Article

Forecasting Future Development under the Interactions among Sustainable Development Goals

1
Key Laboratory of Virtual Geographic Environment, Ministry of Education of PRC, Nanjing Normal University, Nanjing 210023, China
2
International Research Center of Big Data for Sustainable Development Goals, Beijing 100094, China
3
Key Laboratory of Digital Earth Science, Aerospace Information Research Institute, Chinese Academy of Sciences, Beijing 100094, China
4
Jiangsu Center for Collaborative Innovation in Geographical Information Resource Development and Application, Nanjing 210023, China
*
Author to whom correspondence should be addressed.
Sustainability 2023, 15(22), 15929; https://doi.org/10.3390/su152215929
Submission received: 12 October 2023 / Revised: 4 November 2023 / Accepted: 10 November 2023 / Published: 14 November 2023

Abstract

:
Simulating the performance of the Sustainable Development Goals (SDGs) provides guidance to policymakers for faster achievement of the 2030 Agenda. However, current modeling and forecasting methods are not well thought out in terms of interactions between the SDGs. This study developed an iteration forecasting model considering the interactions of SDGs and simulated the SDGs’ progress from 2021 to 2030 for 41 cities in the Yangtze River Delta under various sustainable development paths. The results indicated that the cities with the highest levels of sustainable development in the Yangtze River Delta would only achieve half of the goals by 2030 if they continued on their past paths. Learning from other cities resulted in a more significant improvement in the achievement of SDGs. Furthermore, the higher the development cost, the better the achievement of the goals. Compared to the other goals, SDG11 and SDG13 required higher development costs to be achieved. We optimized the development paths by taking development costs and goal attainment into account. The results showed that cities with high levels of economic development are more likely than cities with low levels of economic development to achieve SDG8 and SDG9 by 2030, while the opposite is true for SDG15.

1. Introduction

The United Nations proposed 17 Sustainable Development Goals (SDGs), which aimed to regularly monitor and report on the process of sustainable development in countries from 2016 to 2030 [1], as well as to promote the integrated and coordinated development of the three dimensions of society, economy, and environment, so that mankind can move towards the path of sustainable development in a comprehensive manner [2,3]. With only seven years left before the deadline set by the 2030 Agenda, there is an urgent need to accelerate progress towards the achievement of the SDGs. The debate over the 2030 Agenda has centered on whether countries are moving fast enough toward the SDGs and whether the SDGs can be achieved in their entirety [4]. Forecasting the progress of the SDGs allows us to better understand the trends of social, economic, and environmental changes, and the impacts these changes may have on the achievement of the SDGs, so that we can adjust development paths in time and make greater progress [5].
Given the complexity and uncertainty of the SDGs, simulating the SDGs’ progress under various sustainable development paths has become an important tool for informing sustainable development and the SDGs’ implementation. The system dynamics model is currently a more widely used predictive analysis tool, capable of combining the dynamics of subsystems as well as comparative analyses of different solutions [6], and is applicable to all types of scenario analyses and comparative evaluations of alternatives [7,8,9]. Threshold 21 is a system dynamics-based model with significant advantages over the many models that have the potential to support national sustainability planning, and it is particularly suitable for scenario modeling [7]. The iSDG model based on Threshold 21 is designed for regional, national, and subnational policy development, and is often customized [10]. It can simulate multiple policies individually or in aggregate, allowing for greater flexibility [11]. Although the iSDG model extended Threshold 21, it had some difficulty in performing longer simulations, so T21 China 2050 was developed and successfully explains some of the sustainability issues of concern to Chinese planners [12].
However, these system dynamics models are limited to a single region. In order to consider the influence of a region’s neighborhoods as it develops, the iterative forecasting model was applied to scenario analysis and modeling projections for the SDGs [13]. Although the current iterative forecasting model allows regions to learn from each other and improve their own development paths, it still has some limitations. The current iterative forecasting model does not take the SDGs’ interactions into account, but these complex interactions cannot be ignored because they have a significant impact on development related to the SDGs [14,15]. To fill the gap in current SDG forecasting models in terms of taking into account neighborhoods and SDG interactions, this study proposes an iterative forecasting model considering the SDGs’ interactions within and between regions. It is a flexible model that can be applied to any city.
Most of the SDGs clearly state that national governments are responsible for the localization and implementation of the SDGs, but local governments, such as cities, need to be held accountable for delivering progress in the SDGs [16,17]. According to the Sustainable Development Solutions Network (SDSN), without proper engagement and coordination of cities, 65% of the SDGs will not be fully achieved [18]. The achievement of all SDGs in China is heavily reliant on cities transitioning to sustainable development. Therefore, this study focused on the city scale, with 41 cities in the Yangtze River Delta serving as the study area. We analyzed the synergies and trade-offs of SDGs within and among cities using a Simultaneous Equation System and Granger Causality, and then proposed an iterative forecasting model considering interactions between the SDGs to simulate their progress in the cities of the Yangtze River Delta from 2021 to 2030 under various development paths.
The rest of the paper is organized as follows: Section 2 describes the study area as well as data acquisition and preprocessing. Section 3 describes the modeling process, including the analysis of SDGs’ interactions, the construction of an iterative forecasting model considering SDGs’ interactions, and the setting of development paths. Section 4 applies the iterative forecasting model considering SDGs’ interactions to the study area and discusses the development of the SDGs under various development paths. Finally, in Section 5, conclusions are drawn and future research contents are considered.

2. Study Area and Data Acquisition

2.1. Study Area

This study takes the Yangtze River Delta as the study area, and the scope of the study area is shown in Figure 1. The Yangtze River Delta includes 41 cities in Shanghai, Jiangsu, Zhejiang, and Anhui. It is located in the lower reaches of the Yangtze River in China, bordering the Yellow Sea and the East China Sea. As one of the regions in China with the highest level of economic development and innovation capacity, it plays an important role in the overall situation of sustainable development and modernization. The issue of city development in the Yangtze River Delta has been elevated to a national strategy, and the outline of the integrated regional development of the Yangtze River Delta states that promoting the integrated development and enhancing the innovation and competitiveness of the region are critical in leading the nation’s high-quality development.

2.2. Data Acquisition and Preprocessing

This study collected and organized SDGs-related time-series statistics for 41 cities in the Yangtze River Delta, and it quantified 60 indicators from 2000 to 2020. Sources of statistical data include provincial statistical yearbooks, the China Urban Statistical Yearbook, the China Urban Construction Statistical Yearbook, the China Regional Economic Statistical Yearbook, and the Landsat-derived annual land cover product of China (CLCD) from 2000 to 2020 [19].
In order to ensure comparability among different indicators, data were standardized using the normalization formula of SDG indicators [20,21]. The standardized indicator values range from 0 to 100, with higher values indicating better performance in achieving the SDGs. The indicators were aggregated to explore future development at the goal level. The SDGs aim at synergistic development, and the indicators under each goal are equally important, so each indicator has the same weight in the aggregation process [22]. The standardized 60 indicators were aggregated into 16 goals (except SDG14 [23]) using the arithmetic mean method.

3. Methods

Cities are more likely to learn from the experiences of areas with similar characteristics to their own, and the first law of geography suggests that areas that are closer together are more spatially connected [24]. Therefore, the more similar the characteristics and the closer the geographic proximity, the more likely cities are to learn from each other. There are complex interactions between the SDGs, and synergies and trade-offs can facilitate or hinder their progress. Therefore, while simulating the progress towards SDGs in cities, the interactions of intra-city SDGs and the impact of spatial spillover effects between cities should not be ignored. Based on the above ideas, the framework of modeling is constructed as shown in Figure 2. The modeling is mainly divided into three parts: the first is the analysis of the interactions between SDGs within and between cities, the second is the construction of the iterative forecasting model considering the SDGs’ interactions, and the third is the setting of the development paths of the SDGs. The specific implementation steps will be elaborated in the following sections.

3.1. Interaction Analysis of SDGs

Previous studies have frequently used Spearman, Pearson, and other correlation analysis methods to quantify the relationship between the SDGs, which are unable to determine the directions of impacts [25]. Meanwhile, spatial econometric models such as the spatial Durbin model (SDM), spatial lag model (SLM), and spatial error model (SEM) are frequently used in the study of spatial spillover effects [26]. These econometric models measure the effects of all neighborhoods on the study unit but cannot quantify the spillover effects of two cities on each other. In order to gain a better understanding of the SDGs’ interactions, this study refers to the SEY model [27,28]. It quantifies the interactions between SDGs within and between cities using a Simultaneous Equation System and Granger Causality.
The Simultaneous Equation System is a model that consists of a collection of related single equations that can be solved to determine the relationships among multiple variables. In this study, Simultaneous Equation Systems within and between cities are constructed separately to explore the interactions of SDGs within cities and the spatial spillover effects of the SDGs. The Simultaneous Equation System formula is as follows:
S D G k i t = σ 0 + σ 1 S D G 1 j t + + σ 17 S D G 17 j t + + σ k S D G k j t 1 + e k t
where i , j denote cities; intra-city interactions are computed when i = j ; t denotes time; S D G k is the score of the kth goal; σ 0 to σ 17 are the coefficients of the interactions between SDGs, which represent synergistic effects if positive and trade-offs if negative and whose values indicate the strength of the interactions; when calculating the interactions between cities, let σ k be 0; σ 0 is the intercept; and e k t is the error term. The Simultaneous Equation System was solved using ordinary least squares and the coefficients were considered significant if their p-value was less than 0.05. Furthermore, Granger Causality tests were established to ensure that there was a significant causal relationship between goal pairs.

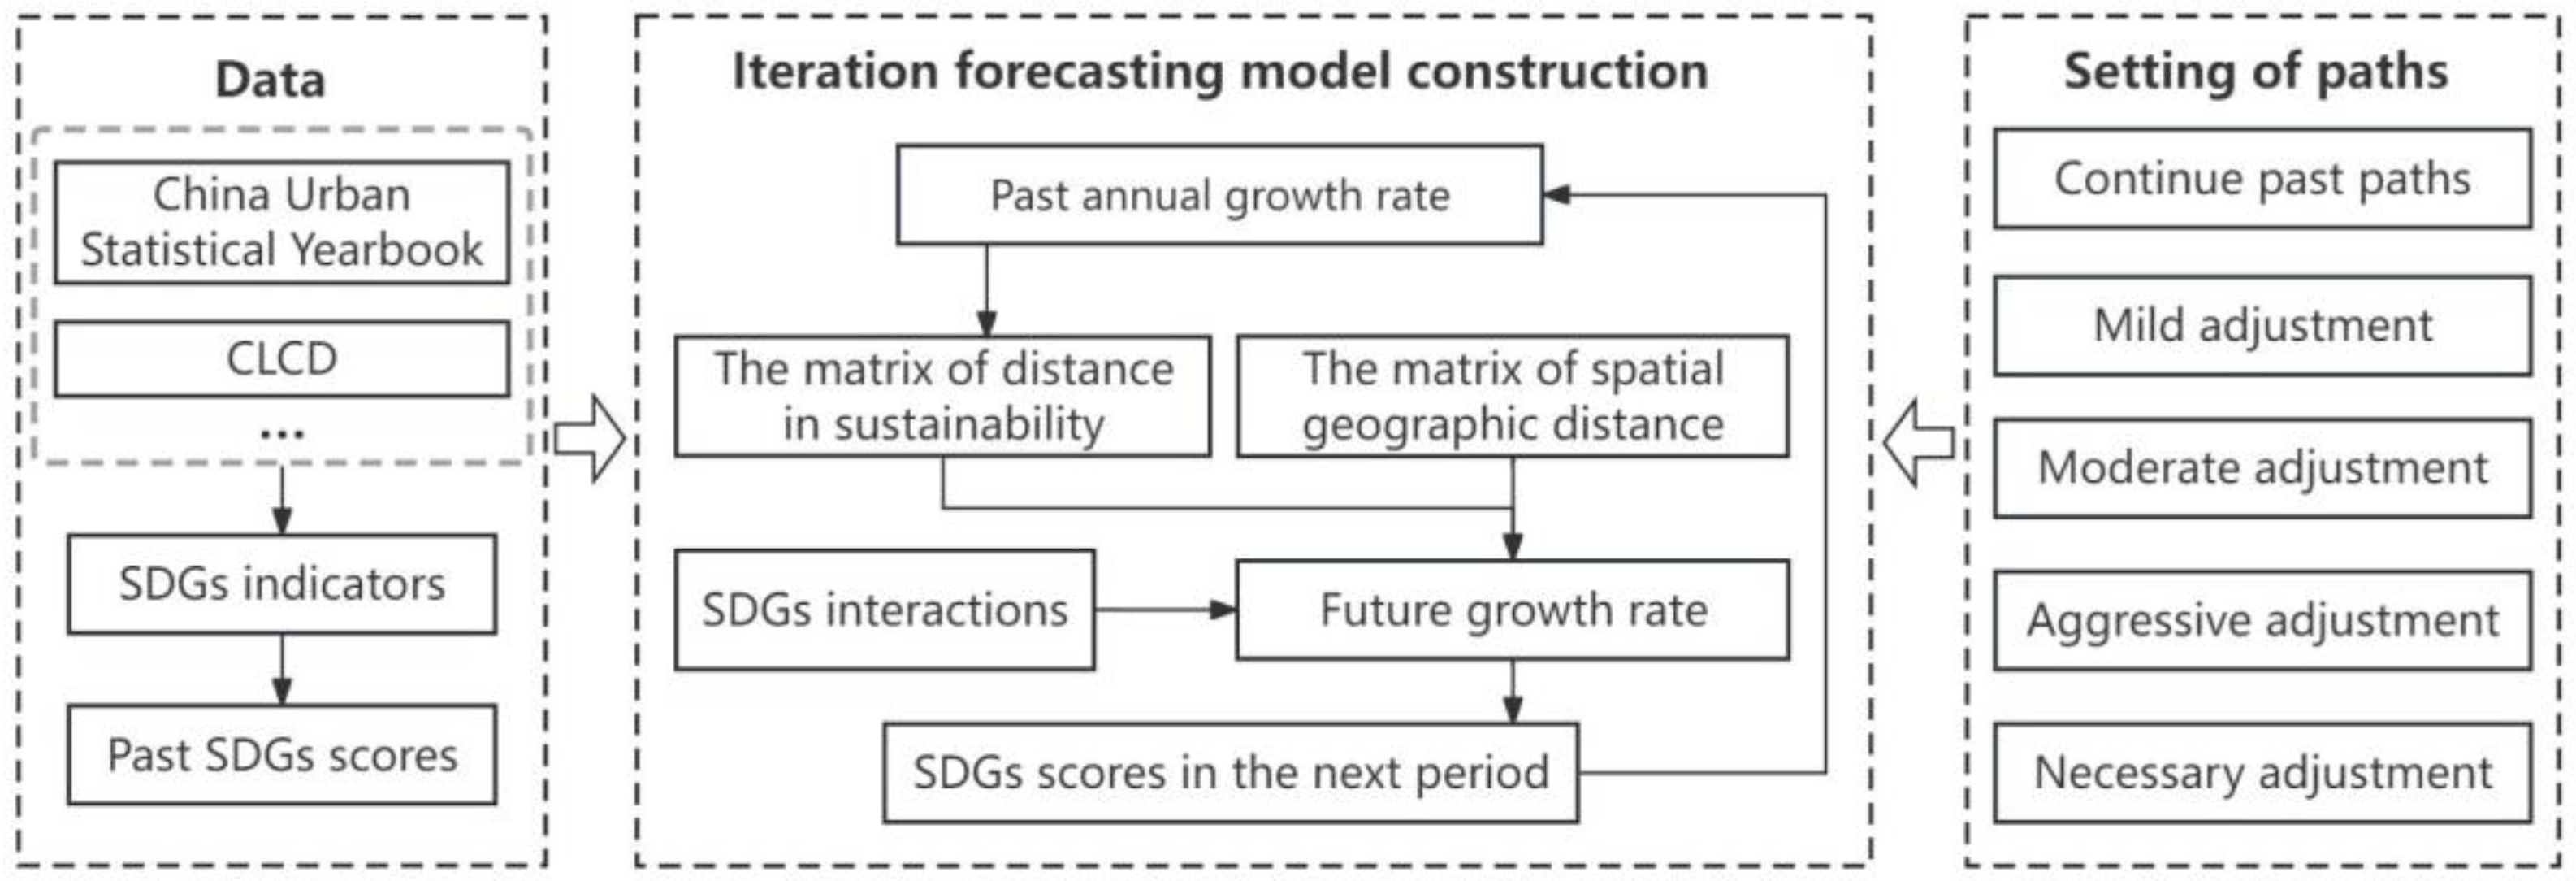
3.2. Construction of the Iterative Forecasting Model Considering SDG Interactions

Since the interactions between SDGs has a non-negligible impact on their progress, this study proposed an adjacency-based iteration forecasting model considering SDGs interactions within and between cities. The specific steps are shown below.
Step 1: Determine the future growth rate in the next period based on an adjacent city.
Since the target city is learning the best growth pattern of the set of adjacent cities under different paths, the future growth rate for the next period is located between the minimum growth rate and the maximum growth rate of the set of adjacent cities, as shown in Equation (2):
g i j t min 1 l M g l j t s i l j t α   &   d i l β , max 1 l M g l j t s i l j t α   &   d i l β
where s i l j t is the sustainability distance regarding SDG j between city i and city l in year t [13]; d i l represents the geographic distance between city i and city l , calculated from the straight-line distance between the latitude and longitude of the two cities; α and β are important parameters for choosing the path and the set of adjacent cities; g l j t is the past annual growth rate of SDG j for city l from the base year to t [13]; and g i j t is the future growth rate that the target city wants to learn. To achieve SDGs as quickly as possible, the target city will choose the city with the largest growth rate in the set of adjacent cities for learning.
Step 2: Take into account SDG interactions.
In order to measure the impact of intra-city SDG interactions as well as the spatial spillover effects of SDGs, this study set the combined impact factor Φ as follows:
Φ i j = ε c _ i n m e a n + λ c _ o u t m e a n
where ε and λ denote the weights of intra-city SDG interactions and spatial spillover effects, respectively, and ε + λ = 1. c _ i n m e a n is the average impact of intra-city SDG interactions on SDG j ; c _ o u t m e a n is the average impact value of spatial spillover effects on SDG j . The combined impact factor Φ ( 1 , 1 ) , and if the combined impact shows a trade-off effect on the SDGs progress, then Φ is negative and it will have a certain inhibitory and slowing effect on the future growth rate g i j t , thereby impeding SDG development; when Φ is positive, it indicates that the combined impact promotes SDGs’ progress.
Step 3: Simulate the scores of SDGs for the next period.
After learning the growth rate from adjacent cities, the scores of SDGs for the next period are simulated considering both intra-city SDG interactions and spatial spillover effects. If g i j t is negative, the SDG scores remain unchanged; if it is positive, the SDG scores in the next period are simulated by the following formula:
Y i j t + 1 g i j t , Y i j t , Φ i j = Y i j t × 1 + g i j t × ( 1 + Φ i j )
where Y i j t + 1 is the SDG forecast score for the next period. When the city continues its own past path, Φ i j is 0.
Step 4: Iterate from step 1 to step 3 up to 2030.

3.3. Setting of the Development Paths

In order to explore the process of achieving SDGs at different rates of development, this study sets five development paths based on the distance in sustainability and geography, namely continue past paths (α = 0, β = 0), mild path adjustment (α = 5, β = 25), moderate path adjustment (α = 10, β = 50), aggressive path adjustment (α = 20, β = 75), and necessary path adjustment (α = 100, β = 100). Continue past paths considers only the past growth rate of the target city, while the remaining four development paths select future growth rates from a set of adjacent cities. From the mild path adjustment to the necessary path adjustment, the development cost increases sequentially.
Optimizing the sustainable development path for SDGs is based on cost-effectiveness. If SDGs can score 100 under the continue past paths scenario, there is no need to consider learning from other cities. However, if SDGs cannot be sustainable under the continue past paths scenario, they develop under other paths, gradually adjusting from mild to necessary, and learning from the best development patterns of adjacent cities.

4. Results and Discussion

4.1. Simulation of the SDG Index up to 2030

The projected SDG index was calculated by arithmetically averaging the SDG scores for 2030 under the five development paths (as shown in Figure 3). Under the continue past paths scenario, five cities scored between 65 and 70. After mild path adjustment, 11 fewer cities scored below 75 than under the continue past paths scenario. After necessary path adjustment, 40 cities scored above 85, with 5 cities scoring above 97.5. The SDG index values of the cities generally improved, indicating that cities could improve their sustainability through continuous learning and strengthening in social, economic, and environmental aspects. Cities were fully developed after necessary path adjustment, and the difference in the SDG index between cities was smaller. Meanwhile, the Yangtze River Delta as a whole became more sustainable. It is evident that coordinated regional development can be promoted by strengthening inter-city linkages.
Under the five development paths, the sustainable development level of the Yangtze River Delta had obvious regional characteristics. All of them showed that the southern cities had higher SDG indexes, and their average performance was ahead of other regions in the Yangtze River Delta. Under the continue past paths scenario, Hangzhou and Shanghai had higher SDG indexes. Hangzhou and Shanghai are both developed cities that are more likely to attract and gather innovative talents and resources, which will in turn increase the values of the SDG index. Under the remaining four development paths, Hangzhou ranked first in all of them, and many cities in Zhejiang performed well. After necessary path adjustment, the cities with SDG index scores over 97.5 were all in Zhejiang. Zhejiang is the only province in China where the income of residents in all cities exceeds the national average, with a developed economy and generally high living standards. It also has a high potential for sustainable development by emphasizing urban–rural integration and environmental development. Therefore, it exhibits a high SDG index.
Statistics on the process of achieving the SDGs (target score 100) in Yangtze River Delta cities by 2030 are shown in Figure 4. Under the continue past paths scenario, the best-performing cities could only achieve half of the SDGs. Relative to the continue past paths scenario, there was little change in the number of cities achieving the goals after mild path adjustment. However, with the further increase in development costs, the number of cities achieving the SDGs increased more significantly. By the time of the aggressive path adjustment, most cities would be able to achieve half or more of the SDGs. Except for a few cities, such as Hangzhou and Shanghai, which achieved a relatively high number of SDGs under the continue past paths and mild path adjustment scenarios, there was little difference in SDG progress for the rest of the cities. As the cost of development increased, the SDG progress of cities in the Yangtze River Delta gradually showed more obvious spatial differences. Some cities in the northwest region achieved a low number of SDGs. Meanwhile, as the cities with faster SDG progress, such as Hangzhou and Shanghai, drove the development of their adjacent cities, the SDG progress of the adjacent region improved. Therefore, it is necessary to selectively learn from the development experience of adjacent cities and change the development path at the appropriate time, allowing cities to achieve more goals for sustainable development faster.
The SDGs cover various elements, including economy, society, and environment. In order to explore the sustainable development progress in relation to a certain type of the goals, SDGs are divided into four categories: essential needs (SDG1, SDG2, SDG3, SDG6, SDG7), environmental protection (SDG12, SDG13, SDG15), social development (SDG4, SDG5, SDG10, the SDG16, SDG17), and economic development (SDG8, SDG9, SDG11) [29]. Figure 4f depicts the progress of the four types of goals under the five development paths. The essential needs were better accomplished under various paths. From the continue past paths to necessary path adjustment scenarios, the number of cities achieving the SDGs gradually increased. The increase in the environmental protection category was particularly obvious, suggesting that appropriately increasing the development costs for cities is conducive to promoting rapid growth in urban environmental sustainability.

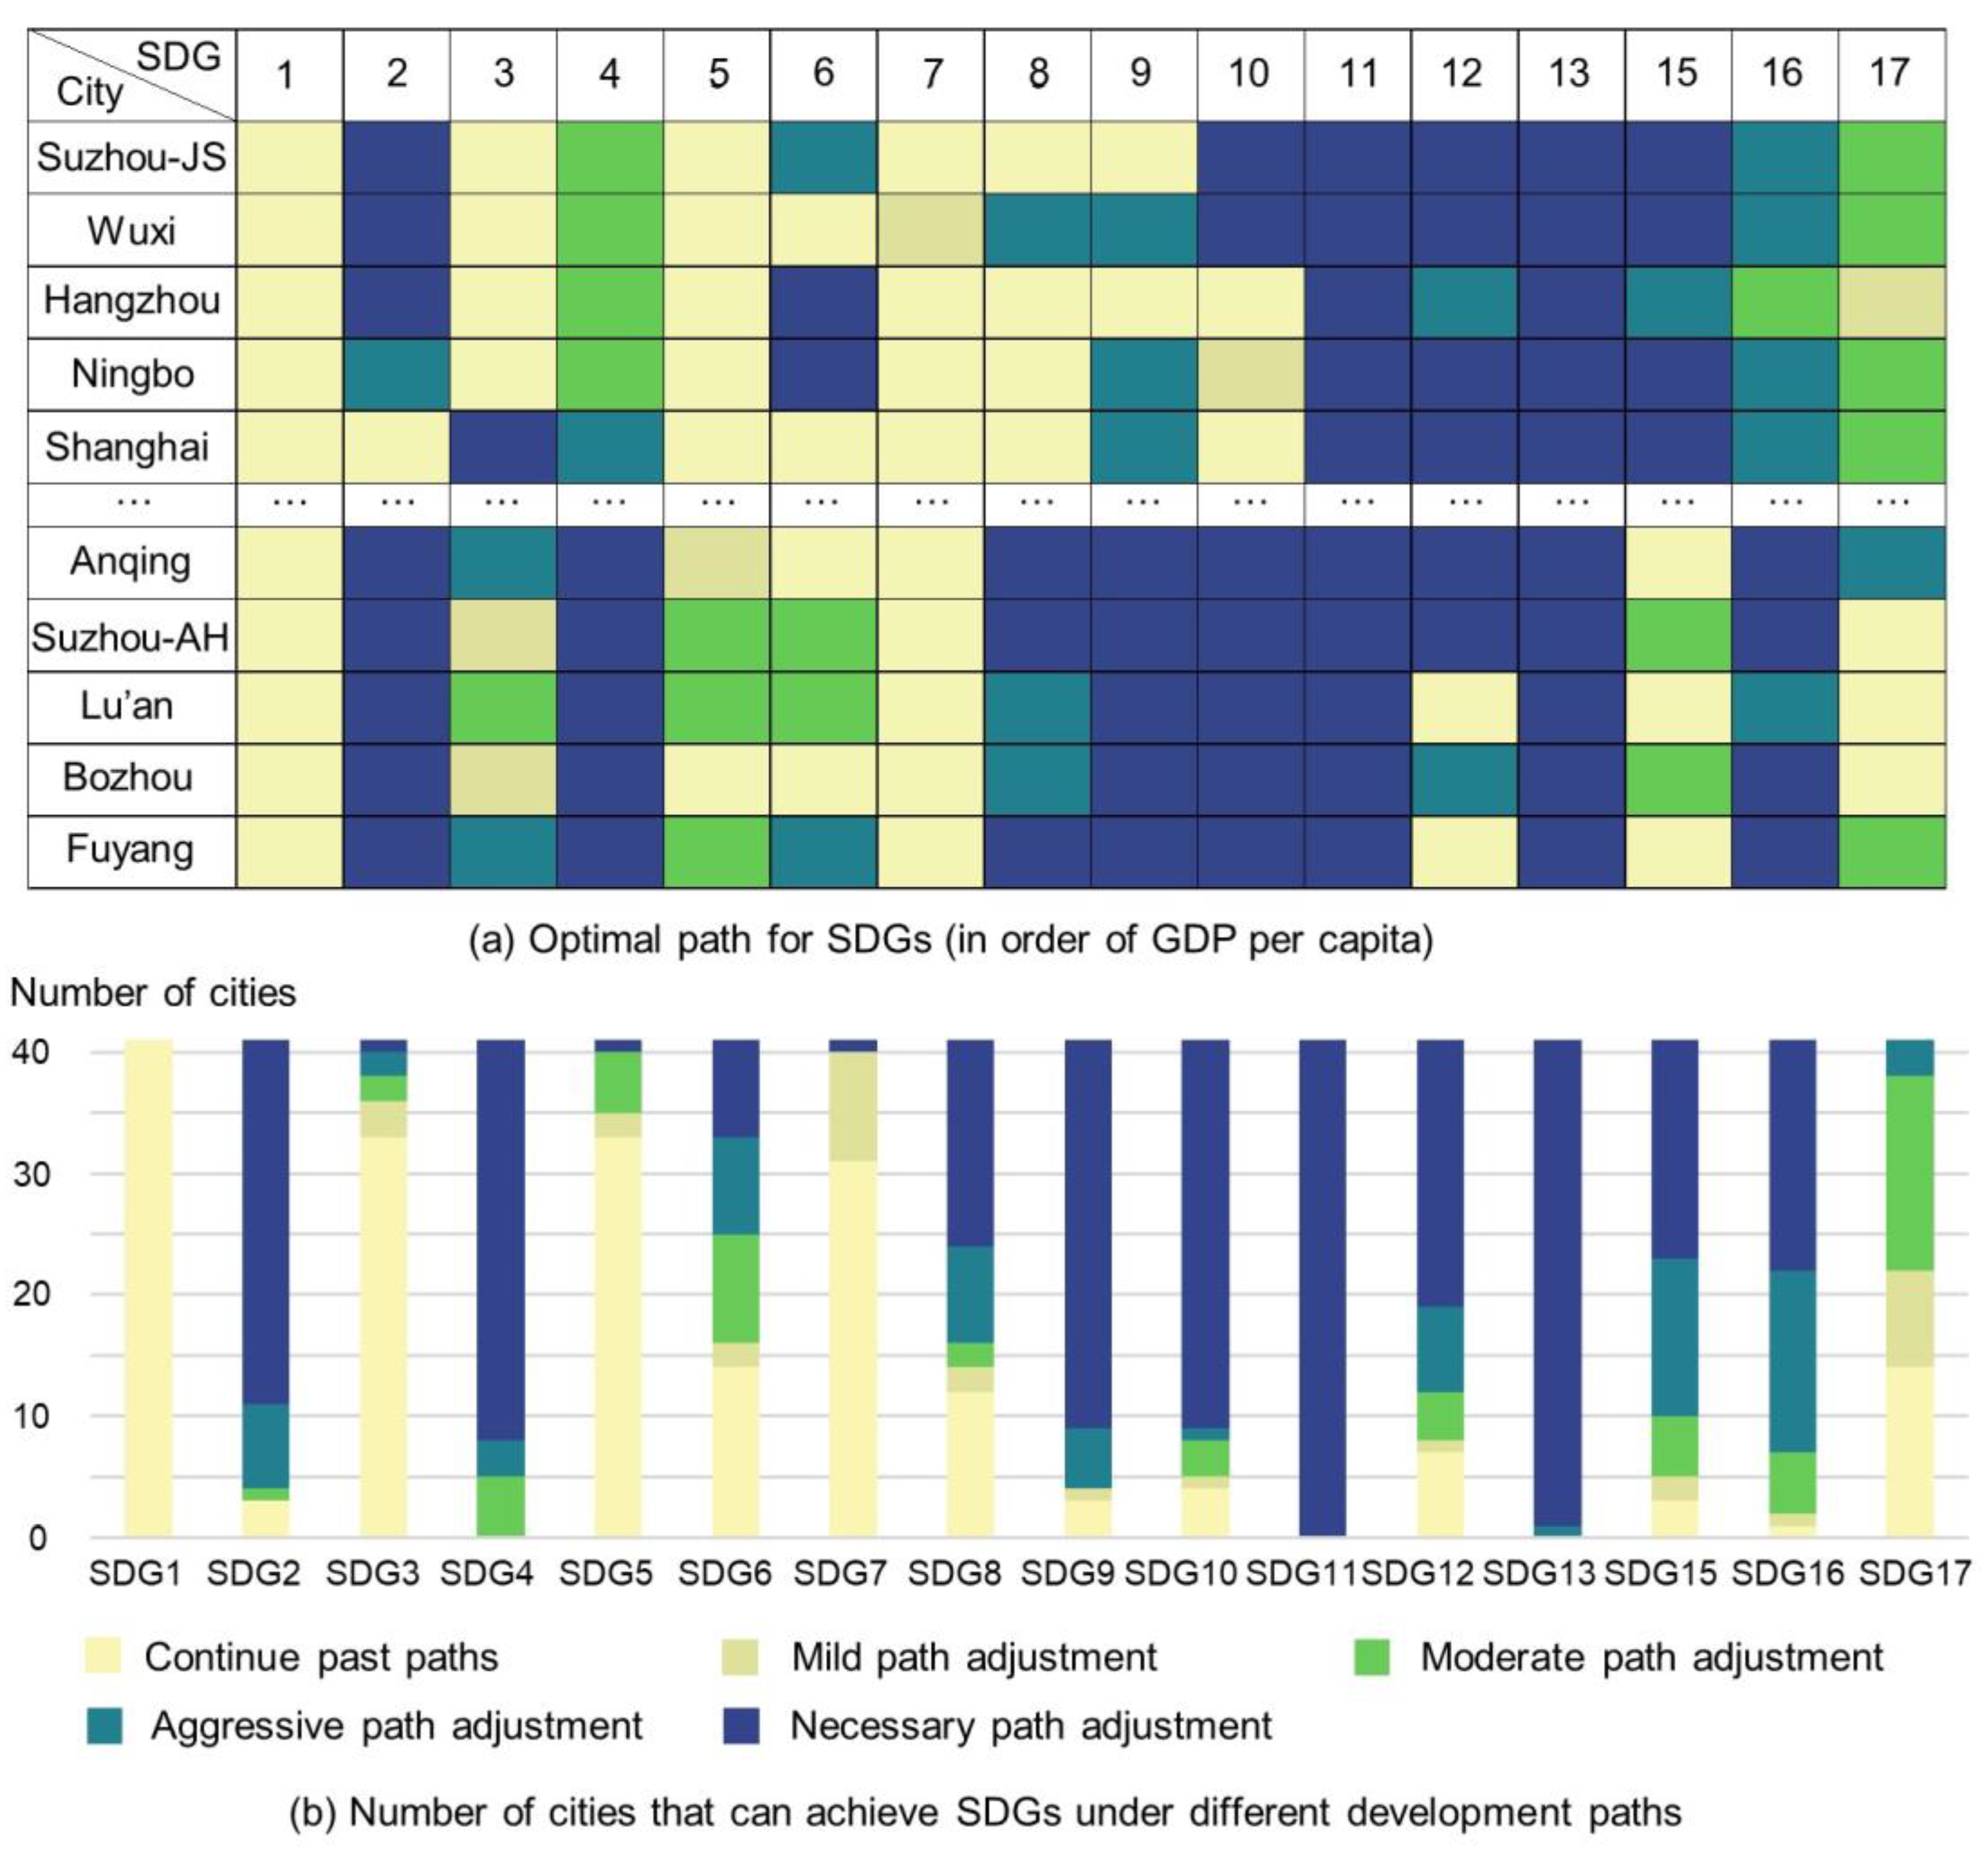
4.2. Optimization of the Development Paths

The optimal paths for the development of SDGs in the Yangtze River Delta cities are shown in Figure 5. As can be seen in Figure 5a, cities with a high level of economic development were more likely to achieve SDG8 (Decent Work and Economic Growth) and SDG9 (Industry, Innovation and Infrastructure) by 2030 than cities with a low level of economic development. SDG9 could score 100 by 2030 in cities with a high level of economic development by continuing past paths, which was most evident in innovative cities such as Suzhou and Hangzhou. SDG15 focuses on terrestrial biodiversity, which was more costly to achieve in 2030 for cities with a high level of economic development. The economic development of these cities is largely attributed to industrial growth, which inevitably leads to environmental degradation [30]. However, some cities are still struggling with the conflict between environmental protection and economic development [31], fearing that environmentally friendly adjustment policies will limit economic growth. Therefore, the key to achieving sustainable development is to maintain a balance between sustainable economic development and improved ecological and environmental quality. And shifting existing economic development to a higher quality and more sustainable model through technological innovation and efficiency optimization is a good option [32].
Figure 5b shows that most cities could achieve SDG3 (Good Health and Well-being), SDG5 (Gender Equality), and SDG7 (Affordable and Clean Energy) by simply continuing their past paths or slightly increasing the development costs. However, in order to achieve the SDGs more effectively, almost all cities need to prioritize SDG11 (Sustainable Cities and Communities) and SDG13 (Climate Action) by investing more development costs. With high urban population density and complex industrial structures, cities in the Yangtze River Delta region face challenges in land use, traffic congestion, environmental pollution, etc., requiring large-scale adjustments and improvements. Fossil energy still dominates the energy structure in the Yangtze River Delta [33], resulting in substantial carbon emissions. In order to achieve SDG13, there is a need to increase the development and utilization of clean energy and promote the transformation of the energy structure.

5. Conclusions

There are challenges for cities in the Yangtze River Delta to achieve the 2030 Agenda. If past development paths continue, the best performing cities in the Yangtze River Delta would only achieve half of the SDGs by 2030. While most cities were expected to achieve SDG3, SDG5, and SDG7, the development of SDG11 and SDG13 could face significant challenges. Therefore, our first and foremost task is to take measures to advance the process of achieving these lagging goals. Cities in the Yangtze River Delta are characterized by high density and urban–rural integration. In order to achieve SDG11, urban planning and land use policies should be formulated to improve the efficiency of resource utilization, the physical layout of cities, the infrastructure in peri-urban areas, public transportation, and the use of renewable energy sources. To meet the challenges of SDG13, cities can boost environmental investment, foster low-carbon economic development, and encourage residents to adopt low-carbon lifestyles.
Sustainable development seeks coordinated regional development and aims to promote the balanced development of cities in the region, but the process of achieving SDGs in the Yangtze River Delta could show obvious differences. Cities with a higher level of economic development could have certain difficulties in achieving SDG15, but cities with a lower level of economic development could still need to make greater efforts to achieve SDG8 and SDG9. Therefore, measures should distinguish between cities at different levels of economic development and individualized responses are needed. Cities with a high level of economic development should strengthen the supervision of environmental protection and rationally plan land development and resource utilization to ensure the sustainable development of the ecological environment. Additionally, they should strengthen environmental education and raise public awareness of environmental protection. Cities with a low level of economic development should ensure the rational allocation of resources and investment, and promote the synergistic development of cities, thus promoting economic growth. Moreover, the government can actively attract external investment and promote inter-city cooperation to deliver new economic growth prospects and employment opportunities to the cities. In addition, it is important to cultivate and attract talented people to enhance the innovation and competitiveness of the cities.
When cities learned from adjacent cities, the number of goals achieved increased. Additionally, as the cost of development increased, the rate of growth in the number of goals achieved accelerated. Therefore, cities in the Yangtze River Delta should actively cooperate and share resources, especially with cities that are engaged in similar SDG implementation processes. The Yangtze River Delta region can establish an exchange platform and regularly invite representatives from cities with more advanced SDG implementation processes to share their experiences and achievements through exchanges and discussions to understand and learn from each other’s practical experiences. Cities that are lagging behind in the SDG implementation process can set up a special working group to conduct research and consciously absorb lessons from the experiences of other cities, so as to better promote the process of achieving SDGs locally.
In future research, we will focus on two aspects. On the one hand, with the large number of cities in China, limited data disclosure, and frequent changes in administrative divisions, the city-level indicator system is still lacking, and localizing the indicator system is difficult [13]. We will learn more about the environmental, economic, and social conditions of the cities in the Yangtze River Delta, localize as many indicators as possible, and improve the applicability of the localization of the indicator system. On the other hand, as spatial carriers of high-intensity social activities and economic development, the issues of population, socio-economic factors, resources, and the environment are intertwined with the process of urban development [34], which poses a great challenge to the choice of development paths. In the future, we will set more comprehensive sustainable development paths by combining different policies and aspects of society, the economy, and the environment, so as to provide policymakers with more alternative sustainable development paths.

Author Contributions

Conceptualization, Y.X., Y.C. and M.C.; methodology, Y.X., L.C. and Y.B.; formal analysis, Y.X.; data curation, L.C., Y.B., Y.L. and Y.G.; writing—original draft preparation, Y.X.; writing—review and editing, Y.X., Y.C. and M.C.; supervision, Y.C. All authors have read and agreed to the published version of the manuscript.

Funding

This work was financially supported by the National Natural Science Foundation of China (grant no. 42271422) and the International Research Center of Big Data for Sustainable Development Goals (CBAS2022GSP08).

Institutional Review Board Statement

Not applicable.

Informed Consent Statement

Not applicable.

Data Availability Statement

The data presented in this study are available on request from the corresponding author.

Conflicts of Interest

The authors declare no conflict of interest.

References

  1. Allen, C.; Metternicht, G.; Wiedmann, T. Priorities for science to support national implementation of the sustainable development goals: A review of progress and gaps. Sustain. Dev. 2021, 29, 635–652. [Google Scholar] [CrossRef]
  2. Chen, J.; Peng, S.; Zhao, X.; Ge, Y.; Li, Z. Measuring regional progress towards SDGs by combining geospatial and statistical information. Acta Geod. Cartogr. Sin. 2019, 48, 473–479. [Google Scholar] [CrossRef]
  3. Guo, H.; Liang, D.; Chen, F.; Sun, Z.; Liu, J. Big Earth Data Facilitates Sustainable Development Goals. Bull. Chin. Acad. Sci. 2021, 36, 874–884. [Google Scholar] [CrossRef]
  4. Kostetckaia, M.; Hametner, M. How Sustainable Development Goals interlinkages influence European Union countries’ progress towards the 2030 Agenda. Sustain. Dev. 2022, 30, 916–926. [Google Scholar] [CrossRef]
  5. Allen, C.; Metternicht, G.; Wiedmann, T.; Pedercini, M. Greater gains for Australia by tackling all SDGs but the last steps will be the most challenging. Nat. Sustain. 2019, 2, 1041–1050. [Google Scholar] [CrossRef]
  6. Gu, C.; Guan, W.; Liu, H. Chinese urbanization 2050: SD modeling and process simulation. Sci. China Earth Sci. 2017, 60, 1067–1082. [Google Scholar] [CrossRef]
  7. Allen, C.; Metternicht, G.; Wiedmann, T. National pathways to the Sustainable Development Goals (SDGs): A comparative review of scenario modelling tools. Environ. Sci. Policy 2016, 66, 199–207. [Google Scholar] [CrossRef]
  8. Yang, Z. Sustainability of Urban Development with Population Decline in Different Policy Scenarios: A Case Study of Northeast China. Sustainability 2019, 11, 6442. [Google Scholar] [CrossRef]
  9. Pedercini, M.; Arquitt, S.; Chan, D. Integrated simulation for the 2030 agenda. Syst. Dyn. Rev. 2020, 36, 333–357. [Google Scholar] [CrossRef]
  10. Collste, D.; Pedercini, M.; Cornell, S.E. Policy coherence to achieve the SDGs: Using integrated simulation models to assess effective policies. Sustain. Sci. 2017, 12, 921–931. [Google Scholar] [CrossRef]
  11. Pedercini, M.; Zuellich, G.; Dianati, K.; Arquitt, S. Toward achieving Sustainable Development Goals in Ivory Coast: Simulating pathways to sustainable development. Sustain. Dev. 2018, 26, 588–595. [Google Scholar] [CrossRef]
  12. Qu, W.; Shi, W.; Zhang, J.; Liu, T. T21 China 2050: A Tool for National Sustainable Development Planning. Geogr. Sustain. 2020, 1, 33–46. [Google Scholar] [CrossRef]
  13. Xiao, H.; Xu, Z.; Ren, J.; Zhou, Y.; Lin, R.; Bao, S.; Zhang, L.; Lu, S.; Lee, C.K.M.; Liu, J. Navigating Chinese cities to achieve sustainable development goals by 2030. Innovation 2022, 3, 100288. [Google Scholar] [CrossRef] [PubMed]
  14. Spaiser, V.; Ranganathan, S.; Swain, R.B.; Sumpter, D.J.T. The sustainable development oxymoron: Quantifying and modelling the incompatibility of sustainable development goals. Int. J. Sustain. Dev. World Ecol. 2017, 24, 457–470. [Google Scholar] [CrossRef]
  15. Spangenberg, J.H. Hot Air or Comprehensive Progress? A Critical Assessment of the SDGs. Sustain. Dev. 2017, 25, 311–321. [Google Scholar] [CrossRef]
  16. Wiedmann, T.; Allen, C. City footprints and SDGs provide untapped potential for assessing city sustainability. Nat. Commun. 2021, 12, 3758. [Google Scholar] [CrossRef]
  17. Engström, R.E.; Collste, D.; Cornell, S.E.; Johnson, F.X.; Carlsen, H.; Jaramillo, F.; Finnveden, G.; Destouni, G.; Howells, M.; Weitz, N.; et al. Succeeding at home and abroad: Accounting for the international spillovers of cities’ SDG actions. npj Urban Sustain. 2021, 1, 18. [Google Scholar] [CrossRef]
  18. Lafortune, G.; Zoeteman, K.; Fuller, G.; Mulder, R.; Dagevos, J.; Schmidt-Traub, G. SDG Index and Dashboards Report for European Cities; SDSN: Paris, France, 2019. [Google Scholar]
  19. Yang, J.; Huang, X. The 30 m annual land cover datasets and its dynamics in China from 1990 to 2021. Earth Syst. Sci. Data 2022, 13, 3907–3925. [Google Scholar] [CrossRef]
  20. Fu, B.; Wang, S.; Zhang, J.; Hou, Z.; Li, J. Unravelling the complexity in achieving the 17 sustainable-development goals. Natl. Sci. Rev. 2019, 6, 386–388. [Google Scholar] [CrossRef]
  21. Zhang, J.; Wang, S.; Pradhan, P.; Zhao, W.; Fu, B. Untangling the interactions among the Sustainable Development Goals in China. Sci. Bull. 2022, 67, 977–984. [Google Scholar] [CrossRef]
  22. Lafortune, G.; Fuller, G.; Moreno, J.; Schmidt-Traub, G.; Kroll, C. SDG Index and Dashboards Detailed Methodological Paper; Sustainable Development Solutions Network: Paris, France, 2018. [Google Scholar]
  23. Cao, M.; Chen, M.; Zhang, J.; Pradhan, P.; Guo, H.; Fu, B.; Li, Y.; Bai, Y.; Chang, L.; Chen, Y.; et al. Spatio-temporal changes in the causal interactions among Sustainable Development Goals in China. Humanit. Soc. Sci. Commun. 2023, 10, 450. [Google Scholar] [CrossRef]
  24. Tobler, W.R. A Computer Movie Simulating Urban Growth in the Detroit Region. Econ. Geogr. 1970, 46, 234–240. [Google Scholar] [CrossRef]
  25. Warchold, A.; Pradhan, P.; Kropp, J.P. Variations in sustainable development goal interactions: Population, regional, and income disaggregation. Sustain. Dev. 2021, 29, 285–299. [Google Scholar] [CrossRef]
  26. Xiao, H.; Bao, S.; Ren, J.; Xu, Z. Transboundary impacts on SDG progress across Chinese cities: A spatial econometric analysis. Sustain. Cities Soc. 2023, 92, 104496. [Google Scholar] [CrossRef]
  27. Nodehi, M.; Arani, A.A.; Taghvaee, V.M. Sustainability spillover effects and partnership between East Asia & Pacific versus North America: Interactions of social, environment and economy. Lett. Spat. Resour. Sci. 2022, 15, 311–339. [Google Scholar] [CrossRef] [PubMed]
  28. Taghvaee, V.M.; Nodehi, M.; Arani, A.A.; Jafari, Y.; Shirazi, J.K. Sustainability spillover effects of social, environment and economy: Mapping global sustainable development in a systematic analysis. Asia-Pac. J. Reg. Sci. 2023, 7, 329–353. [Google Scholar] [CrossRef]
  29. Liu, Y.; Wang, Y.; Du, J.; Guo, H.; Wu, B.; Fu, B. Earth Big Data for Balanced Development Assessment. Bull. Chin. Acad. Sci. 2021, 36, 963–972. [Google Scholar] [CrossRef]
  30. Du, Y.; Sun, X.-X. Economic development and environmental quality—A case study of china prefecture-level cities. Environ. Prog. Sustain. Energy 2017, 36, 1290–1295. [Google Scholar] [CrossRef]
  31. Wang, X.; Fan, P.; Wu, Z.; Liang, Q. Pollution, demographic, and public willingness to participate in environment protection in China—A study based on micro-survey data. Environ. Sci. Pollut. Res. 2019, 26, 25117–25129. [Google Scholar] [CrossRef]
  32. Han, Z.; Jiao, S.; Zhang, X.; Xie, F.; Ran, J.; Jin, R.; Xu, S. Seeking sustainable development policies at the municipal level based on the triad of city, economy and environment: Evidence from Hunan province, China. J. Environ. Manag. 2021, 290, 112554. [Google Scholar] [CrossRef]
  33. Wu, W.; Zhang, T.; Xie, X.; Huang, Z. Regional low carbon development pathways for the Yangtze River Delta region in China. Energy Policy 2021, 151, 112172. [Google Scholar] [CrossRef]
  34. Wu, Q.; Cheng, J.; Chen, G.; Hammel, D.J.; Wu, X. Socio-spatial differentiation and residential segregation in the Chinese city based on the 2000 community-level census data: A case study of the inner city of Nanjing. Cities 2014, 39, 109–119. [Google Scholar] [CrossRef]
Figure 1. Study area.
Sustainability 15 15929 g001
Figure 2. Flowchart of modeling considering interactions between SDGs under different paths.
Sustainability 15 15929 g002
Figure 3. Simulation of the SDG index of Yangtze River Delta cities in 2030.
Sustainability 15 15929 g003
Figure 4. Simulation of the SDG progress of Yangtze River Delta cities in 2030: (ae) The number of SDGs achieved under five development paths. (f) The number of cities achieving different types of SDGs. A, B, C, and D represent the four categories of essential needs, environmental protection, social development, and economic development, respectively.
Sustainability 15 15929 g004
Figure 5. Optimal paths for SDGs: (a) Optimal path for each SDG for the top five and last five cities in terms of GDP per capita. Higher GDP per capita indicates a higher level of economic development in the city. (b) The number of cities adopting each optimal path for each SDG.
Sustainability 15 15929 g005
Disclaimer/Publisher’s Note: The statements, opinions and data contained in all publications are solely those of the individual author(s) and contributor(s) and not of MDPI and/or the editor(s). MDPI and/or the editor(s) disclaim responsibility for any injury to people or property resulting from any ideas, methods, instructions or products referred to in the content.

