Abstract
Innovative technologies have been incorporated into intelligent transportation systems (ITS) to improve sustainability, safety, and efficiency, hence revolutionising traditional transportation. The combination of three-dimensional (3D) indoor building mapping and navigation is a groundbreaking development in the field of ITS. A novel methodology, the “Three-Dimensional Routing Information Framework “(3D RIF), is designed to improve indoor navigation systems in the field of ITS. By leveraging the Quantum Geographic Information System (QGIS), this framework can produce three-dimensional routing data and incorporate sophisticated routing algorithms to handle the complexities associated with indoor navigation. The paper provides a detailed examination of how the framework can be implemented in transport systems in urban environments, with a specific focus on optimising indoor navigation for various applications, including emergency services, tourism, and logistics. The framework includes real-time updates and point-of-interest information, thereby enhancing the overall indoor navigation experience. The 3D RIF’s framework boosts the efficiency and effectiveness of intelligent transportation services by optimising the utilisation of internal resources. The research outcomes are emphasised, demonstrating a mean enhancement of around 25.51% in travel. The measurable enhancement highlighted in this statement emphasises the beneficial influence of ITS on the efficiency of travel, hence underscoring the significance of the ongoing progress in this field.
1. Introduction
With the rapid growth of urbanisation and the continuous development of modern infrastructure, ITS has become crucial for efficient, safe, and sustainable travel [1]. These systems combine modern technologies and data-driven approaches to optimise transport networks, regulate traffic, and improve overall urban mobility. While outdoor navigation and vehicular transportation have traditionally been the focus of ITS, there is an increasing need for seamless indoor navigation within complex infrastructures such as airports, hospitals, malls, transportation hubs, and other public buildings [2,3]. People frequently use two-dimensional (2D) navigation methods for outdoor navigation, and there is a need to look for similar options when moving through an indoor space. Although 2D navigation can give directions in the X-Y plane, it might not be enough to navigate multiple stories of buildings. Additional information is required to enhance the visualisation of the building layout in support of developing a reliable indoor navigation system [4]. 3D maps or floor plans that display the layout of each floor and their connections can help navigate a multi-story building. The proposed framework can aid users in understanding and visualising the vertical structure and levels of a building. Further, the proposed framework extends the use of augmented reality (AR) to superimpose digital 3D data onto users’ perspectives of the real world for indoor navigation. AR provides a more immersive indoor navigation experience by offering visual clues [5].
Two-dimensional navigation may be appropriate for straight and straightforward indoor structures, but it might not be sufficient for more complicated multi-story buildings [6]. 2D indoor maps have constraints depicting vertical portions of a route while navigating present-day modern multi-level buildings [7]. Incorrect information about vertical routes may lead to wrong turns or routes. Several components are used in indoor positioning systems (IPS) to define vertical routes accurately. These components deliver precise location-based services in an indoor space and are divided into hardware, software, and positioning algorithms.
Sensors, beacons, and communication tools are examples of hardware-based components. Wireless Fidelity (Wi-Fi), Bluetooth, and Radio Frequency Identification (RFID) are examples of sensors used to find people and objects within indoor areas [8,9]. Beacons are tiny devices that produce a signal that sensors can pick up to determine their position. Further, this information can be utilised by communication devices, such as smartphones and tablets. Location-based services, data processing, and visualisation tools are examples of the software components [10]. Applications that provide services using your current location, such as navigation and wayfinding, are known as location-based services. Data from sensors and other devices are collected, analysed, and stored using data processing techniques. These data are presented using visualisation tools to make it simple for people to understand the information [11]. The mathematical models used to locate objects and people inside a building are called positioning algorithms [12]. These algorithms triangulate the user’s location using information from sensors, beacons, and communication devices. Particle filters, trilateration, and fingerprinting are a few examples of positioning algorithms. The choice of algorithm depends on the particular requirements of the IPS.
IPS combines hardware, software, and positioning algorithms to deliver precise location-based services in indoor spaces. Together, the components of an IPS detect the position of objects, vehicles, and people, process the data, and offer location-specific services to the user. Figure 1 illustrates the different elements of an IPS that are essential for improving indoor navigation, asset monitoring, emergency response, security, and building optimisation. The image also shows how these technologies can be integrated with an ITS, resulting in a seamless combination of indoor and outdoor technologies that work together to enhance productivity and the user experience.
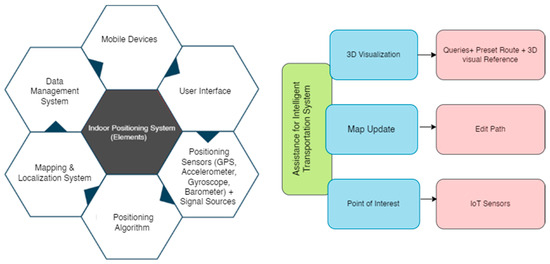
Figure 1.
Elements of an indoor positioning system.
A reliable indoor routing system is required to provide easy navigation in complex and unknown indoor environments. This issue has a potential solution with the development of 3D indoor routing information systems. With 3D maps, 3D indoor routing information systems provide users with real-time routing information, instructions, and other relevant information about indoor environments. Routing information systems are used in Global Positioning System (GPS) navigation systems, mobile apps, web-based mapping services, logistics and fleet management, emergency services, and other applications where route planning and real-time traffic updates are crucial for decision-making and travel optimisation. This study offers a 3D indoor routing information system using 3D maps and the QGIS tool [13]. QGIS is a popular open-source GIS programme that visualises, analyses, and interprets geographical data. The following are the major contributions of this work:
- To propose a framework for integrating Building Information Modelling (BIM) and QGIS tools to capture 3D structural information and floor plans of buildings.
- This paper designs an indoor navigation system for intelligent transportation that utilises 3D building plans for accurate navigation.
- To examine the performance of the proposed framework using a case analysis.
The rest of this paper is organised as follows: the subsequent section reviews the literature pertinent to the topic. Section 3 explains the methodology for developing a 3D model and routing information system. The case study conducted within university premises to validate the performance of the proposed system department is presented in Section 4. The results and discussion of the applied methodology are presented in Section 5. Finally, Section 6 concludes the study by providing insights for future research.
2. Research Work
A rising number of people are now interested in creating routing information systems that use 3D models of buildings. These systems can provide the precise location of rooms, parking areas, showrooms, amenities, and services within a structure. To facilitate ITS education, virtual reality (VR) technology has been utilised to produce 3D representations of indoor spaces. One of these systems is INtelligent TRraffic Evaluator for Prompt Incident Diagnosis in a Virtual Reality environment (INTREPID-VR) version 1, created by Hadipriono and integrated into ITS education [14]. However, developing accurate 3D models can be a difficult task that requires specialised knowledge and software. We will examine the state-of-the-art research on using 3D building models for routing information systems and the software and tools employed in their production.
A 3D IPS for pedestrian routing was proposed using a micro-electromechanical systems (MEMS) sensor. This MEMS sensor was attached to the foot of a pedestrian, and the readings from the MEMS sensor, an accelerometer, and a barometer were used to determine the pedestrian’s approximate location using a combination of Kalman filtering, pedestrian dead reckoning (PDR), and zero velocity update (ZUPT) algorithms [15]. Specialised software like 3ds Max (3ds Max 2023 which was released by Autodesk) was used to create and print 3D models of old architectural buildings. These tools were able to handle massive spatial data. Different studies have utilised the BIM model to provide indoor routing and navigation. Semantics relevant to indoor routes, such as path accessibility and the degree of recognition, were used for efficient evacuation routes [16]. For indoor routing, the integration of BIM and GIS was suggested as a solution to the data interoperability problem. Industry Foundation Classes (IFC) format data collected from building information models and indoor geospatial data were compiled to create an integrated ontology. The integrated ontology model was queried using the SPARQL language, and a prototype application was designed to validate the suggested methodology. It was determined that using ontology is a legitimate method of connecting BIM and GIS. The study devised a framework that employed data gathering techniques such as 3D laser scanning and drones to convert the collected data into three-dimensional BIM models [17]. Similarly, a research investigation presented a repositioning methodology that relies on a 3D model incorporating a building shape registration algorithm. This strategy facilitates the revision of 3D building data by leveraging exceptionally precise 2D information [18].
Navigating indoors involves selecting the safest and most efficient route, much like the primary goals of ITS. Just like optimising traffic flow in traditional ITS, optimising paths within a building plays a vital role in the larger objective of enhancing overall transportation safety and efficiency. Innovative algorithms, like a swift and secure variant of Dijkstra’s algorithm, highlight the ingenuity and adaptability linked to ITS methods. Furthermore, integrating these advancements into indoor navigation systems promotes a holistic approach and aligns with the principle of utilising technology to develop intelligent and effective mobility solutions. A study investigation was centred on the development of an autonomous robot’s indoor navigation capabilities via the utilisation of convolutional neural networks and reinforcement learning techniques [19]. A novel method was introduced for visual navigation in expansive indoor areas lacking pre-existing maps, utilising a distributed deep reinforcement learning framework. Similarly, a study was conducted to present a reinforcement learning approach that integrates a semantic understanding of the indoor surroundings in order to improve navigation and generalisation abilities. Additionally, a research study introduced an enhanced technique for indoor navigation using fully convolutional neural networks. This approach demonstrates advancements in object detection precision and positioning outcomes. Similarly, another study presented a web-based 3D GIS solution for urban routing using a modified Dijkstra’s algorithm [20].
The 3D spatial routing method GSG (Greedy Surface Routing Greedy) was also introduced. Triangles on a surface are utilised by GSG to jump out of the local minimum areas brought on by holes and to divide the network using 3D Restricted Delaunay Triangulation. The creation of hybrid position-based and partial progress-based 3D routing algorithms and point-to-point 3D routing algorithms employing light detection and ranging (LiDAR) data for noise prediction is a recent breakthrough in 3D routing algorithms [21]. These latest discoveries show how 3D routing algorithms, such as adaptive routing, noise prediction, and progress-based routing, are still being studied and improved. Multiple methods and software have created 3D models for indoor environments. Brief information about the reviewed literature related to 3D indoor modelling is presented in Table 1.

Table 1.
Summary of 3D indoor modelling on technologies and outcomes.
This literature study indicates that building precise 3D models of indoor spaces for routing information systems can be difficult, requiring specialised knowledge and software. Various methods and tools have been utilised to create 3D models of buildings, including their structural components, fine-grained internal navigation networks, obstacles, and staircases, such as laser scanning, photogrammetry, and BIM. Data interoperability has been identified as a challenge that can be solved by integrating BIM and GIS. The fastest and safest paths can be found using various techniques and algorithms, such as modified Dijkstra’s algorithm, pedestrian dead reckoning (PDR), and zero velocity update (ZUPT). Based on the findings and suggestions made in the examined studies, the next section will provide details of the methods used to generate the 3D model of the indoor environment.
3. Methodology
Data collection, data processing, and data management are essential for creating a 3D model of a building. By using coordinates, the generated 3D model is georeferenced to accurately locate the user’s position inside the building. The first stage of the process involves collecting building information and sensor data, including geographical coordinates and relevant sensor measurements. The building then adopts a standardised coordinate system, such as WGS84, to match the given building coordinates (30.5161° N, 76.6598° E) with this established standard. The coordinates of the sensor data, obtained using sensors in smartphones, are transformed to align with the selected coordinate system of the building. With the proposed integrated solution, the user’s real-time sensor-based position is connected to the 3D model of the building, ensuring accuracy and consistency in placement. Calibration, accuracy evaluation, and real-time synchronisation are crucial stages that contribute to improving alignment and functionality. The developed 3D model is improved with additional information such as location names, floor plans, and POIs once the basic structure of the building has been created. The 3D model of the building is further used for indoor routing and wayfinding between two locations. In the proposed study, Dijkstra’s algorithm is deployed for finding the shortest path using different factors such as slopes and elevators. The algorithm is implemented in a mobile application that displays the path to the user in real time, providing a seamless navigation experience. The general process of creating a 3D model of the selected area using QGIS involves the following steps:
- 1.
- 3D model creation of the buildings: The process of constructing a 3D model of a building entails gathering information about its height, shape, entrances, exits, slopes, and elevators. This has been achieved using various methods, including surveying, LiDAR, photogrammetry, or gaining access to open data sources. The QGIS software (3.24.1) is then used to capture and process the gathered data to create the 3D model. This method is usually the initial stage in constructing a 3D model of a structure and is essential for accurately representing a building. Table 2 discusses a few typical architectural parameters that need to be incorporated into 3D models:
Table 2. Parameters included in 3D models.
Vector files are needed to create a 3D model of a building. It is necessary to import the GeoJSON or shapefiles. It is required to ensure the data are correct by correcting any mistakes or discrepancies, such as lost data or misplaced coordinates. To accurately represent structures in 3D, height information must also be supplied. This has been achieved by using LiDAR data, digital elevation models, or building footprints that provide height characteristics.
- 2.
- Data processing: Data cleansing, transformation, and structuring are a few of the essential processes included in the data processing phase for indoor routing. Redundancy, missing values, and data type issues must be addressed before the data are loaded into a PostgreSQL database. A specific data structure has been defined for the PostgreSQL database to store the data, done with the help of the pgAdmin or psql tools. After the data have been loaded, they are used for indoor routing by setting up a routing network, defining the start and endpoint, and using routing algorithms to find the best route.
- 3.
- Georeference of the 3D model: After creating the 3D model, the QGIS tool adds a mesh layer to the 3D model. After adding the mesh layer, the model is aligned with the other spatial data sources, like satellite imagery or vector data. The complete process is known as the georeferencing of a 3D model. Ensuring accuracy in both the 3D model and vector data requires a meticulous process of collecting, processing, and georeferencing data. After completing the registration of the 3D model in QGIS, it is essential to verify its alignment with additional spatial data sources, such as satellite imagery or vector data. The accuracy of the registered 3D model can be evaluated and validated via the utilisation of ground truth data, comparative analysis, error quantification (RMSE or MSE), and iterative refinement techniques.
- 4.
- Create a floor plan: For indoor routing, the internal structure of the building is fundamental. So, this step is used to add the floor plan of the building to the 3D model. This is achieved by using polygons to create a vector layer of the floor elements. Based on the floor element’s shape, relevant shapes are added to the vector layer.
- 5.
- Add routing information: Routing within indoor areas is possible using pathways, so an additional vector layer is added to the 3D model to represent the pathways between different locations. We have assigned a weight to the edges based on the distance and constructed a network representing connectivity and adjacency relations.
The routing vector layer stores information like the distance between floor points, door and wall information, and obstacles or restrictions. When establishing the weight of the edges in an indoor graph, which includes multiple paths and junctions, it is crucial to use a systematic and scientific approach. This involves evaluating various parameters such as edge lengths, pathway types, environmental conditions, and intersection complexity. Each factor is assigned a numerical value that is used to calculate the overall weight of a specific edge. For instance, shorter paths can be given lower weight values to prioritise efficiency, while paths that pass through well-lit and monitored areas can be assigned higher weights to prioritise safety. By implementing a numerical framework and thoroughly evaluating various factors, a quantitative methodology ensures a logical and efficient allocation of weights to individual edges in the network.
- 6.
- Model visualisation: After creating the 3D model of the building and routing information, the 3D model is visualised. For the visualisation of the 3D model, the Qgis2threejs plugin is used. Qgis2threejs is a plugin that converts 3D models and spatial data from QGIS into a format suitable for web visualisation via WebGL. The process involves data preparation, configuration setting selection, and model processing. This visualisation step provides different internal and external views of the building.
- 7.
- Model publishing: The created 3D model is now published as a web map using the QGIS Cloud or web mapping service. Model publishing enables open access to the model, which is feasible using non-proprietary spatial data to avoid copyright infringement. 3D model extension and application: The geometry data from the 3D model is exported using PostgreSQL with the PostGIS extension, enabling a navigation tool to lead people through the structure. Without extra hardware, precise real-time indoor localisation has been achieved using mobile phone sensors in conjunction with Wi-Fi and Bluetooth. Potential uses for this sensor data integration exist in several industries that demand accurate indoor positioning.
- 8.
- Data management: Consistent formatting, logical grouping, and routine backups to guard against loss are all data management components. Compatibility may be facilitated by using standardised file formats like shapefile and GeoJSON. Access to data is made easier using logical organisation, distinct file names, and appropriate grouping. Routine backups to cloud storage or backup software ensure data security from hardware failure or corruption. The PostgreSQL database structure was specifically created for the 3D indoor modelling framework and consists of multiple interconnected tables. Each table has a distinct purpose in facilitating interior navigation and modelling processes. The Building Information Table is a fundamental component encompassing crucial building parameters such as BuildingID, BuildingName, BuildingFootprint for the overall structure, BuildingHeight, and architectural details. The Level Information Table, associated with the Building Information Table, documents specific information pertaining to each level, including FloorID, FloorNumber, and FloorLayout. The Routing Network Table, which relies on the Floor Information Table, contains essential node-related data for routing purposes, including NodeID, Coordinates, EdgeID, and EdgeWeight. The database also integrates geospatial data types to efficiently manage spatial relationships, as demonstrated by the inclusion of the Pathway Information Table, which includes PathwayGeometry, and the Points of Interest (POI) Table, which includes POICoordinates. The User Location Data Table plays a vital role in real-time positioning by recording essential information such as UserID, FloorID, UserCoordinates, and Timestamp. Efficient indexing and restrictions play a crucial role in optimising data retrieval and ensuring data integrity within this robust database structure. These elements are essential for enabling the smooth operation of indoor navigation and the effective management of spatial information.
The routing information derived from the 3D indoor model is utilised for localisation and navigation within an Android application. Mapping activities are conducted on desktop platforms using web-based mapping tools. Various data, such as floor plans and points of interest, are created using QGIS and incorporated to enhance the application experience. To integrate this information with the mobile application, Android SDKs are employed. For navigation purposes, the data from the 3D model are exported using QGIS and integrated into the Android app using the following steps:
- Export the routing information: The routing information from QGIS is exported into a format (e.g., GeoJSON) used in the Android application.
- Import the routing information into the Android application: Libraries like GeoTools, GDAL, and Osmosis are used to import the geospatial data into the Android application.
- Routing algorithms: Dijkstra’s algorithm has been used to find the shortest path between two locations. In order to determine the shortest and most secure path between two points in indoor environments, Dijkstra’s method is utilised. This algorithm works by selecting the node with the least known distance and adjusting the distances to its adjacent nodes. The aim is to construct the most efficient path. The programme takes into account the weights assigned to the edges, which represent the distance and security level of pathways within the building. The process begins by defining the weighted graph, where nodes represent critical locations and edges signify connections between these locations. Each edge is assigned a weight based on factors such as distance, visibility, and safety. The programme navigates the graph systematically to calculate the quickest and safest route, facilitating efficient indoor navigation. The output of these algorithms is further used to provide routing in indoor areas.
- Display the route on a map: After calculating the route, this route will display on the map in the Android app.
- Add additional features: Additional features like searching for a specific location, point of interest, or turn-by-turn direction assistance were added.
The complete process of creating a 3D routing information system using QGIS is depcited in Figure 2 below. It elaborates on creating a 3D model of a building and using PostgreSQL to store the GEOM data for a navigation application. The procedure includes data acquisition, data processing, database management, and Android application development.
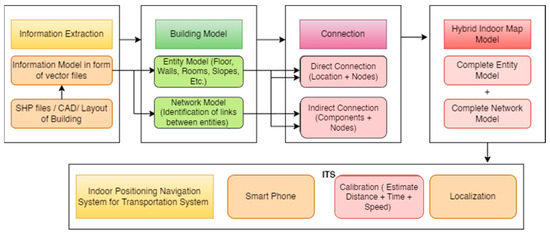
Figure 2.
Modelling approach for a 3D indoor positioning system for transportation assistance. The rectangles describe the process steps.
The innovation of the work lies in the integration of QGIS for the purpose of 3D indoor modelling as well as the development of an accurate indoor routing algorithm utilising Dijkstra’s approach. This integration enables clear visualisation of indoor spaces and accurate navigation. The integration of smartphone sensor data with wireless signals offers an innovative approach to improving indoor localisation without the need for further gear. The case study effectively demonstrated the implementation of these novel components within a three-story building.
4. Case Study
This section provides the details of the case study performed to check the effectiveness of the proposed framework. This case study involved a series of steps. Firstly, a three-story building with specific coordinates was selected. Next, building information was integrated into the study. Subsequently, a 3D model was created using QGIS. The detailed layout of the building was then incorporated into the model. An indoor positioning app was integrated into the system. Dijkstra’s algorithm was utilised to determine the optimal routing within the building. Finally, the travel time efficiency was analysed using an ITS.
A three-story building located at 30.5161° N, 76.6598° E was used for the case analysis. The study incorporates building information into the model to support various services such as wayfinding, routing, navigation, emergency response, and management. Multiple elements, such as indoor models, route visualisation, integration with the outdoor environment, and path networks, are integrated to achieve a comprehensive 3D indoor modelling framework. The study emphasises using existing geographical information systems for mapping, analysing, sharing, and managing capabilities. QGIS was used to view the GIS data in three dimensions as a 3D visualisation application. It provides access to analytical tools and functions due to its complete integration with the geo-processing environment, as shown in Figure 3. The developed prototype integrates the transportation hub’s building footprints into the outdoor road network and models the indoor multi-story buildings.
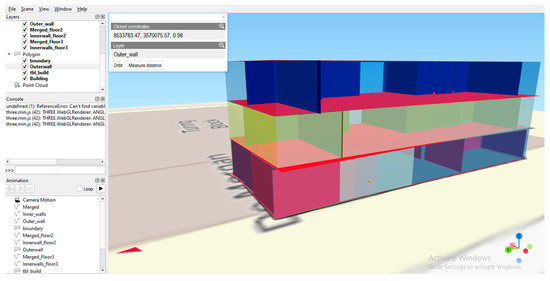
Figure 3.
Representation of a building in three dimensions.
The case study demonstrates the integration of ITS concepts into indoor navigation solutions by building a 3D model with QGIS for an indoor positioning mobile app. A 3D model of the selected building is created per the steps defined in the methodology section and using the QGIS software. Vector files are converted into 3D models using blueprints of the building and QGIS. The 3D model includes detailed information about the building layout, including the location of each floor, parking areas, connected nodes, and units. The accuracy of the building layout is maintained using the building blueprint. Once the 3D model was completed, we integrated it into the indoor positioning application. This application provides real-time location-based services to users. We used the Android app to provide users with real-time navigation information based on their location within the building. The fundamental technology underlying the IPS and indoor navigation involves the use of Dijkstra’s calibration algorithm, which integrates preexisting environment information, such as magnetic fields, Bluetooth, and Wi-Fi signals, with inertial sensor data from smartphones, including compass, gyroscope, and accelerometer readings.
This sensor data integration enables real-time indoor localisation with high accuracy, achieving less than 3 m of error without requiring additional hardware. Here are a few steps to provide indoor routing in the indoor positioning mobile application. The application SDK needs to be configured to work in indoor spaces. There is a need to calibrate the system to ensure precise indoor positioning. After calibration, Dijkstra’s routing algorithm determines the best route between two points within the indoor space. The algorithm should consider different points of interest to provide the most desirable route. The SDK provides real-time positioning data from Wi-Fi, Bluetooth, and sensors in mobile devices. The routing algorithm uses this gathered data to determine the user’s location and provide the best route. After integrating the routing algorithm with the mobile application’s SDK, an intuitive interface needs to be developed. The user can enter their destination, and the mobile application provides them with directions (turn by turn). Finally, the system needs to be tested thoroughly to ensure it works correctly. To find the shortest path after mapping the indoor data of a building using QGIS data, a possible routing algorithm could be as follows:
Convert the indoor map data into a graph where offices, rooms, hallways, pathways, waiting areas, slopes, inclined surfaces, ramps (which allow vehicles to move between levels in a building, such as parking garages or indoor transport), and other transportation-related facilities like parking spaces are represented as nodes and the connections between them as edges. This can be undertaken using QGIS software. Assign weights to the edges based on their length and the perceived safety of the route. For example, shorter routes may have a lower weight, while routes through well-lit and monitored areas may have a higher weight. These weights can be adjusted based on the sensor’s (LiDAR) calculation and the traditional paths. Dijkstra’s algorithm will use the weights assigned to each edge to determine the optimal path. Once the path is determined, display it to the user. This can be displayed using QGIS or other mapping software and may include visual cues such as arrows or highlighted areas. Figure 4 shows the construction of a dual graph representing the connectivity relations (solid black lines) and adjacency relations (black dotted lines). Each floor’s dual graph aids in regaining the spatial links between various regions and elements within the indoor environment of various floors. It is possible to design the best course of travel by understanding the connectedness and adjacency relations between various regions, such as doors, walls, rooms, pathways, vehicle ramps, and other transportation-related facilities.
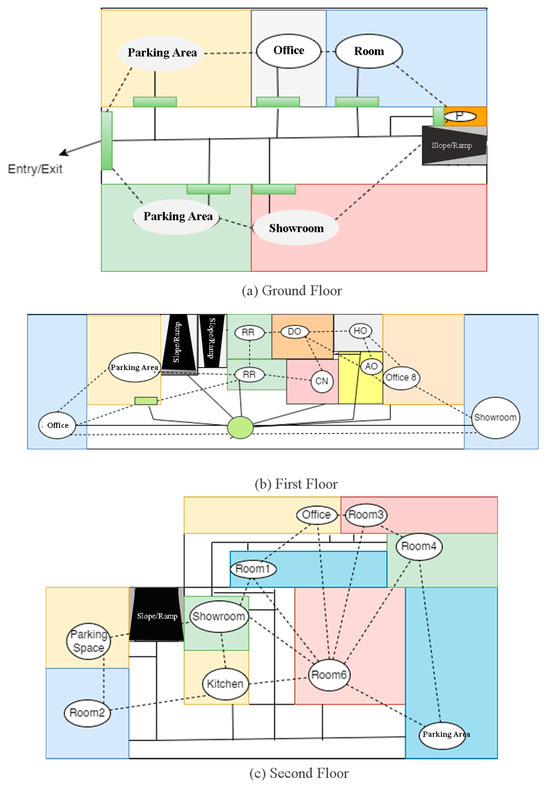
Figure 4.
Dual graph that symbolises both connectivity relations and adjacency relations.
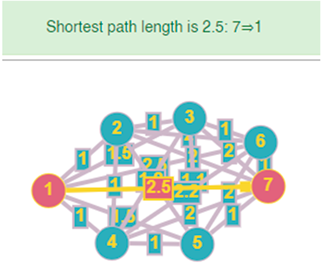
The current work documents the effective creation of a graph with weighted vertices and connected pathways for each level of a building. We employed the weights provided to each vertex using the Dijkstra method to find the shortest path between any two locations on a given floor. Table 3 shows the graph’s adjacency matrix and distance matrix to help demonstrate our findings. The most effective route between any two points can be quickly determined using a visual representation of the relationship between vertices and their distances, as shown in Table 3. In order to develop edge connections within the context of indoor navigation, a comprehensive analysis of the building plan is conducted, wherein pathways or routes connecting different sites are identified and defined. This objective is accomplished via the comprehension of spatial linkages and proximities among various zones within the structure. The assignment of weights to edges is determined by several factors, such as distance and safety considerations. Connections are established by taking into account the coherence and fluidity of transitions between different areas. This methodology guarantees optimal routing and contributes to the development of a dependable indoor navigation system.
Table 3.
Visual demonstration of the connection between vertices and the distances between vertices.
Numerous steps may be taken to develop a routing algorithm that uses QGIS data to discover the quickest route through an indoor map. Several key control factors play a vital role in attaining maximum performance. The parameter known as “Mapping Tool Alignment” guarantees the accurate alignment of the mapping tool with the building layout by means of calibration that takes into account the physical structure of the building. The parameter known as “3D Modelling Algorithms” encompasses the careful selection and refinement of algorithms utilised in the creation of a three-dimensional model. This selection process is conducted using rigorous experimentation and comparison with recognised industry standards, as shown in Figure 5. First, a graph must be created from the indoor map data using a library like NetworkX. The weight function can then give the graph’s edge weights based on length and perceived safety. A shortest path algorithm such as Dijkstra’s can be used to find the best path through the graph. By using a series of calculations, the shortest path between two nodes can be determined.
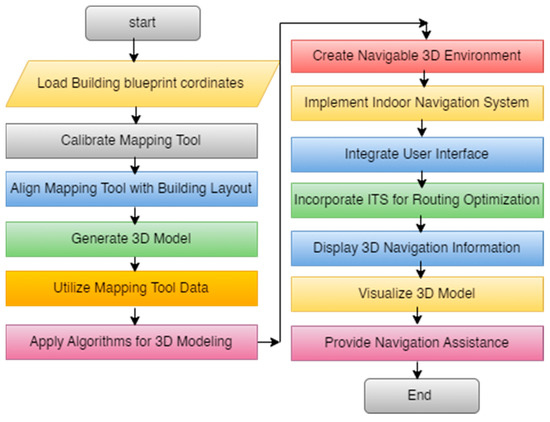
Figure 5.
Representation of flow of proposed algorithm.
Dijkstra’s algorithm updates the cost value of each node until the shortest path from the starting node to the destination is found. This path can be displayed to the user by using mapping libraries like Folium. It allows adding markers, cues, and other visuals. The “NetworkX” library facilitates numerical computations, enabling the calculation of distances and the determination of optimal routes. In contrast, the software “Folium” functions akin to an artist, facilitating the generation of interactive maps. The initial step is establishing a framework, namely an empty graph, using the “Networkx” library. Next, we establish a rulebook, which is a function that determines the level of difficulty or ease of our journey by considering many parameters. Subsequently, the utilisation of “Dijkstra’s algorithm”, a sophisticated method for determining the most efficient path, is employed, owing to the implementation of “Networkx”. Now, we enter the enjoyable phase. The application “Folium” enables users to plot their desired route on a geographical map. The process involves delineating the initial point and the desired destination, then establishing a connection between them by drawing a line. This method facilitates a lucid and straightforward path for navigation. The aforementioned system utilises the Python programming language and relies on the “NetworkX” and “Folium” libraries to effectively determine and present the optimal indoor route as shown in Algorithm 1.
| Algorithm 1. To calculate the shortest and safest path after mapping the indoor data of a building using QGIS data |
|
5. Result and Discussion
The present study involved the development of a 3D routing information system for an indoor application. A mapping tool was calibrated to the actual coordinates using the building blueprint layout. The resulting 3D model provides a visual representation of the indoor space that can be easily navigated using the proposed methodology, as shown in Figure 6.
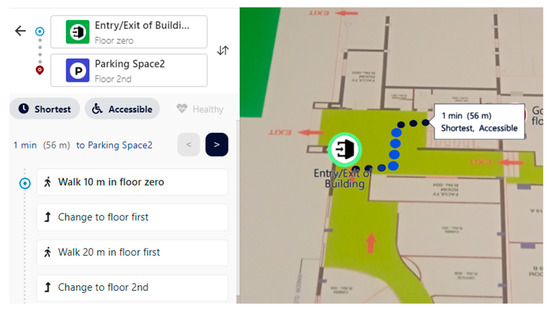
Figure 6.
Indoor navigation information assistance (desktop view from floor zero to floor 2).
Several experiments were conducted to evaluate the efficacy of the system. The results of these experiments were studied to determine the accuracy and reliability of the proposed framework. According to the experimental findings in Figure 5, the system successfully provided precise indoor navigation data.
Additionally, it was discovered that the suggested methodology was simple to utilise and user-friendly. The 3D model’s images gave users a clear and concise portrayal of the indoor environment, making it simple for them to go from one place to another.
The graph shows (in Figure 7) the significant reduction in travel time, measured in minutes, achieved by implementing an ITS compared to standard navigation methods across various locations and floors. For testing how accurate the 3D routing information system was, the difference between the real coordinates from the building plan and the system’s equivalent coordinates had to be worked out. The calculation of the error (E) was performed utilising the Euclidean distance, which is a widely accepted metric for evaluating spatial precision, as shown in Equation (1).
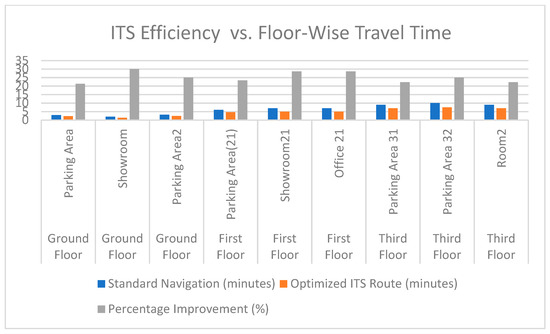
Figure 7.
Comparison of ITS efficiency gains (%) and floor-wise travel time.
Xactual and Yactual are the actual coordinates from the blueprint of the building. Xgenerated and Ygenerated are the coordinates generated by the system. The efficacy of the three-dimensional routing information system was assessed via a comparison of travel durations between conventional navigation techniques and the integrated intelligent transportation system. The quantification of journey time reduction, a fundamental metric of operational effectiveness, was computed in Equation (2):
where Tstandard is the average time travel of a standard navigation system. Tsys is the average time using the implemented ITS. According to research, the use of ITS results in an average improvement of around 25.51% of travel time when compared to standard navigation methods. This demonstrates the effectiveness of ITS in enhancing the user experience by optimising routes, resulting in expedited interior navigation and greater convenience. By implementing these improvements, the system performance is enhanced by the efficient deployment of resources.
A comparative review of our study’s key characteristics and outcomes with the relevant field research supports our findings. A comparison of the accuracy, modelling efficiency, 3D model understanding, time travel impact from ITS deployment (Table 4), and efficiency increase is revealed. Our research’s strengths and contributions are highlighted by comparison to relevant studies.
Table 4.
Comparison of key features and results with related studies.
6. Conclusions
The study concludes with the fact that due to complex indoor layouts, it is difficult to find a location without a reliable indoor navigation system. The study suggests using the QGIS software to model multi-story buildings in 3D and incorporating these models into an indoor positioning application to support reliable indoor navigation services. The integration described plays a crucial role in establishing an intelligent transportation infrastructure that enables accurate navigation for vehicles within enclosed areas.
By considering various points of interest, the routing algorithm finds the shortest path between two points in an indoor area. The quickest path is found with a network representing walkable places as nodes and their connections as edges.
The process of collecting data to create a 3D model framework posed significant challenges. Data were gathered using both LiDAR technology and traditional methods to ensure device accuracy. Another hurdle emerged during the building creation process, specifically in data removal. Handling duplicate and inconsistent data and inaccurate measurements proved to be difficult when removing unnecessary information. Although QGIS can be challenging to use for beginners, it offers various plugins that facilitate quick and easy design. To construct the 3D model, vector files were generated. The accuracy of the model was verified using the Situm indoor application, which involved calibrating actual points of interest, pathways, and routing inside the building. Calibration played a vital role in assessing the system’s functionality and accuracy. Our study revealed that the framework achieved an accuracy of less than 1 m. Based on the observed evidence, the utilisation of ITS has been found to result in an average travel time improvement of 25.51% compared to traditional navigation methods. Additionally, they can be easily calibrated using an Android app. Precision was evaluated by comparing the calibrated model to actual locations, with an error of less than 1 m indicating satisfactory precision. However, it is important to note that precision alone does not guarantee accuracy, which requires attention to detail and expertise. It is vital to acknowledge the significance of evaluating our methodology by scrutinising diverse case studies, since this is crucial for attaining comprehensive validation. The present study provides a thorough evaluation based on a singular case study. Nevertheless, future studies will extend the validation process to include other indoor scenarios, specifically emphasising the assessment of accuracy, usability, and efficiency advantages in diverse setups and geographical contexts. Subsequent endeavours will prioritise the enhancement of positioning accuracy by means of sophisticated sensors and the incorporation of user feedback. The utilisation of dynamic routing, the incorporation of real-time data, and the application of machine learning techniques for personalised navigation exhibit considerable potential. The crucial aspects for the successful implementation of comprehensive indoor navigation systems involve the adaptation of the framework to various indoor environments and the effective resolution of privacy concerns.
Author Contributions
J.S. and S.S.S. reviewed, advised, and provided guidance throughout the research. They also contributed to the refinement of the study design, data analysis, and interpretation of the findings. N.T. conceived the study, designed the research methodology, collected the data and interpretation of the results, and drafted the initial version of manuscript. S.S. conducted the statistical analysis of the data and contributed to the interpretation of the results. F.A., A.A.A. and F.I.A. reviewed and analyzed the results. These authors also helped with funding acquisition. All authors have read and agreed to the published version of the manuscript.
Funding
This work was supported by the Researchers Supporting Project (number RSP2023R395), King Saud University, Riyadh, Saudi Arabia.
Institutional Review Board Statement
Not applicable.
Informed Consent Statement
Not applicable.
Data Availability Statement
The authors confirm that the data supporting the finding of this research are available within the article.
Acknowledgments
We would like to acknowledge Situm Indoor Positioning System (www.situm.com, accessed on 5 April 2023) for providing us with access to its app, which was instrumental in validating the effectiveness of our research work. The use of Situm’s indoor positioning technology greatly contributed to the accuracy and reliability of our experiments accessed on 5 April 2023. Authors also would like to extend their appreciation to King Saud University for the support of this work.
Conflicts of Interest
The authors have no competing interests to declare that are relevant to the content of this article.
References
- Goyal, D.; Dang, R.K.; Goyal, T.; Saxena, K.K.; Mohammed, K.A.; Dixit, S. Graphene: A Path-Breaking Discovery for Energy Storage and Sustainability. Materials 2022, 15, 6241. [Google Scholar] [CrossRef]
- Pascacio, P.; Casteleyn, S.; Torres-Sospedra, J.; Lohan, E.S.; Nurmi, J. Collaborative Indoor Positioning Systems: A Systematic Review. Sensors 2021, 21, 1002. [Google Scholar] [CrossRef]
- Kang, Z.; Yang, J.; Yang, Z.; Cheng, S. A Review of Techniques for 3D Reconstruction of Indoor Environments. ISPRS Int. J. Geo-Inf. 2020, 9, 330. [Google Scholar] [CrossRef]
- Sun, Q.; Zhou, X.; Hou, D. A Simplified CityGML-Based 3D Indoor Space Model for Indoor Applications. Appl. Sci. 2020, 10, 7218. [Google Scholar] [CrossRef]
- Ma, W.; Zhang, S.; Huang, J. Mobile Augmented Reality Based Indoor Map for Improving Geo-Visualization. PeerJ Comput. Sci. 2021, 7, 2–25. [Google Scholar] [CrossRef] [PubMed]
- Liu, J.; Luo, J.; Hou, J.; Wen, D.; Feng, G.; Zhang, X. A BIM Based Hybrid 3D Indoor Map Model for Indoor Positioning and Navigation. ISPRS Int. J. Geo-Inf. 2020, 9, 747. [Google Scholar] [CrossRef]
- Hamm, N.; Sun, Q.; Kelobonye, K.; Zhang, H.; Li, G. Precise Indoor Path Planning Based on Hybrid Model of GeoSOT and BIM. ISPRS Int. J. Geo-Inf. 2022, 11, 243. [Google Scholar] [CrossRef]
- Subedi, S.; Pyun, J.-Y. A Survey of Smartphone-Based Indoor Positioning System Using RF-Based Wireless Technologies. Sensors 2020, 20, 7230. [Google Scholar] [CrossRef] [PubMed]
- Mantri, A.; Dutt, S.; Gupta, J.P.; Chitkara, M. Design and Evaluation of a PBL-Based Course in Analog Electronics. IEEE Trans. Educ. 2008, 51, 432–438. [Google Scholar] [CrossRef]
- Buyukdemircioglu, M.; Kocaman, S. Reconstruction and Efficient Visualization of Heterogeneous 3D City Models. Remote Sens. 2020, 12, 2128. [Google Scholar] [CrossRef]
- Divya Zion, G. Comparative Analysis of Tools for Big Data Visualization and Challenges. In Data Visualization: Trends and Challenges Toward Multidisciplinary Perception; Springer: Berlin/Heidelberg, Germany, 2020; pp. 33–52. [Google Scholar]
- Wu, T.; Xia, H.; Liu, S.; Qiao, Y. Probability-Based Indoor Positioning Algorithm Using IBeacons. Sensors 2019, 19, 5226. [Google Scholar] [CrossRef] [PubMed]
- Sehra, S.S.; Singh, J.; Rai, H.S. Assessing OpenStreetMap Data Using Intrinsic Quality Indicators: An Extension to the QGIS Processing Toolbox. Future Internet 2017, 9, 15. [Google Scholar] [CrossRef]
- Pense, C.; Tektaş, M.; Kanj, H.; Ali, N. The Use of Virtual Reality Technology in Intelligent Transportation Systems Education. Sustainability 2022, 15, 300. [Google Scholar] [CrossRef]
- Zheng, L.; Zhou, W.; Tang, W.; Zheng, X.; Peng, A.; Zheng, H. A 3D Indoor Positioning System Based on Low-Cost MEMS Sensors. Simul. Model. Pract. Theory 2016, 65, 45–56. [Google Scholar] [CrossRef]
- Zhou, Y.; Pang, Y.; Chen, F.; Zhang, Y. Three-Dimensional Indoor Fire Evacuation Routing. ISPRS Int. J. Geo-Inf. 2020, 9, 558. [Google Scholar] [CrossRef]
- Soliman, K.; Naji, K.; Gunduz, M.; Tokdemir, O.B.; Faqih, F.; Zayed, T. BIM-Based Facility Management Models for Existing Buildings. J. Eng. Res. 2022, 10, 21–37. [Google Scholar] [CrossRef]
- Kang, J.; Lee, J.; Yun, H.; Lee, S. Repositioning Technique Based on 3D Model Using a Building Shape Registration Algorithm. Sens. Mater. 2022, 34, 261–276. [Google Scholar] [CrossRef]
- Sleaman, W.K.; Yavuz, S. Indoor Mobile Robot Navigation Using Deep Convolutional Neural Network. J. Intell. Fuzzy Syst. 2020, 39, 5475–5486. [Google Scholar] [CrossRef]
- Zhang, H.; Zhao, Q.; Cheng, Z.; Liu, L.; Su, Y. Dynamic Path Optimization with Real-Time Information for Emergency Evacuation. Math. Probl. Eng. 2021, 2021, 3017607. [Google Scholar] [CrossRef]
- Bharadwaj, S.; Dubey, R.; Zafar, M.I.; Faridi, R.; Jena, D.; Biswas, S. Determination of Point-to-Point 3D Routing Algorithm Using LiDAR Data for Noise Prediction. Appl. Syst. Innov. 2022, 5, 58. [Google Scholar] [CrossRef]
- Nikoohemat, S.; Diakité, A.A.; Zlatanova, S.; Vosselman, G. Indoor 3D Reconstruction from Point Clouds for Optimal Routing in Complex Buildings to Support Disaster Management. Autom. Constr. 2020, 113, 103109. [Google Scholar] [CrossRef]
- Scianna, A.; Gaglio, G.F.; La Guardia, M. Digital photogrammetry, TLS survey and 3D modelling for VR and AR applications in CH. Int. Arch. Photogramm. Remote Sens. Spat. Inf. Sci. 2020, XLIII-B2-2020, 901–909. [Google Scholar] [CrossRef]
- Karachaliou, E.; Georgiou, E.; Psaltis, D.; Stylianidis, E. UAV for Mapping Historic Buildings: From 3D Modelling to BIM. Int. Arch. Photogramm. Remote Sens. Spat. Inf. Sci. 2019, XLII-2-W9, 397–402. [Google Scholar] [CrossRef]
- Díaz-Vilariño, L.; Khoshelham, K.; Martínez-Sánchez, J.; Arias, P. 3D Modeling of Building Indoor Spaces and Closed Doors from Imagery and Point Clouds. Sensors 2015, 15, 3491–3512. [Google Scholar] [CrossRef] [PubMed]
Disclaimer/Publisher’s Note: The statements, opinions and data contained in all publications are solely those of the individual author(s) and contributor(s) and not of MDPI and/or the editor(s). MDPI and/or the editor(s) disclaim responsibility for any injury to people or property resulting from any ideas, methods, instructions or products referred to in the content. |
© 2023 by the authors. Licensee MDPI, Basel, Switzerland. This article is an open access article distributed under the terms and conditions of the Creative Commons Attribution (CC BY) license (https://creativecommons.org/licenses/by/4.0/).