Abstract
The incorporation of construction and demolition (C&D) waste in concrete production has gained great importance toward sustainability, especially in geopolymer concrete. In this study, ground granulated blast-furnace slag (GGBFS) and fine aggregate of normal geopolymer concrete were partially replaced by clay brick powder (CBP) and fine clay brick (FCB) derived from C&D waste, respectively, aiming to produce high-strength geopolymer concrete (HSGC). Fly ash (FA) was also used as a partial replacement for GGBFS in normal geopolymer concrete. Twenty HSGC mixtures were designed using the response surface methodology with three variables, including CBP (0–25%), FA (0–25%), and FCB (0–50%). The performance of the proposed HSGC mixtures was assessed by measuring several mechanical and durability properties. In addition, a variety of physicochemical methods, including X-ray fluorescence spectroscopy, X-ray diffraction, and scanning electron microscopy, were used to examine the mineralogical and microstructural characteristics of the control and the developed mixtures. The findings revealed that the compressive, splitting tensile, and flexural strengths of the HSGC made with C&D waste ranged from 38.0 to 70.3 MPa, 4.1 to 8.2 MPa, and 5.2 to 10.0 MPa, respectively. The results also indicated that the incorporation of FA is an essential parameter to eliminate the negative impacts of C&D waste addition on concrete workability. The optimal proportions for the HSGC were 5% for CBP, 5% for FA, and 40% for FCB, which were determined to generate the optimized HSGC with the highest mechanical performance, according to the verified models and optimization findings. The physicochemical analyses showed that the thick amorphous geopolymeric gel predominated the nonporous structure of the optimized HSGC, which had good mechanical characteristics. Furthermore, the anti-carbonation performance and freezing resistance of the optimal HSGC increased by 17.7% and 14.6%, respectively, while the apparent porosity decreased by 8.4%.
1. Introduction
Owing to the increasing growth of infrastructure in modern societies, the need for concrete has expanded dramatically, leading to environmental pollution [1,2,3] and public concern about the high production of conventional concrete [4,5]. Next to water, concrete is the second-largest consumable material in the world [6,7]. The production of concrete generates 5–7% of all atmospheric CO2 emissions, which increases the problem of global warming [8,9]. The manufacture of Portland cement (PC) on a regular basis presents several environmental challenges, including a high energy demand, the use of non-renewable raw materials, and the release of large amounts of CO2 [10,11]. According to estimations, the production of one ton of cement consumes up to 1.5 tons of raw materials and emits more than one ton of CO2 [12].
The growing cement-based construction material demand in low- and middle-income countries and the need to reduce CO2 emissions are the primary factors forcing the construction industry toward trustworthy alternatives to cement-based structural materials in favor of eco-friendlier sustainable materials [13]. The use of geopolymer concrete (GPC) as a sustainable substitute to cementitious composites as a building material has gained interest on a global scale in recent years [14,15,16], because of its use in industrial waste [17,18], its decreased CO2 emissions, its adequate mechanical and durability characteristics [8], and its high resistance to fire and acids [18]. Chowdhury et al. [19] introduced the term “geopolymer” in 1979 to describe a group of mineral binders having a chemical composition and amorphous microstructure like zeolite. In comparison to PC, the use of geopolymer binders can decrease energy consumption and CO2 emissions by 60% [15]. Numerous earlier studies claimed that, compared to the same strength grade of PC concrete, GPC had superior engineering and durability properties [20,21,22]. According to Ganesh and Muthukannan [23], using GPC would minimize the global warming effect of cement manufacturing by around 80%.
GPC is manufactured based on silica and aluminum as raw materials, in addition to the alkaline activator solution [7], which has the same chemical composition as zeolites but has an amorphous structure [3]. Fly ash (FA), ground granulated blast-furnace slag (GGBFS), silica fume, metakaolin, rice-husk ash, high-calcium wood ash, red mud, and other industrial by-products are the main sources of aluminosilicates [23]. The alkaline activator solution is often an aqueous concentrated solution of alkali hydroxide and silicate [23]. Industrial waste materials such as GGBFS and FA-based alkali materials emit 80% and 80–90% less greenhouse gas than those from cement concrete manufacture, respectively [24]. Sodium hydroxide (NH), potassium hydroxide (KH), sodium silicate (SS), and potassium silicate (KS) are commonly the alkaline activators utilized in the production of GPC [5]. The optimum alkaline activator, according to [25,26], is a sodium hydroxide-sodium silicate blend for producing high-strength GPC. GPC that has been activated with NaOH typically has high compressive strength [26]. The flowability decreases as the concentration of NaOH rises because of the increase in solution viscosity [27], whereas the compressive strength increases [19]. One of the most crucial elements impacting the characteristics of GPC is the curing technique utilized. The polymerization process of GPC is successfully enhanced, and the pores in the internal structure are filled by curing GPC at temperatures between 60 and 90 °C [7].
Construction demolition waste (C&D) is growing daily, and it has the potential for technological advancement in producing GPC. The rheological and mechanical properties of GPC that incorporates waste materials as a partial substitute for aggregates and binder components have been the subject of several studies. The durability and mechanical characteristics of GPC, including slag and ceramic waste powder (CWP), were studied by Chokkalingam et al. [8]. It was reported that a blend of 60% slag and 40% CWP performed better than a control mix comprising 100% slag. To create an ideal ternary geopolymer system in an ambient setting, Mahmoodi et al. [28] explored the usage of recycled ceramic wall tile (RWT), recycled concrete (RCW), and waste recycled clay brick (RCB). It was possible to manufacture high-strength GPC in ambient settings by using a ternary composition of 40% RWT, 40% RCW, and 20% RCB. Reig et al. [29] used porcelain tiles to make geopolymer binders and mortars and studied the effect of alkaline activator concentrations and Ca (OH)2. A compressive strength less than 15 MPa after 7 days was obtained, and it increased with the use of larger Ca (OH)2 doses. Fort et al. [30] used waste brick powder to produce geopolymer pastes and achieved 41.9 MPa of compressive strength. Naenudon et al. [31] used waste ceramic electrical insulators as a replacement for aggregate to enhance the characteristics of fly-ash-based GPC. Also, to improve the strength of a pumice-based geopolymer paste, Nasaeng et al. [32] combined calcined oyster shell (CS) particles and recycled concrete (RC). The results revealed that when the RC and CS contents increased, the compressive strength was enhanced. By combining 50% CS and 50% RC, maximum compressive strengths of 26.6 and 27.1 MPa were reached, respectively, at 28 days.
The response surface methodology (RSM), a multivariate statistical tool, has previously been proven to be a viable statistical procedure [33]. Several studies have reported RSM-based optimizations of concrete characteristics [34,35,36]. The RSM is a successful experimental design technique for designing experiments, building response models, evaluating the impacts of components, and analyzing the best conditions when several variables affect an interest response [37]. For examining the impact of interactions between components, RSM approaches can also provide contour plots and rough continuous surfaces [38].
Numerous studies have separately employed C&D waste such as recycled powder, recycled fine aggregate, and fly ash as main components for slag-based GPC production, but these wastes have not been combined through any mixture design application to optimize their blending. Therefore, the central composite design (CCD) was employed in the current study to design and optimize the test and establish the regression model to improve the mechanical performance of high-strength geopolymer concrete (HSGC) containing C&D waste. Clay brick powder (CBP) and fine clay brick (FCB) derived from W&D waste and FA were used as independent variables. Concrete slump, compressive strength, tensile strength, and flexural strength were used as response target values. This study aims to achieve the highest possible mechanical strength by carefully blending the mixture’s constituents in the study domain. Also, the aim of this paper is to recycle the construction and building waste with furnace slag to produce high-strength concrete. All responses’ experimental data were gathered and utilized to build mathematical models, which were then statistically assessed using ANOVA and given diagnostic validation. The best component domains from the CBP-FA-FCB were then identified using the response curves and the desirability function to create an optimized high-strength geopolymer composite. Several physicochemical methods, including X-ray fluorescence (XRF), X-ray diffraction (XRD), Fourier transform infrared (FTIR), scanning electron microscopy (SEM), and energy-dispersive X-ray (EDX), were used to characterize the precursors and produce geopolymeric materials. The current study is divided into four sections. The raw materials and methodology of this study are presented in Section 2. The results and discussion provided with the microstructure study are explained in Section 3. Finally, the conclusion of this study is shown in Section 4.
2. Experimental Program
2.1. Preparation of C&DW-Based Precursors and Recycled Aggregate
The main binder component utilized in the current study to produce geopolymer concrete was ground GGBFS, which has a specific gravity of 2.82 and a surface area of 3950 cm2/g. FA Class F with 2.38 specific gravity and 4250 cm2/g specific surface area was utilized as a partial substitute for GGBFS (0–25%) to increase and improve the concrete’s workability. Additionally, C&DW-based materials were used as recycled precursors and recycled fine aggregate was used to produce eco-efficient, high-strength geopolymer concrete (HSGC). CBP and FCB were carefully derived from C&D waste, as shown in Figure 1, which were obtained from an old, demolished structure. GGBFS was replaced (0–25%) with some of the CBP-based precursors to study the effect of higher calcium content on the overall performance. Similarly, the recycled FCB derived from C&D waste was partially replaced (0–50%) as a partial replacement of fine aggregate. The type and proportions (as are discussed later) of C&D wastes were agreed upon to achieve ideal geopolymerization and high-compressive-strength results under heat curing conditions. Each C&D-waste-based material was subjected to a 3-step crushing, milling, and sieving procedure for powder and fine aggregate. In other words, the CBP precursor and FCB fine aggregate were extracted from C&D waste. Each one of the materials was crushed by a jaw crusher with 1 mm spacing and then ground in a ball mill for an hour. Upon the demolition of a structure, different types of C&D wastes are obtained together. It takes substantially less work to recycle different types of C&D waste materials together. The macro- and microstructures (SEM images) of different precursors are presented in Figure 1. According to the SEM images, CBP precursor particles had angular grains with a rough surface, whereas GGBFS had a mixed particle structure that included grains with angular surfaces, while the FA had a smooth surface. Table 1 lists the chemical composition of GGBFS, FA, and C&D waste (CBP). The GGBFS, FA, and C&D waste powder were found to have sufficient Si and Al to allow the geopolymerization process to take place.
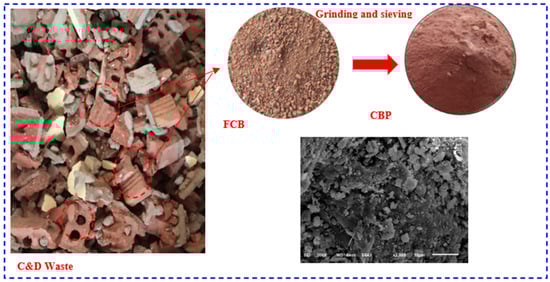
Figure 1.
Macro- and microstructure (SEM image) of the C&DW before and after grinding.

Table 1.
Oxide composition of GGBFS, FA, and CBP.
As seen in Table 1, FCB chemical compositions were comparable to those of GGBFS with slight changes. They both were high in silicon (63.30%) and aluminum oxides (15.78%), which are required for geopolymerization. In Figure 2, the chemical formulas of the crystal structures detected from XRD investigations were recorded for CBP and GGBFS precursors. No peaks attributable to any crystallized compounds were seen in the XRD of GGBFS obtained from the diffraction patterns, except for a broad diffraction halo between 20 and 30°, which corresponds to the vitreous phase, which is consistent with earlier research. However, the major crystalline phases of FCB include quartz, calcite, some sodium feldspar, and hematite. It was observed that quartz peaks with a hump centered between 2θ values of approximately 26°. Based on previous studies [22], two different alkaline activators were used in this investigation for the alkaline activation of waste-based precursors: (i) a flake of sodium hydroxide (NH) with 16 M form with a minimum of 98% NH, a maximum of 0.4% sodium carbonate, 0.1% sodium chloride, and 15 ppm of iron, and (ii) sodium silicate (SS) with a SiO2/Na2O ratio of 2.5 (SiO2 = 37.5%, Na2O = 15%, and H2O = 47.5%).
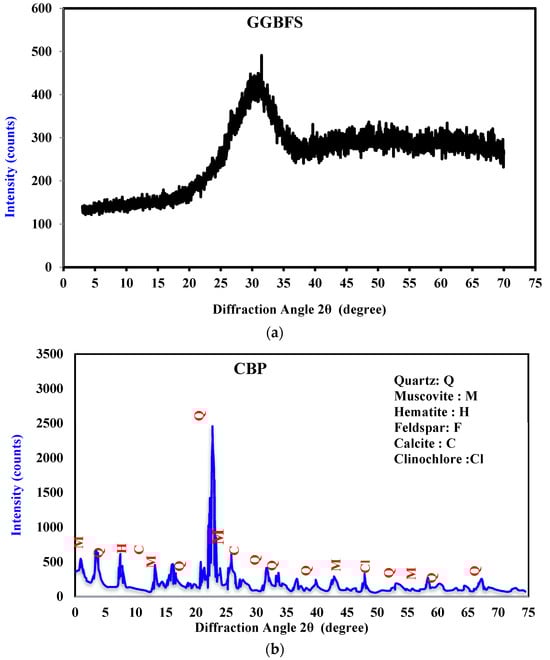
Figure 2.
XRD patterns of (a) GGBFS and (b) CBP.
Locally available crushed dolomite type 4/12.5 as coarse aggregates and natural sand type (0/4) with 2.975 fineness modulus as fine aggregates were used. All aggregates used were according to BS EN 12620 [39]. Figure 3 displays the grading curves for all materials used. Dolomite, sand, and FCB had specific gravities of 2.61, 2.59, and 2.08, respectively, and water absorption values of 1.2%, 0.76%, and 12.3%, respectively. In saturated surface dry state, the coarse and fine aggregates were employed. In addition, a polycarboxylate-based superplasticizer (SP) with 1.15 specific gravity was utilized in this study, according to ASTM C494 Type F [40].
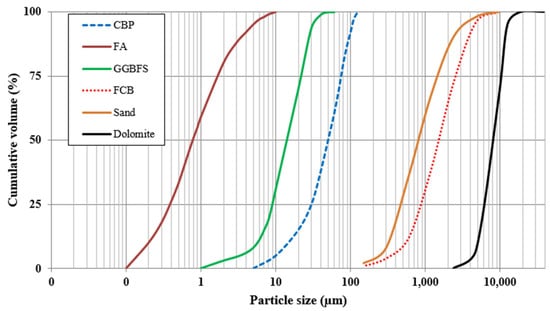
Figure 3.
Particle size distribution of GGBFS, FA, CBP, sand, FCB, and dolomite.
2.2. Optimum Mix Design of GPC
The optimal design mix for GPC was determined in the current investigation using the response surface method (RSM) of analysis, as shown in Figure 4. Three parameters were considered when performing the RSM: the replacement of GGBFS with FA (from 0 to 25%), the replacement of GGBFS with CBP (from 0 to 25%), and the replacement of sand with FCB (from 0 to 50%). The portion coded value was set at α = (2k)0.25 = (23) 0.25 = 1.682. Table 2 presents the variables’ limits and coded values. Twenty concrete mixes (R1 to R20) were developed based on CCD using RSM, plus one control mix (Co) without CBP, FA, and FCB. Trial-and-error methods were used to select the control GPC mix to obtain a slump value in the range of 100–150 mm and a compressive strength greater than 50 MPa. Table 3 displays the design criteria for each concrete mix. For all mixes, the ratio of fine aggregate to coarse aggregate was kept constant (0.35:0.65). The ratio of the SS to NH utilized was 2.5, and the NH molarity was 16 M [22].
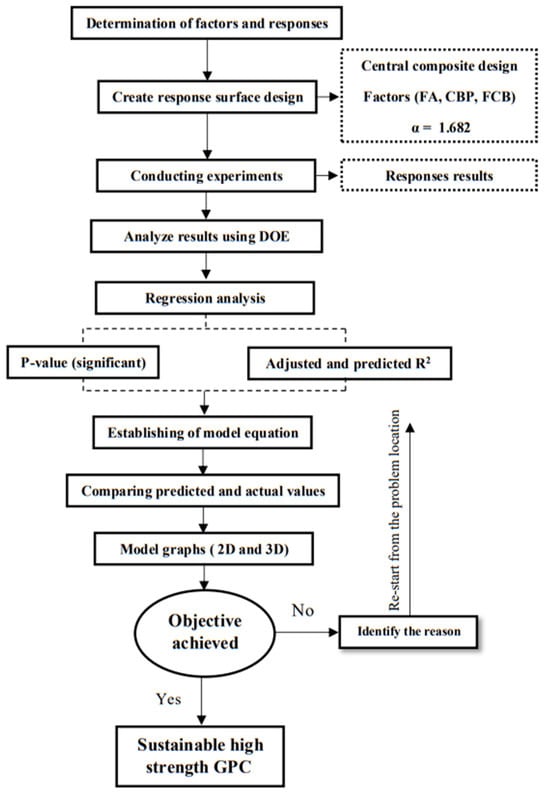
Figure 4.
Flow chart for the optimization and prediction process using RSM.
Table 2.
Limits and coded value of parameters.
Table 3.
Proportioning of mixes (kg/m3).
2.3. Specimen Preparation, Curing, and Testing
To obtain accurate findings, the mixing and testing techniques must be as comparable as possible throughout this research. First, NH pellets were dissolved in water, and the solution of the alkaline activator was made 24 h before concrete mixing. Precursors (GGBFS, FA, and CBP), sand, dolomite, and FCB were all added to the Horbit mixer, and dry mixing was used for 1 min at low speed (65 rpm). For 2 min, the dry components (aggregates and binder) were mixed at medium speed (102 rpm). The mixer was then filled with half of the alkaline activator and mixed for roughly 2 min at high speed (180 rpm). Finally, superplasticizer with the other half of alkaline activator solution were added to the mixer and mixed for about 3 min, until the mixture was fully blended and uniform. The steps of the mixing process are shown in Figure 5. The fresh concrete was then cast into steel molds and compacted using vibrating table. According to our previous study, the effect of different curing conditions on geopolymer concrete was investigated, and it was found that heat curing, especially in the range of 60–80 °C, is one of the best curing methods [22]. The cast samples were left at room temperature for 24 h, and then demolded and subjected to heat curing in a hot-air oven at 80 °C for 24 h before being stored at room temperature until the testing day [22].
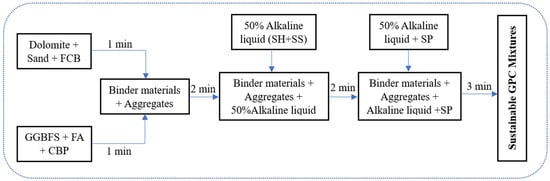
Figure 5.
The mixing procedure for sustainable GPC.
2.4. Test Procedure
2.4.1. Slump Test and Mechanical Characteristics
The slump test was carried out for all GPC mixtures according to ASTM C143 [41] to evaluate the effect of FA, CBP, and FCB on concrete workability. To assess the impact of the incorporation of C&D waste on GPC, three experimental responses, including compressive strength (fc), tensile strength (ft), and flexural strength (fr), were specifically considered. The compressive strength of mixes was measured at 7 and 28 days using 100 mm cubes according to BS/EN 12390-3 [42]. According to ASTM-C496-11 [43], cylindrical specimens with dimensions of 150 × 300 mm were utilized to evaluate the splitting tensile strength at 28 days. Three-point flexural strength test was performed on specimens with dimensions of 100 × 100 × 500 mm according to ASTM-C78-16 [44].
2.4.2. Water Absorption and Apparent Porosity
The water absorption and apparent porosity of the HSGC samples were measured according to ASTM C20 [45]. Water absorption test evaluates saturated concrete mass change by absorbing water. Three cylindrical discs (Ø100 × 50 mm) were cast for each mixture to measure the water absorption. The specimens were dried in an oven at 105 ± 5 °C for two days until they achieved a consistent weight. After that, they were stored in curing room at 60 ± 5% relative humidity and 23 ± 2 °C for 8 h and their weights were recorded (W0). All specimens were soaked in water for 24 h, and then the specimens were taken from the water and weighed after drying outer surface (W1) to evaluate water absorption. The water absorption was calculated using Equation (1).
2.4.3. Carbonation and Freeze–Thaw Testing
Carbonation is a degradation process that negatively influences the concrete and represents one of the primary perceived limitations for their adoption in structural applications. The depth of carbonation of HSGC specimens (35 mm × 35 mm × 100 mm) was calculated to define the effect of C&DW-based material on the durability of the HSGC. During the 28-day curing procedure, the top and bottom of each HSGC specimen were sealed with waterproof tape to ensure that CO2 diffused into the samples only through the circumferential surface, as shown in Figure 6a. The specimens were then placed in a carbonation test chamber with the following conditions: 25 °C, 60% ± 5% R.H., and 5% CO2. According to BS EN 12390-12:2020 [46], the HSGC specimens were cut at 30–35 mm intervals over the course of a week to measure the carbonation depth [47]. The specimens’ cuts were sprayed by phenol-phthalein solution (C₂₀H₁₄O₄) and the depths of colorless regions were measured.
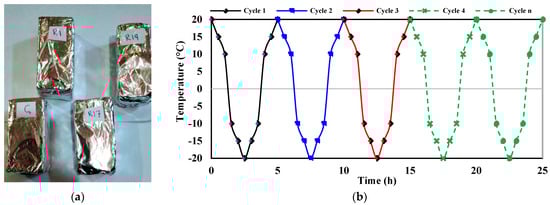
Figure 6.
(a) Carbonation specimen’s sealed with waterproof tape, (b) freeze–thaw cycles test.
The freeze–thaw test was performed according to ASTM C666/C666M [48] on 50 × 50 × 50 mm3 specimens for a total of 50 freeze–thaw cycles (see Figure 6b). HSGC specimens were immersed in a water bath for 24 h to ensure the quality of the test before being subjected to freeze–thaw cycles [49].
2.4.4. Scanning Electron Microscopy (SEM)
The impact of the research parameters (FA, CBP, and FCB) on the internal microstructure of GPC was examined using SEM analysis. The analysis was conducted on slices of dimensions (10 × 10 × 10) mm taken from the core of the concrete cubes of some selected mixtures. The engineering properties of HSGC were verified using a scanning electron microscope JEOL JSM-510LV (Electron Microscopy Unit, Mansoura University, Mansoura, Egypt).
3. Results, Analysis, Optimization, and Prediction
3.1. Analysis of Response Surface Models
To study the impact of input parameters (CBP, FA, and FCB) on the output responses (slump, fc, ft, and fr) and to construct the models, 21 GPC mixtures were produced and tested. The mixture proportioning and test results are shown in Table 4.
Table 4.
Mixes and experimental results of responses.
3.1.1. Effect of Input Variables on Slump Results
Table 4 illustrates the effect of GGBFS replacement with C&DW-based material on the workability of GPC mixtures. The slump values ranged from 60 to 115 mm for all GPC mixtures. Figure 7a shows the main effects of each parameter on the slump result. It is noticed that the slump value of any GPC mix was influenced by FA, CBP, and FCB levels. As observed, the slump value exhibited an increase with the increase in FA content and a decrease in CBP and FCB content. The abundance of FA resulted in a significant increase in slump value due to the lubricating effect provided by its spherical, glassy-shaped particles. This result agrees with what was found by Amran et al. [26] and Xu et al. [15]. In contrast, the increase in CBP as a replacement for GGBFS, and FCB as a replacement for sand led to a decrease in slump. The shape and nature of C&D waste (CBP and FCB) have a negative effect on workability because they cause strong adhesion between the matrix and particles [26]. The maximum slump (115 mm) was obtained for the control mix and the R16 mix, which contained 19.93% FA, 5.07% CBP, and 10.14% FCB. However, when using CBP and FCB as an alternative to GGBFS and sand, respectively, the absence of FA resulted in a noticeable negative effect on slump results, as shown in mix R7, which contained 0.0% FA, 12.5% CBP, and 25% FCB and offered the minimum slump value (60 mm). The effect of the interaction between parameters on slump test results is shown in Figure 7b. The highest values of slump were achieved at the maximum content of FA and the minimum content of CBP and FCB.
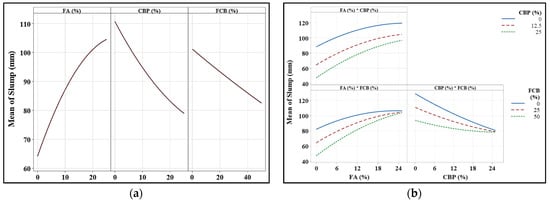
Figure 7.
(a) Main effects of variables on slump value, (b) effect of input parameter interaction on slump value.
3.1.2. Effect of Input Variables on Mechanical Properties
Figure 8 shows the compressive strength (CS) variation of GPC prepared with different substitution levels of FA and C&DW-based material at the ages of 7 and 28 days. The findings presented a decreasing trend in CS with the increase in GGBFS replacement level by FA. This effect can be observed by comparing mixes R7, R2, and R13, which contain 0.0%, 12.5%, and 25% FA, having CSs of 56.5, 53.0, and 48.8 MPa, respectively, at 7 days, and 61.7, 58.5, and 56.5 MPa, respectively, at 28 days. A similar trend was observed with increasing CBP replacement levels from 0.0% to 12.5% and 25% for mixes (R3, R2, and R11); the CS decreased from 59.8 MPa to 53.0 and 40.3 MPa, respectively, at 7 days, and from 64.0 MPa to 58.5 and 46.8 MPa, respectively, at age 28 days. This impact of CBP on the CS of GPC mixes is identical to its effect on conventional concrete, as was reported by Abdellatief et al. [34] and He et al. [50]. For mixes R10, R2, and R8, the CS after 7 days first demonstrated a significant increase from 41.6 MPa to 53.0 MPa as the FCB replacement level increased from 0.0% to 25%, followed by a slight decrease to 51.9 MPa at the FCB replacement level of 50%. A similar trend was observed at 28 days; the CS increased from 45.7 MPa to 58.5 MPa as the FCB replacement level increased from 0.0% to 25%, while at the 50% replacement level, the strength decreased to 54.3 MPa.
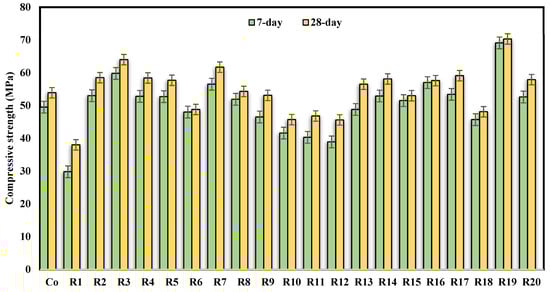
Figure 8.
Compressive strength of GPC mixes.
It was obvious that aggregates with a reactive surface and an inert core, such as FCB, improve the geopolymer matrix by forming a stronger connection with the reactive surface. The results illustrate the possibility of achieving HSGC mixtures by using low levels of CBP and FA and high ratios of up to 40% FCB as a replacement for sand. Correspondingly, the peak 28-day compressive strength (70.3 MPa) was obtained by R19 samples with 5.07% FA, 5.07% CBP, and 39.86% FCB, while the lowest strength was obtained by mixture R1 with 5.07% FA, 19.93% CBP, and 10.14% FCB. The main difference between R19 and R1 was the replacement level of CBP and FCB. From Figure 8, it is observed that mixture R19 exhibited approximately 39.6 and 30.4% more compressive strength than the control specimen at 7 and 28 days, respectively. It is noticed that among all the GPC mixtures, mixes R3, R7, and R19 achieved CSs higher than 60 MPa at 28 days, so it can be classified as HSGC. This enhancement may be attributable to the material’s granular structure and superior hydraulic response capabilities, which caused the calcium to react more quickly and produce gels of calcium silicate hydrate (C-S-H) and aluminosilicate hydrate (C-A-S-H). In contrast, there was only a modest increase in strength between days 7 and 28, indicating that most of the reaction occurred in the first seven days. This is due to the rapid formation of C-S-H and C-A-S-H gels through the reaction of high-molarity SH with slag [50,51,52].
Estimating the effect of the interactions between inputs (variables) and outputs (responses) is crucial. Figure 9a illustrates that the CS at 7 days of age tends to decrease because of the increased replacement of CBP with GGBFS. This is because adding CBP reduces the quantity of hydration products and weakens the integrity of cementitious materials. This negative effect of increasing CBP content is significantly reduced when the FA content is increased in the mixture. The results indicated that the use of CBP by minimal content could significantly contribute to the hydration kinetics and the development of unreacted GGBFS and FA particles. In contrast, the results illustrated that the 7 day CS is greatly affected by the interaction between FA and FCB, and it is found that the maximum CS at 7 days of age is achieved at the higher levels of FCB with the lower levels of FA, as shown in Figure 9b. Figure 9c displays the possibilities to achieve 7-day CS > 55 MPa through the combination of CBP and FCB at replacement levels of GGBFS with CBP less than 10% and sand with FCB ranging from 4% to 46% [38].
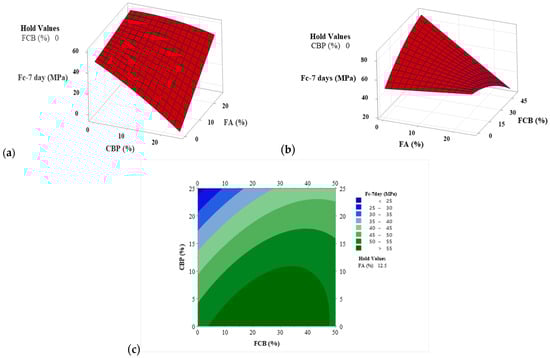
Figure 9.
Surface plot of 7-day compressive strength vs. (a) CBP and FA, and (b) FCB and FA, and (c) contour plot of 7-day compressive strength vs. CBP and FCB.
Figure 10 shows the effect of FA concentration on effectiveness as well as the impact of combining CBP and FCB on the CS. Figure 10a shows that HSGC can be achieved using FCB as a replacement for sand by up to 50% with 100% GGBFS. It is also possible to achieve a CS approximately equal to the CS of the control mix (53.9 MPa) at different proportions of CBP with FCB and 25% FA, as shown in Figure 10b,c. The response surface optimizer tool also gives the ability to control the ratios of the variables to produce concrete with the desired properties [22]. For example, to achieve a 28-day CS equal to that of the control mixture with the highest possible slump using CBP and FA as a replacement of GGBFS and FCB as a substitution of sand, the mixture ratios are composed of 25% FA, 10% CBP, and 30% FCB, as shown in Figure 11.
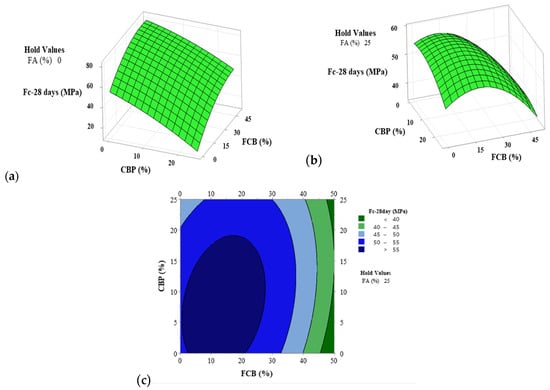
Figure 10.
Surface plot of 7-day compressive strength vs. (a) CBP and FA, and (b) FCB and FA, and (c) contour plot of 28-day compressive strength vs. CBP and FCB.
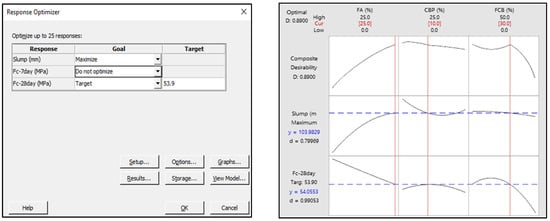
Figure 11.
Using response optimizer tool to achieve desirable responses.
The splitting tensile strength (STS) results of GPC mixtures are illustrated in Table 4. The STS for mixes containing CBP, FA, and FCB ranged from 4.1 Mpa to 8.1 Mpa, compared to 6.1 Mpa for Co. This indicates the significant impact of parameters on tensile strength. Mix R19, which is composed of 89.86% GGBFS, 5.07% FA, 5.07% CBP, and 39.86% FCB, achieved the highest STS, while mixture R1, which is composed of 75% GGBFS, 5.07% FA, 19.93% CBP, and 10.14% FCB, achieved the lowest STS. The results presented a decreasing trend in STS with the increase in GGBFS replacement level by FA. This effect can be observed by comparing mixes R7, R2, and R13, which contain 0.0%, 12.5%, and 25% FA, with an STS equal to 6.95, 6.55, and 6.05 Mpa, respectively. A similar trend was observed upon increasing the CBP replacement ratio from 0.0% to 12.5% and 25% for mixes R3, R2, and R11; the STS decreased from 7.6 Mpa to 6.55 and 5.15 Mpa, respectively [22,26,50].
The significant correlation (R2 = 0.94) between the CS and STS of GPC mixes is shown in Figure 12. The ratio of STS/CS for all concrete mixtures ranged from 9.9% to 11.5%. The contour plots shown in Figure 13a illustrate the high significant impact of each factor and the interaction between them on the STS results. At a constant value of FCB (25%), high results of STS were achieved at lower values of FA and CBP. An STS of 7–8 MPa can be obtained through the combination of up to 25% FCB and 5% CBP at a 12.5% hold value of FA, and this strength value can also be achieved through the combination of approximately up to 40% FCB and 5% CBP at a 12.5% hold value of CBP. The area with the desired slump value of 70–120 mm, 28-day CS of 60–70 MPa, and 28-day STS of 5–8 MPa when CBP and FA were combined with different replacement levels at a 25% constant value of FCB is highlighted by the overlaid contour plot illustrated in Figure 13b.
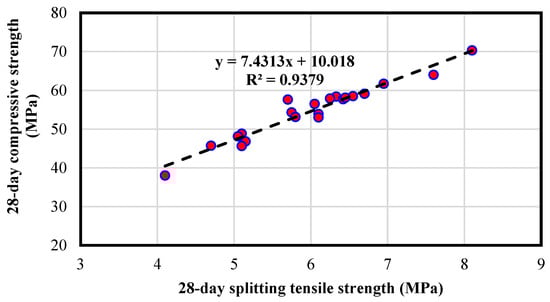
Figure 12.
Splitting tensile strength vs. compressive strength of GPC mixtures at 28 days.
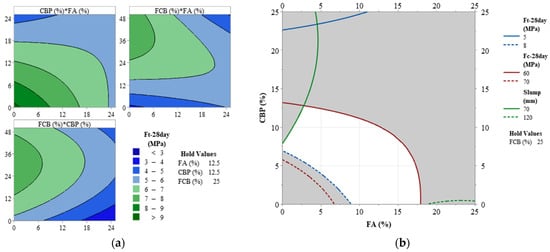
Figure 13.
(a) Contour plots of 28-day splitting tensile strength vs. CBP, FCB, and FA. (b) The overlaid contour of slump: 28-day CS and 28-day STS vs. CBP and FA.
The flexural strength results of GPC mixtures are shown in Table 4. The flexural strength of mixes containing CBP, FA, and FCB ranged from 5.2 MPa to 9.95 MPa, compared to 8.5 MPa for the control mix. The peak flexure strength (9.95 MPa) was obtained by mix R19 with 89.86% GGBFS, 5.07% FA, 5.07% CBP, 39.86% FCB, and 60.14% sand. The results presented a decreasing trend in flexural strength with the increase in CBP replacement level. This effect can be observed by comparing mixes R3, R2, and R11, which contain 0.0%, 12.5%, and 25% CBP content, having flexural strengths of 9.4, 8.85, and 6.07 MPa, respectively [22,26]. The contour plots shown in Figure 14a illustrate the highly significant effect of each parameter and the interaction between them on flexural strength results. It is observed that a flexure strength up to 11 MPa can be obtained through the combination of the studied parameters (FA, CBP, and FCB) at different levels. The area with the desired slump value of 70–120 mm, a 28-day compressive strength of 60–70 MPa, a 28-day splitting tensile strength of 5–8 MPa, and a 28-day flexural strength of 9–11 MPa through the combination of CBP and FA at different replacement levels at a 25% constant value of FCB is highlighted by the selected overlaid contour plot in Figure 14b.
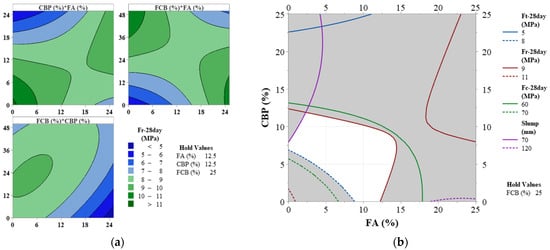
Figure 14.
(a) Contour plots of 28-day flexural strength vs. CBP, FCB, and FA. (b) The overlaid contour of slump: 28-day Fc, 28-day Ft, and 28-day Fr vs. CBP and FA.
3.2. Statistical Models
The significance of each parameter as well as the correlation between the output responses and input variables can be demonstrated through statistical analysis. To estimate and validate the model, p-values were used. For 95% confidence intervals, p-values < 0.05 suggest that the model terms are significant, while values > 0.05 are verified as insignificant [35]. The insignificant terms were removed based on the analysis of variance (ANOVA) to increase the efficacy of the proposed model. Based on the results, the constructed models were statistically significant. The Pareto charts generated from the response surface analysis are given in Figure 15a–d and indicate the standardized influence of each variable on slump, 28-day fc, 28-day ft, and 28-day fr. Table 5 shows the significant terms of models with p-values < 0.05 and R2, R2 (adj.), and R2 (pred.) values. The model formula was developed in Equations (2)−(5) as follows:
Slump (mm) = 113.18 + 2.252 FA − 3.507 CBP − 1.090 FCB − 0.0545 FA*FA + 0.0729 CBP*CBP + 0.02848 FA*FCB +
0.02848 CBP*FCB (%)
0.02848 CBP*FCB (%)
Fc-28 day (MPa) = 54.031 − 1.151 CBP + 1.2388 FCB − 0.02117 CBP*CBP − 0.01433 FCB*FCB + 0.05497 FA*CBP −
0.03590 FA*FCB + 0.00819 CBP*FCB
0.03590 FA*FCB + 0.00819 CBP*FCB
Ft-28 day (MPa) = 6.142 − 0.0376 FA − 0.1875 CBP + 0.1775 FCB − 0.002047 FCB*FCB + 0.007084 FA*CBP − 0.003928
FA*FCB
FA*FCB
Fr-28 day (MPa) = 8.476 − 0.1973 CBP + 0.1394 FCB + 0.002034 FA*FA − 0.00584 CBP*CBP − 0.001419 FCB*FCB +
0.01276 FA*CBP (%) − 0.007588 FA*FCB + 0.003757 CBP*FCB
0.01276 FA*CBP (%) − 0.007588 FA*FCB + 0.003757 CBP*FCB
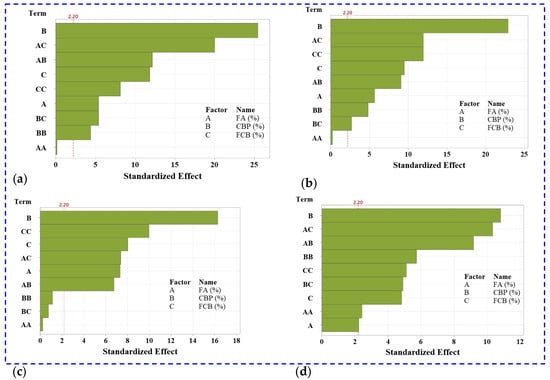
Figure 15.
Pareto chart of standardized effect of input factors on (a) slump, (b) 28-day CS, (c) 28-day STS, and (d) 28-day flexural strength.
Table 5.
Analysis of variance for all responses.
3.3. Properties of Affordable HSGC
Seven specimens are marked in Table 4 that were generated with the best proportions and underwent testing to determine their physical and durability, as shown in Figure 16. From the results shown in Figure 16a, the sample density ranges from 2234 kg/m3 to 2198 kg/m3. The reduction in density is associated with the lower specific gravity of brick waste and FA than GGBFS. The specimen’s water absorption ranges from 3.86% to 7.30% after being soaked in water at room temperature for 24 h (Figure 16b), which is less than 13% and satisfies BS-1881-122:2011. The effects of using C&D waste as a precursor and fine aggregate on the porosity of the HSGC by Archimedes law are presented in Figure 16c. It can be observed that the porosity of prepared HSGC is affected by the addition of CBP, and the values match with the mechanical performance. Mixture R19 has a lower open porosity (6.69%) than the control mixture. It is noted that mixture R1 has high pores (9.78%), which is related to its low density (2198 kg/m3), low strength (38.0 MPa), and high-water absorption (7.30%). These results agree with what was observed by Abdellatief et al. [34].
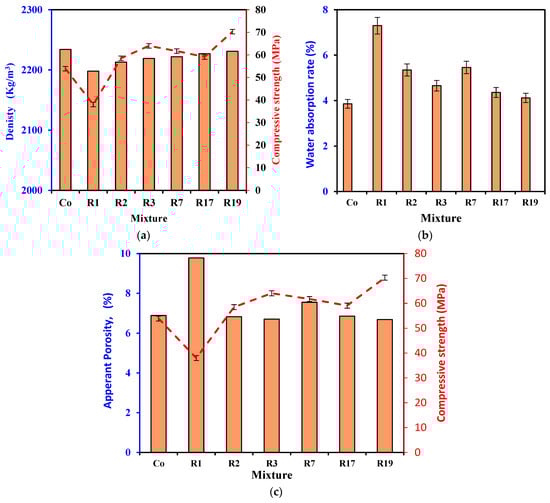
Figure 16.
Physical and durability characteristics of HSGC with C&D waste. (a) Dry density; (b) water absorption; (c) porosity.
3.4. Carbonation
Figure 17 illustrates the change in cross-section color after exposure to CO2 attack and after being sprayed using phenol-phthalein solution at 14 and 28 days. All the HSGC specimens displayed a clear pink color, and with the increase in carbonation time, the pink zone diminished toward the center of the specimen cross-section due to the penetration of CO2 from the outer surface of the specimens. Table 6 shows the carbonization depth (C-depth) of HSGC with various carbonation times. The C-depth of HSGC was recorded with increasing carbonation times. The C-depth of the optimum mixture, which had high strength (R19), was recorded as 7.0 mm compared to that of R1 (11 mm) at 28 days. This represents a drop of 36.36% when using the optimum C&D waste and FA content, resulting in an improvement in the strength of HSGC, which is also advantageous for fending off CO2 and water intrusion. It was also found that the C-depth of the low-strength mixture (R1) with a high volume of C&D waste was higher than that of the control mix, demonstrating that the carbonation depth is associated with the strength grade of concrete. This is because the high volume of large C&D wastes increases concrete system porosity, which facilitates CO2 penetration as discussed above and agrees with previous studies [38].
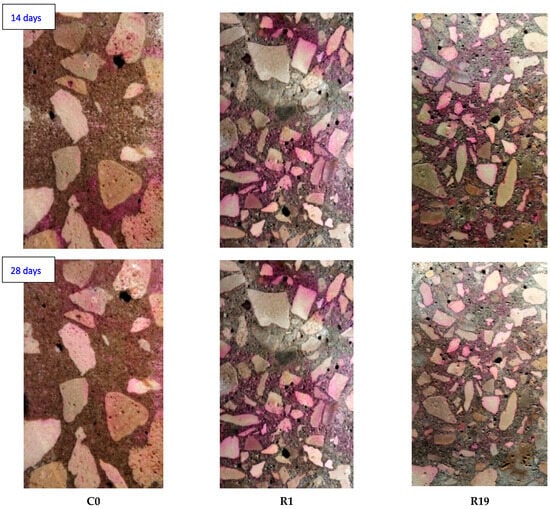
Figure 17.
Carbonation specimens of HSGC containing C&D waste and FA after spraying the phenol-phthalein solution.
Table 6.
Carbonation depth of HSGC containing C&D waste and FA at 14 and 28 days.
3.5. Freeze–Thaw Test
Figure 18 shows the mass loss results after 15, 25, and 50 cycles of freeze–thaw. Lu et al. [49] reported that mass losses are the key metrics to assess the freezing and thawing resistance of concrete. There are no obvious cracks or flaking in the tested specimens; however, only minor spalling was reported on the local surface of specimens. The R1 mixture’s surface showed substantial pitting because of the freeze–thawing process. The R1 mixture had the lowest weight after exposure, which decreased by about 3.83%. The slight exfoliation of the surface of HSGC samples is attributed to the weight loss that occurs during freeze–thaw cycles. After 50 freeze–thaw cycles, the HSGC specimens exhibited good freeze–thaw resistance due to the addition of optimal C&D waste and FA materials. As shown in Figure 18, the R19 mixture lost about 1.13% of its weight after 50 cycles, which is lower than that of the control mix. In contrast, R3 and R7 mixtures lost about 1.81% and 1.95%, respectively, which are both higher than that of the control mixture (1.26%). These results agree well with the previous relevant studies [49].
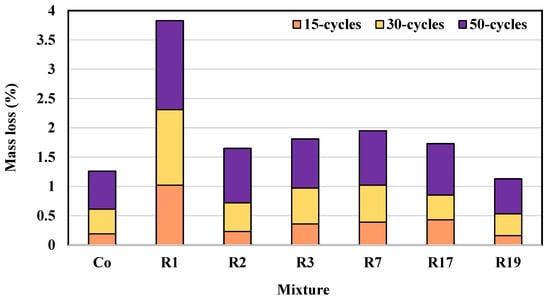
Figure 18.
Weight loss of HSGC specimens after cycles of freeze–thaw.
3.6. Microstructural Analysis
SEM analysis was conducted to understand and identify the effect of C&D waste (CBP and FCB) and FA on the microstructure of HSGC. SEM images were used to evaluate the microstructure of the control mix (Co) as well as the mixes that had the highest mechanical properties (R3, R7, and R19), in addition to the mix that had the lowest mechanical properties (R1). It was observed that the type and concentration of replacement factors affected the GPC microstructure. The microstructure of HSGC mixtures can be influenced by pore structure, hydration product morphology, and interfacial transition zone (ITZ) microstructure [50,51,52]. Figure 19a–e show the SEM images of HSGC samples. The SEM micrograph of the control mix (Co) revealed significant voids, more unreacted GGBFS, and a less compact structure with more cracks and weak ITZ between the binder and aggregate, as shown in Figure 19a. SEM analysis of the R19 mixture with 5.07% FA, 5.07% CBP, and 39.86% FCB revealed the formation of an aluminosilicate amorphous phase in a three-dimensional network, and a more refined microstructure with fewer cracks and pore spaces than GPC with the control mix, as shown in Figure 19b. The inclusion of polymerization products of calcium-aluminosilicate-hydrate gel (C-A-S-H) and sodium-aluminosilicate-hydrate (N-A-S-H) resulted in a fully compact and cohesive geopolymer matrix, which explains why the mechanical performance improved [50,51,52]. In addition, fewer cracks can be detected in the SEM micrograph for R3 and R7 mixtures (Figure 19c,d) in contrast to the control mixture due to the extra hydration products that closed the pores, which enhanced the strength and microstructure properties. Furthermore, aggregates having a reactive surface and an inert core, such as FCB, improved the geopolymer matrix by forming a stronger link with their reactive surface. R1 mixture specimens containing 5.07% FA, 19.93% CBP, and 10.14% FCB appear less compact and dense, with unreacted particles and interfacial fissures than control mix micrographs (Figure 19e). The high replacement level of CBP with slag resulted in a gel formation deficiency, and a part of the binders remained unreacted, which sequentially induced lower mechanical properties and caused a part of the aluminosilicate sources to be wasted. These weaknesses indicate an inadequate hydration process and brittleness of the microstructure when compared to the control mix, as well as R3, R7, and R19 mixes [52].
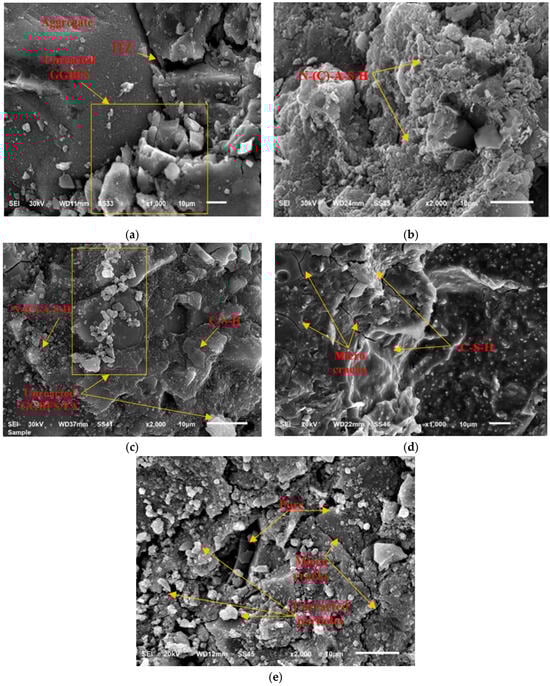
Figure 19.
SEM images of mixes: (a) Co, (b) R19, (c) R3, (d) R7, and (e) R1.
4. Conclusions
This study investigates the effect of clay brick powder (CBP) and fine clay brick (FCB) derived from C&D waste as a partial substitution of binder material and fine aggregate, respectively, on the fresh, mechanical, and microstructure properties of HSGC. Based on the test results, the following conclusions can be drawn:
- The workability of HSGC mixtures was negatively influenced by the utilization of C&D waste, and the incorporation of FA was an essential parameter to eliminate this negative effect of CBP and FCB on concrete workability.
- With low amounts of CBP and FA as a replacement for GGBFS and high amounts of FCB up to 40% as a replacement for sand, HSGC with high-durability properties could be manufactured.
- The addition of CBP by a minimal percentage up to 5% could significantly contribute to the hydration kinetics and the development of unreacted GGBFS and FA particles.
- The HSGC mixture composed of 487.5 kg/m3 slag, 27 kg/m3 FA, 30.7 kg/m3 CBP, 345 kg/m3 sand, 170 kg/m3 FCB, 955 kg/m3 dolomite, 208 kg/m3 SS, 32.5 kg/m3 SH, 50.7 kg/m3 water, and 13 kg/m3 superplasticizer achieved 70.3 MPa of compressive strength, 8.1 MPa of tensile strength, and 9.95 MPa of flexural strength at 28 days, with increased of 30.4%, 32.8%, and 17.05%, respectively, compared to those of the control mix.
- The resistance of HSGC to carbonation and freezing–thawing cycles gradually improved as the strength grade increased. On the other hand, the apparent porosity gradually decreased as the strength grade rose.
- The high replacement level of CBP with GGBFS resulted in gel formation deficiency, and a part of the binders that remained unreacted resulted in a less compact and denser matrix and lower mechanical performance than the control mixture. A fully compact and cohesive geopolymer matrix was obtained by using a minimal ratio of CBP and FA and a maximum ratio of FCB.
- The current experimental and optimization study helped produce high-strength concrete using construction and demolition waste, which indicates the possibility of using this high-strength eco-friendly concrete in practical applications. Therefore, it is recommended in the future to study the performance of the optimized mixture in the reinforced beam and its structural performance.
Author Contributions
Conceptualization, W.E.E. and M.A.; data curation, A.M.T., O.Y. and M.A.K.; formal analysis, W.E.E. and M.A.; funding acquisition, O.Y. and M.A.K.; investigation, W.E.E., M.A. and M.A.K.; methodology, W.E.E. and M.A.; project administration, A.M.T., O.Y. and M.A.K.; resources, A.M.T. and O.Y.; software, M.A.; supervision, A.M.T.; validation, W.E.E.; visualization, O.Y.; writing—original draft, W.E.E., A.M.T., and M.A.K.; writing—review and editing, A.M.T. and O.Y. All authors have read and agreed to the published version of the manuscript.
Funding
This research received no external funding.
Institutional Review Board Statement
Not applicable.
Informed Consent Statement
Not applicable.
Data Availability Statement
Data is contained within the article.
Conflicts of Interest
The authors declare no conflict of interest.
Nomenclature
| C&D waste | construction and demolition (C&D) waste |
| GGBFS | ground granulated blast-furnace slag |
| CBP | clay brick powder |
| FA | fly ash |
| FCB | fine clay brick |
| PC | Portland cement |
| HSGC | high-strength geopolymer concrete |
| GPC | geopolymer concrete |
| KS | potassium silicate |
| NH | sodium hydroxide |
| PH | potassium hydroxide |
| SS | sodium silicate |
References
- Kathirvel, P.; Sreekumaran, S. Sustainable development of ultra-high-performance concrete using geopolymer technology. J. Build. Eng. 2021, 39, 102267. [Google Scholar] [CrossRef]
- Arunachelam, N.L.; Maheswaran, J.; Chellapandian, M.; Murali, G.; Vatin, N.I. Development of high-strength geopolymer concrete incorporating high-volume copper slag and micro silica. Sustainability 2022, 14, 7601. [Google Scholar] [CrossRef]
- Youssf, O.; Elchalakani, M.; Hassanli, R.; Roychand, R.; Zhuge, Y.; Gravina, R.J.; Mills, J.E. Mechanical performance and durability of geopolymer lightweight rubber concrete. J. Build. Eng. 2022, 45, 103608. [Google Scholar] [CrossRef]
- Dener, M.; Karatas, M.; Mohabbi, M. Sulfate resistance of alkali-activated slag/Portland cement mortar produced with lightweight pumice aggregate. Constr. Build. Mater. 2021, 304, 124671. [Google Scholar] [CrossRef]
- Shahmansouri, A.A.; Yazdani, M.; Ghanbari, S.; Bengar, H.A.; Jafari, A.; Ghatte, H.F. Artificial neural network model to predict the compressive strength of eco-friendly geopolymer concrete incorporating silica fume and natural zeolite. J. Clean. Prod. 2021, 279, 123697. [Google Scholar] [CrossRef]
- Tanu, H.M.; Unnikrishnan, S. Review on Durability of Geopolymer Concrete Developed with Industrial and Agricultural Byproducts. Mater. Today Proc. 2023. [Google Scholar] [CrossRef]
- Balamurali, K.; Anand, N.; Johnson, A.U.; Samuvel Raj, R.; Praveen, B.; Kiran, T. Performance evaluation on engineering properties and sustainability analysis of high strength geopolymer concrete. J. Build. Eng. 2022, 60, 105147. [Google Scholar] [CrossRef]
- Chokkalingam, P.; El-Hassan, H.; El-Dieb, A.; El-Mir, A. Development and characterization of ceramic waste powder-slag blended geopolymer concrete designed using Taguchi method. Constr. Build. Mater. 2022, 349, 128744. [Google Scholar] [CrossRef]
- Youssf, O.; Mills, J.E.; Elchalakani, M.; Alanazi, F.; Yosri, A.M. Geopolymer concrete with lightweight fine aggregate: Material performance and structural application. Polymers 2022, 15, 171. [Google Scholar] [CrossRef]
- Mousavinejad, S.H.G.; Sammak, M. Strength and chloride ion penetration resistance of ultra-high-performance fiber reinforced geopolymer concrete. Structures 2021, 32, 1420–1427. [Google Scholar] [CrossRef]
- Zhao, J.; Wang, S.; Wang, Z.; Wang, K.; Fu, C. Bond performance between FRP bars and geopolymer concrete after elevated temperature exposure. Constr. Build. Mater. 2023, 384, 131476. [Google Scholar] [CrossRef]
- Farhan, N.A.; Sheikh, M.N.; Hadi, M.N.S. Investigation of engineering properties of normal and high strength fly ash based geopolymer and alkali-activated slag concrete compared to ordinary Portland cement concrete. Constr. Build. Mater. 2019, 196, 26–42. [Google Scholar] [CrossRef]
- Karimipour, A. Effect of untreated coal waste as fine and coarse aggregates replacement on the properties of steel and polypropylene fibres reinforced concrete. Mech. Mater. 2020, 150, 103592. [Google Scholar] [CrossRef]
- McLellan, B.C.; Williams, R.P.; Lay, J.; Van Riessen, A.; Corder, G.D. Costs and carbon emissions for geopolymer pastes in comparison to ordinary portland cement. J. Clean. Prod. 2011, 19, 1080–1090. [Google Scholar] [CrossRef]
- Xu, S.; Yuan, P.; Liu, J.; Pan, Z.; Liu, Z.; Su, Y.; Li, J.; Wu, C. Development and preliminary mix design of ultra-high-performance concrete based on geopolymer. Constr. Build. Mater. 2021, 308, 125110. [Google Scholar] [CrossRef]
- Sandanayake, M.; Gunasekara, C.; Law, D.; Zhang, G.; Setunge, S. Greenhouse gas emissions of different fly ash based geopolymer concretes in building construction. J. Clean. Prod. 2018, 204, 399–408. [Google Scholar] [CrossRef]
- Parhi, S.K.; Patro, S.K. Prediction of compressive strength of geopolymer concrete using a hybrid ensemble of grey wolf optimized machine learning estimators. J. Build. Eng. 2023, 71, 106521. [Google Scholar] [CrossRef]
- Alrshoudi, F.; Abbas, H.; Abadel, A.; Albidah, A.; Altheeb, A.; Al-Salloum, Y. Compression behavior and modeling of FRP-confined high strength geopolymer concrete. Constr. Build. Mater. 2021, 283, 122759. [Google Scholar] [CrossRef]
- Chowdhury, S.; Mohapatra, S.; Gaur, A.; Dwivedi, G.; Soni, A. Study of various properties of geopolymer concrete—A review. Mater. Today Proc. 2020, 46, 5687–5695. [Google Scholar] [CrossRef]
- Meng, B.; Xiong, Y.; Zhong, W.; Duan, S.; Li, H. Progressive collapse behaviour of composite substructure with large rectangular beam-web openings. Eng. Struct. 2023, 295, 116861. [Google Scholar] [CrossRef]
- Lingyu, T.; Dongpo, H.; Jianing, Z.; Hongguang, W. Durability of geopolymers and geopolymer concretes: A review. Rev. Adv. Mater. Sci. 2021, 60, 1–14. [Google Scholar] [CrossRef]
- Abdellatief, M.; Elrahman, M.A.; Abadel, A.A.; Wasim, M.; Tahwia, A. Ultra-high performance concrete versus ultra-high performance geopolymer concrete: Mechanical performance, microstructure, and ecological assessment. J. Build. Eng. 2023, 79, 107835. [Google Scholar] [CrossRef]
- Ganesh, A.C.; Muthukannan, M. Development of high performance sustainable optimized fiber reinforced geopolymer concrete and prediction of compressive strength. J. Clean. Prod. 2021, 282, 124543. [Google Scholar] [CrossRef]
- Deb, P.S.; Nath, P.; Sarker, P.K. The effects of ground granulated blast-furnace slag blending with fly ash and activator content on the workability and strength properties of geopolymer concrete cured at ambient temperature. Mater. Des. 2014, 62, 32–39. [Google Scholar] [CrossRef]
- Gopika, M.; Ganesan, N.; Indira, P.V.; Kumar, V.S.; Murali, G.; Vatin, N.I. Influence of steel fibers on the interfacial shear strength of ternary blend geopolymer concrete composite. Sustainability 2022, 14, 7724. [Google Scholar] [CrossRef]
- Amran, M.; Debbarma, S.; Ozbakkaloglu, T. Fly ash-based eco-friendly geopolymer concrete: A critical review of the long-term durability properties. Constr. Build. Mater. 2021, 270, 121857. [Google Scholar] [CrossRef]
- Wang, F.; Sun, X.; Tao, Z.; Pan, Z. Effect of silica fume on compressive strength of ultra-high-performance concrete made of calcium aluminate cement/fly ash based geopolymer. J. Build. Eng. 2022, 62, 105398. [Google Scholar] [CrossRef]
- Mahmoodi, O.; Siad, H.; Lachemi, M.; Dadsetan, S.; Şahmaran, M. Optimized application of ternary brick, ceramic and concrete wastes in sustainable high strength geopolymers. J. Clean. Prod. 2022, 338, 130650. [Google Scholar] [CrossRef]
- Reig, L.; Soriano, L.; Borrachero, M.V.; Monzó, J.; Payá, J. Influence of the activator concentration and calcium hydroxide addition on the properties of alkali-activated porcelain stoneware. Constr. Build. Mater. 2014, 63, 214–222. [Google Scholar] [CrossRef]
- Fořt, J.; Vejmelková, E.; Koňáková, D.; Alblová, N.; Čáchová, M.; Keppert, M.; Rovnaníková, P.; Černý, R. Application of waste brick powder in alkali activated aluminosilicates: Functional and environmental aspects. J. Clean. Prod. 2018, 194, 714–725. [Google Scholar] [CrossRef]
- Naenudon, S.; Wongsa, A.; Ekprasert, J.; Sata, V.; Chindaprasirt, P. Enhancing the properties of fly ash-based geopolymer concrete using recycled aggregate from waste ceramic electrical insulator. J. Build. Eng. 2023, 68, 106132. [Google Scholar] [CrossRef]
- Nasaeng, P.; Wongsa, A.; Cheerarot, R.; Sata, V.; Chindaprasirt, P. Strength enhancement of pumice-based geopolymer paste by incorporating recycled concrete and calcined oyster shell powders. Case Stud. Constr. Mater. 2022, 17, e01307. [Google Scholar] [CrossRef]
- Elemam, W.E.; Abdelraheem, A.H.; Mahdy, M.G.; Tahwia, A.M. Prediction and Optimization of Self-Consolidating Concrete Properties. ACI Mater. J. 2022, 119, 91–104. [Google Scholar] [CrossRef]
- Abdellatief, M.; Elemam, W.E.; Alanazi, H.; Tahwia, A.M. Production and optimization of sustainable cement brick incorporating clay brick wastes using response surface method. Ceram. Int. 2023, 49, 9395–9411. [Google Scholar] [CrossRef]
- Sultana, N.; Hossain, S.M.Z.; Alam, M.S.; Hashish, M.M.A.; Islam, M.S. An experimental investigation and modeling approach of response surface methodology coupled with crow search algorithm for optimizing the properties of jute fiber reinforced concrete. Constr. Build. Mater. 2020, 243, 118216. [Google Scholar] [CrossRef]
- Mäkelä, M. Experimental design and response surface methodology in energy applications: A tutorial review. Energy Convers. Manag. 2017, 151, 630–640. [Google Scholar] [CrossRef]
- Alyamac, K.E.; Ghafari, E.; Ince, R. Development of eco-efficient self-compacting concrete with waste marble powder using the response surface method. J. Clean. Prod. 2017, 144, 192–202. [Google Scholar] [CrossRef]
- Tahwia, A.M.; Hamido, M.A.; Elemam, W.E. Using mixture design method for developing and optimizing eco-friendly ultra-high performance concrete characteristics. Case Stud. Constr. Mater. 2023, 18, e01807. [Google Scholar] [CrossRef]
- BS EN 12620; Aggregate for Concrete. BSI: London, UK, 2002.
- ASTM C494; Standard Specification for Chemical Admixtures for Concrete. ASTM International: West Conshohocken, PA, USA, 2005.
- ASTM C143; Slump of Hydraulic Cement Concrete. ASTM International: West Conshohocken, PA, USA, 2004.
- BS EN 12390-3; Testing Hardened Concrete. Part 3: Compressive Strength of Test Specimens. BSI: London, UK, 2009.
- ASTM C496-11; Standard Test Method for Splitting Tensile Strength of Cylindrical Concrete Specimens. ASTM International: West Conshohocken, PA, USA, 2011.
- ASTM C78-16; Standard Test Method for Flexural Strength of Concrete (Using Simple Beam with Third-Point Loading). ASTM International: West Conshohocken, PA, USA, 2016.
- ASTM C20; Test Methods for Apparent Porosity, Water Absorption, Apparent Specific Gravity, and Bulk Density of Burned Refractory Brick and Shapes by Boiling Water. ASTM International: West Conshohocken, PA, USA, 2010.
- BS EN 12390-12:2020; Testing Hardened Concrete, Part 12: Determination of the Carbonation Resistance of Concrete—Accelerated Carbonation Method. BSI Standards Limited: London, UK, 2020.
- Beltrame, N.A.; Dias, R.L.; Witzke, F.B.; Medeiros-Junior, R.A. Effect of carbonation curing on the physical, mechanical, and microstructural properties of metakaolin-based geopolymer concrete. Constr. Build. Mater. 2023, 406, 133403. [Google Scholar] [CrossRef]
- ASTM C666/C666M-15; Standard Test Method for Resistance of Concrete to Rapid Freezing and Thawing. ASTM International: West Conshohocken, PA, USA, 2015.
- Liang, G.; Yao, W.; Wei, Y. A green ultra-high performance geopolymer concrete containing recycled fine aggregate: Mechanical properties, freeze-thaw resistance and microstructure. Sci. Total Environ. 2023, 895, 165090. [Google Scholar] [CrossRef]
- He, Z.; Shen, A.; Wu, H.; Wang, W.; Wang, L.; Yao, C.; Wu, J. Research progress on recycled clay brick waste as an alternative to cement for sustainable construction materials. Constr. Build. Mater. 2021, 274, 122113. [Google Scholar] [CrossRef]
- Dener, M. Effect of Ferrochrome Slag Substitution on High Temperature Resistance and Setting Time of Alkali-Activated Slag Mortars. Iran. J. Sci. Technol. Trans. Civ. Eng. 2023, 47, 2833–2843. [Google Scholar] [CrossRef]
- Dener, M. Mechanical and durability properties of alkali-activated slag/waste basalt powder mixtures. Proc. Inst. Mech. Eng. Part L J. Mater. Des. Appl. 2023, 237, 2250–2265. [Google Scholar] [CrossRef]
Disclaimer/Publisher’s Note: The statements, opinions and data contained in all publications are solely those of the individual author(s) and contributor(s) and not of MDPI and/or the editor(s). MDPI and/or the editor(s) disclaim responsibility for any injury to people or property resulting from any ideas, methods, instructions or products referred to in the content. |
© 2023 by the authors. Licensee MDPI, Basel, Switzerland. This article is an open access article distributed under the terms and conditions of the Creative Commons Attribution (CC BY) license (https://creativecommons.org/licenses/by/4.0/).