Article

The Effect of Information Provision and Color Coding in Product Labeling on the Preference for Meat Substitutes

1
Faculty of Economics and Business, KU Leuven, Naamsestraat 69, 3000 Leuven, Belgium
2
Faculty of Economics and Business, KU Leuven, Warmoesberg 26, 1000 Brussels, Belgium
*
Author to whom correspondence should be addressed.
Sustainability 2023, 15(22), 15688; https://doi.org/10.3390/su152215688
Submission received: 21 August 2023 / Revised: 30 October 2023 / Accepted: 30 October 2023 / Published: 7 November 2023
(This article belongs to the Collection Food Choice and Consumer Preferences)

Abstract

:
For health, environmental, and animal welfare reasons, an increase in the consumption of meat in our diet is of great concern in today’s society. Meat substitutes have been advocated for a long time as a solution to these problems and are evolving continuously with technological advancements. Despite these efforts, it is remarkable that meat alternatives only account for a small portion of the global meat market. As a result, we examined the factors that affect Flemish consumers’ preferences for meat substitutes in Belgium using a discrete choice experiment. We also examined consumers’ preferences after providing additional information, as well as the impact of color-coding certain attribute levels on their preferences. The study was conducted using a sample size of 162 participants selected via convenience sampling. The findings show that it is important to keep the sensory properties of meat substitutes similar to those of actual meat. The results also indicate that additional information regarding the environmental and health impact of meat consumption can help to promote meat substitutes. The traffic light color coding of the levels of saturated fat and ecofootprint attributes increases the preference for healthy and environmentally friendly alternatives. Finally, we observed that individual-level variations in the utility attributed to meat substitutes are explained significantly by age, gender, education, current diet group, and attitudinal factors. Overall, we can conclude that the promotion of meat substitutes can be achieved via a combined strategy that focuses on improving the taste, appearance, and nutritional profile of meat substitutes, as well as raising consumers’ awareness of the environmental and health impact of meat consumption.

1. Introduction

Throughout history, the consumption of meat has played a prominent role in the human diet. The intake of meat has played a crucial role in providing the vital nutrients and energy necessary for the sustenance and progress of the human species. Meat serves as a rich source of vital nutrients, including protein, iron, zinc, and vitamin B12 [1,2]. These essential nutrients are vital for the maintenance of general health and well-being. Meat eating has also been linked to cultural and social practices, as well as historic culinary traditions in several countries [3,4,5]. Throughout Western societies, meat consumption is socially embedded in individuals’ daily lives and is part of several types of social identities, e.g., religious, gender, communal, racial, national, and class identities [6]. Furthermore, the meat industry plays a significant role in bolstering the nation’s economy by generating job opportunities and giving assistance to other industries [7].
The worldwide per capita consumption of meat (excluding fish and seafood) has shown a notable rise, surging from 22.93 kg in 1961 to 42.26 kg in 2020 [8]. Within the European Union, this figure stood at around 49.2 kg in the year 1961, which subsequently increased to 78.2 kg by the year 2020. Specifically, in Belgium during the year 2020, the per capita meat consumption was recorded at 62 kg. This growth can be attributed to various factors, including rising incomes, urbanization, changing dietary preferences, and the increase in the availability and affordability of meat products. The United Nations Food and Agriculture Organization predicts that this tendency will persist over the next 10 to 20 years.
The rise in the production and consumption of meat and meat products are, however, being criticized for their effect on the environment, health, and animal welfare. The environmental impact of meat production arises from various emissions to the environment, as well as the significant consumption of land, food, and water in the production process [9,10,11]. A recent study on global greenhouse emissions reported that meat accounts for 57% of all greenhouse emissions from food production [12], and another study showed that livestock takes up nearly 80% of global agricultural land [13]. On the other hand, scientific evidence associates excessive meat consumption with increased risks of heart disease, stroke, type 2 diabetes, obesity, and colorectal cancer [14,15]. The production of meat has a negative influence on the well-being of animals. For instance, industrialized methods of raising and killing animals, intensive farming methods that force animals to live in small spaces, and transportation and handling methods that cause stress and injury, have all negative effects on animal welfare [16,17,18,19].
The rising recognition of the adverse consequences linked to meat production has led to increased interest in alternative protein sources. Meat substitutes that approximate the nutritional and sensory characteristics of meat, such as taste, texture, or aesthetic appearance, are among the emerging alternative protein sources. Meat substitutes include a diverse range of options, such as plant-based meats, cultivated or cultured meat (often called in vitro meat), mycoprotein, microalgae-based meat, and insect-based meat. When compared to conventional livestock production methods, meat alternatives are thought to be more environmentally friendly because of their lower greenhouse gas emissions and reduced use of farmland or water. However, like most foods, meat substitutes have their share of ethical challenges, which vary depending on the type of meat alternative. Milburn [20] provides a holistic view of the ethical challenges for the widespread adoption of meat alternatives. The author discusses the negative aspects of meat substitutes, such as being unnatural and highly processed, affirming the place of meat in human diets, market control in the hands of a small number of cultivated meat producers, the dependence of cultivated meat on the continued use of animals, and the alleged inaccurate assumption of insects being nonsentient, among other factors.
The interest in meat substitutes has grown rapidly over the past decade [21,22]. However, despite the rapid growth in interest, the market shares of meat substitutes still remain low. For instance, in 2022, the Good Food Institute estimated that plant-based meat substitutes represented only 2.5% of retail packaged meat dollar sales in the USA [23]. In order to further promote the consumption of meat substitutes in sufficient amounts, it is important to understand how specific meat substitute attributes, as well as consumers’ perceptions of the environmental and health impact of meat, can influence the acceptance of meat substitutes.
Extensive research has been conducted to investigate which product or consumer-related factors affect the acceptance of meat substitutes. Among the product-related factors, the sensory attractiveness of meat substitutes was reported to play a major role in the acceptance of these products. Several studies indicate that the lower sensory attractiveness of meat substitutes compared to meat is one of the key barriers to the consumption of meat substitutes [24,25,26,27]. Other product-related factors that influence consumers’ acceptance of meat substitutes include price [27,28] and product familiarity [24,29]. Researchers have also identified several consumer-related factors. Among other factors, these include consumers’ environmental and health perceptions of meat, animal welfare, the social and cultural value of meat, and food neophobia (the reluctance to eat new foods) [29,30,31].
Due to the greater importance of the sensory aspect, major efforts in research and development have led to improvements in the appearance, nutritional profile, and taste of meat substitutes. Through technological advancement and innovative processes, producers developed the second generation of meat substitutes that are more similar to authentic meat products [32,33]. Moreover, meat products blended with plant-based proteins are also introduced as another opportunity to promote meat substitutes [30,34]. Despite the efforts to improve the product aspect, the low share of meat substitutes in the total meat market necessitates alternative strategies for securing rapid growth in market share. One possibility includes increasing consumer awareness of the health and environmental benefits of meat substitutes, which can promote a transition in the direction of a healthier and more sustainable diet. In this regard, providing additional information, as well as the use of a color-coding approach in product labeling, can play a substantial role.
Several studies have shown that the information provided to the respondents can affect the outcome of a discrete choice experiment (DCE) [35,36,37]. The provision of information can lead to significant changes in either preference (willingness to pay (WTP)) or attribute non-attendance behavior. For instance, Rousseau and Vranken [35] illustrated that providing objective information about the environmental- and health-related impact of organically versus conventionally produced apples increases the WTP for apples with an organic label. On the other hand, Sandorf et al. [36] and Maaya et al. [37] showed a post-information increase in the attendance probabilities of attributes for which additional information was provided. The importance of providing information has also been demonstrated in the context of meat-related products. Martin et al. [38] used consumers’ sensory evaluation (tasting) of sausages and reported a positive effect of health and environment-related information on both the purchase intent and WTP for plant-based sausages. Grasso et al. [39] have also reported similar results after assessing the effect of providing information on the consumers’ sensory evaluation of burgers.
Recent studies have reported a lack of awareness of the environmental [40] and health effects [41] of meat consumption among meat consumers in Western societies, including Belgium. It is, thus, a desirable objective to further investigate the sensitivity of meat consumers for additional information so as to provide additional empirical evidence. In this study, we explore whether providing information about the environmental and health impact of meat consumption is useful to promote the consumption of meat substitutes using a DCE.
Another important aspect related to product information is the use of color coding in product labeling. Song et al. [42] conducted a systematic review and meta-analysis based on 156 studies between 1990 and 2021 to study the impact of color-coded and nutrition warning labeling schemes. They found that the traffic light color-coding approach to product labeling is associated with an increased probability of selecting more healthy products. In a stated preference study, Jonker et al. [43] showed that the use of color coding for attribute levels in a DCE significantly improves respondents’ attribute attendance. In the context of meat, color-labeled meat products have also been presented both in hypothetical and non-hypothetical choice experiments [44,45] to study consumers’ preferences and willingness to pay. These studies use the UK traffic light labeling system, which employs color coding to indicate the content of major nutrients such as fat, saturated fat, sugar, and salt in a food item [46]. As such, it is important to investigate whether color coding the levels of certain attributes can be used as a strategy to promote the consumption of meat substitutes.
This study aims to investigate whether color coding the levels of health and environment-related attributes and/or providing additional information regarding the health and environmental effects of meat consumption can help to promote the consumption of meat substitutes by Flemish consumers. Although there are studies that separately investigate the effect of using color coding in product labeling or providing additional information, the joint effect of these strategies has not been well explored. By jointly studying the effect of color coding and additional information, the result of this study could be useful to promote either or both of the strategies, as it provides comparative figures in a single study. We also explore the influence of other attributes of meat and meat substitutes, as well as the influence of consumers’ socio-demographic and environmental attitudes on the preference for meat substitutes.
The remainder of this paper is structured as follows: Section 2 describes the data and models, and Section 3 presents the results of the analysis. A discussion and our conclusions are presented in Section 4.

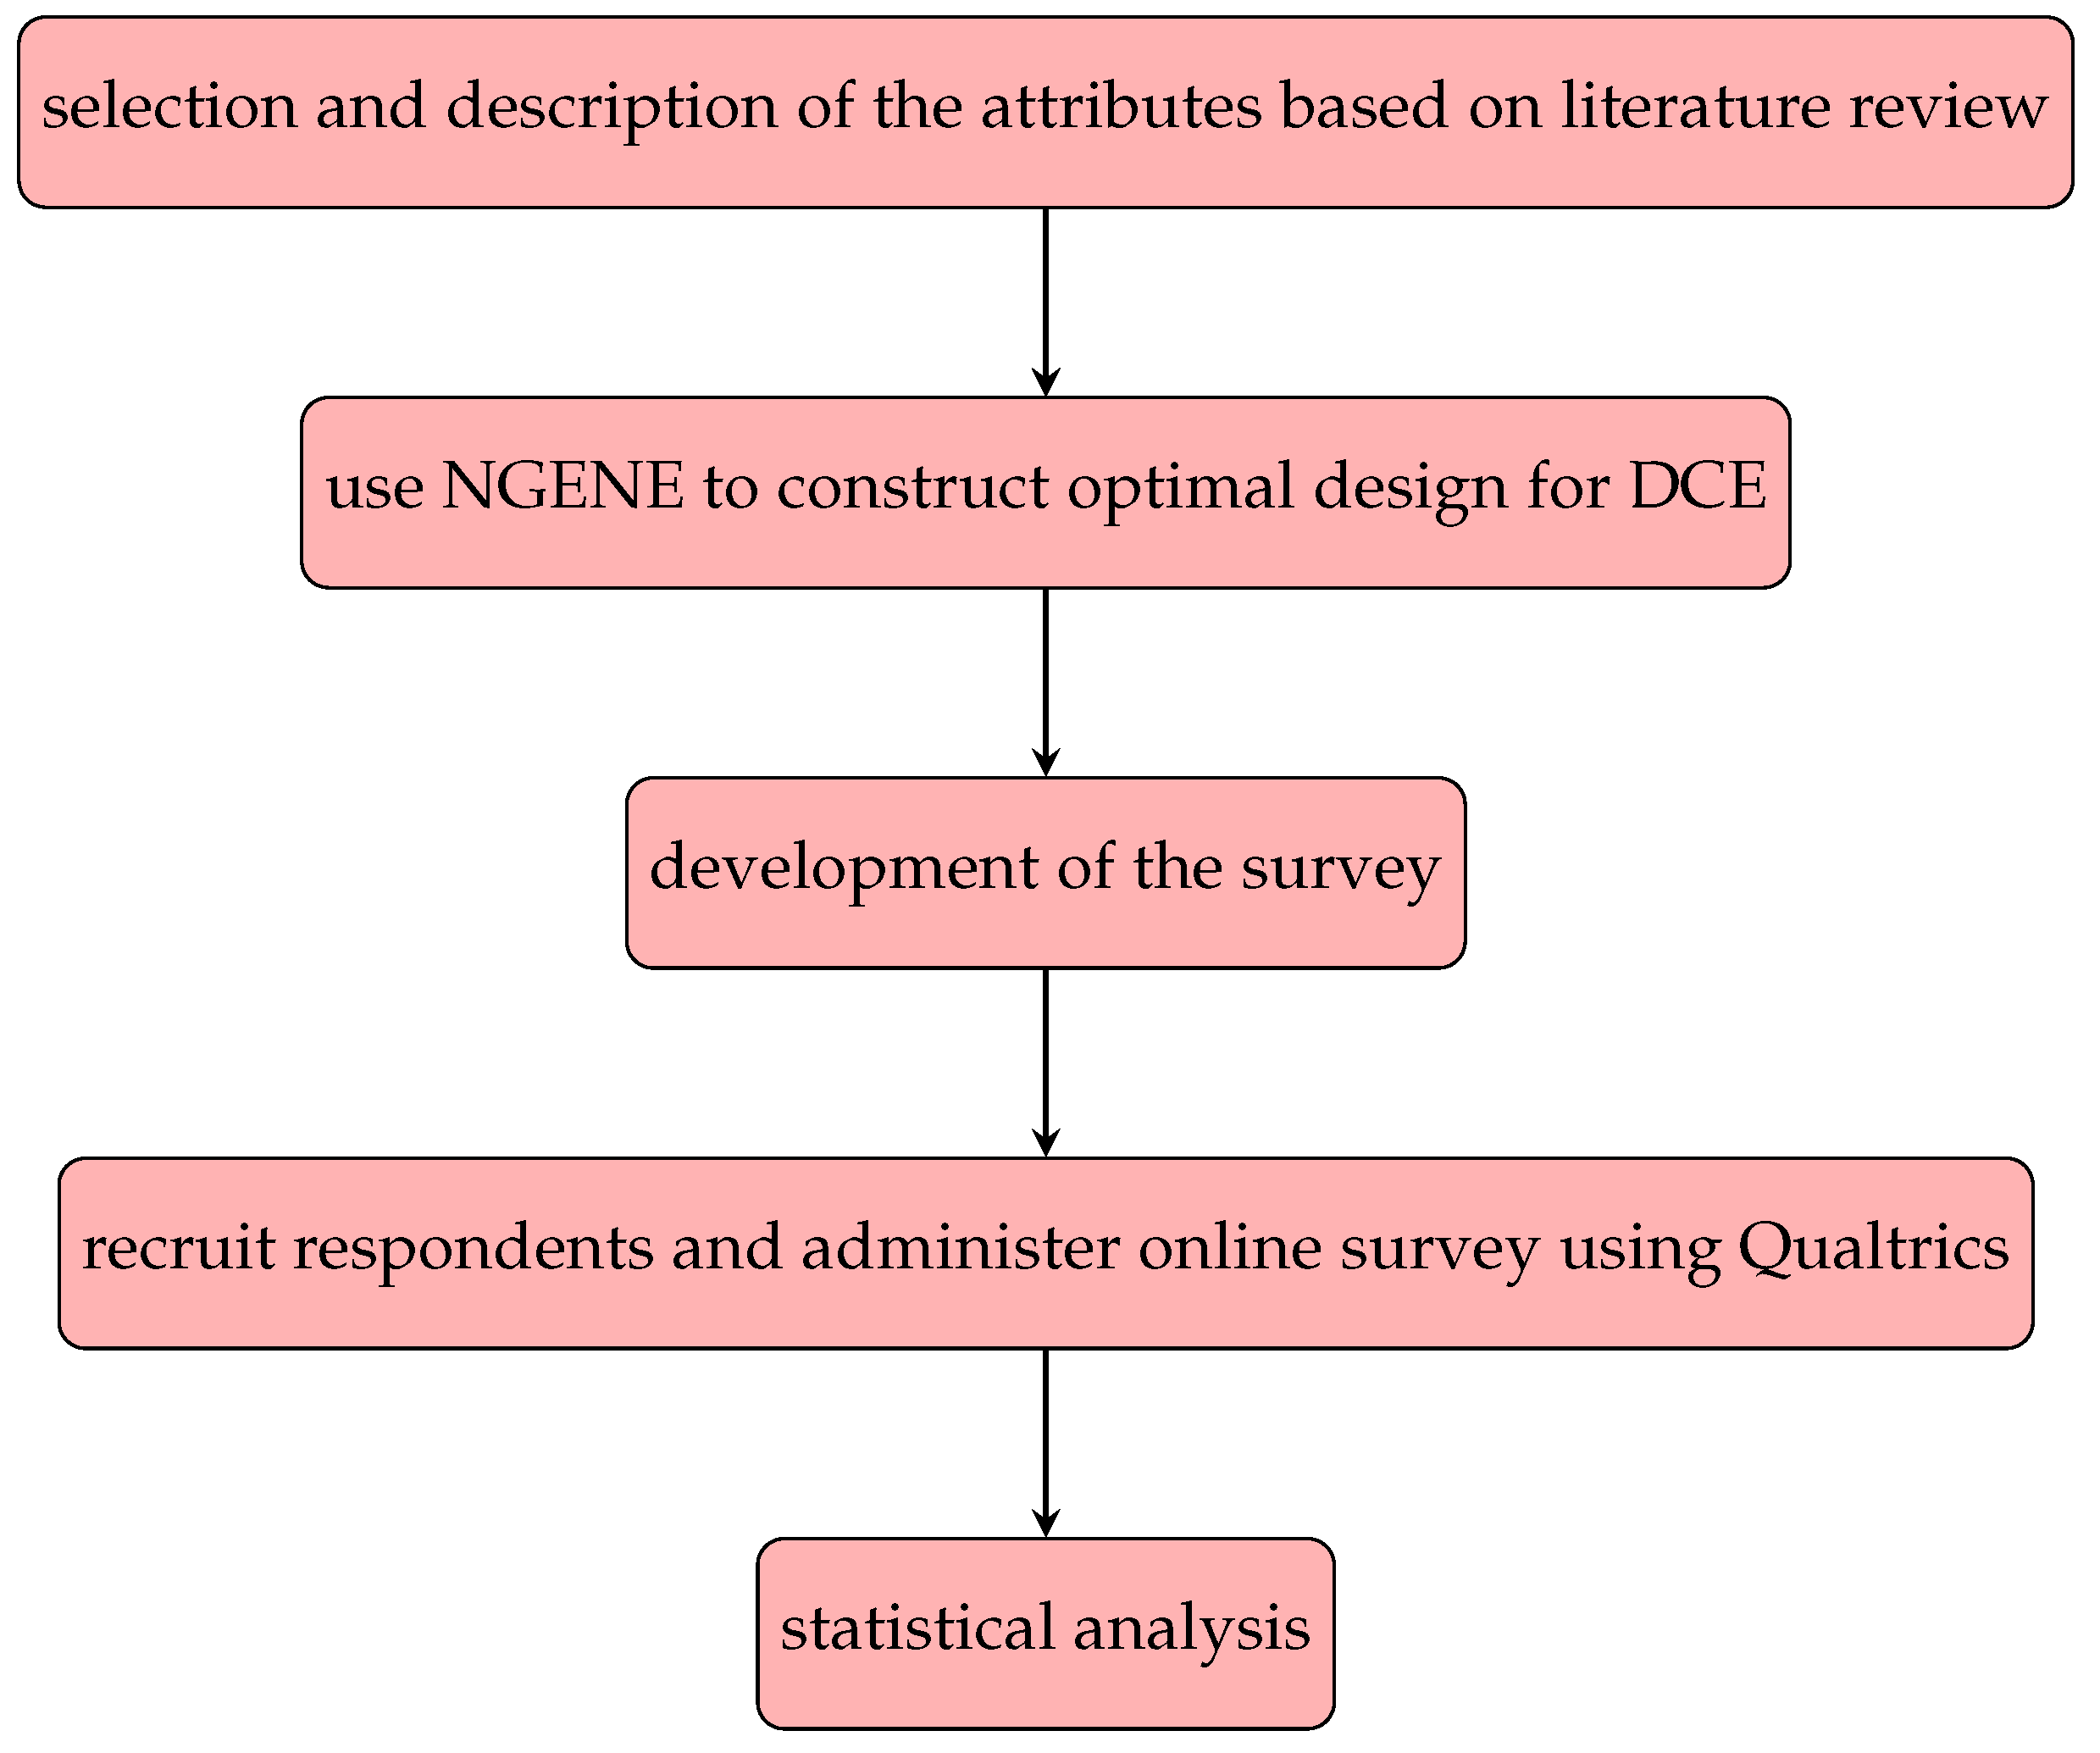
2. Materials and Methods

2.1. Choice Experiment

This study uses a DCE to address the objectives. The construction of the DCE started with a comprehensive literature review undertaken to identify the most crucial attributes that influence consumers’ perception of meat substitutes and sustainable food in general. The review identified six attributes that were used to construct hypothetical choice situations. The first set of attributes are the taste rating and the appearance rating of the meat substitutes. The attribute levels of taste and appearance indicate the similarity between meat substitutes and meat. The second set of attributes includes the percentage of saturated fat and the size of the ecological footprint, which are directly related to the health and environmental aspects of meat and meat substitute consumption. The levels of the saturated fat attribute are defined as percentages of saturated fat levels, which were set to 2%, 5%, and 8% for meat and 1%, 5%, and 15% for meat substitutes. The saturated fat percentages considered here are in line with the content of actual meat and meat substitutes. For instance, a study by Alessandrini et al. [47] using a cross-sectional survey of 207 plant-based meat substitutes and 226 meat products in the UK shows that the saturated fat content ranged from 1.1% to 11.6% for meat sausages and from 0.2% to 15.8% for plant-based meat sausages. Furthermore, the saturated fat percentage ranged from 1.1% to 11.0% for meat burgers and from 0.2% to 10.0% for plant-based meat burgers. The levels of the ecological footprint were expressed in the standard measurement unit: the carbon dioxide (CO2) equivalent in kg associated with the production of 1 kg of meat or meat substitute. The size for the levels of the ecological footprint attribute was established based on the average footprint estimates of meat and meat substitutes reported by the Federation of American Societies for Experimental Biology [48]. Finally, the attribute organic label, which indicates whether a European Union organic label [49] was used or not (with levels “yes” or “no”), was included, as well as the attribute price that was based on the observed approximate market prices at the time of this study (2022). The six attributes considered here have been shown in several studies to describe meat or food in general [24,28,45]. Table 1 presents a summary of the attributes and their levels that were used for the meat and meat substitutes.
This choice experiment consists of 12 choice situations. Each choice situation contains four alternatives: one meat product, two meat substitute products, and an opt-out. The levels of the alternatives are drawn from all possible combinations using the D-efficiency criterion for the conditional logit model using the software NGENE 1.2 [50]. Figure 1 provides a flow chart of the stages in constructing the choice experiment and conducting the survey.

2.2. Respondent Recruitment and Survey Structure

The participants of the survey were recruited from the Flemish region of Belgium by two KU Leuven students as part of their master’s thesis, who used social media platforms for recruitment [51,52]. The respondents were chosen using a convenience sampling method. In addition, the respondents were asked to further distribute the survey through their own personal communication, resulting in snowball sampling. The recruited participants received the online version of the survey prepared using the online survey tool Qualtrics.
The survey itself was structured in three parts. The first part briefly introduced the purpose of the survey, the estimated duration, and the content of the survey, followed by some general questions about the respondents’ current eating habits. The second part of the survey includes the 12 choice sets. This choice experiment had four versions, which differ based on the use of color coding and the provision of additional information. To assess the effect of color coding, a traffic light color-coding scheme was used for ecological footprint and saturated fat in versions two and four. The levels of the fat attribute are color-coded as 1%, 2% (both green); 5% (orange); 8%, 15% (both red). For the ecological footprint attribute we have color-coded as 2 kgCO2e, 3.5 kgCO2e, 4 kgCO2e (all green); 6 kgCO2e, 13 kgCO2e (both orange); 20 kgCO2e (red). This color coding holds across the alternatives. The thresholds of each color for the saturated fat attribute used here closely resemble the UK Food Standard Agency guidance, i.e., green < 1.5 g/100 g, orange 1.5 g/100 g to 5.0 g/100 g, and red > 5.0 g/100 g [46]. On the other hand, as indicated by Macdiarmid et al. [45], there are no standardized guidelines for color coding ecological footprint. As such, the three levels of meat/meat substitutes used in the choice experiment were assigned green, orange, and red, depending on their size. We assume that the color-coded attribute levels in the DCE have a similar impact as the color-coded labels in actual products.
Similarly, to assess the effect of information provision, additional information on the environmental and health effects of meat consumption was provided after the first block of six choice sets in versions three and four. The information described the impact of meat consumption both on the environment and on respondents’ health based on objective scientific studies. Neither color coding nor additional information was provided in the first version. Table 2 summarises the four versions of the choice tasks.
Appendix A provides an example of a choice set with color coding, and Appendix B presents the additional information given.
To get more insight into the environmental attitude and the nutritional attitude of the respondents, the final section of the survey consisted of the New Ecological Paradigm (NEP) scale [53] and the food choice questionnaire [54], along with a few socio-demographic questions. The NEP scale consists of 15 items (see Appendix C) that use a 7-point Likert scale (1 = completely disagree to 7 = completely agree) to elicit environmental concerns. The 15 items were framed in such a way that agreement in odd-numbered items and disagreement in even-numbered items indicate a pro-ecological view. We recoded the even-numbered items of the NEP scale such that the higher values indicate pro-environmentalism.
On the other hand, the food choice questionnaire (FCQ) consisted of 36 items that used a 7-point Likert scale to measure the motivations underlying food choice. The 36 items aim to measure nine distinct factors, which were labeled health, mood, convenience, sensory appeal, natural content, price, weight control, familiarity, and ethical concern, with higher values for the items in each factor indicating support for the factor [54]. The survey, however, included a selection of 22 items (see Appendix D), retaining at least one question per factor in order to reduce the length of the survey. These factors from the FCQ will only be used in the analysis if they have acceptable internal consistency (Cronbach’s alpha values of 0.65 or higher).

2.3. Statistical Modeling

The respondents’ preference for meat substitutes can be modeled using a random utility model that describes the individuals’ preferences by a utility function and postulates that an individual chooses the alternative with the highest utility. In this framework, we fit a mixed logit model, which is a highly flexible model that allows for heterogeneous preferences [55].
In a mixed logit model, the utility of an alternative j in a choice task s for respondent n reads
U n j s = β n x n j s + ϵ n j s ,
where x n j s is a vector with the levels of the attributes of alternative j in a choice set s, β n is the vector of taste coefficients of these attributes for person n, and ϵ n j s is an independent and identically Gumbel-distributed error term. When using the attributes in this study (see Table 1), the utility function reads
U n j s = β 1 n O p t o u t n j s + β 2 n M e a t s u b s t i t u t e n j s + β 3 n P r i c e n j s + β 4 n T a s t e n j s + β 5 n O r g a n i c n j s + β 6 n A p p e a r a n c e n j s + β 7 n E c o f o o t p r i n t n j s + β 8 n F a t n j s + β 9 n M e a t s u b s t i t u t e n j s P r i c e n j s + ϵ n j s ,
where the dummy variable O p t o u t is equal to 1 when the “No choice” option is chosen and 0 if one of the other alternatives is chosen, and the dummy variable M e a t s u b t i t u t e is equal to 1 if either of the two meat substitutes is chosen or is 0 otherwise. Except for the organic label attribute, which is a dummy variable, with 1 indicating the presence and 0 indicating the absence of the label, the other attributes are treated as continuous attributes and are assumed to have a linear effect on the utility. Finally, we added the interaction between M e a t s u b s t i t u t e and P r i c e to assess whether the effect of price on the preference of meat and meat substitutes differs.
In a mixed logit model, the respondent-specific β n parameters are assumed to follow a certain distribution for which the parameters are estimated. In this model, conditional on β n , the probability that an individual n will choose an alternative, j, in choice situation, s, is
P n j s = exp ( β n x n j s ) l = 1 J exp ( β n x n l s ) .
Let y n j s be a dummy that equals 1 if individual n chooses an alternative j in the choice set s, or that equals 0 otherwise, and let the vector y n contain all S choices of respondent n. The unconditional joint probability for all the choices of individual n assuming a multivariate Normal distribution with mean μ , and covariance matrix Σ for β n is
P ( y n | μ , Σ ) = β n s = 1 S j = 1 J exp ( β n x n j s ) l = 1 J exp ( β n x n l s ) y n j s f ( β n | μ , Σ ) d β n ,
and the likelihood is
P ( y | μ , Σ ) = n = 1 N P ( y n | μ , Σ ) ,
where y is a vector with the choices of all N individuals.
To investigate the effect of color coding and additional information on the preference parameters for the attributes “saturated fat” and “ecological footprint”, we included the interaction between a dummy variable, indicating the use of color coding ( C o l o r ) and a dummy, indicating the presence of additional information ( I n f o ), with the two attributes. We also included an interaction term of the alternative-specific constant for meat substitutes with I n f o and with C o l o r to investigate the impact of additional information and color coding on the preference for meat substitutes. The utility function in (2) further expands on this to include these interactions and is given as
U n j s = + β 10 n E c o f o o t p r i n t n j s I n f o n s + β 11 n E c o f o o t p r i n t n j s C o l o r n + β 12 n E c o f o o t p r i n t n j s I n f o n s C o l o r n + β 13 n F a t n j s I n f o n s + β 14 n F a t n j s C o l o r n + β 15 n F a t n j s I n f o n s C o l o r n + β 16 n M e a t s u b s t i t u t e n j s I n f o n s + β 17 n M e a t s u b s t i t u t e n j s C o l o r n + ϵ n j s ,
where is the deterministic part of the utility function given in (2). I n f o n s is equal to 1 for the last 6 choice sets for respondent n when additional information is provided or is 0 otherwise. C o l o r n is equal to 1 for all respondents who received survey versions 2 or 4 or is 0 otherwise.
A significant interaction term of an attribute with the color coding dummy means that the preference parameter of this attribute changes when color coding is used. On the other hand, a significant interaction term of an attribute with the additional information dummy means that the coefficient of the attribute shifts after the provision of information. A higher-order interaction of these two attributes with the dummies for both color coding and additional information is also considered to capture the joint effect of color coding and additional information on the preference parameters of these attributes. A significant higher-order interaction term implies that the effect of color coding on the preference coefficients changes if extra information is provided.
Finally, we investigated the effect of respondents’ characteristics and attitudinal factors on the preference for meat substitutes. The coefficient of the alternative specific constant for meat substitutes indicates the utility difference between meat substitutes and meat. By including the interactions between the M e a t s u b s t i t u t e dummy and the respondents’ characteristics, we investigated whether the individual-specific utility differences between meat substitutes and meat can be explained by these personal characteristics. In particular, we included an interaction term between the alternative-specific constant for meat substitutes and socio-demographic variables (age, education level, and gender), the current diet followed by the respondents (omnivore, flexitarian, vegetarian, and vegan), and the attitudinal factor measured using the NEP score and the factors of FCQ, as explained earlier. The expanded utility function in (6) can now be expressed as
U n j s = + [ β 18 n A g e n + β 19 n G e n d e r n + β 20 n E d u c ( h i g h e r ) n + β 21 n E d u c ( u n i v e r s i t y ) n + β 22 n D i e t ( f l e x i t a r i a n ) n + β 23 n D i e t ( v e g e t a r i a n ) n + β 24 n N E P n + β 25 n H e a l t h n + β 26 n C o n v e n i e n c e n + β 27 n E t h i c a l n + β 28 n W e i g h t _ c o n t r o l n ] M e a t s u b s t i t u t e n j s + ϵ n j s ,
where is the deterministic part of the utility function given in (6), and H e a l t h n , C o n v e n i e n c e n , E t h i c a l n , and W e i g h t _ c o n t r o l n denote the mean score of these selected factors from the FCQ for respondent n. Gender is dummy-coded with “female” as the reference category. E d u c a t i o n is a categorical variable with three categories: “secondary education”, “higher education”, and “university”. We included one respondent with “primary education” and two respondents with “Ph.D.” in the categories “secondary education” and “university”, respectively. The effect of education is represented by two dummies, with “secondary education” used as a reference category. Similarly, the categorical variable D i e t is represented by two dummies, “flexitarian” and “vegetarian”, with “omnivore” used as a reference category. We added the two respondents from the “vegan” category to the “vegetarian” category. Finally, NEP, the factors of the FCQ, and age are treated as continuous variables and are standardized to have a mean of 0 and a standard deviation of 1.

3. Results

3.1. Sample Description

A total of 333 respondents started to fill in the survey. Of this sample, 162 respondents who completed the survey and who did not choose the opt-out option more than four times in the 12 choice sets were used in the analysis. The socio-demographic composition and eating habits of these 162 respondents are given in Table 3. As can be seen from Table 3, about 66% of the respondents are women, and more than half of the respondents are aged below 26 years, with an average age of 33 years. Most of the respondents ( 80 % ) have an education level above secondary education, and half of the respondents are white-collar workers. About 65% reported their family net monthly income to be greater than EUR 2000, whereas 16.0% of the respondents preferred not to report their family income level. The sample is skewed towards females, young respondents, and more educated individuals, representing the group that is more likely to have exposure to meat substitutes. The current eating habit of the respondents shows that 90% stated that they eat meat (65% describe themselves as an omnivore, and 25% as flexitarian), with more than 60% of the respondents stating that they eat meat on most days of the week. The respondents assigned to the four versions of the survey do not significantly differ by the current diet habit that they follow ( χ 2 = 7.015 , d f = 6 , p-value = 0.319). Two-thirds of the respondents already bought meat substitutes and are familiar with the product. The remaining one-third reported the look, taste, and lack of cooking skills of meat substitutes as the three main reasons for not buying meat substitutes. Overall, the sample used in this study includes a diverse group of Flemish society that mostly consumes meat and, therefore, represents a relevant target group for a study that aims to reduce meat consumption.
The environmental attitude of the respondents was measured using the score on the 15 NEP items. The internal consistency of the 15 items was checked using Cronbach’s alpha (=0.768), which means the NEP score, indeed, has acceptable reliability as a measure of the concept “pro-environmental attitude”. The mean NEP score based on the 15 items (after recoding the even items) is 4.89 (on a 7-point scale) (see Appendix E), which implies that the respondents have a fairly pro-ecological orientation. Moreover, the mean NEP score of the respondents does not significantly differ across the respondents assigned to the four versions of the survey, as can be seen from the one-way ANOVA test in Appendix E (p-value = 0.122). Appendix E also contains a summary of the nine factors measured using selected items from the food choice questionnaire. For instance, the health factor is measured by five out of the six items from the food choice questionnaire, and it has a good internal consistency (Cronbach’s alpha = 0.794), with an average score of 5.32 (on a 7-point scale), which implies a high average for health consciousness for the respondents in the sample. The respondents assigned to the four versions of the survey do not significantly differ by health consciousness (p-value = 0.331 from the one-way ANOVA test). The factors of health, convenience, ethical concern, and weight control, which have acceptable internal consistency (Cronbach’s alpha values 0.65 ), are used in the subsequent analysis. Although the factor sensory appeal has a good internal consistency (Cronbach’s alpha = 0.695), it was not used further in the analysis, as the sensory appeal factor is already represented by the taste and appearance rating attributes of meat or meat substitutes.

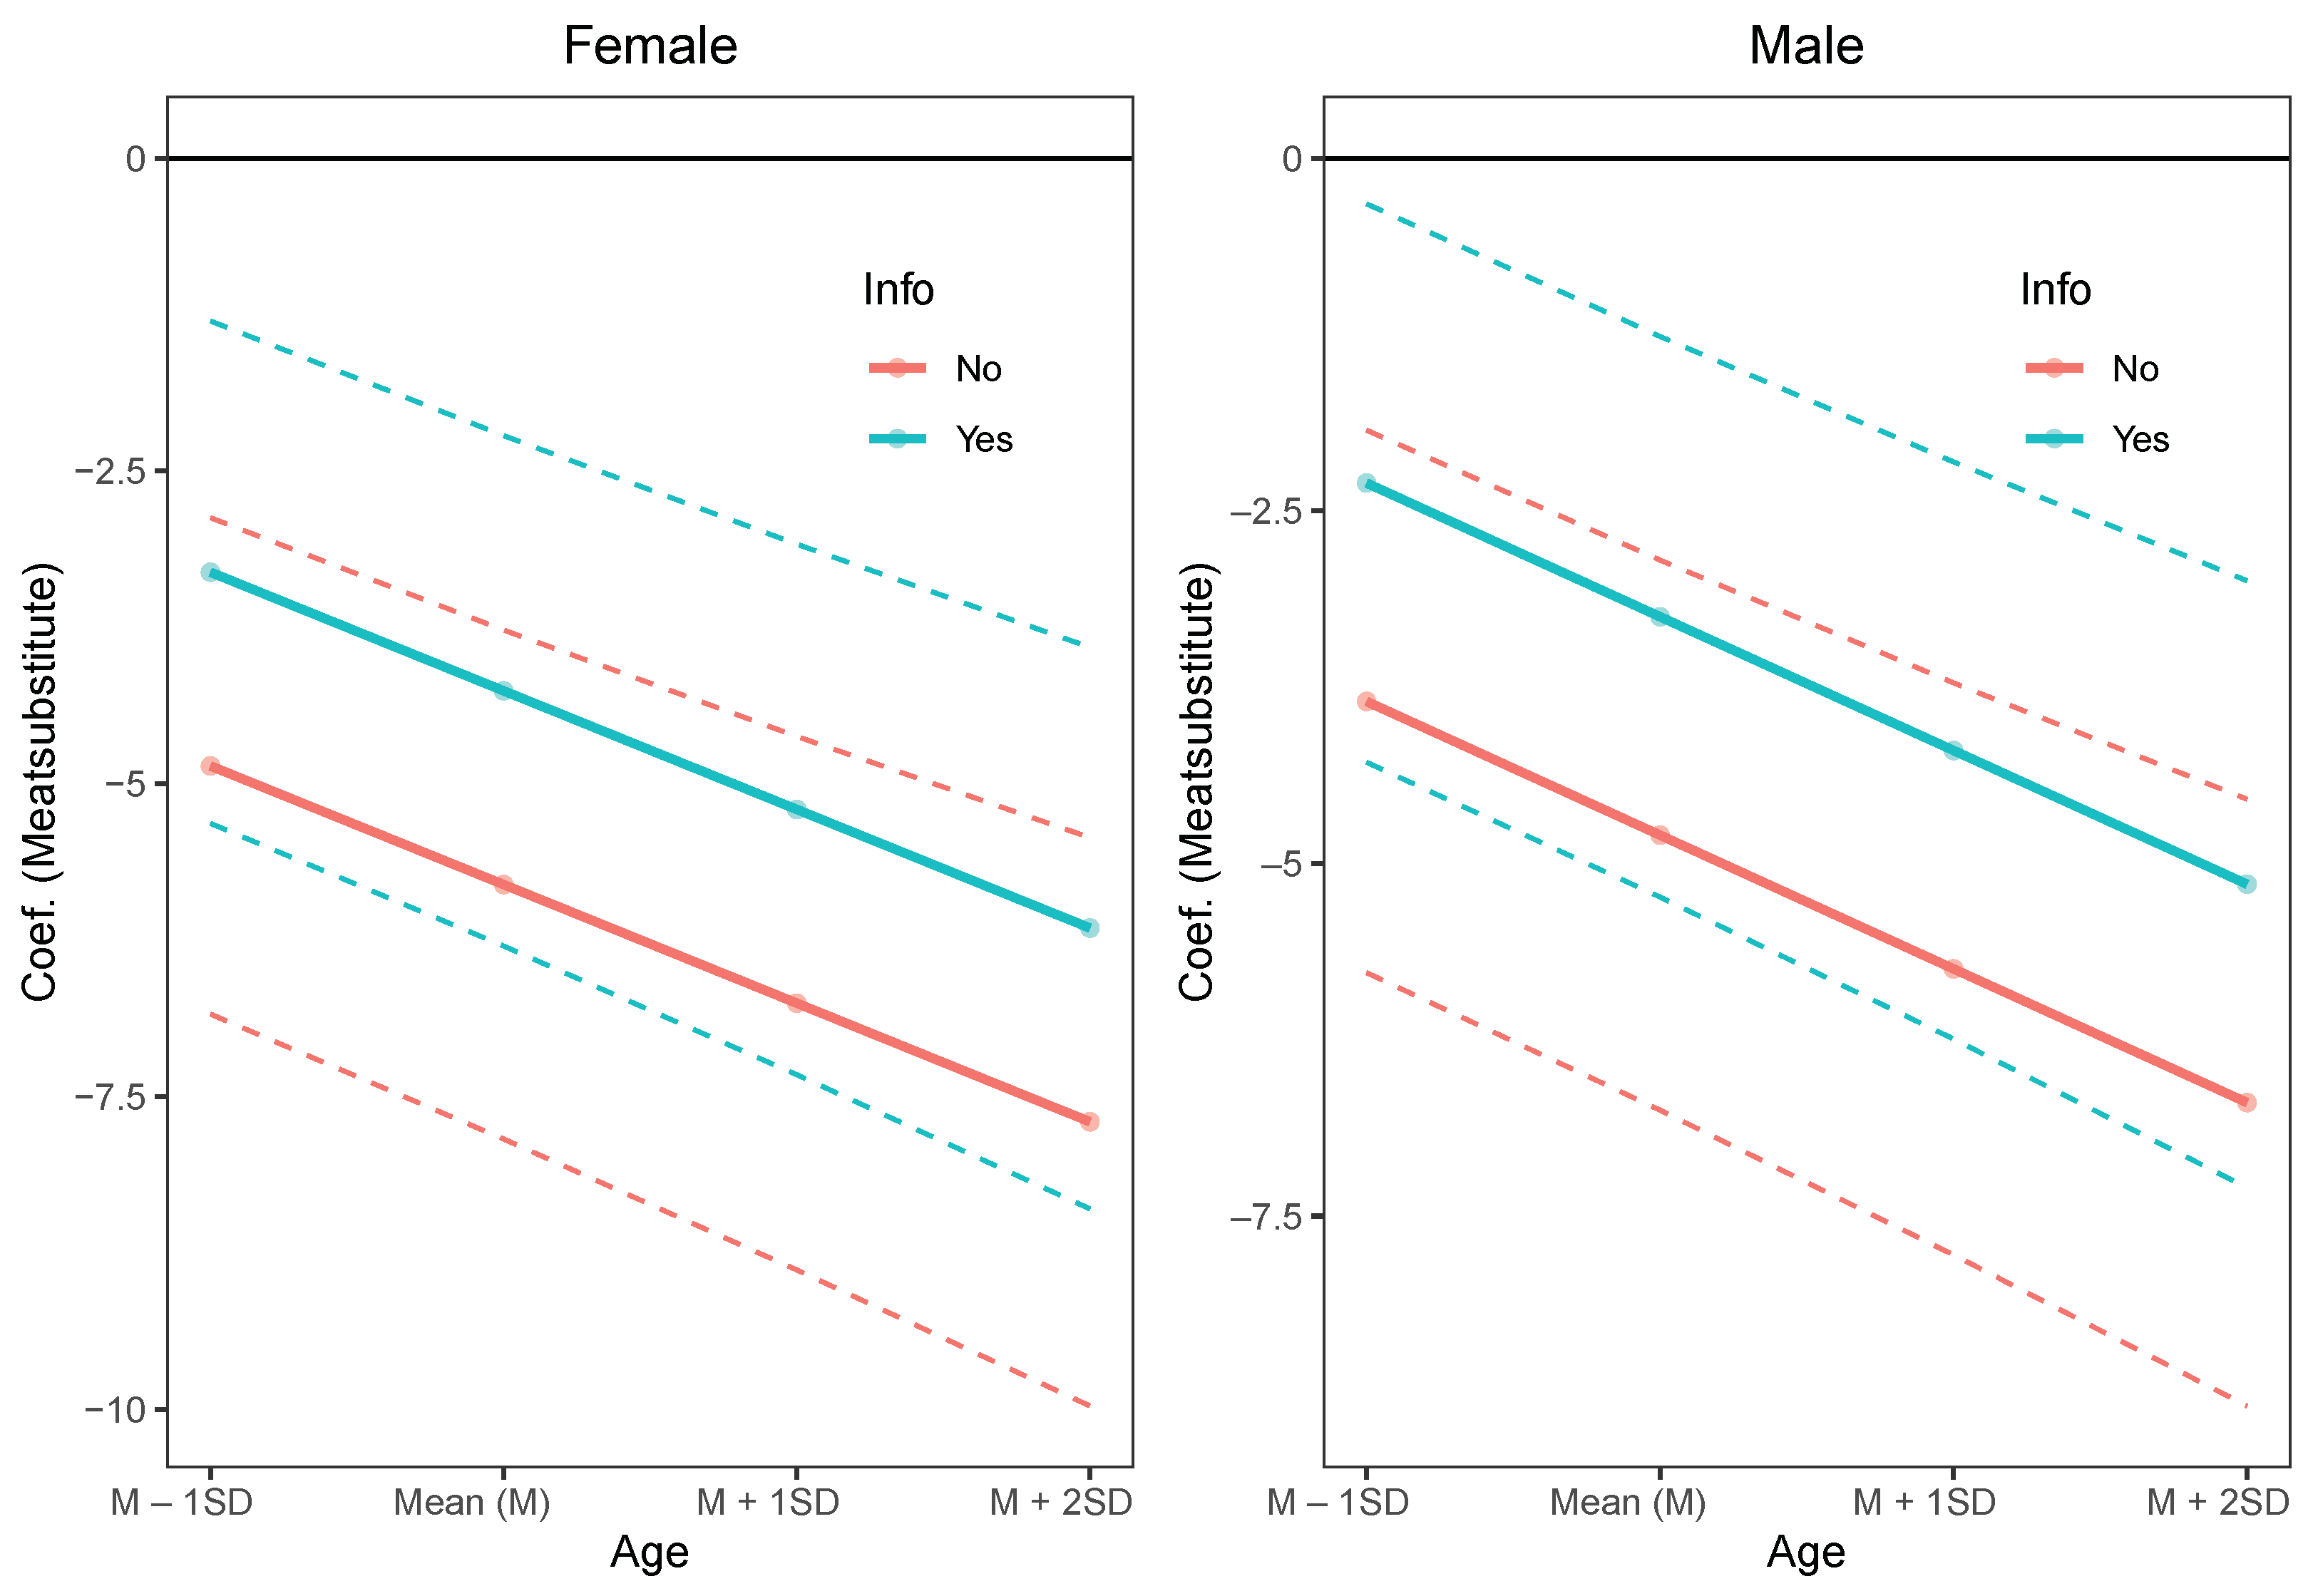
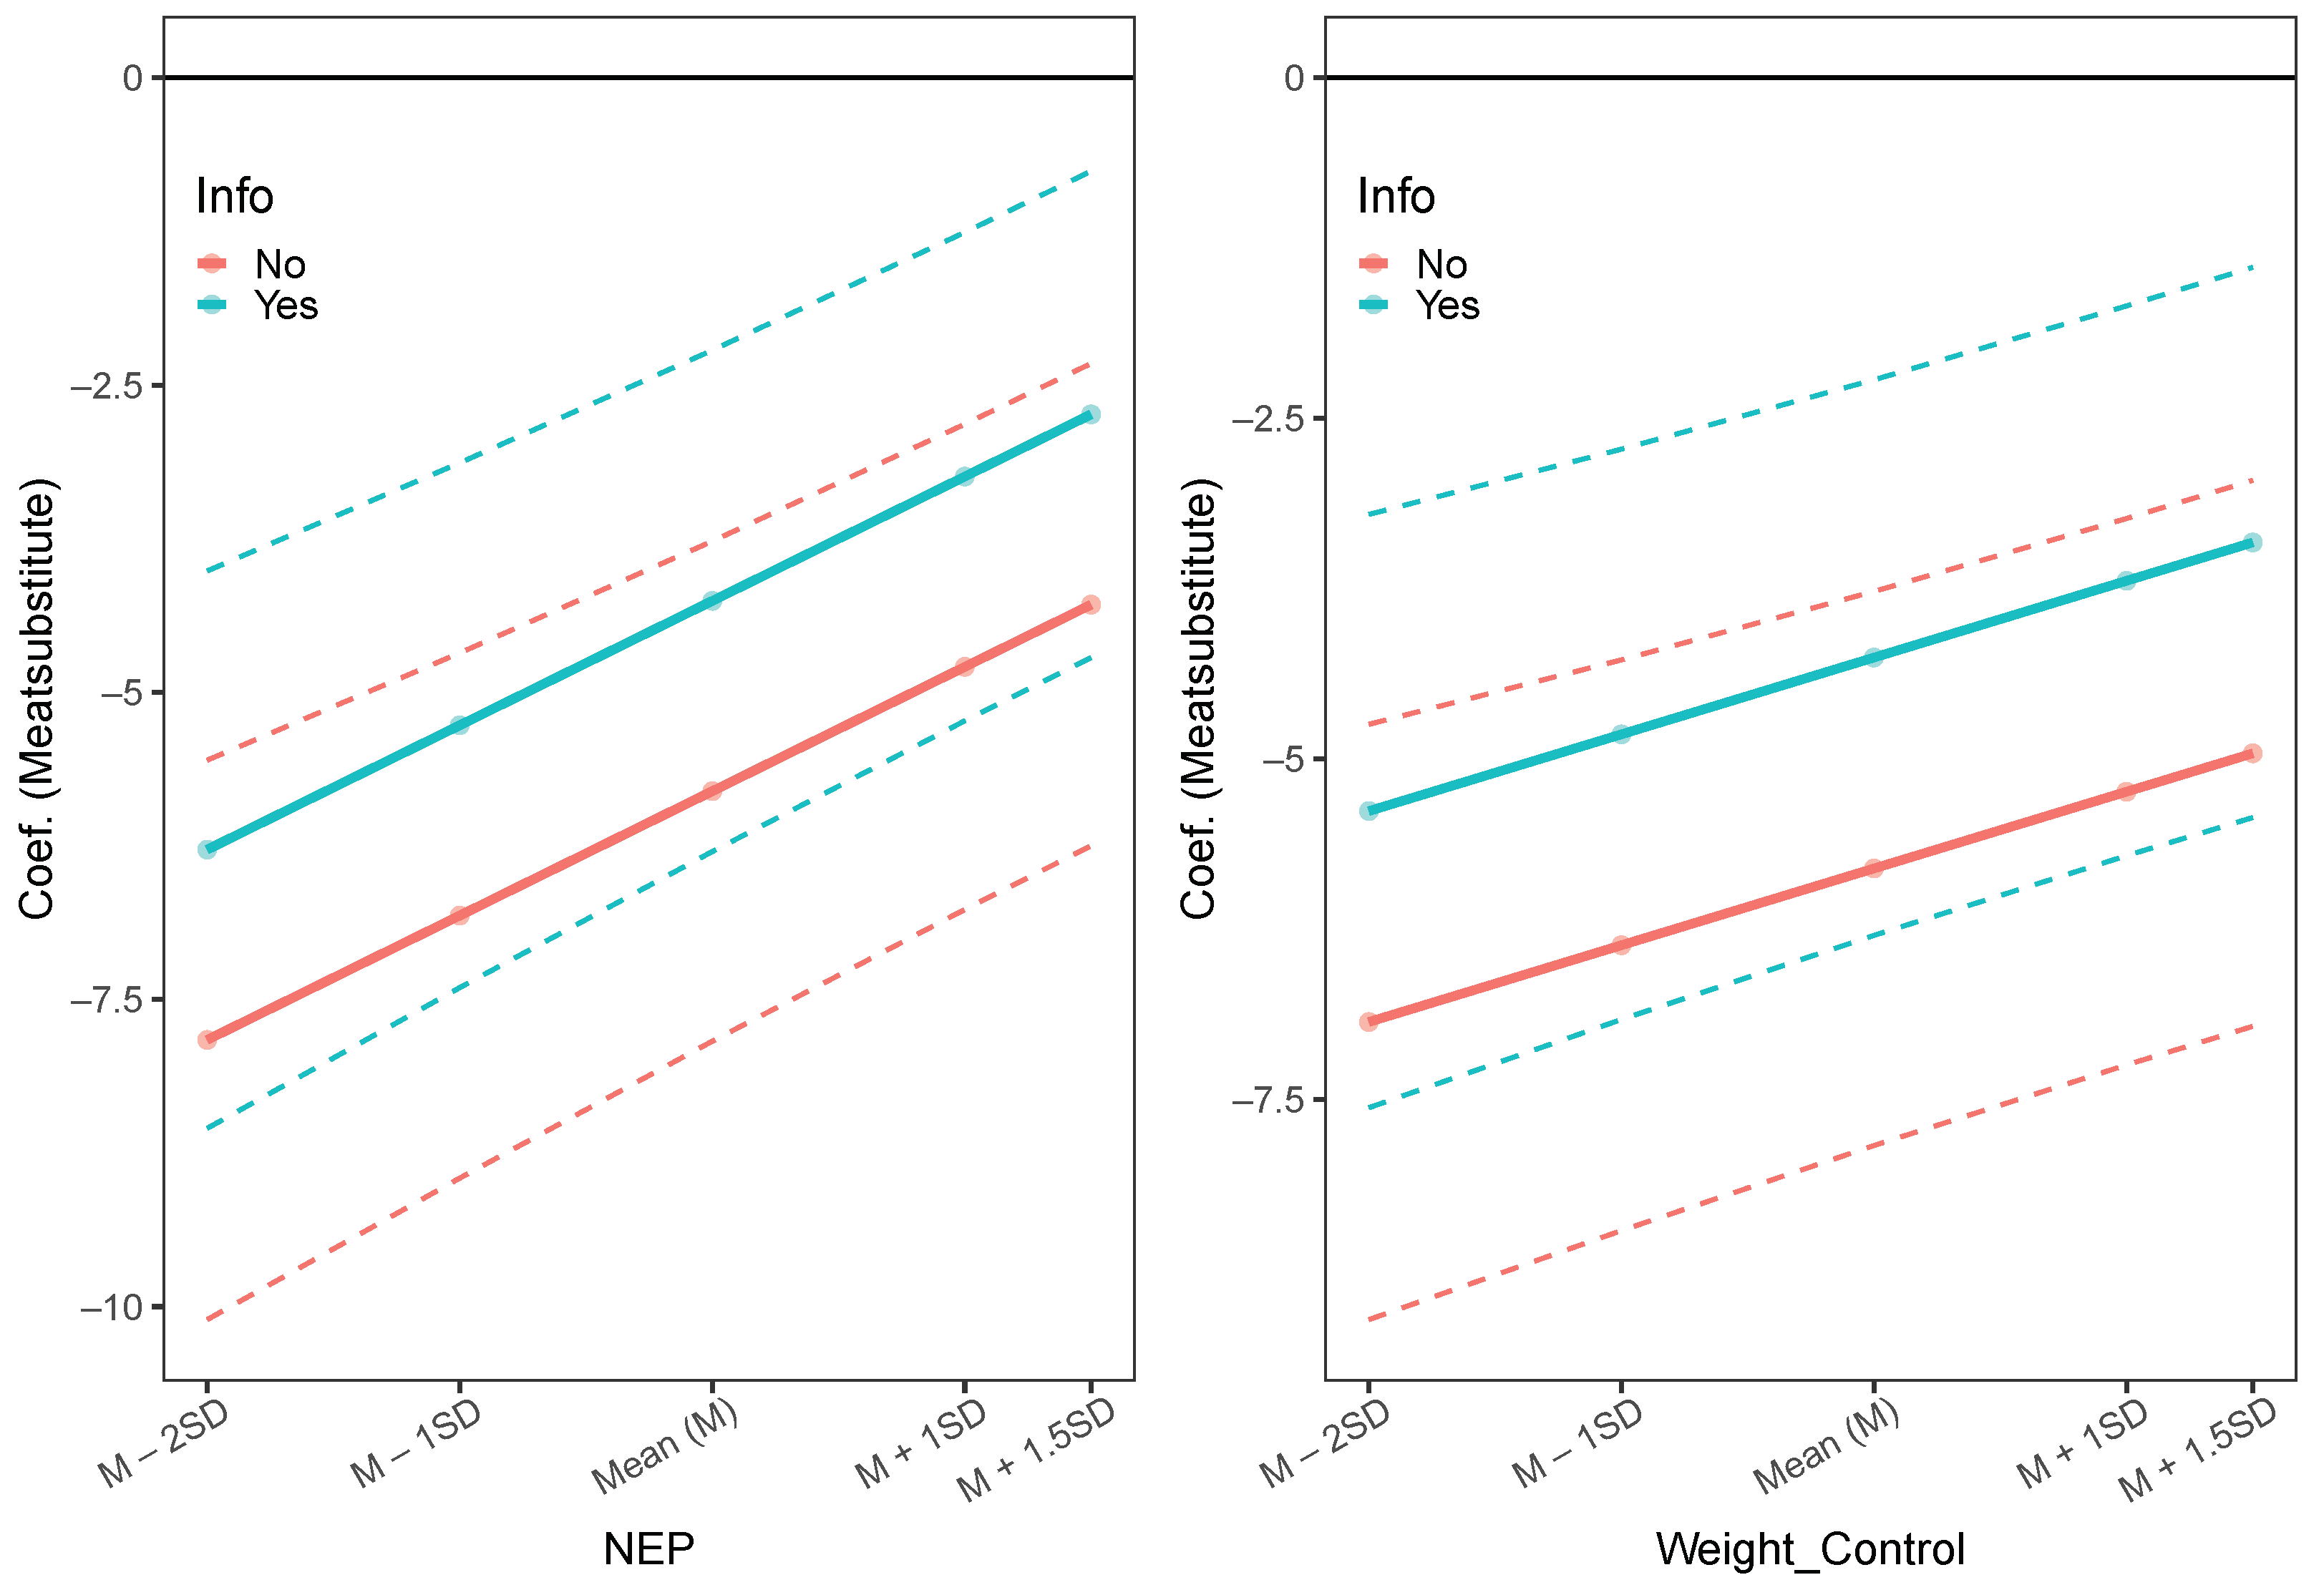
3.2. Estimation Results

In this section, we present the parameter estimates of the mixed logit model. The model uses the utility function specified in (7) and assumes a heterogeneous effect for the attributes and for the interaction terms that capture the effect of color coding and additional information, as well as the effect of socio-demographic and attitudinal factors on the preference for meat substitutes. This model is estimated using the maximum simulated likelihood estimation procedure with 2000 Halton draws in the R package mlogit [56]. Table 4 presents the results.
From Table 4, we can see that the coefficients for the second-order interaction terms E c o f o o t p r i n t × I n f o × C o l o r and F a t × I n f o × C o l o r are not significant. This implies that the effect of color coding on the preference coefficients of E c o f o o t p r i n t and F a t does not significantly change if the extra information is provided. On the other hand, the first-order interaction terms of both the attributes with color coding ( E c o f o o t p r i n t × C o l o r and F a t × C o l o r ) are negative and significant. This implies that the respondents assigned to the colored version of the survey consider higher quantities of the ecological footprint and saturated fat attributes to be less desirable than the respondents assigned to the uncolored version of the survey questionnaire. A possible explanation is that color coding increases the attention to these attributes and increases the stated probability of selecting more healthy and environmentally friendly products. The interaction terms E c o f o o t p r i n t × I n f o and F a t × I n f o are not significant, which implies that, on average, the provision of additional information regarding either health or the environment does not affect the coefficients of the attributes for ecological footprint or saturated fat, respectively. Finally, the estimates of E c o f o o t p r i n t and F a t are negative and significant, which indicates that without providing additional information and without using color coding, higher levels of these attributes are not desirable. We can, therefore, conclude that color coding has a reinforcing effect on the impact of the ecological footprint and saturated fat attributes.
The table also shows that the mean preference parameter estimates of the other attributes considered in this study are significant at a one percent significance level. The estimated coefficients for taste, organic label, and appearance are positive, indicating a preference for meat or meat substitutes that have a similar taste and appearance as meat and are produced in an organic way. As expected, the price has a significant negative coefficient, and it has a different impact on meat and meat substitutes, as can be seen from the significant interaction between M e a t s u b s t i t u t e and P r i c e . When the price increases by EUR 1 and all other attributes remain constant, the utility assigned to meat decreases on average by 0.767 units, whereas the utility assigned to meat substitutes decreases by 0.323 ( = 0.767 + 0.444 ) units. Though price has a smaller effect on meat substitutes than meat, its effect is still significant, which implies that respondents are less price-sensitive when they buy meat substitutes compared to meat. Except for the organic label (p-value = 0.082), the standard deviations of the random preference coefficients are significant at a one percent significance level for all attributes, indicating heterogeneity in the preferences.
Table 4 also contains the estimates for the alternative specific constants, O p t o u t and M e a t s u b t i t u t e s (with the reference category “meat”). The coefficient of O p t o u t ( = 11.519 ) is negative and significant, which reflects the higher benefit expected from buying meat than from not buying at all. On the other hand, the coefficient of the alternative specific constant M e a t s u b s t i t u t e indicates the utility difference between meat substitutes and meat, as discussed earlier. For instance, the estimate M e a t s u b s t i t u t e = 5.711 in Table 4 implies that, prior to the provision of additional information, for female respondents of average age with a primary/secondary education level, an omnivorous diet, and average scores for the attitudinal factors, the utility assigned to meat substitutes is, on average, 5.711 units lower than the utility assigned to meat. The interaction effect M e a t s u b s t i t u t e × I n f o shows the effect of the provision of extra information regarding the harmful environmental and health impact of meat consumption on the coefficient of M e a t s u b s t i t u t e . We can see that providing extra information significantly increases the coefficient of M e a t s u b s t i t u t e on average by 1.483 units, holding the effect of other variables constant. For instance, post-information, for female respondents of average age with a primary/secondary education level, an omnivorous diet, and average scores on attitudinal factors, the coefficient of M e a t s u b s t i t u t e becomes 4.218 ( = 5.711 + 1.493 ). This estimate is still significantly negative (p-value < 0.001). This implies that post-information, these respondents still had a higher preference for meat, although after receiving the information, there is a significant decline in preference for meat. It is important to note that the increase in the preference for meat substitutes relative to the pre-information level does not necessarily mean that all consumers will prefer them over meat after receiving the information. The post-information preference for meat substitutes compared to meat depends on the pre-information preference level, which, in turn, depends on socio-demographics, current diet, and attitudinal variables. On the other hand, the non-significant interaction of M e a t s u b s t i t u t e with C o l o r shows that using color-coded attribute levels for the attributes of ecological footprint and saturated fat does not have a significant impact on the coefficient of M e a t s u b s t i t u t e .
Table 4 also presents the estimates for the effects of socio-demographic variables, current diet, and attitudinal factors on the preference for meat substitutes, which were modeled as the interaction terms between the alternative-specific constant for meat substitutes and the socio-demographic variables, current diet, and attitudinal factors. The socio-demographic factors considered here include age, gender, and education, which are identified in the literature as affecting the consumption of meat substitutes. The attitudinal factors include the mean NEP score and the mean score of selected factors based on the FCQ. The effect of these variables can be interpreted as follows.
The estimates of the interaction of M e a t s u b s t i t u t e with G e n d e r and with A g e show that being male increases the coefficient of M e a t s u b s t i t u t e , whereas being older reduces it. Having a higher non-university education level or a university education level significantly increases the coefficient of M e a t s u b s t i t u t e compared to having a primary/secondary education level. Similarly, following a flexitarian diet or a vegan/vegetarian diet significantly increases the coefficient of M e a t s u b s t i t u t e compared to having an omnivore diet. On the other hand, there is a positive and significant interaction effect of the attitudinal factors ( N E P and W e i g h t _ C o n t r o l ) with M e a t s u b s t i t u t e . The corresponding estimates in Table 4 show the effects of an increase of 1 SD in these variables on the coefficient of M e a t s u b s t i t u t e while holding the other effects constant. These estimates imply that the respondents who are more concerned about the environment or who care more about how their daily food choices affect their weight are more likely to choose meat substitutes than respondents who are less concerned about these things, ceteris paribus. Finally, the interaction of M e a t s u b s t i t u t e with the other attitudinal factors ( H e a l t h , C o n v e n i e n c e , and E t h i c a l ) is not significant, which suggests that, on average, the utility that respondents assign to meat substitutes compared to meat does not differ in terms of these variables.
As we have discussed earlier, the post-information preference for meat substitutes compared to meat depends on the pre-information level, which varies along with the socio-demographic factors and attitudinal factors. By using the effect plots in Figure 2 and Figure 3 for various socio-demographic and attitudinal factors, we visualize whether meat substitutes are preferred in comparison to meat post-information. Figure 2 shows the pre-information and post-information estimates of the M e a t s u b s t i t u t e coefficient for varying ages for female (left-hand panel) and male (right-hand panel) respondents with a primary/secondary education level, an omnivorous diet, and average scores for the attitudinal factors. We can see from Figure 2 that in the case of pre-information, both the female and male respondents at various ages prefer meat to meat substitutes, although the preference level differs. It is also clear that post-information, those respondents still prefer meat despite a significant decline in their preference for meat compared to the pre-information level. In Figure 3, we also present the effect of extra information when the levels of the attitudinal factors vary for female respondents of an average age with a primary/secondary education level and an omnivorous diet. The value of the attitudinal factors other than the varying factor held constant at an average level. We can see from Figure 3 that for both pre-information and post-information, these respondents do not significantly prefer meat substitutes over meat, even for those who care more about the environment and how their daily food choices affect their weight. In conclusion, despite the fact that information provision reduces the preference for meat, its influence is not sufficient to ultimately cause a preference for meat substitutes over meat for respondents following an omnivore diet.

4. Discussion and Conclusions

An increase in the consumption of meat substitutes has the potential to reduce the harm associated with meat consumption. As a result, efforts have been made to raise the consumption of meat substitutes. Although the current level of improvement in the sensory and nutritional aspects of meat substitutes is promising, there remain several barriers. This paper investigates how color coding and the provision of additional information on health and environmental attributes affect the preference for meat substitutes. We provide empirical evidence from a DCE experiment survey conducted in the Flemish part of Belgium.
The result of this study demonstrates that ratings of sensory characteristics (taste and appearance) of meat substitutes significantly affect preferences for meat substitutes in Flanders. The meat substitutes that resemble meat in appearance and taste are most preferred. This finding is in line with several other studies and stresses the importance of the sensory quality of meat substitutes [24,25,26,27]. The consumers’ preference based on sensory aspects can best be studied in blind tasting, as demonstrated in the case of meat sausage in Martin et al. [38] and for the case of burgers in Grasso et al. [39]. However, in the absence of the actual products, the hypothetical choice situations used here can provide valuable information.
The study shows that the non-sensory aspects of meat or meat substitutes are also crucial in explaining the preferences of Flemish consumers. As for many other products, price negatively affects the preference for meat and meat substitutes, although the respondents are less price-sensitive to meat substitutes compared to meat. This result is in line with the finding of Weinrich and Gassler [57] that found a smaller sensitivity for the potential buyers of micro-algae-based meat substitutes to higher prices when compared to buyers of meat. Flemish consumers prefer meat and meat substitutes with an EU organic label but not with a high percentage of saturated fat or a large ecofootprint. This finding is also consistent with previous research that shows consumers’ preference for organic food [28,35], as well as a preference for food with low saturated fat and ecofootprint [45,47,58]. Therefore, the wide consumption of meat substitutes can potentially be promoted by producing meat substitutes with reduced saturated fat in an environmentally friendly manner at a low cost. However, keeping a low price while maintaining these desired non-sensory characteristics is a challenge that requires more research and technological advancement.
The knowledge gap regarding the health and environmental impact of meat consumption among meat consumers provides another opportunity to promote the demand for meat substitutes. The information intervention studies in the literature clearly demonstrate that providing additional information has the potential to change either consumers’ preferences or the probability of attending attributes. In line with previous studies [38,39], this study shows that providing additional information about the harmful environmental and health impact of meat consumption after the first six choice sets has a significant positive impact on consumers’ preference for meat substitutes. This suggests that awareness regarding the negative consequences of meat consumption on the environment is essential. This result is not unexpected, as several studies reported that most consumers of meat are unaware of its environmental impact. For instance, the systematic review by Sanchez-Sabate and Sabaté [40] shows that the percentage of participants who were aware of the negative impact of meat production and consumption ranged only from 23% to 35% across studies conducted in Western societies, including Belgium. On the other hand, after capturing the overall effect of providing additional information on meat substitutes, there is no extra effect from additional information on the coefficients of the attributes “ecofootprint” and “saturated fat”. An increase in preference for meat substitutes that already have lower levels of ecofootprint and saturated fat when compared to meat indirectly captures the expected effect of additional information on the coefficients of ecofootprint and saturated fat attributes.
This study also shows that using color-coding for attribute levels significantly affects the respondents’ preferences through its effect on the coefficients of the attributes “ecofootprint” and “saturated fat”. This result demonstrates the possibility of promoting meat substitutes by presenting health and environmental attributes on colored labels. This finding substantiates the result of the systematic review and meta-analysis by Song et al. [42], which associates an increased probability of selecting a healthy product when a traffic light color coding scheme is used in product labeling.
The individual-level variation in utility attributed to meat substitutes compared to meat is explained significantly by age, gender, education, and the attitudinal factors of NEP and weight control. The result shows that as age increases, meat substitutes are less preferred. In line with some studies [59,60], we also found that meat substitutes are preferred more by men than women. However, this result contradicts the findings of other studies that show males’ have a greater preference for meat [61,62,63]. Finally, meat substitutes are preferred by consumers who have stronger pro-environmental attitudes and who emphasize the weight control aspect of the food they eat.
Overall, it is important to keep the taste and appearance of meat substitutes similar to meat and produce them in an organic way at a low price. It is also crucial to keep the ecological footprint and saturated fat as low as possible. By holding these attributes constant, increasing awareness regarding the environmental and health impact of meat consumption can directly promote the consumption of meat substitutes. In addition, color coding the levels of health and environmental attributes draws attention to these attributes, increasing the preference for an alternative with a lower ecological footprint and saturated fat level. Given that meat substitutes have lower levels of these attributes than meat, using color coding enhances the likelihood of choosing meat substitutes more and, thus, can promote their consumption. Therefore, both color coding and additional information can jointly be used to promote meat substitutes. Finally, individual preference differences suggest that respondents who are male, younger, more educated, more pro-environmental, and more concerned about the calorie elements of the food they eat favor meat substitutes more. These individual differences can also be exploited in future interventions that aim to promote meat substitutes.
This research shows which factors affect Flemish consumers’ preferences for meat and meat substitutes and whether using extra information or color-coded product labeling can increase the attractiveness of meat substitutes. Despite the use of convenience sampling in our study, the findings align with previous studies that have shown comparable effects in terms of the attributes of meat or meat substitutes in various geographical areas. Moreover, the results pertaining to the influence of extra information and color coding, although being examined separately in prior studies, align with past research. The consistent findings support the generalizability to Belgium and other Western countries given the comparability of lifestyles seen across these nations. This study is, however, bound to the limitations of using a hypothetical choice experiment to study actual choices. The use of a DCE can generate a hypothetical bias, as the measures in hypothetical choice experiments capture the intentions rather than the actual behavior. It also limits the alternatives available to respondents compared to the huge variety of alternatives available in the actual market. For instance, we only offered two options for meat substitutes, ignoring the other vegetarian alternatives, which might have led us to an overestimation of the market share of meat substitutes. Moreover, the choice sets were always presented in the same order, which might also affect the outcome of the DCE. In this regard, evidence shows that preference may change when the choice sets are presented in a different order [64,65,66]. We encourage future similar research to randomize the choice sets presented to the respondents. The second limitation of the study is related to the way in which additional information is presented. Even though the information shown contains objective scientific evidence, the acceptance of such information as credible information can vary depending on the respondent’s level of education and other factors. The credibility of the information can be emphasized by using more familiar sources like the World Health Organization (WHO) or explicitly stating that the information source is guaranteed by government bodies (e.g., see Rousseau and Vranken [35]). It is also important to note that the information provided contains both environmental and health aspects, which complicate the interpretation of the effects. In order to disentangle the effects of health information and environmental information, a survey setup that assigns respondents only to a health information or environmental information condition might be more useful (e.g., see Martin et al. [38]). Further research with a large representative sample and considering actual market choices would strengthen the findings of this study.

Author Contributions

Conceptualization, S.Y.A., M.M., M.V., H.M. and N.F.; methodology, S.Y.A., M.M., M.V., H.M. and N.F.; validation, S.Y.A.; formal analysis, S.Y.A., H.M. and N.F.; data curation, M.M., H.M. and N.F.; writing—original draft, S.Y.A.; writing—review and editing, S.Y.A., M.M. and M.V.; supervision, M.M. and M.V.; funding acquisition, M.M. and M.V. All authors have read and agreed to the published version of the manuscript.

Funding

This research was funded by the C14/17/016—DBOF project of KU Leuven and the G0C7317N—FWO project.

Institutional Review Board Statement

It was not considered relevant.

Informed Consent Statement

Informed consent was obtained from all subjects involved in the study.

Data Availability Statement

The data that support the findings of this study are available from the authors upon request.

Conflicts of Interest

The authors declare no conflict of interest.

Abbreviations

The following abbreviations are used in this manuscript:
DCEdiscrete choice experiment
WTPwillingness to pay
NEPnew ecological paradigm
FCQfood choice questionnaire
ANOVAanalysis of variance

Appendix A. Example of a Choice Set with Color-Coded Attribute Levels

AttributesMeatMeat Substitute 1Meat Substitute 2
Price (EUR/500 gr)EUR 6EUR 4EUR 10
Taste (rating)615
Organic labelNoEU organic labelNo
Appearance (rating)615
Ecological footprint (kgCO2e)133.53.5
Saturated fat (%)851
Which option would you prefer?
O Meat  O Meat substitute 1  O Meat substitute 2  O No choice

Appendix B. Additional Information

Meat consumption has a major impact on the environment and on your health.
Agriculture is the world’s largest source of methane and nitrous oxide emissions. These greenhouse gases are the second and fourth largest contributors to the hole in the ozone layer, respectively [67].
Individuals who frequently eat red and processed meat are more likely to be obese, have a high body mass index (BMI), and large waist circumference due to the high amounts of saturated fatty acids and cholesterol in these products [68].
The ecological footprint is a method of measuring how much a person takes up the available space on our planet [69]. The ecological footprint of meat substitutes has an average of 2.4 kg CO2e. Meat consumption has an ecological footprint of between 9 and 129 kg CO2e for beef, between 4 and 11 kg CO2e for pork, and between 2 and 6 kg CO2e for chicken [48].

Appendix C. NEP Scale Items

  • We are approaching the limit of the number of people the Earth can carry.
  • People have the right to adapt the natural environment to their own needs.
  • When people interfere with nature, it often has disastrous consequences.
  • Human competences will ensure that we do NOT make the Earth uninhabitable.
  • Humans are seriously abusing the environment.
  • The Earth has plenty of natural resources; we just need to learn how to develop them.
  • Plants and animals have just as much right to exist as humans.
  • The natural balance is strong enough to withstand the impact of modern industrialized countries.
  • Despite our special abilities, humans are still subject to the laws of nature.
  • The so-called ’ecological crisis’ facing humanity has been greatly exaggerated.
  • Earth is like a spaceship with limited space and resources.
  • Man is destined to rule over the rest of nature.
  • The natural balance is very delicate and easily disturbed.
  • Humans will eventually learn enough about how nature works to fully control it.
  • If things continue as they are now, we will soon experience a major ecological disaster.

Appendix D. Selected Items from Food Choice Questionnaire

Nb.It Is Important to Me That the Food I Eat on a Typical Day:Factor
1is easy to prepareConvenience
2contains no additivesNatural Content
3is low in caloriesWeight Control
4tastes goodSensory Appeal
5is low in fatWeight Control
6is high in fiber and roughageHealth
7is nutritiousHealth
8is easily available in shops and supermarketsConvenience
9is good value for moneyPrice
10smells niceSensory Appeal
11helps me control my weightWeight Control
12has a pleasant textureSensory Appeal
13is packaged in an environmentally friendly wayEthical Concern
14contains lots of vitamins and mineralsHealth
15looks niceSensory Appeal
16is high in proteinHealth
17takes no time to prepareConvenience
18keeps me healthyHealth
19makes me feel goodMood
20has the country of origin clearly markedEthical Concern
21is what I usually eatFamiliarity
22is cheapPrice

Appendix E. Mean NEP Score and the Mean Score of the Factors Based on the Food Choice Questionnaire

ItemsItems Used α Mean (SD)
OverallVersion 1Version 2Version 3Version 4p-Value
NEP15150.7684.89 (0.73)4.91 (0.68)4.79 (0.74)5.18 (0.93)4.8 (0.61)0.122
Health650.7945.34 (0.92)5.33 (0.73)5.13 (1.1)5.44 (1.17)5.47 (0.73)0.331
Convenience530.8155.12 (1.31)5.03 (1.33)5.03 (1.5)5.23 (1.33)5.21 (1.16)0.847
Ethical Concern320.74.72 (1.51)4.63 (1.66)4.5 (1.49)4.67 (1.68)5.02 (1.28)0.402
Price320.4215.12 (0.98)5.17 (0.97)4.79 (1.01)5.2 (1.17)5.31 (0.8)0.072
Sensory Appeal440.6955.58 (0.98)5.61 (0.91)5.54 (1.08)5.34 (0.97)5.73 (0.94)0.421
Weight Control330.8384.4 (1.44)4.4 (1.47)4.32 (1.34)3.84 (1.65)4.78 (1.29)0.056
Mood61 5.83 (1.15)5.82 (1.09)5.52 (1.47)6.15 (1.13)5.92 (0.85)0.153
Natural Content31 4.25 (1.51)4.2 (1.31)4.07 (1.55)4 (1.98)4.58 (1.33)0.153
Familiarity31 4.22 (1.65)4.18 (1.74)4.14 (1.66)3.63 (1.64)4.65 (1.52)0.081
Notes: α denotes Cronbach’s alpha. The p-values are obtained from a one-way ANOVA test for differences among the four versions.

References

  1. Wyness, L.; Weichselbaum, E.; O’Connor, A.; Williams, E.B.; Benelam, B.; Riley, H.; Stanner, S. Red meat in the diet: An update: Red meat update. Nutr. Bull. 2011, 36, 34–77. [Google Scholar] [CrossRef]
  2. Cocking, C.; Walton, J.; Kehoe, L.; Cashman, K.D.; Flynn, A. The role of meat in the European diet: Current state of knowledge on dietary recommendations, intakes and contribution to energy and nutrient intakes and status. Nutr. Res. Rev. 2020, 33, 181–189. [Google Scholar] [CrossRef]
  3. Smil, V. Eating meat: Constants and changes. Glob. Food Secur. 2014, 3, 67–71. [Google Scholar] [CrossRef]
  4. Nungesser, F.; Winter, M. Meat and social change: Sociological perspectives on the consumption and production of animals. ÖZS. Österr. Z. Soziol. 2021, 46, 109–124. [Google Scholar] [CrossRef]
  5. Partarakis, N.; Kaplanidi, D.; Doulgeraki, P.; Karuzaki, E.; Petraki, A.; Metilli, D.; Bartalesi, V.; Adami, I.; Meghini, C.; Zabulis, X. Representation and presentation of culinary tradition as cultural heritage. Heritage 2021, 4, 612–640. [Google Scholar] [CrossRef]
  6. Chiles, R.M.; Fitzgerald, A.J. Why is meat so important in Western history and culture? A genealogical critique of biophysical and political-economic explanations. Agric. Hum. Values 2018, 35, 1–17. [Google Scholar] [CrossRef]
  7. Ederer, P.; Baltenweck, I.; Blignaut, J.N.; Moretti, C.; Tarawali, S. Affordability of meat for global consumers and the need to sustain investment capacity for livestock farmers. Anim. Front. 2023, 13, 45–60. [Google Scholar] [CrossRef]
  8. Food and Agriculture Organization of the United Nations (FAO). Per Capita Meat Consumption by Type, World, 1961 to 2020. Available online: https://ourworldindata.org/grapher/per-capita-meat-consumption-by-type-kilograms-per-year (accessed on 22 September 2023).
  9. de Vries, M.; de Boer, I. Comparing environmental impacts for livestock products: A review of life cycle assessments. Livest. Sci. 2010, 128, 1–11. [Google Scholar] [CrossRef]
  10. Nijdam, D.; Rood, T.; Westhoek, H. The price of protein: Review of land use and carbon footprints from life cycle assessments of animal food products and their substitutes. Food Policy 2012, 37, 760–770. [Google Scholar] [CrossRef]
  11. Jarmul, S.; Dangour, A.D.; Green, R.; Liew, Z.; Haines, A.; Scheelbeek, P.F. Climate change mitigation through dietary change: A systematic review of empirical and modelling studies on the environmental footprints and health effects of ‘sustainable diets’. Environ. Res. Lett. 2020, 15, 123014. [Google Scholar] [CrossRef]
  12. Xu, X.; Sharma, P.; Shu, S.; Lin, T.S.; Ciais, P.; Tubiello, F.N.; Smith, P.; Campbell, N.; Jain, A.K. Global greenhouse gas emissions from animal-based foods are twice those of plant-based foods. Nat. Food 2021, 2, 724–732. [Google Scholar] [CrossRef]
  13. Ritchie, H. How much of the world’s land would we need in order to feed the global population with the average diet of a given country. Our World Data 2017, 3, 2017. [Google Scholar]
  14. Micha, R.; Wallace, S.K.; Mozaffarian, D. Red and processed meat consumption and risk of incident coronary heart disease, stroke, and diabetes mellitus: A systematic review and meta-analysis. Circulation 2010, 121, 2271–2283. [Google Scholar] [CrossRef] [PubMed]
  15. Richter, C.K.; Skulas-Ray, A.C.; Champagne, C.M.; Kris-Etherton, P.M. Plant Protein and Animal Proteins: Do They Differentially Affect Cardiovascular Disease Risk? Adv. Nutr. 2015, 6, 712–728. [Google Scholar] [CrossRef]
  16. Sutherland, M.A.; Webster, J.; Sutherland, I. Animal health and welfare issues facing organic production systems. Animals 2013, 3, 1021–1035. [Google Scholar] [CrossRef] [PubMed]
  17. Bergeron, R.; Meunier-Salaün, M.C.; Robert, S. The welfare of pregnant and lactating sows. In Welfare of Pigs from Birth to Slaughter; Wageningen Academic Publishers: Wageningen, The Netherlands, 2008; pp. 65–95. [Google Scholar]
  18. Hartung, J.; Marahrens, M.; Von Holleben, K. Recommendations for future development in cattle transport in Europe. DTW. Dtsch. Tierarztl. Wochenschr. 2003, 110, 128–130. [Google Scholar]
  19. Alvarez, J.; Bicout, D.; Calistri, P.; Depner, K.; Drewe, J.; Garin-Bastuji, B.; Gonzales Rojas, J.; Gortázar Schmidt, C.; Michel, V.; Miranda Chueca, M.; et al. Welfare of pigs at slaughter. EFSA J. 2020, 18, 6148. [Google Scholar] [CrossRef]
  20. Milburn, J. Chapter 10—Ethics of meat alternatives. In Meat and Meat Replacements; Meiselman, H.L., Manuel Lorenzo, J., Eds.; Woodhead Publishing: Cambridge, MA, USA, 2023; pp. 257–280. [Google Scholar]
  21. Tziva, M.; Negro, S.; Kalfagianni, A.; Hekkert, M. Understanding the protein transition: The rise of plant-based meat substitutes. Environ. Innov. Soc. Transit. 2020, 35, 217–231. [Google Scholar] [CrossRef]
  22. Zhao, S.; Wang, L.; Hu, W.; Zheng, Y. Meet the meatless: Demand for new generation plant-based meat alternatives. Appl. Econ. Perspect. Policy 2023, 45, 4–21. [Google Scholar] [CrossRef]
  23. Good Food Institute. U.S. Retail Market Data for the Plant-Based Industry. 2022. Available online: https://gfi.org/marketresearch/ (accessed on 9 May 2023).
  24. Hoek, A.C.; Luning, P.A.; Weijzen, P.; Engels, W.; Kok, F.J.; De Graaf, C. Replacement of meat by meat substitutes. A survey on person-and product-related factors in consumer acceptance. Appetite 2011, 56, 662–673. [Google Scholar] [CrossRef]
  25. Tucker, C.A. The significance of sensory appeal for reduced meat consumption. Appetite 2014, 81, 168–179. [Google Scholar] [CrossRef] [PubMed]
  26. Cordelle, S.; Redl, A.; Schlich, P. Sensory acceptability of new plant protein meat substitutes. Food Qual. Prefer. 2022, 98, 104508. [Google Scholar] [CrossRef]
  27. Michel, F.; Hartmann, C.; Siegrist, M. Consumers’ associations, perceptions and acceptance of meat and plant-based meat alternatives. Food Qual. Prefer. 2021, 87, 104063. [Google Scholar] [CrossRef]
  28. Weinrich, R.; Elshiewy, O. Preference and willingness to pay for meat substitutes based on micro-algae. Appetite 2019, 142, 104353. [Google Scholar] [CrossRef] [PubMed]
  29. Verbeke, W. Profiling consumers who are ready to adopt insects as a meat substitute in a Western society. Food Qual. Prefer. 2015, 39, 147–155. [Google Scholar] [CrossRef]
  30. Profeta, A.; Baune, M.C.; Smetana, S.; Broucke, K.; Van Royen, G.; Weiss, J.; Hieke, S.; Heinz, V.; Terjung, N. Consumer preferences for meat blended with plant proteins—Empirical findings from Belgium. Future Foods 2021, 4, 100088. [Google Scholar] [CrossRef]
  31. Weinrich, R. Opportunities for the adoption of health-based sustainable dietary patterns: A review on consumer research of meat substitutes. Sustainability 2019, 11, 4028. [Google Scholar] [CrossRef]
  32. Dekkers, B.L.; Boom, R.M.; van der Goot, A.J. Structuring processes for meat analogues. Trends Food Sci. Technol. 2018, 81, 25–36. [Google Scholar] [CrossRef]
  33. He, J.; Evans, N.M.; Liu, H.; Shao, S. A review of research on plant-based meat alternatives: Driving forces, history, manufacturing, and consumer attitudes. Compr. Rev. Food Sci. Food Saf. 2020, 19, 2639–2656. [Google Scholar] [CrossRef]
  34. Neville, M.; Tarrega, A.; Hewson, L.; Foster, T. Consumer-orientated development of hybrid beef burger and sausage analogues. Food Sci. Nutr. 2017, 5, 852–864. [Google Scholar] [CrossRef]
  35. Rousseau, S.; Vranken, L. Green market expansion by reducing information asymmetries: Evidence for labeled organic food products. Food Policy 2013, 40, 31–43. [Google Scholar] [CrossRef]
  36. Sandorf, E.D.; Campbell, D.; Hanley, N. Disentangling the influence of knowledge on attribute non-attendance. J. Choice Model. 2017, 24, 36–50. [Google Scholar] [CrossRef]
  37. Maaya, L.; Meulders, M.; Vandebroek, M. Online Consumers’ Attribute Non-Attendance Behavior: Effects of Information Provision. Int. J. Electron. Commer. 2020, 24, 338–365. [Google Scholar] [CrossRef]
  38. Martin, C.; Lange, C.; Marette, S. Importance of additional information, as a complement to information coming from packaging, to promote meat substitutes: A case study on a sausage based on vegetable proteins. Food Qual. Prefer. 2021, 87, 104058. [Google Scholar] [CrossRef]
  39. Grasso, S.; Rondoni, A.; Bari, R.; Smith, R.; Mansilla, N. Effect of information on consumers’ sensory evaluation of beef, plant-based and hybrid beef burgers. Food Qual. Prefer. 2022, 96, 104417. [Google Scholar] [CrossRef]
  40. Sanchez-Sabate, R.; Sabaté, J. Consumer attitudes towards environmental concerns of meat consumption: A systematic review. Int. J. Environ. Res. Public Health 2019, 16, 1220. [Google Scholar] [CrossRef]
  41. Grummon, A.H.; Goodman, D.; Jaacks, L.M.; Taillie, L.S.; Chauvenet, C.A.; Salvia, M.G.; Rimm, E.B. Awareness of and reactions to health and environmental harms of red meat among parents in the United States. Public Health Nutr. 2022, 25, 893–903. [Google Scholar] [CrossRef] [PubMed]
  42. Song, J.; Brown, M.K.; Tan, M.; MacGregor, G.A.; Webster, J.; Campbell, N.R.; Trieu, K.; Mhurchu, C.N.; Cobb, L.K.; He, F.J. Impact of color-coded and warning nutrition labelling schemes: A systematic review and network meta-analysis. PLoS Med. 2021, 18, e1003765. [Google Scholar] [CrossRef]
  43. Jonker, M.F.; Donkers, B.; de Bekker-Grob, E.W.; Stolk, E.A. Effect of level overlap and color coding on attribute non-attendance in discrete choice experiments. Value Health 2018, 21, 767–771. [Google Scholar] [CrossRef] [PubMed]
  44. Apostolidis, C.; McLeay, F. To meat or not to meat? Comparing empowered meat consumers’ and anti-consumers’ preferences for sustainability labels. Food Qual. Prefer. 2019, 77, 109–122. [Google Scholar] [CrossRef]
  45. Macdiarmid, J.I.; Cerroni, S.; Kalentakis, D.; Reynolds, C. How important is healthiness, carbon footprint and meat content when purchasing a ready meal? Evidence from a non-hypothetical discrete choice experiment. J. Clean. Prod. 2021, 282, 124510. [Google Scholar] [CrossRef]
  46. Food Standards Agency (FSA). Guide to Creating a Front of Pack (FoP) Nutrition Label for Pre-Packed Products Sold through Retail Outlets. 2013. Available online: https://www.food.gov.uk/sites/default/files/media/document/fop-guidance_0.pdf (accessed on 5 April 2022).
  47. Alessandrini, R.; Brown, M.K.; Pombo-Rodrigues, S.; Bhageerutty, S.; He, F.J.; MacGregor, G.A. Nutritional quality of plant-based meat products available in the UK: A cross-sectional survey. Nutrients 2021, 13, 4225. [Google Scholar] [CrossRef] [PubMed]
  48. Federation of American Societies for Experimental Biology (FASEB). Quantifying the Environmental Benefits of Skipping the Meat. 2016. Available online: https://www.sciencedaily.com/releases/2016/04/160404170427.htm (accessed on 5 May 2022).
  49. EU. Regulation (EU) 2018/848 of the European Parliament and of the Council of 30 May 2018 on organic production and labelling of organic products and repealing Council Regulation (EC) No 834/2007. Off. J. Eur. Union 2018, L150, 1–92. [Google Scholar]
  50. Ngene, C. 1.2 User Manual and Reference Guide; ChoiceMetrics Pty Ltd.: Sydney, Australia, 2018. [Google Scholar]
  51. Michiels, H. Impact of Increased Knowledge about Meat Consumption on Flemish Consumers’ Willingness to Pay for Meat Substitutes. Master’s Thesis, KU Leuven, Brussels, Belgium, 2022. [Google Scholar]
  52. Flamant, N. Impact of Increased Knowledge about Meat Consumption on the Willingness to Pay of Flemish Consumers for Meat Substitutes. Master’s Thesis, KU Leuven, Brussels, Belgium, 2022. [Google Scholar]
  53. Dunlap, R.E.; Van Liere, K.D.; Mertig, A.G.; Jones, R.E. Measuring endorsement of the New Ecological Paradigm: A Revised NEP Scale. J. Soc. Issues 2000, 56, 425–442. [Google Scholar] [CrossRef]
  54. Steptoe, A.; Pollard, T.M.; Wardle, J. Development of a measure of the motives underlying the selection of food: The food choice questionnaire. Appetite 1995, 25, 267–284. [Google Scholar] [CrossRef]
  55. Train, K.E. Discrete Choice Methods with Simulation; Cambridge University Press: Cambridge, MA, USA, 2009. [Google Scholar]
  56. Croissant, Y. Estimation of Random Utility Models in R: The mlogit Package. J. Stat. Softw. 2020, 95, 1–41. [Google Scholar] [CrossRef]
  57. Weinrich, R.; Gassler, B. Beyond classical van Westendorp: Assessing price sensitivity for variants of algae-based meat substitutes. J. Retail. Consum. Serv. 2021, 63, 102719. [Google Scholar] [CrossRef]
  58. Scarborough, P.; Matthews, A.; Eyles, H.; Kaur, A.; Hodgkins, C.; Raats, M.M.; Rayner, M. Reds are more important than greens: How UK supermarket shoppers use the different information on a traffic light nutrition label in a choice experiment. Int. J. Behav. Nutr. Phys. Act. 2015, 12, 1–9. [Google Scholar] [CrossRef]
  59. Slade, P. If you build it, will they eat it? Consumer preferences for plant-based and cultured meat burgers. Appetite 2018, 125, 428–437. [Google Scholar] [CrossRef]
  60. Van Loo, E.J.; Caputo, V.; Lusk, J.L. Consumer preferences for farm-raised meat, lab-grown meat, and plant-based meat alternatives: Does information or brand matter? Food Policy 2020, 95, 101931. [Google Scholar] [CrossRef]
  61. Rosenfeld, D.L.; Tomiyama, A.J. Gender differences in meat consumption and openness to vegetarianism. Appetite 2021, 166, 105475. [Google Scholar] [CrossRef] [PubMed]
  62. Knaapila, A.; Michel, F.; Jouppila, K.; Sontag-Strohm, T.; Piironen, V. Millennials’ Consumption of and Attitudes toward Meat and Plant-Based Meat Alternatives by Consumer Segment in Finland. Foods 2022, 11, 456. [Google Scholar] [CrossRef] [PubMed]
  63. Vandermoere, F.; Geerts, R.; De Backer, C.; Erreygers, S.; Van Doorslaer, E. Meat consumption and vegaphobia: An exploration of the characteristics of meat eaters, vegaphobes, and their social environment. Sustainability 2019, 11, 3936. [Google Scholar] [CrossRef]
  64. Nguyen, T.C.; Le, H.T.; Nguyen, H.D.; Ngo, M.T.; Nguyen, H.Q. Examining ordering effects and strategic behaviour in a discrete choice experiment. Econ. Anal. Policy 2021, 70, 394–413. [Google Scholar] [CrossRef]
  65. Day, B.; Bateman, I.J.; Carson, R.T.; Dupont, D.; Louviere, J.J.; Morimoto, S.; Scarpa, R.; Wang, P. Ordering effects and choice set awareness in repeat-response stated preference studies. J. Environ. Econ. Manag. 2012, 63, 73–91. [Google Scholar] [CrossRef]
  66. Scheufele, G.; Bennett, J. Response Strategies and Learning in Discrete Choice Experiments. Environ. Resour. Econ. 2012, 52, 435–453. [Google Scholar] [CrossRef]
  67. Carlsson-Kanyama, A.; González, A.D. Potential contributions of food consumption patterns to climate change. Am. J. Clin. Nutr. 2009, 89, 1704–1709. [Google Scholar] [CrossRef]
  68. Rouhani, M.H.; Salehi-Abargouei, A.; Surkan, P.J.; Azadbakht, L. Is there a relationship between red or processed meat intake and obesity? A systematic review and meta-analysis of observational studies. Obes. Rev. 2014, 15, 740–748. [Google Scholar]
  69. Postma, A.P. Ecologische Voetafdruk—Betekenis en Bruikbaarheid. 2000. Available online: https://research.rug.nl/en/publications/ecologische-voetafdruk-betekenis-en-bruikbaarheid (accessed on 6 April 2022).
Figure 1. Stages for the construction of the DCE and conducting the survey.
Sustainability 15 15688 g001
Figure 2. Estimates of the average M e a t s u b s t i t u t e coefficient by age for female (left panel) and male (right panel) respondents with a primary/secondary education level, an omnivorous diet, and average scores for the attitudinal factors. The dashed lines give point-wise 95% confidence intervals of the estimates.
Sustainability 15 15688 g002
Figure 3. Estimates of the average M e a t s u b s t i t u t e coefficient by attitudinal factors for female respondents of an average age with a primary/secondary education level and an omnivorous diet while holding the scores of non-varying attitudinal factors at an average level. The dashed lines give point-wise 95% confidence intervals of the estimates.
Sustainability 15 15688 g003
Table 1. Attributes and their levels.
AttributeAttribute Levels for MeatAttribute Levels for Meat Substitutes
Price (EUR/500 g)5, 6, 74, 6, 10
Taste (rating)61, 3, 5
Organic labelNo, EU Organic labelNo, EU Organic label
Appearance (rating )61, 3, 5
Ecological footprint (kgCO2e )4, 13, 202, 3.5, 6
Saturated fat (%)2, 5, 81, 5, 15
Notes: (i) The rating for taste and appearance is coded as follows: 1 = tastes (looks) completely different from meat, 3 = tastes (looks) a bit like meat, 5 = tastes (looks) almost completely like meat, and 6 = tastes (looks) completely like meat. (ii) The measurement unit kgCO2e is kilograms of carbon dioxide equivalent associated with the production of 1 kg of meat/meat substitute.
Table 2. Versions of the choice tasks.
Color CodingAdditional Information (between Choice Set 6 and 7)
NoYes
NoVersion 1Version 3
YesVersion 2Version 4
Table 3. Socio-economic composition and eating habits of respondents.
CharacteristicRespondents (%)CharacteristicRespondents (%)
Gender Employment status
 Male55 (33.95) Self-employed17 (10.49)
 Female107 (66.05) White-collar79 (48.77)
Age groups  Blue-collar9 (5.56)
 18–2595 (58.64) Student53 (32.72)
 26–3516 (9.88) Retired4 (2.47)
 36–458 (4.94)Current diet
 46–5529 (17.9) Omnivore104 (64.2)
 56–6511 (6.79) Flexitarian41 (25.31)
 66+3 (1.85) Vegetarian15 (9.26)
Education level  Vegan2 (1.23)
 Primary education1 (0.62)Weekly meat eating habit
 Secondary education31 (19.14) Never15 (9.26)
 Higher education (not university)71 (43.83) Less than once a week15 (9.26)
 University57 (35.19) Once or twice a week33 (20.37)
 Ph.D.2 (1.23) Most days99 (61.11)
Net family income (in € per month) Ever bought a meat substitute?
 0–100010 (6.17) Yes120 (74.07)
 1000–200022 (13.58) No42 (25.93)
 2000–300031 (19.14)Why not?
 3000–400024 (14.81) Too expensive4 (7.27)
 4000–500021 (12.96) Doesn’t look appealing20 (36.36)
 5000–600013 (8.02) Doesn’t seem healthy1 (1.82)
 6000+15 (9.26) I don’t know how to put it into a recipe12 (21.82)
 No answer26 (16.05) I won’t like the taste9 (16.36)
 Others9 (16.36)
Table 4. Parameter estimates for mixed logit model.
AttributeMean (s.e.)St. Dev. (s.e.)
Effect of attributes on preference
for meat and meat substitutes
Price−0.767 ***0.236 ***
(0.135)(0.043)
Taste0.603 ***0.581 ***
(0.059)(0.057)
Organic0.553 ***0.313
(0.116)(0.269)
Appearance0.116 **0.186 ***
(0.042)(0.054)
Ecofootprint−0.069 ***0.064 **
(0.02)(0.023)
Fat−0.068 ***0.131 ***
(0.017)(0.017)
Impact of extra information and color
coding on the effect of the attributes
Ecofootprint × Info0.0420.019
(0.037)(0.07)
Ecofootprint × Color−0.055 *0.049
(0.025)(0.033)
Ecofootprint × Info × Color−0.0290.057
(0.042)(0.062)
Fat × Info−0.0250.035
(0.034)(0.065)
Fat × Color−0.078 **0.013
(0.024)(0.052)
Fat × Info × Color0.0230.061
(0.045)(0.043)
Alternative specific constantsOptout−11.519 ***4.395 ***
(1.378)(0.751)
Meatsubstitute−5.711 ***0.648
(1.06)(0.366)
Impact of extra information and color
coding on preference for meat substitutes
Meatsubstitute × Info1.493 ***0.766
(0.341)(0.528)
Meatsubstitute × Color−0.230.034
(0.297)(0.86)
Meatsubstitute × Price0.444 **0.133 ***
(0.143)(0.04)
Effect of personal charactersticsMeatsubstitute × Age−1.002 ***0.903 *
(0.167)(0.435)
Meatsubstitute × Gender(Male)1.023 ***1.102 *
(0.241)(0.5)
Meatsubstitute × Educ (higher)0.923 *1.241 *
(0.385)(0.554)
Meatsubstitute × Educ (university)0.761 *0.373
(0.381)(0.63)
Meatsubstitute × Diet(flexitarian)1.623 ***0.249
(0.267)(0.679)
Meatsubstitute × Diet(vegetarian)10.782 ***7.927 **
(2.105)(2.438)
Meatsubstitute × NEP1.034 ***0.104
(0.152)(0.443)
Meatsubstitute × Health0.1070.705
(0.15)(0.37)
Meatsubstitute × Convenience0.0110.185
(0.11)(0.359)
Meatsubstitute × Ethical0.0981.805 ***
(0.147)(0.294)
Meatsubstitute × Weight_Control0.559 ***0.069
(0.132)(0.523)
LL: −1222.4AIC: 2556.72
Notes: (i) The analysis was conducted using 1944 observations (162 persons who took 12 choice sets). (ii) */ **/ *** denotes significance at the 5%/1%/0.1% level.
Disclaimer/Publisher’s Note: The statements, opinions and data contained in all publications are solely those of the individual author(s) and contributor(s) and not of MDPI and/or the editor(s). MDPI and/or the editor(s) disclaim responsibility for any injury to people or property resulting from any ideas, methods, instructions or products referred to in the content.

