Article

Research on Microclimate-Suitable Spatial Patterns of Waterfront Settlements in Summer: A Case Study of the Nan Lake Area in Wuhan, China

1
School of Civil Engineering, Architecture and Environment, Hubei University of Technology, Wuhan 430068, China
2
Key Laboratory of Health Intelligent Perception and Ecological Restoration of River and Lake, Ministry of Education, Hubei University of Technology, Wuhan 430068, China
3
College of Design and Engineering, National University of Singapore, Singapore 117566, Singapore
4
School of Urban Construction, Wuhan University of Science and Technology, Wuhan 430081, China
*
Author to whom correspondence should be addressed.
Sustainability 2023, 15(22), 15687; https://doi.org/10.3390/su152215687
Submission received: 24 September 2023 / Revised: 21 October 2023 / Accepted: 4 November 2023 / Published: 7 November 2023

Abstract

:
As China’s urbanization progresses, thermal environmental problems such as the overheating effect experienced by cities are becoming more and more obvious in the daily lives of residents. Urban waterfront spaces not only create pleasant landscape environments and regulate microclimates, but also help to maintain ecological diversity. However, the current high-density urban construction model has led to poor air mobility and weakened water regulation functions in cities. Therefore, the rationalization of the spatial form of settlements has become particularly important in recent times. In this study, the Nan Lake area of Wuhan City was taken as the research object, and it was simulated using ENVI-met (5.5.1) software. Further, the orthogonal experimental design method was combined with the extremum difference analysis method. This study focused on the effects of the layout form (LF), floor area ratio (FAR), green form (GF), and offshore distance (OD) on the temperature (T), relative humidity (RH), and thermal comfort in waterfront settlements in summer. This study found that (1) among the various factors, the effect of the GFs and LFs on the overall microclimate of the study region was the most significant, while the volume ratio had the least significant effect on each indicator. (2) The parallel layout form was found to have better ventilation effects compared to the other three layout forms, with its cooling and humidifying effects being superior. (3) Among the four types of greening combinations, the combination of “grass + shrubs” had the best cooling effect at the height of pedestrians, while trees were able to reduce the heat transfer of solar radiation to the ground due to the shading and evaporation effects provided by their canopies. (4) The cooling and humidifying effects provided by the water body of Nan Lake gradually diminished as the distance from its shore increased; therefore, waterfront settlements maintaining a reasonable proximity to their water bodies will help bring into play the microclimate adjustment effect of such bodies. This study provides a valuable reference for the construction and renewal of urban waterfront settlements in the hot summer and cold winter zones of China (HSCW).

1. Introduction

According to the World Meteorological Organization (WMO), the average global temperature has risen by more than 1.15 °C since the 1850s [1], and this prolonged warming has led to an increase in uncomfortable weather conditions. Due to global climate change and the development of global urbanization levels, urban overheating has become a typical problem in urban construction, with an important impact on urban comfort, energy use, and people’s health [2,3,4,5].
As independent ecosystems in cities, water bodies maintain the balance of regional ecological diversity and play a crucial role in mitigating the urban heat island effect [6,7,8]. Urban waterfronts are often the most attractive areas in a city due to their waterfront attractiveness, landscapes, and livability, and their surrounding thermal environment has been the focus of many scholars’ attention. However, changes in the thermal environment around a water body are very complex, being influenced by a combination of factors, including the water body itself and the sub-surface [9]. Therefore, how to improve the microclimate of waterfront settlements through integrated design and planning has become a central concern of scholars in various countries.
Existing studies have shown that water bodies have a significant moderating effect on their urban thermal environment, whether they are lakes, rivers, wetlands, ponds, fountains, etc.; these types of water bodies do, however, have different degrees of influence on their surrounding thermal environment. Waterfront spaces are an important part of city spaces, which are currently divided into six categories: commerce; entertainment and recreation; culture, education, and environment; history; residential and public transportation; and port facilities [10]. To provide such spaces, waterfront settlements are becoming more and more favored and increasing in number due to their waterfront attractiveness, landscapes, and livability. Having physical properties such as a high heat capacity and a high latent heat of evaporation, bodies of water are often considered to be the best natural source of urban open-air cooling in summer. As areas adjacent to water bodies, waterfront residential areas are directly impacted by these bodies, so the microclimate of waterfront settlements has gradually become a hot research topic.

2. Literature Review

2.1. Cooling Effect of Water Bodies

In a review of the relevant literature on the impact of water bodies on the microclimate of waterfront settlements, the intensity of the cooling effect of a water body was found to be intrinsically correlated with the width of the water body and the shape of the river bank. Fei et al. [11] took the thermal environment of waterfront spaces in Tianjin as their research object, and through a quantitative analysis of the microclimate of four typical waterfront spaces in Tianjin, it was found that the most economical water body width was 70–80 m, and that the cooling effect of a water body was able to be significantly improved when the geometry of a given water body along the shoreline was in the form of an S shape. Similarly, Hongyu et al. [12] found that the cooling provided by a body of water can vary according to its geometry, with lakes exhibiting greater cooling than rivers.
In addition, some researchers have focused on the global impacts of water bodies on urban climate, such as Chen et al. [13], who investigated the influence of river wind on the microclimate of waterfront settlements along the Yangtze River in the Wuhan area and also explored the influence of water changes on the urban climate by numerical analysis that used data on changes of the urban waters of Wuhan city in the past 40 years. Similarly, Li et al. [14] used a numerical simulation to study the microclimate effect of water bodies in cities, and Wang [15] conducted mobile measurements near the Yangtze River in Wuhan during the summer months. That study examined the river cooling effect, determined thresholds for cooling and humidification distances using a third-order polynomial approach, assessed coastal heat stress at the pedestrian level, and investigated the impact of the coastal built environment using stepwise regression analysis.
It can be seen that the current research on the factors affecting the cooling effect of water bodies has mainly focused on the width, area, shape, and dominant wind direction of such bodies [16,17]. These studies provide an important basis for further optimizing the transformation and design of urban waterfront spaces.

2.2. Effect of Blue–Green Synergistic Cooling

In recent years, as waterfront space microclimate research has increased, the blue–green space wind synergistic cooling effect has gradually become the focus of many scholars. Urban green infrastructure (UGI) and urban blue spaces (UBS) are nature-based elements of urban land use that play an integral role in improving the urban thermal environment. A growing body of research suggests that waterfront green spaces can help create a cooling effect, thereby mitigating the urban heat island effect [18,19,20]. For instance, in Chongqing, a typical hot and humid city in China, a study found that the synergistic cooling effect of a blue–green space in the range of 7–12 m was the most obvious, with an average cooling amplitude recorded that was 3.3 °C higher than the sum of the cooling effects of water and plants alone [21]. Meanwhile, the literature suggests that the cooling effect of UGI is strongly influenced by the type of vegetation, green areas, and spatial distribution [22], while the cooling effect of UBS is strongly influenced by the wind direction, wind speed, water body areas, and building layouts [23]. These studies provide useful information for further optimizing waterfront urban planning and blue–green space design.

2.3. Thermal Comfort in Waterfront Spaces

In related studies on thermal comfort in waterfront spaces, it can be found that human thermal comfort is closely related to microclimate changes. In recent years, the number of studies on outdoor thermal comfort in various climatic environments has increased. For instance, Manat Srivanit et al. [24] conducted microclimate simulations using ENVI-met for 192 design scenarios of a waterfront villa area in a Bangkok suburb, exploring the impacts of different residential layout designs, building geometries, and green forms on outdoor thermal comfort in the suburb. Xu et al. [25] analyzed the effects of water bodies, vegetation, and wind conditions on temperature and humidity in the waterfront area of Sand Lake in Huang Xing Park, Shanghai, through on-site measurements and summer high-temperature index calculations, and found that the water bodies were able to effectively improve human comfort in the zones along the shoreline during the hottest period of the summer, with the area 10–20 m from the water’s edge showing the greatest improvement in thermal comfort. Meanwhile, Fei et al. [26] used a combination of subjective and objective analysis and a software model simulation to evaluate the thermal environment of different types of microscale waterfront settlements. Additionally, the objective effects of different waterfront distances on thermal comfort, as measured by the heat index (HI), were quantified, and a subjective evaluation of the universal thermal climate index (UTCI) was carried out. That study showed that appropriate green cover and vegetation types can form a coupling mechanism between waterfront green spaces and thermal evaluation criteria. These studies provide important theoretical support for the thermal comfort design of waterfront spaces.

2.4. Impact of Spatial Patterns on Microclimates

In the study of spatial morphology, scholars have analyzed cities and urban settlements in depth, mainly from a meso–micro scale perspective. Some of these studies have focused on the impact of morphological indicators, such as urban planning strategies, building compactness, and spatial layout patterns of settlements on microclimates. A study by Jang [27] focused on the microclimatic impacts of three strategies commonly used in the development of high-density waterfront settlements in Seoul, Korea, and modeled and compared the microclimates of these settlements under different strategies through ENVI-met. Meanwhile, Xu [28] analyzed the correlation in Wuhan between air temperature and four morphological indicators, namely building density (BD), vegetation coverage (VC), the floor to area ratio (FAR), and the sky view fraction (SVF). Further, Wang [29] compared the differences in the microclimate characteristics of five settlements in Luoyang City with different architectural spatial layouts and concluded that different architectural designs and spatial layouts have an important impact on the environmental microclimate characteristics of settlements. These studies provide useful references for optimizing urban planning and settlement design.
In summary, research on the microclimates of settlements has been fruitful. A review of the literature revealed that two main methods, field measurements and software simulations, have been used in previous studies. Most researchers have focused their questions on these areas: (1) the water body cooling effect, (2) the effect of blue–green synergistic cooling, (3) thermal comfort in waterfront spaces and (4) the impact of spatial patterns on microclimates. However, these studies are less concerned with systematic relationships between micro-scale spatial form factors and microclimates, and they lack significant analyses of the effects of spatial form factors on microclimates and thermal comfort. Therefore, in order to explore the issue of how the spatial form factors of waterfront settlements affect surrounding microclimates and outdoor thermal comfort, this study took the South Lake area of Wuhan as its research object and adopted a hybrid method combining orthogonal tests and software simulation in order to identify and analyze the key factors affecting the microclimates and human comfort of waterfront settlements. By analyzing the influence of various typical waterfront settlements’ spatial patterns on the effect of microclimate regulation, we aimed to provide reference values for improving the construction and planning of waterfront settlements in the HSCW zone.
This study consists of five main parts. In the first part, the context of the current study is analyzed. In the second, the research results of local and international scholars are reviewed, and the objective and purpose of this study are clarified. In the third, taking Wuhan Nan Lake Area as an example, the various factors affecting the microclimates and human comfort of waterfront settlements in the HSCW zone are clarified by employing an orthogonal experimental method and software simulation to study the waterfront settlements in the HSCW zone, including LF, FAR, GF, and the distance from the shore. In the fourth, the longitudinal and transverse distribution patterns of the microclimate data of each scheme are analyzed, and the quantitative relationship between the influencing factors and the human comfort and microclimates of the settlements is established. Further, this section explores the significance of the primary and secondary relationships between the influence of each factor on human thermal comfort and the T and RH, as well as the degrees of their influence. In the fifth part, the results of the analysis are summarized and discussed.

3. Methodology and Study Area

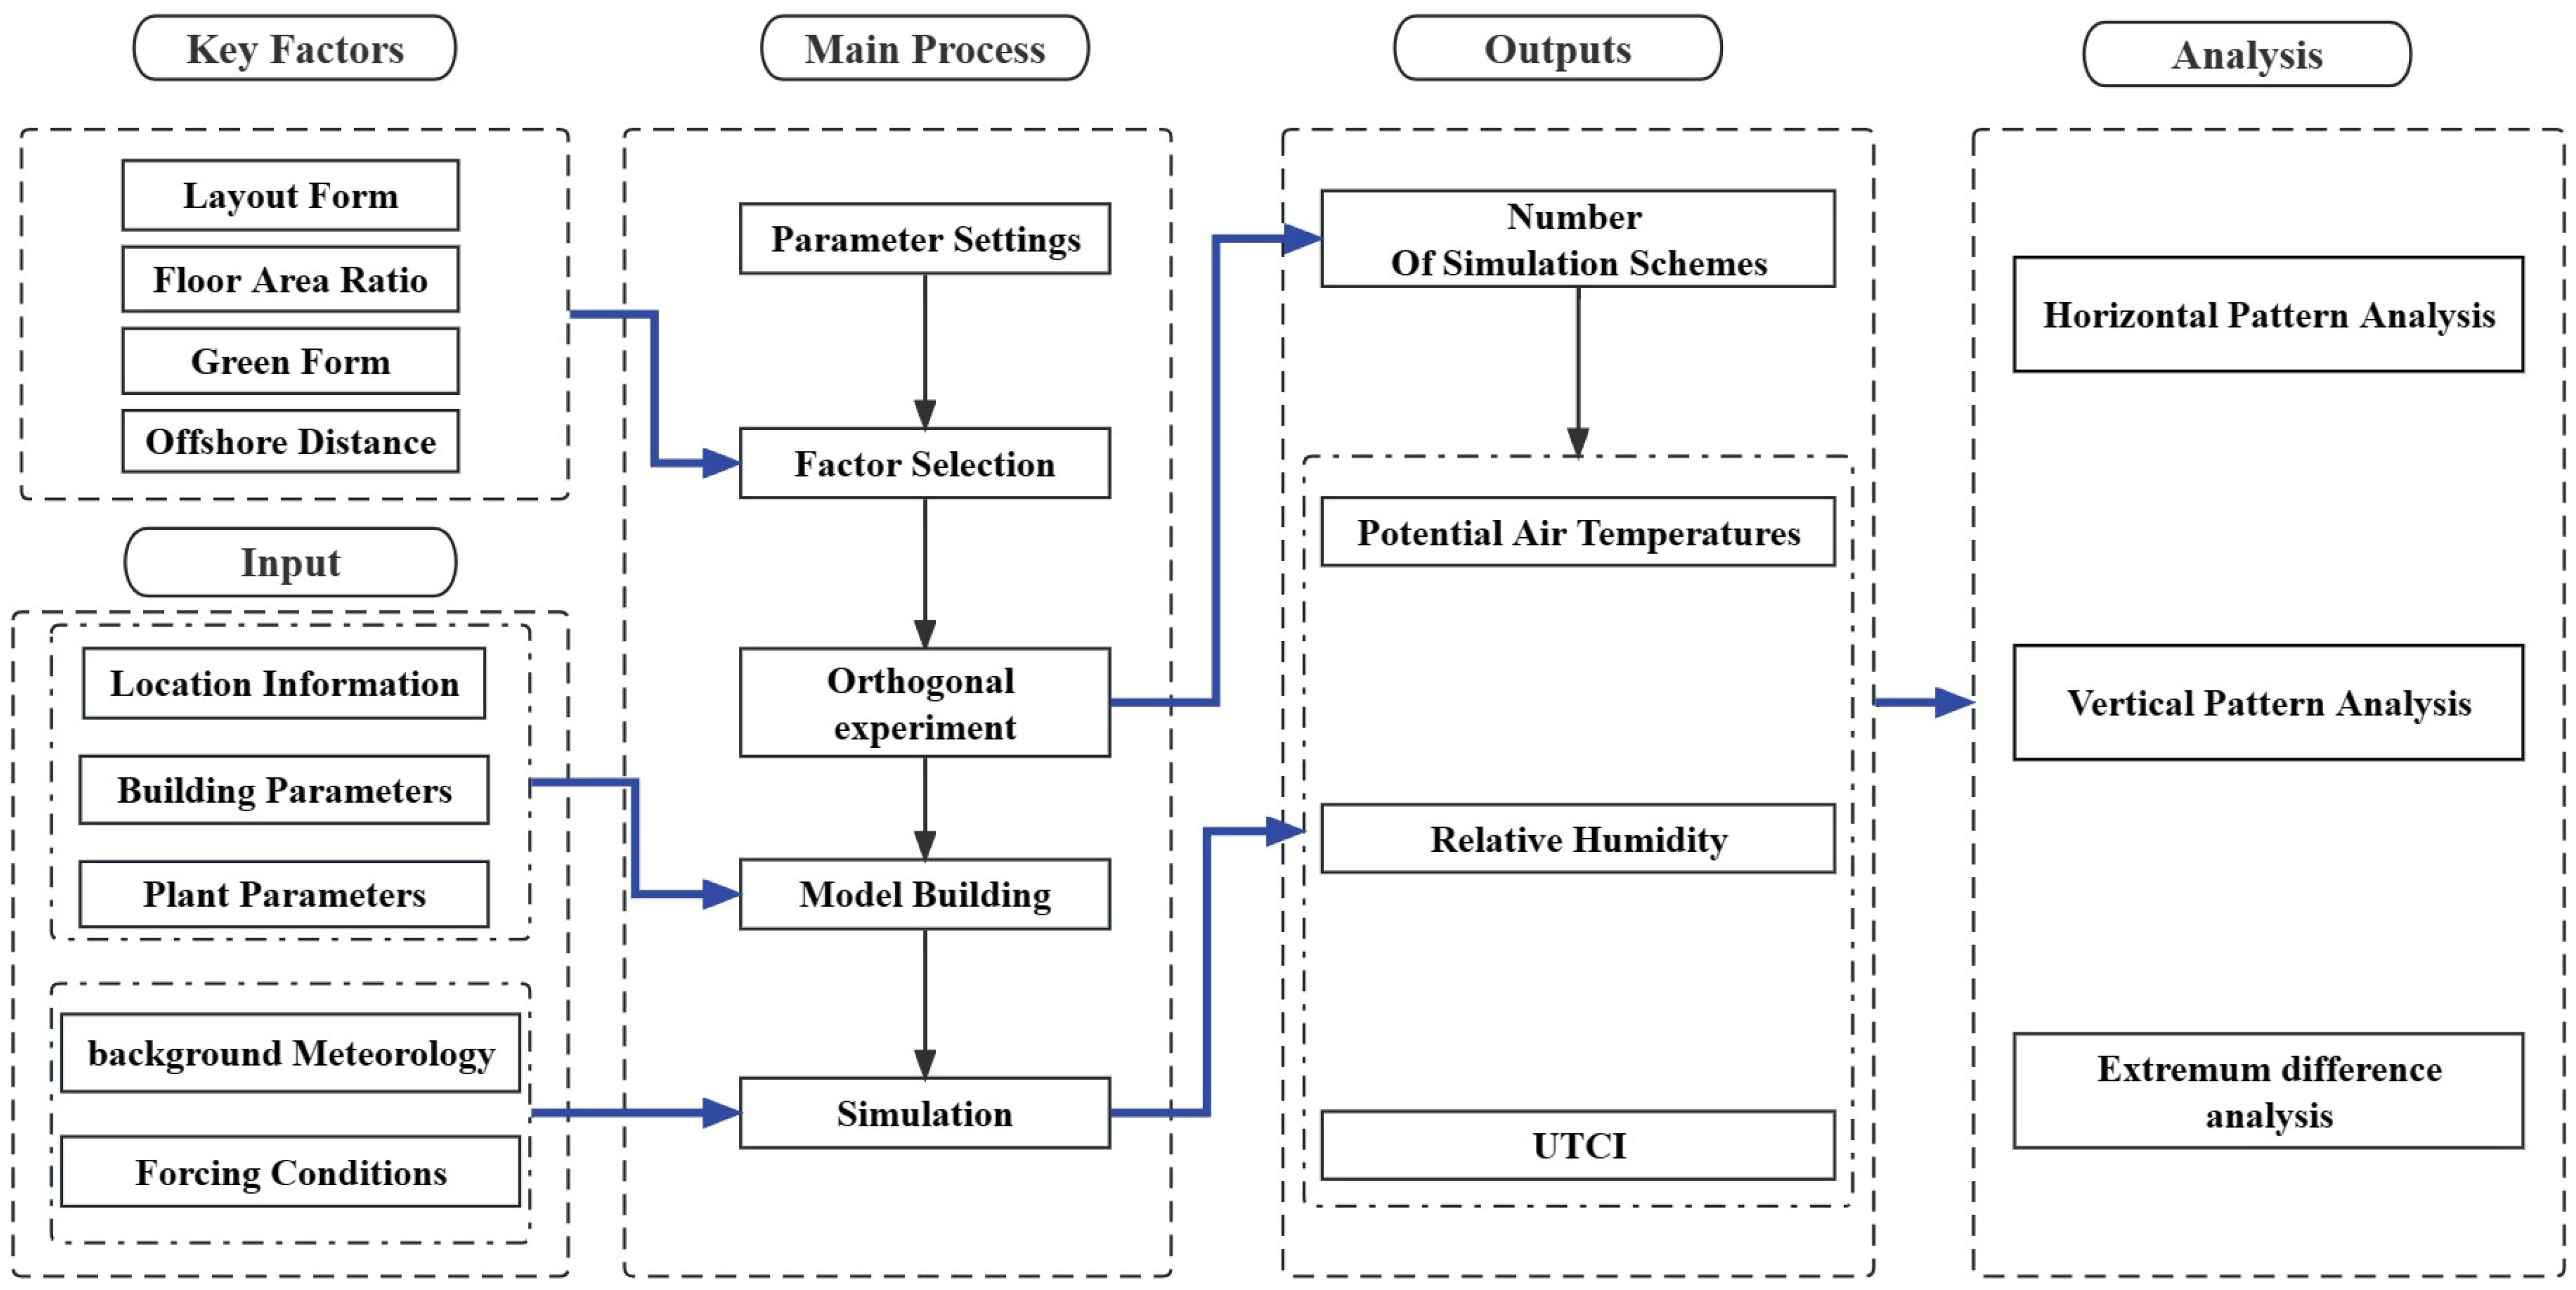
3.1. Research Method

The research of this study was divided into five main steps. In step 1, field research was conducted on the study sample, and relevant information on the settlements was collected. In step 2, the research data and key factors were extracted while relevant norms and standards were adhered to. In step 3, the levels for each influencing factor were determined, and orthogonal experiments were conducted in order to obtain the number of simulation scenarios. In step 4, based on the results of the orthogonal experiments, ENVI-met was applied to model typical settlements. In step 5, a simulation was performed using ENVI-met in order to output the microclimate and thermal comfort results for each scenario, and the results were analyzed. The specific research methodology is shown in Figure 1.
This study conducted field research in the Nan Lake area of Wuhan. During a previous visit, 32 neighborhoods around the Nan Lake were investigated, and basic information on the number of building floors, main LF, building orientation (BO), green rate (GR), and FAR of these settlements was obtained. The results are shown in Table 1.
As can be seen from the basic information above, the BO of the settlements in the Nan Lake area was mainly north–south, the buildings in the settlement were predominantly multi-story and high-rise, and most of the monolithic building layouts were panelized.
By analyzing the layout and architectural forms of these settlements, four typical settlement layout planes were identified: parallel [30], staggered, combined, and enclosed [31]. The classification results are shown in Table 2.
At the same time, using data from the actual research and the relevant provisions of “The Planning and Design Standards for Urban Residential Areas (GB 50180-2018)” [32] on the FAR and green space ratio of multi-story and high-rise residential buildings, as well as by referring to the 2021 “Wuhan City Waterfront and Mountain Area Planning and Management Provisions” [33] on the minimum offshore spacing requirements for waterfront buildings, the LFs of the settlements were horizontally divided into the categories of FAR, GF, and OD, as shown in Table 3. This study adopted an idealized scheme in which the plot ratio was considered as a single non-intersecting factor, i.e., the value of the plot ratio was adjusted by fixing the building spacing and varying the building height, which ultimately enabled the development of a four-factor, four-level orthogonal experiment.
Next, orthogonal experiments were conducted involving these four factors. Since the effect of each factor was relatively independent, the interactions among the factors were not considered. According to the SPSSAU orthogonal experimental table manual, the L16(45) orthogonal experimental table can be used, and the minimum number of simulation schemes needed for factor analysis is 16. The experiments carried out in this study are summarized in Table 4. In these experiments, the height of the grass in the GF was set at 0.25 m, the height of the shrubs was set at 2 m, the height of dwarf trees was set at 4 m, and the height of tall trees was set at 15 m.
According to the results of the above research and analysis, in the settlements model, the ideal length and width of the waterfront settlement site was 530 m × 470 m, the ideal length and width of single buildings was 30 m × 15 m, the ideal spacing between building boundaries and lakes was 50 m, and the ideal spacing between building boundaries and the road was 10 m. Further, the ideal spacing between monolithic buildings was 22.5 m at the face of the hill wall and 26 m at its front and rear. These results are summarized in Table 5. Regarding the four typical spatial layout forms analyzed in the settlement model, we defined a parallel layout as a horizontal and vertical alignment of single buildings, a staggered layout as a staggering of 25 m between the fronts of single buildings, an enclosed layout as the arrangement of single buildings adjacent to each other around the formation of an atrium, and a combined layout as an enclosed arrangement of single buildings.

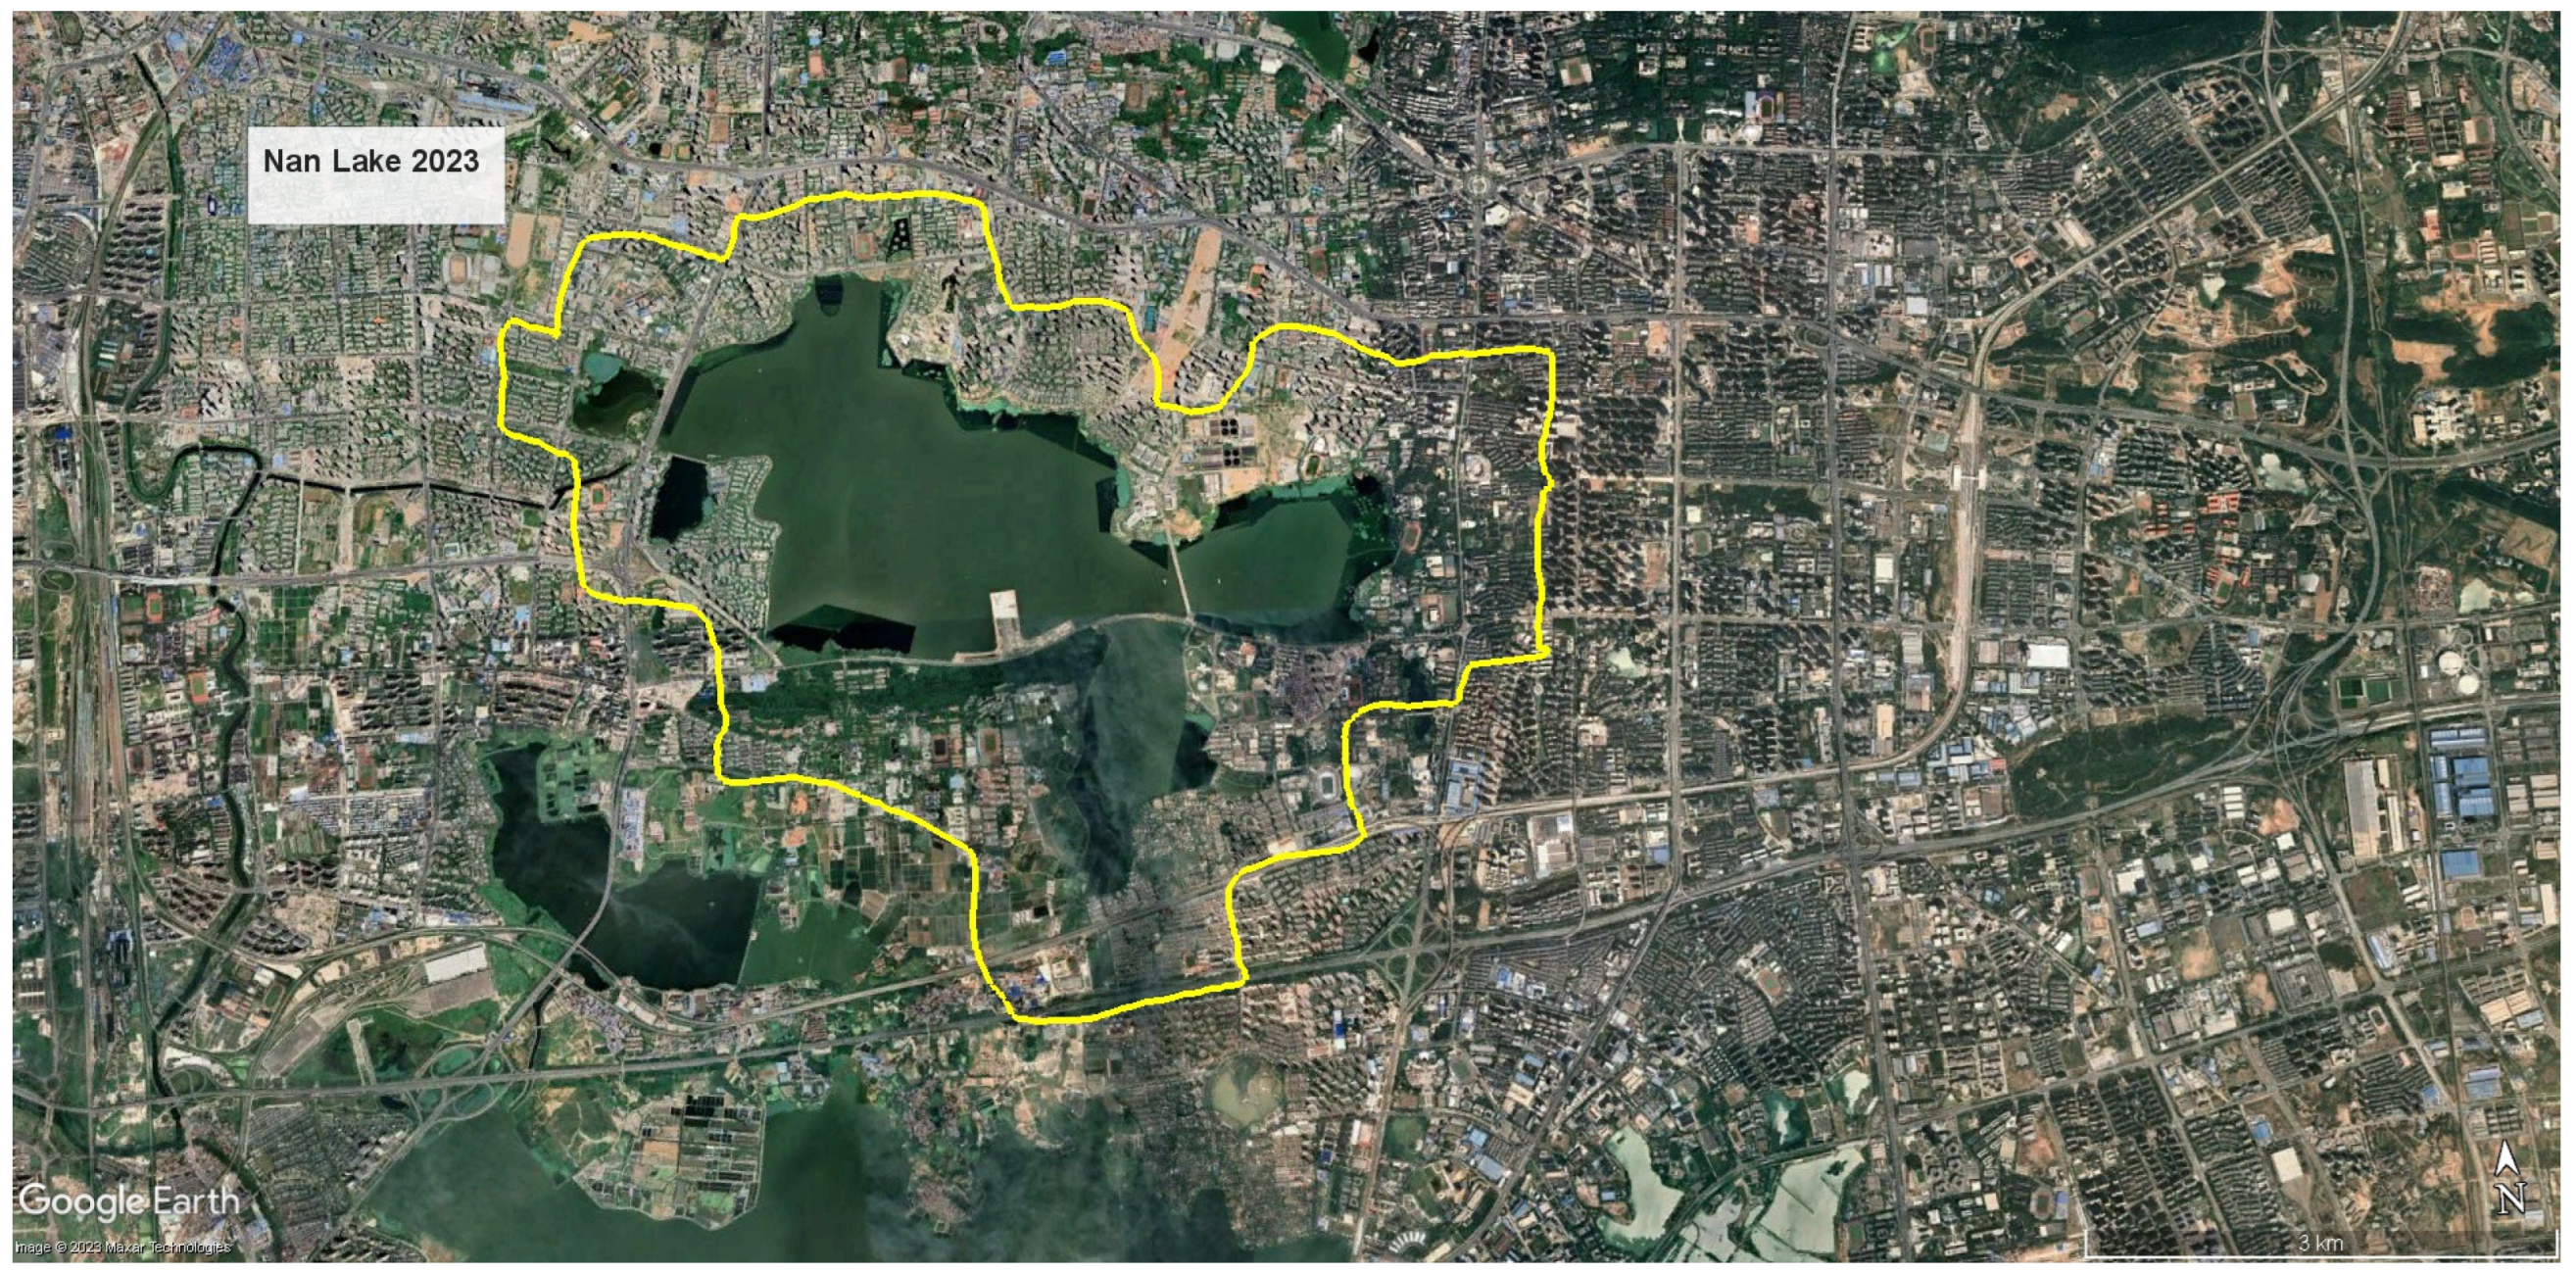
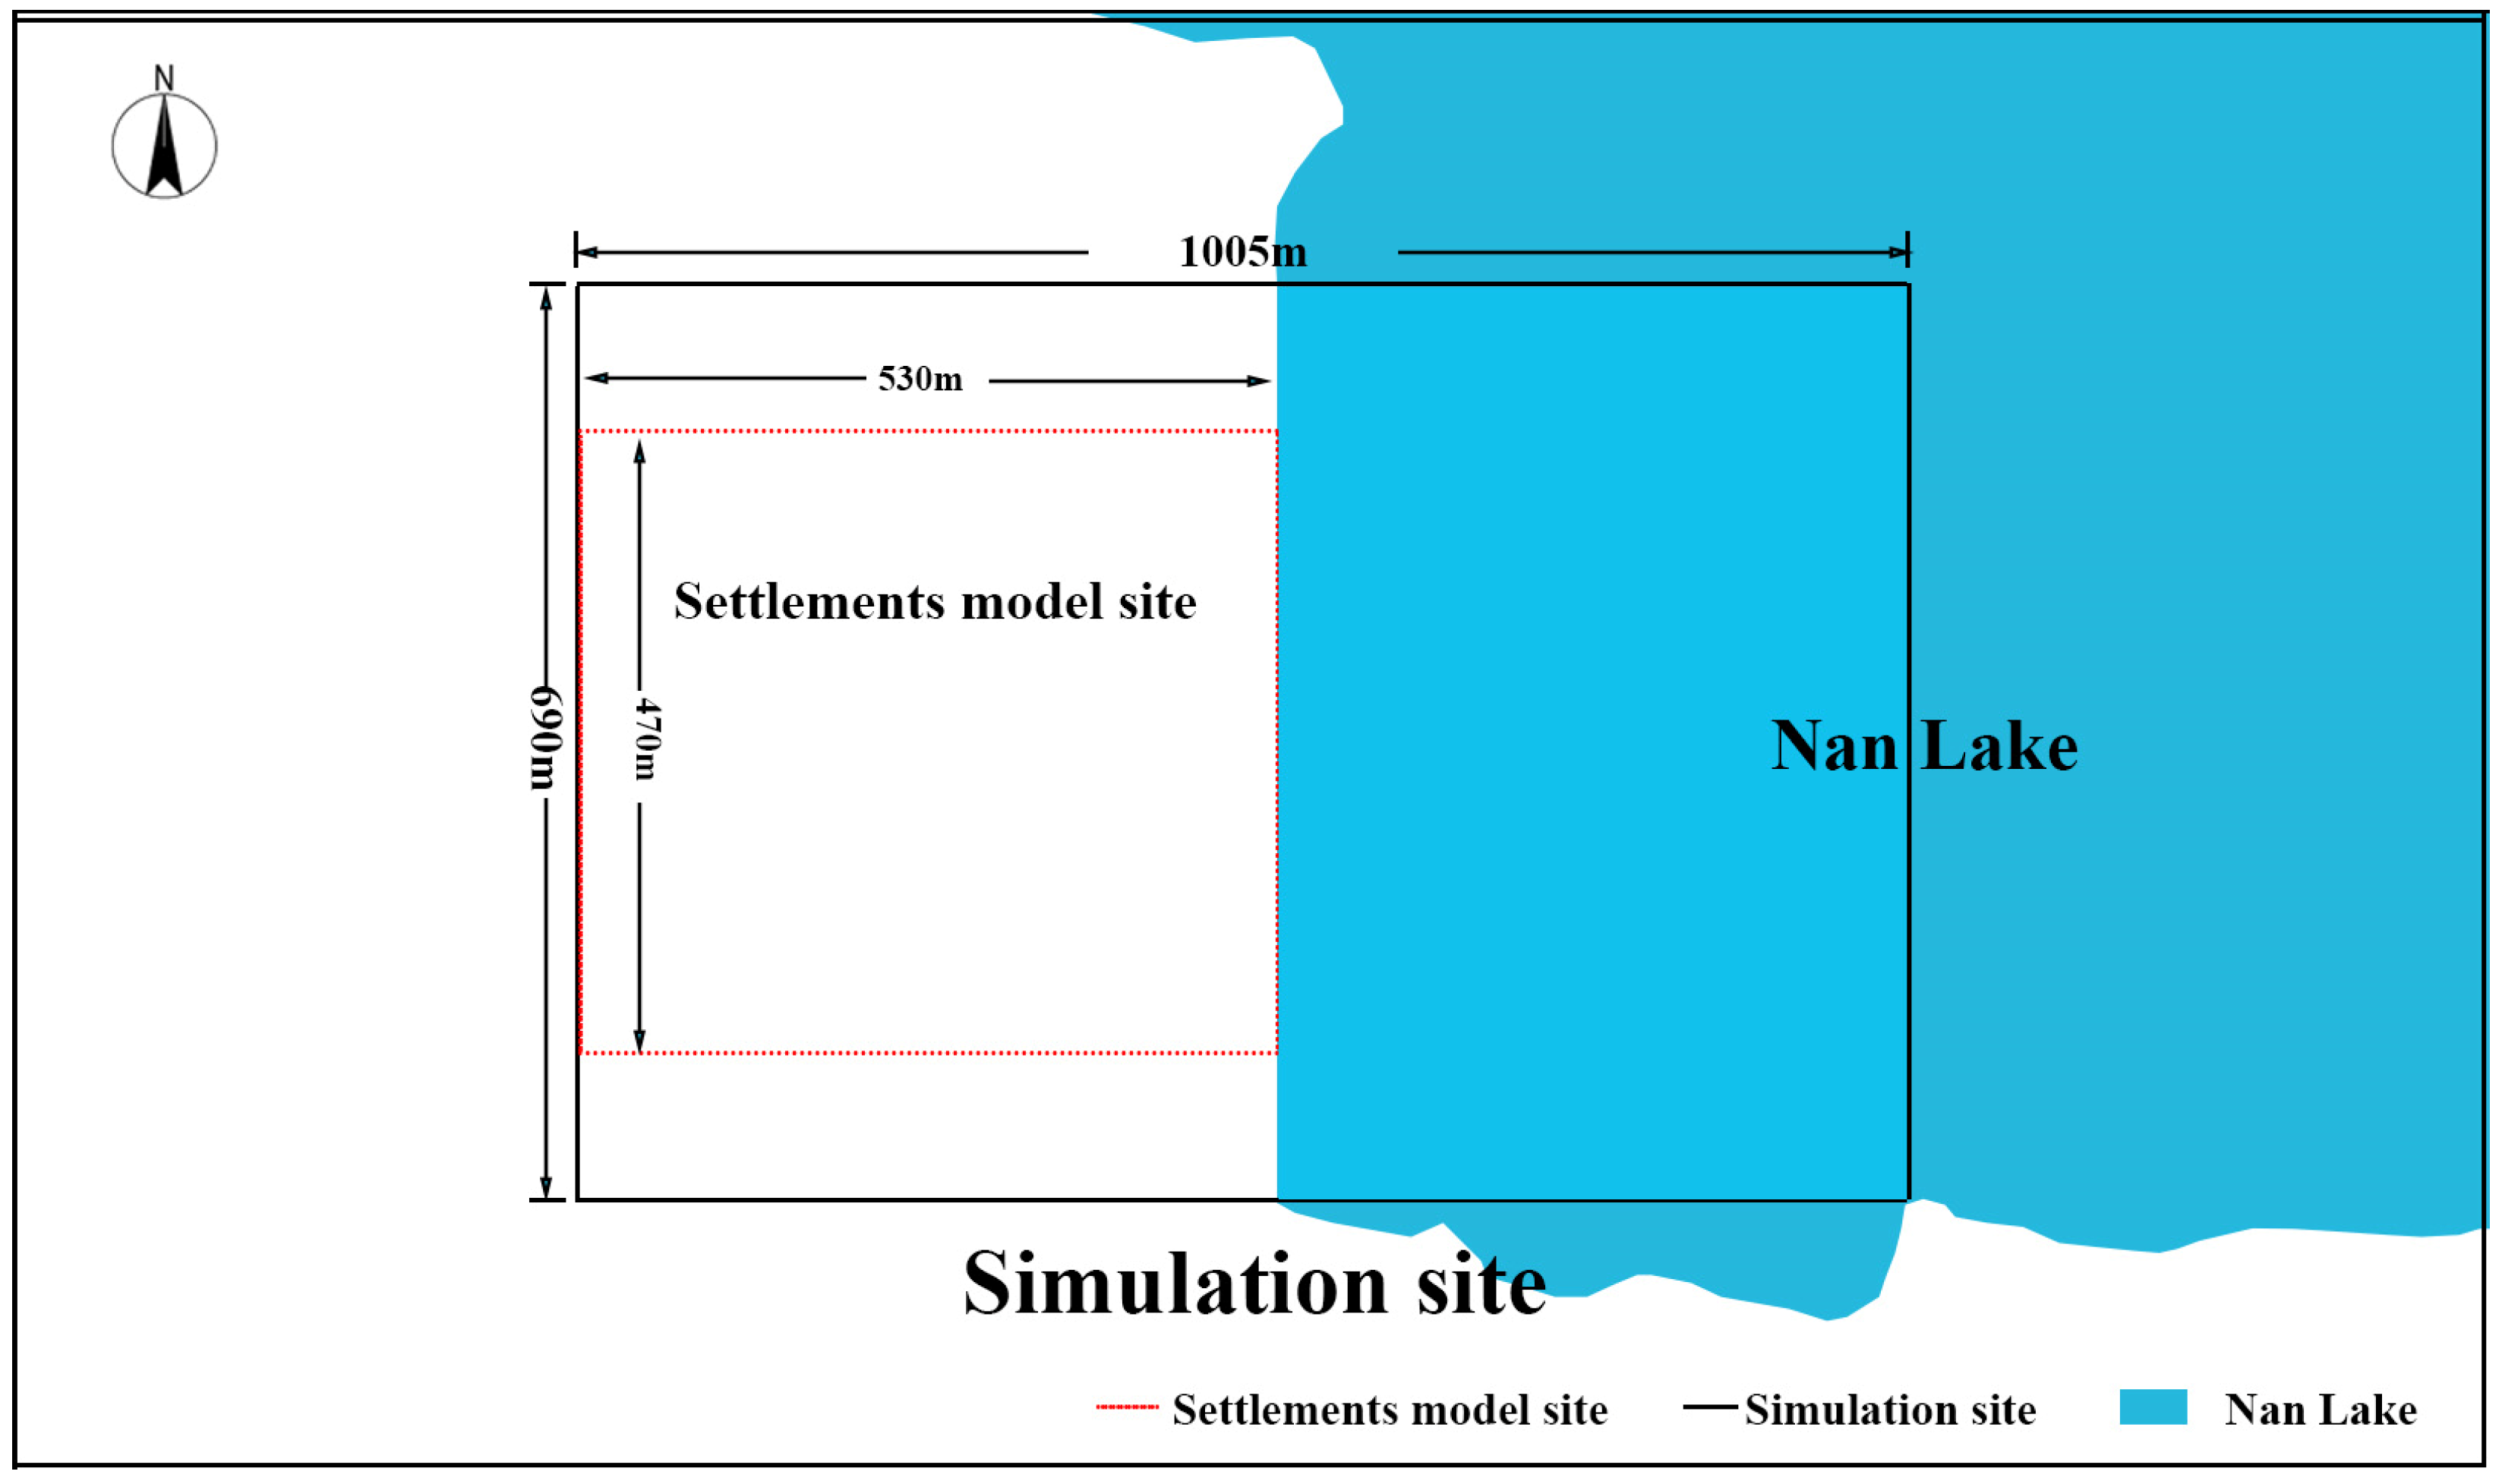
3.2. Study Area and Scoping

Wuhan, located in the HSCW zone, has a subtropical humid monsoon climate. Having many water systems and lakes, it is known as the “City of a Hundred Lakes”. The city’s total surface water area is 2217.6 km2, accounting for 26.1% of the city’s area [34]. The region receives abundant rainfall all year round [35], recording an average annual rainfall of 1320 mm over the past 30 years. Much of this rainfall is concentrated in the months of June–August. Wuhan’s air humidity averages close to 70% throughout the year, and the city enjoys plenty of light, having a total number of hours of sunshine ranging from 1810 to 2100 h throughout the year. These climatic conditions create a typical climate characterized by high temperatures and high humidity, meaning the four seasons are often not clearly distinguished. At the same time, the distribution of light, heat, and precipitation in the region varies considerably, and its seasonal distribution is also uneven, with its summer season starting in May, when temperatures rise sharply, and the height of summer being experienced in mid-July, with the average temperature in the month ranging from 25 °C to 30 °C. Further, the monsoon effect is obvious in Wuhan, whose summer is dominated by southeast winds with an average wind speed of 1.6 m/s [36].
Nan Lake, the third largest urban lake in Wuhan, is located in Hongshan District, and it has a water area of 7.6 square kilometers [37]. The lake, featuring a synthesis of natural and artificial subsurfaces, and its formation, development, and evolution have played an unnoticeable role in shaping the natural and human environments of the surrounding areas. The formation of the water system of Nan Lake has a long history, dating back to the Three Kingdoms period. While there had been changes to its form, only small changes to the lake’s natural state had taken place until 1973, when the planning and development of Wuhan City saw a variety of avenues along the lake begin to be built. Further, the Nan Lake shoreline was transformed from a curved to a straight line. From the very beginning of the use of the lake, its area began to be constantly transformed into agricultural land and land for construction. Excessive development has led to a reduction of the water body area of Nan Lake, the disappearance of several of its water system tributaries, and the gradual weakening of its connection with the Yangtze River [38], which has further led to the occurrence of urban flooding and the deterioration of the microclimate of the surrounding area [39]. As shown in Figure 2, due to the rapid development of urban construction, the area of Nan Lake has been gradually reduced, resulting in a corresponding reduction in the area of the waterfront. In turn, the cooling and regulating effect of the water body on the thermal environment around it has been gradually weakened, aggravating the phenomenon of the urban heat island effect [40,41]. The lake’s waterfront space is a typical case of an urban development that has been neglected, and how to effectively utilize this space in order to improve its surrounding microclimate in the future development of Nan Lake has become an important issue.
Taking the Nan Lake area as an example, this study employed a method of determining the index factors of each spatial form in order to carry out orthogonal experiments and used ENVI-met software to simulate and analyze the schemes employed. This study aimed to analyze the quantitative relationship between the urban waterfront space and urban settlements in the city.
A microclimate is a small-scale climatic environment in the near-surface atmosphere and soil surface layer caused by different tectonic features of a given subsurface, and it specifically refers to an object area within 0.1–1000 m horizontally and 0.1–100 m vertically. In terms of research on urban waterfront spaces, Cao et al. [42] examined the effects of spatial patterns on temperature and wind speed within 0.1 km, 0.2 km, 0.5 km, and 1 km radii, and found that spatial patterns within 0.5 km and 1 km radii are suitable scales for research. Based on the fact that the object of this study was the neighboring area of Wuhan Nan Lake, this study focused on the settlement space within a 0.5 km radius of Nan Lake, as shown in Figure 3.
According to the hierarchical control scale division of the residential area, a 470 m × 530 m plot beside Nan Lake was selected as the study unit (as shown in Figure 4). Using “The Planning and Design Standards for Urban Residential Areas (GB 50180-2018)” [32], reference was made to the maximum net density control index of the residential buildings, the maximum FAR control index, the building spacing index, the number of building floors, and the public green space index within the residential area, as well as the requirements for setting green space at all levels. After combining the results of the field research with the regulatory documents, the impacts of changes in spatial morphology elements on the regional thermal environment of the South Lake waterfront residential area were simulated and analyzed by varying four parameters: FAR (building height), LF, GF, and OD.

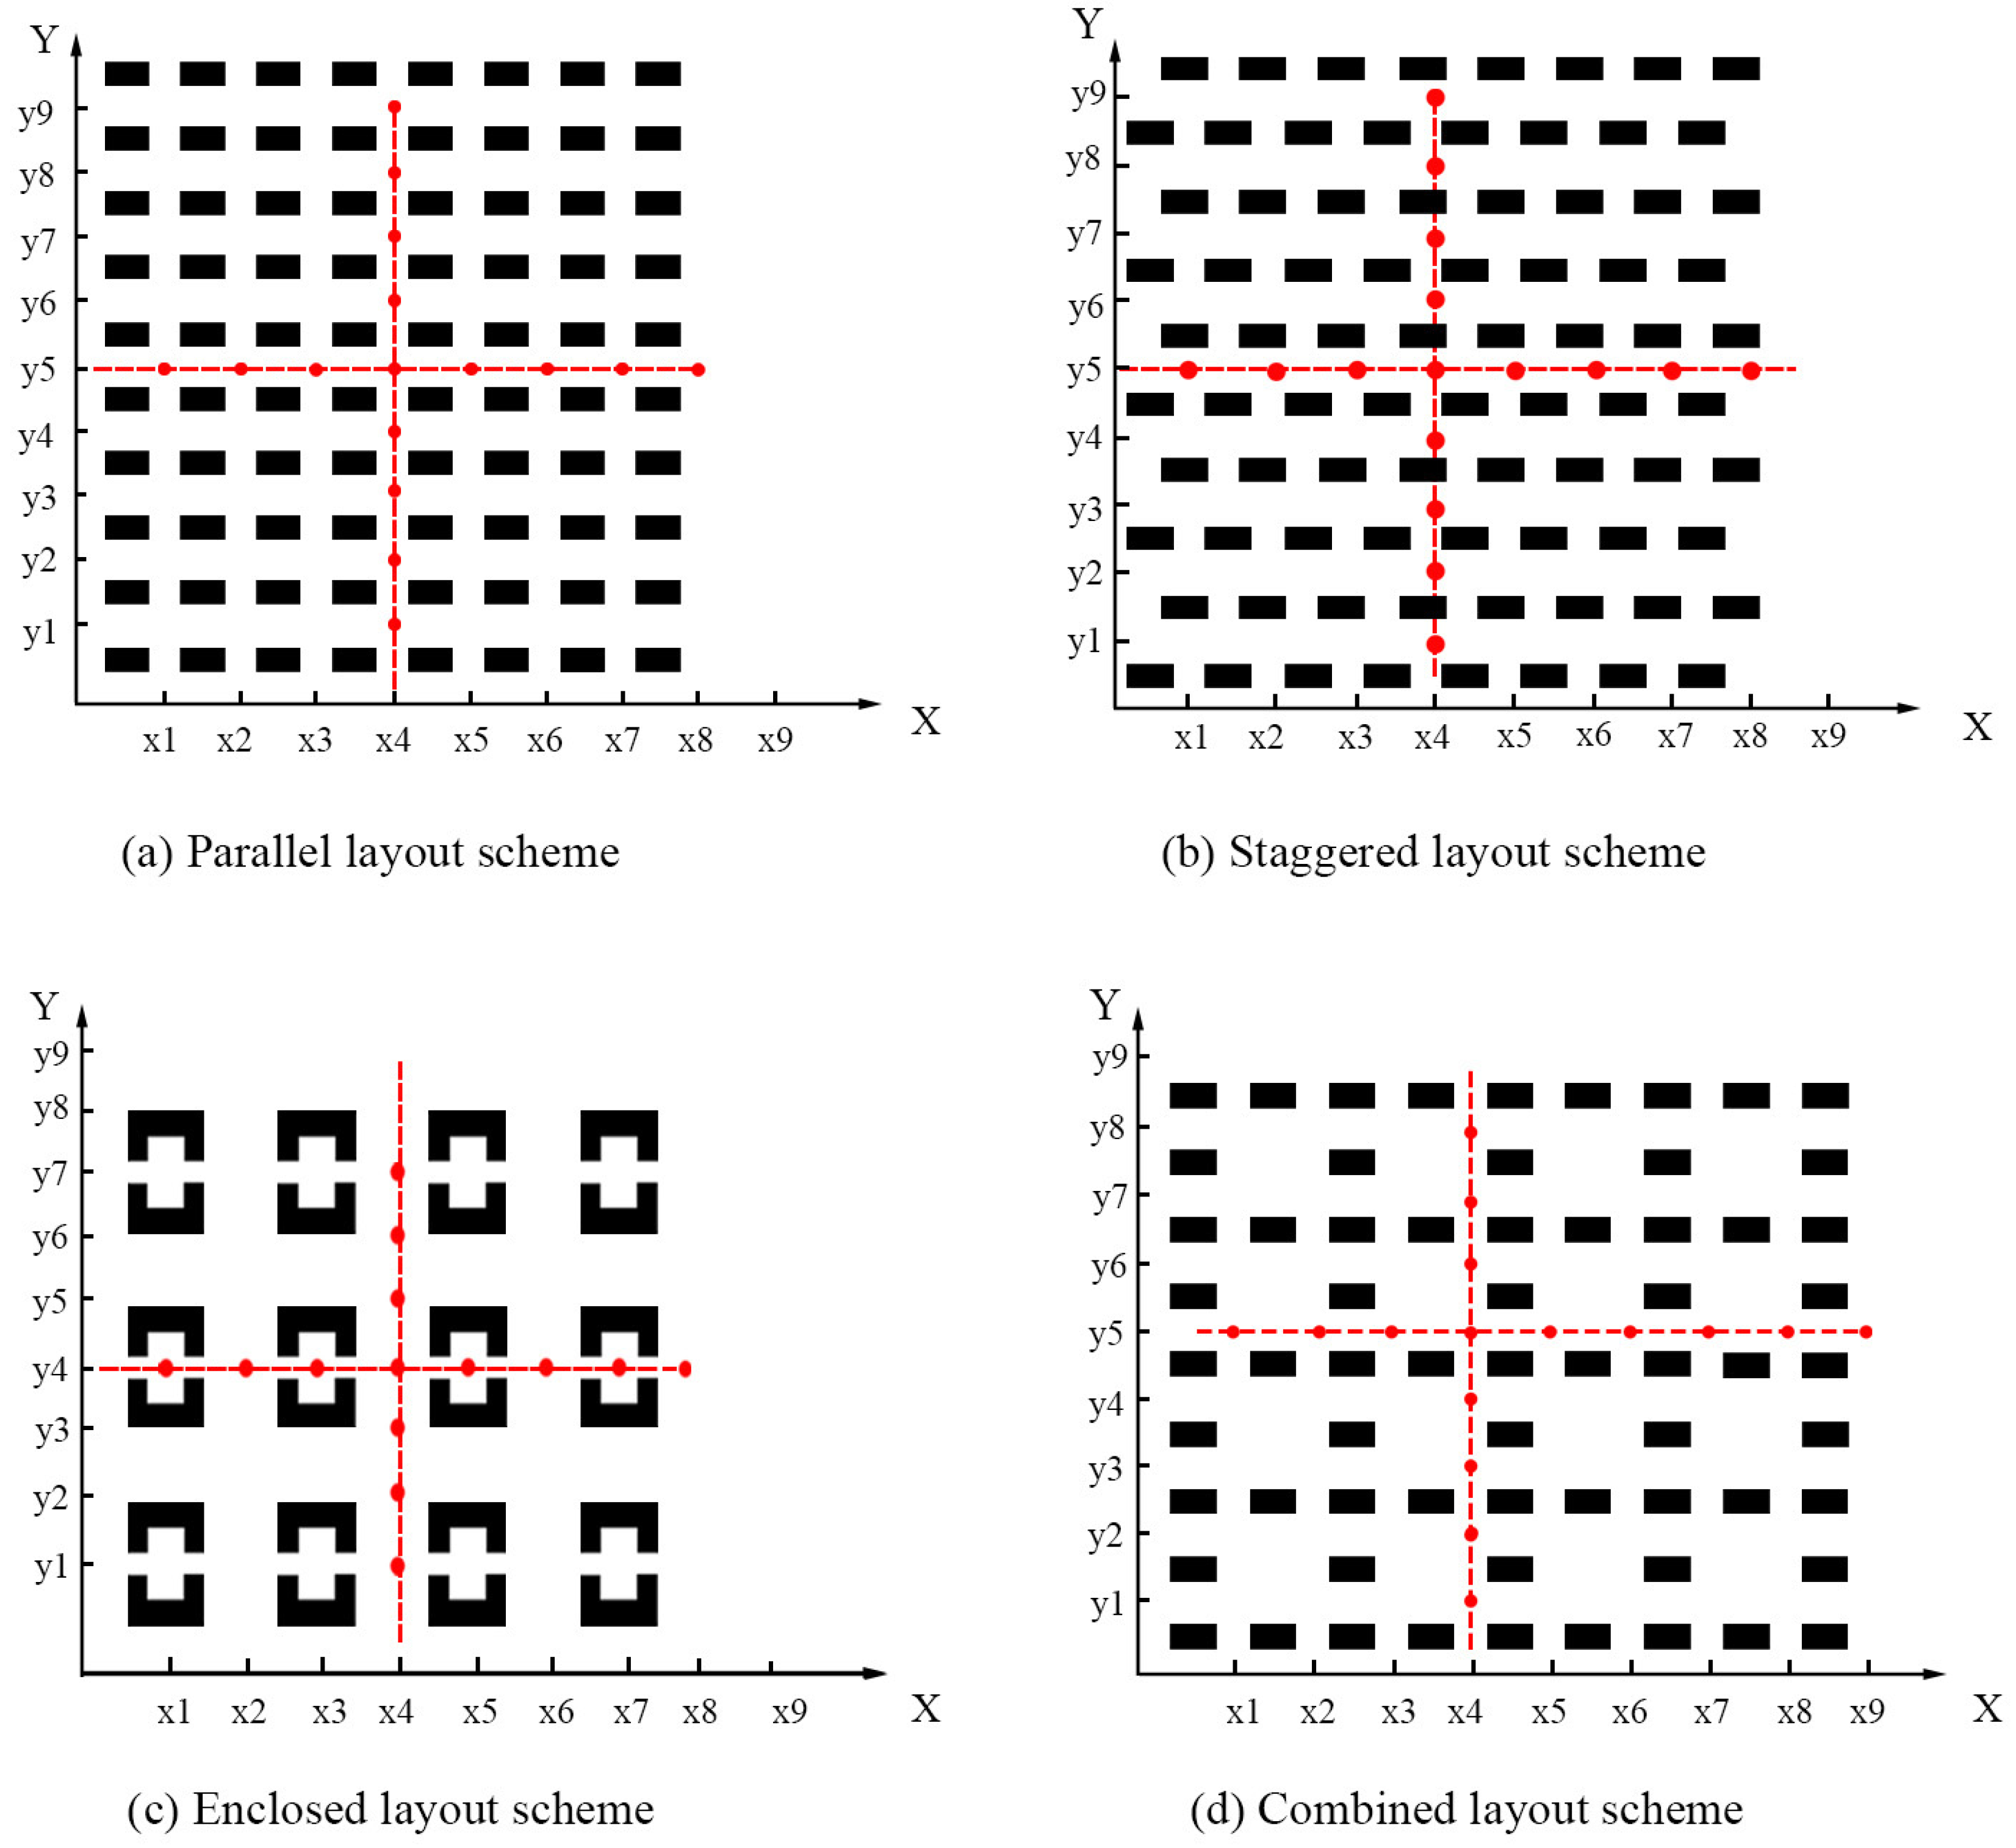
3.3. Study Parameters and Scheme Descriptions

In this study, ENVI-met software (5.5.1) was used to perform a comprehensive simulation of each scheme. ENVI-met, a piece of numerical simulation software focusing on urban microclimate research, is capable of simulating microclimatic conditions with a high degree of accuracy in 3D environmental models. Now a well-recognized scientific tool in the field of microclimate research, ENVI-met is widely used by scholars at home and abroad to simulate microclimates on the microscale [43,44,45] in order to quantitatively analyze the factors affecting microclimate environments and the spatial and temporal characteristics of urban microclimates. In terms of microclimates, this study paid special attention to two key indicators, T and RH. In addition, the extent to which the influencing factors affected temperature and humidity human comfort (UTCI) was investigated by means of a polar extremum difference analysis.
The ENVI-met simulation operation process was roughly divided into five steps. First, the workspace was established, and the simulated scene information in the workspace was set, such as the geographic location, unit mesh accuracy, nesting parameters, etc. After the setup was completed, the required simulation site base map was imported into the SPACE modeling board to generate the model file (.inx). Second, the ENVI-guide board was utilized to set the background meteorological parameters, including the simulation date, time, wind speed, wind direction, temperature, relative humidity, radiation, rainfall, and other condition parameters, in order to obtain the (.sim) file. Third, data operations were performed using ENVI-core in order to obtain the (.EDX) files. Fourth, the BIO-met module was applied to perform comfort operations on the model. Fifth, the output files of steps three and four were imported into Leonardo for the visualization and analysis of the simulation results.
By referring to the schemes shown in Table 4, it can be seen that since the FAR was a single non-intersecting factor in this study, it was only affected by the building height. Therefore, the FAR of the model for each scheme was quantified by changing the height, and the model height and number of floors corresponding to the FAR for each specific scheme are shown in Table 6.
The parameters required for the ENVI-met simulations fell into two main categories: meteorological parameters and model parameters. For the meteorological parameters, the direct radiation, scattered radiation, longwave radiation, air temperature, humidity, wind speed, wind direction, and rainfall for a given day had to be entered. These data were derived from the European Centre for Medium-Range Weather (ECMWF), which provided accurate weather information for the simulations. For the model parameters, the location of the simulation area, the number of model grids, the unit grid accuracy, and the height and material of the model all had to be set. Having determined the above setup parameters, this study chose 21 July 2023 as the simulation date to obtain the relevant meteorological parameters, while it combined the data shown in Table 5 and Table 6 to set the model parameters for each scheme.

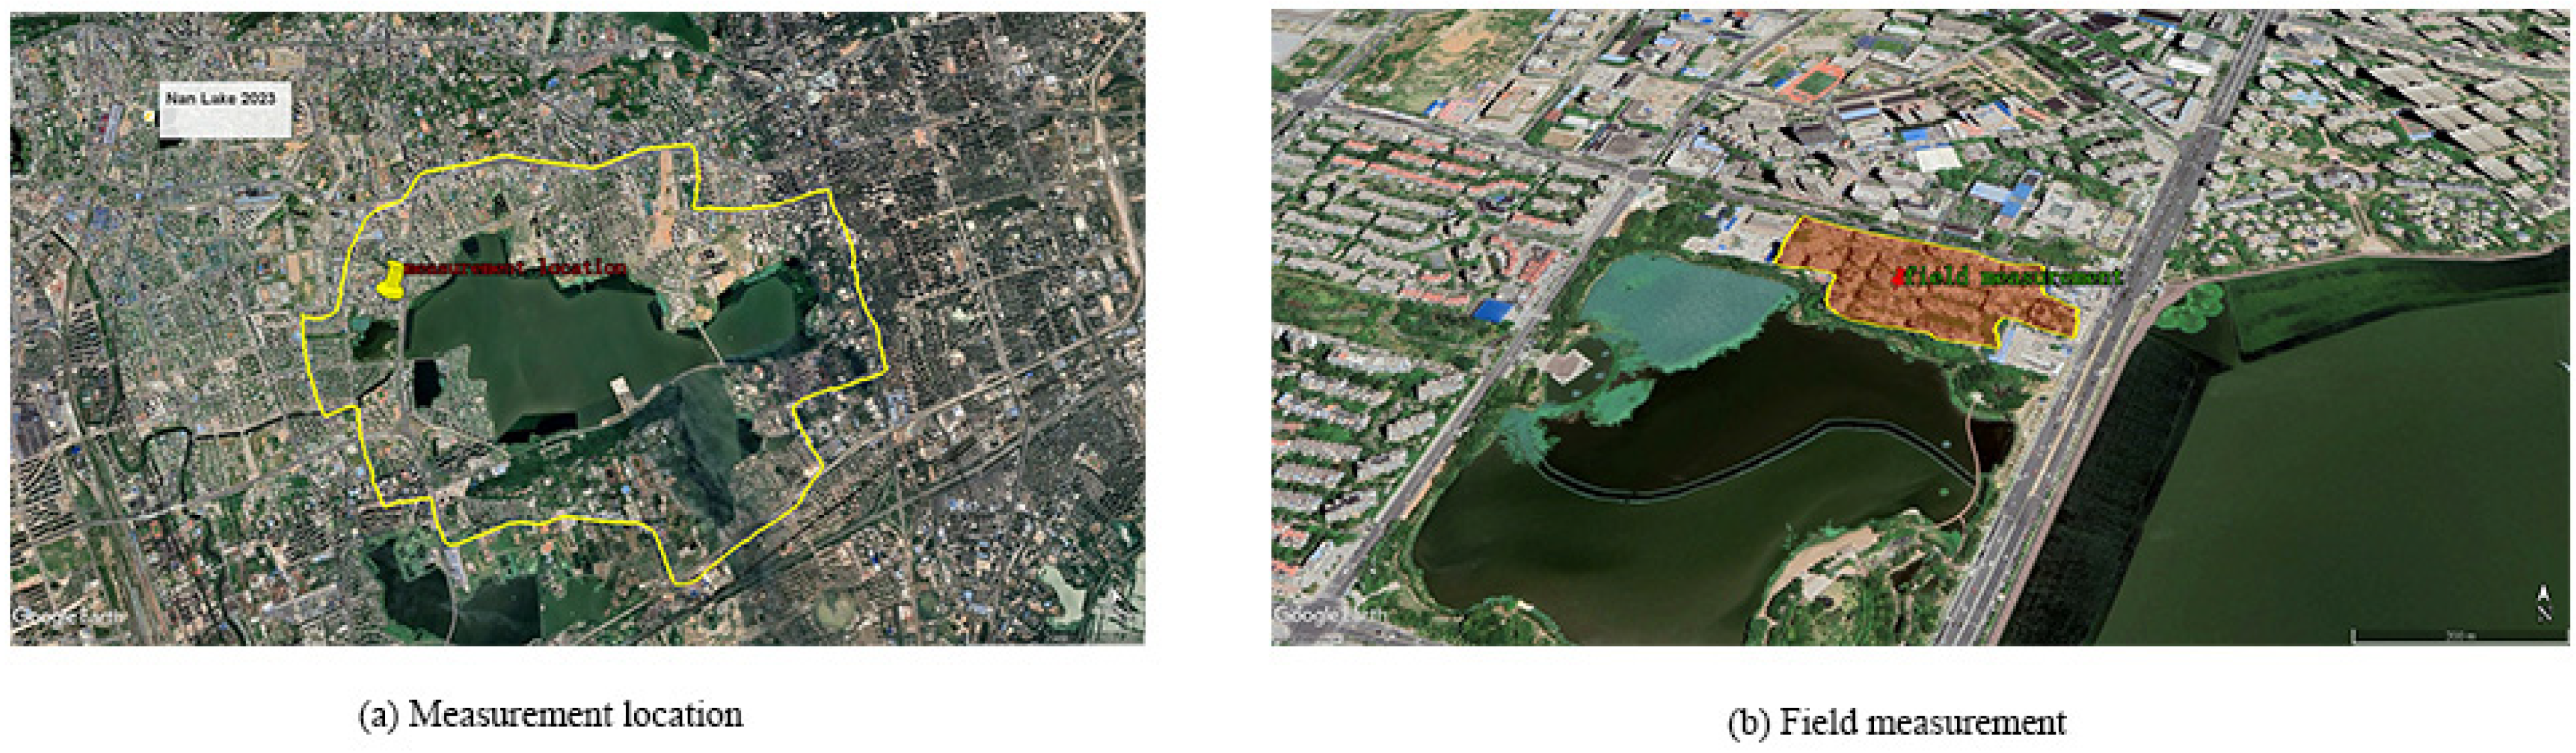
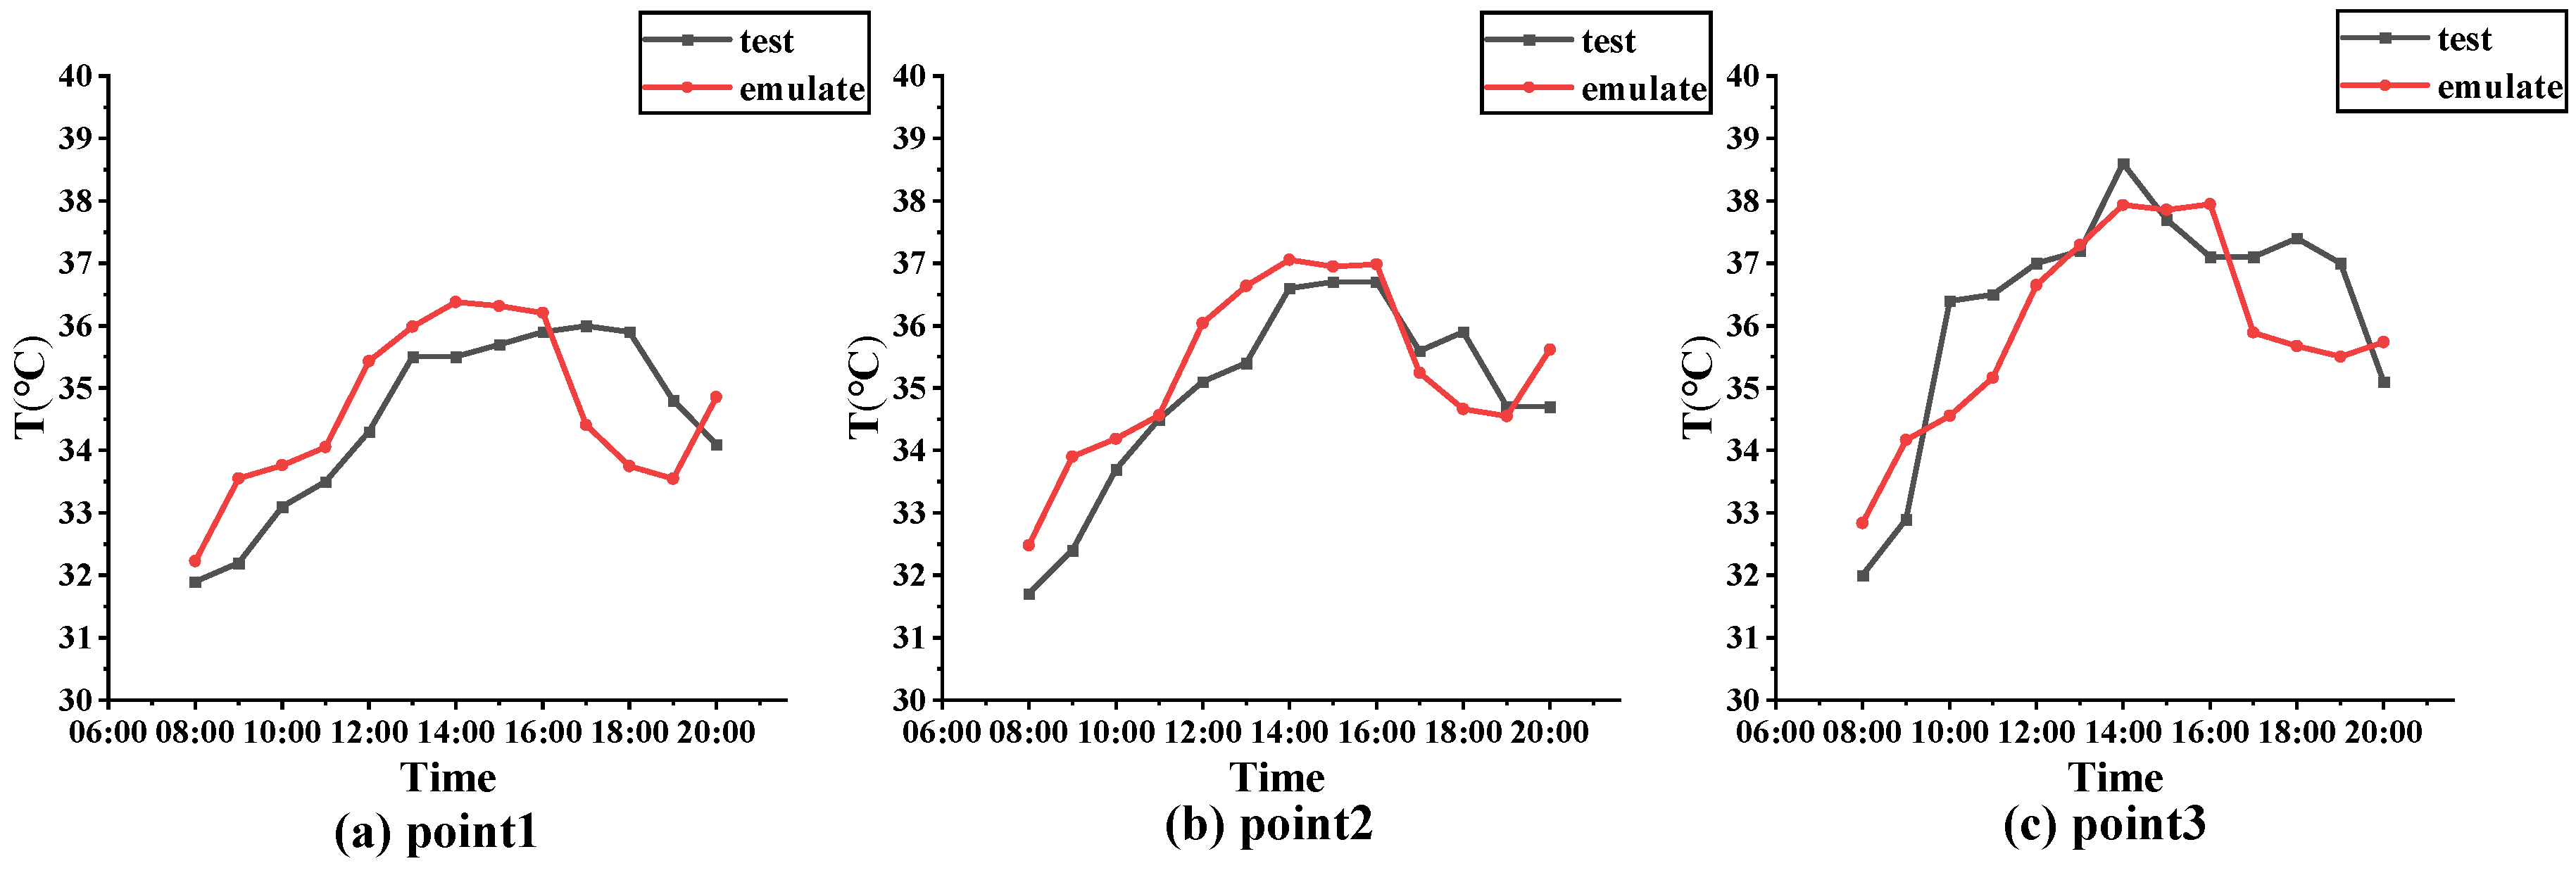
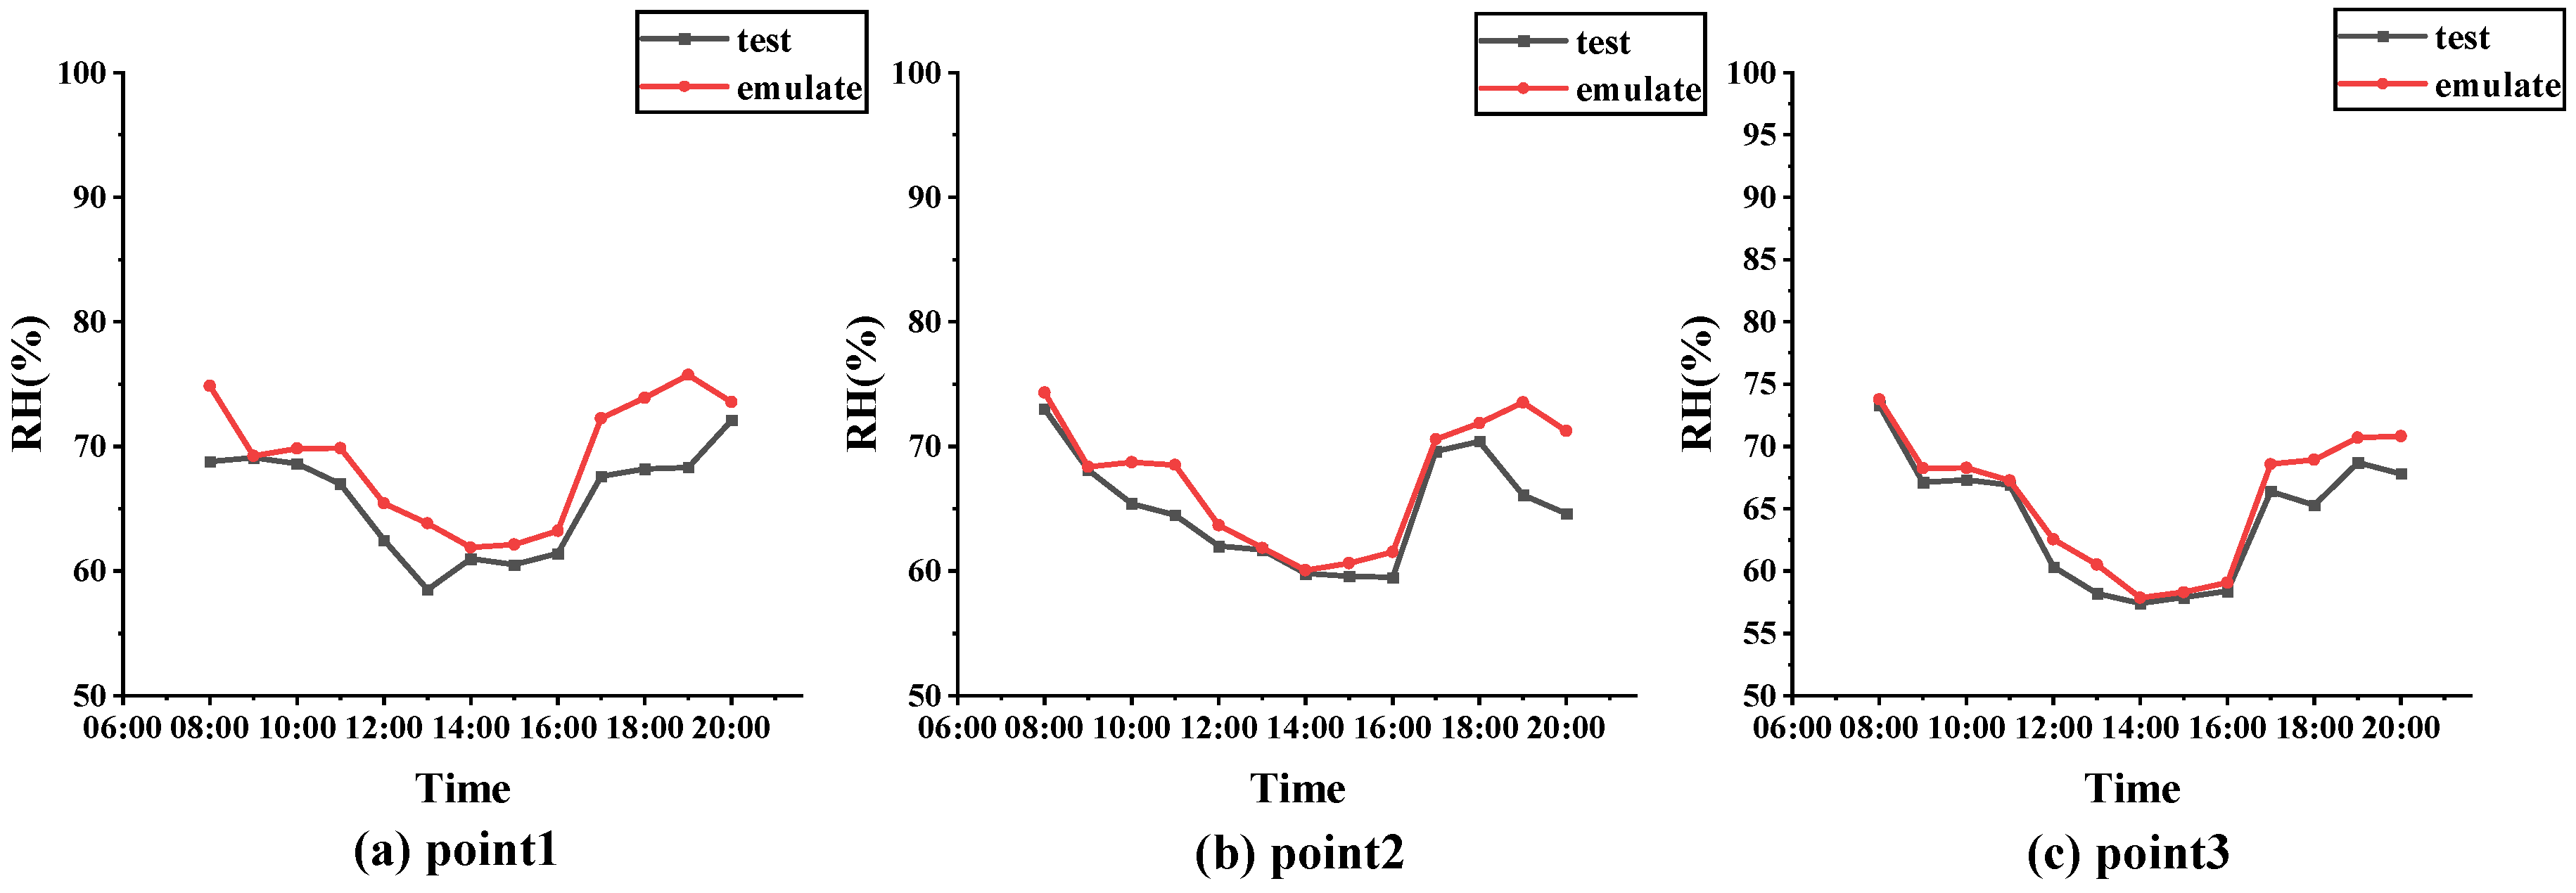
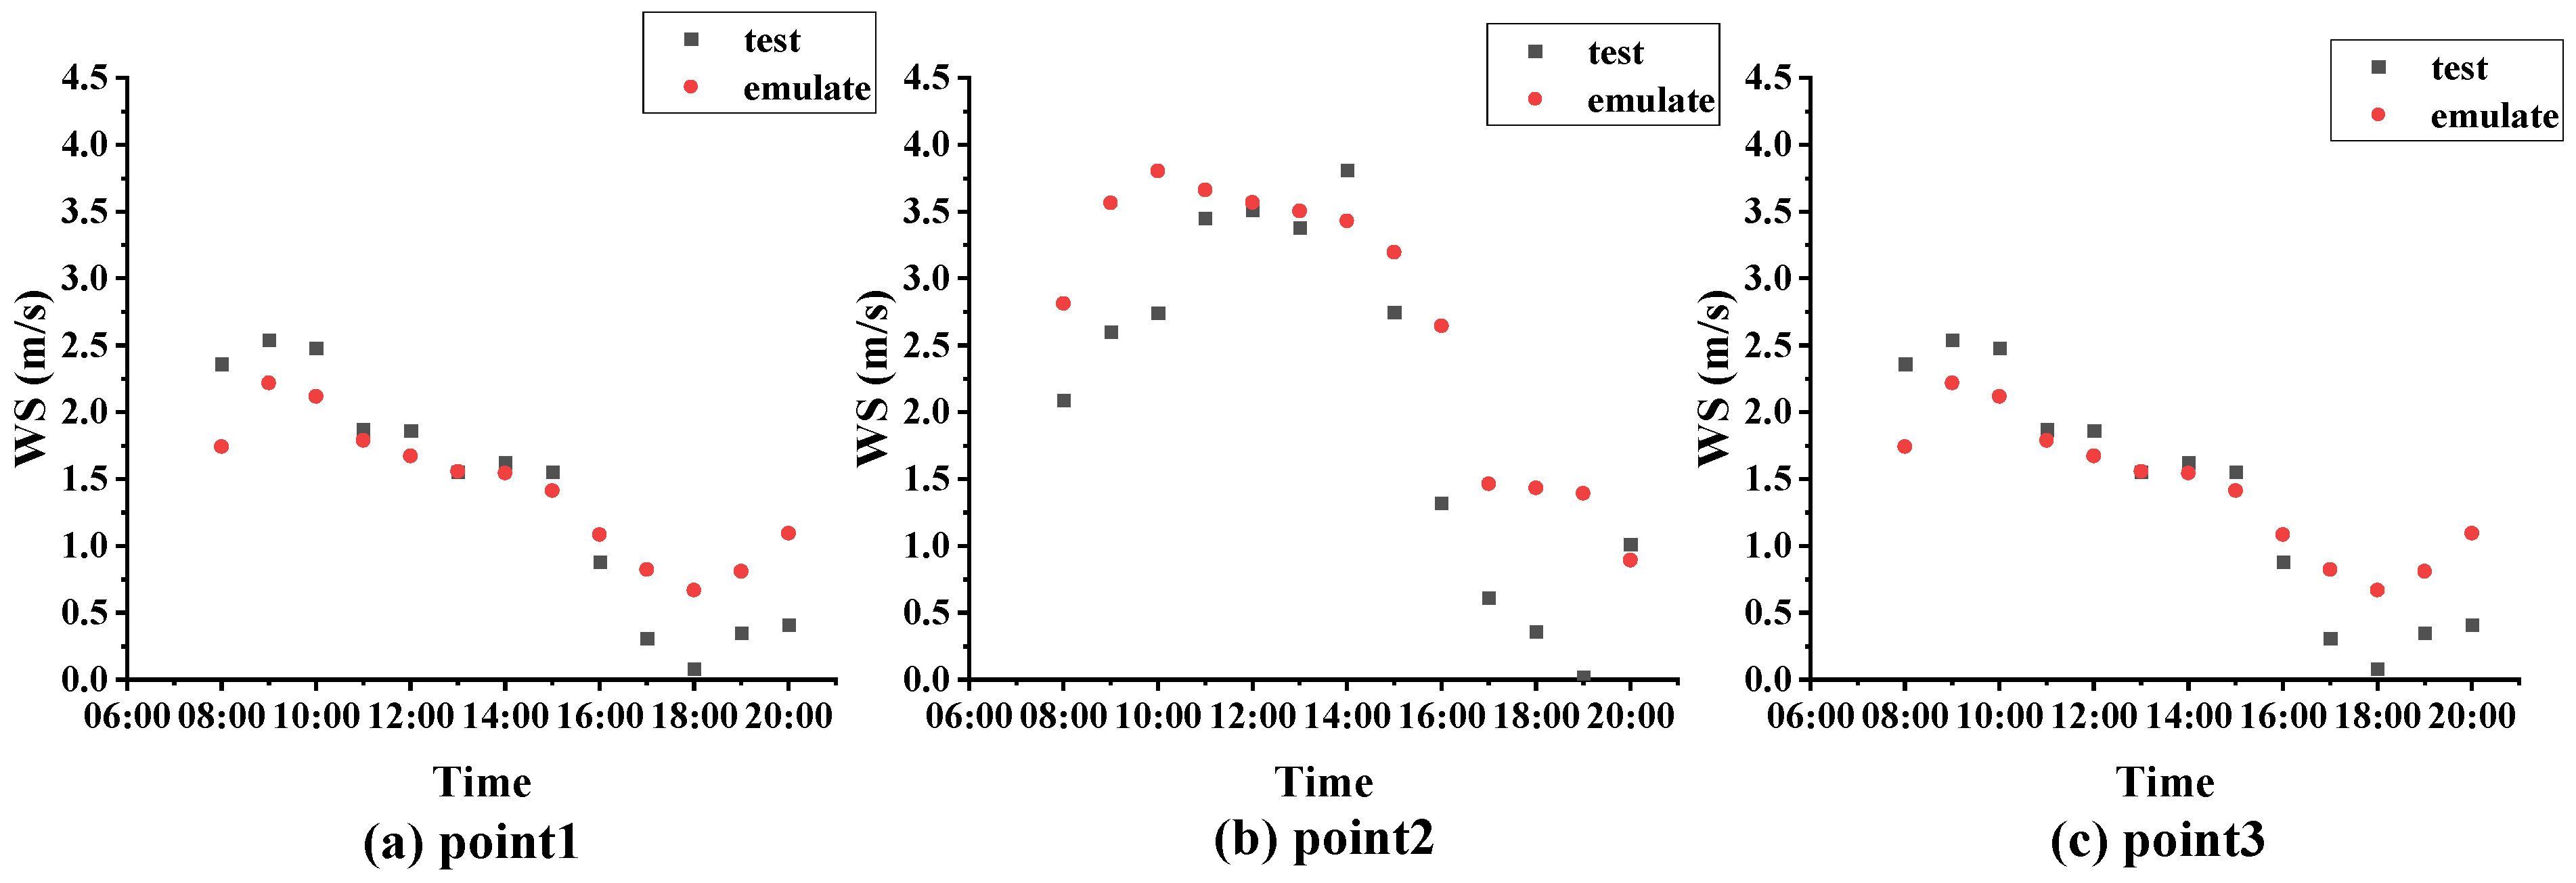
3.4. Model Validation

The selected sample settlement is located in the Nan Hu Lake Yuan settlement in Hong Shan District, Wuhan (as shown in Figure 5.) The settlement is located in the Nan Lake Scenic Area on the west side of South Luo Shi Road in Hong Shan District, adjacent to the Nan Lake Happy Bay Park, east of Publishing City Road, north of Airport Road 3, south of Wu Liang Road, and west of the southern section of Ding Zi Qiao Road. The settlement is surrounded by urban roads and the site is well organized, with the sample having a length of about 400 m from north to south and 160 m from east to west, covering in total an area of about 54,694.00 m2. The building area is about 130,759.00 m2, and the building type in the small area is the slab building type. A total of 18 buildings were included; these had a plot ratio of 2.3 and a GR of 40.0%, and the number of floors in each building ranged between 8 and 12.
The actual test date was 11 July 2023, which was at the beginning of the ambient period; it was a sunny day marked by high temperatures. Three TES 1341 thermocouple anemometers and one JTR05 solar radiation self-logger were used in the on-site meteorological field measurements for fixed-point and timed recordings. Combined with the background meteorological data required for the ENVI-met simulation and the resulting data to be validated, this test provided both temperature and humidity data collection and radiation data collection. Considering that human activities are often within 3.0 m of the ground, the temperature, relative humidity, wind speed, and wind direction were measured at 1.5 m above the ground for each measurement point. For these factors, a TES 1341 thermocouple anemometer was used to measure the temperature, humidity, and wind speed; the instrument was placed on a 1.5-meter-high tripod and set to record its measurements every 10 min, while the temperature, relative humidity, and wind speed displayed by the instrument were recorded manually every 30 min, and the angle of the wind direction was recorded by means of a fluttering belt and a compass. Solar radiation data were then measured by the JTR05 solar radiation self-logger, which again was set to record its measurements every 10 min and whose measurements were manually recorded every 30 min. The actual measurement time period was from 8:00 to 20:00 on the test day. As shown in Figure 6, given the different locations of the buildings, their different distances from the water body, and the differences in their underlying surfaces, we set up three measurement points within the study area and placed a solar radiation self-logging device on the rooftop of each building to obtain the background meteorological data.
Based on the mapping data from the field visit, the measured area was modeled and numerically simulated in ENVI-met. The settlement model is shown in Figure 7. The results of the simulation were compared with the actual measured data to verify the accuracy of the simulation results. The validation was evaluated using the mean absolute percentage error (MAPE) and root mean square error ( R M S E ), and the R M S E and M A P E were used to verify the reliability of the simulation results. Referring to recent research on the accuracy of ENVI-met simulations, it was found that the R M S E of the measured versus simulated T and wind speed (WS) was not greater than 1.31, and that the M A P E of the measured versus simulated RH was not greater than 5% [26], which means the simulation satisfies the established requirements.
R M S E = 1 r i = 1 r y i y i 2
M A P E = 1 r i = 1 r y i y i y i × 100 %
where r is the total number of groups, y i is the simulated value of the parameter, and y i is the measured value of the i t h parameter.
In this study, SPSS was used to statistically analyze the measured and simulated T, RH, and WS data comparisons [46]. As seen in Table 7, the results show that the simulated microclimate results were more compatible with the on-site measurements, while the RMSE values for the T and WS were within 1.31 and the MAPE values of the RH were not greater than 5%, with all of these values being within a reasonable error range.
Meanwhile, as seen in Figure 8, Figure 9 and Figure 10, the T, RH, and WS trends simulated by ENVI-met were basically consistent with the measured data, which indicated that the ENVI-met simulation had reliability and was able to successfully simulate the real microclimate scenarios.

4. Results and Analysis

In order to quantitatively analyze the effects of different combinations of factors on the thermal and humid environments of waterfront building areas, in this study, based on their same LFs, horizontal (parallel to the riverbank direction Y) and vertical (perpendicular to the riverbank direction X) directions at a level of 1.5 m above the ground in the study region’s waterfront building area were used. Sampling points were selected from ventilation corridors and building bypass zones with characteristics representative of the flow field, and the average values at the height of pedestrians in the settlements were compared and analyzed as an analytical index [43,47,48]. The specific horizontal and vertical internal locations are shown in Figure 11, marked by short red dashed lines. For the horizontal locations, the sampling points started at the northernmost point, labeled HX1; for the vertical locations, the sampling points started at the point closest to the lakeshore, labeled ZX1.

4.1. Temperature Distribution Pattern of Each Scheme

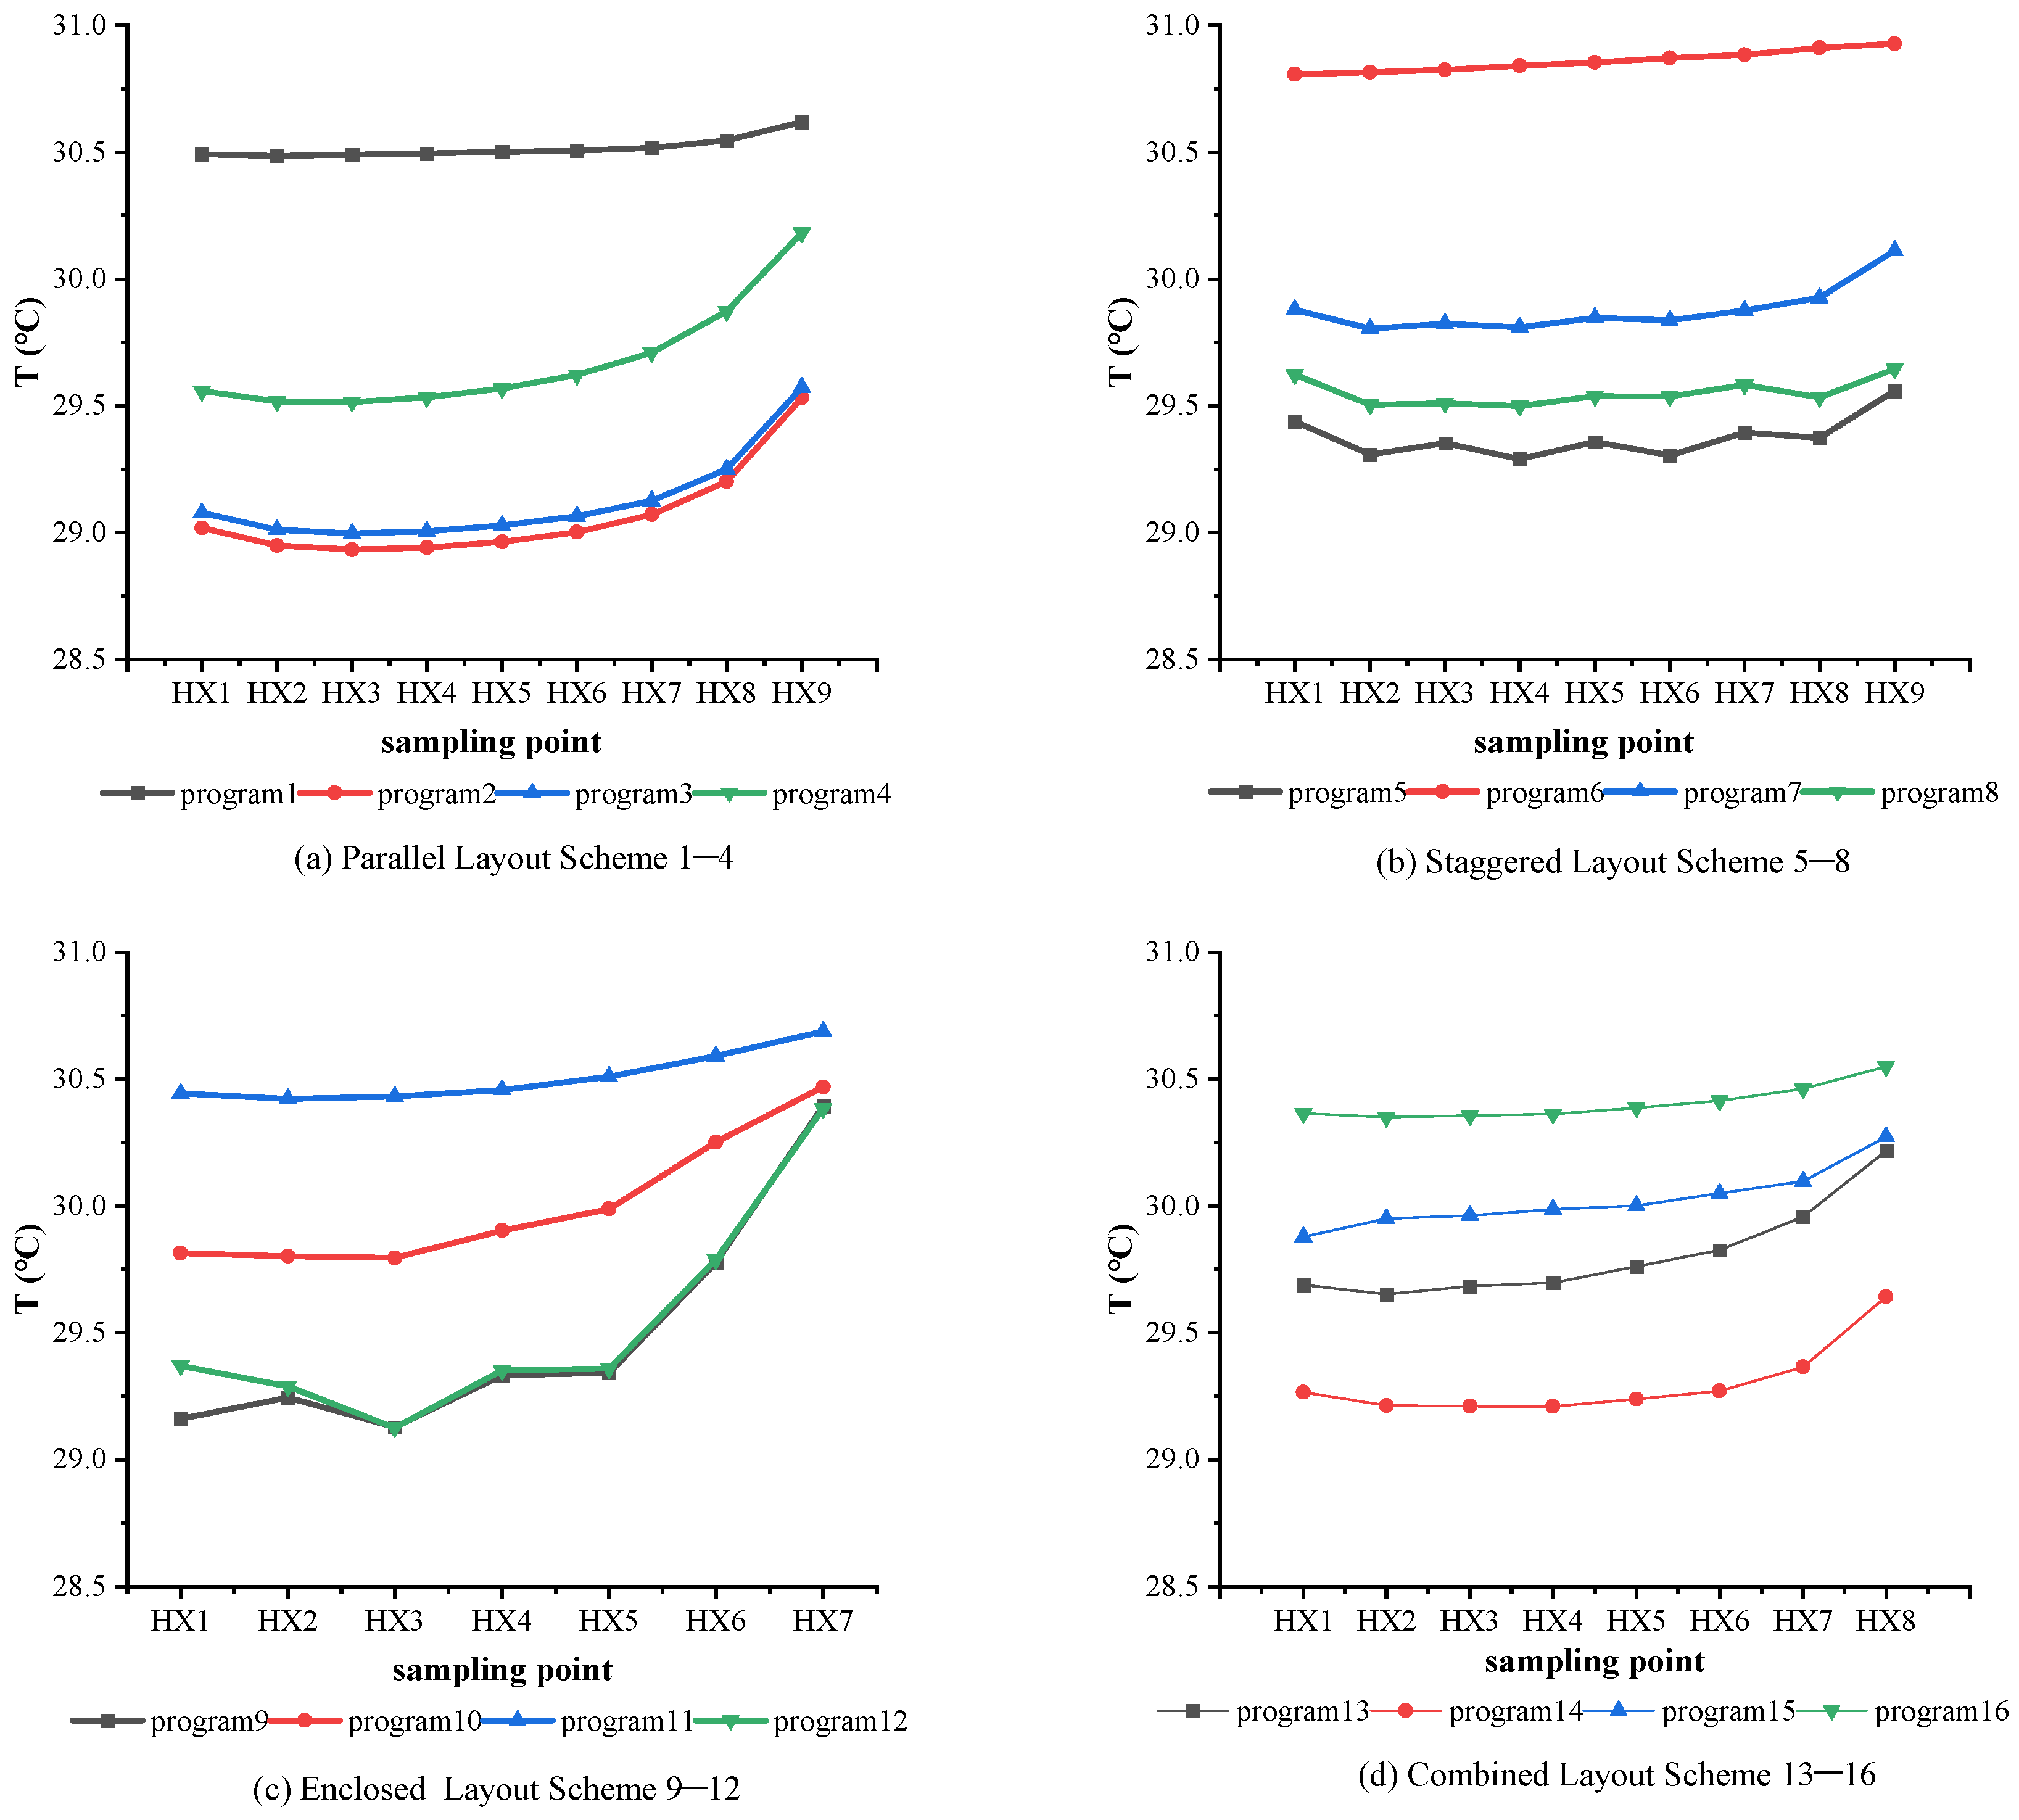
4.1.1. Horizontal Patterns of Change

Figure 12 illustrates the distribution of the outdoor temperatures with the lateral distance at the sampling points in each scheme. From the figure, it can be clearly observed that the temperature change in each scheme as a whole showed an upward trend, but their patterns of change varied. For both the parallel and combined layouts, the outdoor temperatures showed a smooth increasing trend, albeit with small changes in values recorded. In contrast, the temperature changes for the staggered layout showed a symmetrical distribution, with the external ambient temperature being higher at the sides and relatively lower in the center. This change was particularly noticeable in Scheme 5, due to the fact that the sampling points were located on either side of the Y direction, immediately adjacent to the building boundaries and the pavement outside the settlement, which was affected by the building facades and the heat island effect, resulting in higher temperatures. For the enclosed layout, there were large differences in the outdoor temperatures among the individual schemes, especially for Scheme 9 and Scheme 12, whose temperatures rose sharply at sampling point 5 as a result of the ventilation corridor effect, which was created by the combination of the high-temperature façades of the buildings on both sides and the spacious roadway in the middle of the area.
A comparison of the lateral temperature variations recorded for the four layout forms reveals that the outdoor temperatures of the four schemes for the parallel layout were the lowest, having a range of 28.9–30.6 °C, of which the lowest temperature recorded in the middle of the building area was in Scheme 2. This was due to the fact that the relatively regular nature of the parallel layout constituted a ventilation corridor in the north–south direction, and that the GF of the “grass + shrubs” was conducive to heat dissipation at the height of the walkway. Among these 16 simulation schemes, it can be found that the outdoor temperatures recorded in Schemes 1, 6, 11, and 16 were much higher than those recorded in the rest of the schemes. By also referring to Table 4, it can be found that what these four schemes had in common was that their GFs were set up as grassy areas, which resulted in unobstructed outdoor spaces in the settlements that were marked by poorer transpiration by the plants present, therefore leading to higher and weakly varying outdoor temperatures. The highest overall average temperature was recorded in Scheme 6. In addition to the reasons mentioned above, this was due to its use of the slab building type and staggered layout, which are characterized by poor ventilation; further, the settlement as a whole did not form an air corridor in the north–south direction, and the southerly winds characteristic of Wuhan in summer were unable to provide effective airflow into the interior of the settlement.

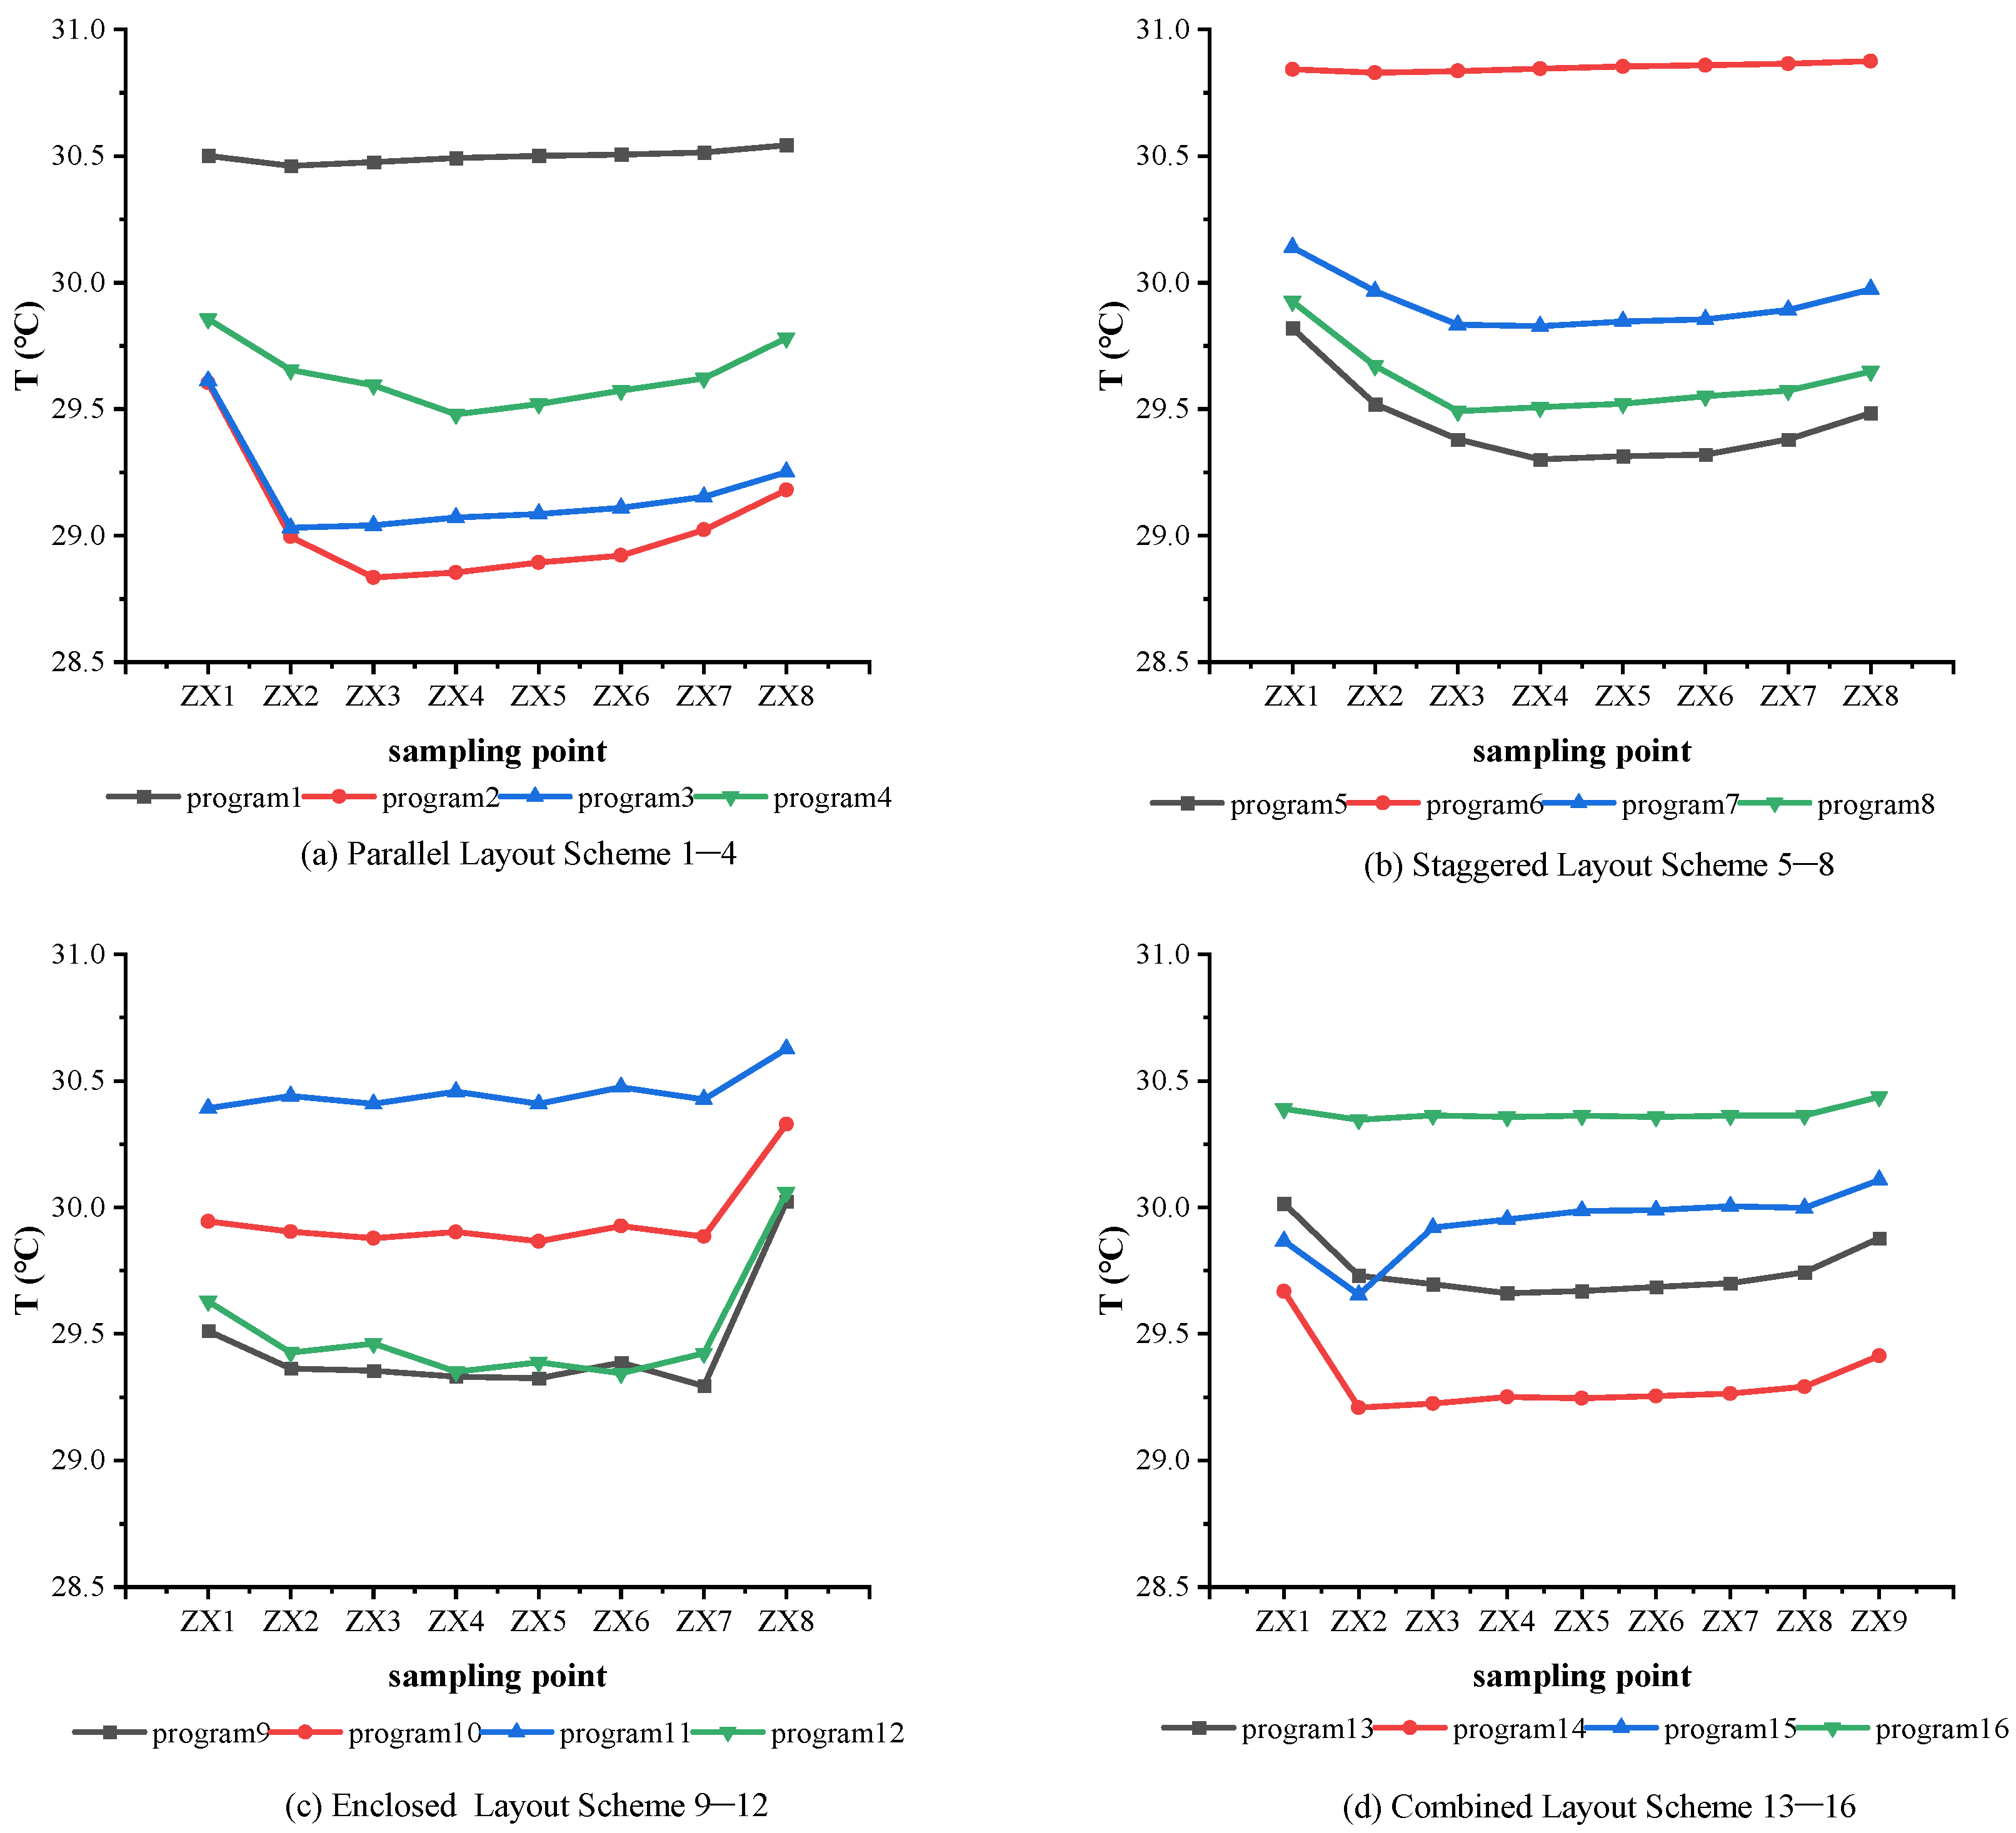
4.1.2. Vertical Patterns of Change

Figure 13 shows the distribution patterns of the outdoor temperatures with longitudinal distance at the sampling points of each scheme. From the figure, it can be seen that the temperature change patterns of each scheme were approximately the same, and that the temperatures recorded at their starting points were generally slightly higher than those recorded at other points. The main reason for this was that the road material used near the lake was asphalt, meaning the road surface temperature was high; further, the road along the lakeside was not set up with green plants. As the sampling points entered the building area, the recorded outdoor temperatures began to fall and stabilize due to the shade provided by the buildings and the influence of greening, and then as the points moved further away from the shore, their recorded temperatures rose slowly. Among the schemes, the changes in the eight parallel layout and combined layout schemes showed a typical change pattern of higher values on both sides and relatively lower values in the center of the study area, with the temperature changes in the combined layouts being more gentle in the building area. The staggered layout schemes had the smoothest temperature trend, while the temperature changes in the enclosed layout schemes showed an up-and-down pattern of change, with a significant increase in the outdoor temperatures at the farthest point offshore recorded. In particular, the most significant temperature changes were recorded at a sampling point in Scheme 9, due to the fact that this point was located in the center of the building enclosure at the very end of the study region, where the cooling effect of the water body was weak and it was affected by the high temperature of the peripheral road pavement at the boundary of the settlement to the west; further, the fluctuating temperature changes were also related to the scheme’s enclosed layout form, which was characterized by a weak and insignificant wind inside the enclosing space.
A comprehensive comparison of the longitudinal temperature changes recorded for the four layout forms reveals that the outdoor temperatures in the waterfront building area increased as the distance from the shore increased, with the cooling effect of the water body on the settlements gradually diminishing. Again, the outdoor temperatures in Schemes 1, 6, 11, and 16 were much higher than those in the rest of the schemes, from which it can be deduced that the irrational GFs significantly weakened the cooling regulation in the outdoor spaces of the settlements.

4.2. Relative Humidity Distribution Pattern of Each Scheme

4.2.1. Horizontal Patterns of Change

Figure 14 shows the distribution pattern of relative humidity with lateral distance at the sampling points of each scheme. The starting point of the calculation began at the study region’s northernmost boundary within the waterfront built-up area and increased gradually by distance along the Y direction. As can be seen in Figure 14, although the overall trend of relative humidity decreased as one moved deeper into the south, the characteristics of the changes in relative humidity varied from scheme to scheme and across the different layouts. The relative humidity variations were relatively small across the parallel layout and staggered layout schemes. In the staggered layout schemes, the relative humidity variation curves were roughly symmetrically distributed along the centerline of the settlements, most notably in Scheme 5. The enclosed layout schemes had two peaks in relative humidity along the transverse direction, and the staggered layout schemes had four peaks in relative humidity along the transverse direction. This was due to the fact that in these schemes, the airflow was greatly influenced by the LF, being related to the ventilation corridor formed by each LF. The staggered column and enclosed layout schemes were less effective due to their use of horizontal ventilation, which resulted in the airflow in the central region being blocked by the buildings, while the main ventilation corridor was formed vertically. Further, the buildings in this region were widely spaced, which allowed the airflow from the lake to enter the middle part of the building area, and thus, the relative humidity was relatively large in this region.
A comprehensive comparison of the four layout forms reveals that there was one scheme for each layout that recorded much lower humidity values than the remaining schemes. Combining this analysis with the data shown in Table 4, it can be seen that Schemes 1, 6, 11, and 16, coincidentally, did not perform as well in terms of the cooling effect. Similarly, the mono-GF of the grass in the settlements resulted in weak moisture retention and low humidity in these schemes. Comparing the 16 schemes, it was found that the schemes with the highest relative humidity values were Schemes 2, 5, 12, and Scheme 14. By referring as well to Table 4, it can be seen that Schemes 2, 5, and 12 had the same common GF feature, which was “Grass + Shrubs,” while Scheme 14 and Scheme 2 shared the common feature of their FAR both being 2.0, from which it can be inferred that the GF and the FAR had a certain influence on the relative humidity.

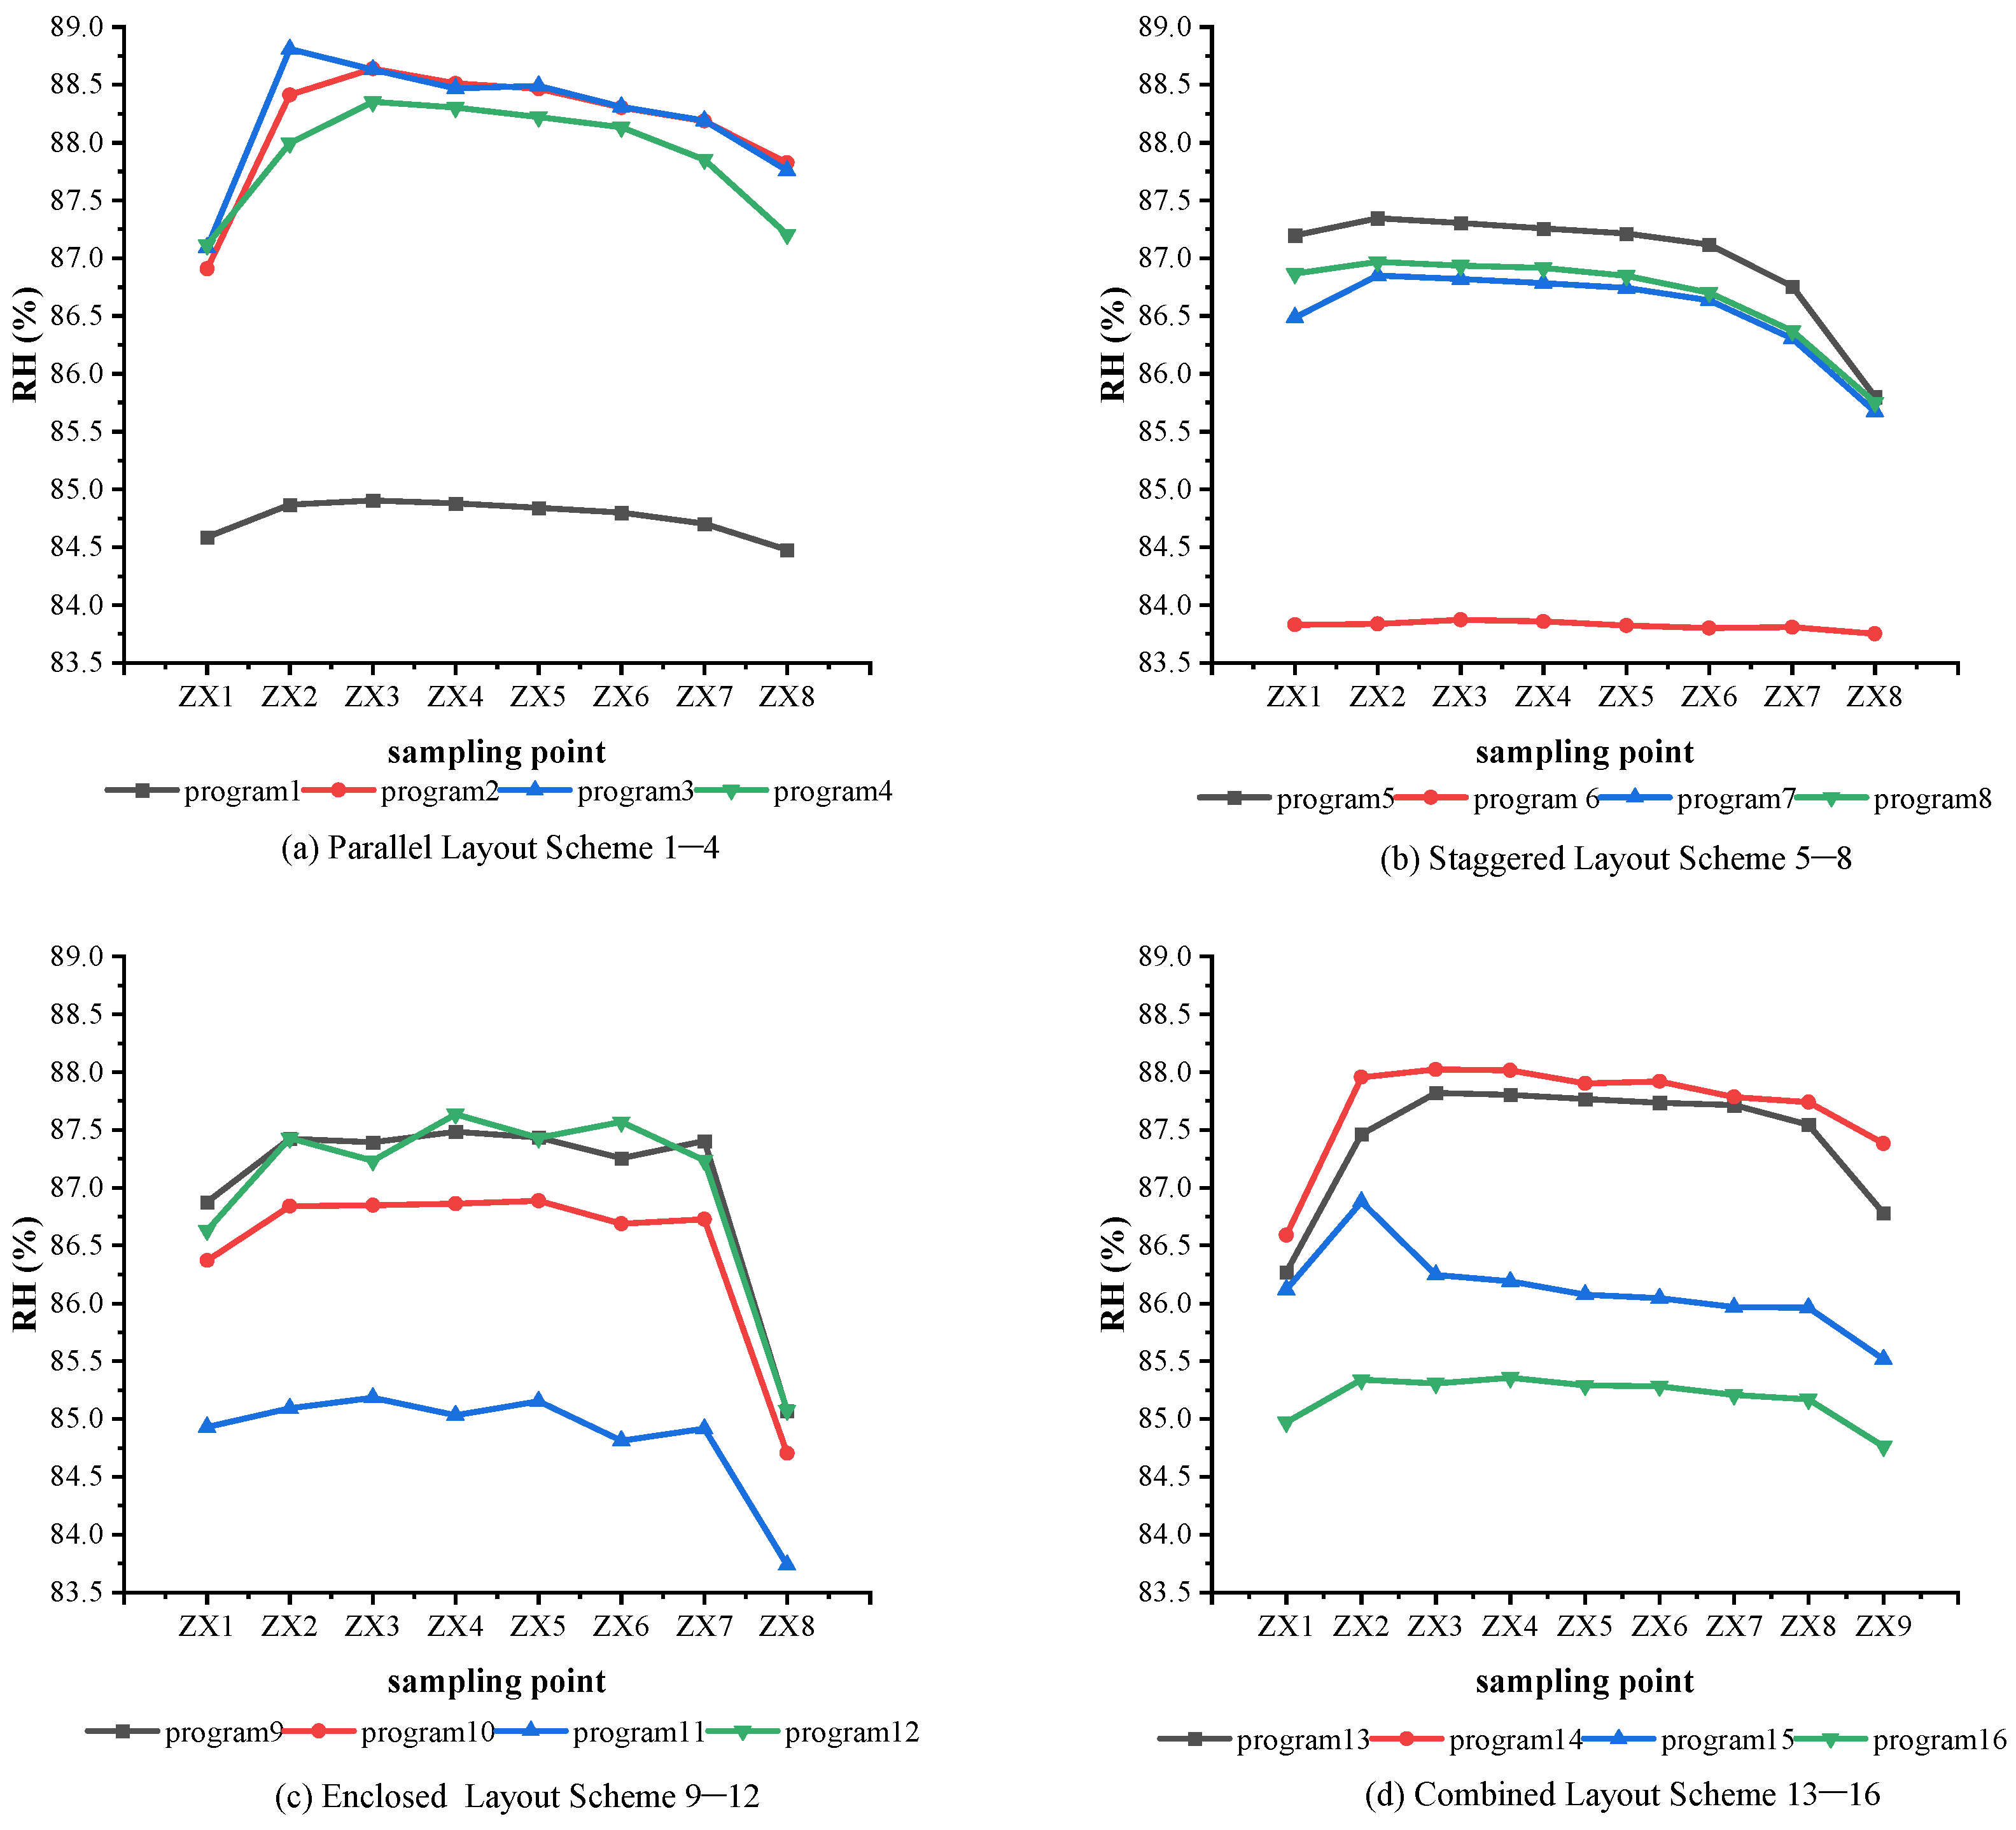
4.2.2. Vertical Patterns of Change

Figure 15 shows the distribution pattern of the relative humidity with the longitudinal distance at the sampling points of each scheme. From the figure, it can be seen that these distribution patterns were roughly the same. They did show different degrees of attenuation as the distance from the lakeside increased, but there was little difference in the overall change in their distribution patterns due to the high humidity of summer in Wuhan and the shading and ventilation effects of the different buildings and plants that were present. Among the schemes, there were nine, namely Schemes 2, 3, 4, 5, 7, 9, 10, 13, and 14, which showed a gentle trend of humidity changes in the building area. By also referring to Table 4, it can be found that most of the greening forms of these schemes were composed of “grass + trees.” It can, therefore, be inferred that greening in the form of trees helped enhance the moisturizing effect of the outdoor spaces in the residential area of the study region.
A comprehensive comparison of the four layout forms reveals that the relative humidity values in the longitudinal direction of Schemes 1, 6, 11, and 16 remained much lower than those of the other schemes, once again demonstrating the important influence of the GF on the relative humidity in the study region.
A comparison of the T and RH of the longitudinal and transverse directions of the change patterns found that the longitudinal change pattern of T was different from that of RH. The reason for this was that the RH was mainly affected by the concentration of the moisture dispersal source and the change in airflow on the diffusion path, with its mechanism being relatively simple. Meanwhile, the T was affected by the low-temperature airflow brought about by the wind, and the size of the changes in its values was also related to the T of the different land surfaces and the influence of the sun’s radiation, which made the combined effect relatively more complicated.

4.3. Orthogonal Experimental Analysis of Waterfront Settlement Simulation Schemes

As discussed above, 16 simulation schemes with different factor combinations were obtained through orthogonal experiments, and then ENVI-met was used to simulate these schemes, with the corresponding UTCI, T, and RH values of each scheme being calculated. The specific experimental results are shown in Table 8.
The factors affecting human comfort are very diverse and can be mainly categorized into meteorological factors and individual differences. Meteorological factors cover environmental factors such as solar radiation and the T and RH of the area in which an individual is located, whereas individual difference factors are characterized by the subjective feelings of the individual, such as their amount of clothing worn, level of exercise, and heat tolerance [49]. More than 160 comfort indices have been developed in research related to thermal comfort [50], including the wet bulb black globe temperature (WBGT), predicted mean voting value (PMV), standard effective temperature (SET), physiologically equivalent temperature (PET), and universal thermal climate index (UTCI). Among the many metrics used for outdoor thermal comfort evaluation, the PET and UTCI are the most widely used [50,51].
The founding principles of the UTCI are rooted in multidisciplinary cross-fertilization. Based on the mature development of thermal physiology and heat exchange theory, the UTCI was proposed by the International Society for Biometeorology (ISB) in 2002 [52]. This metric works toward a common thermal metric applicable globally by combining a multi-node model with a clothing model. Wang [51] and others from Tongji University found that in the HSCW zone, specifically in Shanghai, the results of outdoor thermal comfort evaluation by the UTCI in summer were more consistent with individuals’ subjective feelings than the PET, while in winter, the PET more accurately reflected individuals’ thermal comfort feelings. Therefore, in this study, the UTCI was selected as the thermal comfort index in order to investigate the variability of the schemes analyzed.
The UTCI index is modeled using a sixth-degree polynomial equation based on the thermal physiological exchange theory [53]. Its core structure consists of the Fiala multi-node model [54] and the adaptive dressing model [55]. The Fiala model is used to simulate the process of heat exchange between the human body itself and the outside world, while the dressing model intelligently adjusts the amount of clothing worn according to changes in the meteorological elements of the surrounding environment. The specific model’s expression is shown below:
U T C I = f T a ; T m r t ; V ; R H = T a + O f f s e t ( T a ; T m r t ; V ; R H )
UTCI values are mainly affected by air temperature ( T a , °C), mean radiant temperature ( T m r t , °C), wind speed at 10 m above the ground ( V , m/s), and relative humidity (RH), as shown in the above equation [56].
In this study, using the BIO-met module in ENVI-met, the UTCI thermal comfort in the settlement model at a pedestrian height of 1.5 m was calculated using a 35-year-old adult male in summer clothing as a representative. Using polar analysis, the major and minor factors affecting thermal comfort were identified, and the order of the influence of the different spatial form factors on thermal comfort was analyzed in depth.
The results obtained are shown in Table 8, Table 9 and Table 10. k1, k2, k3, and k4 are the experimental indicators for the four levels of each influencing factor, from which the lowest level and the highest level of each influencing factor can be discerned, and R is the extreme variance, which indicates the range of changes in the role of each influencing factor. Additionally, the magnitude of the value of R in Table 8 represents the magnitude of the influence of the corresponding factor on the degree of the UTCI.
As R reflects the magnitude of change in the test indicator when the level of the factor fluctuates, the greater the R value, the greater the effect of the factor on the test indicator. Therefore, based on the magnitude of the R values shown in Table 9, it can be seen that the main order of influence of each factor on the thermal comfort of the UTCI in the study region was as follows: OD > GF > LF > FAR.
The T simulation data were analyzed using polar analysis of variance to obtain the data shown in Table 10. According to the size of the R values shown in the table, it can be found that the main order of the influence of each factor on the T was as follows: GF > LF > OD > FAR.
The polar analysis method was used to obtain the RH simulation data shown in Table 11. According to the size of the polar R values in the table, it can be seen that the main order of the influence of each factor on the RH was as follows: GF > LF > OD > FAR.
A comprehensive analysis of the extremes of the results of the simulation schemes revealed that the four spatial form influencing factors, namely the LF, FAR, GF, and OD, had different degrees of influence on the T, RH, and UTCI. Among them, the influence of the GF and LF on the overall microclimate of the study region was the most significant. It is worth noting that the order of the influence of the four influencing factors on the T and RH was consistent, which suggests that, to a certain extent, there was a correlation between the T and RH change patterns within the waterfront residential area. The FAR ranked at the bottom of the list for all three outcomes and had the least significant effect on the microclimate and the thermal comfort in the study region. By comparing the order of influence weights with regard to the microclimate and comfort, it can be seen that the influence of the GF was more significant, both for the UTCI and for the T and RH.

5. Conclusions and Discussion

5.1. Conclusions

This study examined microclimate variations among waterfront settlements in the HSCW zone composed of different spatial form factors. Orthogonal experiments through ENVI-met were used to simulate four key factors: the LF, FAR, GF, and OD, and their primary and secondary orders of influence on the microclimate and thermal comfort were obtained by polar analysis. Based on these findings, the following conclusions were drawn:
  • An analysis of the extreme variance revealed the following: the order of significance of the factors with regard to the UTCI was: OD > GF > LF > FAR. Similarly, the order of significance for T was: GF > LF > OD > FAR. The order of significance for RH was: GF > LF > OD > FAR. It can be seen that among the four factors, the GF and LF had a more significant impact on the overall microclimate of the study region, and the FAR had the least significant impact on each indicator.
  • Under the specific climatic conditions of the HSCW zone, waterfront settlements may experience high humidity and hot weather, with these having some impact on human thermal comfort. Therefore, when planning waterfront settlements, buildings should be rationally laid out to fully utilize the role of ventilation corridors in order to alleviate the discomfort caused by high temperatures and humidity. This study found that in the study region, the parallel layout form had better ventilation compared to the other three layout forms. In the comparative study of T and RH, it was found that the horizontal temperature distribution of the four parallel layout schemes ranged from 28.9 °C to 30.6 °C, and their vertical temperature distribution ranged from 28.8 °C to 30.5 °C, with these being lower than the temperatures recorded in the other three layout schemes. Additionally, their horizontal humidity distribution ranged from 84.4% to 88.5%, and their vertical humidity distribution ranged from 84.5% to 88.8%, with these distributions being higher than those in the other three layout schemes.
  • In the construction of waterfront settlements, reasonable GFs can provide such settlements with more comfortable living experiences. This study found the following: taking the Nan Lake area as an example, for the four greening forms of grass, shrubs, dwarf trees, and tall trees, the combination of “grass + shrubs” had the best cooling effect at the height of a pedestrian, while trees were found to reduce the heat transfer of solar radiation to the ground due to the shading and evaporation effects of their canopies.
  • In the summer, waterfront settlements are regulated by water bodies, creating a relatively mild microclimate that can provide residents with a natural escape from the heat. In this study, it was found that the cooling and humidifying effects provided by the water bodies of Nan Lake declined as the distance from the shore increased.

5.2. Discussion

Analysis of the data on the T and RH changes in the sixteen schemes revealed that the GF and LF largely affected the T and RH changes within the study region. The rational LF formed several ventilation corridors in the internal space of the waterfront settlement, providing a good ventilation effect and thus achieving the function of regulating the microclimate of the settlement. Meanwhile, the cooling effect and moisturizing ability of grass by itself had obvious limitations. Conversely, the rest of the GFs led to richer T and RH distributions, although these also changed with the distance; regardless, it is clear that they provided certain cooling and moisturizing effects. Therefore, it is recommended that shrubs be planted on both sides of the roads within settlements, while in more open outdoor areas, such as plazas and children’s playgrounds, trees can be planted around the perimeter in order to provide shade for the site as well as a cooling effect.
When building waterfront settlements, consideration should be given to the fact that their vertical distance should not be too long, and the distance between settlements and water bodies should be controlled by fully utilizing the shoreline so as to maximize the microclimate regulating effect of these bodies. At the same time, reasonable LFs and GFs can effectively mitigate the decline in the microclimate effect of water bodies experienced as the distance from their shorelines increases. When planning waterfront settlements in areas with hot summers and cold winters, it is recommended that reasonable combinations be adopted for different water conditions, with the aim of alleviating the discomfort caused by high summer temperatures, minimizing the urban heat island effect and achieving the goal of sustainable development.
Further, on the basis of previous research, this study explored the microclimate changes in waterfront settlements in the HSCW zone and used the research method of combining orthogonal experiments with extreme variance analysis to analyze the spatial morphology factors of waterfront settlements through vertical and horizontal comparisons and significance analyses. This research method not only identifies the relative importance of each influencing factor but also integrates the interactions between combinations of spatial morphology factors, providing ideas for the optimization of subsequent related studies.
Due to the many limitations of waterfront settlements in terms of their selection conditions for field case zones, in this study, the case zones were selected only with the goal of building an ideal model that maintained as much similarity to the study site as possible. During the course of the study, urban design methods were used to keep conditions such as the building spacing and green areas within the study region consistent. These pre-determined conditions ensured that the spatial environment and three-dimensional morphological characteristics of the vegetation caused less disturbance, allowing the study to focus on the influence of changes in the key spatial morphological factors on the microclimate of the study region. However, due to the complexity and diversity of the internal composition of the actual site, the microclimate changes in the actual waterfront settlement were influenced by more factors than those considered in this study. In this study, only one climate zone and four spatial form factors were considered, and in the simulation results, there were not many differences in the T, RH, and UTCI values among the schemes. In future research, the scope of this study can be expanded by adding additional simulated case scenarios, which would facilitate analysis of the role of more influencing factors and provide more reference strategies for the construction of future waterfront settlements.

Author Contributions

Conceptualization, N.G. and H.Z.; methodology, N.G. and H.Z.; software, N.G.; validation, N.G., H.Z., H.Y., Z.K. and P.W.; formal analysis, N.G., H.Z. and H.Y.; data curation, N.G., Z.K. and H.Y.; writing—original draft preparation, N.G; writing—review and editing, N.G.; visualization, N.G.; supervision, H.Z., N.H.W. and L.N.; project administration, H.Z.; funding acquisition, H.Z. All authors have read and agreed to the published version of the manuscript.

Funding

This work was supported by the Humanities and Social Science Research Project of the Ministry of Education of China (No. 22YJAZH146) and the National Natural Science Foundation of China (No. 51508169). It was also supported by the Local Cooperative Project of China Scholarship Council (No. 202008420322).

Institutional Review Board Statement

Not applicable.

Informed Consent Statement

Not applicable.

Data Availability Statement

Not applicable.

Acknowledgments

We are grateful to the Key Laboratory of Health Intelligent Perception and Ecological Restoration of River and Lake, Ministry of Education (HBUT), for providing the open research project for this study. This study was also supported by the research project “Research on Life Cycle Renewal Strategies for Urban Community Living Areas under the Goal of Dual Carbon” (No. XJ2021008201).

Conflicts of Interest

The authors declare no conflict of interest.

References

  1. World Meteorological Organization. State of the Global Climate 2022; World Meteorological Organization (WMO): Geneva, Switzerland, 2023; p. 4. [Google Scholar]
  2. Thompson, V.; Kennedy-Asser, A.T.; Vosper, E.; Lo, Y.E.; Huntingford, C.; Andrews, O.; Collins, M.; Hegerl, G.C.; Mitchell, D. The 2021 Western North America Heat Wave among the Most Extreme Events Ever Recorded Globally. Sci. Adv. 2022, 8, eabm6860. [Google Scholar]
  3. Lang, Q.; Yu, W.; Ma, M.; Wen, J. Analysis of the Spatial and Temporal Evolution of Land Cover and Heat Island Effects in Six Districts of Chongqing’s Main City. Sensors 2019, 19, 5239. [Google Scholar] [CrossRef]
  4. Wang, Z.F. The Relationship between Land Use, Land cover Change, and the Heat Island Effect in Xi’an City, China. Appl. Ecol. Env. Res. 2019, 17, 7795–7806. [Google Scholar] [CrossRef]
  5. Duan, S.; Luo, Z.; Yang, X.; Li, Y. The Impact of Building Operations on Urban Heat/Cool Islands under Urban Densification: A Comparison between Naturally-Ventilated and Air-Conditioned Buildings. Appl. Energy 2019, 235, 129–138. [Google Scholar] [CrossRef]
  6. Qiu, X.; Kil, S.-H.; Park, C. Impact of Local Environment on Cooling Island Effect of Water Body: Case Study of Changsha, China. Sens. Mater. 2021, 33, 3801. [Google Scholar] [CrossRef]
  7. Yang, L.; Liu, X.; Qian, F. Research on Water Thermal Effect on Surrounding Environment in Summer. Energy Build. 2020, 207, 109613. [Google Scholar] [CrossRef]
  8. Hathway, E.A.; Sharples, S. The Interaction of Rivers and Urban Form in Mitigating the Urban Heat Island Effect: A UK Case Study. Build. Environ. 2012, 58, 14–22. [Google Scholar] [CrossRef]
  9. Condie, S.A.; Webster, I.T. The Influence of Wind Stress, Temperature, and Humidity Gradients on Evaporation from Reservoirs. Water Resour. Res. 1997, 33, 2813–2822. [Google Scholar]
  10. The Japan Civil Engineering Society. Waterfront Landscape Design; Dalian University of Technology Press: Dalian, China, 2002; ISBN 978-7-5611-2123-8. [Google Scholar]
  11. Fei, F.; Wang, Y.; Jia, X. Assessment of the Mechanisms of Summer Thermal Environment of Waterfront Space in China’s Cold Regions. Sustainability 2022, 14, 2512. [Google Scholar] [CrossRef]
  12. Du, H.; Song, X.; Jiang, H.; Kan, Z.; Wang, Z.; Cai, Y. Research on the Cooling Island Effects of Water Body: A Case Study of Shanghai, China. Ecol. Indic. 2016, 67, 31–38. [Google Scholar] [CrossRef]
  13. Chen, H.; Li, B.; Zhou, X. Study on the Regulating Role of Water Bodies and Urban Microclimate--Taking Wuhan as an Example. Constr. Sci. Technol. 2011, 22, 72–73+77. [Google Scholar] [CrossRef]
  14. Li, S.-Y.; Xuan, C.-Y.; Li, W.; Chen, H.-B. Analysis of Microclimate Effects of Water Body in a City. Chin. J. Atmos. Sci. 2008, 32, 552–560. [Google Scholar]
  15. Wang, Y.; Ouyang, W.; Zhan, Q.; Zhang, L. The Cooling Effect of an Urban River and Its Interaction with the Littoral Built Environment in Mitigating Heat Stress: A Mobile Measurement Study. Sustainability 2022, 14, 11700. [Google Scholar] [CrossRef]
  16. Jiang, L.; Liu, S.; Liu, C.; Feng, Y. How Do Urban Spatial Patterns Influence the River Cooling Effect? A Case Study of the Huangpu Riverfront in Shanghai, China. Sustain. Cities Soc. 2021, 69, 102835. [Google Scholar] [CrossRef]
  17. Moyer, A.N.; Hawkins, T.W. River Effects on the Heat Island of a Small Urban Area. Urban Clim. 2017, 21, 262–277. [Google Scholar] [CrossRef]
  18. Jiang, Y.; Jiang, S.; Shi, T. Comparative Study on the Cooling Effects of Green Space Patterns in Waterfront Build-Up Blocks: An Experience from Shanghai. Int. J. Environ. Res. Public Health 2020, 17, 8684. [Google Scholar] [CrossRef]
  19. Jiang, Y.; Huang, J.; Shi, T.; Li, X. Cooling Island Effect of Blue-Green Corridors: Quantitative Comparison of Morphological Impacts. Int. J. Environ. Res. Public Health 2021, 18, 11917. [Google Scholar] [CrossRef]
  20. Jiang, Y.; Huang, J.; Shi, T.; Wang, H. Interaction of Urban Rivers and Green Space Morphology to Mitigate the Urban Heat Island Effect: Case-Based Comparative Analysis. Int. J. Environ. Res. Public Health 2021, 18, 11404. [Google Scholar] [CrossRef]
  21. Shi, D.; Song, J.; Huang, J.; Zhuang, C.; Guo, R.; Gao, Y. Synergistic Cooling Effects (SCEs) of Urban Green-Blue Spaces on Local Thermal Environment: A Case Study in Chongqing, China. Sustain. Cities Soc. 2020, 55, 102065. [Google Scholar] [CrossRef]
  22. Anjos, M.; Lopes, A. Urban Heat Island and Park Cool Island Intensities in the Coastal City of Aracaju, North-Eastern Brazil. Sustainability 2017, 9, 1379. [Google Scholar] [CrossRef]
  23. Sun, R.; Chen, A.; Chen, L.; Lü, Y. Cooling Effects of Wetlands in an Urban Region: The Case of Beijing. Ecol. Indic. 2012, 20, 57–64. [Google Scholar] [CrossRef]
  24. Srivanit, M.; Jareemit, D. Modeling the Influences of Layouts of Residential Townhouses and Tree-Planting Patterns on Outdoor Thermal Comfort in Bangkok Suburb. J. Build. Eng. 2020, 30, 101262. [Google Scholar] [CrossRef]
  25. Xu, J.; Wei, Q.; Huang, X.; Zhu, X.; Li, G. Evaluation of Human Thermal Comfort near Urban Waterbody during Summer. Build. Environ. 2010, 45, 1072–1080. [Google Scholar] [CrossRef]
  26. Fei, F.; Wang, Y.; Yao, W.; Gao, W.; Wang, L. Coupling Mechanism of Water and Greenery on Summer Thermal Environment of Waterfront Space in China’s Cold Regions. Build. Environ. 2022, 214, 108912. [Google Scholar] [CrossRef]
  27. Jang, G.; Kim, S.; Lee, J.S. Planning Scenarios and Microclimatic Effects: The Case of High-Density Riverside Residential Districts in Seoul, South Korea. Build. Environ. 2022, 223, 109517. [Google Scholar] [CrossRef]
  28. Xu, H.; Chen, H.; Zhou, X.; Wu, Y.; Liu, Y. Research on the Relationship between Urban Morphology and Air Temperature Based on Mobile Measurement: A Case Study in Wuhan, China. Urban Clim. 2020, 34, 100671. [Google Scholar] [CrossRef]
  29. Wang, Y.; Zhou, D.; Wang, Y.; Fang, Y.; Yuan, Y.; Lv, L. Comparative Study of Urban Residential Design and Microclimate Characteristics Based on ENVI-Met Simulation. Indoor Built Environ. 2019, 28, 1200–1216. [Google Scholar] [CrossRef]
  30. Yang, F.; Lau, S.S.Y.; Qian, F. Urban Design to Lower Summertime Outdoor Temperatures: An Empirical Study on High-Rise Housing in Shanghai. Build. Environ. 2011, 46, 769–785. [Google Scholar] [CrossRef]
  31. Jiang, Y.; Wu, C.; Teng, M. Impact of Residential Building Layouts on Microclimate in a High Temperature and High Humidity Region. Sustainability 2020, 12, 1046. [Google Scholar] [CrossRef]
  32. GB/50180-2018; The Planning and Design Standards for Urban Residential Areas. China Building Industrial Press: Beijing, China, 2018.
  33. 72577330X/2021-71247; Regulations on Planning and Management of Waterfront and Mountainous Areas of Wuhan City. Wuhan Natural Resources and Planning Bureau: Wuhan, China, 2021.
  34. Editorial Department of Wuhan Statistical Yearbook—2018. Wuhan Statistical Yearbook—2018; China Statistics Press: Wuhan, China, 2018; ISBN 978-7-5037-8523-54. [Google Scholar]
  35. Deng, Q.; Zhou, Z.; Shan, X.; Li, C.; Liu, D. Effects of Greening Areas and Water Bodies on Urban Microclimate in Wuhan—A Simulation Study Considering Prospective Planning. Atmosphere 2022, 13, 725. [Google Scholar] [CrossRef]
  36. Yang, B.; Meng, F.; Ke, X.; Ma, C. The Impact Analysis of Water Body Landscape Pattern on Urban Heat Island: A Case Study of Wuhan City. Adv. Meteorol. 2015, 2015, 416728. [Google Scholar] [CrossRef]
  37. Ji, B.; Liu, C.; Liang, J.; Wang, J. Seasonal Succession of Bacterial Communities in Three Eutrophic Freshwater Lakes. Int. J. Environ. Res. Public Health 2021, 18, 6950. [Google Scholar] [CrossRef] [PubMed]
  38. Pan, H.; Dong, H.; Wang, T. Study on the Relationship between Historical Evolution of Water System Morphology and Flooding in Wuhan’s Nan Lake. In Proceedings of the Sustainable Development and Rational Planning—Proceedings of the 2017 China Urban Planning Annual Conference, Dongguan, China, 18 November 2017; China Architecture & Building Press: Dongguan, China, 2017; pp. 38–45. [Google Scholar]
  39. Zhou, X.; Ooka, R.; Chen, H.; Kawamoto, Y.; Kikumoto, H. Impacts of Inland Water Area Changes on the Local Climate of Wuhan, China. Indoor Built Environ. 2016, 25, 296–313. [Google Scholar] [CrossRef]
  40. Wu, C.; Li, J.; Wang, C.; Song, C.; Chen, Y.; Finka, M.; La Rosa, D. Understanding the Relationship between Urban Blue Infrastructure and Land Surface Temperature. Sci. Total Environ. 2019, 694, 133742. [Google Scholar] [CrossRef]
  41. Zhu, D.; Zhou, X.; Cheng, W. Water Effects on Urban Heat Islands in Summer Using WRF-UCM with Gridded Urban Canopy Parameters—A Case Study of Wuhan. Build. Environ. 2022, 225, 109528. [Google Scholar] [CrossRef]
  42. Cao, Q.; Luan, Q.; Liu, Y.; Wang, R. The Effects of 2D and 3D Building Morphology on Urban Environments: A Multi-Scale Analysis in the Beijing Metropolitan Region. Build. Environ. 2021, 192, 107635. [Google Scholar] [CrossRef]
  43. Qi, X.; Zhao, X.; Fu, B.; Xu, L.; Yu, H.; Tao, S. Numerical Study on the Influence of Rivers on the Urban Microclimate: A Case Study in Chengdu, China. Water 2023, 15, 1408. [Google Scholar] [CrossRef]
  44. Peter, J.G.; David, J.S.; George, B.-W.; Mohammad, T. Evaluating the ENVI-Met Microscale Model for Suitability in Analysis of Targeted Urban Heat Mitigation Strategies. Urban Clim. 2018, 26, 188–197. [Google Scholar] [CrossRef]
  45. Alsaad, H.; Hartmann, M.; Hilbel, R.; Voelker, C. ENVI-Met Validation Data Accompanied with Simulation Data of the Impact of Facade Greening on the Urban Microclimate. Data Brief 2022, 42, 108200. [Google Scholar] [CrossRef]
  46. Chow, W.T.L.; Pope, R.L.; Martin, C.A.; Brazel, A.J. Observing and Modeling the Nocturnal Park Cool Island of an Arid City: Horizontal and Vertical Impacts. Theor. Appl. Clim. 2011, 103, 197–211. [Google Scholar] [CrossRef]
  47. Li, J.; Zheng, B.; Bedra, K.B.; Li, Z.; Chen, X. Effects of Residential Building Height, Density, and Floor Area Ratios on Indoor Thermal Environment in Singapore. J. Environ. Manag. 2022, 313, 114976. [Google Scholar] [CrossRef] [PubMed]
  48. Xu, H.; Lin, X.; Lin, Y.; Zheng, G.; Dong, J.; Wang, M. Study on the Microclimate Effect of Water Body Layout Factors on Campus Squares. Int. J. Environ. Res. Public Health 2022, 19, 14846. [Google Scholar] [CrossRef] [PubMed]
  49. Lin, H.-J.; Ma, H.-Y.; Zhang, M. Analysis of the variation characteristics of human thermal comfort in summer of China from 1980 to 2019 based on UTCI. Clim. Change Res. 2022, 18, 58–69. [Google Scholar] [CrossRef]
  50. Potchter, O.; Cohen, P.; Lin, T.-P.; Matzarakis, A. Outdoor Human Thermal Perception in Various Climates: A Comprehensive Review of Approaches, Methods and Quantification. Sci. Total Environ. 2018, 631–632, 390–406. [Google Scholar] [CrossRef]
  51. Wang, Y.; Pan, C.; Huang, Z. Comparison of applicability of PET and UTCI in different seasons in Shanghai. Build. Sci. 2020, 36, 55–61. [Google Scholar]
  52. Wei, D.; Yang, L.; Bao, Z.; Lu, Y.; Yang, H. Variations in Outdoor Thermal Comfort in an Urban Park in the Hot-Summer and Cold-Winter Region of China. Sustain. Cities Soc. 2022, 77, 103535. [Google Scholar] [CrossRef]
  53. Bröde, P.; Fiala, D.; Błażejczyk, K.; Holmér, I.; Jendritzky, G.; Kampmann, B.; Tinz, B.; Havenith, G. Deriving the Operational Procedure for the Universal Thermal Climate Index (UTCI). Int. J. Biometeorol. 2012, 56, 481–494. [Google Scholar] [CrossRef]
  54. Fiala, D.; Havenith, G.; Bröde, P.; Kampmann, B.; Jendritzky, G. UTCI-Fiala Multi-Node Model of Human Heat Transfer and Temperature Regulation. Int. J. Biometeorol. 2012, 56, 429–441. [Google Scholar] [CrossRef]
  55. Havenith, G.; Fiala, D.; Błazejczyk, K.; Richards, M.; Bröde, P.; Holmér, I.; Rintamaki, H.; Benshabat, Y.; Jendritzky, G. The UTCI-Clothing Model. Int. J. Biometeorol. 2012, 56, 461–470. [Google Scholar] [CrossRef]
  56. Adekunle, T.O.; Nikolopoulou, M. Winter Performance, Occupants’ Comfort and Cold Stress in Prefabricated Timber Buildings. Build. Environ. 2019, 149, 220–240. [Google Scholar] [CrossRef]
Figure 1. The study’s research methodology.
Sustainability 15 15687 g001
Figure 2. Evolution of the extent of the Nan Lake system (2000–2022) (Viewing angle elevation: 11.21 km).
Sustainability 15 15687 g002
Figure 3. Schematic of the scope of the study.
Sustainability 15 15687 g003
Figure 4. Schematic of the simulation site.
Sustainability 15 15687 g004
Figure 5. Location of actual points included in the study.
Sustainability 15 15687 g005
Figure 6. Points arrangement.
Sustainability 15 15687 g006
Figure 7. Settlements model.
Sustainability 15 15687 g007
Figure 8. Comparison of the measured and simulated temperatures.
Sustainability 15 15687 g008
Figure 9. Comparison of the measured and simulated relative humidity.
Sustainability 15 15687 g009
Figure 10. Comparison of the measured and simulated wind speed.
Sustainability 15 15687 g010
Figure 11. Sampling points for the analog program data.
Sustainability 15 15687 g011
Figure 12. Transverse temperature change patterns.
Sustainability 15 15687 g012
Figure 13. Longitudinal temperature change patterns.
Sustainability 15 15687 g013
Figure 14. Change patterns of transverse humidity variation.
Sustainability 15 15687 g014
Figure 15. Change patterns of vertical humidity variation.
Sustainability 15 15687 g015
Table 1. Summary information on settlements around Nan Lake.
No.StoryLFBOGR (%)FAR
17Staggered layoutSouth–north25.12.4
213Combined layoutSouth–north28.63.2
34/7Combined layoutSouth–north32.52.2
44Parallel layoutSouth–north32.82.4
56Parallel layoutSouth–north32.02.9
66/12Parallel layoutSouth–north33.52.4
77/11Parallel layoutSouth–north35.01.0
89Parallel layout/Staggered layoutSouth–north42.01.1
96Parallel layoutSouth–north42.41.3
105/10Parallel layoutSouth–north40.31.5
116Staggered layoutSouthwest–northeast35.41.6
1242/13Combined layoutSouth–north42.11.7
1329Staggered layoutSouthwest–northeast42.22.1
1417Staggered layoutSouth–north40.02.5
1516Enclosed layoutSouth–north42.33.0
1625Enclosed layoutDisordered40.23.5
1730Enclosed layout/Staggered layoutSouthwest–northeast40.53.8
187Combined layoutDisordered35.43.7
1916/27Staggered layoutSoutheast–northwest40.74.0
2027Parallel layoutSouth–north36.83.0
216/31Staggered layoutSouthwest–northeast37.33.4
2218Parallel layoutSouth–north38.62.2
2318Staggered layoutSouth–north42.32.3
2417Parallel layoutSouth–north41.32.4
257/12Parallel layoutSouth–north40.52.3
2648Staggered layoutSouth–north40.33.3
276Parallel layoutSoutheast–northwest41.01.3
2815/3Enclosed layout/Combined layoutDisordered45.61.3
2930Staggered layoutDisordered45.22.2
3016Parallel layoutSouthwest–northeast45.22.6
316Parallel layoutSouth–north53.01.6
327Parallel layoutSouth–north40.61.5
Table 2. Classification of spatial layout forms in Nan Lake waterfront settlements.
LFSchematic PlanSpatial Representation
Parallel layoutSustainability 15 15687 i001Sustainability 15 15687 i002
Staggered layoutSustainability 15 15687 i003Sustainability 15 15687 i004
Combined layoutSustainability 15 15687 i005Sustainability 15 15687 i006
Enclosed layoutSustainability 15 15687 i007Sustainability 15 15687 i008
Table 3. Classification of the level of each factor.
FactorsLevel 1Level 2Level 3Level 4
LFParallel layoutStaggered layoutCombined layoutEnclosed layout
FAR1.52.02.53.0
GFGrassGrass + shrubsGrass + dwarf treesGrass + tall trees
OD50 m150 m250 m350 m
Table 4. Orthogonal experiments carried out in the study.
NO.LFFARGFOD (m)
1Parallel layout1.5Grass50
2Parallel layout2.0Grass + shrubs150
3Parallel layout2.5Grass + dwarf trees250
4Parallel layout3.0Grass + tall trees350
5Staggered layout1.5Grass + shrubs250
6Staggered layout2.0Grass350
7Staggered layout2.5Grass + tall trees50
8Staggered layout3.0Grass + dwarf trees150
9Combined layout1.5Grass + dwarf trees350
10Combined layout2.0Grass + tall trees250
11Combined layout2.5Grass150
12Combined layout3.0Grass + shrubs50
13Enclosed layout1.5Grass + tall trees150
14Enclosed layout2.0Grass + dwarf trees50
15Enclosed layout2.5Grass + shrubs350
16Enclosed layout3.0Grass250
Table 5. Summary of model information.
LFParallel LayoutStaggered LayoutCombined LayoutEnclosed Layout
Schematic planSustainability 15 15687 i009Sustainability 15 15687 i010Sustainability 15 15687 i011Sustainability 15 15687 i012
Settlement model dimensions530 m × 470 m
Individual building dimensions30 m × 15 m
FAR range1.5–3.0
Table 6. Architectural model size parameters.
LFFARHeight (m)Story
Parallel layout/Staggered layout1.53010
2.03913
2.54816
3.06020
Combined layout1.53612
2.04515
2.55719
3.06923
Enclosed layout1.53913
2.05117
2.56622
3.07826
Table 7. Comparison of measured and simulated error values.
PointT/RMSERH/MAPEWS/RMSE
11.0644144.90%0.457999
20.8021873.60%0.809417
31.1055722.40%0.393414
Table 8. Orthogonal design for analog schemes.
NO.LFFARGFOD/mUTCI/°CT/°CRH/%
1Parallel layout1.5Grass5037.930.584.6
2Parallel layout2.0Grass + shrubs15034.229.088.2
3Parallel layout2.5Grassland + dwarf trees25034.429.188.3
4Parallel layout3.0Grassland + tall trees35034.729.787.8
5Staggered layout1.5Grass + shrubs25035.129.487.3
6Staggered layout2.0Grass35035.730.983.9
7Staggered layout2.5Grassland + tall trees5037.330.285.7
8Staggered layout3.0Grassland + dwarf trees15034.929.686.9
9Enclosed layout1.5Grassland + dwarf trees35036.229.786.6
10Enclosed layout2.0Grassland + tall trees25036.130.186.4
11Enclosed layout2.5Grass15037.130.585.1
12Enclosed layout3.0Grass + shrubs5036.329.886.4
13Combined layout1.5Grassland + tall trees15035.529.987.0
14Combined layout2.0Grassland + dwarf trees5036.929.886.1
15Combined layout2.5Grass + shrubs35036.130.185.7
16Combined layout3.0Grass25036.430.485.2
Table 9. Significance analysis of factors affecting UTCI.
Mean UTCI at Each LevelImpact Factors
LFFARGFOD
k135.3036.1536.7937.12
k235.7635.7735.4135.42
k336.4236.2435.6235.52
k436.2635.5835.9235.67
R1.120.661.381.70
Table 10. Significance analysis of factors affecting T.
Mean T at Each LevelImpact Factors
LFFARGFOD
k129.5929.8830.5730.08
k230.0129.9929.5929.77
k330.0229.9829.5529.74
k430.0829.8729.9730.11
R0.490.121.020.37
Table 11. Significance analysis of factors affecting RH.
Mean RH at Each LevelImpact Factors
LFFARGFOD
k187.2186.3684.6985.69
k285.9586.1686.9186.80
k386.1086.1886.9786.79
k486.0186.5686.7085.98
R1.260.402.281.11
Disclaimer/Publisher’s Note: The statements, opinions and data contained in all publications are solely those of the individual author(s) and contributor(s) and not of MDPI and/or the editor(s). MDPI and/or the editor(s) disclaim responsibility for any injury to people or property resulting from any ideas, methods, instructions or products referred to in the content.

