Abstract
Cities are facing significant challenges related to climate change, particularly due to the increasing impact of the Urban Heat Island (UHI) phenomenon. The present study investigated the UHI phenomenon at the microscale in Annaba, Algeria. The research involved a multi-step approach, starting with on-site measurements of urban microclimate parameters, performed in downtown Annaba on 6 July 2023. The UHI intensity was quantified by comparing city-measured temperatures with rural surroundings. Thermal imaging is then used to empirically identify the contributing factors to UHI initiation at the microscale. The study employed the ENVI-met model to analyse mitigation strategies, manipulating parameters for six scenarios including the current design of the study area. Outputs were used to assess the impact of these strategies on air temperature, mean radiant temperature, relative humidity, and wind speed. The findings revealed an intense UHI effect in Annaba city with a peak difference of 6.9 °C, with practical implications for buildings, ground and roads, vehicles, air conditioners, and specific facade materials. Introducing urban vegetation, particularly urban trees and green roofs, proved highly effectiveness in mitigating the UHI in downtown Annaba. Urban trees demonstrated the most substantial impact, reducing temperatures by 1.9 °C at 1 p.m., while green roof temperature reductions ranged from 0.1 °C to 2 °C.
1. Introduction
Urban areas are at the forefront of climate change challenges, with the intensification of the Urban Heat Island (UHI) phenomenon posing significant threats to the well-being of both the environment and urban dwellers [1,2]. As cities continue to expand and global temperatures rise, understanding and mitigating the impacts of urban overheating have become imperative for sustainable urban development [3,4]. The Urban Heat Island (UHI) phenomenon is a complex and multifaceted aspect of urban environments, manifesting itself through the notable elevation of temperatures within city limits in stark contrast to the cooler environs of rural landscapes [5]. This distinct temperature stems from a variety of interconnected factors, intricately woven into the urban fabric [6,7]. One of the primary contributors to the UHI effect is the transformative alteration of land surfaces within urban areas. The expansive sea of concrete and asphalt that characterizes urban landscapes absorbs and retains solar radiation throughout the day, creating a heat reservoir that continues to radiate warmth into the night [8,9]. This altered surface composition, with its reduced capacity to release absorbed heat, significantly amplifies the overall thermal profile of urban locales [10]. Furthermore, the substitution of natural vegetation with impervious surfaces exacerbates the UHI phenomenon [11,12]. Trees and green spaces in rural areas play a crucial role in mitigating heat through the process of evapotranspiration, where plants release water vapor into the air [13,14,15,16]. In contrast, urban areas often witness a reduction in greenery, leading to decreased evapotranspiration and a subsequent rise in temperatures [17,18]. Another pivotal element contributing to UHI is the escalation of anthropogenic heat sources within urban settings [19,20]. The concentration of human activities, industrial processes, and vehicular traffic generates excess heat, intensifying the thermal disparity between urban and rural regions [21,22]. This anthropogenic heat release becomes particularly pronounced during nighttime, when the dissipation of heat from various sources is less impeded, resulting in elevated urban temperatures during the nocturnal hours [19,23]. The consequences of the UHI phenomenon extend beyond mere temperature differentials. Elevated urban temperatures can contribute to a variety of challenges, including increased energy consumption for cooling, heightened air pollution, and amplified heat-related health risks for urban residents [6,24,25,26]. As cities continue to expand and develop, understanding and addressing the intricate factors contributing to the Urban Heat Island effect becomes imperative for fostering sustainable urban development and enhancing the overall resilience of urban environments [27,28].
Urban overheating, a direct consequence of the Urban Heat Island (UHI) phenomenon, manifests itself when cities undergo extended periods of exceptionally elevated temperatures [29,30]. The intricate fabric of the urban landscape, characterized by concrete structures, asphalt roads, and a scarcity of green spaces, serves as a heat-absorbing entity, trapping and holding onto thermal energy [10,31]. This leads to the formation of microclimates within urban areas, intensifying the discomfort experienced by residents due to increased temperatures [32,33]. In the face of escalating climate change, the incidence and severity of urban overheating events are escalating, amplifying the associated health hazards and placing unprecedented strain on urban infrastructure [25,34,35]. As global temperatures continue to rise, the urban environment becomes increasingly susceptible to prolonged heatwaves, making it imperative for cities to adopt strategic measures to mitigate the impacts of this growing challenge [36,37,38]. The imperative to enhance resilience and adaptability in urban planning and infrastructure becomes ever more urgent in order to safeguard the well-being of urban populations and ensure the sustainable development of our cities in the face of this mounting threat [39,40]. Addressing the multifaceted challenges of urban overheating requires a comprehensive approach that integrates urban planning, green infrastructure development, and community engagement. Implementation of cool roofs, green spaces, and reflective surfaces can mitigate the Urban Heat Island effect, offering relief to communities and reducing the overall energy demand for cooling [37,39,41,42]. Furthermore, community-based initiatives, such as heat action plans and public awareness campaigns, play a crucial role in fostering resilience and ensuring equitable access to cooling resources.
Delving deeper into the intricate web of factors that contribute to Urban Heat Island (UHI) and urban overheating necessitates a comprehensive approach, blending interdisciplinary research with cutting-edge monitoring techniques. The amalgamation of satellite imagery, on-site measurements, and sophisticated climate models serves as an indispensable toolkit for scientists striving to unravel the multifaceted interactions among land use, meteorological conditions, and human activities within built-up areas. Satellite imagery, with its broad spatial coverage and temporal resolution, provides invaluable insights into the spatial distribution of surface temperatures across urban areas. This macroscopic perspective allows researchers to discern patterns and variations, facilitating a holistic understanding of UHI dynamics [31,43,44]. Meanwhile, on-site measurements offer a fine-grained analysis, capturing localized nuances and nuances that may escape the satellite’s purview [45,46]. Combining these approaches allows scientists to create a more nuanced and accurate depiction of UHI, paving the way for targeted interventions. Moreover, advanced climate models play a pivotal role in simulating and forecasting the intricate interplay of factors contributing to UHI [47,48]. These models enable researchers to project future scenarios, considering the evolving dynamics of land use, climate patterns, and human behaviour. By integrating diverse data sources into these models, scientists can gain a predictive understanding of how UHI might evolve, allowing for proactive urban planning strategies and the development of resilient infrastructure [36,49,50,51].
Several cities around the world have become hotspots for UHI research and mitigation efforts. For instance, China has implemented innovative strategies, including green roofs, urban greenery, and sustainable urban planning, to combat overheating [23,52,53]. In Baghdad, researchers are focusing on microclimate studies and green spaces to counter rising temperatures [54,55,56]. Recent Urban Heat Island (UHI) research and mitigation in Algeria have predominantly focused on arid and semi-arid climates due to their heightened susceptibility to UHI effects [57,58]. However, a notable shift has occurred in the past few years, with an increasing academic and practical interest in extending these efforts to Mediterranean climates [59,60]. This expanding scope acknowledges the distinct challenges posed by UHI in diverse environments and underscores the need for tailored mitigation strategies.
Our research is designed with the perspective of investigating the Urban Heat Island (UHI) phenomenon, with a particular emphasis on the microscale of the Mediterranean cities. Recognizing the predominant focus on arid and semi-arid climates in past UHI studies in Algeria, our approach seeks to broaden the scope and contribute to a more comprehensive understanding of UHI dynamics. This study focuses on intentionally addressing the Mediterranean climate, which is characterized by specific environmental factors. The goal is to measure the intensity of the Urban Heat Island (UHI), pinpoint the factors that contribute to its initiation, and develop context-specific mitigation strategies. This intentional consideration of Mediterranean climatic boundaries reflects our commitment to addressing the multifaceted nature of UHI effects and underscores the significance of addressing a wider range of climates in the pursuit of effective and adaptable solutions.
2. Materials and Methods
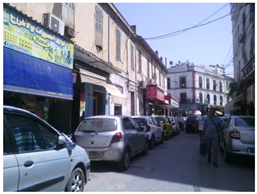
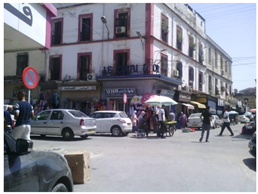
2.1. Study Site
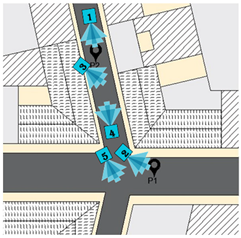
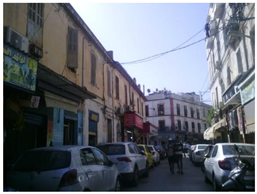
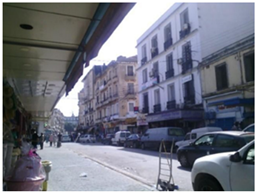
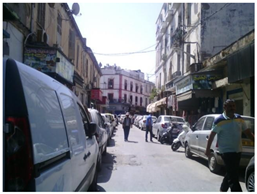
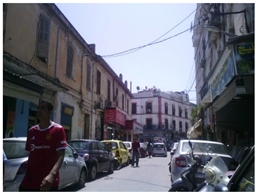
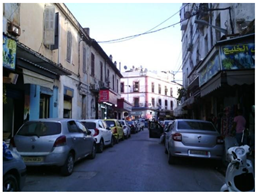
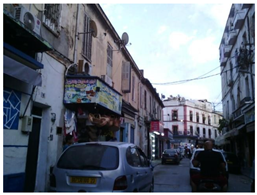
This study was conducted in the Mediterranean city of Annaba (Long: 7°46′0″, Lat: 36°53′59″). The city is located in the extreme northeast of Algeria, 600 km from the capital Algiers, between the Seybouse River and the Tunisian border, as shown in Figure 1a. To achieve the study’s goals, we strategically focused our research efforts on a limited area within the downtown of Annaba city, Figure 1b. Then, we refined our investigative focus to encompass two discrete locations, namely P1 and P2, situated along interconnected thoroughfares. Specifically, P1 is situated along El-Kods Street characterized by canyon geometry, while P2 is positioned within Ibn Khaldoun Street, which is an exposed, unobstructed street, as shown in Figure 1c.
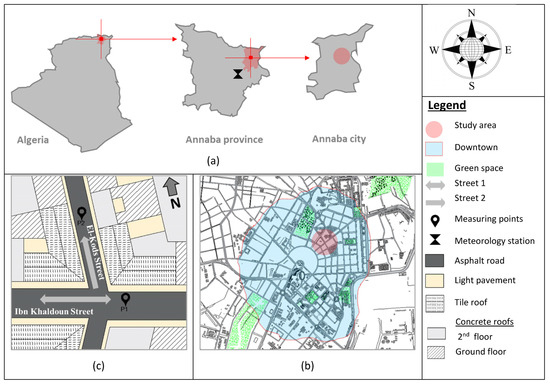
Figure 1.
Study site: (a) location of Annaba city, (b) downtown Annaba, (c) study area.
2.2. Methodological Framework
This study was conducted with the overarching aim of comprehensively investigating the Urban Heat Island (UHI) phenomenon and associated microclimate variations at the microscale within the city of Annaba, Algeria. As presented in Figure 2, the methodological framework encompasses several sequential steps. First, microclimate data collection is initiated, wherein on-site measurements within Annaba’s downtown and meteorological station measurements, specifically focusing on air temperature (Ta), relative humidity (RH), and wind speed (Ws) every half-hour within two streets. These reference measurements were obtained from the airport meteorological station, located 15.4 km from downtown. The station is situated in a flat expanse with short grass, devoid of trees, buildings, walls, or steep slopes. The instrumentation employed for data collection within downtown Annaba included high-precision devices for air temperature and relative humidity and anemometers for wind speed. The frequency of data acquisition was established at a half-hour interval to ensure a comprehensive understanding of temporal variations in the microclimate parameters. Following the data collection phase, the quantification of UHI intensity was then performed, representing the positive differential between the air temperature recorded at the downtown and the rural surroundings (meteorology station measurements) for each specific time frame. Subsequently, thermal imaging techniques were deployed during on-site measurements from 10 a.m. to 6 p.m. to empirically identify and characterize the contributing factors to UHI at the microscale, thereby affording an in-depth understanding of the spatial distribution of heat within the urban environment. Following this, this study employed the ENVI-met microclimate model to conduct a comprehensive analysis of different mitigation strategies. Mitigation strategies in this context refer to measures aimed at addressing environmental conditions, including challenges such as high temperatures, radiant heat, humidity, and wind speed. Multiple scenarios were created by manipulating parameters such as building heights, materials, and vegetation distribution within the ENVI-met model. These parameters serve as adjustable variables representing different aspects of the environment. Each scenario, thus, represents a unique combination of mitigation strategies. Subsequently, ENVI-met’s microscale simulations were performed for each scenario to assess their impact on microclimate conditions. The simulations evaluated variables such as air temperature (Ta), Mean Radiant Temperature (MRT), relative humidity (RH), and wind speed (Ws), providing a detailed understanding of how the manipulated parameters influence the microclimate. Our methodology aligns with a parallel research project in the United Kingdom focused on urbanization and climate change mitigation. The UK study, utilizing ENVI-met simulations, highlighted the importance of addressing UHI to mitigate climate change impacts and identified building form, orientation, and layout as key effective UHI mitigation strategies [4].
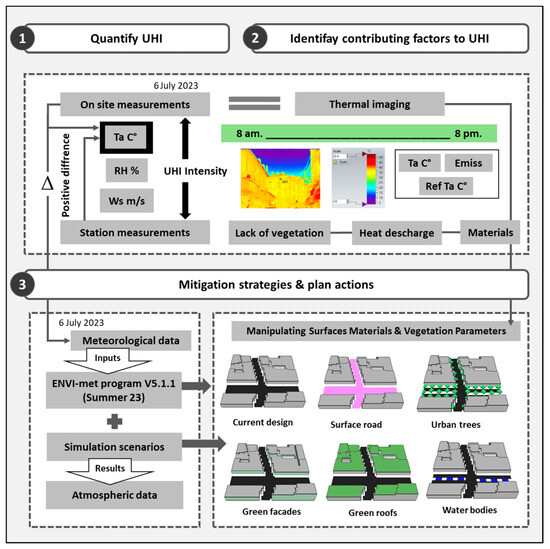
Figure 2.
Methodology chart.
2.2.1. On-Site Measurements and Thermal Imaging
The on-site measurements within downtown Annaba were conducted on an overheating day; on 6 July 2023, we performed an extensive measurement campaign from 8 a.m. to 8 p.m. The investigation involved two distinct points, denoted as P1 and P2, strategically positioned within the area’s investigation. P1 is located within El-Kods Street, which is a canyon road, connected to the open, unobstructed Ibn Khaldoun Street where P2 is situated. We obtained data on air temperature and relative humidity using a multifunctional device, specifically an ‘Air Quality Monitoring Particle Counter PCE-MPC 20’. This portable device operates as more than just a particle counter; it also serves as a comprehensive environmental monitor by measuring air temperature and relative humidity with a respective measuring accuracy of ±1.0 °C and ±3.5%, offering a holistic approach to atmospheric analysis. To ensure unbiased data collection, the instrument was consistently positioned at a height of 1.5 m in both P1 and P2 locations and mounted on a white support, effectively neutralizing any potential impact on measurement readings. Simultaneously, we gathered wind speed measurements employing an anemometer ‘PROVA AVM-07 Anemometer’ at a height of 2.2 m. It is employed for measuring wind speeds, temperatures, and environmental conditions, with a wind velocity range of 0.0 to 45.0 m/s and an accuracy of ±0.3 m/s. All data were collected under optimal conditions, characterized by a clear sky, high sun exposure, and maximum thermal heat stress.
Our measurements were synchronized, ensuring a precise alignment of data collection timelines between the two points. Additionally, to complement our quantitative data, we acquired a series of thermal images concurrently in both streets, using the thermal imager ‘testo 871, version 1.14.0’. It has a thermal sensitivity of 0.08 °C, effectively displaying small temperature differences with real-time transmission of ambient temperature and humidity readings, and features a mold-risk visualization with traffic light colors. The thermal images proved highly effective in visually illustrating the spatial distribution and propagation of heat within the urban environment due to the imager smart functionalities facilitated by the free ‘testo IRSoft software, version 5.0’. The instruments used for data collection are shown in Figure 3.
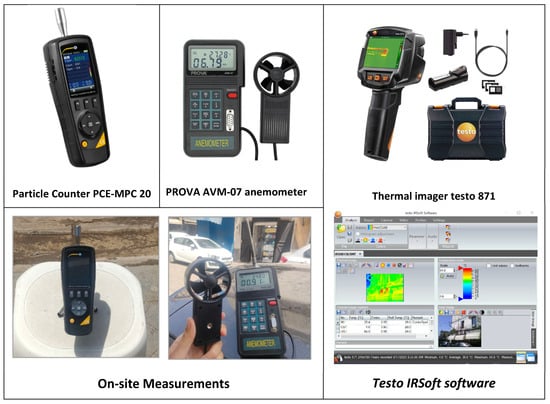
Figure 3.
The instruments used for data collection.
2.2.2. Envi-Met Simulation Model
As aforementioned, the study employed the ENVI-met microclimate model, specifically utilizing the licensed version V5.5.1 Summer 23. The microscale simulations were conducted for six distinctive scenarios situated within downtown Annaba on a sunlit summer day, 6 July 2023, as shown in Table 1.

Table 1.
Simulation conditions of downtown Annaba (V5.5.1, Summer 23).
The modelling process adhered to a structured methodology following the outlined steps. Initially, the settings of the study area were modified by employing the “space” functionality within the ENVI-met program. Subsequently, a simulation file was created by inputting pertinent data such as date, time, location, and meteorological parameters, utilizing the “Envi-guide” functionality. The simulation was then executed using the “Envi-core” functionality. Furthermore, the integrated “Biomet” tool was employed to generate additional thermal data, including thermal indices. Finally, the whole outputs were visualized using the “Leonardo” functionality as clarified in Figure 4. This methodology draws inspiration from a similar approach used in a research study focused on investigating the effect of Urban Heat Island mitigation scenarios. In that study, extensive green roofs, green façades, and living walls were applied to two built areas within Turin and Rome, Italy. Three mitigation scenarios and a baseline one were developed in ENVI-met software (V5.5.1 Summer 23) for each built area and run for a typical winter day, summer day, and summer day with a heatwave [61].
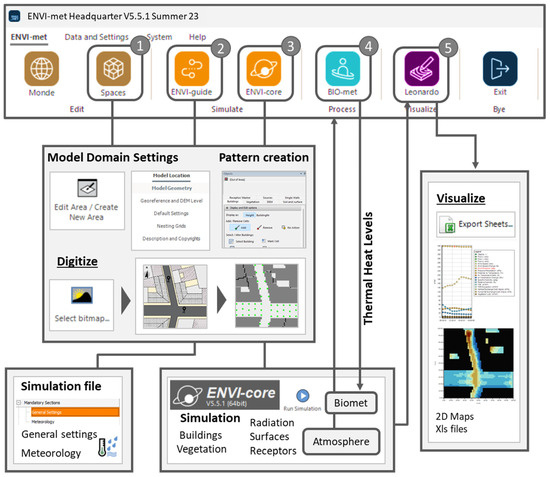
Figure 4.
ENVI-met workflow (Version 5.5.1, Summer 23).
The output data resulting from these simulations included microclimatic variables, including air temperature (Ta), Mean Radiant Temperature (MRT), relative humidity (RH), and wind speed (Ws). Each of the six scenarios was meticulously designed to represent a distinct mitigation strategy for alleviating Urban Heat Island (UHI) effects at the microscale. This comprehensive dataset was then analysed to discern and evaluate the discernible impacts of the various scenarios on microclimate conditions. The primary objective of this analysis was to ascertain the efficacy of each mitigation strategy in mitigating UHI effects at the microscale, thereby contributing to a deeper understanding of the interplay between the thermal urban environment and microclimatic conditions in downtown Annaba.
3. Results
3.1. Quantification of the UHI Phenomenon
In order to quantify the Urban Heat Island in Annaba city, the study investigated the diurnal variations in air temperature between the downtown and surrounding region in two disparate locations, P1 and P2 on a sunny summer day, specifically 6 July 2023. Employing the measured values of air temperature and the recorded air temperature from the meteorology station throughout a 12-h period from 8 a.m. to 8 p.m., this study aimed to discern the nuanced microclimate disparities and their temporal evolution throughout the day. The results are presented in the bar graph below (Figure 5). There is a notable discrepancy in air temperature between downtown and the surrounding area of location P1, with the highest recorded difference peaking at 6.9 °C. Notably, this critical temperature variation was most pronounced during the time interval from 12 p.m. to 2 p.m. in both locations P1 and P2. Subsequently, a discernible shift in the overall trend was observed. During the three hours preceding 3 p.m. to 5 p.m., the temperature differentials exhibited a decline, characterized by lower values, ranging from 5° to 3.1 °C. However, this trend reversed thereafter, with an increase in differentials. The analysis further disclosed that the lowest differentials of 1.3 °C occurred during the initial two hours of the observation period in location P1. The mean daily temperature difference, calculated across the entire observation period, exhibited a range between 4.5° and 4.8 °C.
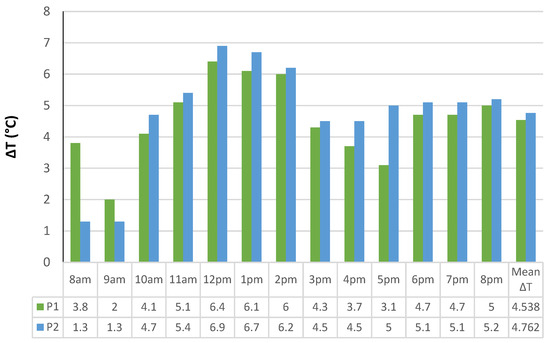
Figure 5.
Positive differential of urban temperatures in P1 and P2 within downtown Annaba, 6 July 2023.
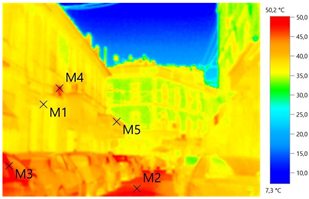
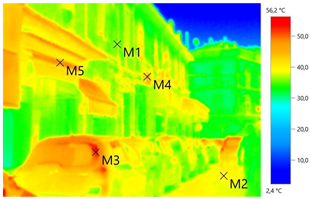
3.2. Identification of Factors Contributing to UHI Phenomenon
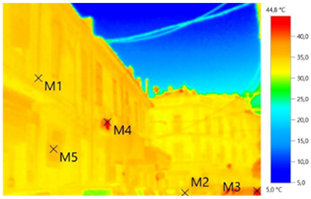
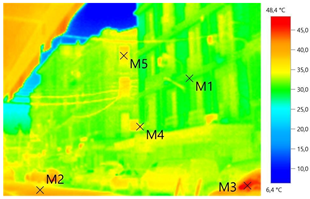
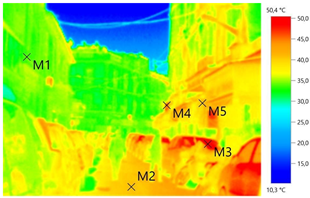
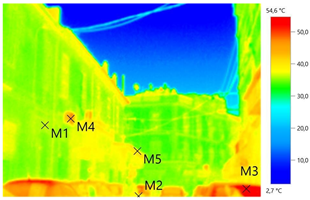
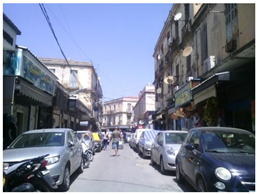
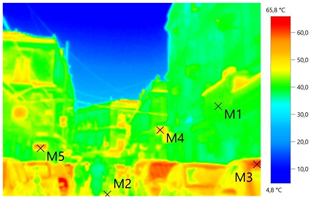
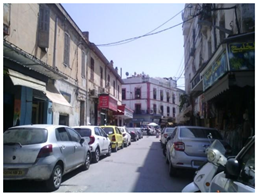
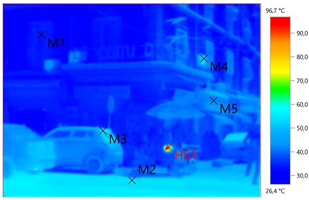
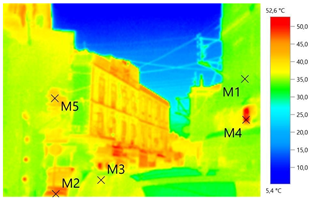
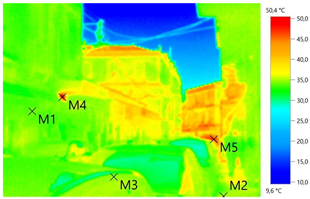
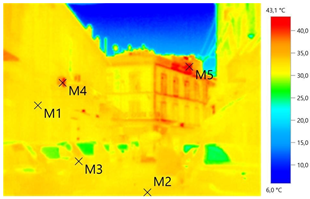
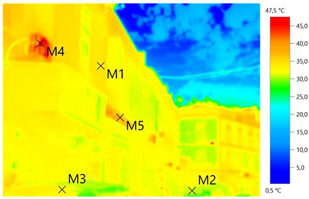
In our study, the Urban Heat Island (UHI) phenomenon was confirmed to be present within the agglomeration of Annaba, prompting an investigation into the primary factors influencing its initiation and propagation. To comprehensively delineate these factors, a thermal imaging approach was employed. The research involved the systematic capture of thermal images across the downtown area of Annaba city, spanning the course of the daytime on 6 July 2023 from 10 a.m. to 6 p.m. To ensure a comprehensive analysis, thermal images were captured from various vantage angles, as detailed in the accompanying Table 2. The investigation emphasized five critical measurement points denoted as M1–M5 and Hs. Specifically, M1 represents surface building temperature, M2 focuses on the surface road temperature, M3 pertains to parked vehicles temperature, M4 represents the air conditioners temperature, and M5 is indicative of special surface facades temperature, while Hs indicates a hot spot due to a temporary activity.
Table 2.
Thermal imaging parameters of downtown Annaba.
The selection of measurement objects aims to provide a nuanced understanding of the multifaceted contributors to the UHI phenomenon, thereby informing targeted mitigation strategies and urban planning interventions. The ensuing Table 3 encapsulates the empirical findings, offering a comprehensive overview of temperature distributions among the studied objects.
Table 3.
Thermal imaging results of downtown Annaba.
3.2.1. Buildings Materials
The colonial buildings of downtown Annaba characterized by their reinforced brick walls and roofing tile have experienced mean surface temperatures within the range of 28.3 °C to 36.6 °C during the period from 10 a.m. to 6 p.m. Remarkably, these values did not surpass the concurrent air temperatures, exhibiting a consistent differential margin of 3 °C to 9.9 °C between surface and air temperatures. A notable surge in the building’s surface temperature was particularly evident at noon, where the temperature difference was a minimum of 3.8 °C. Thermal imaging revealed a nuanced pattern, highlighting that the shaded walls of these buildings exhibited lower surface temperatures during the morning hours. Specifically, walls in the shaded Ibn Khaldoun Street demonstrated a surface temperature of 28.3 °C at 10 a.m., in contrast to the sun-exposed walls located in El-Kods Street which recorded higher values of 32.9 °C. This discrepancy emphasizes the discernible impact of shading on the thermal characteristics of the buildings.
3.2.2. Ground and Road Materials
The thermal imaging conducted in downtown Annaba focused on the ground surface (M2), spanning from 10 a.m. to 6 p.m., elucidates a discernible trend in the asphalt road’s temperature dynamics. The data indicate a progressive rise in surface temperature from the early morning hours, of which the hottest period manifested between 12 p.m. and 3 p.m., culminating in its peak at 2 p.m. Precisely at that juncture, the shaded asphalt road in El-Kods Street displayed a relatively low surface temperature of 46.3 °C compared to Ibn Khaldoun Street, fully exposed to the sun, recorded a significantly higher ground surface temperature of 50.8 °C. Subsequently, over the following three hours from 4 p.m. to 6 p.m., a discernible decline in temperature is observed, signifying a milder hot trend. This temporal evolution of asphalt temperature underscores the impact of shade on the object surface temperature and microclimatic variations within urban environments influencing the overall urban heat dynamics.
3.2.3. Vehicle Surface Materials and Heat Discharge
The thermal imaging study conducted in downtown Annaba city between 10 a.m. and 6 p.m. meticulously examined the surface materials and heat discharges of various objects, with particular emphasis on vehicular sources. The findings underscore a pronounced influence of vehicles on the thermal environment, emerging as the foremost contributors to heat generation among the five scrutinized objects presented in Table 2. Notably, temperatures associated with vehicular surfaces exhibited a significant range, fluctuating between 46.4 °C and 60.6 °C spanning a time period of four hours from 10 a.m. to 2 p.m. The peak of this temperature trend, a noteworthy 60.6 °C, was documented during full sun exposure at noon. Further understanding of the observed influence of vehicles on the thermal dynamics is required focusing on the number and types of vehicles present, as well as their operational states, distinguishing between parked and in-motion vehicles.
3.2.4. Air Conditioners Heat Discharge
The thermal imaging study of downtown Annaba, meticulously focused on scrutinizing the heat discharges emanating from a considerable number of air conditioning systems from 6 a.m. to 8 p.m. The findings indicate a noteworthy observation: air conditioners, exceeding five units for each building, significantly contribute to elevating temperatures within the urban thermal environment, exhibiting a temperature range of 42.6 °C to 50.7 °C. Particularly noteworthy is that the higher values of temperatures are generated by air conditioners at 10 a.m. and persisting prominently from 3 p.m. to 6 p.m., with a high temperature of 50.7 °C recorded at 3 p.m. It is imperative to highlight that, intriguingly, the temperature trend of air conditioners continued its ascent even during periods when ambient air temperatures exhibited a decline, notably from 2 p.m. to 6 p.m.
3.2.5. Specific Facade Materials
In downtown Annaba and specifically in the study area, wherein the ground floors are intended for commercial activities, a distinctive facade treatment is observed, notably employing Aluminum Composite Materials (ACMs). Remarkably, while commercial premises predominantly feature ACMs, residential structures on the first and second floors maintain their original construction materials, namely reinforced brick, wooden windows, and wrought iron balconies. As part of the thermal imaging investigation, temperatures of these specific facade materials were systematically measured from 6 a.m. to 8 p.m. The findings indicate a remarkable thermal contrast, with ACMs showing elevated temperatures ranging from 38.3 °C to 48.1 °C, notably surpassing the more temperate readings associated with wrought iron, which did not exceed 35 °C. Intriguingly, the peak temperatures were recorded during the midday hours, specifically from 11 a.m. to 5 p.m., demonstrating a notable decline in thermal levels by the conclusion of the measurement period.
3.2.6. Human Activity
In addition to the aforementioned factors, the thermal imaging investigated human activities that significantly contribute to heat generation, with a particular focus on a charcoal grilling process conducted in a mobile cart. The measurements were carried out at 2:00 p.m., capturing a noteworthy hot spot with a temperature peak of 96.7 °C. The immediate vicinity within a one-metre radius exhibited temperatures ranging from 70 °C to 96 °C. The observed temperature patterns contribute to our understanding of the overheating related to non-organized human activities conducted outdoors. By examining the thermal aspects of this specific process, we gain a deeper understanding of the heat dynamics that may characterize various outdoor undertakings.
3.3. Mitigation Strategies and Urban Planning Interventions
3.3.1. Envi-Met Model Validation
In the final phase of our investigation, a microclimate model was employed to execute a series of simulations focusing on downtown Annaba. In order to ensure the robustness of our subsequent analyses and interpretations we have first to validate the model’s adequacy. This involved a comprehensive comparison between the simulated meteorological parameters, air temperature, relative humidity, and wind speed, to their corresponding measured values within the locations P1 and P2, as shown in the graphs below in Figure 6.
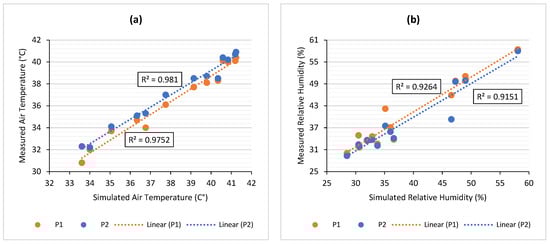
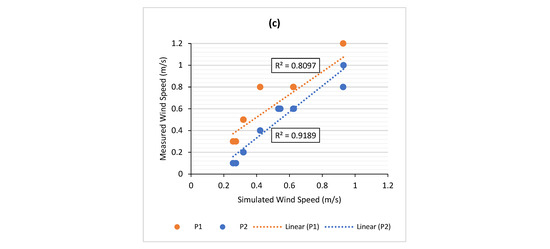
Figure 6.
Comparison of simulated and measured meteorological parameters: air temperature (a), relative humidity (b), and wind speed (c).
To facilitate this comparison, we opted for a linear trend line analysis. The obtained trend lines allowed us to quantitively assess the congruence between the simulated and measured data points based on the integral coefficient of determination (R2). The air temperature trends exhibited a high degree of agreement, with R2 values reaching 0.97 and 0.98 at measurement points P1 and P2, respectively. The relative humidity comparisons indicate relatively lower R2 values of 0.92 at P1 and 0.91 at P2. While slightly diminished in comparison to air temperature, these values still indicate a substantial level of agreement between the simulated and measured relative humidity. Wind speed, while demonstrating low R2 values of 0.80 and 0.91 at P1 and P2, respectively, maintained satisfactory concordance between measured and simulated values. Despite the lower R2, the consistency in trends suggests that the model effectively captures the essential features of wind variations. The obtained high R2 values signify a strong correlation between the simulated and measured microclimate variations, reinforcing the reliability of the model in capturing microclimate dynamics, air temperature, humidity and wind speed trends for downtown Annaba. These findings are in concordance with the established reliability of the ENVI-met microclimate model, as validated in numerous prior investigations in various contexts [46,62].
3.3.2. Microscale Evaluation of UHI Mitigation Strategies
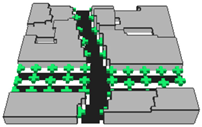
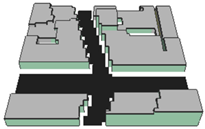
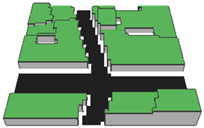
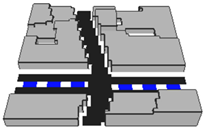
The examination of measurement objects and their subsequent analysis has provided a profound understanding of the factors contributing to the Urban Heat Island (UHI) phenomenon in downtown Annaba. As a natural progression, our study proposes mitigation strategies and urban planning interventions based on these discerning findings. As presented in the methodology section, the study involves the simulation of 6 various scenarios including the current design of the study area, as shown in Table 1.
In order to examine the efficacy of these strategies, their impact on microclimate conditions will be assessed based on the microclimate output parameters such as air temperature (Ta), Mean Radiant Temperature (MRT), relative humidity (RH), and wind speed (Ws). The ensuing results, graphically figured in Figure 7, offer a deep understanding of the effectiveness of the strategies in fighting the Urban Heat Island phenomenon at the microscale.
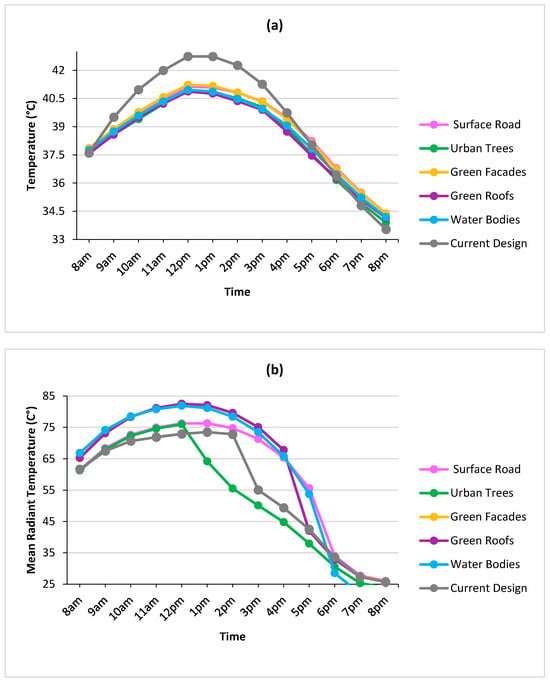
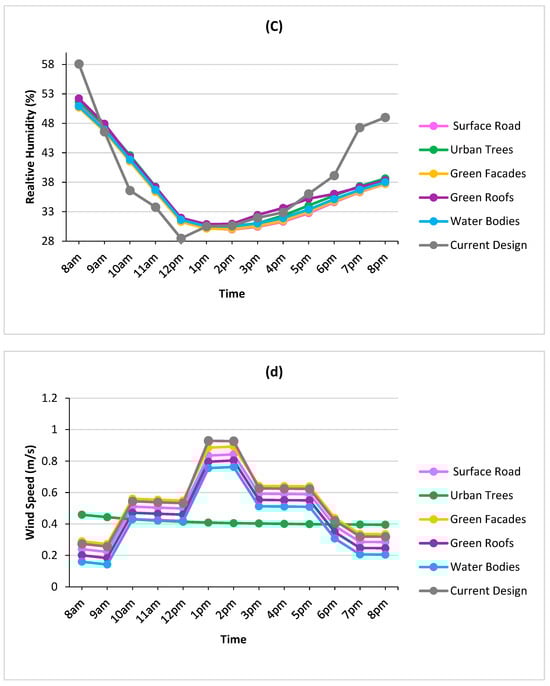
Figure 7.
Comparison simulated scenarios of the study area: (a) air temperature, (b) Mean Radiant Temperature, (c) relative humidity, and (d) wind speed (Leonardo–Envi-Met 5).
Surface Road: This scenario simulated a new surface material on the road, specifically substituting asphalt with basalt brick on road surfaces. The results revealed a substantial reduction in temperature attributable to the basalt brick, from 9 a.m. to 4 p.m. with the maximum decrease recorded at 1 and 2 p.m., reaching 1.6 °C. Concurrently, the Mean Radiant Temperature (MRT) showed a progressive increase along the day, ranging from 0.9° to 13.1 °C between 9 a.m. and 5 p.m. The peak MRT value of 16.3 °C was observed at 3 pm, indicating an escalation in the thermal radiation within the study area. The daily relative humidity demonstrated an increasing trend from 9 a.m. to noon, followed by a progressive decrease from noon to the evening hours, where the maximum decrease reached 11.3%. The wind speed patterns within the simulated area revealed a high consistency between the observed wind speed trend and the current design trend with a slight variance of 0.03 s/m for the whole observational period.
Urban Trees: Scenario 3 aimed to assess the impact of small urban trees, each measuring 5 m in height, on air temperature within a simulated environment. Specifically, 30 trees were planted along Ibn Khaldoun Street, while 12 were planted along El-Kods Street, as shown in Table 1. The results indicated a significant reduction in air temperature during the timeframe from 9 a.m. to 6 p.m. Notably, the maximum temperature reduction, was observed at 1 p.m., amounting to 1.9 °C. The Mean Radiant Temperature showed a noteworthy decrease beginning at 1 p.m., ranging from 1.7° to 17.3 °C, the highest reduction recorded at 2 p.m. The relative humidity trends also exhibited a slight increase observed from 9 a.m. to noon, peaking at 5% at 11 a.m. Subsequently, a progressive decrease was observed from noon to the evening hours, specifically, at 8 p.m., where the humidity reduction reached 10.3%, with a maximum variation of 0.09 s/m at 1 p.m. Contrary to the current design, the wind speed derived from urban trees scenario showed a consistent pattern throughout the day, varying within an average of 0.4 s/m.
Green Facades: Scenario 4 was conducted within downtown Annaba, wherein all building facades were enveloped in a green, grassy substance. The results revealed a statistically significant reduction in air temperature in the interval time between 9 a.m. and 4 p.m., with the maximum decrease reaching 1.5 °C at 1 pm. Concurrently, the Mean Radiant Temperature trend revealed a discernible trajectory from 8 a.m. to 4 p.m. This increase fluctuated between 3.5° to 20 °C, peaking at 3 p.m. Additionally, the investigation delved into the trends of relative humidity over the day. Notably, a significant increase was observed between 9 a.m. and noon. Conversely, the trend showed a remarkable and progressive decrease during the afternoon hours, culminating in a maximum value of 11.3% at 8 p.m. In the example of the surface road, wins speed results revealed a high conformity between the observed and the current design trends, showing a marginal variation of 0.01 s/m, except for the time period between 1 p.m. and 2 p.m., where the variance touched 0.04 s/m.
Green Roofs: Scenario 5 investigated the impact of replacing traditional tile roofs with green roofs in a designated area within downtown Annaba. The results exhibited a noteworthy reduction in air temperature during a significant 10-h interval from 8 a.m. to 6 p.m. Specifically, the green roofs led to a substantial decrease ranging between 0.1 °C and 2 °C, presenting a maximum reduction that was observed at 1 p.m. Simultaneously, the Mean Radiant Temperature (MRT) trends, which revealed an increasing pattern from 8 a.m. to 4 p.m., varying within the range of 3.6 °C to 20 °C which represents the highest recorded increase occurring at 3 p.m. Furthermore, the relative humidity demonstrated a slight rise that does not exceed 6% from 9 a.m. to 3 p.m., followed by a notable decrease starting at 5 p.m. and extended to the evening hours to reach its peak at 6 p.m. with a maximum increase of 10.7%. The wind speed trends demonstrated a pronounced agreement between the simulated and current design patterns, showing a slight deviation of 0.07 s/m. However, during the time interval from 1 p.m. to 2 p.m., a distinct variance was observed, reaching 0.13 s/m.
Water Bodies: The last scenario simulated the study area within downtown Annaba by strategically introducing water bodies along Ibn Khaldoun Street. The results revealed a notable impact on air temperature. The temperature trend showed an ascending pattern from 9 a.m., fluctuating between 0.2 °C to 1.8 °C, ultimately reaching its peak at 1 p.m. with a value of 1.86 °C. Subsequently, a gradual decline ensued, reaching 0.2 °C by 5 p.m., the final three hours of the observational period demonstrated a distinctive deviation, characterized by a further decrease in temperature compared to the current urban design. The Mean Radiant Temperature exhibited an important increase from 8 a.m. to 5 p.m., a trajectory varying between 5.2 °C to 16.4 °C, the highest recorded value occurring at 2 p.m. Noteworthy results revealed a notable increase between 9 a.m. and 1 p.m. However, the trend took a distinctive turn post 1 p.m., witnessing a remarkable decline that persisted into the evening hours to reach a decrease of 11% at 8 p.m. The investigation revealed that the wind speed trends showed the greatest variability in the scenario introducing water bodies, except during the time period from 1 p.m. to 2 p.m., where the variance reached 0.17. The overall variance in wind speed amounted to 0.1 s/m, through the entire observational period.
4. Discussion
The present study was designed to investigate the Urban Heat Island (UHI) phenomenon at the microscale within downtown Annaba. We employed a systematic methodology, encompassing quantification of the UHI phenomenon, identification of contributing factors to its initiation and propagation, and then experimental examination of potential mitigation strategies.
4.1. Annaba’s UHI Intensity
The above results reveal a pronounced UHI effect within the microscale of Annaba city, The observed diurnal variations of air temperature between downtown and the surrounding region in Ibn Khaldoun Street and El-Kods Street on 6 July 2023, reveal significant temperature disparities, particularly during the midday hours, and underscore the complex interplay of various factors influencing the thermal environment in downtown Annaba. However, this spatial heterogeneity between the two streets suggests that local urban characteristics play an important role in shaping the urban microclimate. One of the key contributors to the observed temperature variations lies in the intricate building layout of the two streets. The configuration of buildings, their heights, and their orientations influence the absorption and reflection of solar radiation, thus impacting the local microclimate. El-Kods Street’s initial two hours of observation, with minimal temperature differentials of 1.3 °C, suggest that canyon street configurations may act as effective heat mitigators compared to more open street geometries. This finding aligns with prior research [63,64] and emphasizes the role of urban morphology in influencing temperature patterns. Moreover, the width of the roads in these urban blocks plays a crucial role in modulating temperature differentials. Narrower streets with taller buildings can create a canyon-like effect, limiting exposure to direct sunlight and reducing heat absorption [65,66]. On the other hand, wider streets with shorter buildings may allow for increased solar exposure and heat retention, contributing to higher temperatures. The specific design of Ibn Khaldoun Street and El-Kods Street likely plays a pivotal role in determining the extent of the UHI effect within each microenvironment. Additionally, surface materials and albedo characteristics of buildings and pavements contribute to the thermal properties of urban spaces. Darker surfaces tend to absorb more sunlight and heat, exacerbating temperature differentials [10,67,68]. Analysing the material composition of surfaces in Ibn Khaldoun Street and El-Kods Street can elucidate how these elements influence the observed UHI effect. Subsequently, the notable discrepancy in air temperature between downtown and the surrounding area, with a peak difference of 6.9 °C, indicates the presence of an intense UHI effect. This difference was most pronounced between 12 p.m. and 2 p.m., indicating that downtown Annaba experienced more substantial heating compared to the surrounding regions during peak daytime heating. The fact that the critical temperature variation was most pronounced during the midday hours aligns with expectations, as urban surfaces, such as asphalt and concrete, absorb and re-radiate solar energy, contributing to increased temperatures. The subsequent decline in temperature differentials from 3 p.m. to 5 p.m. could be attributed to the cooling influence of the setting sun and the shading buildings effect that tends to be extended. While, the reversal of the trend after 5 p.m., with an increase in temperature differentials could be influenced by various factors, including the gradual release of stored heat from urban infrastructure, reduced convective cooling, and the persistence of the UHI effect into the evening hours.
The mean daily temperature difference, ranging between 4.5 °C and 4.8 °C, provides information on the magnitude of the thermal disparity due to the UHI effect throughout the observation period. This average underscores the contribution of multiple factors to local temperature patterns and emphasizes the need for further discussions to underscore heat-related effects.
4.2. UHI Initiation and Propagation
Building upon thermal imaging, a deep understanding of the complex interplay of various factors influencing UHI initiation and propagation within downtown Annaba was provided. The findings have practical implications for the heat dynamics of buildings, ground and roads, vehicles, air conditioners, specific facade materials, and human activities. Each factor contributes to the overall urban heat dynamics and requires interventions for urban planning and fighting the UHI effects at the microscale in Annaba city.
The thermal behaviour of colonial buildings in downtown Annaba emphasizes the impact of reinforced brick walls and roofing tile. The consistent differential margin between surface and air temperatures suggests that the building materials possess a certain thermal inertia, influencing the overall urban thermal profile. The observed temperature variations between shaded and sun-exposed walls underscore the significant role of shading in mitigating surface temperatures and ascertain the idea that the unique features of each street, influenced by local urban planning and design, contribute distinctively to the microclimatic variations experienced in these areas. Similar findings were found in previous studies [69,70,71].
The analysis of ground surfaces, particularly asphalt roads, reveals a discernible diurnal trend in temperature dynamics. This phenomenon underscores the crucial interplay between urban design and surface temperatures in our built environments. Notably, asphalt, a commonly used material for road construction, plays a significant role in this thermal balance due to its low albedo [67,72]. Albedo refers to the reflective properties of a surface, and asphalt, with its dark color, tends to have a low albedo. This characteristic makes asphalt absorb a substantial amount of solar radiation during the day, leading to elevated temperatures. The diurnal temperature variation on asphalt roads is pronounced, with daytime temperatures soaring as the material absorbs and retains heat. Moreover, understanding the thermal behaviour of asphalt prompts considerations for alternative road materials with higher albedo, which could help alleviate the urban heat island effect. Choosing materials that reflect more sunlight can contribute to cooler urban microclimates [9,73]. The influence of shading on ground surface temperature cannot be overstated. Shaded areas, such as those provided by trees, buildings, or other structures, exhibit markedly lower temperatures compared to their sun-exposed counterparts [15,42,71]. Shading not only mitigates the absorption of solar radiation by asphalt but also aids in dissipating the heat absorbed earlier in the day.
Vehicles emerge as significant contributors to heat generation in urban environments, with surface temperatures observed to range from 46.4 °C to 60.6 °C. The findings recognize that vehicles, when both parked and in motion, significantly influence the urban heat island effect. However, the thermal behaviours of cars and motorcycles within downtown Annaba become paramount in unravelling their respective impacts on urban heat dynamics Figure 8. While parked vehicles contribute to localized heat buildup, their surfaces absorbing and retaining solar radiation, moving vehicles introduce additional complexities. The friction generated during motion, along with engine heat, further accentuates the heat emission from these mobile units.
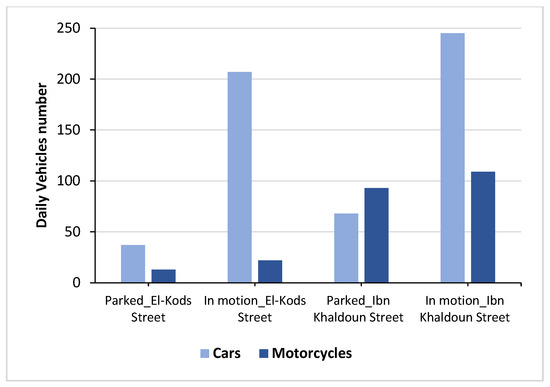
Figure 8.
Daily vehicle number, parked and in motion, within the study area 6 July 2023.
We delved into the nuanced interplay between stationary and moving vehicles, considering their unique thermal signatures. This granular exploration is vital for formulating targeted strategies to mitigate the urban heat island effect. By discerning that cars and motorcycles in varying operational states are the first heat contributors at the microscale of downtown Annaba, we suggest tailoring interventions to limit the effects posed by vehicular heat emissions, such as restricting parking areas and durations downtown. Additionally, designate canyon streets, like El-Kods Street, exclusively for pedestrians. These measures aim to reduce heat concentration, mitigate the UHI effects, and promote pedestrian-comfortable urban environments in Annaba city.
In response to the findings from the investigation into air conditioner heat discharges and the influence of facade materials on urban microclimates, we presented in Figure 9a a typical facade in downtown Annaba showing the main transformation that has undergone. The aim is to enhance the aesthetic appeal while acknowledging the thermal properties of Aluminum Composite Materials (ACMs), which are strategically integrated into the facade. The redesigned facade features ACMs in key areas, lending a modern and sophisticated appearance to the building. However, it is essential to note that ACMs, being efficient conductors of heat, introduce difficulties in managing the thermal effects of the UHI phenomenon in downtown Annaba. Randomly positioned within the redesigned facade are fixed more than fifty-six (56) outdoor units of air conditioners within the study area. These units, while contributing to efficient cooling indoors, generate heat outdoors through their surface material and their heat emissions, working synergistically with the ACMs to amplify the effects of the UHI phenomenon.
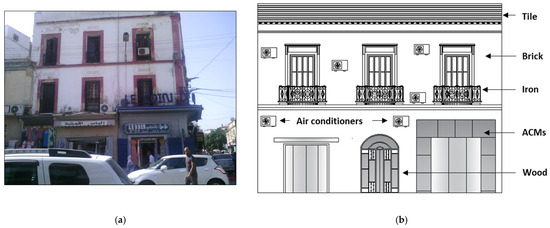
Figure 9.
Façade design in downtown Annaba; (a) real façade and, (b) typical facade of downtown Annaba.
Exploring the thermal dynamics associated with human activities reveals high temperatures in the immediate vicinity, which unveils the intricate thermal effects of non-organized outdoor activities, providing a crucial understanding of their localized impact on urban heat within downtown Annaba. By integrating such findings into city planning processes, our research contributes to the development of targeted strategies for mitigating urban heat islands at the microscale.
Overall, the various factors influencing the urban heat island (UHI) phenomenon in downtown Annaba interact collectively, creating a complex web of thermal dynamics. The thermal behaviour of colonial buildings, with their specific materials, sets the stage for how heat is absorbed and released in the urban landscape. Shading, whether from natural elements or built structures, influences surface temperatures and alters the heat balance. These factors collectively shape the microclimate of each street, contributing distinctively to the overall urban thermal profile. The diurnal temperature variations on asphalt roads further amplify the interaction, as urban design choices play a pivotal role in determining surface temperatures. The introduction of vehicles, both stationary and in motion, adds a dynamic element, with parked vehicles contributing to localized heat buildup and moving vehicles generating additional heat through various mechanisms. While the integration of Aluminium Composite Materials (ACMs) in building facades introduces another layer of interaction, these materials, while enhancing aesthetics, also contribute to urban overheating. Furthermore, placing outdoor units of air conditioners within the study area, combined with the properties of ACMs, amplifies the UHI effects. Additionally, the daily activities of residents in the immediate vicinity further contribute to localized temperature variations.
The collective interaction of these factors underscores the need for a holistic approach to urban planning. Interventions, such as restricting parking, designating pedestrian zones, and strategically placing shading elements, must consider the interconnected nature of these elements.
4.3. Mitigation Strategies and Action Plans
In the course of our investigation, we proposed strategies for mitigation and urban planning interventions based on the discerning findings. This study involved simulating six different scenarios of downtown Annaba, including the existing design of the study area, to inform our recommendations. Furthermore, we categorized these strategies into three main groups to facilitate a clearer understanding and implementation.
Reflected surface strategy: the substitution of asphalt with basalt brick on road surfaces arises from the intention to preserve the distinctive character of the colonial architecture of downtown Annaba. The basalt brick demonstrated a substantial reduction in surface temperature during peak daytime hours. The 1.6 °C temperature decrease at 1 and 2 p.m. can be attributed to the basalt brick’s thermal properties, while the increase in Mean Radiant Temperature (MRT) suggests an escalation in thermal radiation, possibly influenced by the basalt brick’s heat absorption and release characteristics. The observed relative humidity patterns indicate a dynamic interaction with the road material, affecting moisture levels in the atmosphere. These results agreed with a large number of previous studies [68,73,74]. The consistent wind speed alignment with the current design trends affirms the feasibility of integrating basalt brick into urban road infrastructure.
Vegetation strategy: introducing small urban trees along Ibn Khaldoun streets within downtown Annaba resulted in a significant reduction in air temperature, particularly during midday hours. The 1.9 °C temperature reduction at 1 p.m. correlates with the shading effect and transpiration of the trees. The observed MRT decrease is consistent with the trees providing shade and altering the radiant heat exchange induced by trees canopy [13,14,18]. The slight increase in relative humidity during the morning hours and subsequent decrease in the afternoon suggests a localized microclimate effect resulting from trees’ evapotranspiration effect. The consistent wind speed patterns imply that the presence of trees does not significantly disrupt the overall wind dynamics within the studied area. Replacing traditional tile roofs in downtown Annaba with green roofs resulted in a noteworthy reduction in air temperature during daylight hours. The MRT trends suggest a gradual increase in thermal radiation, possibly influenced by the insulating properties of green roofs [61,75,76]. The observed relative humidity patterns indicate a slight rise during the morning hours, followed by a notable decrease in the evening. The wind speed patterns demonstrate a consistent agreement with the current design, except for a distinct variance during the early afternoon hours, potentially linked to the altered surface characteristics of green roofs. Enveloping the building facades in downtown Annaba with a green, grassy substance led to a statistically significant reduction in air temperature. The 1.5 °C decrease at 1 p.m. suggests the cooling effect of vegetative surfaces, while the MRT trend indicates a dynamic interaction between the green facades and thermal radiation, with increasing temperatures throughout the day. The observed relative humidity trends align with the transpiration cooling effect of the grass substance in the roofs. The wind speed patterns generally conform to the current design, with minor variations during specific hours, possibly influenced by the altered surface roughness of the green facades [39,41].
Water bodies strategy: the strategic introduction of water bodies along Ibn Khaldoun Street led to a notable influence on air temperature. The ascending temperature trend until 1 p.m. suggests the heat-absorbing properties of water. The subsequent decline and distinctive turn in temperature post 1 p.m. indicate a complex interplay between water bodies and local microclimates. The MRT trends show an increase in thermal radiation, with a significant decline in the evening hours. The relative humidity patterns align with the evaporative cooling effect of water bodies. The wind speed variability, especially during the afternoon, implies that water bodies can introduce local turbulence and influence wind dynamics, with potential implications for urban airflow patterns [38,77].
In sum, the strategy with the most significant impact on the UHI reduction within downtown Annaba is the introduction of vegetation with its two configurations, urban trees, and green roofs, which is consistent with previous studies [19,38,78,79]. Urban trees demonstrated the highest maximum temperature reduction of 1.9 °C at 1 p.m., indicating a substantial cooling effect. Green roofs also showed notable temperature reductions ranging between 0.1 °C and 2 °C. The surface road with basalt brick and green facades scenarios exhibited significant temperature reductions of 1.6 °C and 1.5 °C, respectively, though slightly less impactful compared to urban trees. Water bodies contributed to a notable temperature reduction, reaching 1.86 °C at 1 p.m., but the decline in later hours suggests a complex interplay of factors. Overall, urban trees appear to be the most effective in reducing air temperature, providing a valuable reduction in UHI effects in downtown Annaba.
4.4. Study Limitations and Future Perspectives
Our research investigated the microscale dynamics of Urban Heat Islands (UHI), emphasizing local factors’ impact on the thermal environment and proposed mitigation strategies. This microscale approach provides detailed insights often overlooked in broader studies, making our research valuable for urban planners and policymakers. By bridging microscale dynamics with broader interventions, we contribute a precise perspective to fight the UHI effects at a local scale. Adding a novel dimension, our study specifically addresses the UHI phenomenon in a Mediterranean city, enriching the existing literature. However, the Mediterranean climate presents unique challenges, and our research provides insights applicable to similar regions and climate contexts.
Our study encountered certain limitations related to the temporal scope and instrumentation choices. Specifically, our temporal focus on 6 July 2023, although intentionally selected to capture optimal conditions, poses a limitation in terms of overlooking potential seasonal variations in UHI dynamics. To address this constraint, future research could benefit from adopting a more extended temporal scope, thus accommodating a broader range of seasonal variations in UHI dynamics. Similarly, our choice of instruments for air temperature and humidity data collection, driven by availability and acceptable accuracy, introduces another set of limitations. Despite the constraints in instrument selection, we implemented rigorous calibration procedures and conducted periodic checks and recalibrations throughout the study to uphold instrument precision and mitigate potential drift or measurement errors. While our study’s exclusive focus on a single city in Algeria provides valuable local insights, it inherently restricts the generalizability of our findings to a broader urban context. Although the inclusion of a Mediterranean climate adds diversity, the applicability of our results to different regions and climates remains uncertain. To counteract this geographical limitation, it is imperative for future studies to encompass a more diverse array of urban contexts. This expansion will contribute to a more comprehensive understanding of UHI dynamics on a global scale, transcending the confines of a singular geographic location.
The robustness of our findings encountered also challenges primarily in the realm of statistical analyses and model limitations. To fortify the credibility of future studies, there is a pressing need to integrate additional statistical and correlation analyses. These supplementary analyses would foster a more accurate understanding of the intricate relationships between contributing factors and UHI intensity.
5. Conclusions
In conclusion, the present study delved into a comprehensive investigation of the Urban Heat Island (UHI) phenomenon at the microscale within the downtown area of Annaba city. The research employed a systematic methodology to quantify the UHI phenomenon, identify contributing factors, and experimentally examine potential mitigation strategies. The key findings revealed a pronounced UHI effect in downtown Annaba, with significant temperature disparities observed, especially during midday hours. The spatial heterogeneity between different streets highlighted the role of local urban characteristics in shaping the microclimate.
This study explored various factors contributing to UHI initiation and propagation, including the thermal behaviour of colonial buildings, ground surfaces like asphalt roads, vehicles, air conditioner heat discharges, facade materials, and human activities. Each factor was found to contribute to the complex heat dynamics of the urban environment, emphasizing the need for targeted interventions in urban planning to mitigate UHI effects in downtown Annaba.
Mitigation strategies were proposed and categorized into three main groups: reflected surface strategy, vegetation strategy, and water bodies strategy. Simulations of different scenarios for downtown Annaba demonstrated the effectiveness of these strategies in reducing air temperatures. Urban trees emerged as the most impactful mitigation measure, showing the highest maximum temperature reduction of 1.9 °C at 1 p.m. Green roofs, basalt brick road surfaces, green facades, and water bodies also contributed significantly to UHI reduction.
The findings of this study underscore the importance of considering multiple factors and implementing a combination of interventions to mitigate the microscale UHI phenomenon in downtown Annaba, with a particular emphasis on the effectiveness of urban trees in reducing urban temperatures. The findings contribute to the broader discourse on addressing urban heat challenges and offer a foundation for future research and policy initiatives in Annaba and similar urban settings, specifically the Mediterranean climate.
Author Contributions
All authors of this research article contributed equally to the conception, design, and execution of the study. Each author played a significant role in the data analysis, interpretation, and manuscript preparation. Conceptualization, B.S. and A.M.A.; methodology, H.H.A., O.A.O. and B.S.; software, O.A.O. and M.R.H.; validation, H.H.A., M.R.H. and B.S.; formal analysis; investigation, B.S.; resources, H.H.A. and O.A.O.; data curation, B.S. and A.M.A.; writing—original draft preparation, A.M.A.; writing—review and editing, M.R.H. and H.H.A.; visualization, O.A.O.; supervision, B.S.; project administration, A.M.A.; funding acquisition, M.R.H., O.A.O., B.S., A.M.A. and H.H.A. All authors have read and agreed to the published version of the manuscript.
Funding
This research received no external funding.
Informed Consent Statement
Not applicable.
Data Availability Statement
The data presented in this study are available on request from the corresponding author.
Conflicts of Interest
The authors declare no conflicts of interest.
References
- Yang, L.; Qian, F.; Song, D.X.; Zheng, K.J. Research on Urban Heat-Island Effect. Procedia Eng. 2016, 169, 11–18. [Google Scholar] [CrossRef]
- Peng, S.L.; Ye, Y.H. The influence of urban heat island on urban planning. Zhongshan Daxue Xuebao/Acta Sci. Natralium Univ. Sunyatseni 2007, 46, 59–63. [Google Scholar]
- Chen, Y.C.; Yao, C.K.; Honjo, T.; Lin, T.P. The application of a high-density street-level air temperature observation network (HiSAN): Dynamic variation characteristics of urban heat island in Tainan, Taiwan. Sci. Total Environ. 2018, 626, 555–566. [Google Scholar] [CrossRef]
- O’Malley, C.; Piroozfarb, P.A.E.; Farr, E.R.P.; Gates, J. An investigation into minimizing urban heat island (UHI) effects: A UK perspective. Energy Procedia 2014, 62, 72–80. [Google Scholar] [CrossRef]
- Lee, Y.Y.; Md Din, M.F.; Ponraj, M.; Noor, Z.Z.; Iwao, K.; Chelliapan, S. Overview of Urban Heat Island (UHI) phenomenon towards human thermal comfort. Environ. Eng. Manag. J. 2017, 16, 2097–2112. [Google Scholar] [CrossRef]
- Nuruzzaman, M. Urban Heat Island: Causes, Effects and Mitigation Measures—A Review. Int. J. Environ. Monit. Anal. 2015, 3, 67. [Google Scholar] [CrossRef]
- Toparlar, Y.; Blocken, B.; Maiheu, B.; van Heijst, G.J.F. A review on the CFD analysis of urban microclimate. Renew. Sustain. Energy Rev. 2017, 80, 1613–1640. [Google Scholar] [CrossRef]
- Santamouris, M. Using cool pavements as a mitigation strategy to fight urban heat island—A review of the actual developments. Renew. Sustain. Energy Rev. 2013, 26, 224–240. [Google Scholar] [CrossRef]
- Taleghani, M. The impact of increasing urban surface albedo on outdoor summer thermal comfort within a university campus. Urban Clim. 2018, 24, 175–184. [Google Scholar] [CrossRef]
- Al-hafiz, B.; Musy, M.; Hasan, T. A Study on the Impact of Changes in the Materials Reflection Coefficient for Achieving Sustainable Urban Design. Procedia Environ. Sci. 2017, 38, 562–570. [Google Scholar] [CrossRef]
- Buyadi, S.N.A.; Mohd, W.M.N.W.; Misni, A. Green Spaces Growth Impact on the Urban Microclimate. Procedia—Soc. Behav. Sci. 2013, 105, 547–557. [Google Scholar] [CrossRef]
- Colunga, M.L.; Cambrón-Sandoval, V.H.; Suzán-Azpiri, H.; Guevara-Escobar, A.; Luna-Soria, H. The role of urban vegetation in temperature and heat island effects in Querétaro city, Mexico. Atmosfera 2015, 28, 205–218. [Google Scholar] [CrossRef]
- Huang, Z.; Wu, C.; Teng, M.; Lin, Y. Impacts of tree canopy cover on microclimate and human thermal comfort in a shallow street canyon in Wuhan, China. Atmosphere 2020, 11, 588. [Google Scholar] [CrossRef]
- Sayad, B.; Alkama, D.; Rebhi, R.; Menni, Y.; Ahmad, H.; Inc, M.; Sharifpur, M.; Lorenzini, G.; Azab, E.; Elnaggar, A.Y. Outdoor thermal comfort optimization through vegetation parameterization: Species and tree layout. Sustainability 2021, 13, 11791. [Google Scholar] [CrossRef]
- de Abreu-Harbich, L.V.; Labaki, L.C.; Matzarakis, A. Effect of tree planting design and tree species on human thermal comfort in the tropics. Landsc. Urban Plan. 2015, 138, 99–109. [Google Scholar] [CrossRef]
- Shashua-Bar, L.; Pearlmutter, D.; Erell, E. The influence of trees and grass on outdoor thermal comfort in a hot-arid environment. Int. J. Climatol. 2011, 31, 1498–1506. [Google Scholar] [CrossRef]
- Xu, C.; Chen, G.; Huang, Q.; Su, M.; Rong, Q.; Yue, W.; Haase, D. Can improving the spatial equity of urban green space mitigate the effect of urban heat islands? An empirical study. Sci. Total Environ. 2022, 841, 156687. [Google Scholar] [CrossRef]
- Aminipouri, M.; Knudby, A.J.; Krayenhoff, E.S.; Zickfeld, K.; Middel, A. Modelling the impact of increased street tree cover on mean radiant temperature across Vancouver’s local climate zones. Urban For. Urban Green. 2019, 39, 9–17. [Google Scholar] [CrossRef]
- Hou, H.; Su, H.; Liu, K.; Li, X.; Chen, S.; Wang, W.; Lin, J. Driving forces of UHI changes in China’s major cities from the perspective of land surface energy balance. Sci. Total Environ. 2022, 829, 154710. [Google Scholar] [CrossRef] [PubMed]
- Chen, Y.; Wang, Y.; Zhou, D. Knowledge map of urban morphology and thermal comfort: A bibliometric analysis based on citespace. Buildings 2021, 11, 427. [Google Scholar] [CrossRef]
- Frontczak, M.; Wargocki, P. Literature survey on how different factors influence human comfort in indoor environments. Build. Environ. 2011, 46, 922–937. [Google Scholar] [CrossRef]
- Yuan, C.; Ng, E.; Norford, L.K. Improving air quality in high-density cities by understanding the relationship between air pollutant dispersion and urban morphologies. Build. Environ. 2014, 71, 245–258. [Google Scholar] [CrossRef]
- Lan, Y.; Zhan, Q. How do urban buildings impact summer air temperature? The effects of building configurations in space and time. Build. Environ. 2017, 125, 88–98. [Google Scholar] [CrossRef]
- Técher, M.; Ait Haddou, H.; Aguejdad, R. Urban Heat Island’s Vulnerability Assessment by Integrating Urban Planning Policies: A Case Study of Montpellier Méditerranée Metropolitan Area, France. Sustainability 2023, 15, 1820. [Google Scholar] [CrossRef]
- Kamal, A.; Mahfouz, A.; Sezer, N.; Hassan, I.G.; Wang, L.L.; Rahman, M.A. Investigation of urban heat island and climate change and their combined impact on building cooling demand in the hot and humid climate of Qatar. Urban Clim. 2023, 52, 101704. [Google Scholar] [CrossRef]
- Udara, P. Air pollution in urban areas and health effects. J. Antarabangsa Alam dan Tamadun Melayu 2016, 4, 25–33. [Google Scholar]
- Du, H.; Wang, D.; Wang, Y.; Zhao, X.; Qin, F.; Jiang, H.; Cai, Y. Influences of land cover types, meteorological conditions, anthropogenic heat and urban area on surface urban heat island in the Yangtze River Delta Urban Agglomeration. Sci. Total Environ. 2016, 571, 461–470. [Google Scholar] [CrossRef] [PubMed]
- Hamed Fahmy, A.; Amin Abdelfatah, M.; El-Fiky, G. Investigating land use land cover changes and their effects on land surface temperature and urban heat islands in Sharqiyah Governorate, Egypt. Egypt. J. Remote Sens. Space Sci. 2023, 26, 293–306. [Google Scholar] [CrossRef]
- Ma, Y.; Lauwaet, D.; Kouti, A.; Verbeke, S. A toolchain to evaluate the impact of urban heat island and climate change on summer overheating at district level. Urban Clim. 2023, 51, 101602. [Google Scholar] [CrossRef]
- Tomczyk, A.M.; Bednorz, E. Regional and seasonal variability in human thermal stress in Poland. Theor. Appl. Climatol. 2023, 152, 787–800. [Google Scholar] [CrossRef]
- Aram, F.; Higueras García, E.; Solgi, E.; Mansournia, S. Urban green space cooling effect in cities. Heliyon 2019, 5, e01339. [Google Scholar] [CrossRef]
- Shahrestani, M.; Yao, R.; Luo, Z.; Turkbeyler, E.; Davies, H. A field study of urban microclimates in London. Renew. Energy 2015, 73, 3–9. [Google Scholar] [CrossRef]
- Elnabawi, M.H.; Hamza, N. Behavioural Perspectives of Outdoor Thermal Comfort in Urban Areas: A Critical Review. Atmosphere 2019, 11, 51. [Google Scholar] [CrossRef]
- Kim, S.W.; Brown, R.D. Urban heat island (UHI) intensity and magnitude estimations: A systematic literature review. Sci. Total Environ. 2021, 779, 146389. [Google Scholar] [CrossRef]
- Tesselaar, M.; Botzen, W.J.W.; Aerts, J.C.J.H. Impacts of climate change and remote natural catastrophes on EU flood insurance markets: An analysis of soft and hard reinsurance markets for flood coverage. Atmosphere 2020, 11, 146. [Google Scholar] [CrossRef]
- Lai, D.; Liu, W.; Gan, T.; Liu, K.; Chen, Q. A review of mitigating strategies to improve the thermal environment and thermal comfort in urban outdoor spaces. Sci. Total Environ. 2019, 661, 337–353. [Google Scholar] [CrossRef]
- Sayad, B.; Alkama, D.; Ahmad, H.; Baili, J.; Aljahdaly, N.H.; Menni, Y. Nature-based solutions to improve the summer thermal comfort outdoors. Case Stud. Therm. Eng. 2021, 28, 101399. [Google Scholar] [CrossRef]
- Gao, N.; Zhang, H.; Wang, P.; Ning, L.; Wong, N.H.; Yu, H.; Ke, Z. Research on Microclimate-Suitable Spatial Patterns of Waterfront Settlements in Summer: A Case Study of the Nan Lake Area in Wuhan, China. Sustainability 2023, 15, 15687. [Google Scholar] [CrossRef]
- Turhan, C.; Atalay, A.S.; Gokcen Akkurt, G. An Integrated Decision-Making Framework for Mitigating the Impact of Urban Heat Islands on Energy Consumption and Thermal Comfort of Residential Buildings. Sustainability 2023, 15, 9674. [Google Scholar] [CrossRef]
- Zhao, Y.; Sen, S.; Susca, T.; Iaria, J.; Kubilay, A.; Gunawardena, K.; Zhou, X.; Takane, Y.; Park, Y.; Wang, X.; et al. Beating urban heat: Multimeasure-centric solution sets and a complementary framework for decision-making. Renew. Sustain. Energy Rev. 2023, 186, 113668. [Google Scholar] [CrossRef]
- Wang, Y.; Bakker, F.; de Groot, R.; Wörtche, H.; Leemans, R. Effects of urban green infrastructure (UGI) on local outdoor microclimate during the growing season. Environ. Monit. Assess. 2015, 187, 732. [Google Scholar] [CrossRef]
- Taleghani, M. Outdoor thermal comfort by different heat mitigation strategies—A review. Renew. Sustain. Energy Rev. 2018, 81, 2011–2018. [Google Scholar] [CrossRef]
- de Almeida, C.R.; Teodoro, A.C.; Gonçalves, A. Study of the urban heat island (Uhi) using remote sensing data/techniques: A systematic review. Environments 2021, 8, 105. [Google Scholar] [CrossRef]
- Hebbert, M. Climatology for city planning in historical perspective. Urban Clim. 2014, 10, 204–215. [Google Scholar] [CrossRef]
- Sayad, B.; Alkama, D.; Rebhi, R.; Kidar, A.; Lorenzini, G.; Ahmad, H.; Menni, Y. Enhanced outdoor thermal comfort through natural design technique: In-situ measurement and microclimate simulation. Instrum. Mes. Metrol. 2021, 20, 131–136. [Google Scholar] [CrossRef]
- Stathopoulos, T.; Wu, H.; Zacharias, J. Outdoor human comfort in an urban climate. Build. Environ. 2004, 39, 297–305. [Google Scholar] [CrossRef]
- Yang, A.S.; Juan, Y.H.; Wen, C.Y.; Chang, C.J. Numerical simulation of cooling effect of vegetation enhancement in a subtropical urban park. Appl. Energy 2017, 192, 178–200. [Google Scholar] [CrossRef]
- Ali-Toudert, F.; Mayer, H. Numerical study on the effects of aspect ratio and orientation of an urban street canyon on outdoor thermal comfort in hot and dry climate. Build. Environ. 2006, 41, 94–108. [Google Scholar] [CrossRef]
- Schiavon, S.; Hoyt, T.; Piccioli, A. Web application for thermal comfort visualization and calculation according to ASHRAE Standard 55. Build. Simul. 2014, 7, 321–334. [Google Scholar] [CrossRef]
- Guo, A.; Yang, J.; Xiao, X.; Xia, J.; Jin, C.; Li, X. Influences of urban spatial form on urban heat island effects at the community level in China. Sustain. Cities Soc. 2020, 53, 101972. [Google Scholar] [CrossRef]
- Ozkeresteci, I.; Crewe, K.; Brazel, A.J.; Bruse, M. Use and evaluation of the ENVI-met model for environmental design and planning. An Experiment on Lienar Parks. In Proceedings of the 21st International Cartographic Conference (ICC), Durban, South Africa, 10–16 August 2003; pp. 10–16. [Google Scholar]
- Lau, K.K.L.; Ng, E.; Ren, C.; Ho, J.C.K.; Wan, L.; Shi, Y.; Zheng, Y.; Gong, F.; Cheng, V.; Yuan, C.; et al. Defining the environmental performance of neighbourhoods in high-density cities. Build. Res. Inf. 2018, 46, 540–551. [Google Scholar] [CrossRef]
- Xie, Z.Q.; Du, Y.; Miao, Q.; Zhang, L.L.; Wang, N. An Approach to Characterizing the Spatial Pattern and Scale of Regional Heat Islands Over Urban Agglomerations. Geophys. Res. Lett. 2022, 49, e2022GL099117. [Google Scholar] [CrossRef]
- Ridha, S. Urban Heat Island Mitigation Strategies in an Arid Climate. In Outdoor Thermal Comfort Reacheable. Doctoral Dissertation, INSA de Toulouse, Toulouse, France, 2017. [Google Scholar]
- Tawfeeq Najah, F.; Fakhri Khalaf Abdullah, S.; Ameen Abdulkareem, T. Urban Land Use Changes: Effect of Green Urban Spaces Transformation on Urban Heat Islands in Baghdad. Alex. Eng. J. 2023, 66, 555–571. [Google Scholar] [CrossRef]
- Abaas, Z.R. Impact of development on Baghdad’s urban microclimate and human thermal comfort. Alex. Eng. J. 2020, 59, 275–290. [Google Scholar] [CrossRef]
- Matallah, M.E.; Mahar, W.A.; Bughio, M.; Alkama, D.; Ahriz, A.; Bouzaher, S. Prediction of climate change effect on outdoor thermal comfort in arid region. Energies 2021, 14, 4730. [Google Scholar] [CrossRef]
- Qaoud, R.; Adel, B.; Sayad, B.; Alkama, D.; Attia, S. Assessing the influence of neighborhood urban form on outdoor thermal conditions in the hot dry city of Biskra, Algeria. Ain Shams Eng. J. 2023, 14, 102525. [Google Scholar] [CrossRef]
- Boussaidi, K.; Djaghrouri, D.; Benabbas, M.; Altan, H. Assessment of Outdoor Thermal Comfort in Urban Public Space, during the Hottest Period in Annaba City, Algeria. Sustainability 2023, 15, 11763. [Google Scholar] [CrossRef]
- Talhi, A.; Barlet, A.; Bruneau, D.; Aichour, B. Towards a prediction of outdoor human thermal comfort adapted for designers of urban spaces: Examining UTCI and APCI in the context of Algiers (Algeria). Int. J. Biometeorol. 2020, 64, 651–662. [Google Scholar] [CrossRef]
- Susca, T.; Zanghirella, F.; Del Fatto, V. Building integrated vegetation effect on micro-climate conditions for urban heat island adaptation. Lesson learned from Turin and Rome case studies. Energy Build. 2023, 295, 113233. [Google Scholar] [CrossRef]
- Yang, J.; Shi, B.; Xia, G.; Xue, Q.; Cao, S.J. Impacts of urban form on thermal environment near the surface region at pedestrian height: A case study based on high-density built-up areas of Nanjing City in China. Sustainability 2020, 12, 1737. [Google Scholar] [CrossRef]
- Lin, P.; Gou, Z.; Lau, S.S.Y.; Qin, H. The impact of urban design descriptors on outdoor thermal environment: A literature review. Energies 2017, 10, 2151. [Google Scholar] [CrossRef]
- Boukhabla, M.; Alkama, D.; Bouchair, A. The effect of urban morphology on urban heat island in the city of Biskra in Algeria. Int. J. Ambient. Energy 2013, 34, 100–110. [Google Scholar] [CrossRef]
- Park, S.; Tuller, S.E.; Jo, M. Application of Universal Thermal Climate Index (UTCI) for microclimatic analysis in urban thermal environments. Landsc. Urban Plan. 2014, 125, 146–155. [Google Scholar] [CrossRef]
- Lau, K.K.L.; Lindberg, F.; Rayner, D.; Thorsson, S. The effect of urban geometry on mean radiant temperature under future climate change: A study of three European cities. Int. J. Biometeorol. 2015, 59, 799–814. [Google Scholar] [CrossRef]
- Li, K.; Chen, Y.; Jiang, J. Grading surface urban heat island and investigating factor weight based on interpretable deep learning model across global cities. Environ. Int. 2023, 180, 108196. [Google Scholar] [CrossRef] [PubMed]
- Chatzidimitriou, A.; Yannas, S. Microclimate development in open urban spaces: The influence of form and materials. Energy Build. 2015, 108, 156–174. [Google Scholar] [CrossRef]
- Saneinejad, S.; Moonen, P.; Carmeliet, J. Comparative assessment of various heat island mitigation measures. Build. Environ. 2014, 73, 162–170. [Google Scholar] [CrossRef]
- Sanaieian, H.; Tenpierik, M.; Van Den Linden, K.; Mehdizadeh Seraj, F.; Mofidi Shemrani, S.M. Review of the impact of urban block form on thermal performance, solar access and ventilation. Renew. Sustain. Energy Rev. 2014, 38, 551–560. [Google Scholar] [CrossRef]
- Ojaghlou, M.; Khakzand, M. Cooling Effect of Shaded Open Spaces on Long-term Outdoor Comfort by Evaluation of UTCI Index in two Universities of Tehran. Space Ontol. Int. J. 2017, 6, 9–26. [Google Scholar]
- Nash, N.; Whitmarsh, L.; Capstick, S.; Gouveia, V.; de Carvalho Rodrigues Araújo, R.; dos Santos, M.; Palakatsela, R.; Liu, Y.; Harder, M.K.; Wang, X. Local climate change cultures: Climate-relevant discursive practices in three emerging economies. Clim. Change 2019, 163, 63–82. [Google Scholar] [CrossRef]
- Sen, S.; Roesler, J.; Ruddell, B.; Middel, A. Cool pavement strategies for Urban Heat Island mitigation in Suburban Phoenix, Arizona. Sustainability 2019, 11, 4452. [Google Scholar] [CrossRef]
- Yang, X.; Zhao, L.; Bruse, M.; Meng, Q. Evaluation of a microclimate model for predicting the thermal behavior of different ground surfaces. Build. Environ. 2013, 60, 93–104. [Google Scholar] [CrossRef]
- Morille, B.; Musy, M. Comparison of the Impact of Three Climate Adaptation Strategies on Summer Thermal Comfort—Cases Study in Lyon, France. Procedia Environ. Sci. 2017, 38, 619–626. [Google Scholar] [CrossRef]
- Peng, L.L.H.; Jim, C.Y. Green-roof effects on neighborhood microclimate and human thermal sensation. Energies 2013, 6, 598–618. [Google Scholar] [CrossRef]
- Jacobs, C.; Klok, L.; Bruse, M.; Cortesão, J.; Lenzholzer, S.; Kluck, J. Are urban water bodies really cooling? Urban Clim. 2020, 32, 100607. [Google Scholar] [CrossRef]
- Cheung, P.K.; Jim, C.Y. Effects of urban and landscape elements on air temperature in a high-density subtropical city. Build. Environ. 2019, 164, 106362. [Google Scholar] [CrossRef]
- Chen, H.; Liu, R.; Zhang, Y. The Impact of Vegetation Canopy on the Outdoor Thermal Environment in Cold Winter and Spring. Sustainability 2023, 15, 12818. [Google Scholar] [CrossRef]

Disclaimer/Publisher’s Note: The statements, opinions and data contained in all publications are solely those of the individual author(s) and contributor(s) and not of MDPI and/or the editor(s). MDPI and/or the editor(s) disclaim responsibility for any injury to people or property resulting from any ideas, methods, instructions or products referred to in the content. |
© 2024 by the authors. Licensee MDPI, Basel, Switzerland. This article is an open access article distributed under the terms and conditions of the Creative Commons Attribution (CC BY) license (https://creativecommons.org/licenses/by/4.0/).