Article

Medium- and Long-Term Prediction of Airport Carbon Emissions under Uncertain Conditions Based on the LEAP Model

1
College of Civil Aviation, Nanjing University of Aeronautics and Astronautics, Nanjing 210016, China
2
School of Architecture, Southeast University, Nanjing 210096, China
*
Author to whom correspondence should be addressed.
Sustainability 2023, 15(21), 15409; https://doi.org/10.3390/su152115409
Submission received: 20 September 2023 / Revised: 19 October 2023 / Accepted: 23 October 2023 / Published: 29 October 2023

Abstract

:
As important nodes in the air transport system, it is of great significance for airports to achieve the carbon-peaking goal before 2030 under the target of peaking carbon emissions in China’s civil aviation industry. However, it remains unknown whether airports will be able to realize this ambitious goal due to a variety of uncertain factors, such as the social economy, epidemic impact, and emission reduction measures. According to the possibilities of uncertain factors, 12 uncertain scenarios were constructed. Using the case of Guangzhou Baiyun International Airport (CAN), this study predicted medium- and long-term carbon emission trends under 12 uncertain scenarios based on the Long-range Energy Alternatives Planning System (LEAP) model. Furthermore, the effects of carbon abatement measures and emission reduction responsibilities were analyzed. The results show that CAN cannot guarantee that it will realize the goal under the established abatement policy. If socioeconomic development is rapid, carbon emissions will peak at about 90 kt tons in 2030, and if socioeconomic development is slow, it will plateau at about 1 million tons between 2030 and 2035. What is more, airlines bear the greatest responsibility for reducing emissions, and technological progress measures have the highest abatement potential. This study provides decision support for airport stakeholders in abatement work so as to ensure that airports can achieve the carbon-peaking goal.

1. Introduction

Climate change is a major global challenge facing humanity [1]. In order to avoid serious social, economic, and ecological impacts of climate change and to achieve sustainable human development, China has officially proposed the medium- and long-term strategic goal of achieving carbon peaking by 2030 [2]. With the rapid development of China’s civil aviation industry, airport traffic activities continue to grow. According to statistics from the China Civil Aviation Administration (CAAC), the number of aircraft landings and take-offs (LTO) in 2019 increased by 564% compared with 2000 [3], and the total carbon emissions from aircraft at China’s airports reached 17.53 million tons in 2019 [4]. Despite the significant impact of the epidemic on the civil aviation market, it is expected to maintain a growth trend. According to research by Airports Council International, the compound annual growth rate of passenger traffic in China’s airports from 2020 to 2040 will be 5.5%, and that of freight traffic will be 6.4%, which will generate a large amount of carbon emissions [5]. However, the civil aviation energy structure, dominated by fossil-based aviation kerosene, cannot be fundamentally changed in the short term, and advanced and applicable civil aviation deep decarbonization technology cannot be applied on a large scale [5]. Therefore, the realization of the airport’s carbon-peaking goal will be tight, difficult, and demanding. In this context, policy documents, such as the Carbon Peak Action Plan by 2030 [2] and the 14th Five-Year Plan for the Green Development of Civil Aviation [6], have put forward a series of action guidelines and suggestions on airport pollution reduction and carbon reduction.
However, airport carbon emissions are affected by a variety of uncertain factors, mainly from the social economy [7], epidemic development [8], and emission reduction efforts [9], making the trend of carbon emissions and the realization of the carbon peak unknown. Therefore, it is still uncertain whether the airport can reach carbon peaking on time if the emission reduction work is carried out according to the existing policy plan. In order to ensure that airports can reach the peak smoothly and on time, it is necessary to carry out medium- and long-term carbon emission forecasts of airports for various possibilities and formulate appropriate and efficient emission reduction strategies.
At present, the research object of carbon emission forecasting in the civil aviation industry is mainly the civil aviation industry as a whole. The research models can be divided into three categories.
The first one is the carbon-emission-forecasting model based on the causality of influencing factors. For example, Chèze et al. [10] established an econometric model considering gross domestic product (GDP) and energy supply to predict the medium- and long-term carbon emission changes in the global civil aviation industry. Yang et al. [11] used the ARIMA model to make short-term predictions of fuel consumption and en-route carbon emissions of Shanghai air transportation. He et al. [12] selected three influencing factors, namely, traffic volume, GDP, and energy efficiency, to establish the STIRPAT model for the civil aviation industry to carry out medium- and long-term forecasts of regional carbon emissions. Considering factors such as the population, economy, and emission reduction technology, T. Planès et al. [13] and Yu et al. [14] constructed the KAYA identity for civil aviation carbon emissions to predict regional carbon emissions in the medium and long term. Liu et al. [15] decomposed the carbon emissions of the civil aviation industry into four influencing factors, namely, the market, operational capacity, technological progress, and alternative fuels, and combined them with the Monte Carlo simulation method to predict the medium- and long-term carbon emission trends of China’s civil aviation industry. Such models can consider the influence of multidimensional factors on carbon emissions, but the difficulty in accurately quantifying factor development makes the carbon emission prediction results unconvincing. In addition, the impact of the epidemic on the long-term stability of such models needs to be further considered.
The second one is the carbon emission prediction model that considers the macroeconomic impact on the energy system. For example, B.S.TAN et al. [16] and Sharma et al. [17] developed a system dynamics model for the civil aviation industry to explore the medium- and long-term carbon emission trends under different policy implementation and economic development scenarios. Zhang et al. [18] constructed an AIM/CGE model to predict the medium- and long-term carbon emissions of the civil aviation industry in various regions around the world. This type of model is based on economic theory and is mainly suitable for socioeconomic analysis and energy policy planning research. It can provide macro-level carbon emission reduction guidance, but it cannot provide detailed technical advice because it does not take emission reduction as the starting point for research, weakening guidance for emission reduction work.
The third one is the energy system model established by simulating all aspects of the energy system. For example, Xu et al. [19] built an energy system model of China’s civil aviation industry based on the LEAP model to explore the medium- and long-term carbon emission development trends of China’s civil aviation industry under different emission reduction measures. Güzel et al. [20] predicted the medium- and long-term carbon emission trends in the Turkish civil aviation industry under different scenarios based on the TIMES model. Such models take engineering technology as the starting point, and they can analyze the technical emission reduction level in detail and provide detailed emission reduction suggestions.
There are also some targeted studies on airport carbon emission forecasting. Acharya et al. [21] considered three emission sources, namely, aircraft engines, ground support equipment, and helicopters, and established a quantitative model of airport carbon emissions and passenger numbers to predict short-term airport carbon emissions. Pamplona et al. [22] proposed an econometric model of airport carbon emissions and passenger numbers for airport aircraft engines to predict short-term airport carbon emissions. Based on the aircraft engine carbon emission calculation model proposed by the International Civil Aviation Organization (ICAO), Hu et al. [23] predicted the medium- and long-term carbon emission development of aircraft engines in an airport under different emission reduction measures. In these studies, the airport carbon emission sources take aircraft engines as the primary emission source, without considering related emission sources, such as ground transportation related to airport operation, and there is no influence of the social economy, epidemic situation, or other uncertainties on airport carbon emissions.
Among the existing carbon emission prediction models for the civil aviation industry, the third model, which simulates all aspects of the energy system, can integrate multiple emission sources, fully explore the use of emission reduction technologies, and deal with uncertainties combined with the scenario analysis method. Among such models, the LEAP (Long-range Energy Alternatives Planning System) model is a typical integrated model based on scenario analysis [24]. Given its low initial data requirements, flexible and simple use, and ability to simulate policy impacts, it is widely used in medium- and long-term carbon emission prediction research in the power industry [25], cement industry [26], transport sector [27,28], etc.
In this study, in order to predict the trend of airport carbon emission under uncertain conditions, a medium- and long-term airport carbon emission prediction (LEAP-Airport) model based on the LEAP model is proposed. Three major contributions are made: (1) the carbon emission sources related to airport traffic activities, which include aero-engines (AEs), auxiliary power units (APUs), ground support equipment (GSE), and ground approach vehicles (GAVs), are comprehensively considered, and the scope of airport carbon emission prediction is expanded compared with previous studies; (2) an energy system model for the airport is established for the first time, and the energy system model is improved so that it can not only reflect the impact of emission reduction technologies on carbon emissions but also study the impact of socioeconomic and epidemic factors; (3) this study offers a comprehensive examination of the effects of three uncertain variables: social economy, epidemic impact, and emission reduction measures. This approach sets it apart from previous studies, which solely treated emission reduction measures as variables with uncertainty. This study provides decision support for the airport to achieve the carbon peak target on time so as to promote the carbon-peaking process in the civil aviation industry.

2. Methods

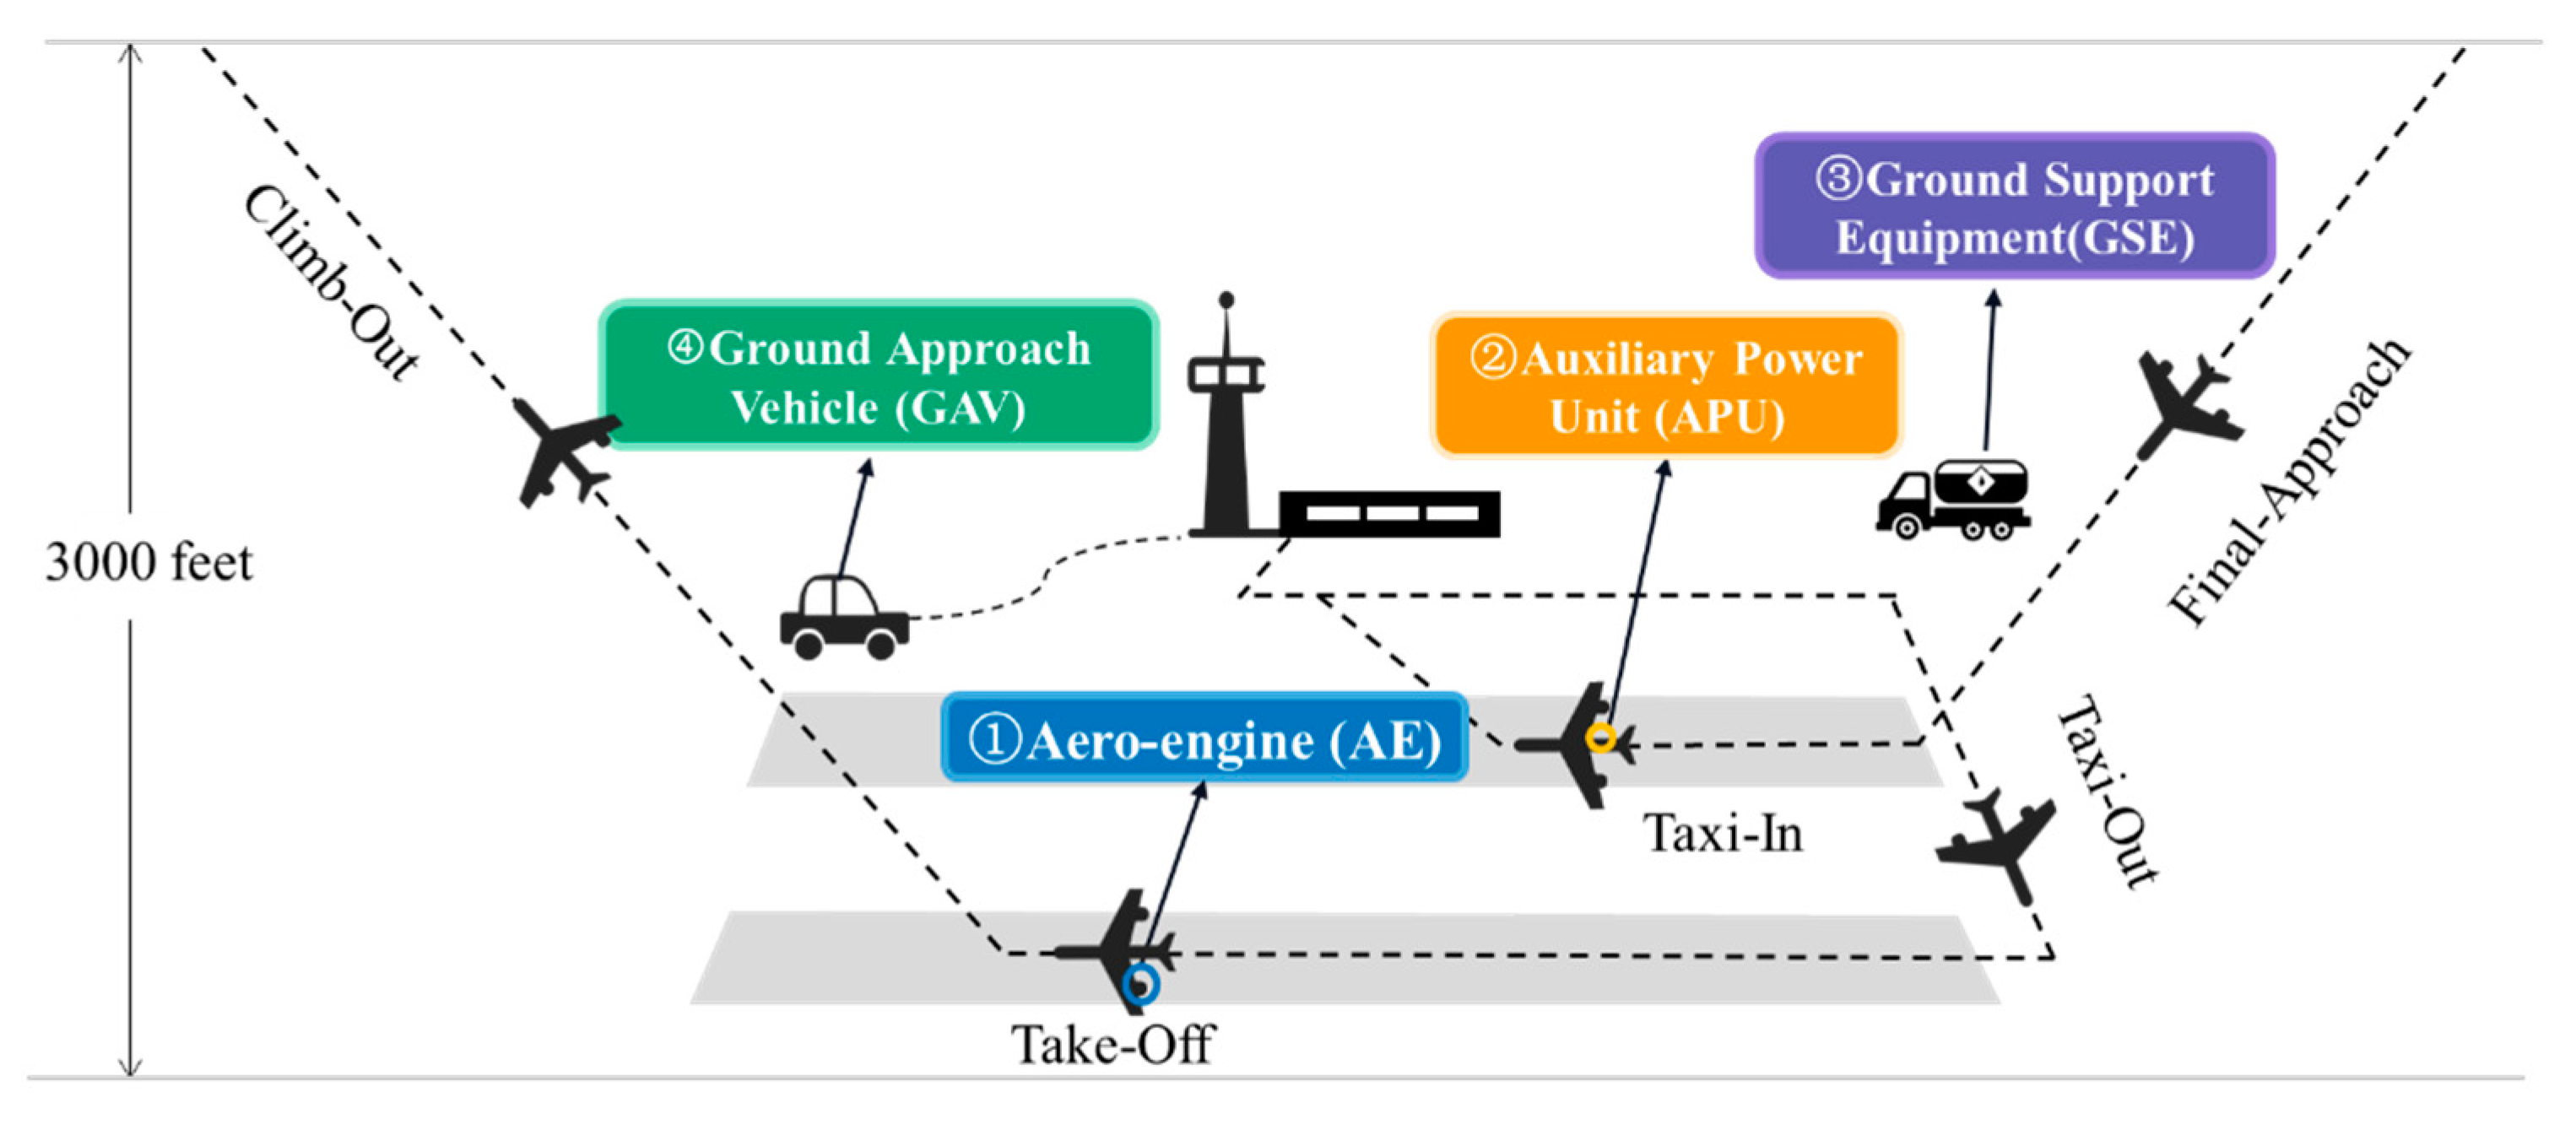
2.1. Scope of Airport Carbon Emissions

There are many sources of emissions within the airport, such as aircraft, ground support equipment, terminals, etc. The activity characteristics of each emission source differ greatly: some are mobile sources (aircraft, etc.), and some are fixed sources (terminals, etc.). In addition, the operating space of each emission source is also different: for example, ground support vehicles only operate at the horizontal level, while the operating range of aircraft includes the altitude level. The carbon emission sources within the scope should fully reflect the characteristics of airport traffic operation. In this study, four main emission sources closely related to traffic operation were selected: AE, APU, GSE, and GAV. The description and activity characteristics of the four types of emission sources are shown in Table 1.
The AE’s airport emissions are predicted as “air emissions emitted during the aircraft landing and take-off cycle, at a height of 3000 feet from the surface to the top of the atmospheric boundary layer” [29]. Therefore, as shown in Figure 1, this study determined the scope of the airport carbon emission boundary as the carbon emissions generated by four emission sources, namely, AEs, APUs, GSE, and GAVs around the airport, in the area from the ground surface to the top 3000-foot height of the atmospheric boundary layer.

2.2. LEAP-Airport Model

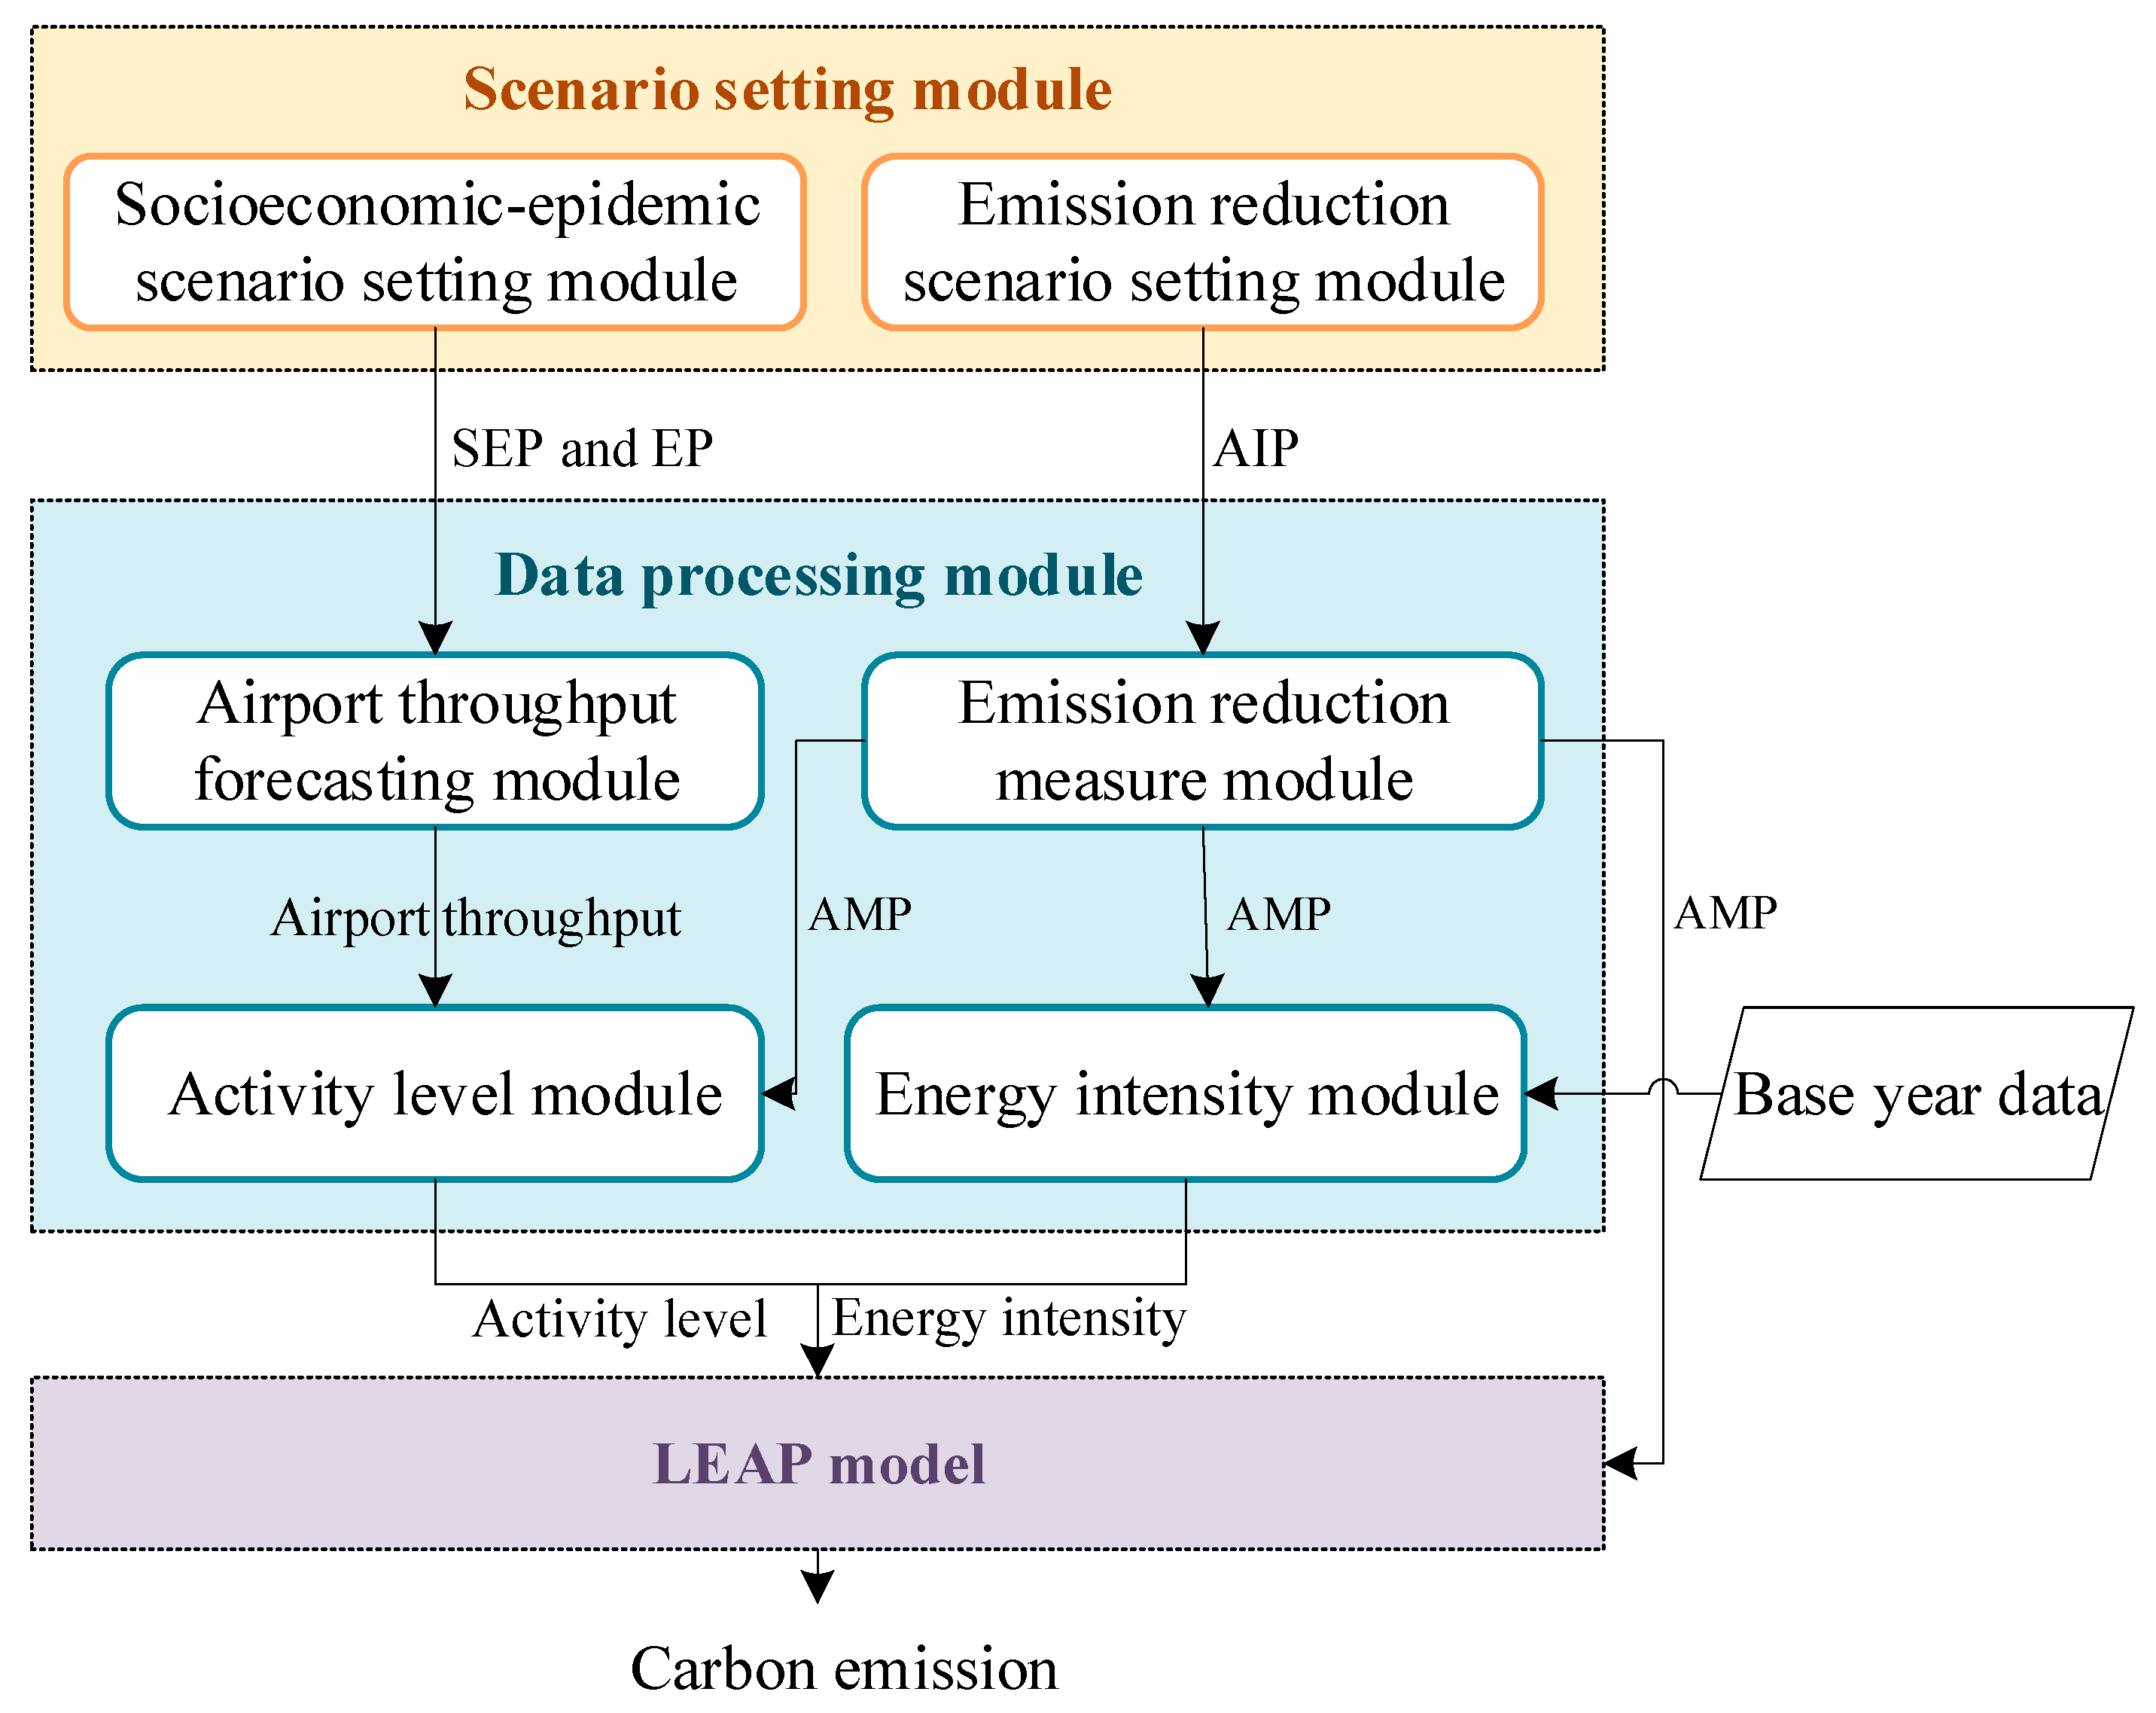
2.2.1. Model Framework

In order to predict the carbon emission trend of airports under uncertain conditions, the LEAP-Airport model based on the LEAP model was established. The framework of the LEAP-Airport model is shown in Figure 2. The model consists of three parts:
i.
Scenario-setting module: Considering the uncertainty of socioeconomic–epidemic factors and emission reduction measures, this module constructs uncertain scenarios of airport development. Socioeconomic parameters (SEPs) and epidemic parameters (EPs) are set through the socioeconomic–epidemic scenario-setting module, and abatement intensity parameters (AIPs) are set through the emission reduction scenario-setting module.
ii.
Data-processing module: In this module, the airport-throughput-forecasting module uses SEPs to forecast airport throughput. The emission reduction measure module outputs specific abatement measure parameters (AMPs) according to AIPs, such as application time, technology penetration, etc. The activity-level module integrates the predicted values of airport throughput and AMPs to calculate the airport activity level. The energy intensity module calculates energy intensity by combining base year data and AMPs.
iii.
LEAP model: Based on the activity level, energy intensity, and AMP data, the carbon emissions of the airport in the target year are predicted.
To determine whether the airport can achieve the goal of carbon peaking in 2030, 2023 should be taken as the base year and 2035 should be taken as the target year to predict the trend of airport carbon emissions.

2.2.2. LEAP Model

The LEAP model is an integrated, scenario-based modeling tool that allows the development of economic, energy, and environmental analyses. The Stockholm Environmental Institute and the University of Boston developed it with the aim of contributing to the mitigation of climate change [30].
The LEAP model bases its structure on a hierarchical tree of four levels, ordered as sector, subsector, end-use, and device. In this study, the data of the airport were organized in a tree structure in the LEAP model according to the scope of airport carbon emissions and the operational characteristics of the emission source, as shown in Table 2.
According to the types of airport emission sources, the airport sector is divided into AE, APU, GSE, and GAV subsectors, corresponding to the four emission sources within the scope. AEs consist of passenger aircraft engines and cargo aircraft engines and are then further divided into end-use according to the aircraft type. APUs are installed only on wide-body and narrow-body passenger aircraft and are therefore divided into two types of end-use. GSE consists of aircraft tractors, cargo loaders, fuel trucks, etc. GAVs include three types of end-use: buses, private cars, and taxis. On this basis, the device is assigned according to the type of fuel used by the end-use.
In the LEAP model, carbon emissions depend on the activity level, energy intensity, and carbon emission factors, and users need to determine the activity-level units of different sectors according to the characteristics of the research objects.
According to the activity characteristics of the above four types of emission sources (shown in Table 1), the units of activity levels are determined as the number of aircraft LTO cycles, APU operating time, GSE operating time, and passenger kilometers. Using Equation (1), the airport carbon emissions can be calculated:
C = n t T n × E I n × E S n t × E F t
where C is the airport carbon emissions; T n is the activity level of emission source n ; E I n is the energy intensity of emission source n ; E S n t is the share of energy t in the total energy used by emission source n ; and E F t is the carbon emission factor for energy t .

2.2.3. Data-Processing Module

i.
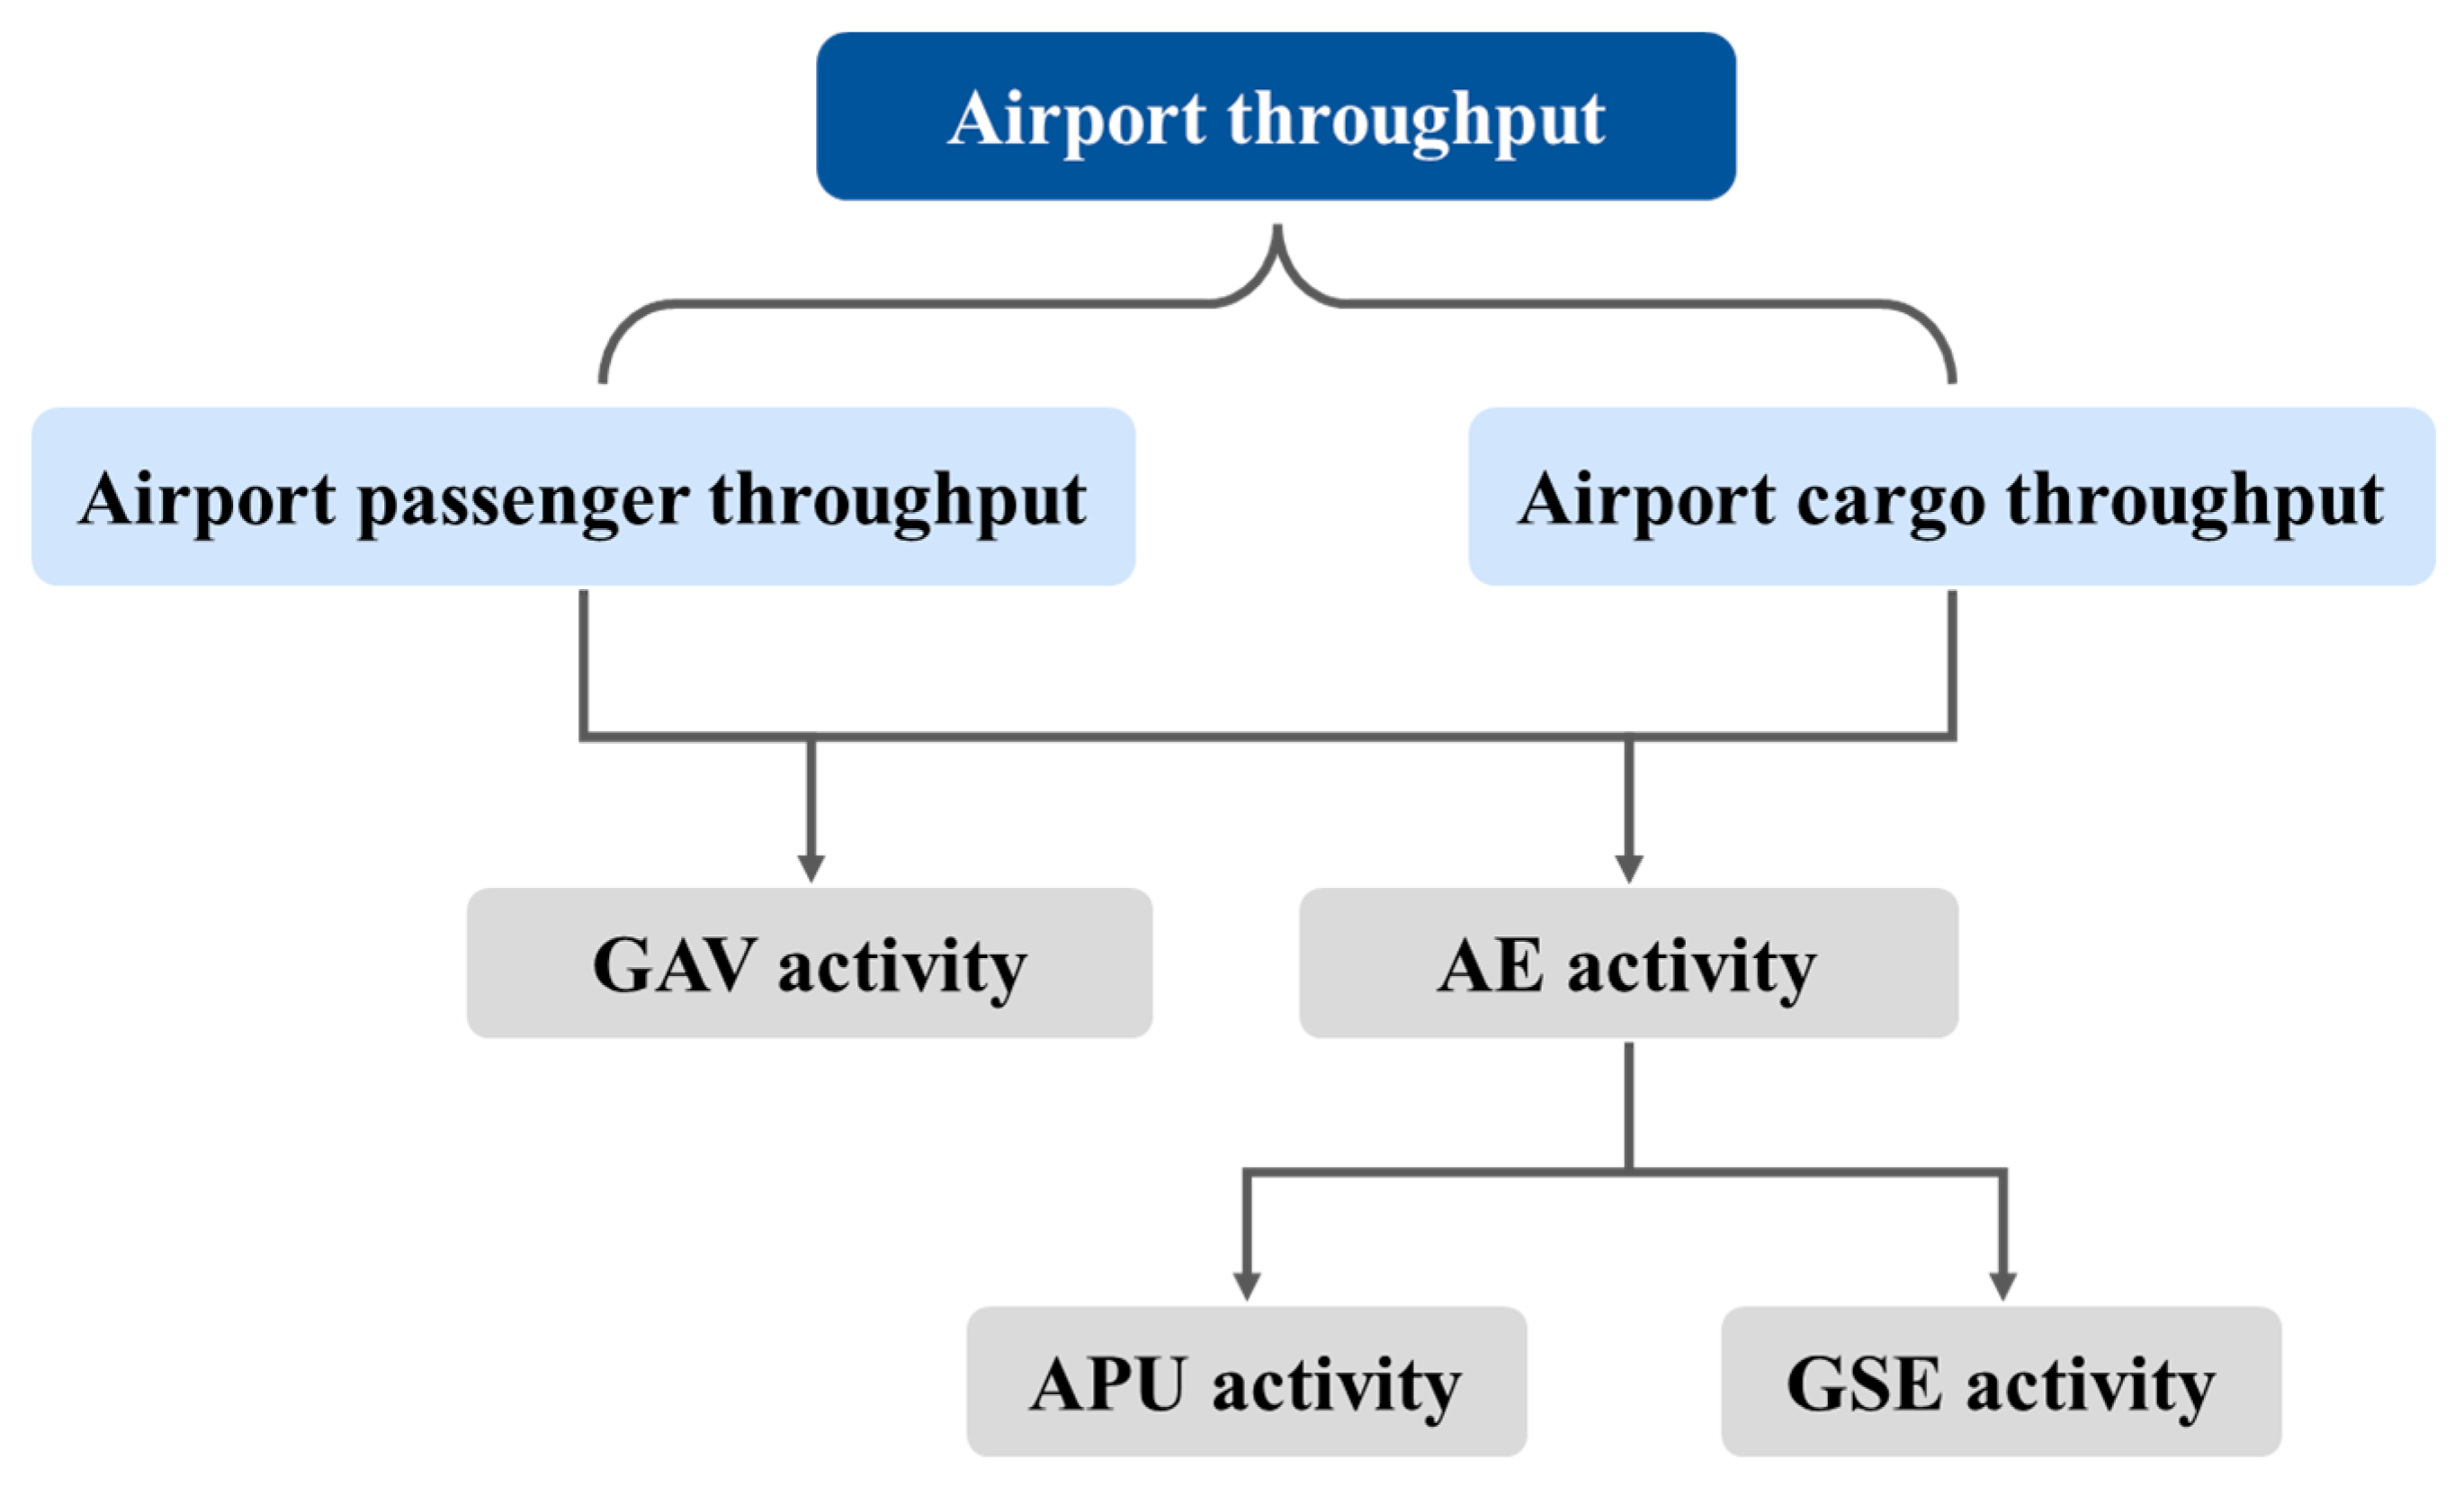
Activity-level module
According to the activity characteristics of various emission sources in Table 1, it can be seen that the activity levels of AE and GAV are influenced by the airport throughput (passenger throughput and cargo throughput), and the activity levels of APU and GSE are influenced by the activity level of AE. The calculation process of each emission source’s activity level is shown in Figure 3.
The AE activity level can be calculated using Equation (2):
T A E i , j , y = P T y × θ i , j y S i , j × i , j y × 2 i = p C T y × α y × θ i , j y S i , j × i , j y × 2 i = c
where T A E i , j , y is the activity level of an AE that is installed on i -class j -type aircraft in year y ; p is passenger aircraft and c is cargo aircraft; j refers to the type of aircraft, which is divided into wide-body, narrow-body, and regional aircraft; P T y is the airport passenger throughput in year y ; θ i , j y is the proportion of j -types in i -class in year y; S i , j is the capacity of i -class j -type aircraft; and i , j y is the full-load rate for i -class j -type aircraft in year y . In this study, the average of inbound and outbound sorties is taken as the LTO cycle number and is therefore divided by 2; C T y is the airport cargo throughput in year y ; and α y is the ratio of all-cargo aircraft traffic to cargo throughput in year y .
The APU activity level can be calculated using Equation (3):
T A P U p , j , y = T A E p , j , y × O T A P U j × θ A P U
where T A P U p , y , j is the activity level of an APU that is installed on i -class j -type passenger aircraft in year y ; T A E p , y , j is the activity level of an AE that is installed on j -type aircraft; O T A P U j is the APU’s running time corresponding to j -type passenger aircraft, and the data come from ACRP Report 149 [31]; and θ A P U is the APU replacement rate.
The GSE activity level can be calculated using Equation (4):
T G S E k , y = i j T A E i , j , y × O T A E i , j , k
where T G E S k , y is the activity level of k -class GSE in year y ; O T A E i , j , k refers to the unit operation time of k -class GSE corresponding to i -class j -type aircraft, and the data come from ACRP Report 149 [31].
The GAV activity level can be calculated using Equation (5):
T G A V l , y = P T y × ( 1 δ ) × ( 1 ϕ y ) × θ l , y × K
where T G A V l , y is the activity level of an l -class GAV in year y ; δ is the proportion of transit passengers; ϕ y is the proportion of subway arrivals in year y ; θ l , y is the proportion of l -class GAVs in year y ; and K is the travel distance of the GAV within the airport, generally 20 km.
ii.
Energy intensity module
Referring to Xu’s calculation method [19], the energy intensity used by each emission source can be calculated using Equation (6)
E I y = E I y - 1 × ( 1 δ y )
δ y = w δ w × λ w y
where E I y is the energy intensity in year y ; δ y is the total energy efficiency improvement rate in year y ; δ w is the energy efficiency improvement rate of w -class technology; and λ w y is the penetration rate of w -class technology in year y .
The GAV energy intensity in the base year is derived from the 2006 IPCC Guidelines for National Greenhouse Gas Inventories [32], and the GSE energy intensity calculation method in the base year is consistent with the Aviation Emissions and Air Quality Handbook [29]. Affected by changes in the aircraft fleet structure, the AE and APU energy intensities of different airports in the base year are different, and they need to be calculated according to the fleet structure.
The AE energy intensity in the base year is derived from Equation (8).
E I A E i , j = b A E b × θ i , j , b
where E I A E i , j is the AE energy intensity of i -class j -type aircraft in the base year (kg/LTO cycle); A E p i , j , b refers to the energy intensity of an AE that is installed on b -type aircraft (such as A320), with data from the Aviation Emissions and Air Quality Handbook [29]; and θ p i , j , b is the proportion of b -type aircraft in i -class j -type aircraft in the base year.
The APU energy intensity in the base year is derived from Equation (9).
E I A P U j = b A P U b × θ j , b
where E I A P U j is the APU energy intensity of j -type passenger aircraft (kg/min); A P U b is the APU energy intensity for b -type aircraft, according to the Aviation Emissions and Air Quality Handbook [29]; and θ j , b is the ratio of b -type aircraft to j -type aircraft in the base year.
iii.
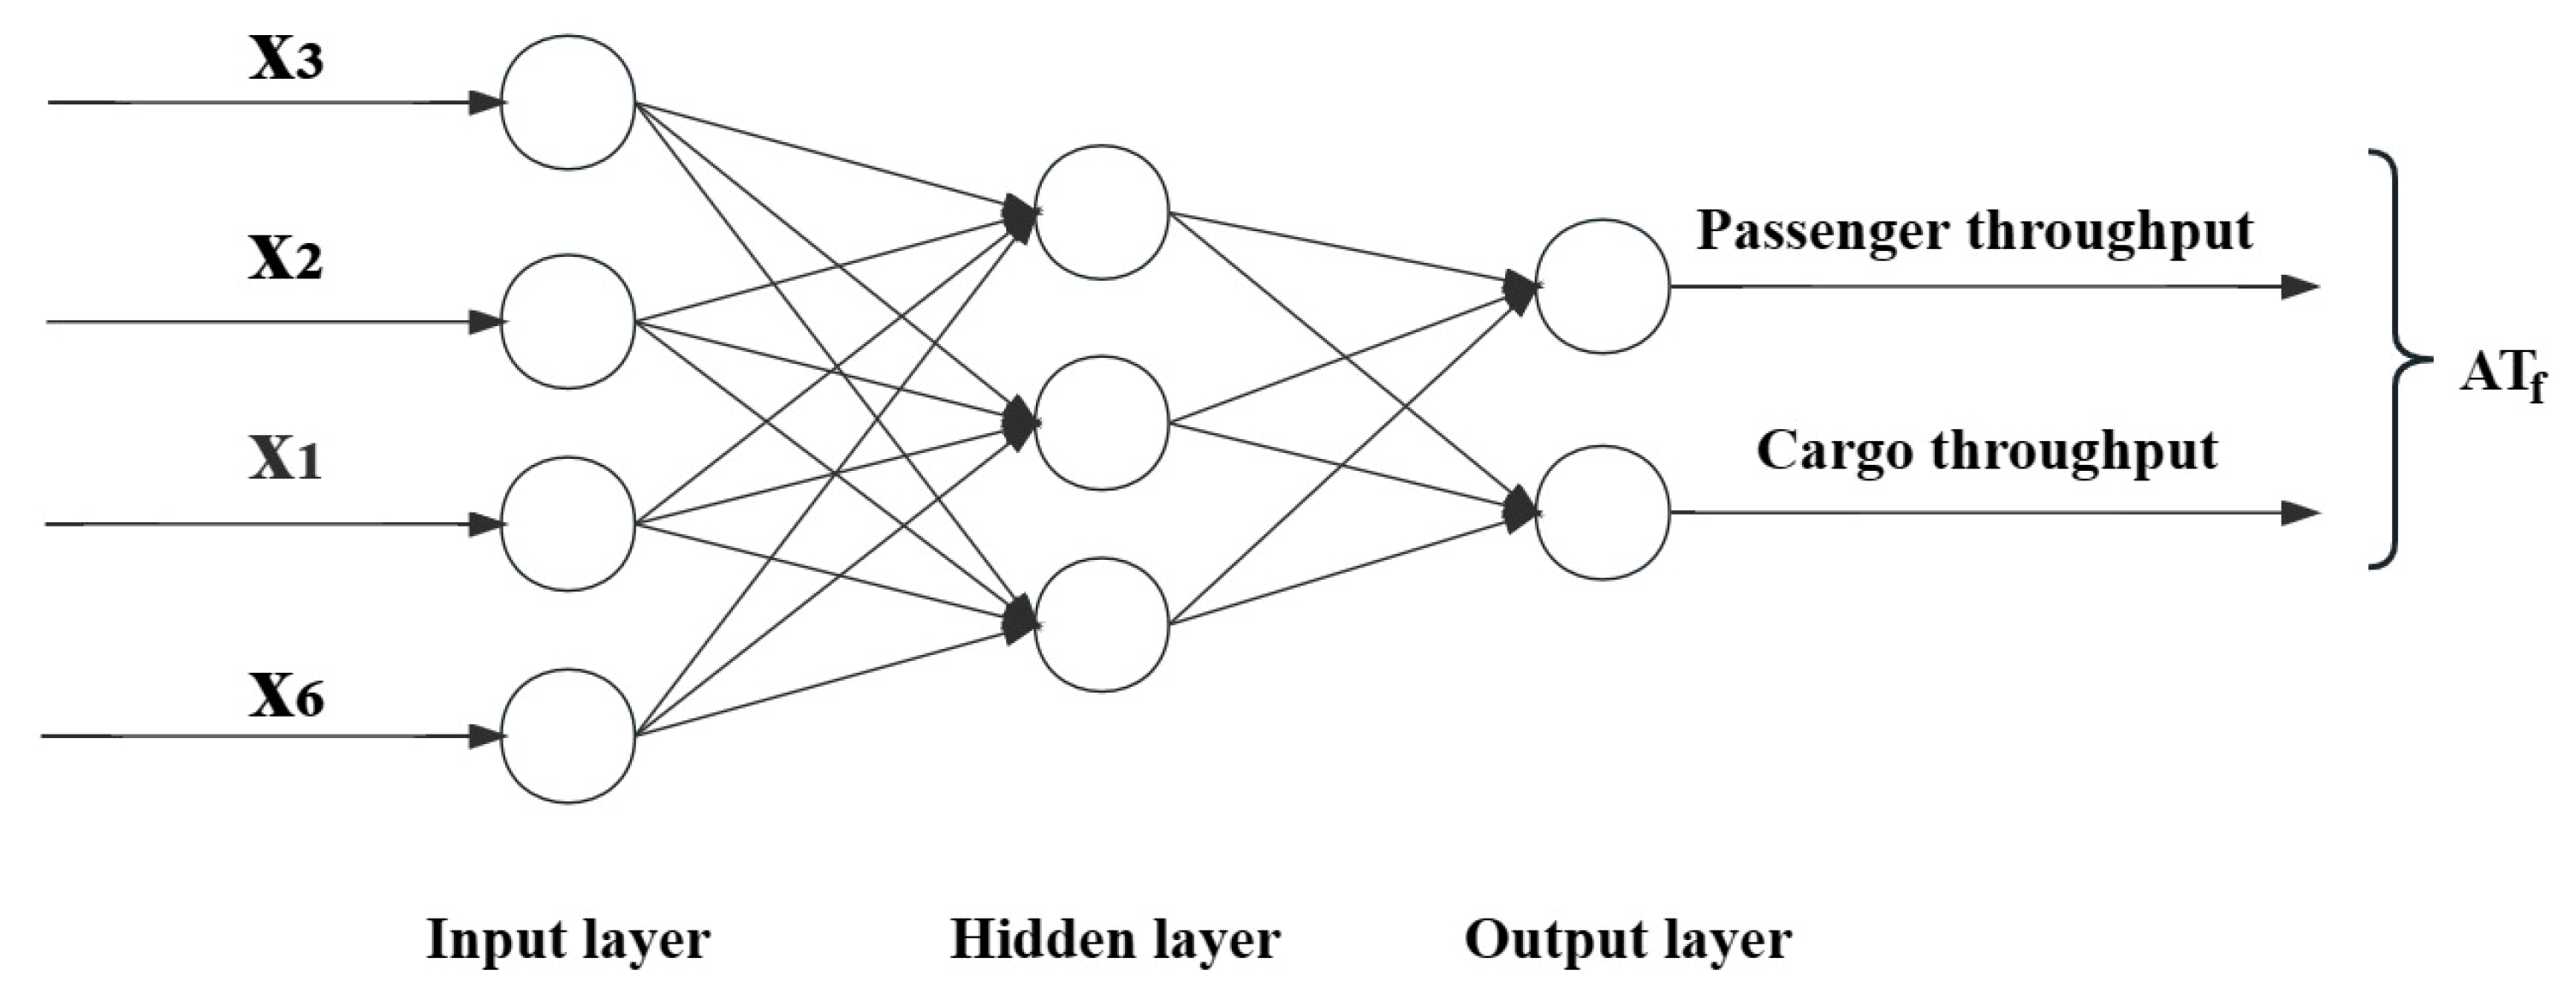
Airport-throughput-forecasting module
This study took Guangzhou Baiyun International Airport (IATA: CAN) as the selected case. As one of three major aviation hubs in China, CAN continues to grow quickly, with an annual growth rate of 6.9%. Its carbon emission development trend is representative, and exploring the emission reduction strategy of CAN can provide a demonstration effect for other airports and enterprises. As shown in Figure 4, airport throughput has grown tortuously since CAN was put into use. However, there are two primary factors that impose limitations on throughput expansion. The first pertains to major emergencies, such as financial crises and epidemics. The second factor relates to constraints on airport resources. For instance, in 2015, the growth in passenger throughput was impeded due to bottlenecks in airspace and ground resources [33]. In addition, the expansion will not have a significant impact without substantial improvement in airspace conditions for airports with a saturated capacity, such as CAN [34]. It can be observed that CAN underwent renovation and expansion (phase II expansion project) between 2012 and 2018; the main expansion projects were the construction of Terminal 2 and Runway 3, and there was no significant change in airport throughput. Therefore, when predicting CAN throughput, three main assumptions are made:
i.
It is assumed that no major emergencies (financial crisis, epidemic, etc.) occur within the forecast period;
ii.
It is assumed that CAN’s resources will always be able to meet the transportation demand within the forecast period;
iii.
It is assumed that within the predicted period, CAN continues to have a saturated capacity, and there is no substantial improvement in airspace conditions.
Socioeconomic factors play a decisive role in airport throughput, and previous studies usually predicted airport throughput based on socioeconomic factors [35,36,37]. Since the epidemic will have a lasting impact on airport development, the airport throughput prediction based on socioeconomic factors will no longer be accurate and needs to be further revised according to the impact of the epidemic. Therefore, this study established the regression relationship between socioeconomic factors and airport throughput and developed airport throughput forecasts. On this basis, the forecast results were revised according to the impact of the epidemic.
It is generally acknowledged that airport throughput is related to factors such as GDP ( x 1 ), resident population ( x 2 ), urbanization rate ( x 3 ), gross value of primary industry ( x 4 ), gross value of secondary industry ( x 5 ), gross value of tertiary industry ( x 6 ), tourism income ( x 7 ), and retail sales of social consumer goods ( x 8 ) [35,36,37]. In order to identify the key socioeconomic factors affecting airport throughput, this study used the feature importance measurement method based on random forest to rank the influencing factors. The random forest method is widely used for feature selection. Its main idea is to quantify the contribution rate of each pair of features to each decision tree in the random forest. By calculating the mean value, the mean value of each feature in the forest is compared horizontally to obtain the importance ranking of each feature and identify key factors [38].
The ranking outcomes of CAN are depicted in Figure 5. For airport passenger throughput, the importance of x 3 , x 2 , and x 6 is greater than the threshold of 0.1, which means that these three factors are more important [39]. For airport cargo throughput, the three factors x 3 , x 1 , and x 2 are more important, with an importance level > 0.1. In order to forecast airport passenger and cargo throughputs simultaneously, the key factors affecting both are taken from the union set in this study. Four factors, namely, x 3 , x 2 , x 1 , and x 6 , are taken as the key socioeconomic factors affecting airport throughput.
To account for the impact of socioeconomic factors and generate long-term forecasts for airport throughput, a BP neural network for prediction was established [40]. As shown in Figure 6, the neural network model used in this study has a structure of 4 × 3 × 2, with 4 input layers, 3 hidden layers, and 2 output layers. The input layer consists of the four key factors of airport throughput, and the output layer is the airport passenger throughput and cargo throughput; that is, the predicted value of airport throughput in the absence of an epidemic is assumed to be A T f .
With the effective control of the epidemic, the civil aviation market will experience a stage of rapid recovery and stable development [41]. In the stage of rapid recovery, the business volume of the civil aviation market will increase significantly and gradually recover to the level of 2019. In the stage of stable development, the trend of development before the epidemic will continue. Due to the great difference in the development laws of the two stages, it is necessary to revise the prediction result for A T f in stages. The revised airport throughput is expressed as Equation (10):
A T y = A T 2019 · ϕ y 2023 y h ( Rapid   recovery   stage ) A T f · Ω h < y 2035 ( Stable   development   stage )
where A T y is the airport throughput in year y ; A T 2019 is the airport throughput in 2019; ϕ y is the ratio of airport throughput in year y to that in 2019; h is the year when the civil aviation market recovered to the level of 2019; A T f is the predicted value of airport throughput assuming that no epidemic occurs; and Ω is the ratio of the predicted value of airport throughput after the epidemic to the predicted value of airport throughput when no epidemic occurs.
iv.
Emission reduction measure module
It is widely believed that the introduction of sustainable aviation fuels (SAFs) and other emission reduction measures will effectively reduce the carbon emissions of the civil aviation industry [42]. Therefore, it is necessary to explore the impact of the implementation of emission reduction measures on airport carbon emissions. In order to fully consider the measures that may be taken in the future, the mainstream emission reduction reports of the civil aviation industry were reviewed [42,43,44,45], and the airport emission reduction measures that can be put into use from 2023 to 2035 were summarized into four aspects: operation improvement, structure optimization, technological progress, and alternative fuel. The operation improvement measures are mainly aimed at aircraft, improving and optimizing all stages of the aircraft LTO cycle within the airport; structural optimization starts from the operating structure of the emission source, aiming to promote the replacement of low-efficiency equipment with high-efficiency equipment; technological progress refers to the use of technologies to improve engine fuel efficiency; and alternative fuel measures refer to the replacement of traditional energy sources with clean energy. Since the industry generally believes that new-power aircraft will be added to the fleet around 2045, no structural optimization measures for aircraft have been set up. The changes in the aircraft fleet structure are consistent with the predicted results of the Aviation Industry Corporation of China [46], as shown in Table 3 and Table 4.
At the same time, airport carbon emissions are not completely controlled by the airport but are jointly controlled by multiple airport stakeholders, including the airport, airlines, and air traffic management bureau. With the goal of guiding the process of airport carbon reduction, abatement responsibilities are assigned to airport stakeholders. The airport emission reduction measures, emission sources, and relative airport stakeholders are shown in Table 5.

2.2.4. Scenario-Setting Module

Airport carbon emission trends are influenced by three uncertainties: socioeconomic development, the epidemic impact, and the intensity of emission reduction measures. Among them, socioeconomic development and the epidemic impact mainly determine airport throughput trends, so the two are analyzed together to construct a socioeconomic–epidemic scenario-setting module. The emission reduction scenario-setting module was constructed to discuss the possibilities of the intensity of emission reduction measures at the airport.
i.
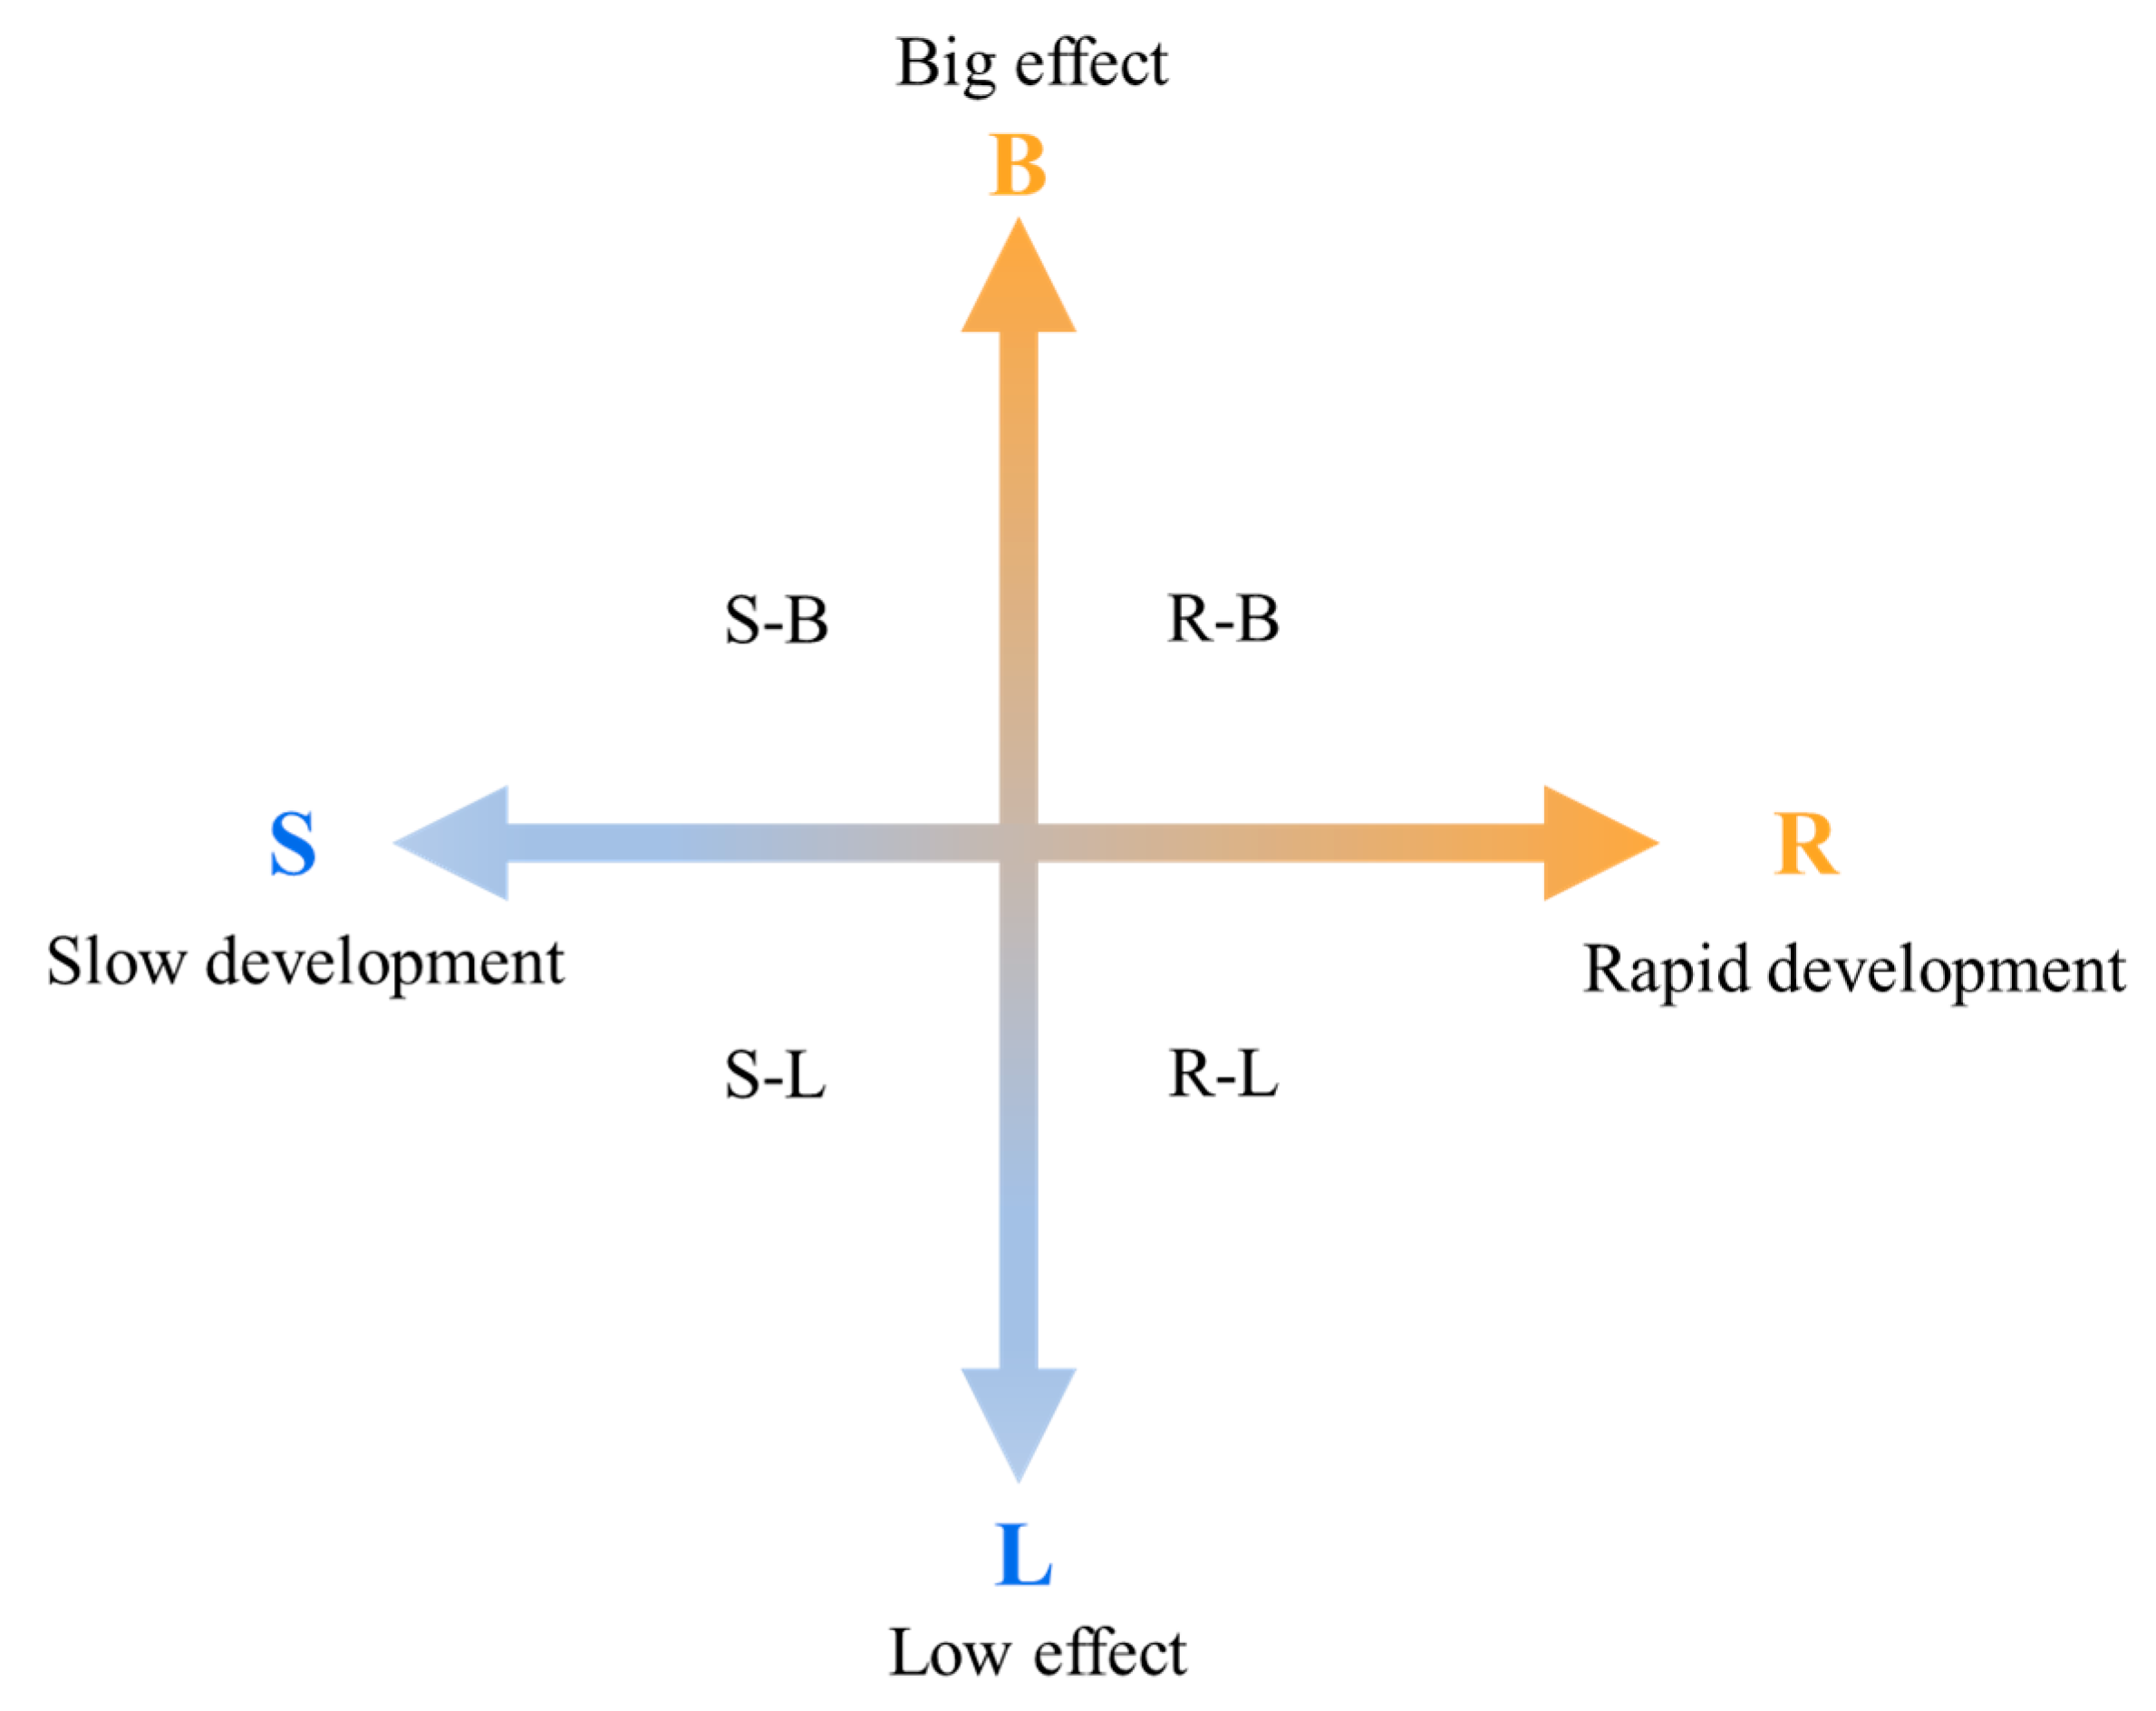
Socioeconomic–epidemic scenario-setting module
Affected by the process of globalization and changes in the world situation, the speed of China’s socioeconomic development is unknown. At the same time, it is still difficult to determine the impact of the epidemic on the future development of the civil aviation market due to differences in the development speed of effective vaccines and the countermeasures of various countries. As shown in Figure 7, by categorizing the speed of socioeconomic development into slow (S) and rapid (R) and the level of impact of the epidemic into low (L) and high (B), four socioeconomic–epidemic scenarios, S-L, S-B, R-L, and R-B, were combined.
According to the above-mentioned results of feature selection for factors affecting airport throughput, the urbanization rate ( x 3 ), resident population ( x 2 ), GDP ( x 1 ), and gross value of tertiary industry ( x 6 ) are the key socioeconomic factors affecting airport throughput. Based on Guangzhou’s planning documents and the related literature [47,48,49], we set SEPs for different socioeconomic development intensities, as shown in Table 6.
Regarding the air passenger market, authorities generally believe that China’s civil aviation passenger transport market will recover to the level of 2019 around 2024 [50,51], so h = 2024. From this, it can be determined that the rapid recovery stage is 2023–2024, and the stable development stage is 2025–2035. The revised parameters in the rapid recovery stage are set according to the forecast results of the Civil Aviation Administration of China [50]. IATA believes that the development of the civil aviation passenger transport market will lag by 2–3 years, and the air passenger market will decrease by 7–10% compared with the assumption that an epidemic will not occur [51]. Based on this, the revised parameters in the stable development stage are set.
The freight market had recovered to the level of 2019 in 2021, so there is no need to forecast for h = 2021. The rapid recovery stage is 2019–2021, and the stable development stage is from 2022 to 2035. It is expected that the freight market will decrease by 5–7% compared with the assumption that there is no epidemic. Based on this, the revised parameters in the case of a low effect and a big effect are set (since the data for 2022 are known, we only set the parameters for 2023–2035). The revised parameters for different epidemic impact levels are shown in Table 7.
ii.
Emission reduction scenario-setting module
Since the intensity of emission reduction measures implemented by airports in the future is uncertain, this study set three emission reduction scenarios for the intensity of emission reduction measures:
(1) Baseline scenario (BAS). The BAS aims to calibrate the effect of emission reduction measures. In this scenario, the airport parameter setting is consistent with the historical data in 2022, and no new emission reduction measures are adopted.
(2) Established Policy Scenario (EPS). The EPS is a scenario in which the airport actively responds to the carbon-peaking goal of the civil aviation industry and the construction of a “green airport”. It aims to judge whether the airport can complete the carbon-peaking goal according to the existing policy. Under this scenario, the airport has adopted a series of operational improvement measures, the operational structure of emission sources has been optimized to a certain extent, some technologies have been introduced to improve fuel efficiency, and alternative fuels have been gradually put into use.
(3) Low-carbon development scenario (LCS). On the basis of the EPS, the LCS increases the implementation of emission reduction measures. Under this scenario, the airport has intensified its operational improvement efforts, further optimized the operational structure of emission sources, actively reformed technologies to improve fuel efficiency, and accelerated the use of alternative fuels.
The parameter settings are derived from documents such as the 14th Five-Year Plan for Civil Aviation Green Development [6], the Action Plan for Carbon Peak before 2030 [2], the 14th Five-Year Plan for Transportation of Guangzhou City [52], etc. Such policy documents are generally planned at intervals of 5 years, so this study set parameters according to a time granularity of 5 years, as shown in Table 8.
iii.
Scenario combination
According to the settings of the socioeconomic–epidemic scenario and emission reduction scenario, we established 12 uncertain scenarios of airport development, as shown in Table 9.

3. Results and Discussion

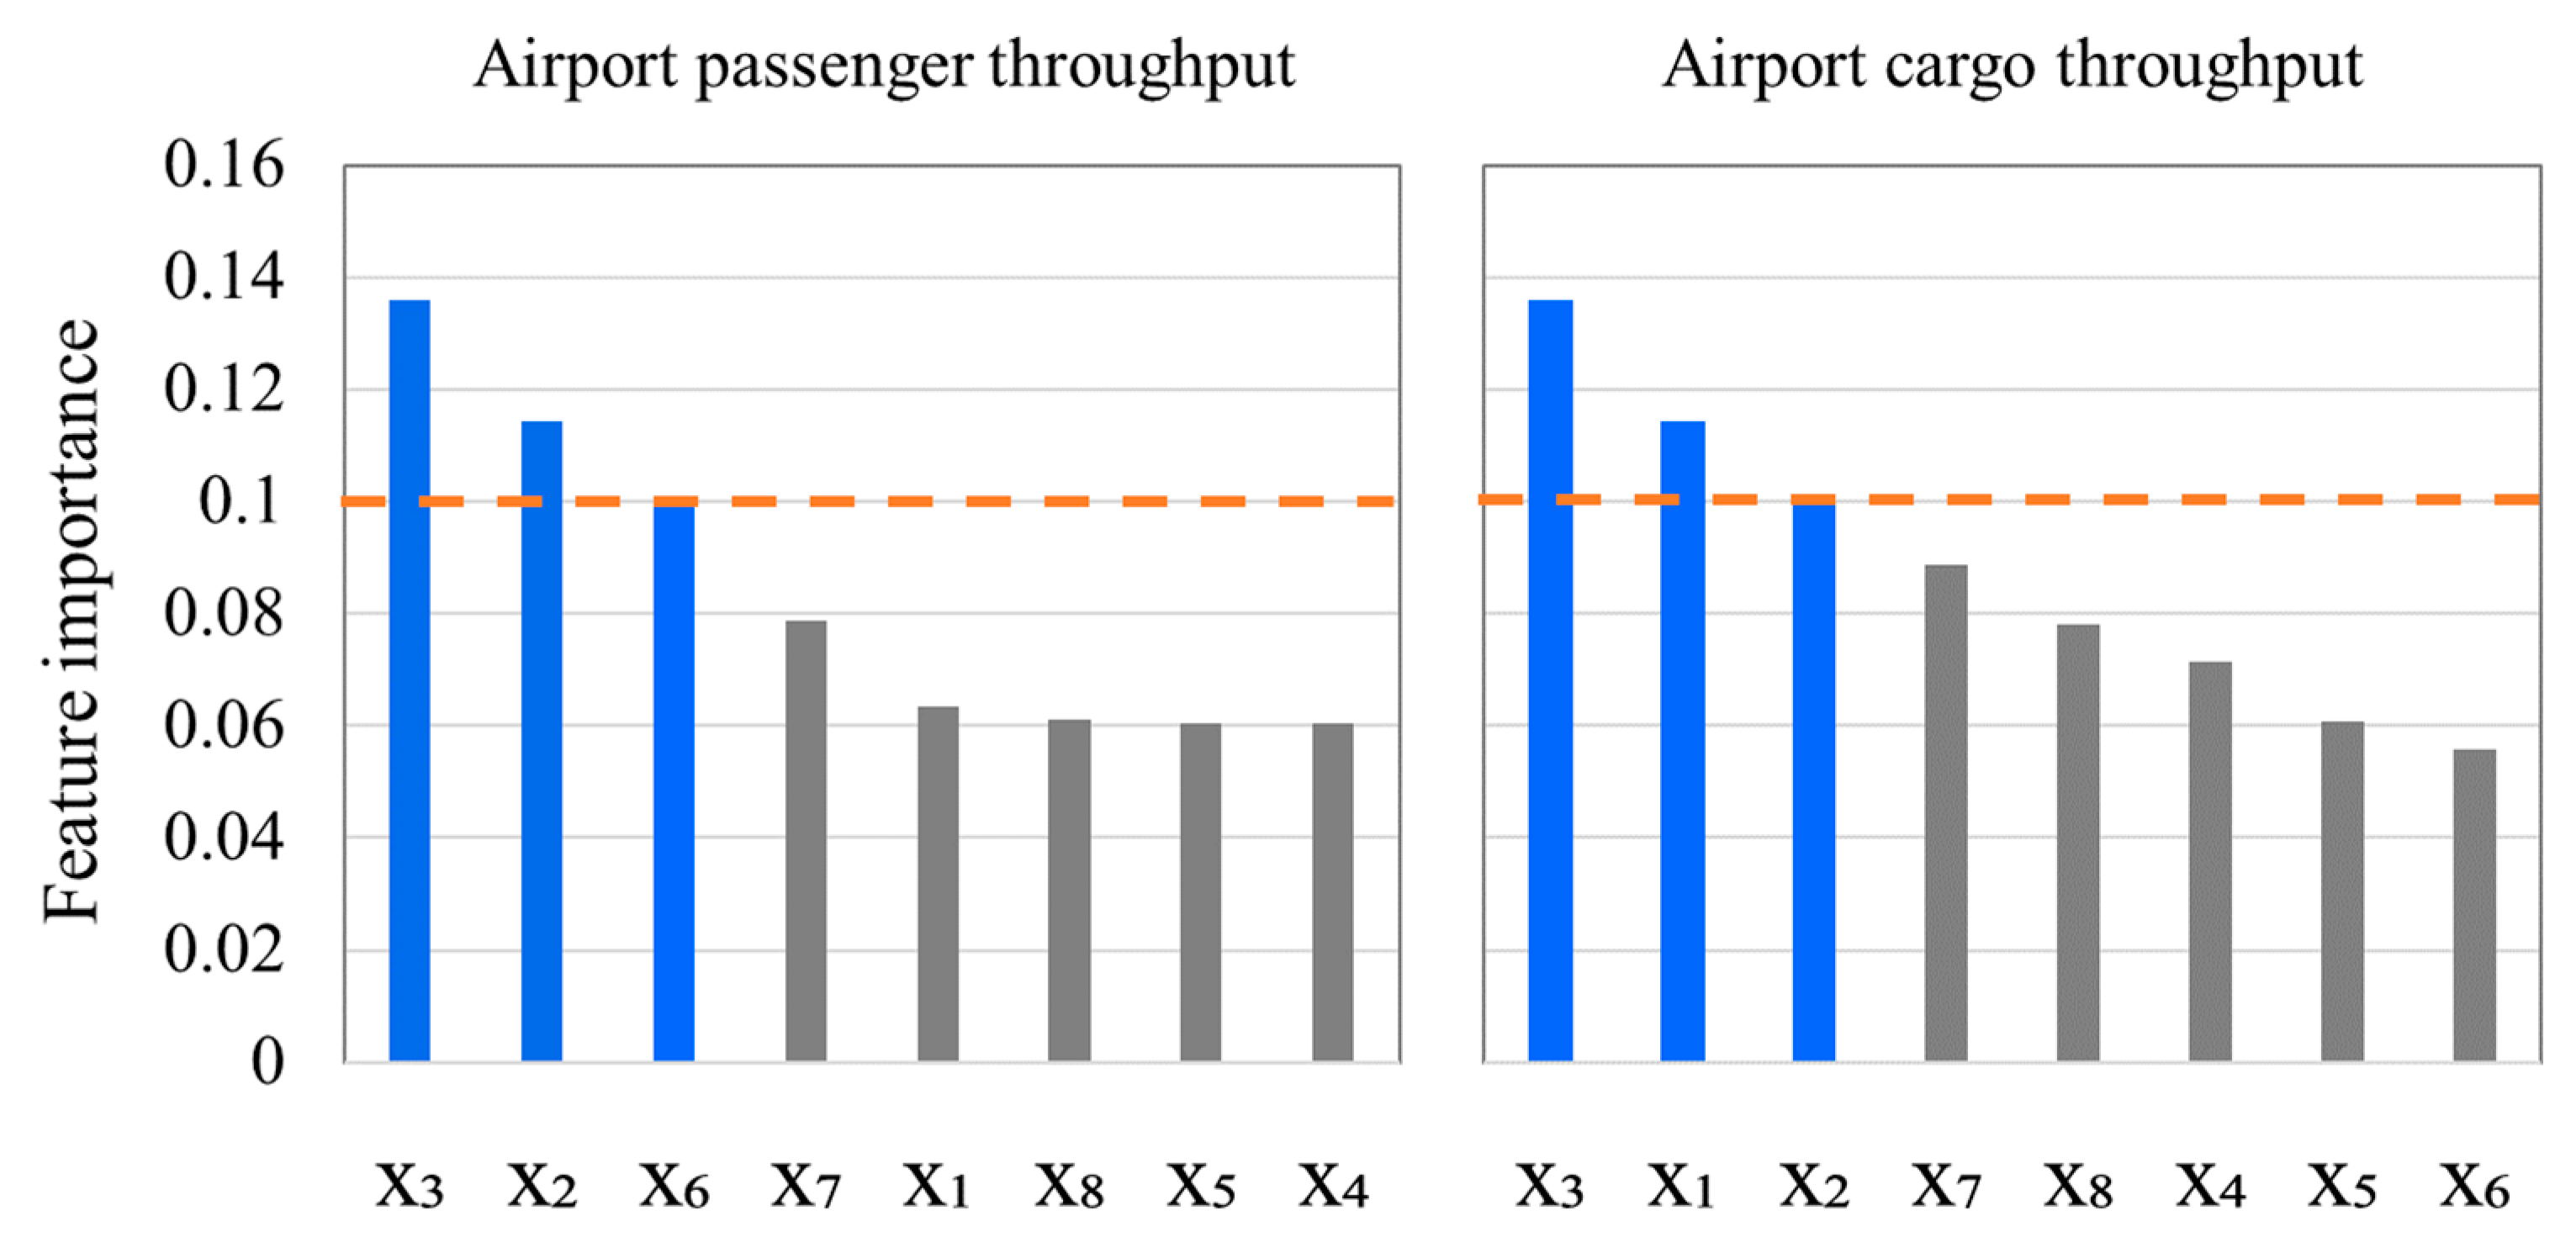
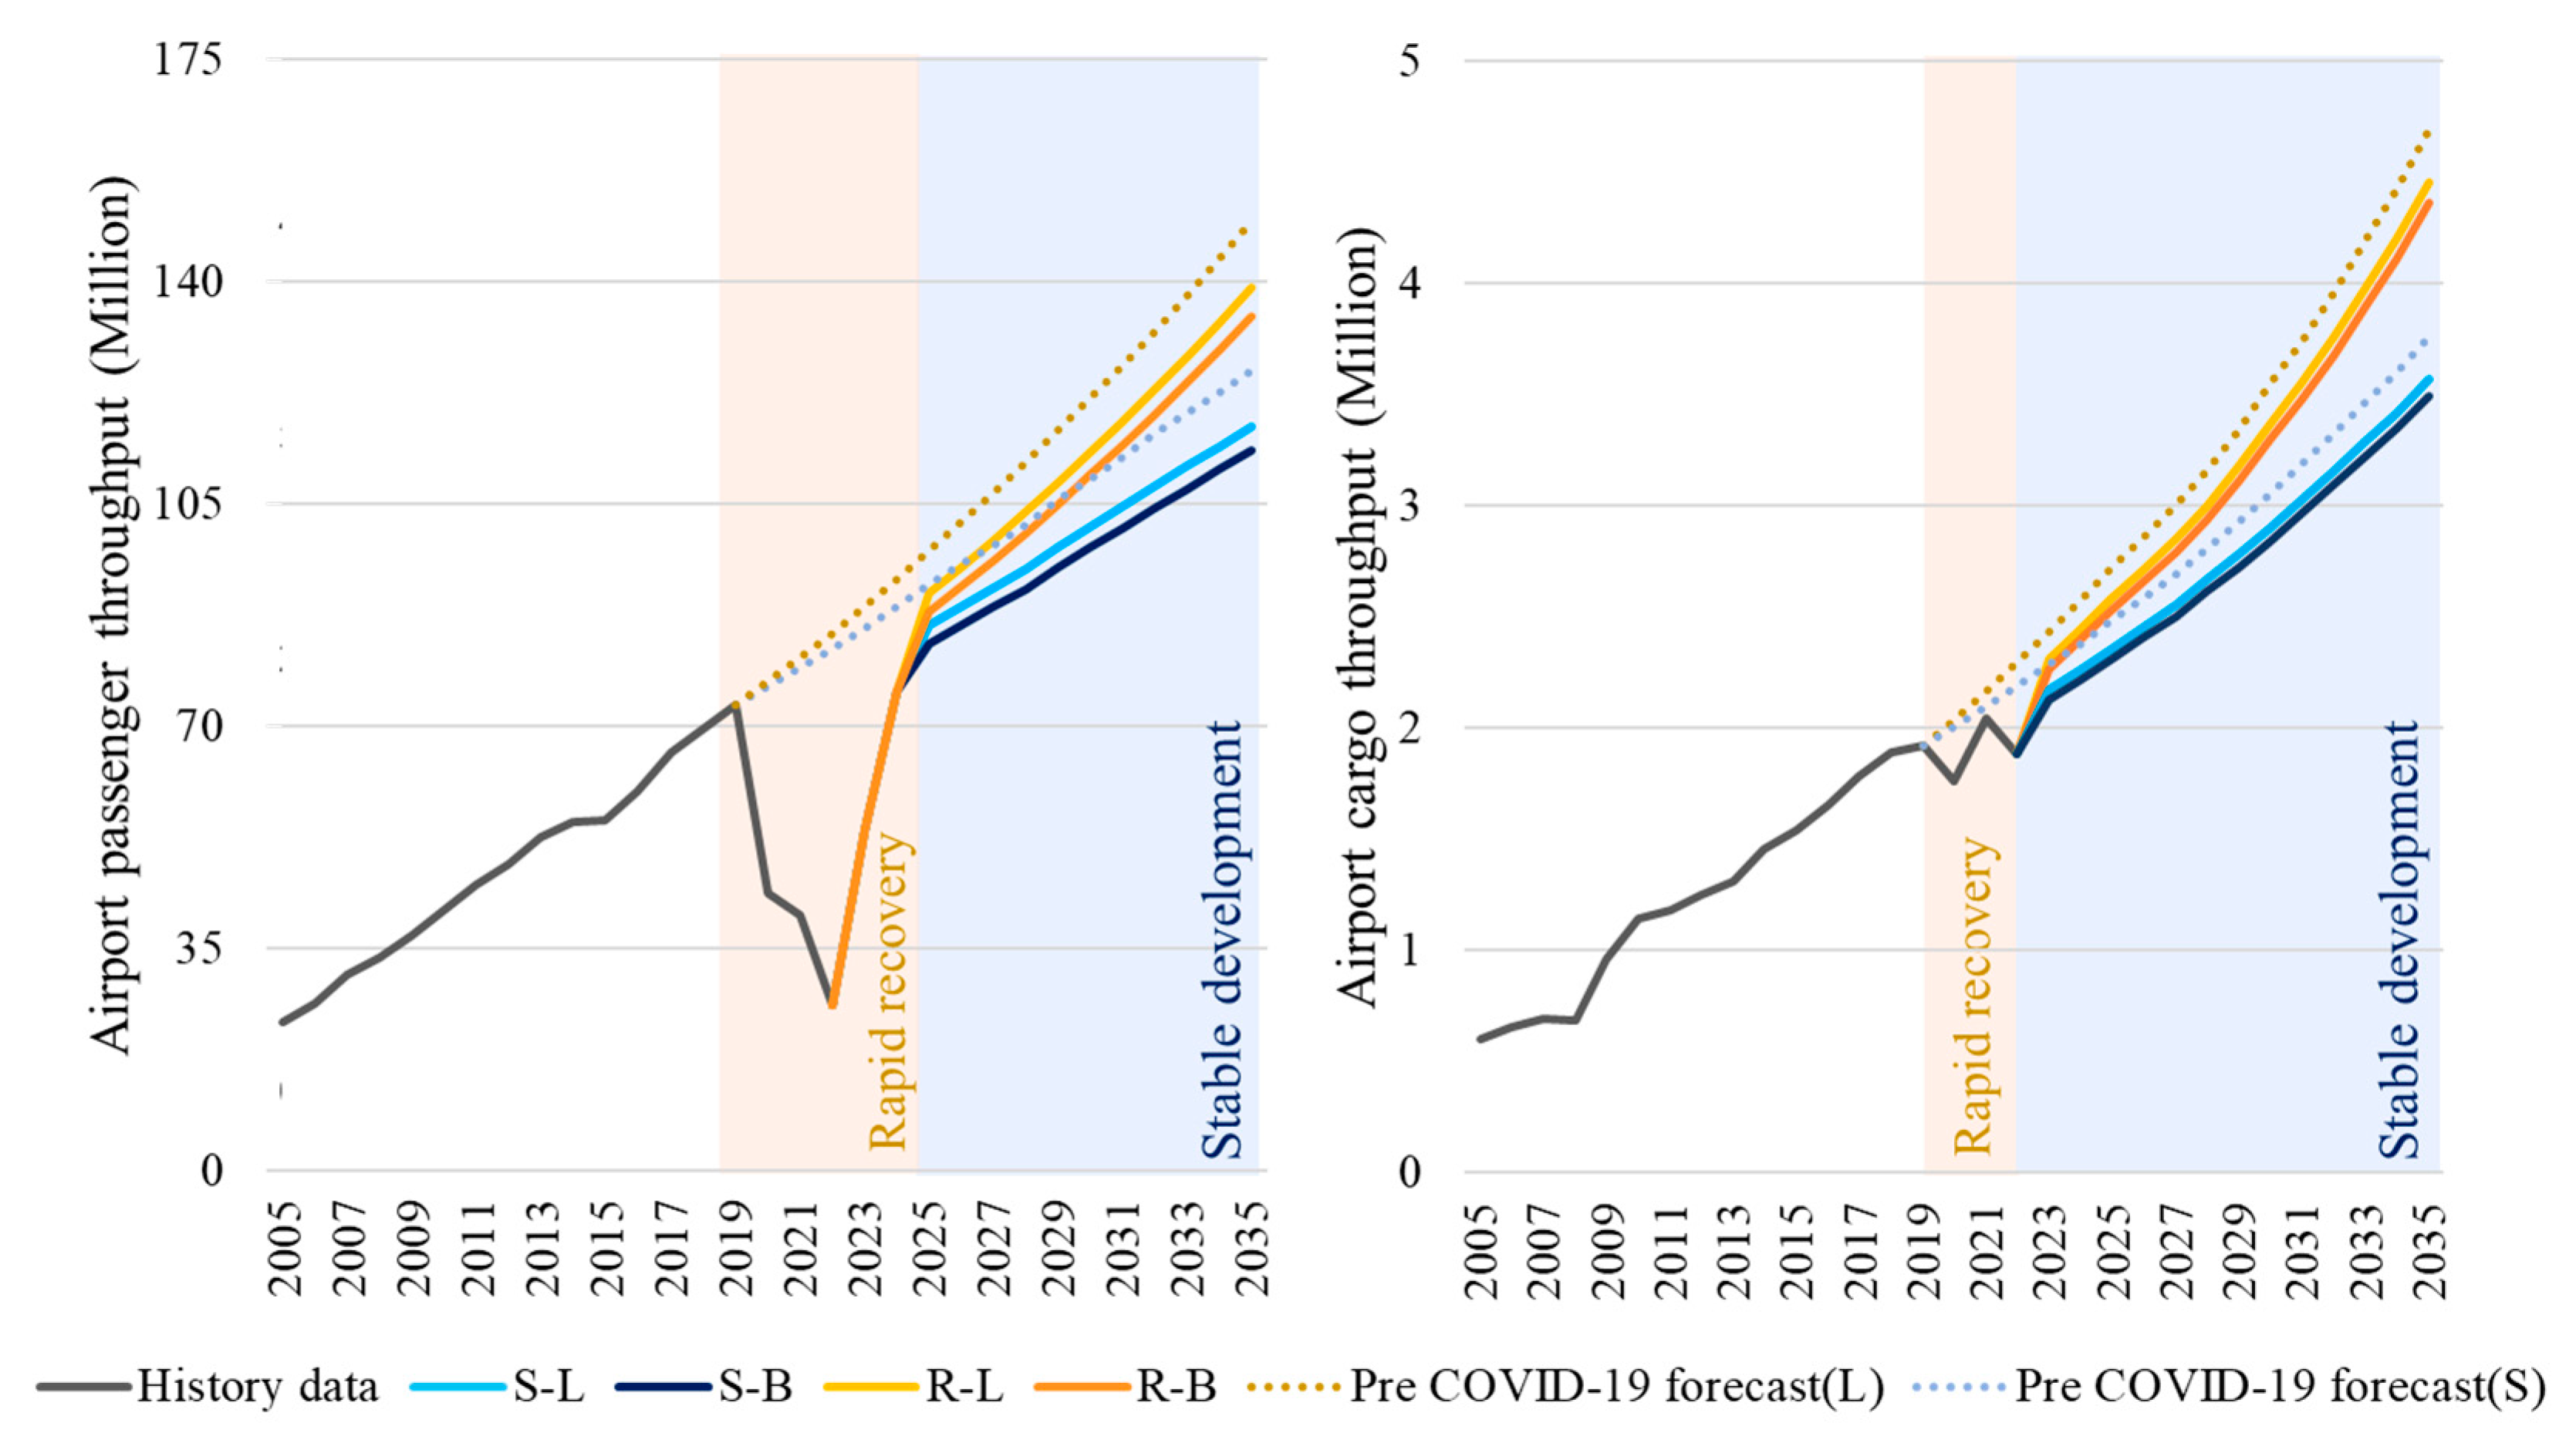
3.1. Results of Airport Throughput Prediction

Based on the SEPs and EPs set in the socioeconomic–epidemic module and the historical throughput data of CAN, the results of airport throughput prediction obtained by the airport throughput prediction module are shown in Figure 8. From the left figure, it can be observed that the airport passenger throughput exhibits a “V”-shaped recovery trend during the rapid recovery stage. Furthermore, the throughput continues to grow steadily during the stable development stage. The range of growth rates for passenger traffic and freight traffic under different scenarios is 4.6–6.0% and 5.8–7.9%, which is broadly in line with ACI projections of 5.5% and 6.4% [5], respectively.
Under the four scenarios, projected passenger throughputs in 2035 are estimated to reach 117.2 million, 113.5 million, 139.19 million, and 134.7 million. In Figure 8, the cargo throughput continues to increase in the stable development stage, and the growth rate is faster than that of passenger throughput. In 2035, the cargo throughput will reach 3.42 million tons, 3.31 million tons, 4.21 million tons, and 4.07 million tons under the four scenarios.

3.2. Activity-Level Prediction Results

Based on the airport throughput prediction results and the AMP set in the emission reduction scenario-setting module, the activity-level prediction results were obtained through the activity-level module, as shown in Figure 9. According to Figure 9a, the AE activity levels of passenger and cargo aircraft continue to rise in all four scenarios, reaching around 460 thousand LTO cycles in 2035.
It can be seen in Figure 9b that the GSE activity level rises steadily in all scenarios and is within the running time range of 70–80 thousand minutes in 2035.
According to Figure 9c, the APU activity level varies across the 12 scenarios due to the implementation of different levels of structural optimization measures. Under the BAS, the APU activity level shows a continuous upward trend. Conversely, under the EPS, the airport will progressively replace APUs, leading to a gradual decline in the activity level. Eventually, with a 100% APU replacement rate, the APU activity level is expected to reach zero in all scenarios by 2035. Under the LCS, airports aim to achieve full APU replacement by 2030, resulting in a complete reduction in APU activity levels to zero across all scenarios by 2030.
From Figure 9d, it is evident that the GAV activity level demonstrates a consistent upward trend under the BAS, reaching approximately 1.6 billion passenger kilometers by 2035. However, under the EPS, the growth trend is hindered by a decline in the ratio of GAV arrivals, primarily attributed to an augmented proportion of subway arrivals. Under the LCS, the proportion of subway arrivals further increases, leading to a further slowdown in the growth trend. By 2035, the GAV activity level is projected to be around 1 billion passenger kilometers. Concurrently, the activity level of airport buses will progressively increase, while that of private cars and taxis will gradually diminish.

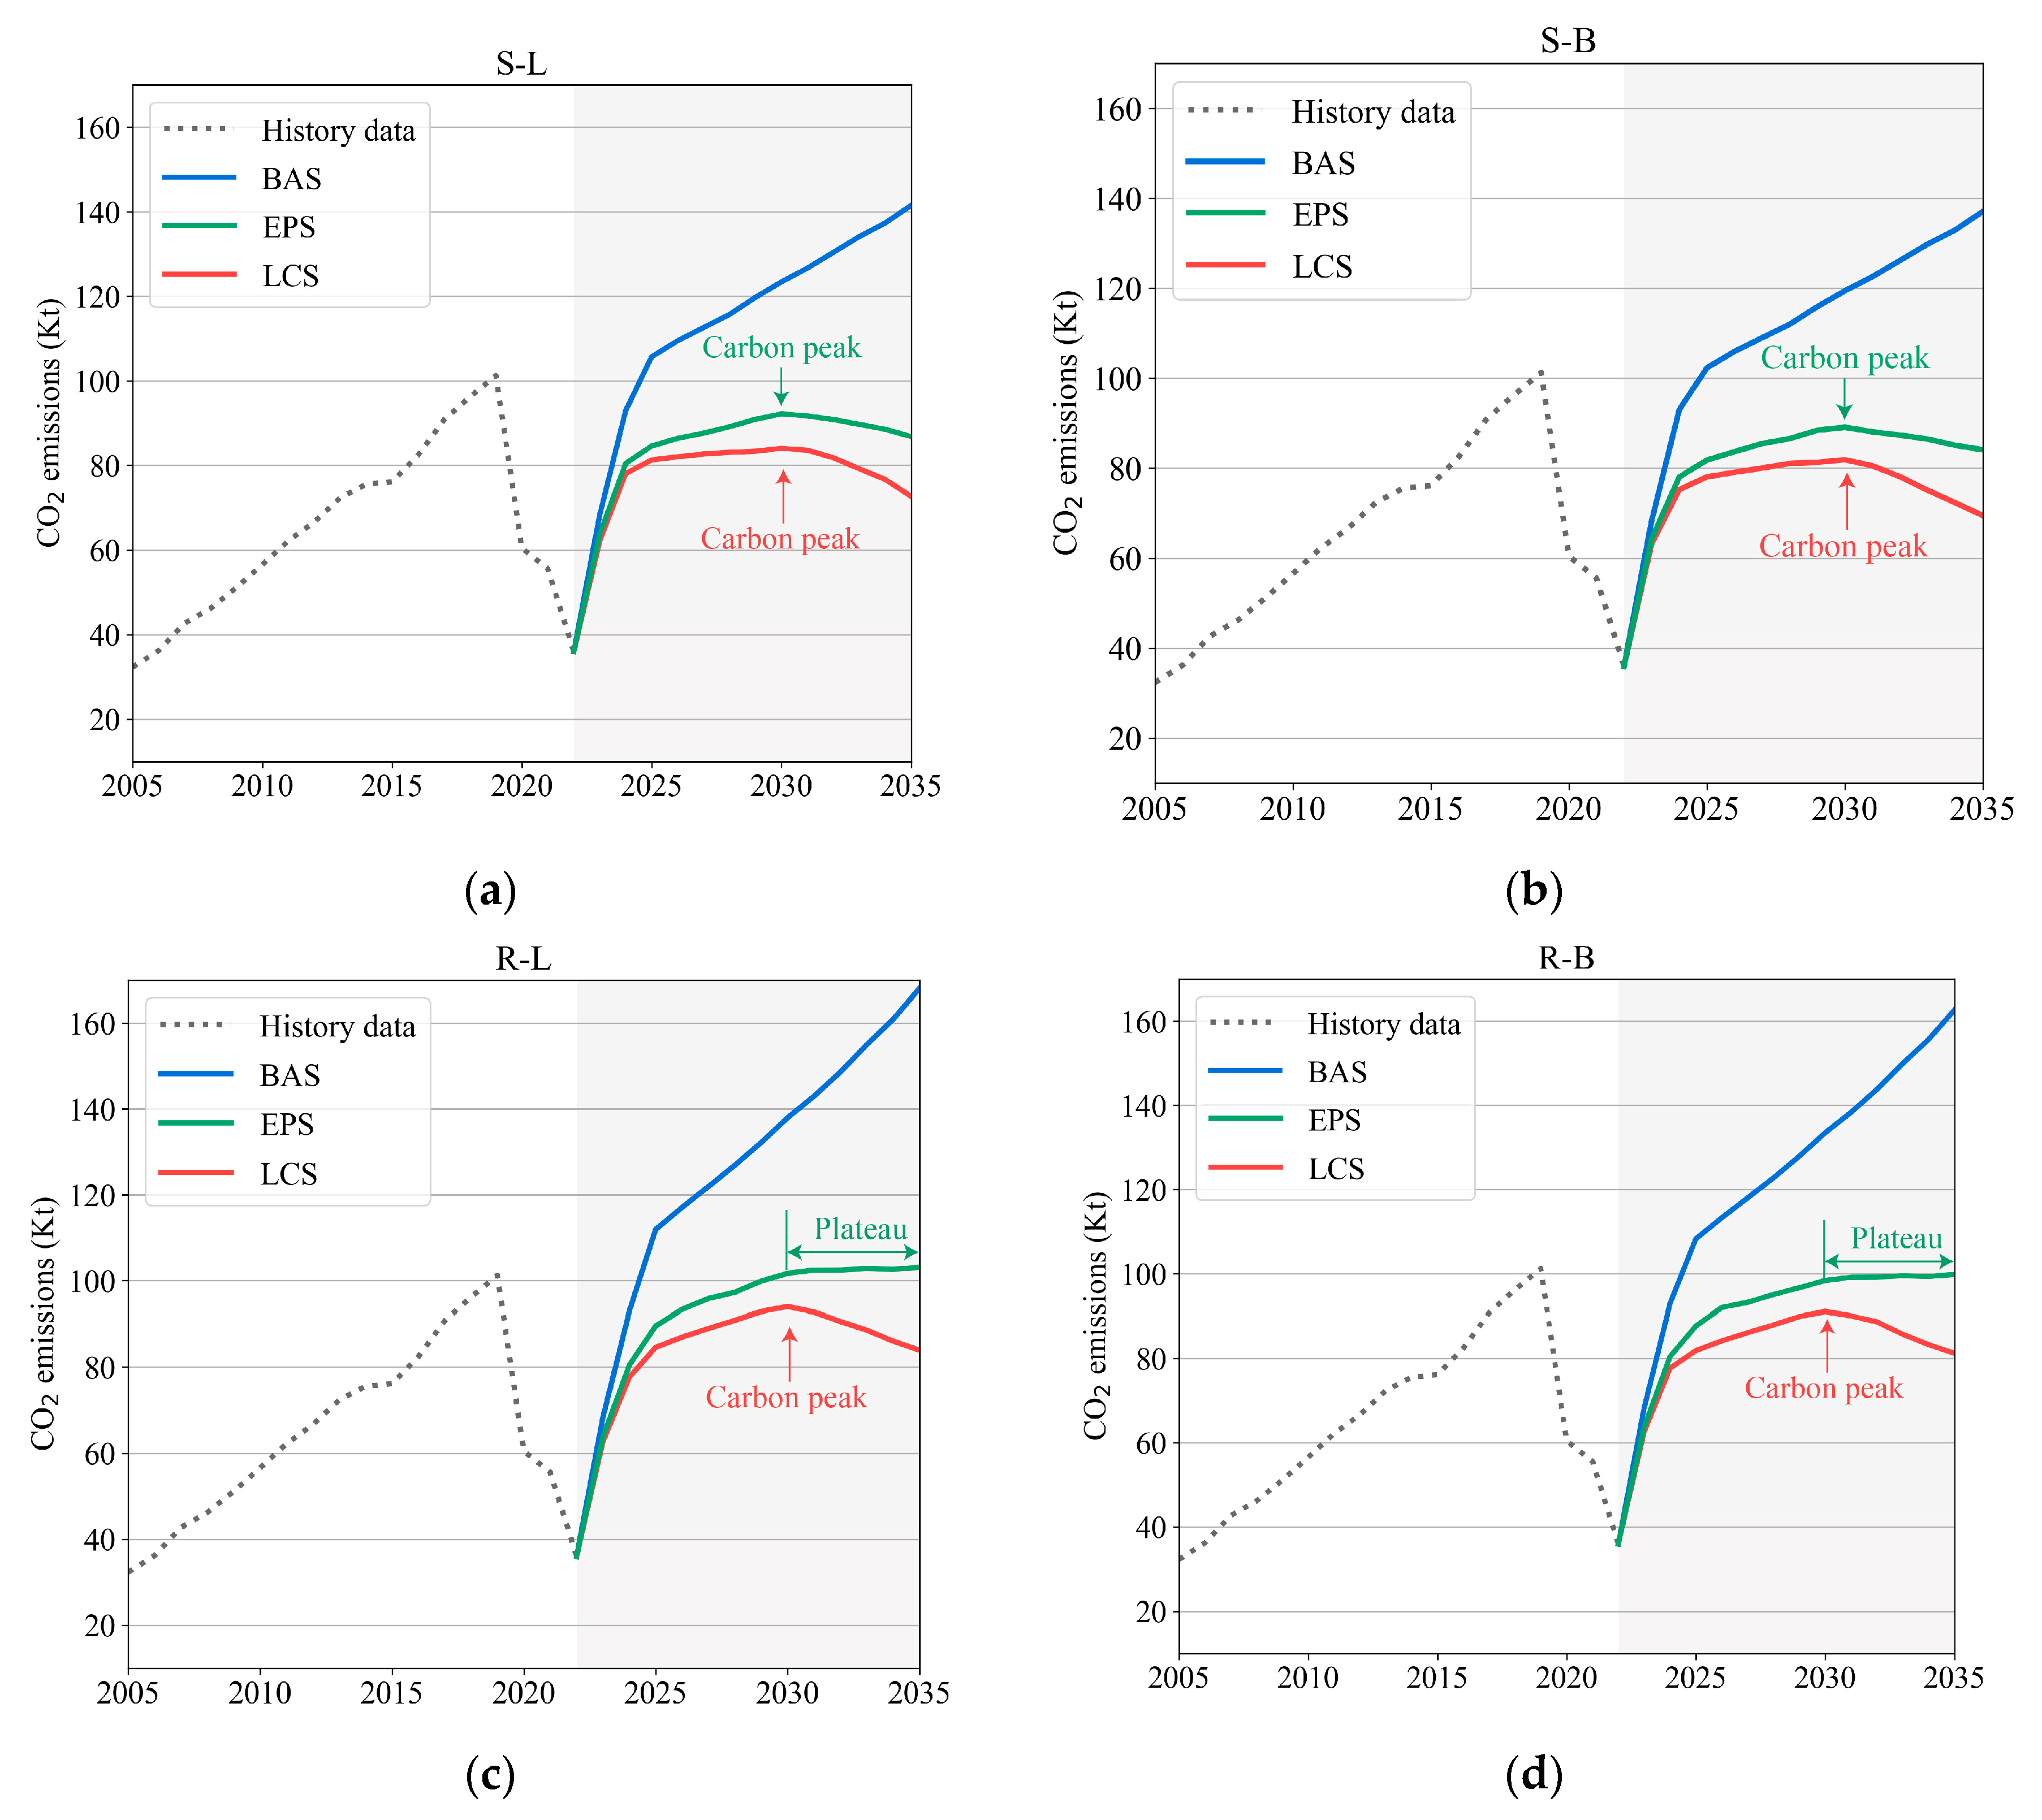
3.3. Airport Carbon Emission Prediction Results

Based on the historical data of CAN, this study used the LEAP model to account for the historical carbon emissions from 2005 to 2022. The results are basically consistent with the results calculated by the emissions and dispersion modeling system, which is an accurate simulation model of airport pollutants [53]. Next, based on the predicted results for the activity level, energy intensity, and AMP from the data-processing module, the forecast results of CAN in 2022–2035 under different scenarios are predicted by the LEAP model, as shown in Figure 10.
As can be seen in Figure 10a,b, CAN cannot achieve the carbon-peaking goal under the BAS. In contrast, the goal can be achieved at the intensity of the EPS and LCS: the peaks are about 80 kt tons and 90 kt tons, and the emissions will reach about 70 kt tons in 2035. In Figure 10c,d, which represent the rapid socioeconomic development intensity (the category R scenario), it can be observed that the airport carbon emission continues to increase under the BAS, and the emissions will reach about 160 kt tons in 2035. CAN still cannot achieve carbon peaking at the abatement intensity of the EPS, and carbon emissions will enter a plateau period from 2030 to 2035, with emissions of about 1 million tons. At the intensity of the LCS, the airport can achieve peak carbon, with a peak of about 90 kt tons.
This study mainly considers the influence of three uncertainty factors on the carbon emission prediction results: (1) The influence of socioeconomic factors. By comparing the class S scenarios (S-B, S-L) and class R scenarios (R-B, R-L), it can be seen that the speed of socioeconomic development affects whether airports can achieve the target of carbon peaking. For example, at the same EPS intensity, CAN achieves carbon peaking in the S-L scenario but enters the peak plateau period in R-L (see Figure 10a,c). (2) Impact of epidemic factors. By comparing the L scenarios (S-L, R-L) and B scenarios (S-B, R-B), it can be seen that when the influence of the epidemic changes, there are differences in the total amount of emissions, but the process of carbon peaking is the same. (3) Influence of emission reduction measures. By analyzing the trend of carbon emissions under different abatement strengths in each subgraph, it can be seen that the abatement strength affects the process of carbon peaking. For example, in the S-L scenario, CAN cannot reach peak carbon emissions under the BAS, but it can reach peak carbon emissions under the EPS and the LCS, as shown in Figure 10a. In general, whether CAN can reach the carbon-peaking goal on time is determined by the speed of socioeconomic development and the strength of abatement, while the epidemic influencing factors will not affect the process.
Hu [23] used Xiamen Airport to predict aircraft carbon emissions, and the results showed that the airport could achieve peak carbon under the established abatement policy, which is consistent with the findings of this study under the class S scenario. However, this study also explores the class R scenario, in which the airport is unable to achieve peak carbon emissions with the current emission reduction efforts. This study considers more possibilities than Hu’s study, which results in more possibilities for the airport’s peak carbon process.

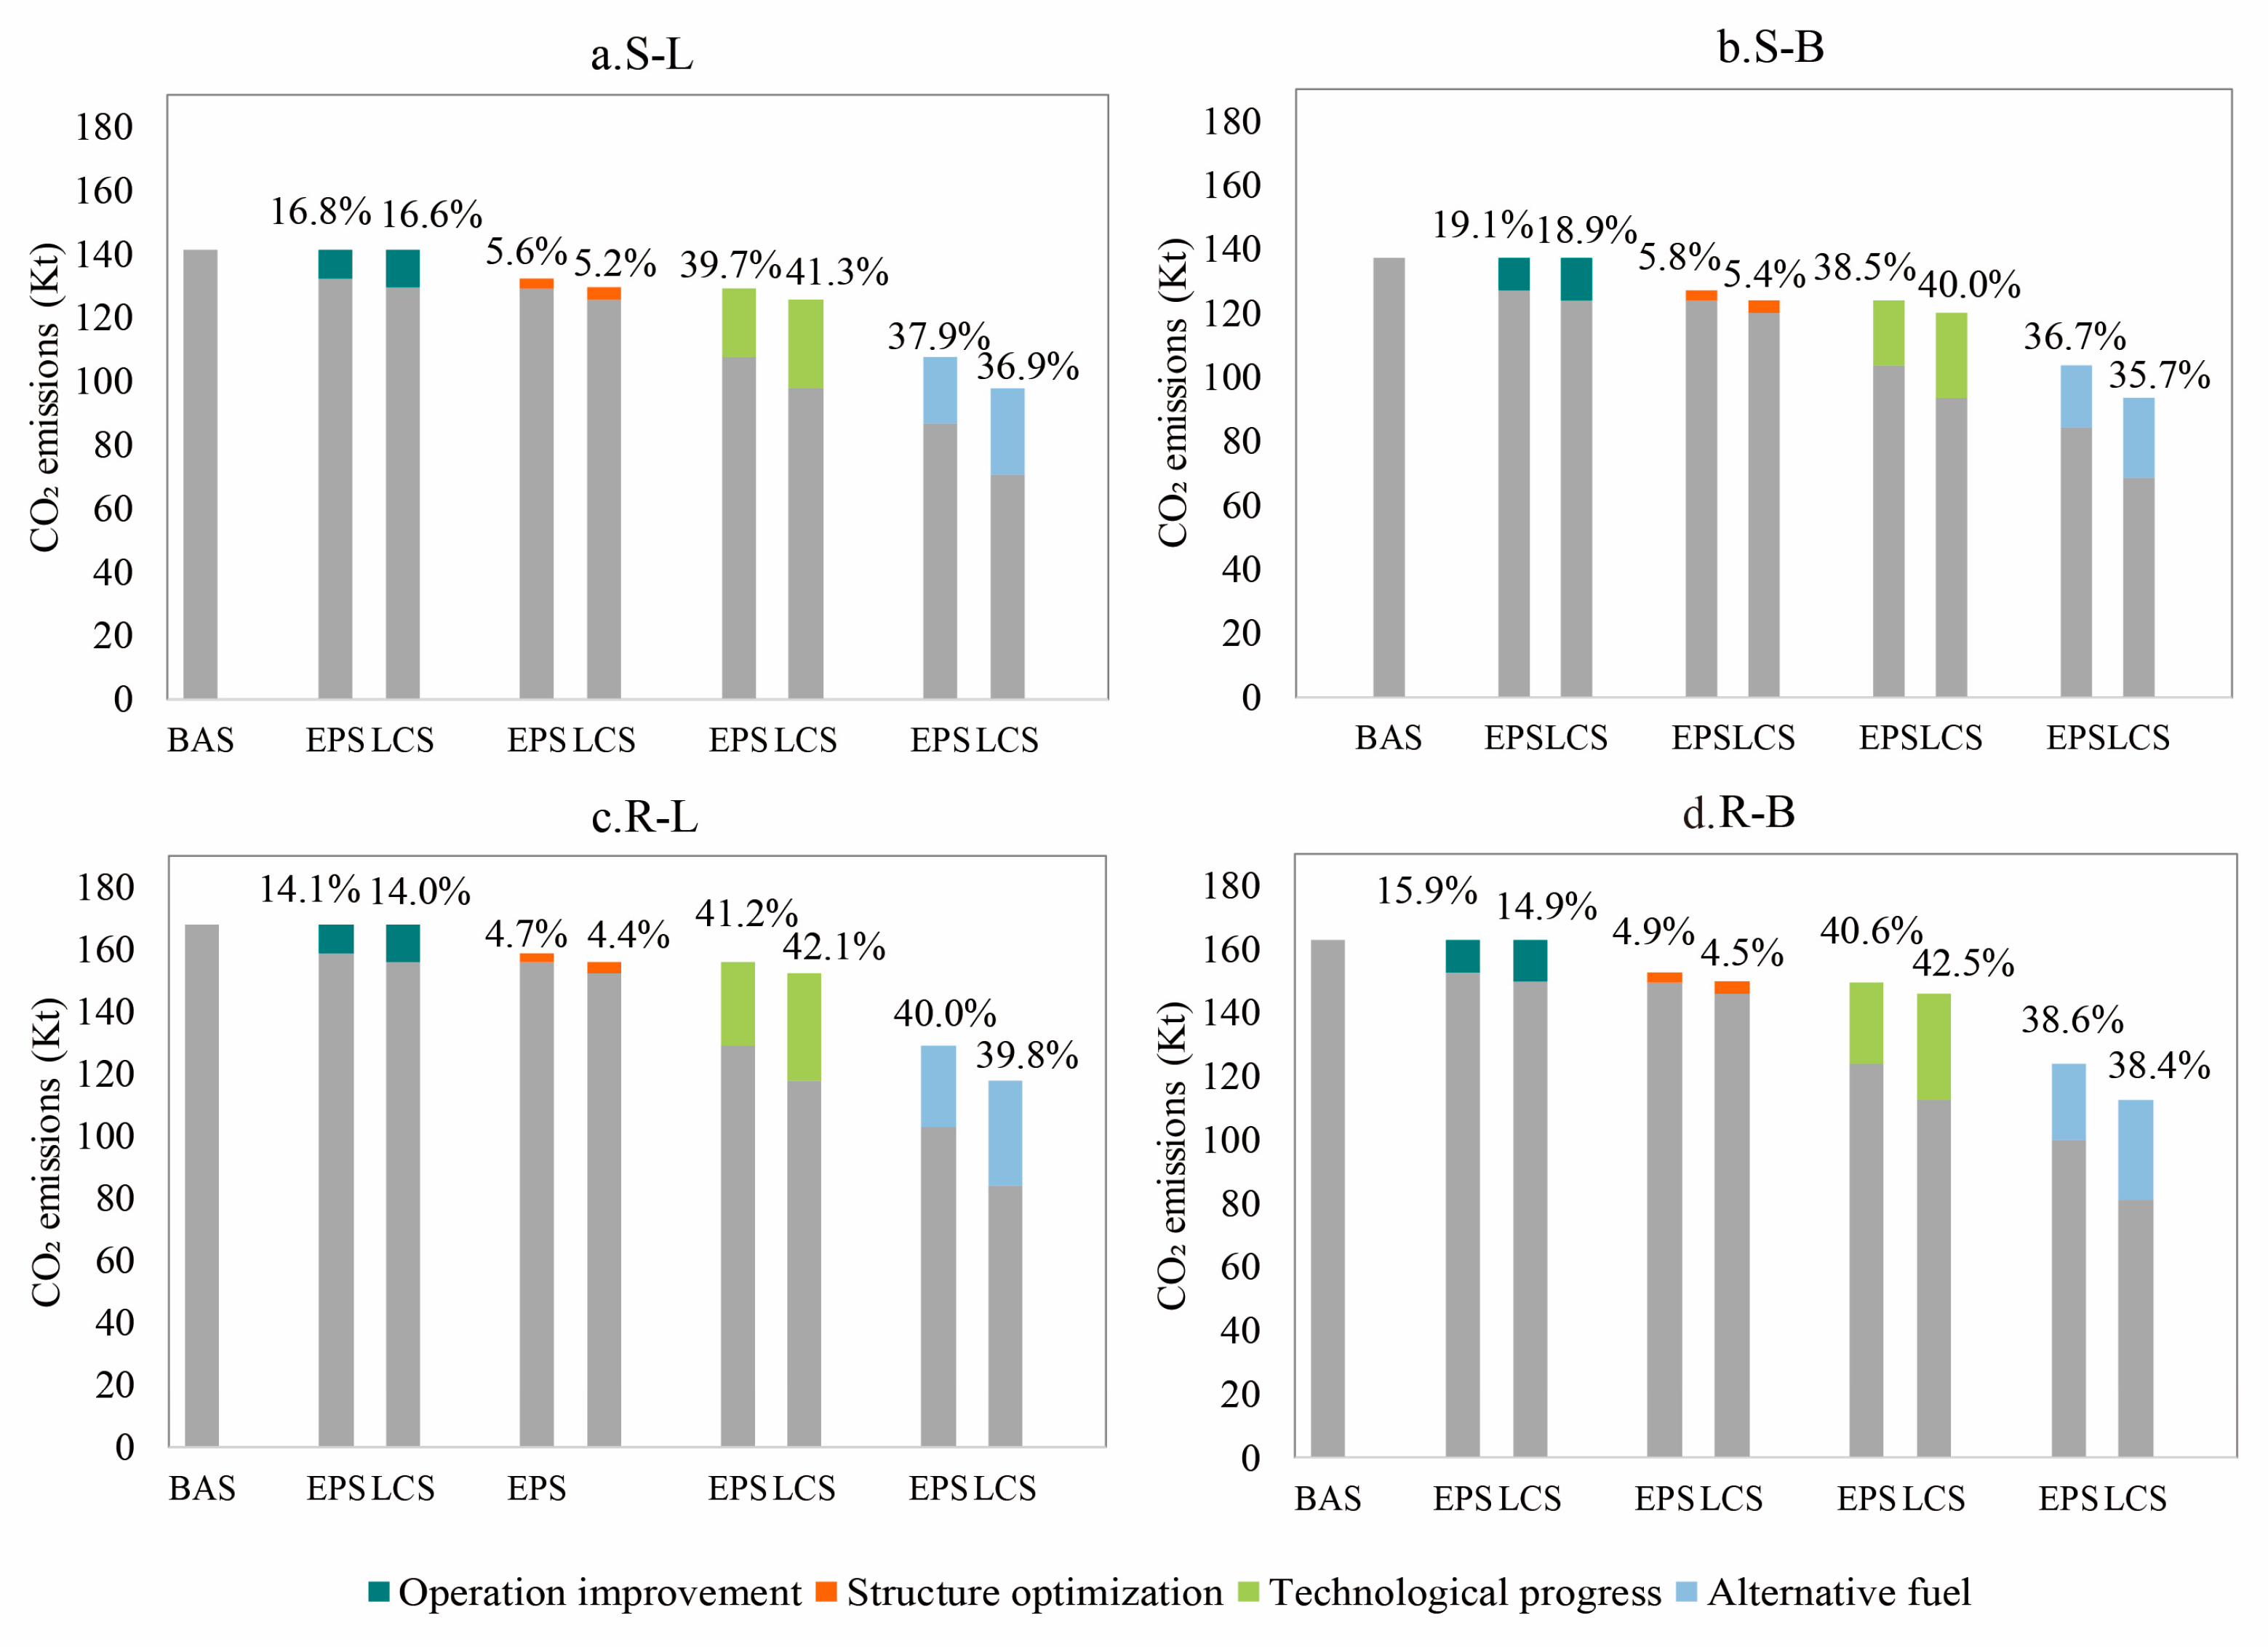
3.4. Analysis of Contribution Degree of Emission Reduction Measures

In order to select abatement measures for airports, this study analyzed the emission reduction contribution of different measures, and the results are shown in Figure 11. In all scenarios, the contribution order of the four types of emission reduction measures is as follows: technological progress > alternative fuel > operation improvement > structure optimization. Among them, technological progress measures contribute more than 40%, which is the most effective emission reduction measure. Alternative fuel measures come in second, contributing about 30%. Compared with the EPS, the contribution proportion of operational improvement and technological progress measures under the LCS increases, indicating that the two types of measures still have greater emission reduction potential.
Therefore, priority should be given to implementing these two types of measures. Since aircraft are the most important source of emissions, special attention should be paid to aircraft replacement to promote the application of high-efficiency aircraft engines. In addition, the use of SAFs in aircraft should be actively promoted.
Existing studies have analyzed the contribution of emission reduction measures based on the civil aviation industry as a whole, and only one emission source, the aircraft, is considered [42,43,44,45]. The ranking of emission reduction contribution is generally alternative fuel > technological progress > operational improvement (emission reduction measures for the aircraft do not include structural optimization measures). Among them, the ranking of alternative fuels and technological progress measures is different from the conclusion of this study, mainly because the process of alternative fuels in China is much slower than that in developed countries, and therefore, the penetration rate of alternative fuels set in this study is lower, resulting in a relatively low contribution to emission reduction.

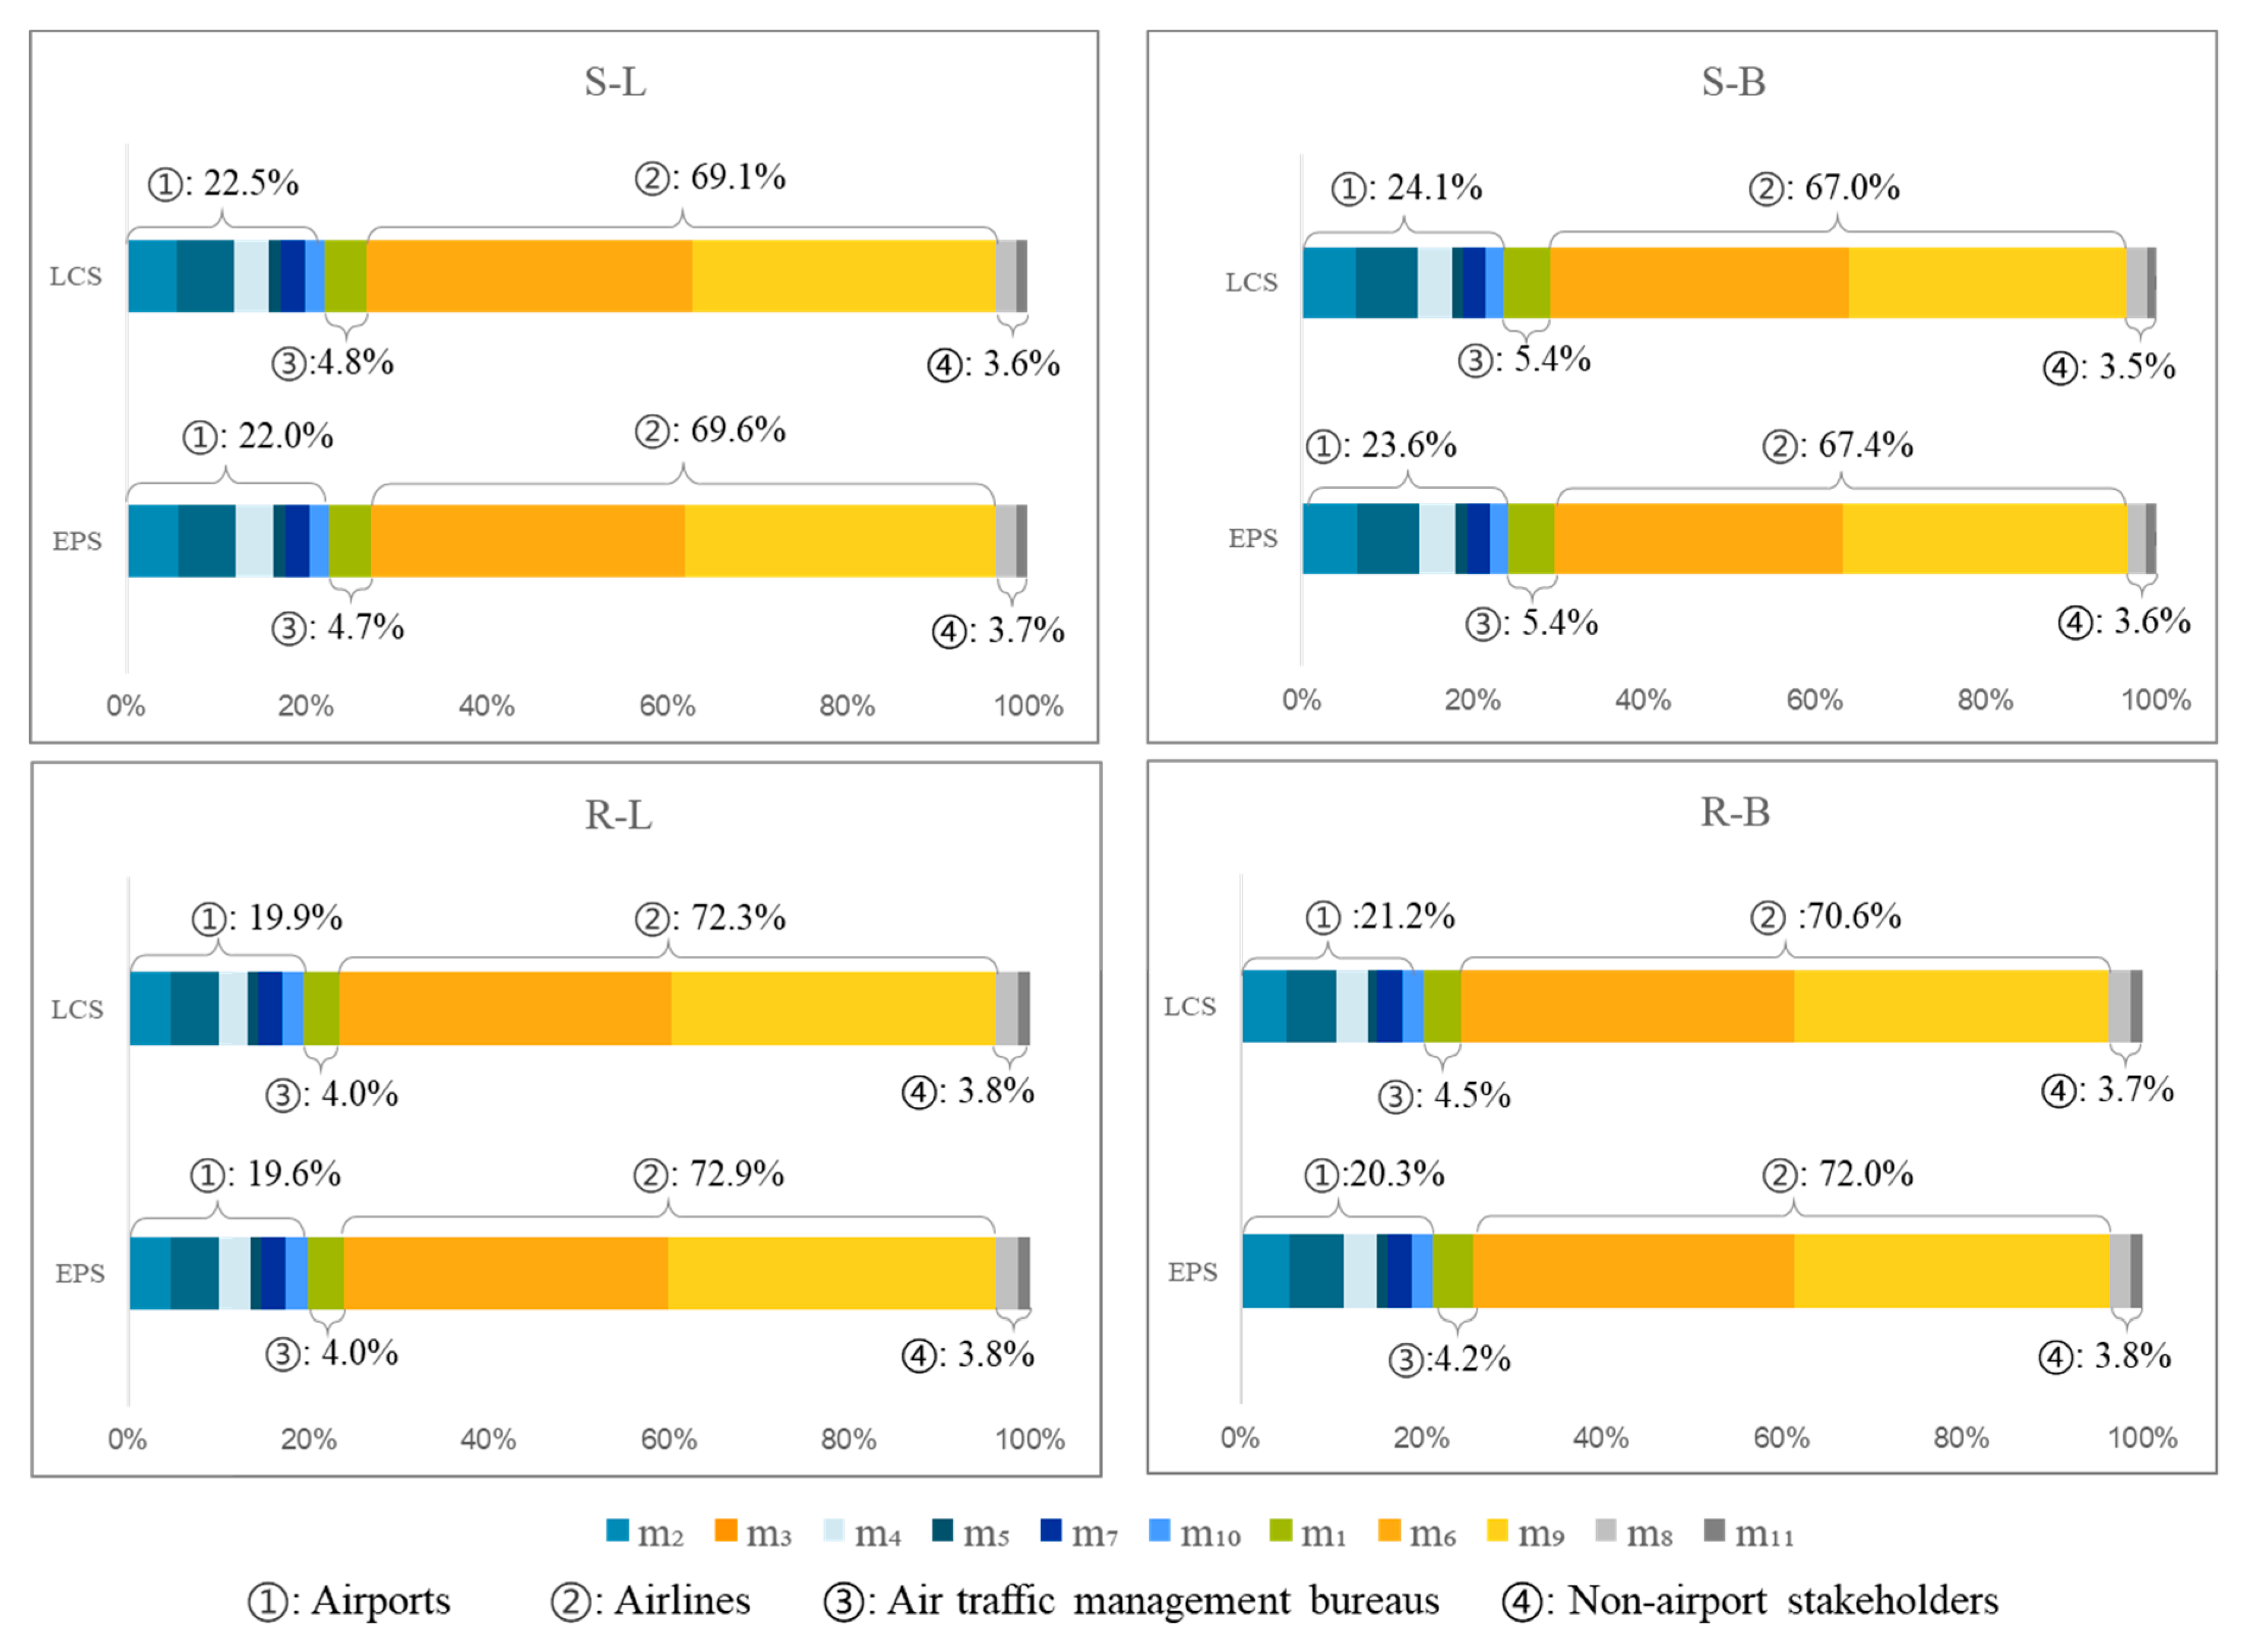
3.5. Distribution of Abatement Responsibilities among Airport Stakeholders

To clarify the responsibility of each stakeholder, this study first mapped the contributions of emission reduction measures to the relevant stakeholders of the airport, and the results are shown in Figure 12. As can be seen, airlines assume the most substantial burden, contributing approximately 70% across all scenarios. Airports follow closely in second place, with an estimated share of around 20%. Conversely, air traffic management bureaus bear the least responsibility for emission reduction, accounting for approximately 5%. In addition, in the category R scenario, the reduction responsibility of airlines will account for a larger proportion, because the airport throughput in the category R scenario is more than in the category S scenario, and the effects of technological progress measures and alternative fuel measures for aircraft are more prominent. Therefore, airlines should actively take measures to improve aircraft fuel efficiency, such as aircraft weight reduction, and promote the introduction of SAFs. However, airlines face huge cost problems in promoting high-efficiency engine replacement, and SAFs are still in the research and development stage, making it difficult to commercialize them in the short term. The implementation of these measures, despite their high potential for emission reductions, presents notable challenges in practice because of the small scale of the industry and high manufacturing costs. In contrast, the emission reduction measures undertaken by airports and air traffic management bureaus are more mature in technology and have been practiced by a large number of airports, so the implementation will face fewer difficulties. For example, the single-engine taxi, which is the responsibility of the airport, only needs to be improved at the operational level, without technical innovation or significant cost investment.

4. Conclusions and Policy Recommendations

In order to help the civil aviation industry to achieve the target of carbon peaking on time and promote the sustainable development of civil aviation, a medium- and long-term airport carbon emission prediction model was constructed based on the LEAP model. Taking CAN as the research object, the development trend of CAN’s carbon emissions was simulated, which considered three uncertain factors: socioeconomic development, the impact of the epidemic, and the intensity of abatement measures. To provide decision support for the abatement work of airports, we further analyzed the contribution of emission reduction measures and assigned emission reduction responsibilities to airport stakeholders. The key findings are as follows:
i.
The intensity of airport carbon emission reduction measures should match the level of socioeconomic development. With the emission abatement efforts of the existing policies (EPS), the airport can achieve the carbon-peaking goal at a slow socioeconomic development intensity but will enter a plateau period at a rapid socioeconomic development intensity and cannot reach carbon peaking on time. On the basis of existing policies, increasing abatement efforts (LCS) can ensure that airports can realize the goal on time under all scenarios. Therefore, airport stakeholders should pay attention to various possible scenarios and plan the intensity of emission reduction measures in advance. Airport stakeholders can use the Carbon Peak Action Plan by 2030 [2] and the 14th Five-Year Plan for the Green Development of Civil Aviation [6] as guidance and determine the appropriate emission reduction intensity according to social and economic development.
ii.
Among the airport carbon emission reduction strategies, technological progress measures and alternative fuel measures have the greatest emission reduction potential. Special attention should be paid to the implementation of two types of emission reduction measures for aircraft, that is, actively promoting the application of high-efficiency aircraft engines while actively introducing SAFs. At present, Chinese airlines have achieved the first commercial flight using SAF [54] and should continue to accelerate the use of SAFs.
iii.
Among airport stakeholders, airlines are the most responsible party for emission reduction, accounting for more than 70% of the abatement responsibility. The airport’s emission reduction responsibility is about 20%, and the abatement responsibility of air traffic management bureaus is about 5%. However, the implementation of emission reduction measures responsible for airlines will face greater challenges, and the technology responsible for airports and air traffic management bureaus is more mature and less difficult to implement. Therefore, the most efficient measures should be selected according to the potential and difficulty of emission reduction measures.
There are three potential limitations in this study that need to be further studied:
i.
The research object of this study is carbon emissions related to transportation activities in airports, and emission sources such as terminals are not included in the carbon emission scope. However, the carbon emission scope determined in this study includes several major emission sources in airports, which can represent the development of airport carbon emissions. In a follow-up study, the carbon emission boundary of airports can be expanded to explore its carbon emission trend.
ii.
The case study in this study is a large airport, and this study did not carry out case studies on medium-sized and small airports due to the limitation of research time. A future study with a larger cohort size is needed to explore the development trends of different types of airports since the carbon emissions of different types of airports may show different development trends.
iii.
The topic of this study is whether airports can achieve the carbon-peaking goal. Due to time constraints, the possibility of carbon neutrality in airports has not been discussed. At present, the research on carbon emission prediction related to airport carbon neutrality is still lacking. In our future work, we intend to further study this.

Author Contributions

Investigation, W.Y. (Wenhui Ye); Resources, Z.W.; Data curation, Y.L., Z.S., H.W. and X.J.; Writing—original draft, W.Y. (Wenjing Ye); Writing—review & editing, L.W. and J.C. All authors have read and agreed to the published version of the manuscript.

Funding

This research was funded by the China Civil Aviation Safety Capacity Building Fund, China (FSSA20220080).

Institutional Review Board Statement

Not applicable.

Informed Consent Statement

Not applicable.

Data Availability Statement

Not applicable.

Conflicts of Interest

The authors declare no conflict of interest.

References

  1. Cavicchioli, R.; Ripple, W.J.; Timmis, K.N.; Azam, F.; Bakken, L.R.; Baylis, M.; Behrenfeld, M.J.; Boetius, A.; Boyd, P.W.; Classen, A.T.; et al. Scientists’ Warning to Humanity: Microorganisms and Climate Change. Nat. Rev. Microbiol. 2019, 17, 569–586. [Google Scholar] [CrossRef] [PubMed]
  2. The State Council of the People’s Republic of China. Action Plan for Peaking Carbon Emissions before 2030; The State Council of the People’s Republic of China: Beijing, China, 2021.
  3. 2019 Civil Aviation Industry Development Statistical Bulletin. Available online: https://www.gov.cn/xinwen/2020-06/13/5519220/files/c5cf239470c64d7fb5cde4626ba9b37e.pdf (accessed on 8 September 2023).
  4. You, Q.; Li, H.; Bo, X.; Zheng, Y. Inventory of Air pollutants and carbon emissions from China’s Civil aviation Airports. Chin. Environ. Sci. 2022, 42, 4517–4524. [Google Scholar] [CrossRef]
  5. Airports Council International (ACI). ACI World Airport Traffic Forecasts 2021–2040; Airports Council International: Montreal, Qc, Canada, 2020. [Google Scholar]
  6. China Civil Aviation Administration (CAAC). “14th Five-Year Plan” Special Plan for Green Development of Civil Aviation; China Civil Aviation Administration: Beijing, China, 2021.
  7. Scheelhaase, J.D.; Grimme, W.G. Emissions Trading for International Aviation—An Estimation of the Economic Impact on Selected European Airlines. J. Air Transp. Manag. 2007, 13, 253–263. [Google Scholar] [CrossRef]
  8. Cui, Q.; Lei, Y.; Li, Y.; Wanke, P.F. Impacts of the COVID-19 on All Aircraft Emissions of International Routes in South America. iScience 2022, 25, 104865. [Google Scholar] [CrossRef] [PubMed]
  9. Airport Environmental Sustainability (IATA). Airport Environmental Sustainability; International Air Transport Association: Montreal, QC, Canada, 2022. [Google Scholar]
  10. Chèze, B.; Gastineau, P.; Chevallier, J. Forecasting World and Regional Aviation Jet Fuel Demands to the Mid-Term (2025). Energy Policy 2011, 39, 5147–5158. [Google Scholar] [CrossRef]
  11. Yang, H.; O’Connell, J.F. Short-Term Carbon Emissions Forecast for Aviation Industry in Shanghai. J. Clean. Prod. 2020, 275, 122734. [Google Scholar] [CrossRef]
  12. He, L.-Y.; Gao, Y.-X. Including Aviation in the European Union Emissions Trading Scheme: Impacts on Industries, Macro-Economy and Emissions in China. IJEF 2012, 4, 91. [Google Scholar] [CrossRef]
  13. Planes, T.; Delbecq, S.; Pommier-Budinger, V.; Benard, E. Simulation and Evaluation of Sustainable Climate Trajectories for Aviation. J. Environ. Manag. 2021, 295, 113079. [Google Scholar] [CrossRef]
  14. Yu, J.; Shao, C.; Xue, C.; Hu, H. China’s Aircraft-Related CO2 Emissions: Decomposition Analysis, Decoupling Status, and Future Trends. Energy Policy 2020, 138, 111215. [Google Scholar] [CrossRef]
  15. Liu, X.; Hang, Y.; Wang, Q.; Zhou, D. Flying into the Future: A Scenario-Based Analysis of Carbon Emissions from China’s Civil Aviation. J. Air Transp. Manag. 2020, 85, 101793. [Google Scholar] [CrossRef]
  16. Tan, B.S.; Yap, E.H. Sustainable Growth of the Commercial Aviation Industry in Malaysia Using A System Dynamics Approach. 2015, 10, 1150–1161. J. Eng. Sci. Technol. 2015, 10, 1150–1161. [Google Scholar]
  17. Sharma, A.; Jakhar, S.K.; Choi, T.-M. Would CORSIA Implementation Bring Carbon Neutral Growth in Aviation? A Case of US Full Service Carriers. Transp. Res. Part D Transp. Environ. 2021, 97, 102839. [Google Scholar] [CrossRef]
  18. Zhang, X.; Chen, Y.; Jiang, P.; Liu, L.; Xu, X.; Xu, Y. Sectoral Peak CO2 Emission Measurements and a Long-Term Alternative CO2 Mitigation Roadmap: A Case Study of Yunnan, China. J. Clean. Prod. 2020, 247, 119171. [Google Scholar] [CrossRef]
  19. Xu, J.; Wang, K. Medium- and long-term carbon emission forecasts and analysis of technical emission reduction potentials in China’s civil aviation industry. China Environ. Sci. 2022, 42, 3412–3424. [Google Scholar] [CrossRef]
  20. Güzel, T.D.; Alp, K. Modeling of Greenhouse Gas Emissions from the Transportation Sector in Istanbul by 2050. Atmos. Pollut. Res. 2020, 11, 2190–2201. [Google Scholar] [CrossRef]
  21. Acharya, R.; Bhattarai, N. Analysis of Greenhouse Gas Emission from Aircrafts and Ground Service Equipment at Tribhuvan International Airport of Nepal. J. Adv. Coll. Eng. Manag. 2021, 6, 111–122. [Google Scholar] [CrossRef]
  22. Pamplona, D.A.; Alves, C.J.P. Civil Aircraft Emissions Study and Pollutant Forecasting at a Brazilian Airport. Eng. Technol. Appl. Sci. Res. 2020, 10, 5217–5220. [Google Scholar] [CrossRef]
  23. Hu, H.; Wang, D.; Feng, H. Prediction of Aircraft CO2 Emission from Perspective of CO2 Emission Peak. Transp. Syst. Eng. Inf. 2021, 21, 257–263. [Google Scholar] [CrossRef]
  24. LEAP. Available online: https://leap.sei.org/default.asp?action=login (accessed on 5 September 2023).
  25. Cai, L.; Duan, J.; Lu, X.; Luo, J.; Yi, B.; Wang, Y.; Jin, D.; Lu, Y.; Qiu, L.; Chen, S.; et al. Pathways for Electric Power Industry to Achieve Carbon Emissions Peak and Carbon Neutrality Based on LEAP Model: A Case Study of State-Owned Power Generation Enterprise in China. Comput. Ind. Eng. 2022, 170, 108334. [Google Scholar] [CrossRef]
  26. Talaei, A.; Pier, D.; Iyer, A.V.; Ahiduzzaman, M.; Kumar, A. Assessment of Long-Term Energy Efficiency Improvement and Greenhouse Gas Emissions Mitigation Options for the Cement Industry. Energy 2019, 170, 1051–1066. [Google Scholar] [CrossRef]
  27. Dong, J.; Li, Y.; Li, W.; Liu, S. CO2 Emission Reduction Potential of Road Transport to Achieve Carbon Neutrality in China. Sustainability 2022, 14, 5454. [Google Scholar] [CrossRef]
  28. Wang, J.; Li, Y.; Zhang, Y. Research on Carbon Emissions of Road Traffic in Chengdu City Based on a LEAP Model. Sustainability 2022, 14, 5625. [Google Scholar] [CrossRef]
  29. Federal Aviation Administration. Aviation Emissions and Air Quality Handbook; Federal Aviation Administration: Washington, DC, USA, 2022.
  30. Hernández, K.D.; Fajardo, O.A. Estimation of Industrial Emissions in a Latin American Megacity under Power Matrix Scenarios Projected to the Year 2050 Implementing the LEAP Model. J. Clean. Prod. 2021, 303, 126921. [Google Scholar] [CrossRef]
  31. KB Environmental Sciences, Inc.; Airport Cooperative Research Program; Transportation Research Board; National Academies of Sciences, Engineering, and Medicine. ACRP149-Improving Ground Support Equipment Operational Data for Airport Emissions Modeling; Transportation Research Board: Washington, DC, USA, 2015; p. 22084. ISBN 978-0-309-37493-4. [Google Scholar]
  32. Van Amstel, A. IPCC 2006 Guidelines for National Greenhouse Gas Inventories; IPCC: Geneva, Switzerland, 2006; ISBN 978-4-88788-032-0. [Google Scholar]
  33. Guangzhou Baiyun International Airport Co., Ltd. Annual Report 2015; Guangzhou Baiyun International Airport Co., Ltd.: Guangzhou, China, 2016. [Google Scholar]
  34. Analysis of the Impact of Airport Capacity and Fleet Size on Flight. Available online: http://att.caacnews.com.cn/mhfzzcgjyxb/mhfzzcgjyxb2th/202110/t20211028_59205.html (accessed on 5 September 2023).
  35. Peng, D.; Zhang, M.; Xiao, Y.; Wang, Y. Research on Passenger Throughput Forecast of Civil Aviation Airport Based on Multi-source Data. J. Phys. Conf. Ser. 2022, 217, 012027. [Google Scholar] [CrossRef]
  36. Zhang, X. Research on Forecasting Method of Aviation Traffic Based on Social and Economic Indicators. IOP Conf. Ser. Mater. Sci. Eng. 2020, 780, 062038. [Google Scholar] [CrossRef]
  37. Chen, B.; Zhao, X.; Wu, J. Evaluating Prediction Models for Airport Passenger Throughput Using a Hybrid Method. Appl. Sci. 2023, 13, 2384. [Google Scholar] [CrossRef]
  38. Ke, J.; Zheng, H.; Yang, H.; Chen, X. (Michael) Short-Term Forecasting of Passenger Demand under on-Demand Ride Services: A Spatio-Temporal Deep Learning Approach. Transp. Res. Part C Emerg. Technol. 2017, 85, 591–608. [Google Scholar] [CrossRef]
  39. Wang, J.; Xu, J.; Zhao, C.; Peng, Y.; Wang, H. An Ensemble Feature Selection Method for High-Dimensional Data Based on Sort Aggregation. Syst. Sci. Control Eng. 2019, 7, 32–39. [Google Scholar] [CrossRef]
  40. Airport Department of Civil Aviation Administration of China and Development Planning Department of Civil Aviation Administration of China. Forecasting of Air Traffic at Transport Airports Compilation Guide; Airport Department of Civil Aviation Administration of China and Development Planning Department of Civil Aviation Administration of China: Beijing, China, 2021.
  41. Boeing. Commercial Market Outlook 2022–2041; Boeing: Chicago, IL, USA, 2021. [Google Scholar]
  42. Sustainable Aviation. Decarbonisation Road-Map: A Path to Net Zero; Sustainable Aviation: London, UK, 2020. [Google Scholar]
  43. Airlines for Europe. Destination 2050—A Route to Net Zero European Aviation; Airlines for Europe: Brussels, Belgium, 2021. [Google Scholar]
  44. ATAG (Air Transport Action Group). Waypoint 2050; Air Transport Action Group: Geneva, Switzerland, 2021. [Google Scholar]
  45. International Air Transport Association (IATA). Aircraft Technology Net Zero Roadmap; International Air Transport Association: Montreal, QC, Canada, 2023. [Google Scholar]
  46. Commercial Aircraft Corporation of China, Ltd. (COMAC). Comac Market Forecast 2022–2041; Commercial Aircraft Corporation of China, Ltd.: Shanghai, China, 2021. [Google Scholar]
  47. The People’s Government of Guangzhou Municipality. Outline of the 14th Five-Year Plan for National Economic and Social Development of Guangzhou Municipality and the Long-Term Goals for 2035; The People’s Government of Guangzhou Municipality: Guangzhou, China, 2021.
  48. The People’s Government of Guangzhou Municipality. Land and Spatial Planning of Guangdong Province (2020–2035); The People’s Government of Guangzhou Municipality: Guangzhou, China, 2019.
  49. Guo, L.; Xi, X.; Yang, W.; Liang, L. Monitoring Land Use/Cover Change Using Remotely Sensed Data in Guangzhou of China. Sustainability 2021, 13, 2944. [Google Scholar] [CrossRef]
  50. The “Recovery Trilogy” of the Domestic Civil Aviation Market: In Early January Next Year, It Will First Recover to 70% of the Pre-Epidemic Flight Volume. Available online: https://www.thestudy.cn/newsDetail_forward_21198981 (accessed on 4 September 2023).
  51. IATA: Global Air Passenger Traffic Expected to Recover by 2024. Available online: https://www.iata.org/contentassets/0276e81943f34f12b515bf84eb42b60b/2022-03-01-01-cn.pdf (accessed on 1 March 2022).
  52. The People’s Government of Guangzhou Municipality. Guangzhou Comprehensive Transportation Hub Master Plan (2018–2035); The People’s Government of Guangzhou Municipality: Guangzhou, China, 2017.
  53. Wang, W.; Guo, R. Aircraft carbon diffusion model research and carbon reduction effect analysis. J. Environ. Eng. 2016, 34, 4. [Google Scholar] [CrossRef]
  54. China Civil Aviation Network: Guizhou Airlines Joins hands with Airbus to Launch Cooperation on Commercial Flight Application of Sustainable Aviation Fuel. Available online: http://www.caacnews.com.cn/1/6/202211/t20221109_1357164.html (accessed on 15 October 2023).
Figure 1. Scope of airport carbon emissions.
Sustainability 15 15409 g001
Figure 2. LEAP-Airport model framework.
Sustainability 15 15409 g002
Figure 3. Calculation process of activity level.
Sustainability 15 15409 g003
Figure 4. Guangzhou Baiyun Airport’s historical throughput.
Sustainability 15 15409 g004
Figure 5. Importance ranking of airport throughput factors.
Sustainability 15 15409 g005
Figure 6. BP neural network model structure.
Sustainability 15 15409 g006
Figure 7. Socioeconomic–epidemic scenario combinations.
Sustainability 15 15409 g007
Figure 8. Airline business volume prediction results.
Sustainability 15 15409 g008
Figure 9. Changes in activity levels under different scenarios. (a) Aero-engine (AE) activity level; (b) ground support equipment (GSE) activity level; (c) auxiliary power unit (APU) activity level; (d) ground approach vehicle (GAV) activity level.
Sustainability 15 15409 g009
Figure 10. Carbon emission prediction results of CAN under different scenarios. (a) S-L scenario; (b) S-B scenario; (c) R-L scenario; (d) R-B scenario.
Sustainability 15 15409 g010
Figure 11. Contribution of different types of emission reduction measures.
Sustainability 15 15409 g011
Figure 12. Distribution of responsibilities for emission reduction in airports among different subjects.
Sustainability 15 15409 g012
Table 1. Activity characteristics of each emission source in airports.
Emission SourcesDescription
AEEngine powered by aviation gasoline or aviation kerosene.
APUHelps start the main engines and provides power when the aircraft is approaching, taxiing, or repositioning on the apron.
GSEProvides corresponding services for the aircraft during arrival and departure so as to ensure the normal operation of the aircraft, including aircraft trailers, air starters, forklifts, etc.
GAVDrives in and out of the airport to pick up and drop off passengers, mainly including private cars, taxis, and airport buses.
Table 2. The tree data structure of airports in LEAP model.
SectorSubsectorEnd-UseDevice
AirportAEPassenger aircraft engineWide-body passenger aircraft engineJet fuel, sustainable aviation fuels (SAFs)
Narrow-body passenger aircraft engine
Regional aircraft engine
Cargo aircraft engineWide-body cargo aircraft engine
Narrow-body cargo aircraft engine
APU Wide-body aircraft APU
Narrow-body aircraft APU
GSE Air startGasoline, diesel, electricity, hybrid
Aircraft tractor
Baggage tractor
Belt loader
Cabin service truck
Cargo loader
Catering truck
Fuel truck
GPU
Hydrant truck
Lavatory truck
Service truck
GAV BusDiesel, electricity, hybrid
Private carGasoline, diesel, electricity, hybrid
TaxiGasoline, electricity, hybrid
Table 3. Passenger aircraft fleet structure settings.
Year2023202520302035
Average seating rate79.81%83.90%85.50%86.50%
Aircraft type ratioWide-body aircraft400 seat class0.45%0.45%0.45%0.44%
250 seat class14.31%14.78%15.82%16.63%
350 seat class4.98%5.04%5.14%5.14%
Narrow-bodied aircraft120 seat class7.43%6.37%4.29%2.83%
160 seat class58.18%57.92%56.56%54.25%
200 seat class12.38%12.69%13.35%13.78%
Branch line90 seat class2.27%2.75%4.41%6.93%
Table 4. Cargo aircraft fleet structure settings.
Year2023202520302035
Average load rate60%
Aircraft typeLarge wide-body aircraft (100 tons)34.49%32.32%28.87%25.63%
Medium wide-body aircraft (60 tons)12.97%13.07%13.18%13.22%
Narrow-body aircraft (30 tons)52.54%54.61%57.95%61.15%
Table 5. Airport emission reduction measures and subjects responsible for emission reduction.
Emission Reduction AngleMeasure NameSerial NumberEmission SourceSubjects Responsible for Emission Reduction
Operation ImprovementOptimization of arrival and departure procedures m 1 AEAir traffic management bureaus
Ground movement optimization m 2 AEAirports
Single-engine taxi m 3 AEAirports
Structure optimizationAPU replacement m 4 APUAirports
Increase the proportion of passengers arriving by public transit * m 5 GAV
Technological progressImprove energy efficiency m 6 AEAirlines
m 7 GSEAirports
m 8 GAVNon-airport stakeholders
Alternative fuelUse SAFs m 9 AE; APUAirlines
Electrify or use alternative fuels m 10 GSEAirports
Electrify or use alternative fuels m 11 GAVNon-airport stakeholders
* Public transit arrivals include both airport bus arrivals and subway arrivals.
Table 6. Parameter settings for different socioeconomic development intensities.
Key Socioeconomic Factors2023–20252026–20302031–2035
SlowRapidSlowRapidSlowRapid
x3Urbanization rate (%)87.588.189.690.090.091.6
x2Growth rate of permanent population (%)1.42.41.21.80.40.8
x1Growth rate of GDP (%)5.665.25.64.24.6
x6Growth rate of gross tertiary industry (%)6.36.65.35.64.34.6
Table 7. Revised parameter settings for different epidemic impact degrees.
Air Passenger Market
Influence degreeParameters in rapid recovery stage ( ϕ y )Parameters in stable development stage ( Ω )
202320242025–2035
Low75%103%93%
Big90%
Air Cargo Market
Influence degreeStable development stage parameters ( Ω )
2023–2035
Low95%
Big93%
Table 8. Parameter settings of emission reduction measures under different scenarios.
Emission Reduction MeasuresParameterEmission SourceBASEPSLCS
2023–2035202520302035202520302035
Operation
improvement
Arrival and departure procedures optimize permeabilityAE-20%100%100%40%100%100%
Ground movement optimization permeabilityAE-50%10%20%60%20%30%
Single-engine taxi permeabilityAE-58%68%73%63%73%78%
Structure
optimization
APU replacement rateAPU86%90%95%100%95%100%100%
Increase the proportion of passengers arriving by public transitProportion of airport bus arrivalsGAV26%28%30%32%30%32%34%
Proportion of subway arrivals-30%35%45%50%40%50%55%
Technological progressEnergy efficiency improvement rateAE-1%2%
GSE-2%4%
GAV-2%4%
Alternative fuelShare of SAFsAE, APU-1.8%6.4%12.8%2%8.4%16.8%
Electrify or use alternative fuelsConventional fuelGSE76%65%57%50%55%47%40%
HybridGSE8%10%13%15%15%18%20%
ElectricGSE16%25%30%35%30%35%40%
Electrify or use alternative fuelsConventional fuelGAV95%72%59%52%65%52%45%
HybridGAV1%10%13%15%15%18%20%
ElectricGAV4%18%28%33%20%30%35%
Table 9. Scenario combinations.
Socioeconomic–Epidemic
Scenario
Emission Reduction ScenarioUncertain Scenario of Airport Development
S-LBASS-L-BAS
EPSS-L-EPS
LCSS-L-LCS
S-BBASS-B-BAS
EPSS-B-EPS
LCSS-B-LCS
R-LBASR-L-BAS
EPSR-L-EPS
LCSR-L-LCS
R-BBASR-B-BAS
EPSR-B-EPS
LCSR-B-LCS
Disclaimer/Publisher’s Note: The statements, opinions and data contained in all publications are solely those of the individual author(s) and contributor(s) and not of MDPI and/or the editor(s). MDPI and/or the editor(s) disclaim responsibility for any injury to people or property resulting from any ideas, methods, instructions or products referred to in the content.

