Article

Investigating the Effects of Environmental Regulation on Industrial Ecological Efficiency in China Using a Panel Smooth Transition Regression Model

1
College of Tourism, Xinyang Normal University, Xinyang 464000, China
2
College of Geographical Science, Shanxi Normal University, Taiyuan 030031, China
*
Author to whom correspondence should be addressed.
Sustainability 2023, 15(21), 15408; https://doi.org/10.3390/su152115408
Submission received: 15 August 2023 / Revised: 15 October 2023 / Accepted: 23 October 2023 / Published: 29 October 2023

Abstract

:
Environmental regulation (ER) is a crucial tool used by governments to intervene in the environmental practices of enterprises, and it is recognized as a significant avenue to impact industrial ecological efficiency (IEE). This study uses the superefficiency SBM model to determine provincial IEE scores. Then, a panel smooth transition regression (PSTR) model is used to explore the effects of ER on IEE transition at different stages of economic growth. The main findings are as follows: Firstly, China’s IEE showed an overall upward trend, with small increments over the past two decades. Regions with higher IEE were mainly located in the east, while those with lower IEE were mostly in the less economically developed west. Secondly, the PSTR model revealed that ER had varying impacts on IEE at different stages of economic growth. ER positively influenced IEE in the early stages of economic growth. However, after surpassing the threshold of economic growth, ER began to contribute to reducing IEE scores. In addition to these findings, this study proposes a series of policy recommendations to strengthen IEE.

1. Introduction

China’s economy is currently at a crucial turning point, transitioning from a phase of rapid growth to one that emphasizes high-quality development. However, many industries still heavily rely on energy and contribute to pollution, emitting excessive emissions that are detrimental to the environment. These challenges pose urgent issues related to environmental pollution and the depletion of resources. China’s industrial energy consumption and industrial solid waste disposed in 2020 were 3.08 and 4.49 times higher than in 2001, respectively [1]. It makes it difficult to achieve a more environmentally friendly socio-economic framework and exacerbates the conflict between achieving economic growth and building an ecological civilization. Consequently, the idea of industrial ecological efficiency (IEE) was introduced to measure the interactions between industrial economics, resource management, and environmental concerns. Since 2000, China has experienced a gradual but modest improvement in its IEE, yet the overall level remains subpar, compounded by notable regional disparities [2,3]. Consequently, there is heightened scholarly interest in strategies to bolster IEE and foster better synchronization between China’s industrial growth, resource utilization, and environmental challenges. These endeavors seek to facilitate an eco-friendly transformation and high-quality advancement within China’s industrial sector.
In order to tackle corporate environmental pollution and improve IEE, it is crucial for the government to intervene through environmental regulation (ER). When economic growth is prioritized in environmental performance evaluations, local governments may be incentivized to relax regulations on polluting firms in pursuit of GDP-centric incentives, which could lower environmental standards to attract highly polluting and energy-intensive companies. During environmental impact assessments and law enforcement, various phenomena can occur, including human interference, temporary policies restricting environmental oversight and enforcement, and certain companies designating themselves as “key protected entities” to evade environmental scrutiny. When assessment objectives prioritize environmental preservation, obligatory metrics such as energy efficiency, air and water quality, primary pollutant emissions, ecological protection zone establishment, and forest coverage are integral criteria for gauging environmental task fulfillment. These indicators are incorporated into the performance evaluations of local governments and their leadership. This heightened emphasis on environmental concerns induces local governments to exercise greater caution when addressing corporate environmental issues. In certain instances, this caution results in a uniform approach to environmental pollution control that does not consider local economic development status and resource endowments. Such a standardized approach often comes at the expense of economic growth and societal well-being. Therefore, it is essential to investigate the influence of ER on IEE and to establish the intensity of these regulations judiciously, considering local development realities.
The Chinese government has a system of overseeing the environment that is centralized and hierarchical. This means that higher-level government entities set performance criteria and assessment standards, while lower-level governments and departments carry out environmental law enforcement and administration. On the one hand, China has put in place environmental regulatory policies to protect the ecological environment, as seen in Figure 1. Since the reform and opening-up period, fundamental mechanisms like the environmental protection target responsibility system (1989) and the pollution discharge permit system (1989) have greatly improved environmental quality. In the 1990s, ecological governance followed the guiding principle of sustainable development, leading to further improvements in environmental legislation. Subsequently, systems like total pollutant emissions control (1998), environmental accountability (2005), and the ecological red line (2011) were introduced to meet evolving needs. On the other side, local governments enact targeted control measures aligned with this set of regulatory objectives.
In this scenario, establishing environmental regulatory targets influences China’s IEE trajectory. Moreover, the strength of local ER policies is a direct factor of the regional disparities of IEE. Investigating the influence and scope of ER on China’s IEE is paramount to enhancing the efficacy of industrial ecological governance and uplifting the overall quality of the environmental landscape.
The subsequent sections are organized as follows. Section 2 gives a review of the literature, while Section 3 presents an overview of the methods and data sources used. Section 4 showcases provincial IEE scores and examines their spatial-temporal characteristics, and it discusses the nonlinear correlation between ER and IEE. Section 5 concludes this paper and highlights policy implications.

2. Literature Review

IEE strives to achieve heightened industrial economic output while concurrently reducing resource consumption and minimizing adverse environmental impacts. Current studies on IEE primarily coalesce around the following three key dimensions.
To begin with, researchers have endeavored to measure IEE using various methods. The data envelopment analysis (DEA) stands out as a technique that combines both desirable and undesirable production impacts into a singular efficiency index, making it popular among scholars. As an illustration, Oggioni et al. employed the DEA method to provide an eco-efficiency assessment for 21 cement industry prototypes across multiple countries. Their results demonstrated that nations with cement industries investing in advanced kiln technologies and incorporating alternative fuels and raw materials in production exhibit eco-efficiency [4]. Similarly, Ezici et al. utilized an integrated approach combining time series analysis, multiregional input–output (MRIO), and DEA to assess the eco-efficiency of manufacturing industries in the United States. They uncovered a prolonged period of relatively low eco-efficiency despite the industrial development [5]. Huang et al. devised a modified DEA model to appraise Chinese provincial IEE from 2001 to 2014 [6]. The outcomes revealed notably higher industrial eco-efficiency levels in the eastern provinces of China. Moreover, alternative methods such as the ratio method [7,8], analytic hierarchy process [9], life cycle cost analysis [10,11,12], material flow analysis [13], ecological footprint analysis [14], and stochastic frontier analysis [15] have also been leveraged by scholars to evaluate and dissect IEE. Nonetheless, it becomes evident that the DEA retains certain advantages in this domain. However, traditional DEA approaches have yet to effectively tackle challenges associated with input–output relaxation, angles, and the consideration of undesirable outputs like environmental impacts.
When it comes to assessing IEE using the DEA model, selecting the appropriate input–output indicators is crucial as it can greatly affect the calculation outcomes. Different choices of these indicators can result in varying conclusions. For example, Ren et al. observed an ascending trend in overall IEE within the Yangtze River Economic Belt, with efficiency levels incrementally rising downstream [16]. In contrast, Zhao et al. reached a contradictory conclusion [17]. Previous studies have mostly used resource consumption (such as electricity, energy, land, and water), capital, and labor as primary input indicators, with the industrial output value as the main output measure [18,19,20]. However, the principal disparity among these studies lies in the definition of environmental indicators. Some studies, like that of Song et al., incorporated environmental input indicators like wastewater discharge, sulfur oxide emissions, and smoke and dust emissions to analyze spatiotemporal changes in IEE within Yellow River Basin cities [21]. Meanwhile, Stergiou and Kounetas et al. utilized environmental indicators, including carbon dioxide, methane, nitrous oxide, sulfur oxides, carbon monoxides, nonmetal volatile organic compounds, and ammonia, as unexpected output indicators in assessing ecological efficiency across 27 European manufacturing industries [22]. It is important to recognize that pollutants are often linked to resource consumption, so including them as unexpected outputs can improve the accuracy and usefulness of IEE evaluations.
Based on the different evaluation methods and indicator choices mentioned above, scholars have calculated regional IEE and further explored its influencing factors. IEE is affected by various influences such as technological advancements [23,24], foreign direct investments [25,26], industrial composition [27,28], industrial accumulation [29,30], and urbanization [31]. These are among the most widely discussed factors, although previous research produced divergent findings due to differences in the studies’ scopes and the selections of indicator data. For instance, technological innovation has had varying outcomes. The introduction of new products and processes resulting from technological progress has increased the utilization of natural resources, boosted economic growth, and improved regional IEE [22]. However, in some cases, a company’s focus on research and development for production technology innovation over green technology innovation may lead to increased pollution emissions due to scale expansion, offsetting the enhancement of ecological efficiency. According to Zhang et al., a higher level of foreign direct investment may hinder the improvement of IEE on a national level [25]. In contrast, Guo et al. found a positive correlation between the intensity of foreign direct investment and the enhancement of IEE in the central part of China [26].
Compared to the previously mentioned determinants, the relationship between ER and IEE has been a topic of much debate. While some studies advocate that ER can lead to improvements in IEE [32,33,34,35], a subset of scholars posits that an overly stringent regulatory environment might amplify cost burdens on enterprises, potentially undermining their ecological efficiency [36,37,38]. Nevertheless, Xu and Zhang confirmed that ER wields no substantial impact on IEE [39].
There is uncertainty regarding the correlation between ER and IEE. Environmental regulatory policies can increase production costs for businesses, but they can also lead to increased investment in technology and productivity. These two contrasting effects, the positive innovation compensation effect and the negative cost offset effect, affect how ER and IEE interact. Appropriate ER can increase the costs associated with pollution control for businesses. However, these regulations can also encourage enterprises to seek innovation in eco-friendly technologies to stay competitive. This approach can improve production efficiency, generate profits, and enhance regional ecological conditions, ultimately bolstering IEE. On the other hand, while ER can have ecological benefits, it can also lead to substantial pollution control costs for businesses. These costs can impact productivity, reduce profits, and impede the advancement of IEE. This complex interplay highlights the multifaceted dynamics between regulatory frameworks and the pursuit of ecological efficiency in the industrial realm.
Furthermore, it is essential to acknowledge that many scholars recognize the critical role of economic growth in shaping IEE [2,40,41]. Essentially, any economic activity is related to economic growth. The desirable output of IEE forms an integral component of economic development, representing a very endogenous variable that may not be ideally suited as an explanatory factor for IEE. In this context, economic growth emerges as a more suitable parameter for gauging regional disparities. For instance, Yu et al. computed the ecological efficiency of interprovincial industries in China, revealing a concentration of provinces with elevated IEE in the prosperous eastern region, contrasted with those exhibiting lower IEE in the less developed western area [42]. Similarly, Liu et al. observed that the IEE in the midstream region of the Yangtze River Basin exceeded that in both the upstream and downstream areas [43]. Zhao et al. noted a need for more significant disparity in IEE among cities during the initial stages of economic development in the Yangtze River Basin. However, as economic growth accelerated, the gap in IEE among cities widened. With the structural transformation and upgrading of the economy, closer intercity economic interdependencies and a more rational allocation of resources led to a gradual convergence in IEE disparities [17]. Hence, this study posits that the correlation between economic development and IEE can serve as a reliable indicator for delineating regional inequality. This proposition is underpinned by the direct impact of variances in regional economic growth on the distribution of technological investments, foreign capital influx, industrial concentration, and the selection and intensity of environmental regulatory strategies, thereby indirectly influencing the IEE.
There can be significant differences in the effects of ER on IEE due to varying economic growth stages and socio-economic situations in different regions [44]. Therefore, this paper analyzes IEE’s regional disparities by taking into account the economic growth level of each area, which will serve as a threshold variable. And we posit the following hypothesis.
Hypothesis 1:
Economic growth is an internal mechanism that impacts the relationship between ER and IEE, with dynamic thresholds and gradual changes.
To achieve this, this paper uses the panel smooth transition regulation (PSTR) model to examine the threshold impact of regional economic growth on the interplay between ER and IEE. Additionally, relying solely on traditional DEA models may cause inaccuracies when calculating IEE, which could ultimately affect decision making and solution selection. To resolve this issue, we decided to use the advanced superefficiency SBM model that incorporates undesirable outputs, as opposed to the traditional DEA model. Overall, this analysis is theoretical and practical through the comprehensive evaluation of IEE in China. Based on regional disparities indicated by economic development, regional disparities are characterized by economic growth, thereby pinpointing distinct trajectories for enhancing IEE in varying locales. Ultimately, these findings will contribute to pursuing high-quality economic development and facilitating a transition toward ecologically sustainable industrial practices.

3. Methods and Data

3.1. Methods

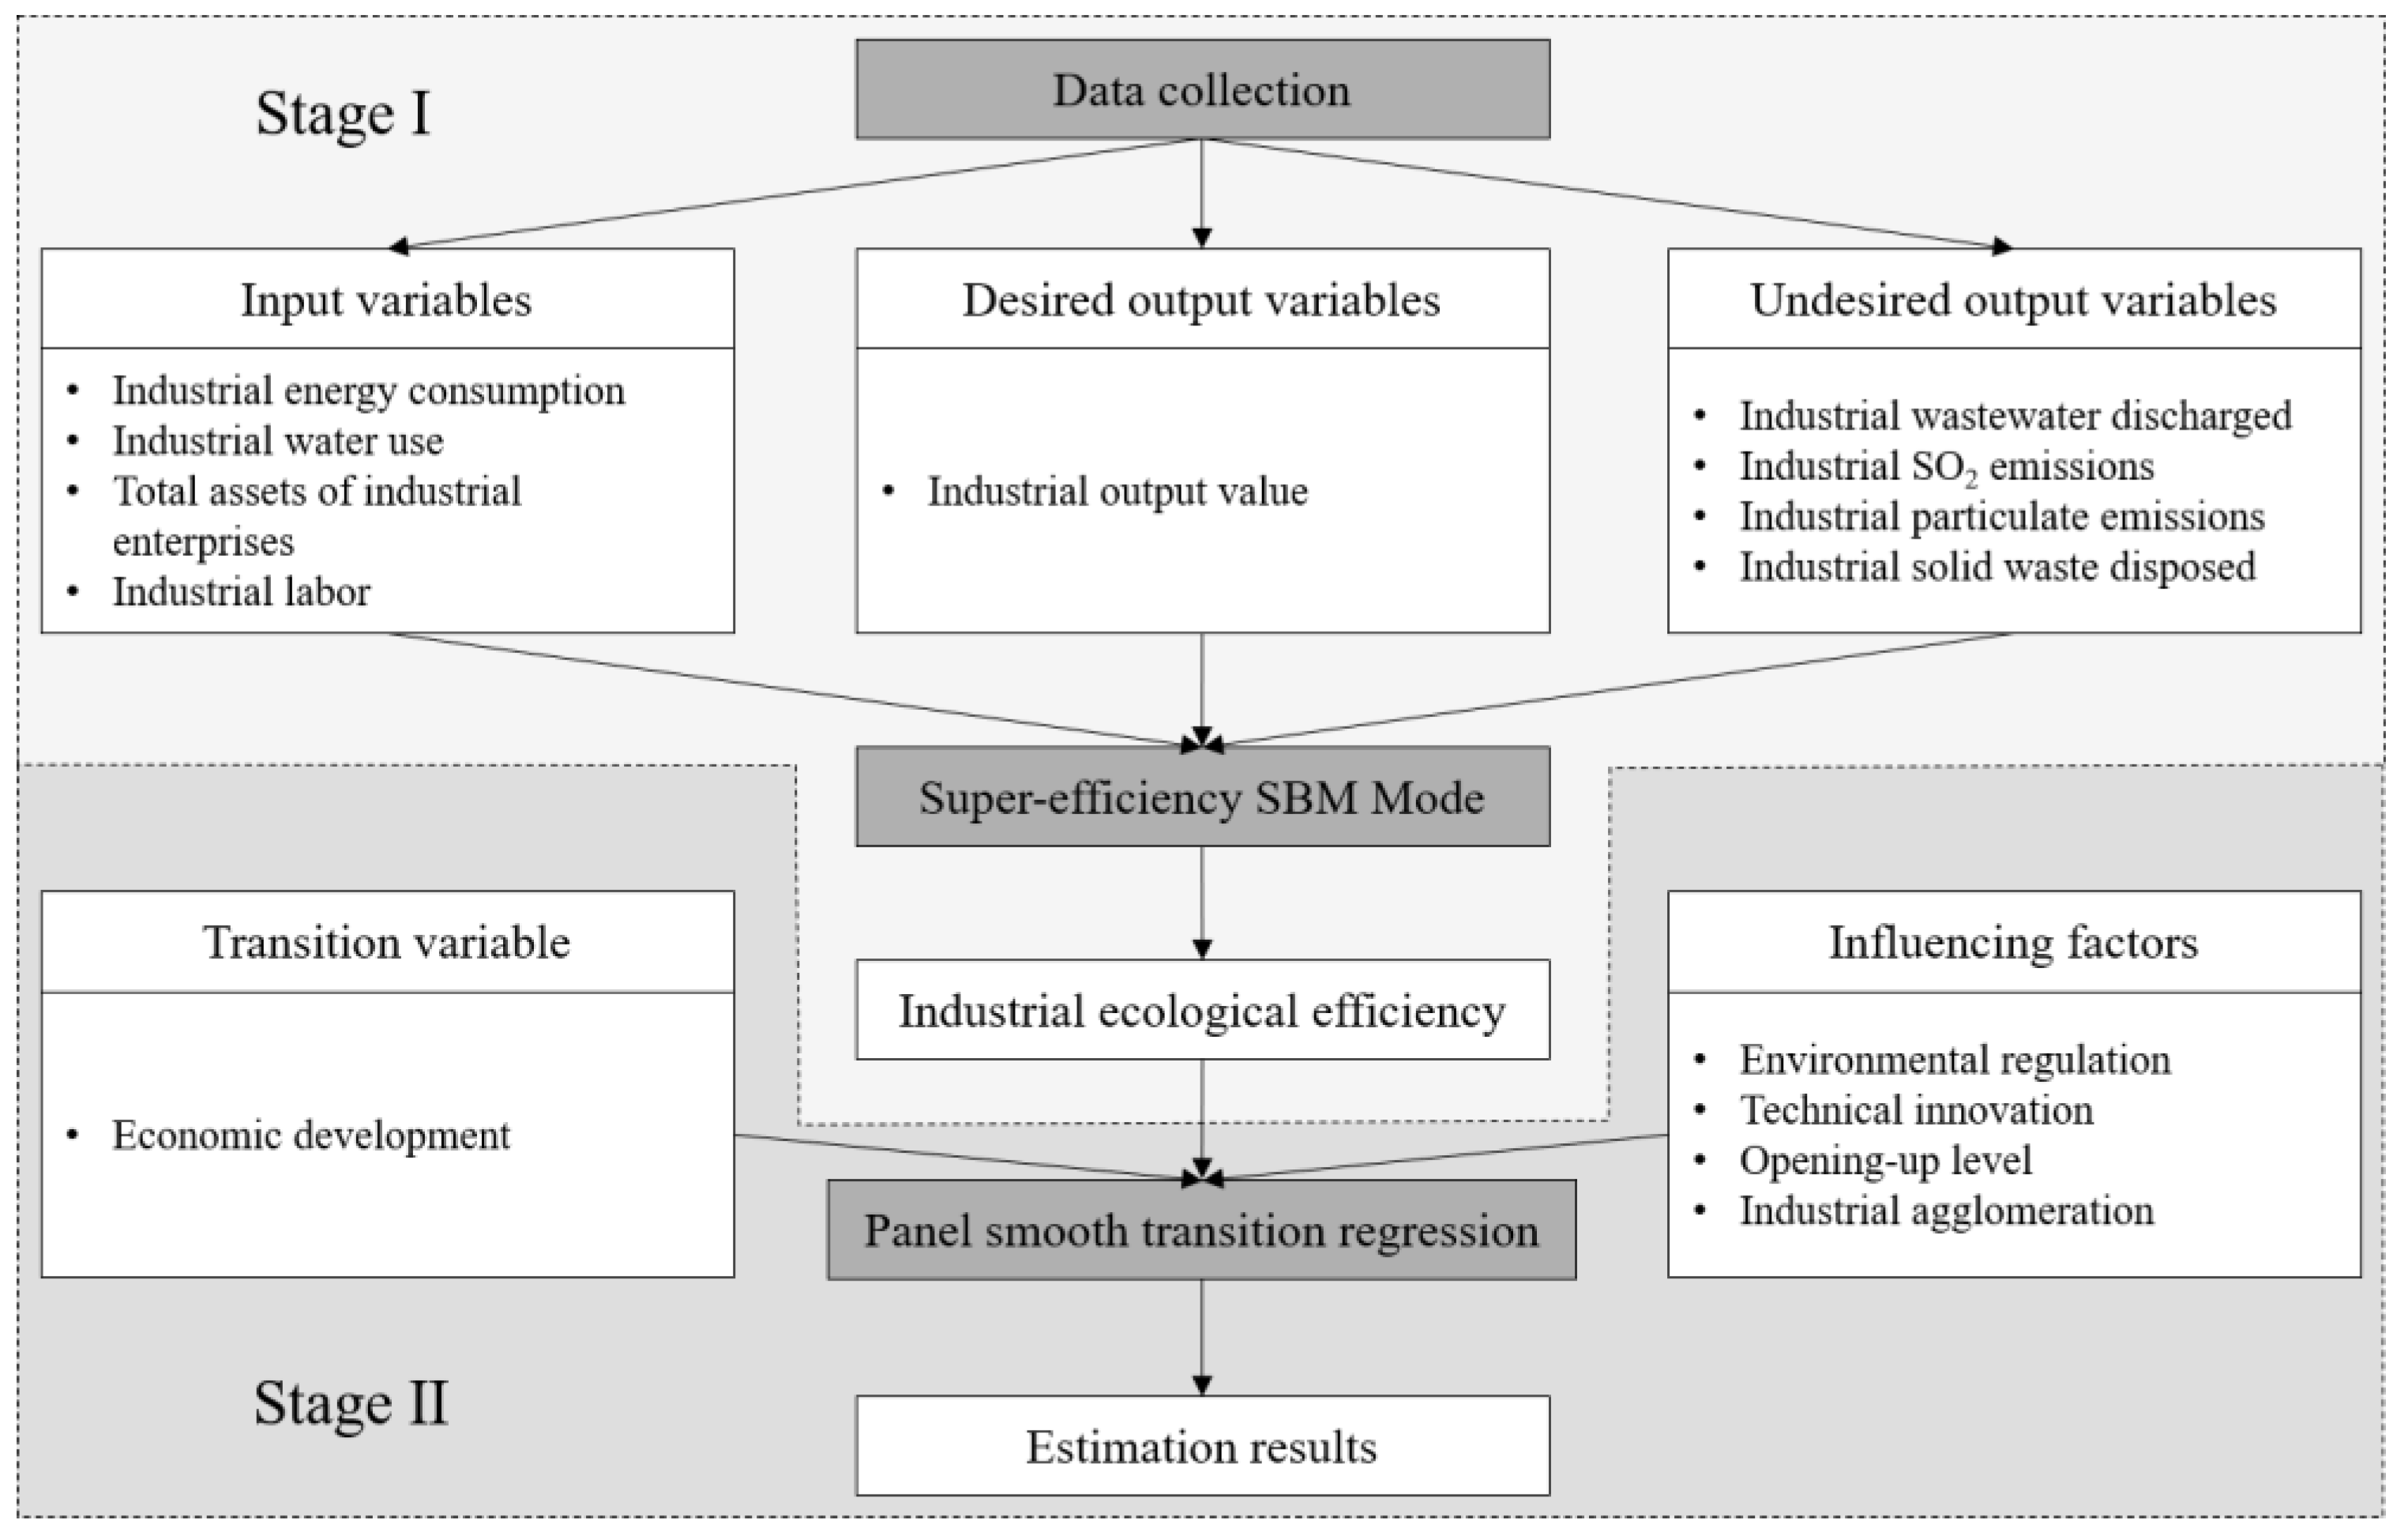
In this study, we used a two-stage approach. First, we used a superefficient SBM model that takes into account undesirable outputs to determine the provincial IEE scores and examine their spatiotemporal characteristics. Then, we conducted a PSTR analysis to study the unique features of how ER affects IEE. Figure 2 provides an overview of the methodology used in this study.

3.1.1. Superefficiency SBM Model Incorporating Undesirable Outputs

Pioneered by Charnes et al., the data envelopment analysis (DEA) model is a robust statistical method used to assess the relative efficiency of a set of comparable decision-making units (DMUs). Rooted in the foundational principle of DEA, a DMU’s efficiency is ascertained by its output-to-input ratio. The collection of the most proficient DMUs forms the efficient frontier, while the efficiency scores of the other DMUs gauge their relative efficiency.
This study adopts the superefficiency SBM model, which incorporates undesirable outputs within the SBM-DEA framework developed by Tone [45], to gauge the IEE in China. The superefficiency SBM model not only accounts for the influence of undesirable output on IEE but also offers a more accurate portrayal of China’s IEE assessments. Moreover, this model addresses a limitation of the traditional DEA model, where numerous efficiency values are constrained to 1, by enabling efficiency values above 1 for decision units, thereby resolving issues related to relaxation variables.
Building upon this premise, we can formulate the superefficiency SBM model incorporating undesirable outputs as follows.
ρ = min 1 + 1 m i = 1 m s i x ik 1 1 q d + q ud r = 1 q d s r d y rk d + t = 1 q ud s t ud y tk ud
s.t.
x ik j = 1 , j k n x ij λ j s i ;
y rk d j = 1 , j k n y rj d λ j + s r d ;
y tk ud j = 1 , j k n y tj ud λ j s t ud ;
1 1 q d + q ud r = 1 q d s r d y rk d + t = 1 q ud s t ud y tk ud > 0
λ , s , s d , s ud 0
i = 1 , 2 , 3 , , m ;
j = 1 , 2 , 3 , , n j k ;
r = 1 , 2 , 3 , , q d ;
t = 1 , 2 , 3 , , q ud
In this context, n, m, qd, and qud express the number of DMUs, inputs, desirable outputs, and undesirable outputs, respectively, while i, r, and t represent the respective types of inputs, desirable outputs, and undesirable outputs. The index j is used to identify DMUs, with xij indicating input i for DMUj and yrj and ytj representing desirable output r and undesirable output t for DMUj, respectively. λj is a vector for projecting the DMUs. The vector sd denotes the deficit in desirable outputs, and the vectors s and sud signify surpluses in inputs and undesirable outputs, respectively.
The parameter ρ signifies the value of IEE. When ρ < 1, a DMU’s IEE is suboptimal, and it can attain efficiency by adjusting inputs or outputs. Conversely, when ρ ≥ 1, a DMU’s IEE is optimal.

3.1.2. The Panel Smooth Transition Regression Model

To elucidate the potential nonlinear association between ER and IEE, we employed the PSTR model, a well-established econometric method for estimating nonlinear relationships, as introduced by González et al. [46]. The theoretical formulation of the PSTR model is presented as follows.
IEE it = μ i + α IEE it - 1 + β 0 Ln ( ER ) it + j = 1 m β j Ln ( ER ) it g j q it j , γ , c + θ Ln ( X ) it + ε it
In this context, i and t denote the cross-sectional and time dimensions of the panel dataset. The dependent variable is IEE, Ln(ER) signifies the natural logarithm of environmental regulation, and Ln(X) represents the natural logarithm of control variables. The term μi represents the vector of individual fixed effects, and εit denotes the error term. The parameters α, β0, and βj (j = 1,2, …, m) correspond to the parameter vectors of the linear and nonlinear models, respectively. The transition function, denoted as gj(qjit, γj, cj) (j = 1, 2, …, m), is contingent upon the transition variable qjit, the transition parameter γj, and the threshold parameter cj. This continuous and normalized transition function, adhering to values between 0 and 1, facilitates transitions between different regimes within the system. Following González et al. [46], we assume the transition function follows an exponential form.
g j ( q it j , γ j , c j ) = 1 + exp γ j j = 1 m q it j c j 1 , c 1 c 2 c n , γ > 0
Here, γj represents the smoothness parameter, characterizing the transition speed between different regimes, and cj (j = 1,2, …, m) is an m-dimensional vector denoting the threshold variables’ locations.

3.2. Variable Selection

3.2.1. Explained Variable

The explained variable under investigation in this research is IEE. Table 1 provides an overview of the indicator framework employed within the superefficiency SBM model to assess IEE. The selection of input indicators comprised four variables, industrial energy consumption, industrial water usage, industrial fixed assets, and industrial labor, while industrial output value was designated as the desirable output indicator, consistent with prevailing research practices. In light of data availability and practical considerations, the undesirable output indicators encompassed industrial wastewater discharge, industrial SO2 emissions, industrial smoke and dust emissions, and industrial solid waste disposed of.

3.2.2. Explanatory Variable

ER is a significant avenue through which the government can influence enterprises’ environmental pollution practices. It comprehensively gauges a government’s commitment to managing the environment. China primarily employs investment-based strategies for ER, complemented by taxation and fees. The allocation of resources towards pollution control exemplifies the government’s determination, offering insight into the emphasis on investment-centric ER. Given this premise, the present study employs industrial pollution control investments as a metric to quantify the extent of environmental regulatory efforts.

3.2.3. Transition Variable

Economic growth is the basis and premise of the improvement of IEE. ER exerts varying influences on IEE as economic growth progresses through different stages. In this investigation, economic growth is adopted as the explanatory factor within the PSTR model, with per capita GDP employed as the metric for gauging economic advancement. To mitigate the impact of pricing dynamics, the per capita GDP of each province was recalibrated to the constant price benchmark of the year 2000.

3.2.4. Control Variables

Drawing from the earlier analysis, this paper opts for technical innovation (TI), opening-up level (OP), and industrial agglomeration (IA) as the control variables underpinning the PSTR model. Research and development investment is employed to gauge the extent of local technological innovation, foreign direct investment acts as a metric for the degree of regional economic opening up, and location entropy serves to quantify the level of industrial clustering.
LE ij = IO ij GDP ij j = 1 n IO ij j = 1 n GDP ij
where i and j represent, respectively, time dimensions and cross-section of the panel. LE denotes location entropy. IO is industrial output value.

3.3. Data Sources

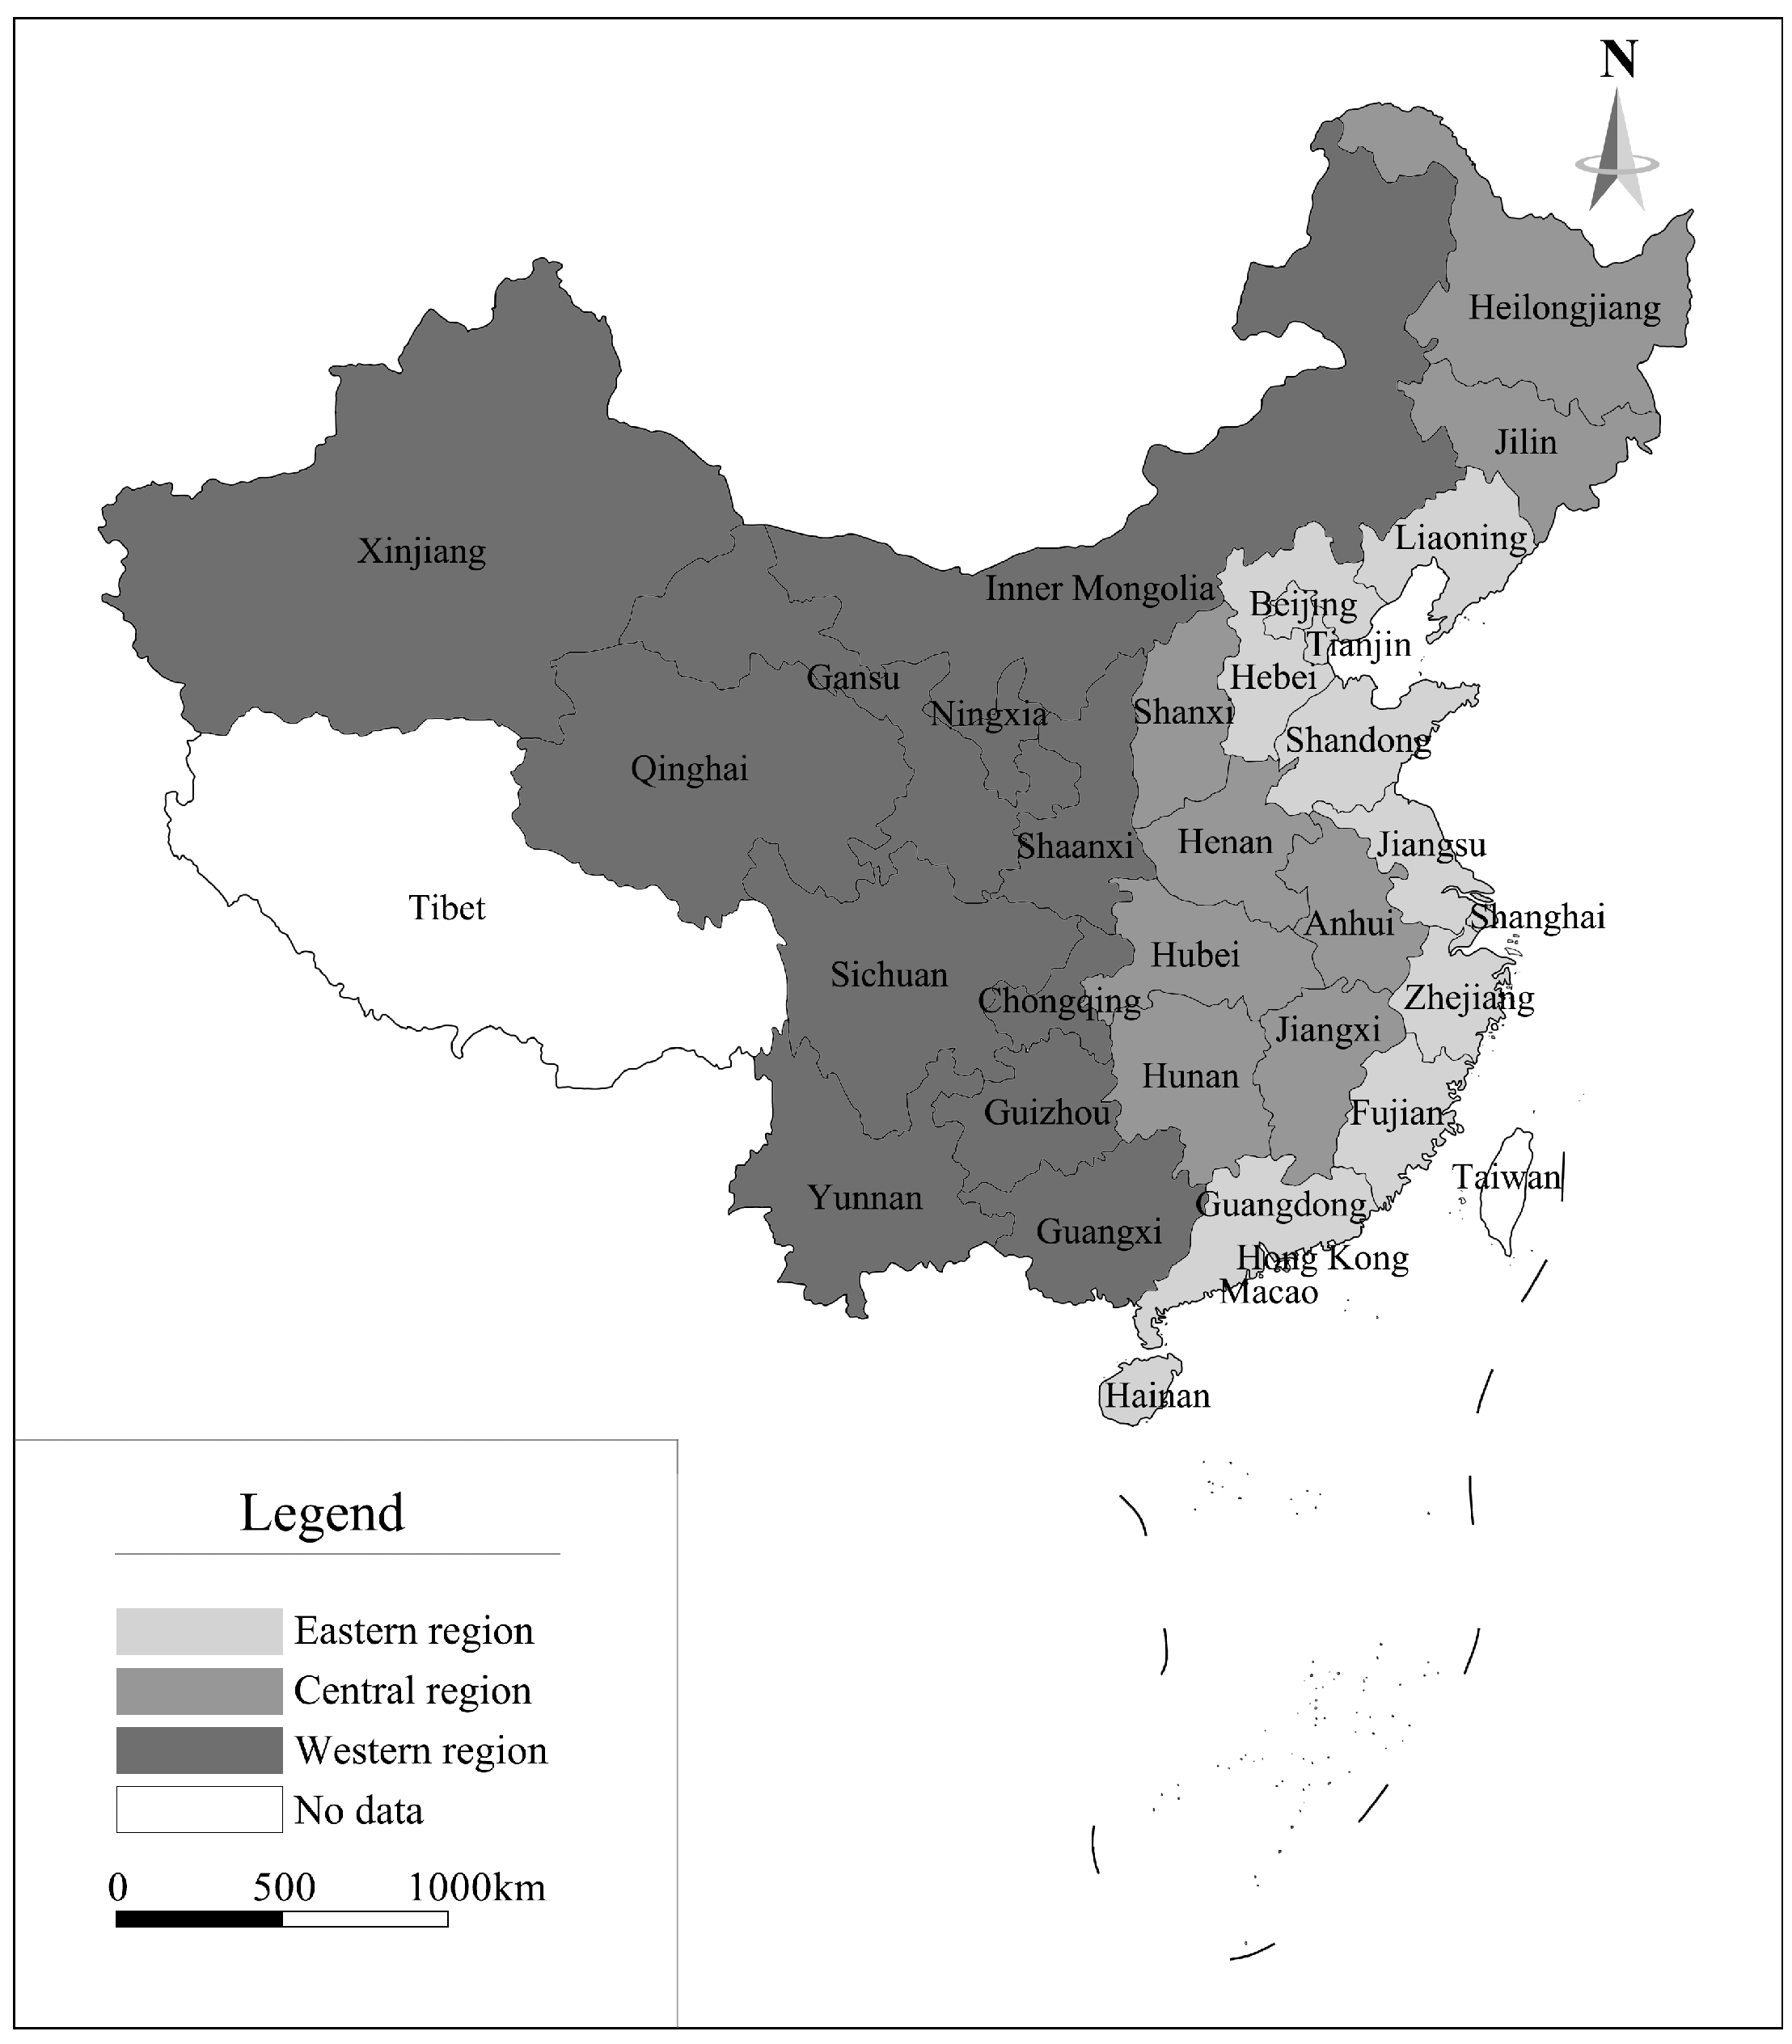
This research study examines 30 provinces, autonomous regions, and municipalities in China from 2001 to 2020, with the exception of Tibet, Hong Kong, Macao, and Taiwan. To account for China’s rapidly developing economy and society, the National Bureau of Statistics of the People’s Republic of China has divided the country into three distinct regions: eastern, central, and western. Figure 3 provides an overview of this regional division.
This study analyzed data from 30 regions in China over a period of two decades (2001–2020), encompassing provinces, autonomous areas, and municipalities. The data were primarily collected from China’s statistical systems and categorized into four main aspects: economic, social, resource-related, and environmental. In greater detail, the economic dataset encompassed metrics such as local industrial output, per capita GDP, industrial fixed assets, research and development expenditures, and foreign direct investment, all expressed in million CNY and adjusted for inflation using constant 2005 prices. This information was sourced from China’s industry statistical yearbooks (2002–2021) and regional statistical compendiums. Social data were sourced from China’s statistical yearbooks (2002–2021) and included parameters such as industrial labor and urbanization. This study used the count of personnel engaged in the secondary industry sector to substitute for the absence of explicit industrial workforce records within the Chinese statistical framework. Resource-related data, such as industrial water usage and energy consumption, were obtained from China’s industry statistical yearbooks (2002–2021) and China Energy Statistical Yearbooks (2002–2021). The environmental data encompassed values such as industrial wastewater discharged, industrial SO2 emissions, industrial particulate emissions (smoke and dust), and industrial solid waste disposed of, which were sourced from China’s environmental statistical yearbooks (2002–2021). Individual missing data were obtained through interpolation and extrapolation.

4. Results and Discussion

4.1. Industrial Ecological Efficiency

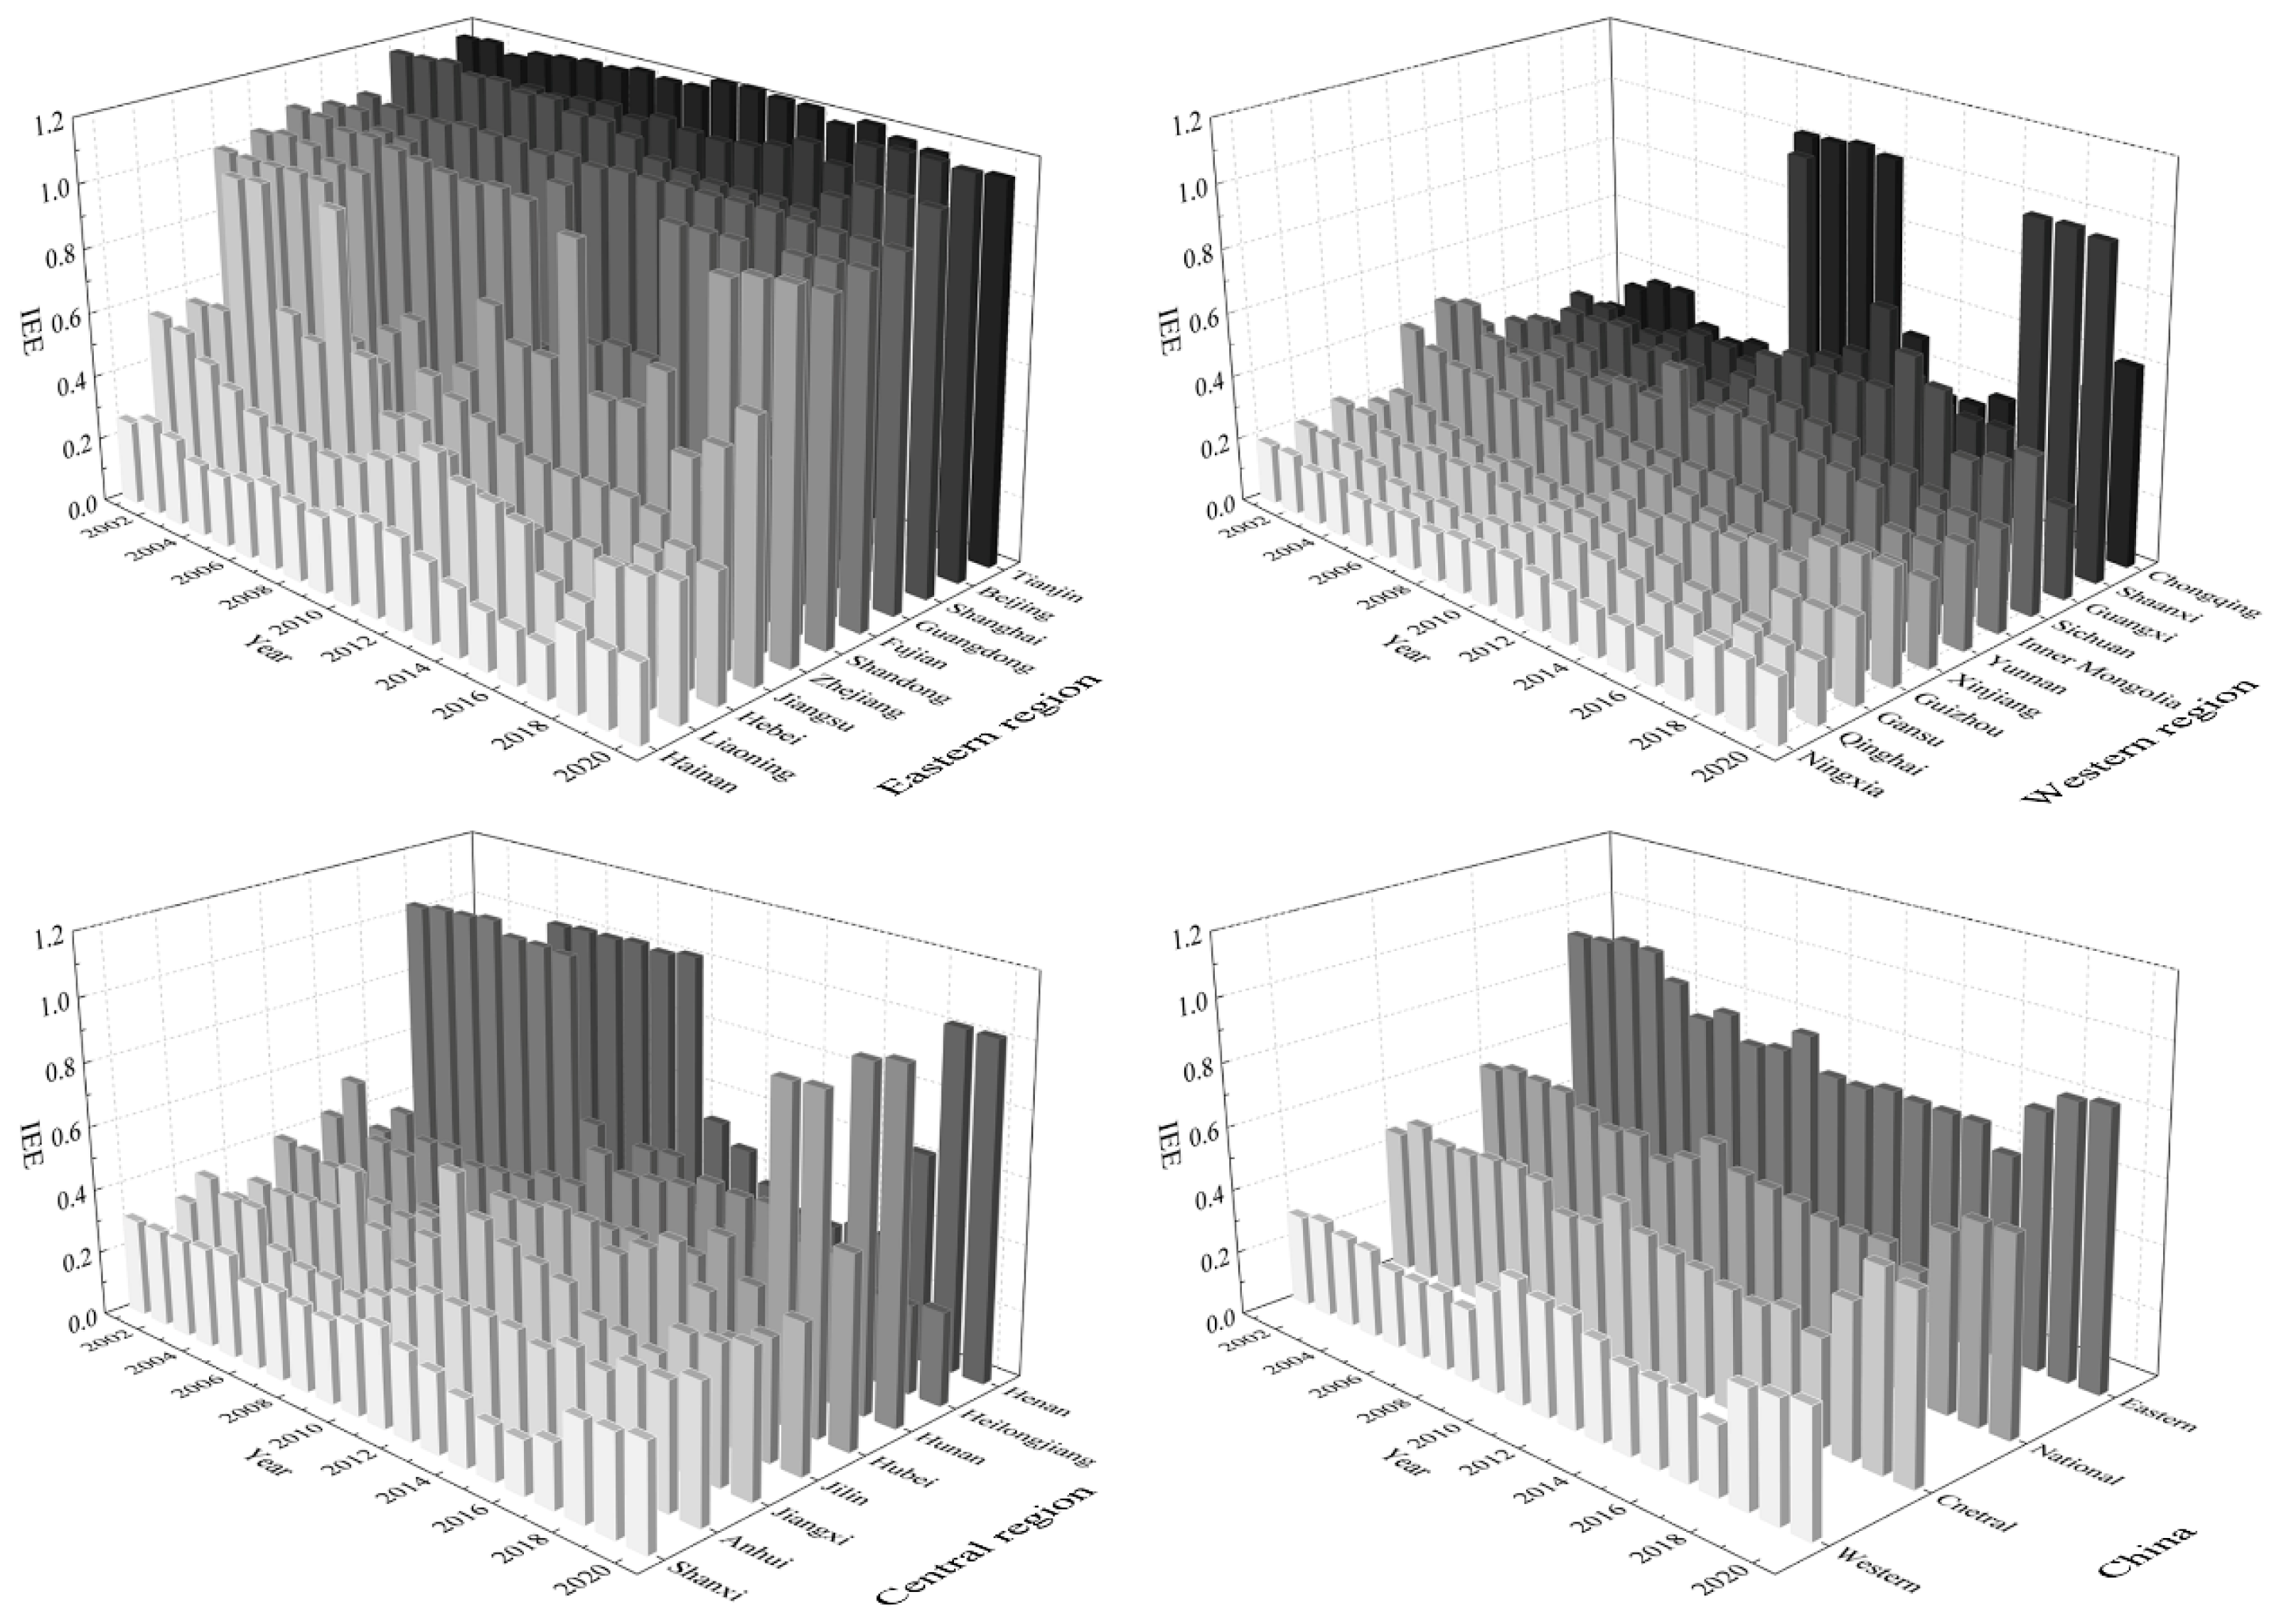
In this study, the superefficiency SBM model is used to assess the IEE of China’s 30 provinces, autonomous regions, and municipalities from 2001 to 2020. The evaluation is carried out using Matlab R2020a. The input and output indices are integrated into the model, and the results are presented in Figure 4.
During the span of 2001 to 2020, China’s IEE fluctuated within the bracket of 0.555 to 0.607 on a national scale. This implies that China’s IEE has not improved much over the last two decades, which aligns with previous research [41,42]. When examined more closely, China’s IEE follows a W-shaped pattern. From 2001 to 2008, China’s IEE decreased by 18.99% (with an average annual decrease of 0.015). This period marked a time of rapid economic growth in China, but it came at the cost of increased pollution emissions and resource consumption. Between 2001 and 2008, the overall IEE of China exhibited a descending trend, decreasing by 18.99% (with an average annual decrease of 0.015). This period marks a golden era in China’s economic growth, characterized by a transition emphasizing economic velocity at the expense of economic quality. Economic growth during this phase led to heightened resource consumption and elevated levels of pollution emissions. From 2009 to 2010, China saw a significant increase of 26.23% in its IEE (with an average annual increase of 0.059). This remarkable upturn in IEE during this phase can be attributed to the repercussions of the global financial crisis on the Chinese economy. The outbreak of the financial crisis led to a notable decline in industrial production across various regions, especially within sectors notorious for high pollution and energy consumption, such as the steel, energy, and chemical industries. This downturn was accompanied by reduced exports and domestic demand, prompting enterprises to curtail their production scale. In response, local governments implemented policies to eliminate backward production capacities, resulting in a remarkable enhancement of IEE. From 2011 to 2017, there was a persistent downtrend of 30.49% (with an average annual decrease of 0.025) in IEE. Following the financial crisis, the pursuit of rapid economic recovery took precedence for local governing bodies, disrupting the previous equilibrium between industrial advancement and ecological enhancement. This imbalance, exacerbated by technology lag and suboptimal management practices, led to an overarching decline in China’s IEE. However, from 2018 to 2020, there was a marked turnaround, with a surge of 53.82% (with an average annual increase of 0.071). This resurgence coincided with the transition from high-speed expansion to pursuing high-quality development in the societal economy. Empowered by the evaluation framework of urban ecological civilization and green advancement, local administrations began prioritizing ecological protection, amplifying resource utilization efficiency, reinforcing ER, and catalyzing the amelioration of IEE across diverse municipalities.
At a regional level, there are noticeable differences in IEE. The eastern region has the highest IEE, ranging from 0.625 to 0.934, indicating that the eastern region has managed to strike a better equilibrium between economic vitality and environmental considerations, manifesting a more rational input–output relationship. The central region follows with efficiency levels ranging from 0.328 to 0.601, while the western region has the lowest IEE, ranging from 0.212 to 0.384. This signifies that the western region is facing significant conflicts between economic expansion, resource utilization, and environmental concerns. After 2010, the eastern region has continued to improve in IEE, while the central and western regions have shown a declining trend due to industrial relocation. The more developed provinces in the eastern region have advanced in industrialization and have seen an improvement in environmental conditions. Meanwhile, local authorities are becoming less tolerant of environmentally harmful industries, forcing them to shut down or relocate. However, the central and western provinces continue to struggle with economic expansion, leading them to accept investment ventures of varying quality with limited alternatives. This situation hinders the advancement of IEE to some extent.
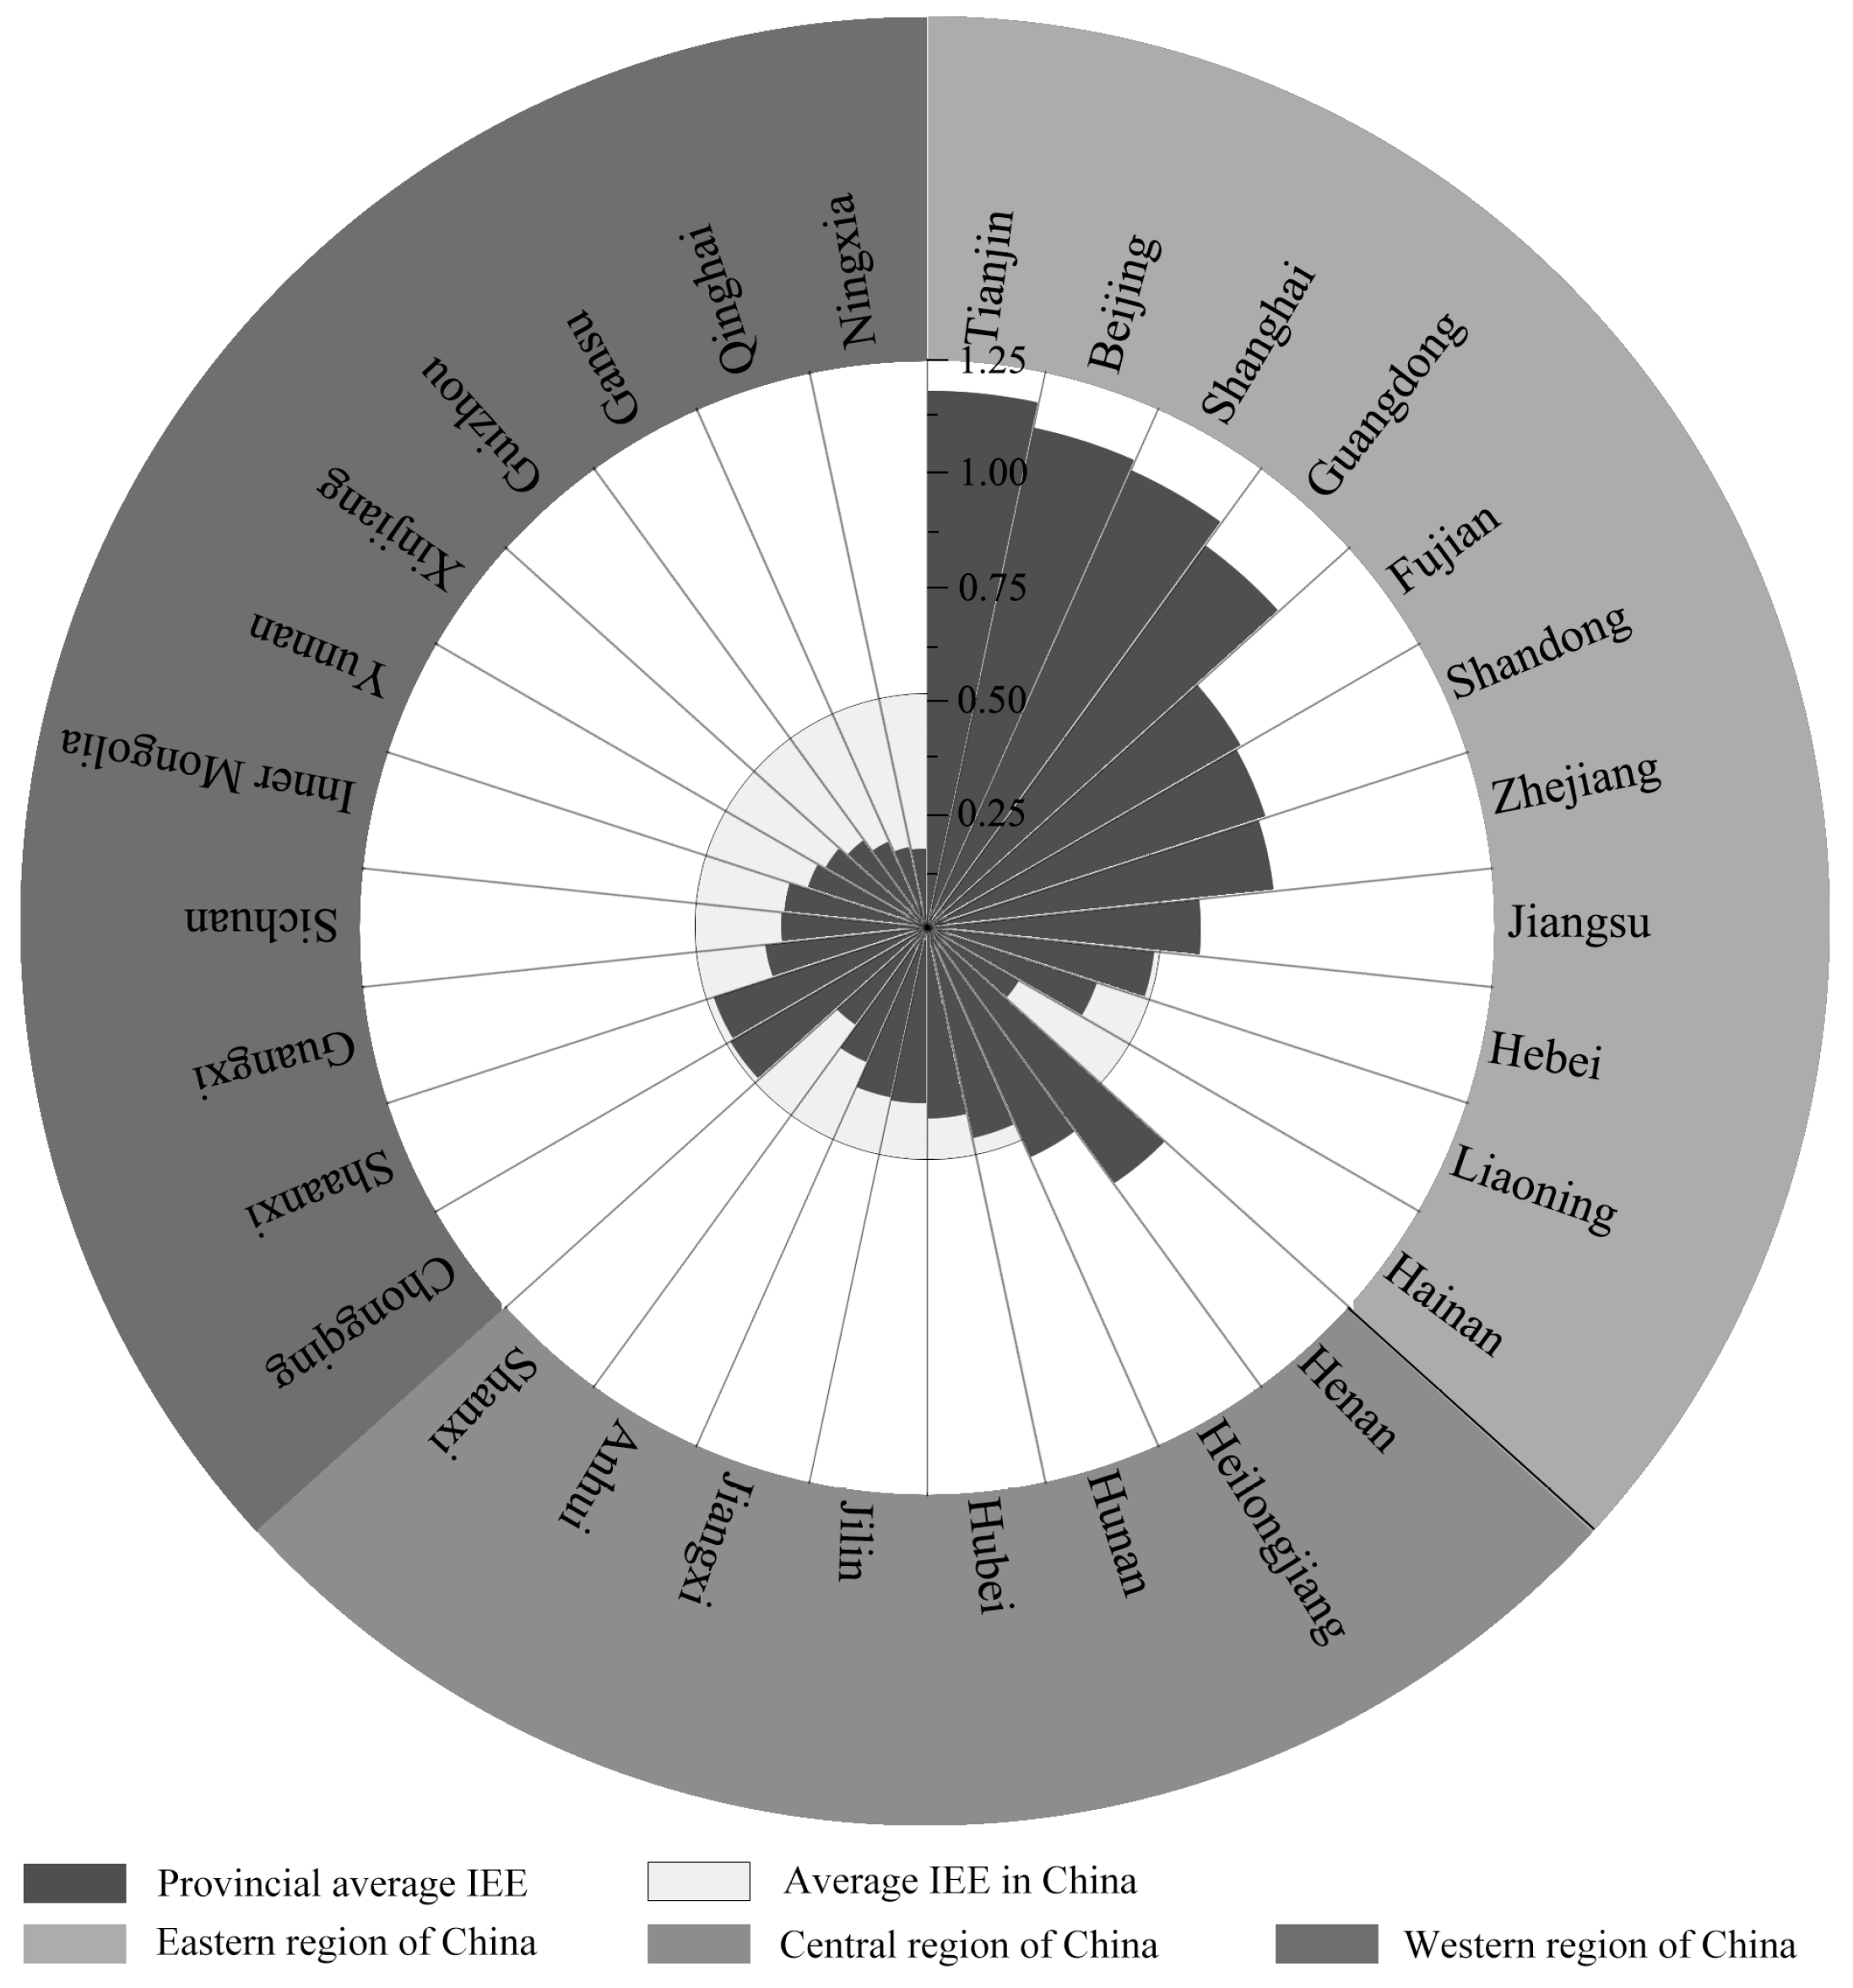
There is a significant difference in IEE among provinces in China, with the potential for improvement in most areas. As shown in Figure 5, Tianjin has the highest IEE score, averaging 1.179 from 2001 to 2020, followed closely by Beijing, Shanghai, and Guangdong with scores of 1.124, 1.107, and 1.046, respectively. Ten provinces exceed the national average IEE score, with all of them situated in the eastern region except for Henan and Heilongjiang in the central region. On the other hand, the five provinces with the lowest IEE scores are Hainan, Guizhou, Gansu, Qinghai, and Ningxia. Guizhou, Gansu, Qinghai, and Ningxia are located in the western region, where industrial and technological development is behind that of the central and eastern regions. Hainan, despite being in the eastern region, relies heavily on energy-intensive heavy industries, which make up over 60% of its industry. The substantial resource consumption and emissions associated with these industries have directly resulted in a comparatively diminished level of IEE within Hainan Province.
This result offers a more comprehensive portrayal of the pronounced interrelation between regional IEE, economic growth, and environmental mandates. Contrasting zones of robust economic and societal progress, industrial expansion within less developed sectors showcases extensive development characterized by elevated production inputs, suboptimal resource utilization efficiency, and pronounced environmental contamination. Consequently, enhancing IEE warrants formulating distinct strategies tailored to the diverse levels of regional economic growth.

4.2. Results of PSTR Models

As mentioned earlier, the influence of ER on IEE may vary depending on the economic growth stage of a given region. Therefore, this study employs the PSTR model for regression analysis, with the economic growth level as the threshold variable. This allows for the evaluation of the nonlinear relationship between ER and IEE. It is posited that this connection transitions seamlessly across distinct regimes.

4.2.1. The Panel Unit Root Test

To avoid the occurrence of spurious regression, this study first examines the data stationarity of each variable. We conducted unit root tests, including LLC and ADF-Fisher panel unit root tests. The outcomes in Table 2 affirm that all study variables exhibit zero-order integration.

4.2.2. Linearity Test

In the second step of employing the PSTR approach, we conduct linearity tests to examine the null hypothesis of linearity. The outcomes presented in Table 3 decisively reject the null hypothesis (r = 0) in favor of the alternative logistic panel smooth transition regression specification at a conventional significance level. This indicates that IEE is influenced by ER, TI, OP, and IA, depending on economic growth levels.

4.2.3. Remaining Nonlinearity Test

To understand the relationship between IEE and its underlying determinants, we need to determine the number of transition functions, referred to as “r”. As indicated in Table 4, the null hypothesis positing a “single threshold effect” for the model is rejected in the case of the eastern region model but accepted for the others. Consequently, it is inferred that the central and western region models exhibit a threshold effect amenable to estimation using the two-regime PSTR. Furthermore, the alternative hypothesis asserting “at least two threshold effects” in the eastern region model is tested against the null hypothesis positing “two threshold effects”. The results indicate an inability to reject the null hypothesis, signifying that the eastern region model features two threshold effects and can be analyzed using the three-regime PSTR models.

4.2.4. PSTR Estimation Results

Table 5 documents the results obtained from analyzing the impact coefficient of ER on IEE in a case where it undergoes a smooth transition with changes in economic growth. The PSTR regression model reveals distinct patterns regarding the independent variable, ER affecting IEE, in the eastern, central, and western regions. For instance, the estimated coefficient (β0) for ER in the first regimes of the eastern, central, and western regional models is statistically significant and positive, measuring 0.046, 0.063, and 0.007, respectively. In the second regime, coefficients represented as the sum of β0 and β1 are negative in the eastern and central region models, measuring −0.0166 and −0.046, respectively. However, the coefficient is identified as positive in the western region model (0.015). On the other hand, in the third regime of the eastern region model, the coefficient, expressed as the sum of β0, β1, and β2, is negative and surpasses the coefficient in the second regime (−0.125).
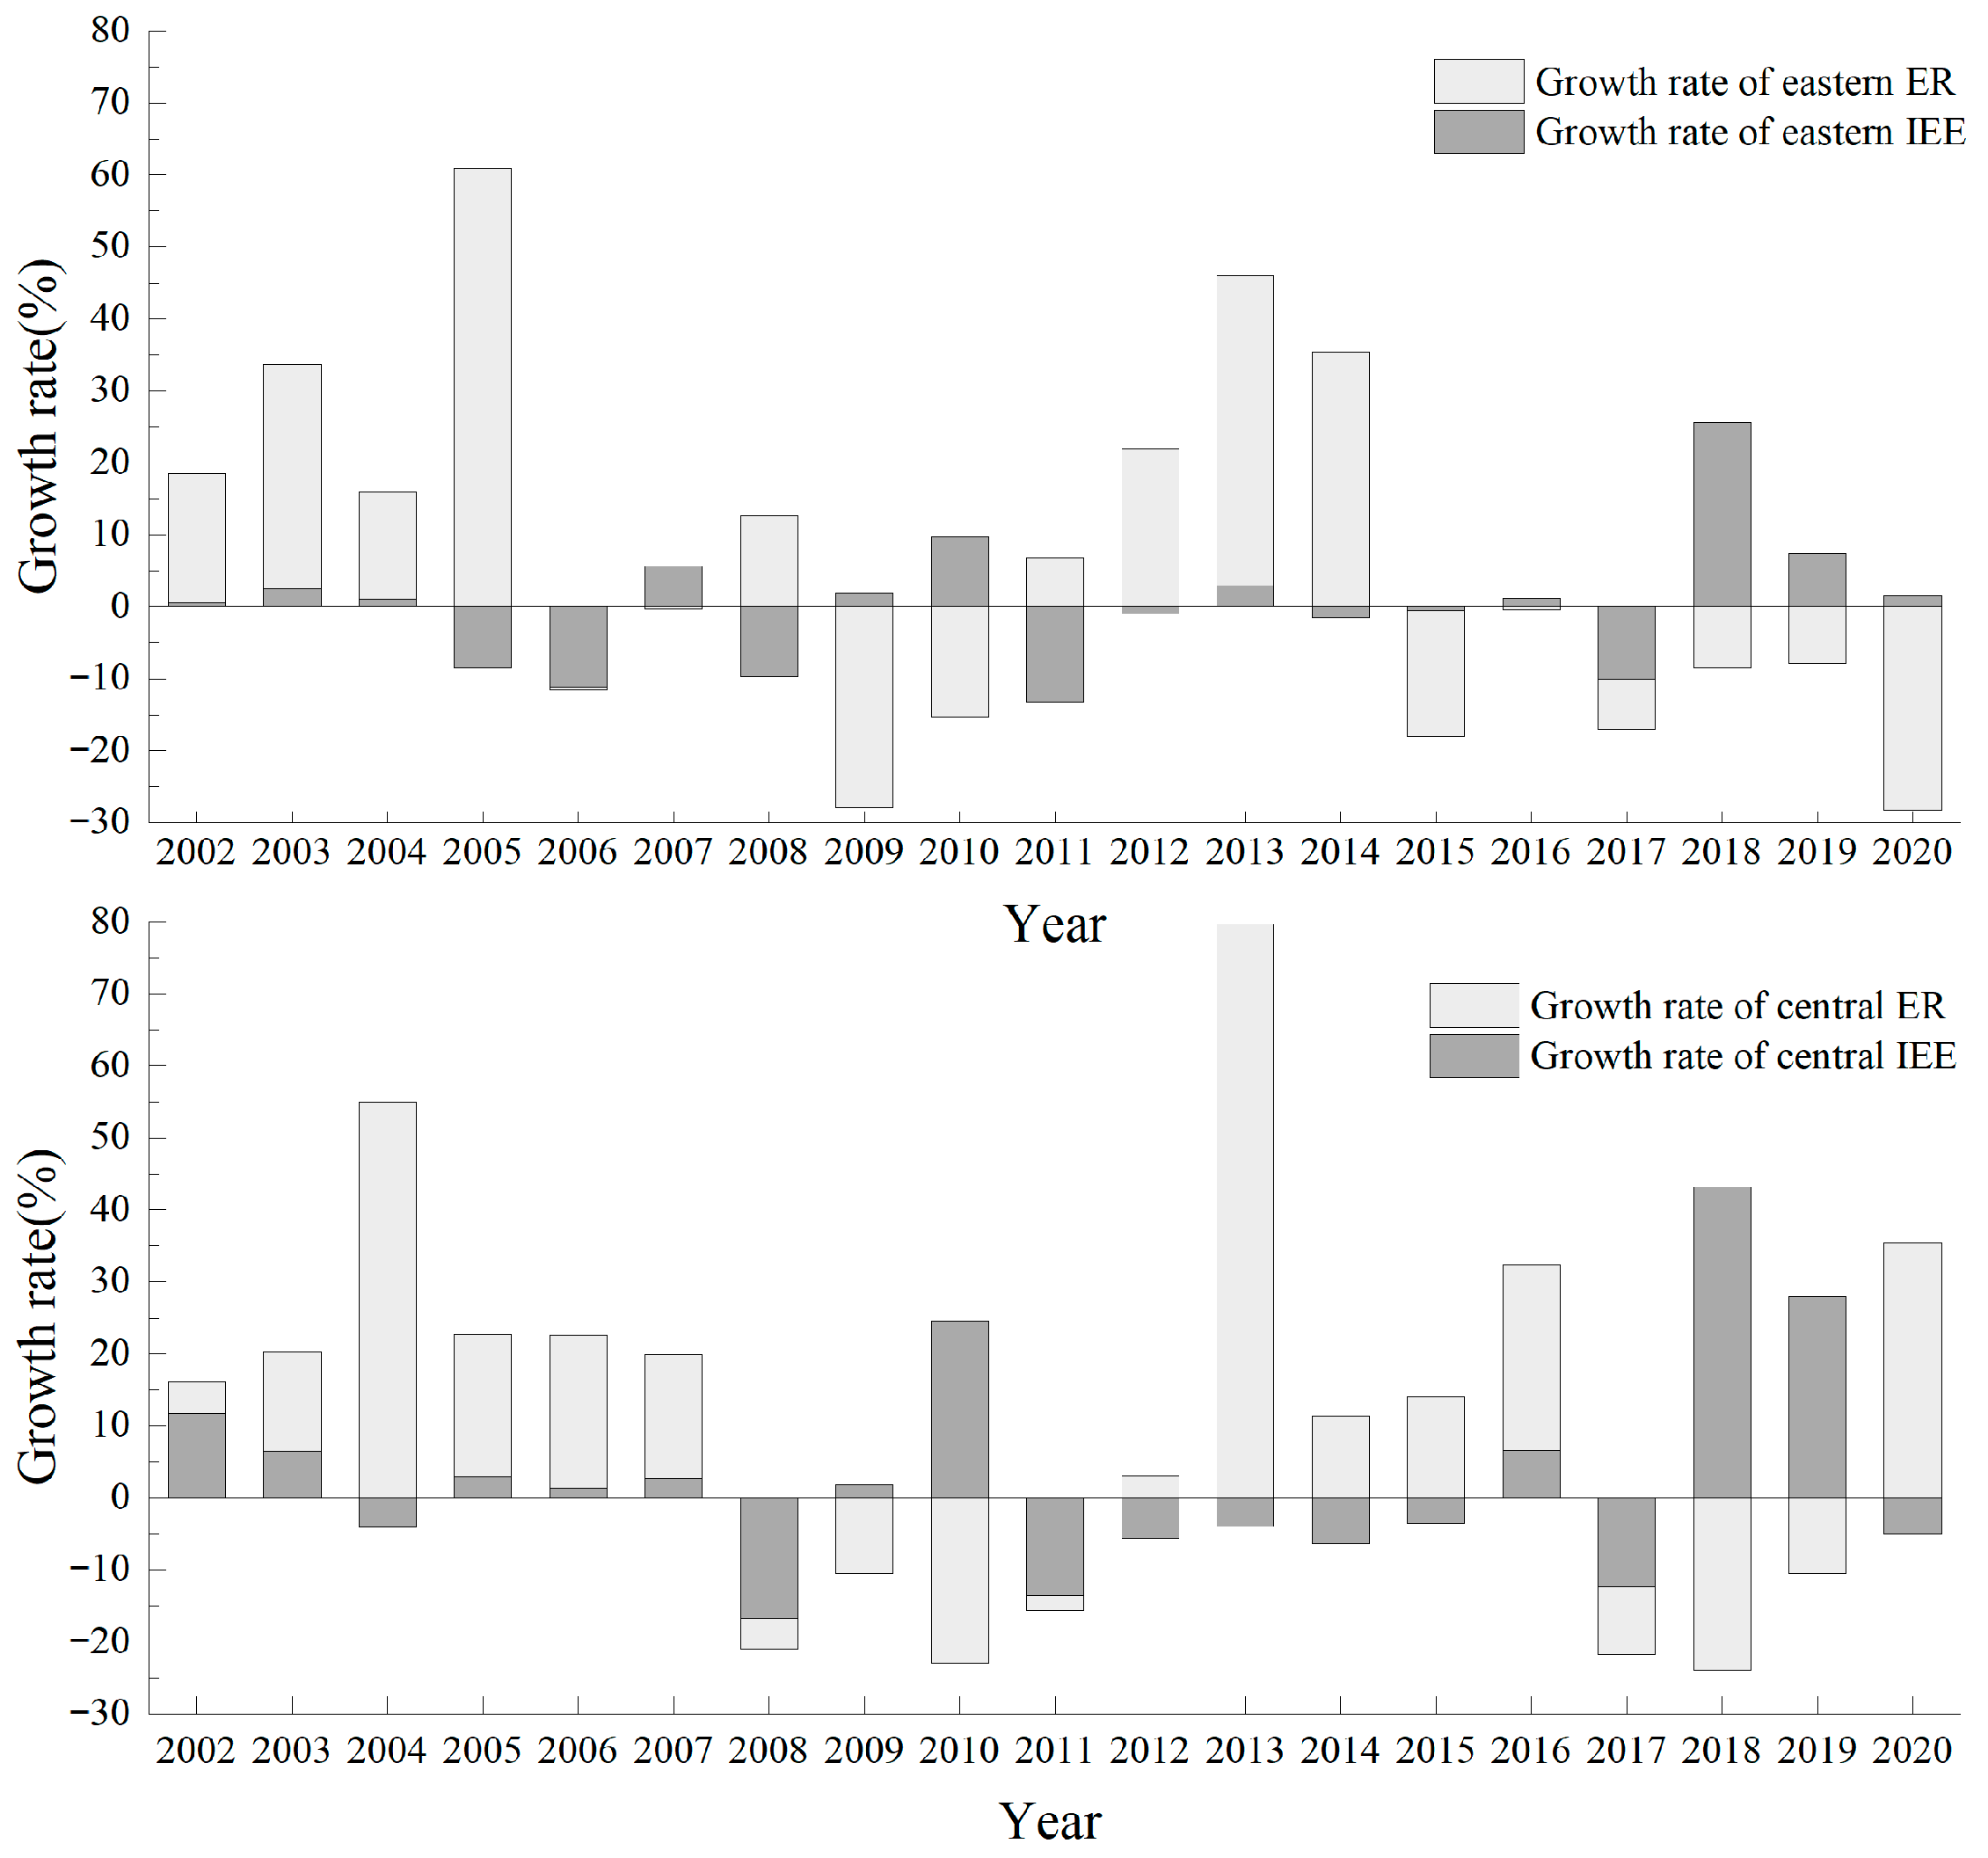
The discovered results support the hypothesis that the impact of ER on IEE varies depending on the level of economic growth. Examining the model for the eastern region reveals that heightened ER initially leads to an enhancement in IEE. However, once the initial economic growth threshold (c = 9.822, about CNY 18,438.88) is attained, this positive impact shifts towards a reduction in IEE, displaying a negative correlation compared to the previous regime. Moreover, as the economic growth crosses the second threshold (c = 10.961, about CNY 43,958.44), the inhibitory influence of ER on IEE becomes significantly more pronounced. This finding aligns closely with the shifts in the intensity of ER and IEE within the eastern region. As illustrated in Figure 6, during the initial phases of economic growth (from 2001 to 2004), both ER and IEE demonstrated a positive growth trajectory. As the government reinforced ER, the IEE continued to improve. Subsequently, following a phase of rapid economic expansion, the changes in the growth rates of ER and IEE diverged most of the time. The reinforcement of ER correlated with a decline in IEE, and conversely, a relaxation in these regulations led to improved efficiency. After 2018, with the transformation and upgrading of the economic structure, environmental pressures exhibited a relative decrease, accompanied by a weakening in the stringency of ER, ultimately fostering a gradual enhancement of IEE.
In the context of the eastern region, it is noteworthy that 78.64% of the sample size is situated within the second and third regimes. This distribution implies that ER predominantly constrains the ecological efficiency of industrial development in this region. The eastern region boasts a relatively advanced economy and a reasonably structured industrial sector, contributing to its comparatively elevated IEE. However, as ER becomes more stringent, certain enterprises might be compelled to exit the industry or shift their production operations. A case in point is Beijing’s implementation of the “Clean Air Action Plan 2013–2017” and the “Three Year Action Plan for Winning the Blue Sky War,” which resulted in the closure of 3212 general manufacturing and polluting enterprises. While transferring pollution might alleviate local environmental concerns, the absence of adequate follow-up options from alternative industries causes economic output to dwindle, leading to a persistent decline in IEE.
The findings indicate that a rise in ER led to a boost in the IEE of the central region. After reaching the first economic growth threshold (c = 9.942, about CNY 20,785.27), these increments started diminishing the IEE in the subsequent regime, showing a negative correlation. This suggests the existence of an inverted “U”-shaped relationship between ER and IEE. This finding is consistent with the evolving trend of ER and IEE in the central region. As depicted in Figure 6, during the initial phases of economic growth (2001–2008), both ER and IEE demonstrated a positive growth trajectory. The reinforcement of ER coincided with an improvement in IEE. Subsequently, following rapid economic expansion, the growth rates of ER and IEE are primarily opposite. Strengthening of ER leads to a decrease in IEE and vice versa. As ER becomes more stringent, certain companies invest in research and development to enhance technology or pivot towards cleaner industries. Consequently, there is a notable reduction in environmental pollution and resource consumption, driving up IEE. However, as the stringency of ER keeps growing, the associated costs rise consistently. While pollutant emissions are somewhat curbed, the increasing burden on productive investment and research and development budgets hampers economic output and stifles the advancement of regional IEE.
Compared to other regions, the western region experiences a smaller impact coefficient of ER on IEE, ranging from 0.007 to 0.022. However, ER still has a positive effect on IEE, and as the region reaches its first economic growth threshold (c = 9.877, approximately CNY 19,477.2), the boost from ER on IEE further increases, maintaining a favorable correlation. This phenomenon might be attributed to the heightened pressure for environmental pollution control and developmental demands prevailing in the western region. Given this region’s relatively backward level of economic growth, the escalation in environmental protection expenditures tends to displace productive investment expenditure. Concurrently, industrial transfer occurs from the eastern to the central and western regions, introducing new environmental challenges. Consequently, the western region is susceptible to striking a balance between two overarching objectives: “prioritizing environmental protection” and “sustaining growth.” This delicate equilibrium often leads to a relatively inconspicuous impact of ER on IEE. On the other hand, owing to its lower level of industrial advancement, the region primarily concentrates on resource-intensive industries, such as the exploitation of advantageous resources and the introduction of industrial transfers. This predisposes the region to a substantial burden of environmental pollution. Nevertheless, ER enhancement can facilitate IEE advancements by implementing equipment upgrades, technological substitutions, and other strategic approaches.
Table 5 shows that the impact coefficients of IEE’s temporal lag are positive in all models. This means that there is a positive and significant impact of the previous period’s IEE on the current manifestation of IEE. These findings show that the improvement in IEE performance is an ongoing process, and it takes time to adjust. This underscores the temporal “inertia” of IEE’s time-series dynamics.
Furthermore, the findings of the PSTR research underscore that the coefficients associated with technological innovation capability have a positive effect on all models and have passed the statistical significance test. By improving technological innovation, resource consumption and pollution emissions are reduced, leading to a better regional IEE. The extent of opening up has also passed the statistical significance test, but its impact varies among different regions. In the eastern region, foreign direct investments initially improve IEE, but this effect decreases after reaching a certain economic growth threshold. The impact of foreign direct investment becomes more pronounced as it continues to increase and reach the secondary economic growth threshold, constraining IEE significantly. In contrast, the escalation in foreign direct investment has the enhancement of IEE in the central region. Conversely, the western region displays a contrary pattern, wherein foreign direct investments exhibit a notable promotional influence on ecological efficiency. Industrial agglomeration only has a significant impact on the eastern region and can have both positive and negative effects depending on the stage of economic growth. During periods of low economic development, industrial accumulation can have adverse environmental consequences, but as economic growth reaches a higher stage, heightened levels of industrial agglomeration can foster a positive environment that promotes resource conservation, environmental friendliness, and knowledge sharing, leading to an improvement in IEE within the eastern region.

5. Conclusions and Policy Suggestions

This study utilized panel data from 2001 to 2020 for 30 provinces, autonomous regions, and municipalities in China. A two-stage approach was employed, beginning with a superefficiency SBM model incorporating undesirable outputs to determine provincial IEE scores. Following this, a PSTR analysis was conducted to examine the distinctive attributes of the influence of ER on IEE.
During the initial analysis phase, it was observed that China’s IEE exhibited a slight upward trend over the past two decades. However, this increase was insignificant, with most provinces displaying modest levels of IEE, excluding Tianjin, Beijing, Shanghai, and Guangdong. Regions boasting elevated levels of IEE were primarily concentrated in the eastern region, whereas those displaying lower IEE were situated within the comparatively less economically developed western region, highlighting significant disparities across Chinese areas.
The second phase of analysis showed that the effects of ER on IEE were likely to differ based on each region’s economic growth level. In regions with lower economic growth levels, ER had a positive impact on IEE. However, as the economic growth level increased past a certain threshold, ER contributed to the decline of IEE scores. Specifically, during the study period, ER predominantly had a constraining influence on IEE in the eastern region, whereas the western region displayed a relatively minor but positive stimulative effect. The central region showed a distinctive inverted “U-shaped” relationship between ER and IEE, indicating that as the economic growth level improved, the impact of ER on IEE transitioned from enhancing to impeding it.
This study has important implications for policy makers who want to improve provincial environmental efficiency. The following suggestions are specifically designed to help regions with lower IEE pursue high-quality, environmentally conscious development.
Firstly, local governments must customize their environmental performance targets based on the varying levels of economic growth and resource availability across different regions. The government should exercise prudence when implementing strict ER because they could force businesses to leave the market due to the high cost of pollution control, which could lead to a decrease in local economic growth. To address this issue, one possible solution is to use composite metrics such as ecological efficiency and ecological welfare performance instead of single indicators like pollutant reduction. These metrics can comprehensively reflect the interaction between regional resource consumption, pollutant emissions, economic growth, and even societal well-being. They are also more useful for evaluating the governance capabilities of local governments.
Secondly, precise policy adaptation is crucial due to regional variations in ER mechanisms. The government should tailor its strategies to unique developmental contexts and varying levels of economic advancement across regions. For instance, in the eastern region, businesses can be encouraged towards autonomous environmental stewardship through environmental taxation, ecological compensation, carbon trading, and green financing. On the other hand, the central region may prioritize administrative and regulatory approaches to improve environmental standards for foreign direct investment by carefully selecting eco-conscious foreign-funded enterprises and rigorously overseeing their ecological impact. The western region, acting as both an ecological buffer and an economically underdeveloped area, must adopt a dual approach to development and protection. The government should proactively promote eco-friendly technology innovation while adhering to the ecological red line, motivating enterprises to intensify independent research and development in environmental conservation.
Nonetheless, this study has certain limitations that require further exploration. Firstly, from an empirical standpoint, the determination of IEE substantially depends on the selection of input–output indicators, leading to disparities between our findings and those of prior studies. In future research, greater attention can be paid to social indicators like employment and health to improve result accuracy. Secondly, the present inquiry centers on the influence of ER, typified by pollution-control expenses, on industrial ecological efficiency. Subsequent investigations can contemplate the effects of diverse ER types on industrial ecological efficiency, thereby yielding more insightful outcomes.

Author Contributions

Conceptualization, G.W. (Guokui Wang); methodology, G.W. (Guokui Wang); software, G.W. (Guokui Wang); validation, X.G., G.W. (Guoqin Wu) and Y.Z.; formal analysis, G.W. (Guokui Wang); data curation, X.G. and G.W. (Guoqin Wu); writing—original draft, G.W. (Guokui Wang); writing—review and editing, G.W. (Guokui Wang), X.G. and Y.Z.; supervision, G.W. (Guoqin Wu); funding acquisition, G.W. (Guoqin Wu). All authors have read and agreed to the published version of the manuscript.

Funding

This research was funded by the Major Project of Humanities and Social Sciences Application Research of Henan Provincial Department of Education, grant number 2022-YYZD-22.

Institutional Review Board Statement

Not applicable.

Informed Consent Statement

Not applicable.

Data Availability Statement

Please refer to http://www.stats.gov.cn/sj/ndsj/ (accessed on 22 October 2023) and https://data.stats.gov.cn/index.htm (accessed on 22 October 2023).

Conflicts of Interest

The authors declare no conflict of interest.

References

  1. National Bureau of Statistics of China. National Data. 2021. Available online: http://data.stats.gov.cn/english/adv.htm?m=advquery&cn=E0103 (accessed on 10 May 2020).
  2. Matsumoto, K.; Chen, Y.Y. Industrial eco-efficiency and its determinants in China: A two-stage approach. Ecol. Indic. 2021, 130, 108072. [Google Scholar] [CrossRef]
  3. Liu, F.; Zhou, S.; Yang, Y.; Liu, C. Research on industrial ecological efficiency evaluation and improvement countermeasures based on data-driven evaluations from 30 provinces and cities in China. Sustainability 2022, 14, 8665. [Google Scholar] [CrossRef]
  4. Oggioni, G.; Riccardi, R.; Toninelli, R. Eco-efficiency of the world cement industry: A data envelopment analysis. Energy Policy 2011, 39, 2842–2854. [Google Scholar] [CrossRef]
  5. Ezici, B.; Eğilmez, G.; Gedik, R. Assessing the eco-efficiency of US manufacturing industries with a focus on renewable vs. non-renewable energy use: An integrated time series MRIO and DEA approach. J. Clean. Prod. 2020, 253, 119630. [Google Scholar] [CrossRef]
  6. Huang, J.; Xia, J.; Yu, Y.; Zhang, N. Composite eco-efficiency indicators for China based on data envelopment analysis. Ecol. Indic. 2018, 85, 674–697. [Google Scholar] [CrossRef]
  7. Van Caneghem, J.; Block, C.; Van Hooste, H.; Vandecasteele, C. Eco-efficiency trends of the Flemish industry: Decoupling of environmental impact from economic growth. J. Clean. Prod. 2010, 18, 1349–1357. [Google Scholar] [CrossRef]
  8. Dahlström, K.; Ekins, P. Eco-efficiency trends in the UK steel and aluminum industries. J. Ind. Ecol. 2005, 9, 171–188. [Google Scholar] [CrossRef]
  9. Xavier Belem, M.J.; Vieira Junior, M.; Mummolo, G.; Facchini, F. An ahp-based procedure for model selection for eco-efficiency assessment. Sustainability 2021, 13, 12121. [Google Scholar] [CrossRef]
  10. Park, Y.S.; Egilmez, G.; Kucukvar, M. A novel life cycle-based principal component analysis framework for eco-efficiency analysis: Case of the United States manufacturing and transportation nexus. J. Clean. Prod. 2015, 92, 327–342. [Google Scholar] [CrossRef]
  11. Richa, K.; Babbitt, C.W.; Gaustad, G. Eco-efficiency analysis of a lithium-ion battery waste hierarchy inspired by circular economy. J. Ind. Ecol. 2017, 21, 715–730. [Google Scholar] [CrossRef]
  12. Mendoza, J.M.F.; D’aponte, F.; Gualtieri, D.; Azapagic, A. Disposable baby diapers: Life cycle costs, eco-efficiency and circular economy. J. Clean. Prod. 2019, 211, 455–467. [Google Scholar] [CrossRef]
  13. Wang, W.; Jiang, D.; Chen, D.; Chen, Z.; Zhou, W.; Zhu, B. A Material Flow Analysis (MFA)-based potential analysis of eco-efficiency indicators of China’s cement and cement-based materials industry. J. Clean. Prod. 2016, 112, 787–796. [Google Scholar] [CrossRef]
  14. Chen, X.; Wang, K.; Wan, G.; Liu, Y.; Liu, W.; Shen, W.; Shi, J. Evaluation and empirical research on eco-efficiency of financial industry based on carbon footprint in China. Sustainability 2022, 14, 13677. [Google Scholar] [CrossRef]
  15. Tsionas, M.G.; Tzeremes, N.G. Eco-efficiency estimation with quantile stochastic frontiers: Evidence from the United States. J. Environ. Manag. 2022, 320, 115876. [Google Scholar] [CrossRef] [PubMed]
  16. Ren, S.G.; Zhang, R.B.; Yuan, B.L. Industrial eco-efficiency evaluation and regional differences of Yangtze River economic belt. Acta Ecol. Sin. 2018, 38, 5485–5497. (In Chinese) [Google Scholar]
  17. Zhao, X.; Wang, Y.X.; Zhao, F.F. The spatiotemporal transition characteristics and spatial spillover effects of urban industrial ecological efficiency: Taking the Yangtze River Economic Belt as an example. Stat. Decis. 2022, 38, 133–138. (In Chinese) [Google Scholar]
  18. Wang, Y.; Liu, J.; Hansson, L.; Zhang, K.; Wang, R. Implementing stricter environmental regulation to enhance eco-efficiency and sustainability: A case study of Shandong Province’s pulp and paper industry, China. J. Clean. Prod. 2011, 19, 303–310. [Google Scholar] [CrossRef]
  19. Fan, Y.; Bai, B.; Qiao, Q.; Kang, P.; Zhang, Y.; Guo, J. Study on eco-efficiency of industrial parks in China based on data envelopment analysis. J. Environ. Manag. 2017, 192, 107–115. [Google Scholar] [CrossRef] [PubMed]
  20. Wang, D.; Wan, K.; Yang, J. Measurement and evolution of eco-efficiency of coal industry ecosystem in China. J. Clean. Prod. 2019, 209, 803–818. [Google Scholar] [CrossRef]
  21. Song, C.; Yin, G.; Lu, Z.; Chen, Y. Industrial ecological efficiency of cities in the Yellow River Basin in the background of China’s economic transformation: Spatial-temporal characteristics and influencing factors. Environ. Sci. Pollut. Res. 2022, 29, 4334–4349. [Google Scholar] [CrossRef]
  22. Stergiou, E.; Kounetas, K. Heterogeneity, spillovers and eco-efficiency of European industries under different pollutants’ scenarios. Is there a definite direction? Ecol. Econ. 2022, 195, 107377. [Google Scholar] [CrossRef]
  23. Liu, L.; Liu, M. How does the digital economy affect industrial eco-efficiency? Empirical evidence from China. Data Sci. Financ. Econ. 2022, 2, 371–390. [Google Scholar] [CrossRef]
  24. Li, B.; Hu, Z.; Miao, C.; Zhang, B.; Kang, W. Spatio-temporal evolution characteristics and influencing factors of the industrial eco-efficiency in the Yellow River Basin. Geogr. Res. 2021, 40, 2156–2169. (In Chinese) [Google Scholar]
  25. Zhang, X.L.; Qiu, F.D.; Tan, J.T.; Wang, C.J. Analysis of the characteristics of spatial and temporal differentiation of Chinese industrial ecological efficiency and its influencing factors. Sci. Geogr. Sin. 2020, 40, 335–343. (In Chinese) [Google Scholar]
  26. Guo, L.; Xu, S.Q. Industrial eco-efficiency with the integration super efficiency DEA: The central six provinces 2003–2013 data as an example. Econ. Geogr. 2016, 6, 116–121. (In Chinese) [Google Scholar]
  27. Xu, J.J.; Wang, H.J.; Tang, K. The sustainability of industrial structure on green eco-efficiency in the Yellow River Basin. Econ. Anal. Policy 2022, 74, 775–788. [Google Scholar] [CrossRef]
  28. Zhang, Q.F.; Tang, X.; Xiao, Y.; Xiang, X.; Huang, H. Coordination of industrial structure and eco-efficiency in ecologically fragile areas: A case study of the Loess Plateau, China. J. Environ. Manag. 2023, 331, 117237. [Google Scholar] [CrossRef] [PubMed]
  29. Wu, K.; You, K.; Ren, H.; Gan, L. The impact of industrial agglomeration on ecological efficiency: An empirical analysis based on 244 Chinese cities. Environ. Impact Assess. Rev. 2022, 96, 106841. [Google Scholar] [CrossRef]
  30. Chen, C.; Sun, Y.; Lan, Q.; Jiang, F. Impacts of industrial agglomeration on pollution and ecological efficiency-A spatial econometric analysis based on a big panel dataset of China’s 259 cities. J. Clean. Prod. 2020, 258, 120721. [Google Scholar] [CrossRef]
  31. He, J.; Hu, S. Ecological efficiency and its determining factors in an urban agglomeration in China: The Chengdu-Chongqing urban agglomeration. Urban Clim. 2022, 41, 101071. [Google Scholar] [CrossRef]
  32. Darnall, N.; Henriques, I.; Sadorsky, P. Do environmental management systems improve business performance in an international setting. J. Int. Manag. 2008, 14, 364–376. [Google Scholar] [CrossRef]
  33. Chakraborty, P.; Chatterjee, C. Does environmental regulation indirectly induce upstream innovation? New evidence from India. Res. Policy 2017, 46, 939–955. [Google Scholar] [CrossRef]
  34. Jiang, P.P.; Wang, Y.; Luo, J.; Zhu, L.; Shi, R.; Hu, S.; Zhu, X. Measuring static and dynamic industrial eco-efficiency in China based on the MinDS-Malmquist-Luenberger model. Environ. Dev. Sustain. 2023, 25, 5241–5261. [Google Scholar] [CrossRef]
  35. Puertas, R.; Guaita-Martinez, J.M.; Carracedo, P.; Ribeiro-Soriano, D. Analysis of European environmental policies: Improving decision making through eco-efficiency. Technol. Soc. 2022, 70, 102053. [Google Scholar] [CrossRef]
  36. Cui, S.; Wang, Y.; Zhu, Z.; Zhu, Z.; Yu, C. The impact of heterogeneous environmental regulation on the energy eco-efficiency of China’s energy-mineral cities. J. Clean. Prod. 2022, 350, 131553. [Google Scholar] [CrossRef]
  37. Ghisetti, C.; Rennings, K. Environmental innovations and profitability: How does it pay to be green? Soc. Sci. Electron. Publ. 2013, 75, 106–117. [Google Scholar] [CrossRef]
  38. Yuan, B.L.; Ren, S.G.; Chen, X.H. Can environmental regulation promote the coordinated development of economy and environment in China’s manufacturing industry?—A panel data analysis of 28 sub-sectors. J. Clean. Prod. 2017, 149, 11–24. [Google Scholar] [CrossRef]
  39. Xu, X.G.; Zhang, J.J. Impacts of environmental regulations on industrial eco-efficiency from the perspective of interaction between regulations. Soft Sci. 2019, 33, 67–71. (In Chinese) [Google Scholar]
  40. Deng, Z.B.; Li, L.P.; Wang, J.; Cao, Y.F. Regional differences and driving factors of China’s industrial ecological efficiency: Based on technology heterogeneity. Resour. Sci. 2022, 44, 1009–1021. [Google Scholar]
  41. Zhang, J.; Liu, Y.; Chang, Y.; Zhang, L. Industrial eco-efficiency in China: A provincial quantification using three-stage data envelopment analysis. J. Clean. Prod. 2017, 143, 238–249. [Google Scholar] [CrossRef]
  42. Yu, Y.; Huang, J.; Zhang, N. Industrial eco-efficiency, regional disparity, and spatial convergence of China’s regions. J. Clean. Prod. 2018, 204, 872–887. [Google Scholar] [CrossRef]
  43. Liu, L.; Zhao, Y.; Yang, Y.; Liu, S.; Gong, X.; Jiang, P. Study on the measurement of industrial eco-efficiency, spatial distribution and influencing factors in Yangtze River Economic Belt. PLoS ONE 2023, 18, e0283964. [Google Scholar] [CrossRef] [PubMed]
  44. Wang, X.; Wu, Q.; Majeed, S.; Sun, D. Fujian’s industrial eco-efficiency: Evaluation based on sbm and the empirical analysis of influencing factors. Sustainability 2018, 10, 3333. [Google Scholar] [CrossRef]
  45. Tone, K. A slacks-based measure of efficiency in data envelopment analysis. Eur. J. Oper. Res. 2001, 130, 498–509. [Google Scholar] [CrossRef]
  46. González, A.; Teräsvirta, T.; van Dijk, D. Panel Smooth Transition Regression Models; Research Paper Series 165; Quantitative Finance Research Centre, University of Technology: Sydney, Austrilia, 2005. [Google Scholar]
Figure 1. The development history of China’s environmental regulation system.
Sustainability 15 15408 g001
Figure 2. The flow chart of the methodology.
Sustainability 15 15408 g002
Figure 3. Overview of China’s regional division.
Sustainability 15 15408 g003
Figure 4. IEE of 30 provinces, autonomous regions, and municipalities in China from 2001 to 2020.
Sustainability 15 15408 g004
Figure 5. Average IEE of 30 provinces, autonomous regions, and municipalities in China.
Sustainability 15 15408 g005
Figure 6. The growth rates of ER and IEE in eastern and central region.
Sustainability 15 15408 g006
Table 1. Input and output indicators to measure IEE.
CategoryQuantitative IndicatorsUnit
InputIndustrial energy consumptionTons of standard coal equivalent
Industrial water useTons
Total assets of industrial enterprisesMillion CNY
Industrial laborPersons
Desirable outputIndustrial output valueMillion CNY
Undesirable outputIndustrial wastewater dischargedTons
Industrial SO2 emissionsTons
Industrial particulate emissions (smoke and dust)Tons
Industrial solid waste disposedTons
Table 2. LLC and ADF-Fisher panel unit root results.
TestLLCADF-Fisher
Statisticp-ValueStatisticp-Value
IEEit−3.059 ***0.001−8.509 ***0.000
Ln(ER)it−2.512 ***0.006−9.491 ***0.000
Ln(GDP)it−2.798 ***0.006−10.866 ***0.000
Ln(TI)it−3.201 ***0.001−6.048 ***0.000
Ln(OP)it−3.407 ***0.001−7.764 ***0.000
Ln(IA)it−2.281 **0.011−10.109 ***0.000
Note: *** and ** are the statistical significance at the 1 and 5% levels, respectively.
Table 3. Linearity test results.
TestsEastern RegionCentral RegionWestern Region
Statisticp-ValueStatisticp-ValueStatisticp-Value
H0: Linear Model vs. H1: PSTR Model with at Least One Threshold Variable (r = 1)
Lagrange multiplier—Wald (LMW)38.651 ***0.00032.256 ***0.00018.546 ***0.000
Lagrange multiplier—Fischer (LMF)8.221 ***0.0007.112 ***0.0004.118 ***0.000
Likelihood ratio Wald (LR)41.954 ***0.00036.009 ***0.00018.965 ***0.000
Note: LM and LR denote Lagrange multiplier and likelihood ratio tests for linearity. *** is the statistical significance at the 1% level.
Table 4. The remaining nonlinearity tests results.
TestsEastern RegionCentral RegionWestern Region
Statisticp-ValueStatisticp-ValueStatisticp-Value
H0: PSTR with r = 1 against H1: PSTR with at Least r = 2
Lagrange multiplier—Wald (LMW)16.946 ***0.0077.9250.1695.6630.565
Lagrange multiplier—Fischer (LMF)5.264 ***0.0012.1250.2581.5520.625
Likelihood ratio Wald (LR)18.648 ***0.0038.1650.1684.9650.433
H0: PSTR with r = 2 against H1: PSTR with at Least r = 3
Lagrange multiplier—Wald (LMW)3.1150.667
Lagrange multiplier—Fischer (LMF)0.6350.722
Likelihood ratio Wald (LR)2.5610.844
Note: LM and LR denote Lagrange multiplier and likelihood ratio tests for linearity. *** is the statistical significance at the 1% level.
Table 5. PSTR estimation results.
Dependent Variable: IEEit
VariablesEastern Region of ChinaCentral Region of ChinaWestern Region of China
Regime 1
(β0)
Regime 2
(β1)
Regime 3
(β2)
Regime 1
(β0)
Regime 2
(β1)
Regime 1
(β0)
Regime 2
(β1)
IEEit−10.227 ***
(3.114)
0.469 ***
(2.898)
0.169 ***
(3.646)
0.183 ***
(3.942)
0.401 ***
(4.658)
0.287 ***
(4.692)
0.275 ***
(3.657)
Ln(ER)it0.046 **
(2.346)
−0.062 ***
(−4.955)
−0.109 ***
(−3.979)
0.063 ***
(2.808)
−0.102 **
(−2.211)
0.007 ***
(4.216)
0.008 ***
(3.664)
Ln(TI)it0.114 ***
(3.654)
0.042 **
(2.066)
−0.136 ***
(−4.692)
0.205 **
(1.936)
0.199 **
(2.528)
0.272 ***
(4.634)
0.094 *
(1.462)
Ln(OP)it0.127 **
(2.296)
−0.171 **
(−2.652)
0.037 ***
(4.115)
−0.033 *
(−1.575)
−0.012 ***
(−3.658)
0.007*
(1.620)
0.021 ***
(4.611)
Ln(IA)it−0.265 **
(−2.712)
0.366 ***
(3.818)
−0.049 ***
(−4.558)
−0.036
(−0.410)
0.226
(0.166)
−0.198 *
(−1.535)
0.505
(0.117)
Transition parameters
Threshold level (c)9.82210.6919.9429.877
Slope parameter (γ)0.4333.5164.2220.356
AIC−3.729−4.007−3.922−4.433
BIC−3.236−3.711−3.406−3.878
Notes: ***, **, and * denote significance at 1%, 5%, and 10%, respectively. Values in brackets are t-statistics.
Disclaimer/Publisher’s Note: The statements, opinions and data contained in all publications are solely those of the individual author(s) and contributor(s) and not of MDPI and/or the editor(s). MDPI and/or the editor(s) disclaim responsibility for any injury to people or property resulting from any ideas, methods, instructions or products referred to in the content.