3.1. Evaluation of the Rotary Experiment
To evaluate the effect of wheat straw delignification using DES-like mixtures based on ChCl and LacA in a molar ratio of 1:5, a predesigned rotary experiment consisting of 20 experiments was used. In the conducted rotary experiment, we investigated the effect of three factors on wheat straw delignification (
Table 1). The limiting parameters of the factors were chosen on the basis of previous knowledge and practice. After conducting the rotary experiment, we focused on the characterization of the samples after the application of DES-like mixtures. The measured parameters included the delignification efficiency, and as in the case of the original biomass (
Table 2), we characterized the obtained pulp in terms of cellulose, lignin, holocellulose and ash content in the samples after delignification using DES-like mixtures based on ChCl/LacA in a molar ratio of 1:5. The obtained data are summarized in
Table 3.
The cellulose content ranged from 43.77% to 69.53%. The lowest cellulose content was obtained in sample 10 with a temperature limiting factor of up to 160 °C. On the contrary, the highest cellulose content was obtained in sample 14. In experiment 14, we used a limiting ratio factor of 1:60. An interesting observation is that although we obtained the lowest yield in this experiment (14), we also obtained the highest cellulose content. We also observe obtaining the same cellulose content representing 58.18% in experiments 11 and 12, which were characterized using a limiting factor of time, which was only 60 min in experiment 11, and up to 240 min in experiment 12. Experiment 9, in which the highest pulp yield was obtained, has a relatively low percentage in terms of cellulose content, only 45.01%, representing the second lowest cellulose content in the experiments, after experiment 10. The same trend as for cellulose content is also observed for holocellulose content. The highest holocellulose content was obtained in sample 14 with a value of 80.30%, and the lowest holocellulose content was obtained in sample 10 with a value of 59.17%.
We saw greater differences when comparing the residual lignin content in the samples after delignification, as its value ranged from 16.13 to 35.49%. The highest lignin content was obtained in sample 10, up to 35.49%. This value of lignin content after experiment 10 and also after experiments 2 and 4 is higher than the lignin content of the original biomass. At the same time, all these three samples did not have the perfect character of fibers obtained after delignification, but rather have the form of powder. In terms of temperature monitoring, we see that the high temperature used in this way (160 °C for experiment 10, and 144 °C for experiments 2 and 4) already results in an increase in lignin content. On the other hand, however, it is interesting to observe samples 6 and 8 with temperature also 144 °C, but with an increased biomass to solvent ratio to 1:30. After these experiments, we obtained a lower lignin content of only 22.95% in sample 6 and 25.54% in sample 8. By lowering the temperature to 80 °C and 120 °C, we can observe a lower lignin content in samples 9, 11, 12 and 15 to 20, in which we used the same ratio of 1:17. In all these delignified samples, the lignin content ranged from 18.08 to 21.56%. The lowest lignin content was obtained after experiment 14 with conditions of 120 °C, time of 150 min, and biomass to solvent ratio of 1:60. This sample also had the highest cellulose content (69.53%) and holocellulose content (80.30%).
The ash content after delignification ranged from 2.81 to 6.06%, while the ash content of the original biomass was 4.56%. Interestingly, the lowest ash content was in the sample after experiment 1 with conditions of 96 °C, 97 min, and a ratio of 1:12. On the contrary, the highest ash content was in the sample (experiment 5) in which we used the same heat-temperature and time and only the ratio used (1:30) was different.
After determining the lignin content according to the procedure described in
Section 2.6.1 (TAPPI T222 om-88, 1998) [
12], we calculated the delignification efficiency according to formula (1). The results obtained are also shown in
Table 3. The delignification efficiency itself ranged from −27.25 to 42.17%. The highest efficiency was obtained in sample 14 characterized by the highest ratio of biomass to solvent used. High efficiency was also achieved in sample 5 with a value of 35.53%, or sample 15 with a value of 30.66%. In contrast to these values, negative values of delignification efficiency were obtained for experiments 2, 4 and 10. These samples are characterized by a higher lignin content than the original biomass itself. The negative value of the delignification efficiency and thus the higher value of the lignin content in the pulp may be because the lignin gradually adsorbed back onto the fibers during delignification. At the same time, degradation of the carbohydrate fraction may also have occurred, as can be seen in the holocellulose content of these samples.
We also observe that the lower the lignin content in the sample after delignification, the higher the effect delignification. It is interesting to observe, for example, the difference in efficiency values for samples 13 and 14, which differ only in the ratio used. With sample 14 with a ratio of 1:60, we obtained efficiency 42.17% and for sample 13 with a ratio of 1:10 only 1.11%. On the other hand, with sample 11 we achieved efficiency 29.40% and for sample 12 the efficiency was 31.09%. These two samples were characterized by the same temperature and ratio, but with a different time. By comparing samples 1 and 3 with samples 5 and 7, we see that when using a different temperature or ratio compared to samples 11 and 12, we obtain different effectiveness. We obtained relatively high efficiencies at lower temperatures up to 120 °C.
In the next part of the work, we focused on the evaluation of the obtained values of variables such as delignification efficiency, cellulose, holocellulose, lignin, and ash content (
Table 3) using the method consisting in the analysis of variance ANOVA. Subsequently, we obtained a set of regression equations, and the least squares method was used to obtain the calculated coefficients of the quadratic model. For the coefficients for delignification efficiency, cellulose and holocellulose content, we observed the maximum obtained, and for lignin and ash content, we observed the minimum obtained. Using the Solver subroutine in Microsoft Excel and applying regression equations, we determined the optimal conditions for delignification. We searched for the optimal conditions for all five parameters of interest and the results are summarized in
Table 4. Other information can be found in the
Supplementary Material of this article (Tables S1 and S2).
The planned experiment was designed to obtain optimal conditions in terms of the resulting percentage of lignin in the pulp. The optimum conditions for obtaining the most the lowest lignin content of 16.44% at our chosen cut-off parameters are: temperature (111 °C), time (60 min), and ratio of biomass to solvent (1:27). For maximum delignification efficiency, reaching 37.32%, the optimal conditions were determined as a temperature of 120 °C, a duration of 150 min, and a ratio of 1:34.
3.2. Characterization of Obtained Pulp after Rotary Experiment
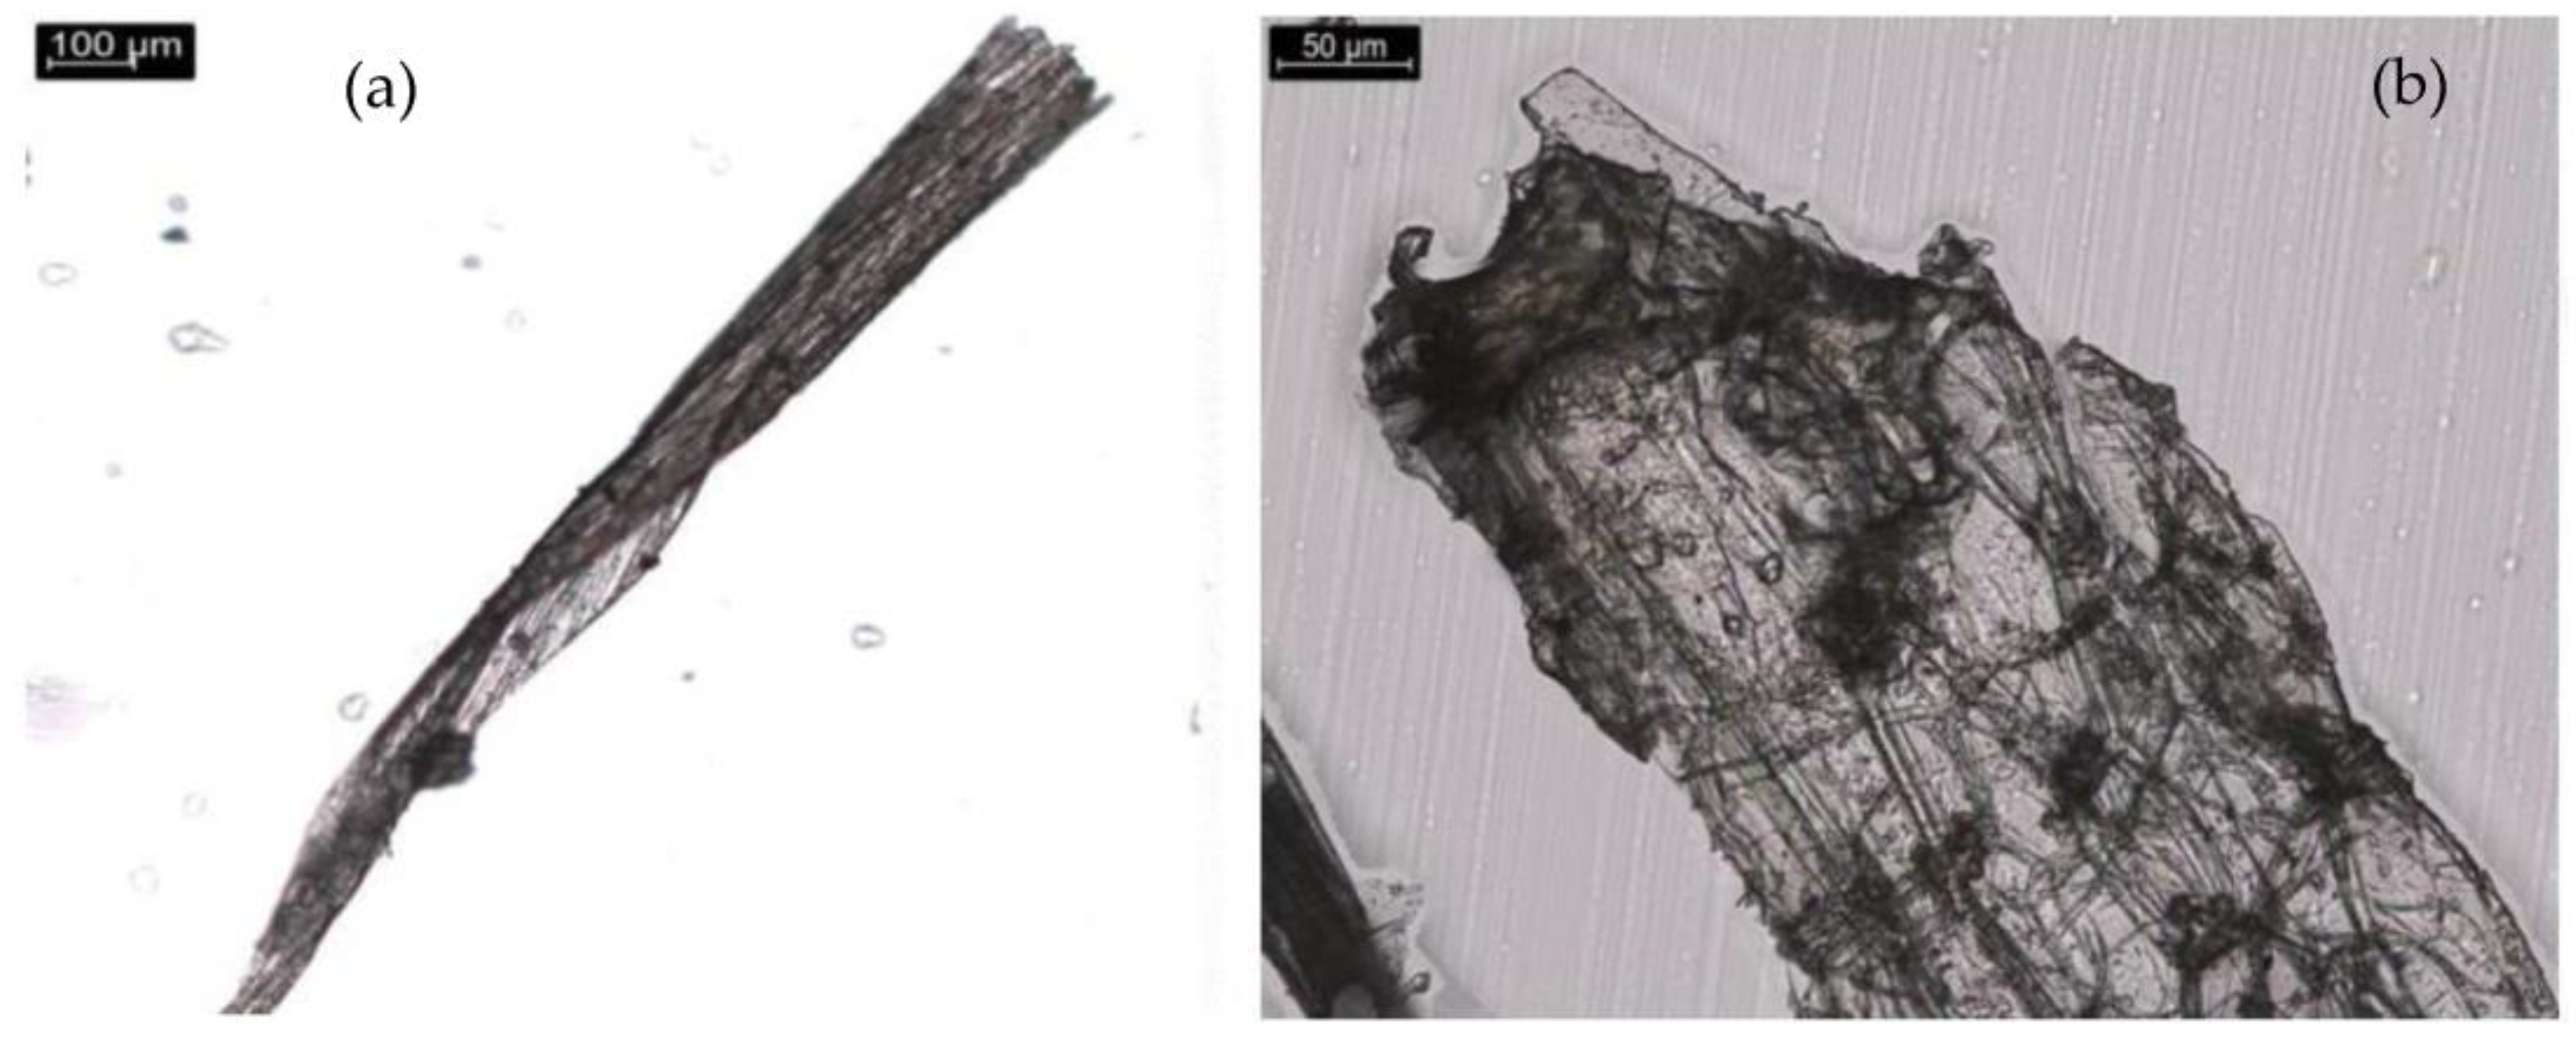
In this part of the work, we investigated and characterized the fibers of the original biomass and the pulp obtained after delignification using different analyses. First, we observed the fibers using optical microscopy to better understand and observe the change in their character. We observed each sample at three magnifications, and our goal was to see the character and shape of each fiber as we observed it. In
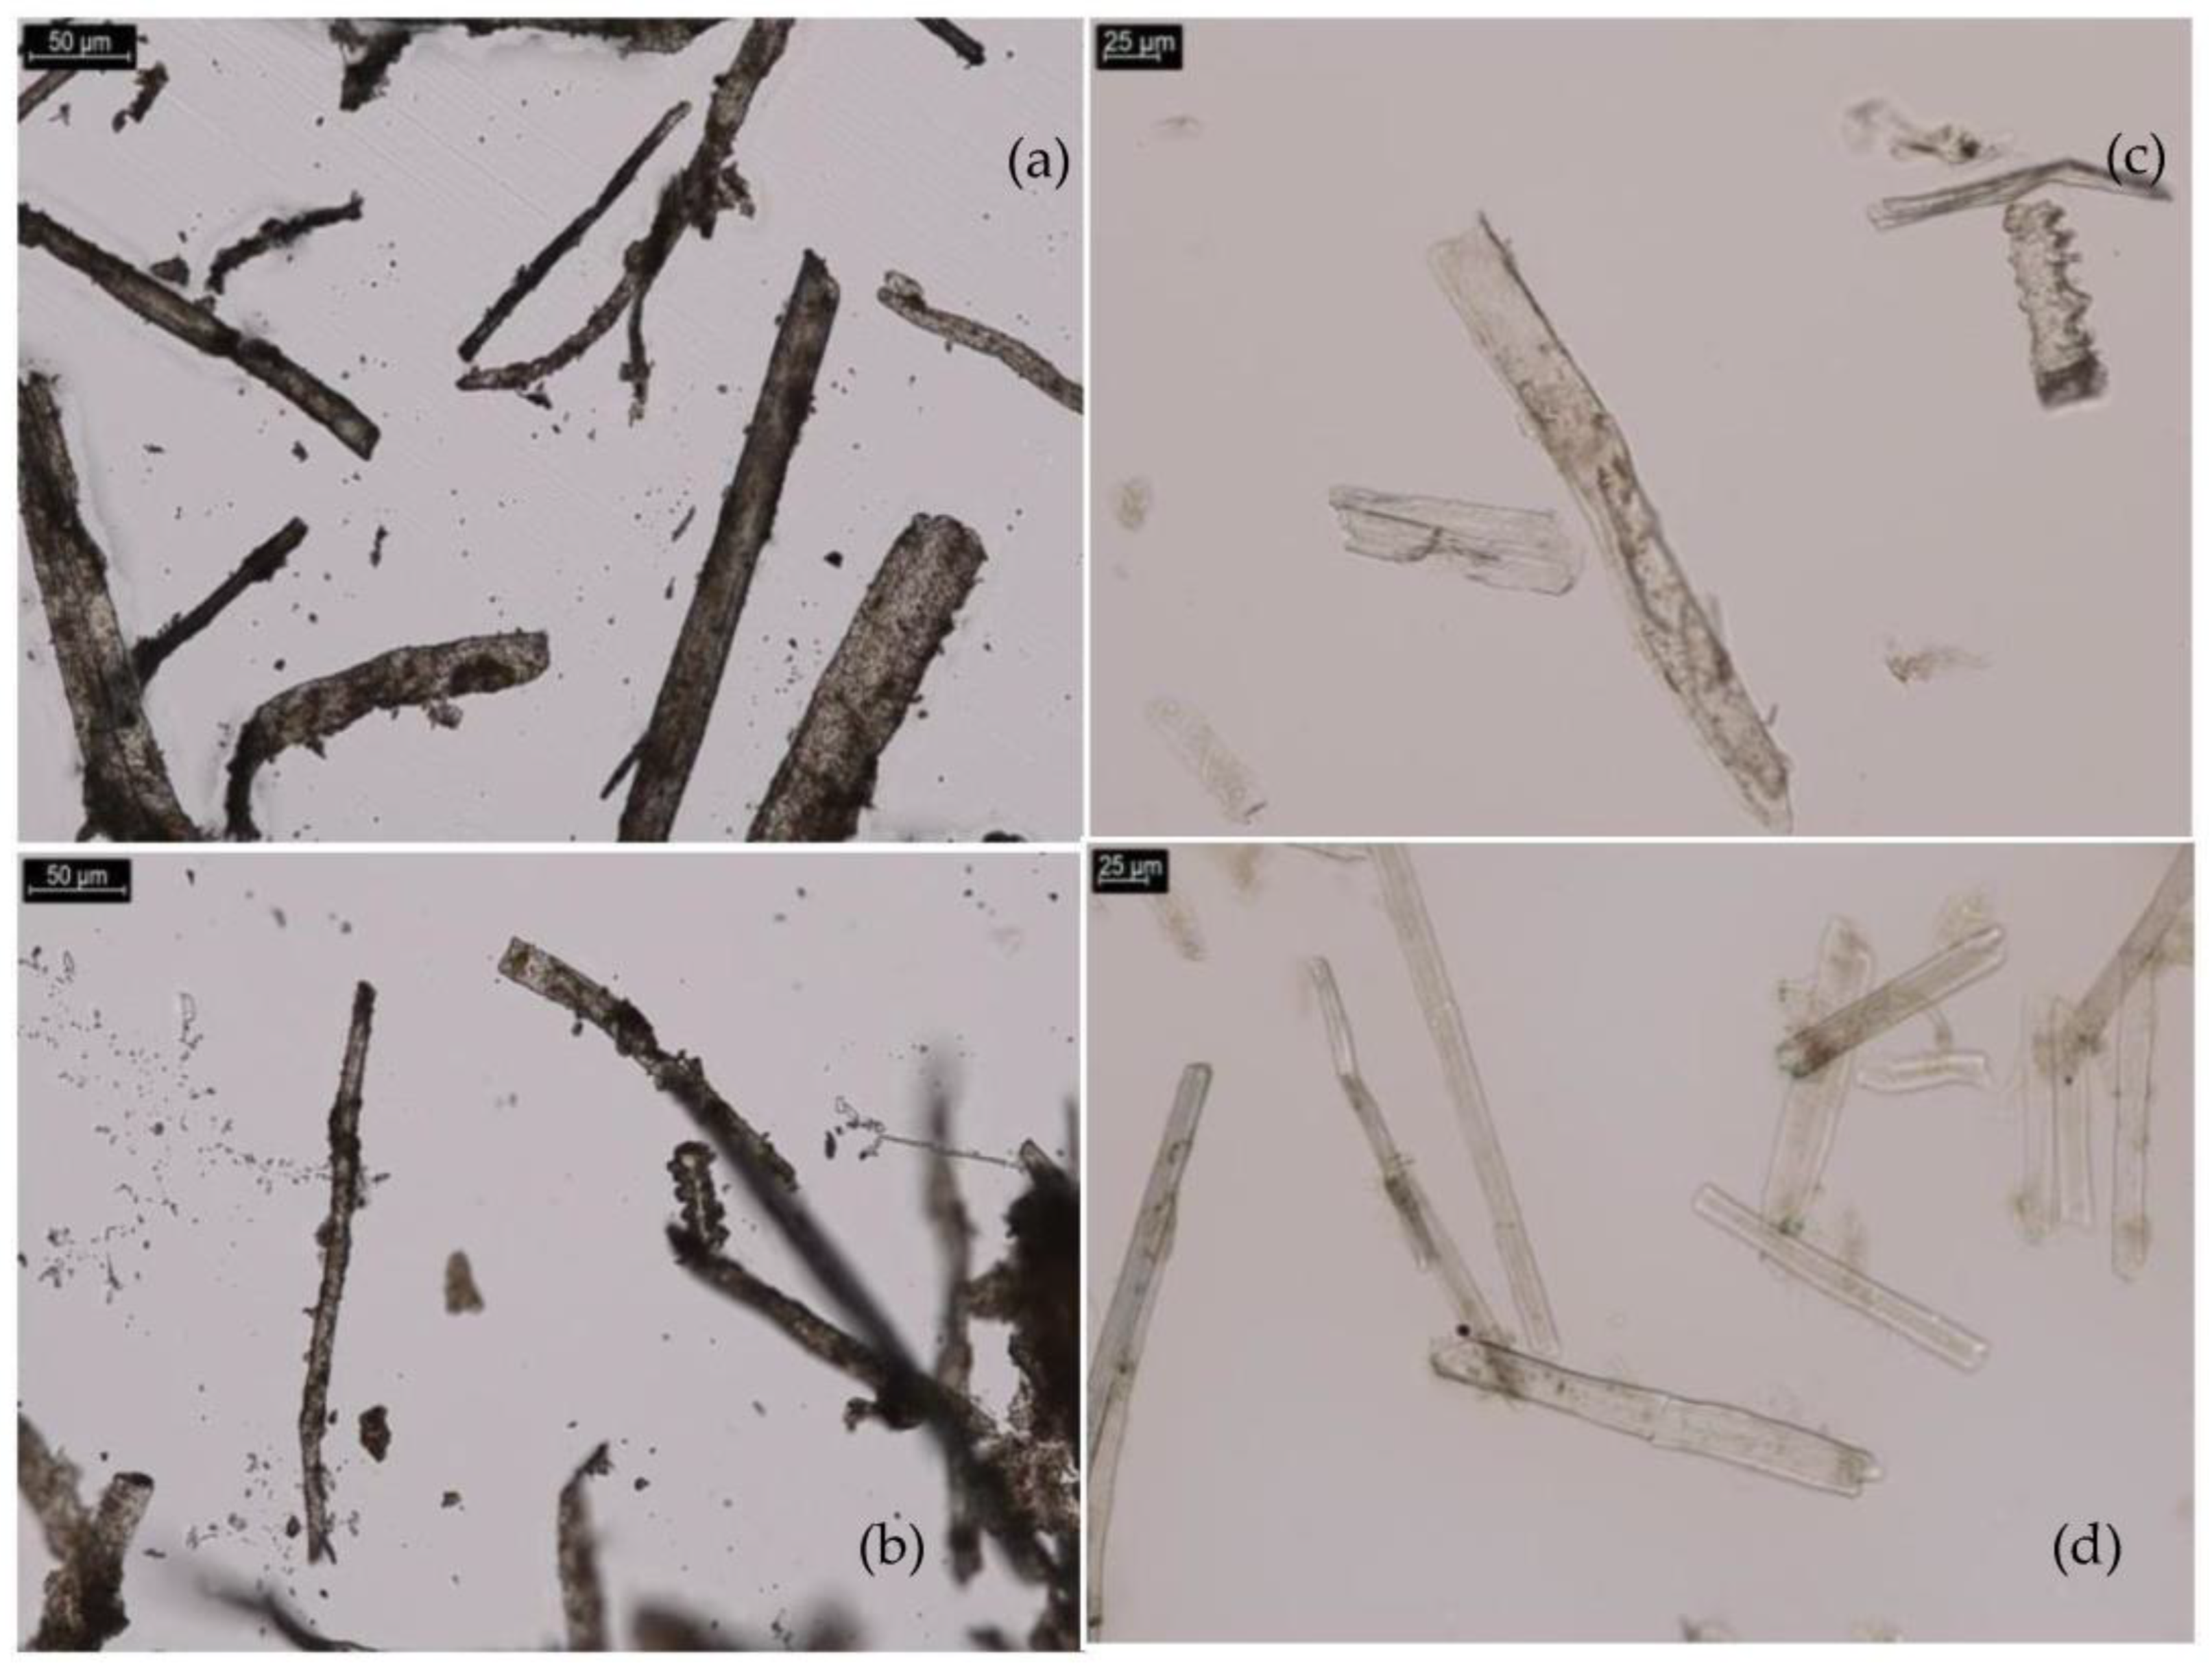
Figure 1, the character of the fibers of the original biomass can be seen. These fibers are relatively smooth, without any distinct protrusions. It can also be seen that they are relatively longer than the fibers obtained after delignification (
Figure 2).
At the same time, we saw brown fragments attached to them, which we assumed could be the re-adsorbed lignin. To confirm our hypothesis, we performed a dioxane test on these samples. We placed a few fibers of the sample on a slide. This sample was under a microscope at 930× magnification. We then added a few drops of dioxane and watched what happened. After a while, the dioxane began to dissolve the trapped brown fragments on the sample. As a result, the fibers were no longer free of brown fragments, which dissolved in the presence of dioxane. This test confirmed the presence of lignin in the sample, as dioxane dissolves lignin. Our hypothesis was confirmed by this experiment, and we tried to confirm it using other methods in this work. Other results can be found in the
Supplementary Material of this article (Tables S3–S8).
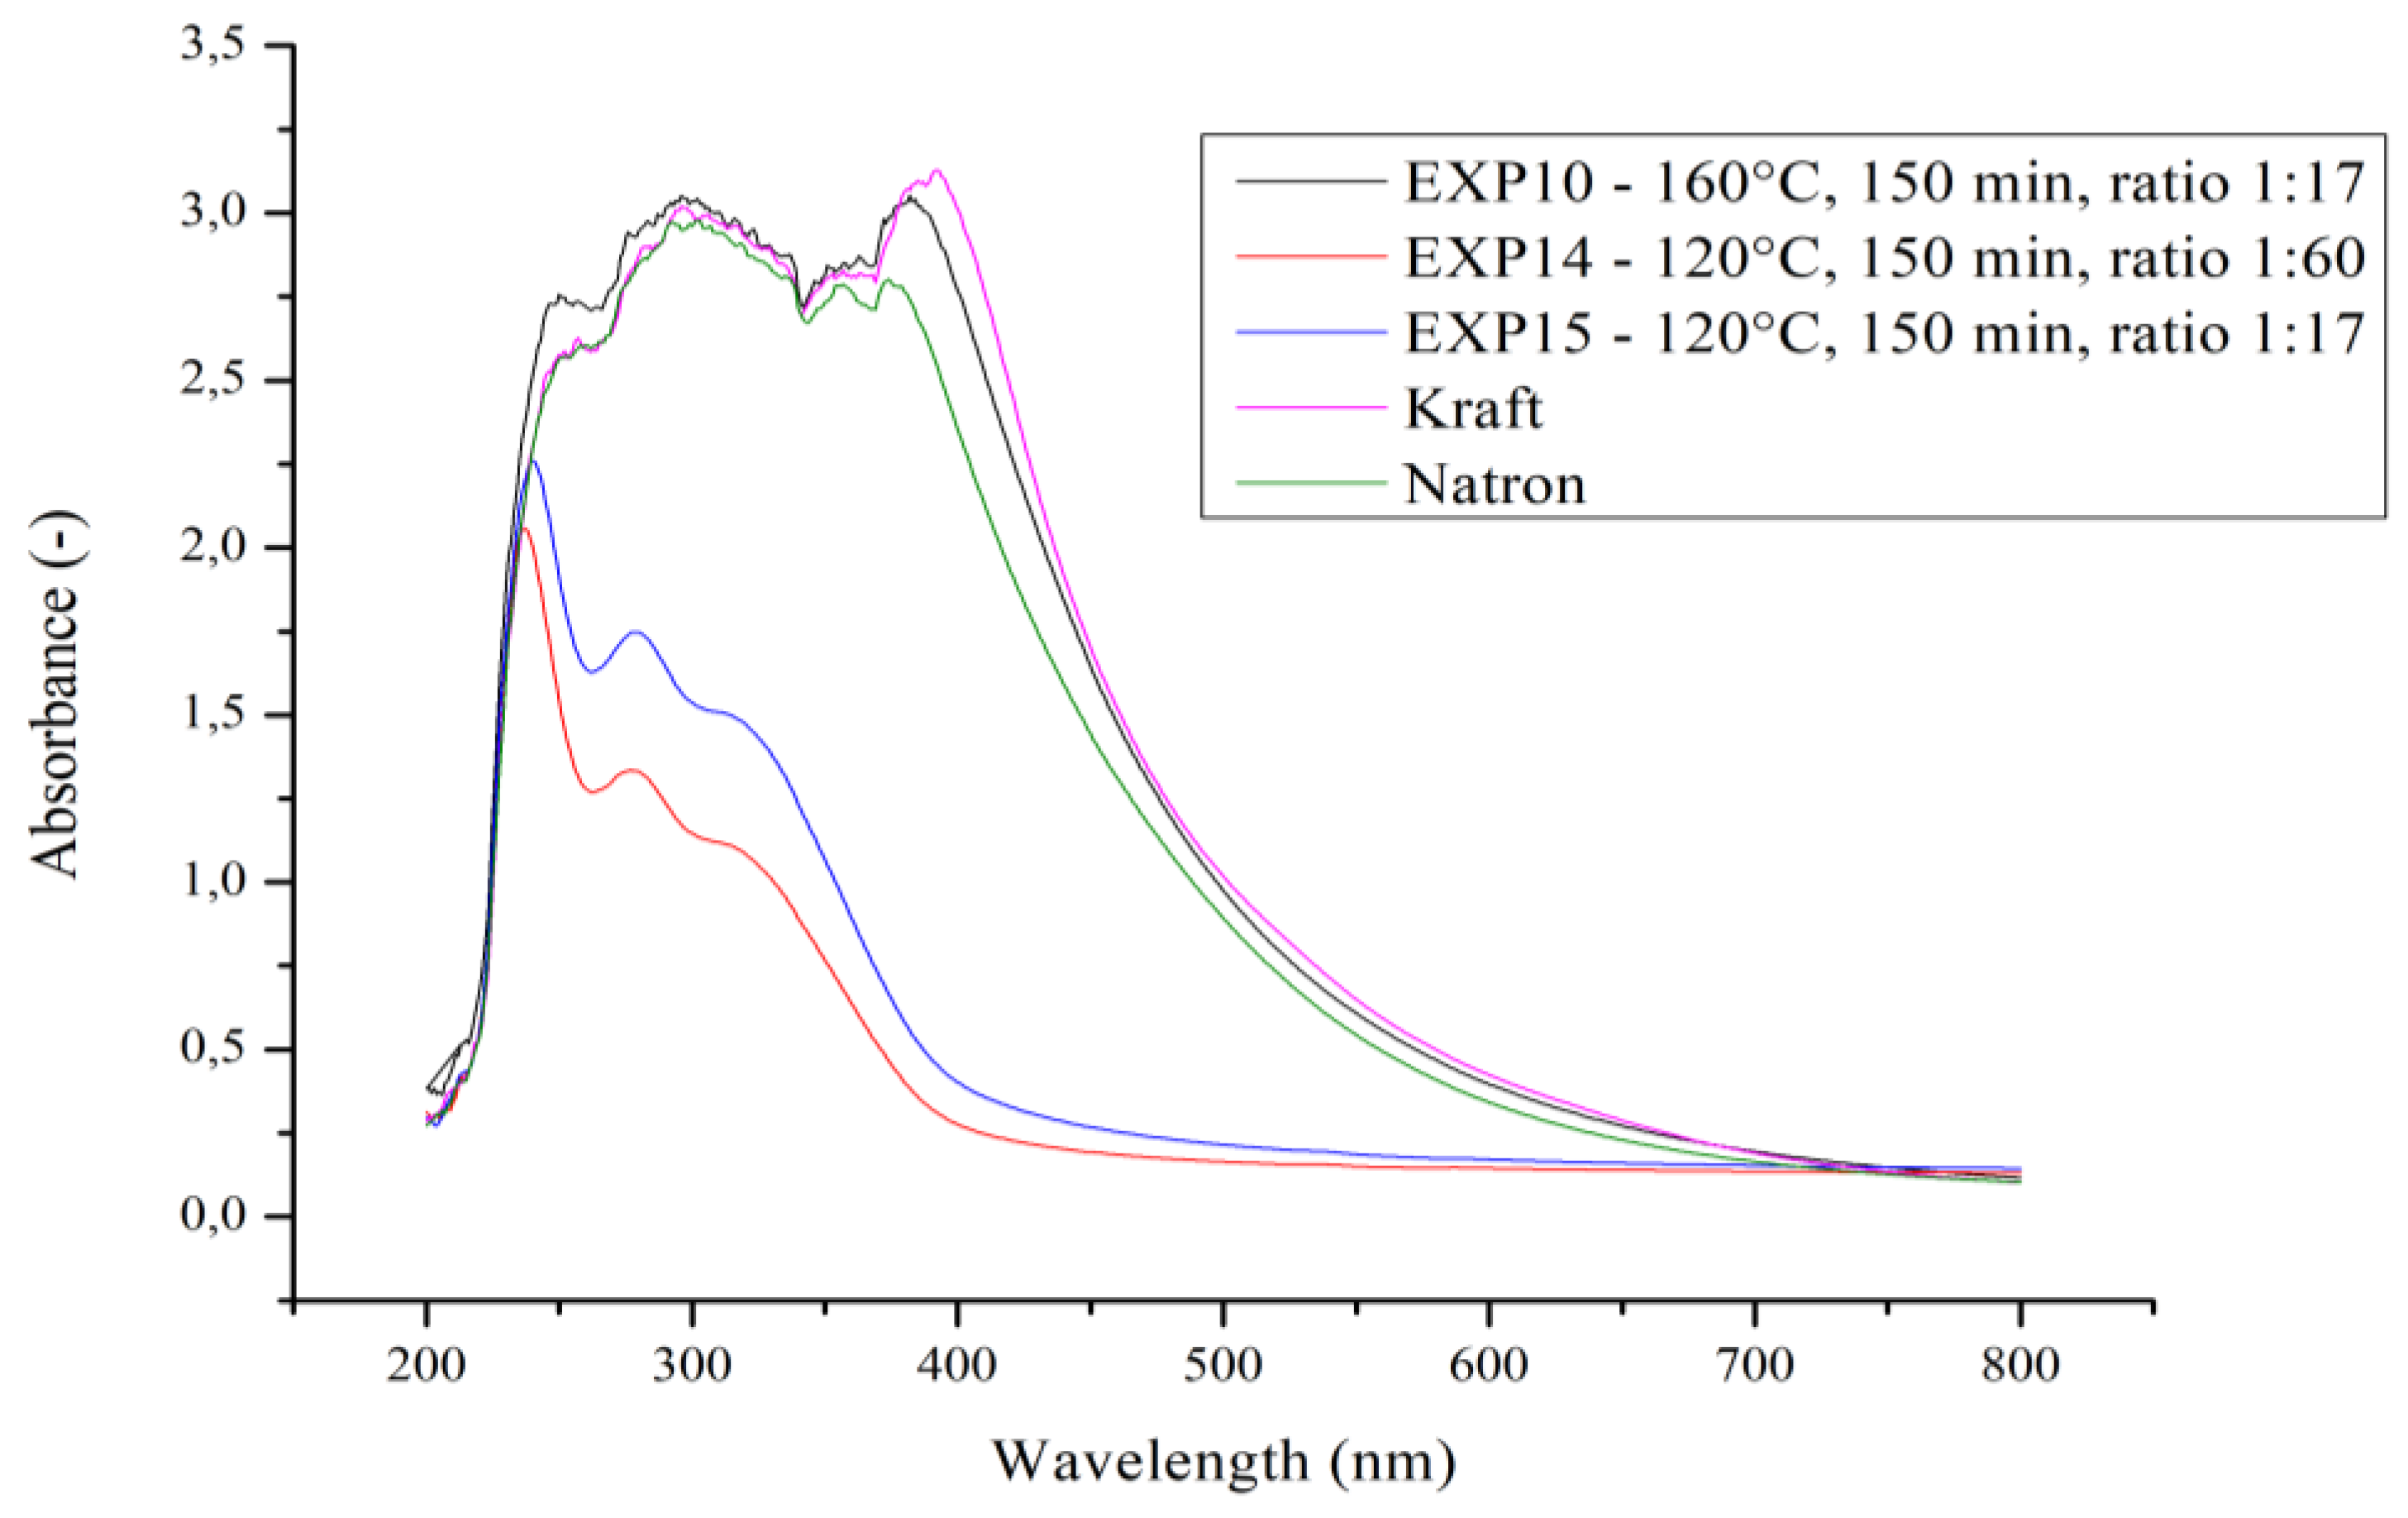
Another analysis to characterize the obtained pulps was UV–Vis spectroscopy where we spectrophotometrically determined brown fragments on the fiber surface. The obtained dependence of absorbance on wavelength is shown in
Figure 3, and we used the OriginPro 8.5 program for the evaluation. The lowest absorbance was obtained for sample 14, characterized by the lowest percentage of lignin with an absorbance value of 2.03 at a wavelength of 240 nm. In contrast, sample 10 with the highest percent lignin has an absorbance value as high as 2.72 at 245 nm. The highest absorbance values for all three samples are between 240 and 300 nm. This confirms the presence of lignin in the solution and hence on the original samples, since the absorption bands centered at 280 nm are attributed to lignin [
15]. As a reference sample, we chose lignin obtained by the natron and sulfate methods. Comparing the reference samples with our samples, we see that sample 10 is almost identical to the reference samples. This proves our hypothesis that the brown fragments from the fiber surface are indeed lignin.
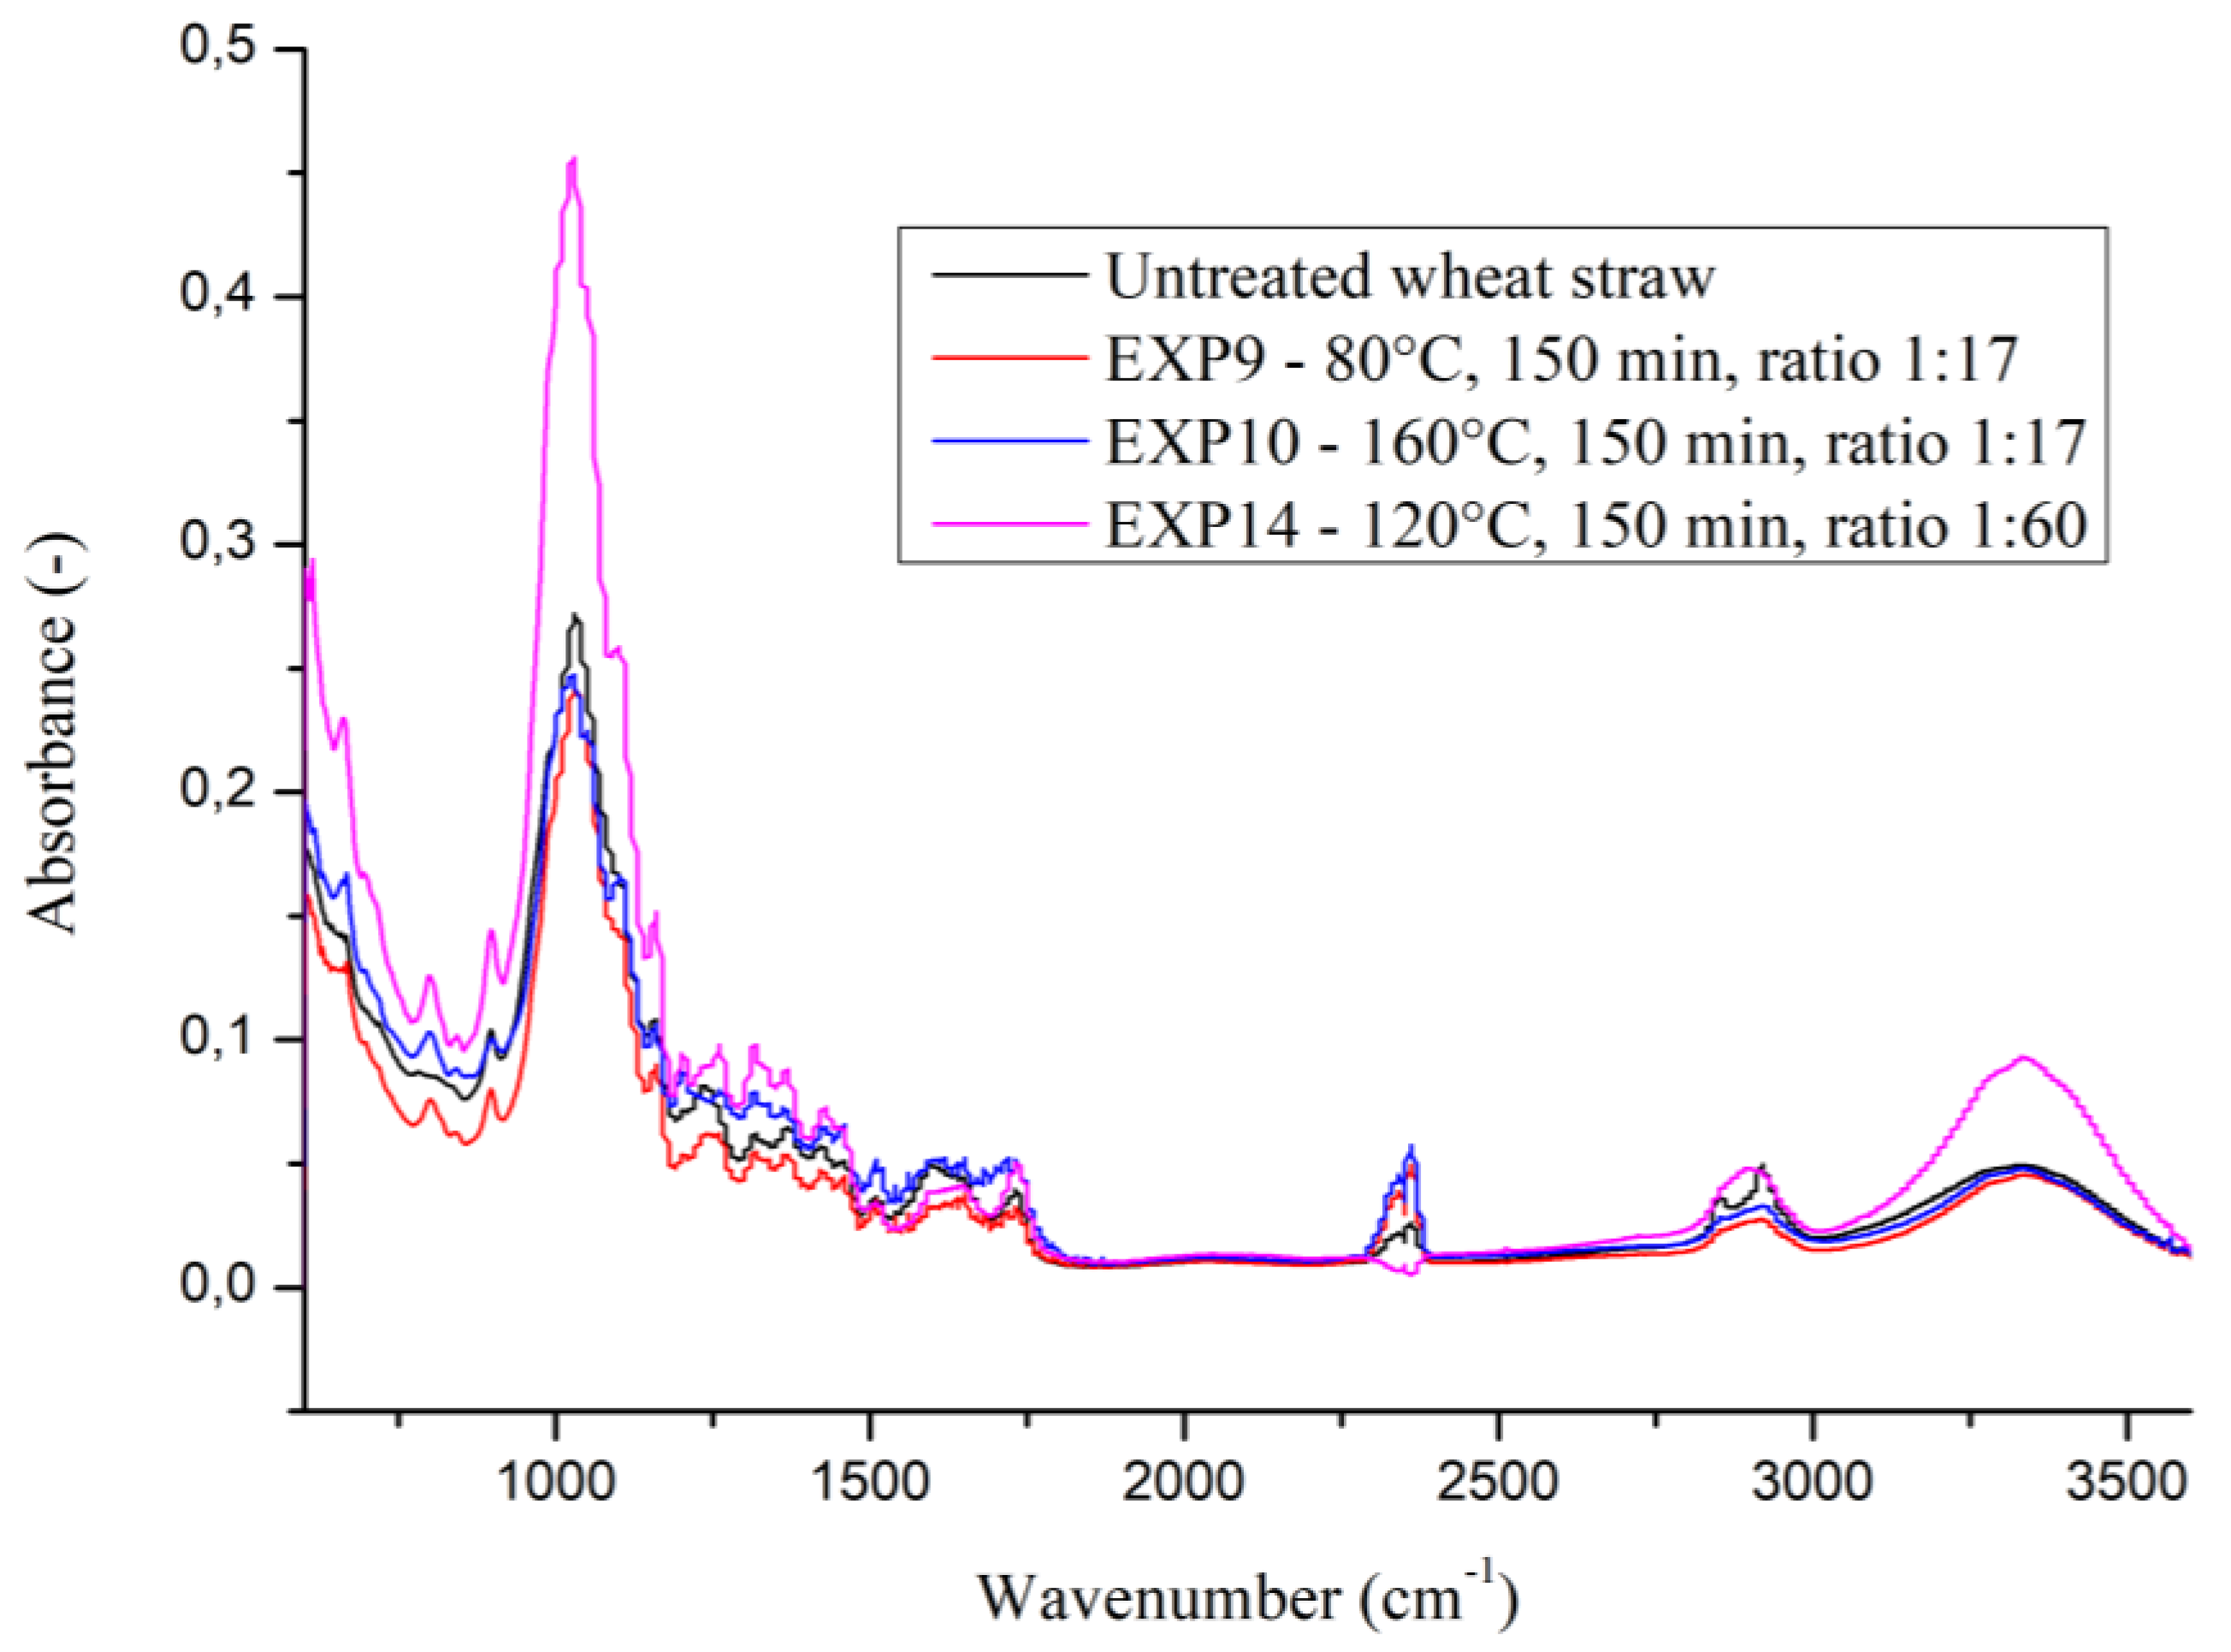
After characterizing the samples using UV–Vis analysis, we used FT-IR analysis. It is known from the literature that FT-IR is an important technique in the analysis of biomass and its structure, and subsequently in the characterization of changes in the structure of lignocellulosic materials as a result of various chemical and physical treatments. Pawlak-Kruzcek et al. [
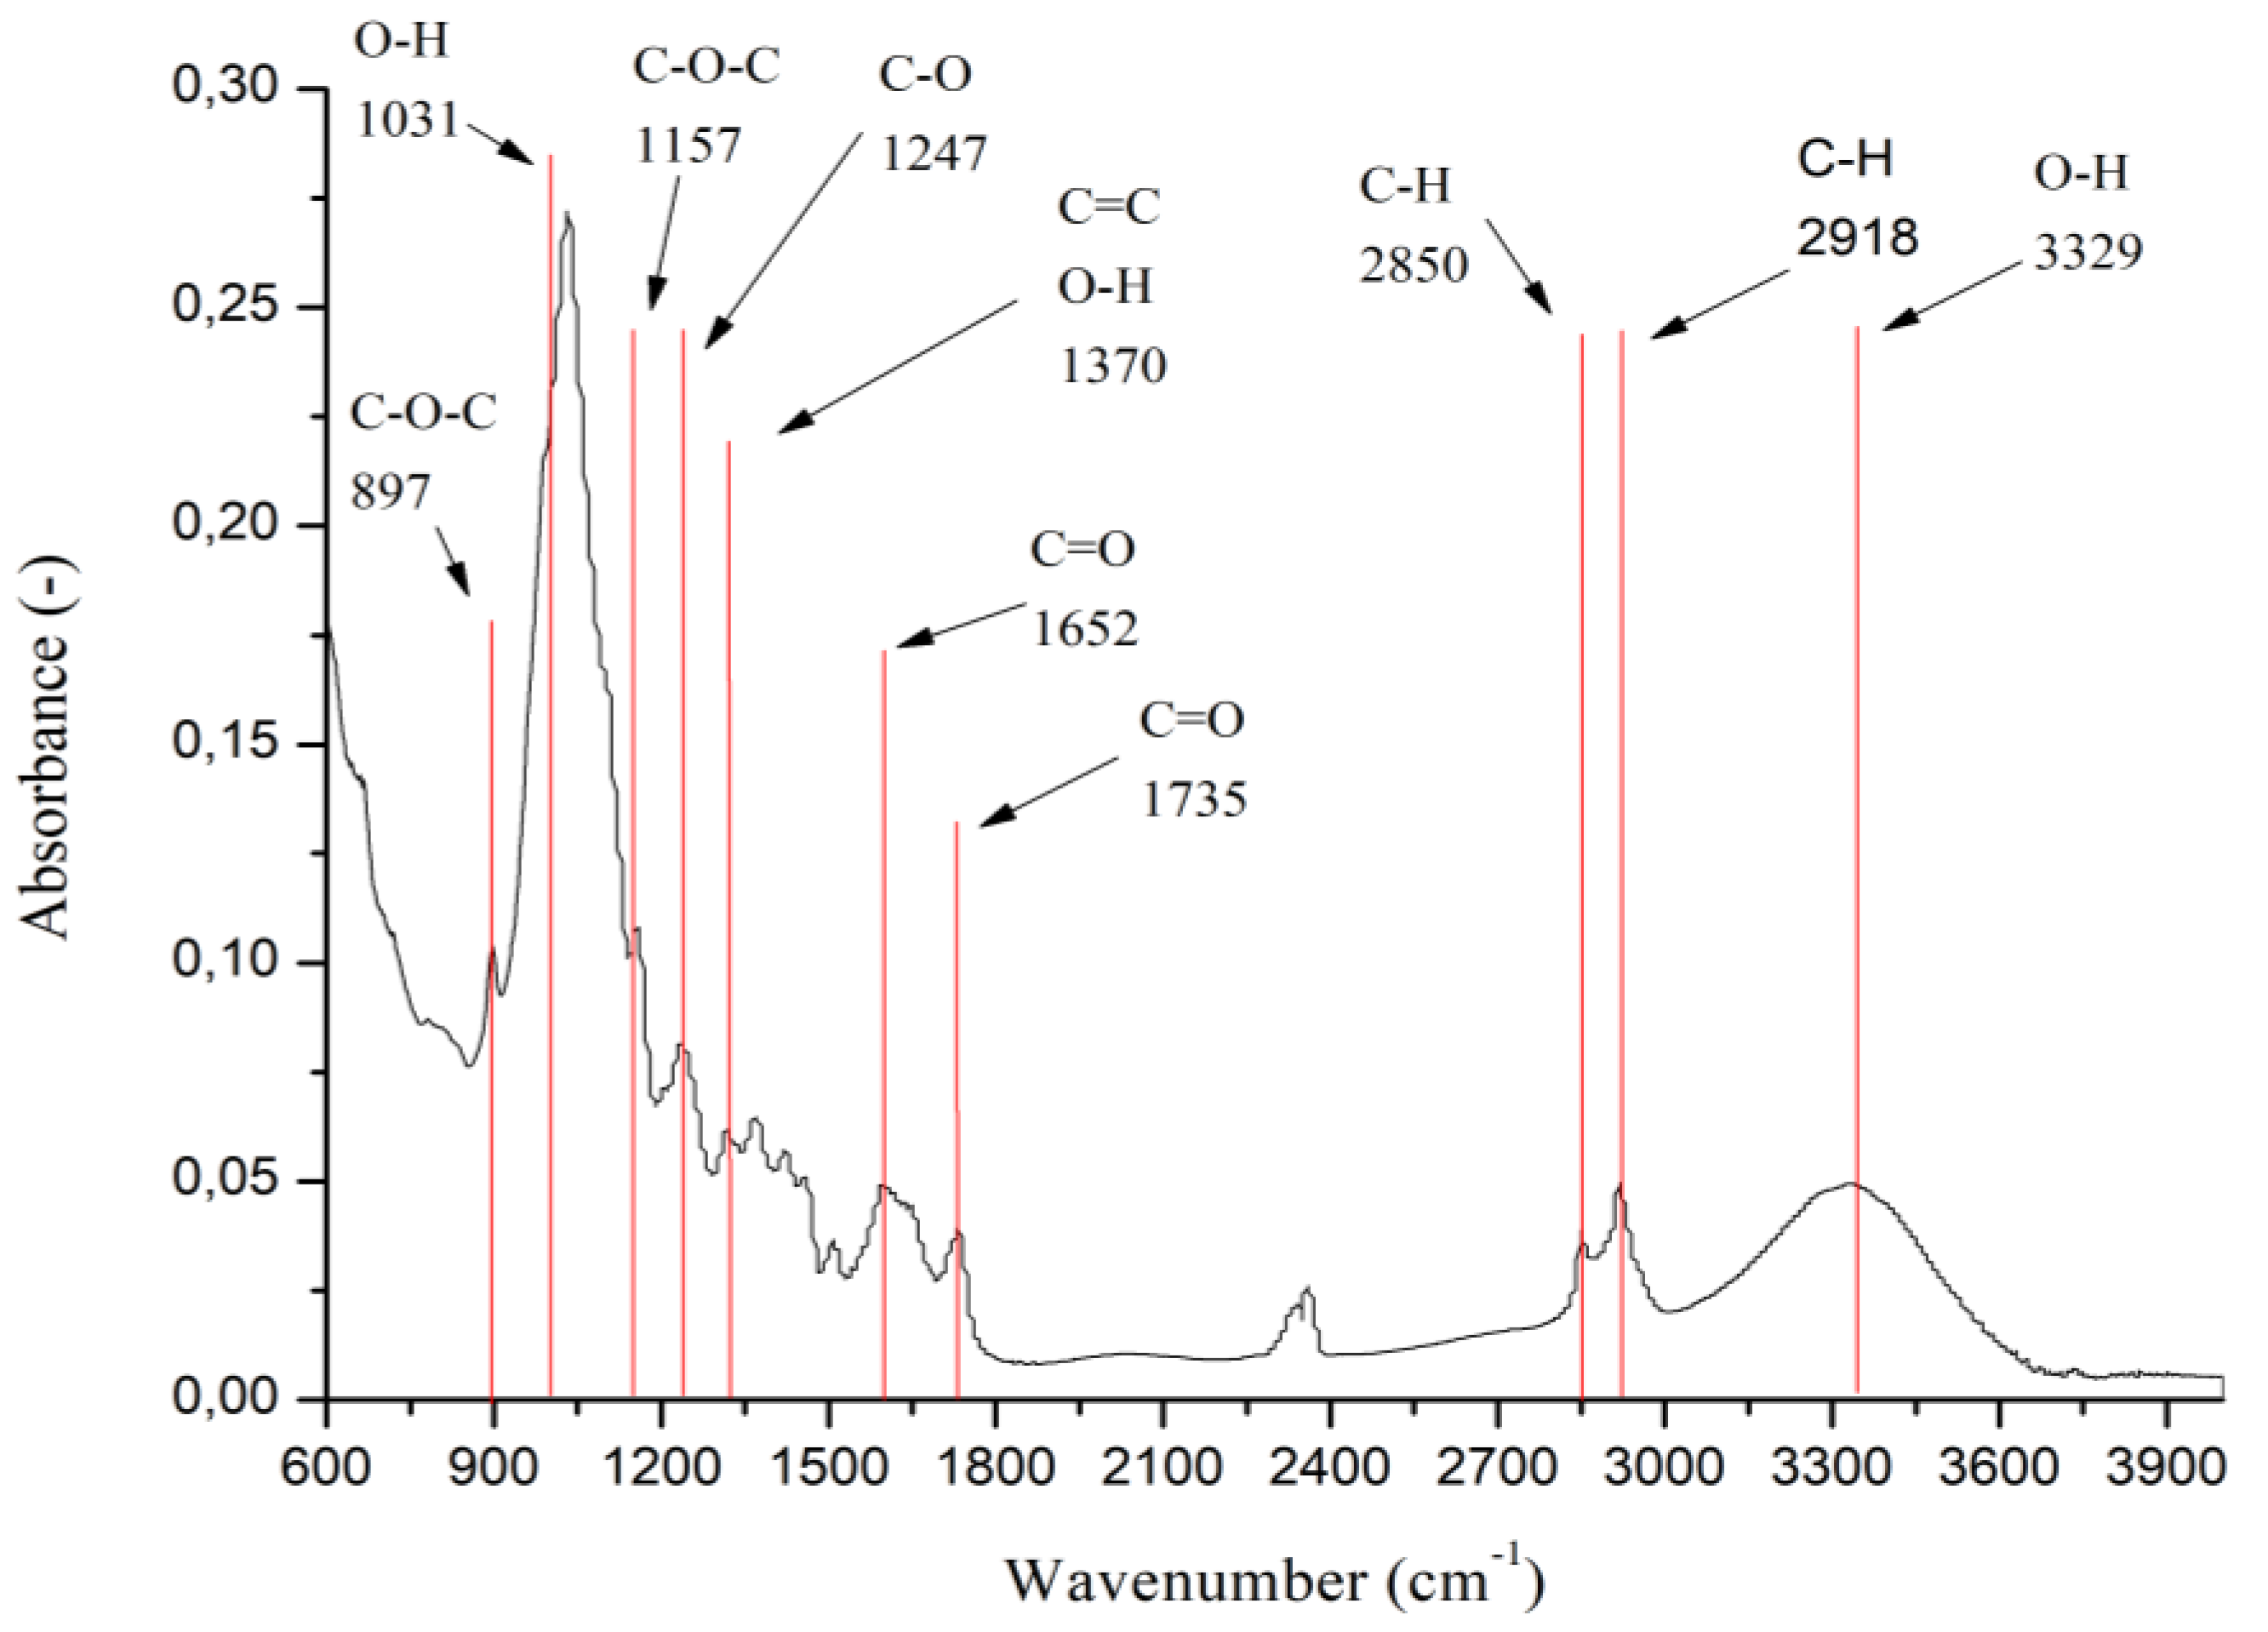
16] summarized the FT-IR bands and maximum values that were identified in various studies dealing with biomass and characterization of its structure. We used the obtained spectra to characterize the fibers in terms of changes in the functional groups of lignin, cellulose, and hemicelluloses after delignification. In
Figure 4, we displayed the obtained spectrum for our raw biomass—wheat straw. The area between 3100 and 3500 cm
−1 is due to the stretching of hydroxyl groups in holocellulose and lignin. Value 897 cm
−1 corresponds to β-glycosidic bonds in cellulose, which can be proven presence of increased cellulose content in samples after delignification [
15,
16,
17,
18,
19]. As it increases absorbance value at a wavelength of 897 cm
−1, thereby increasing the cellulose content in the sample. Values 1380 and 1320 cm
−1 correspond to the C=C bonds of the aromatic nucleus in lignin. Peaks at 1714 and 1654 cm
−1 correspond to conjugated and unconjugated carbonyl bonds. The stretching of the aromatic core in lignin is observed at peaks with the value 1595 and 1510 cm
−1. These signals describe the aromatic vibrations characteristic of lignin syringyl and guaiacyl type [
18,
19].
The comparison of samples 9 and 10 with the raw biomass is worth paying attention to. Sample 10 has almost the same absorbance values and sample 9 shows even lower absorbance values either at the values for lignin or cellulose. These two samples are characterized by temperature boundary parameters, where in the case of sample 9, we used a temperature of 80 °C, and for sample 10 a temperature of up to 160 °C. Comparing samples 10 and 14, for which we obtained the lowest and highest cellulose content, we see a clear difference in the peaks corresponding to cellulose. Sample 10 achieves an absorbance of only 0.27 and sample 14 achieves absorbance values up to 0.46 at a wavelength of 1055 cm
−1 (
Figure 5).
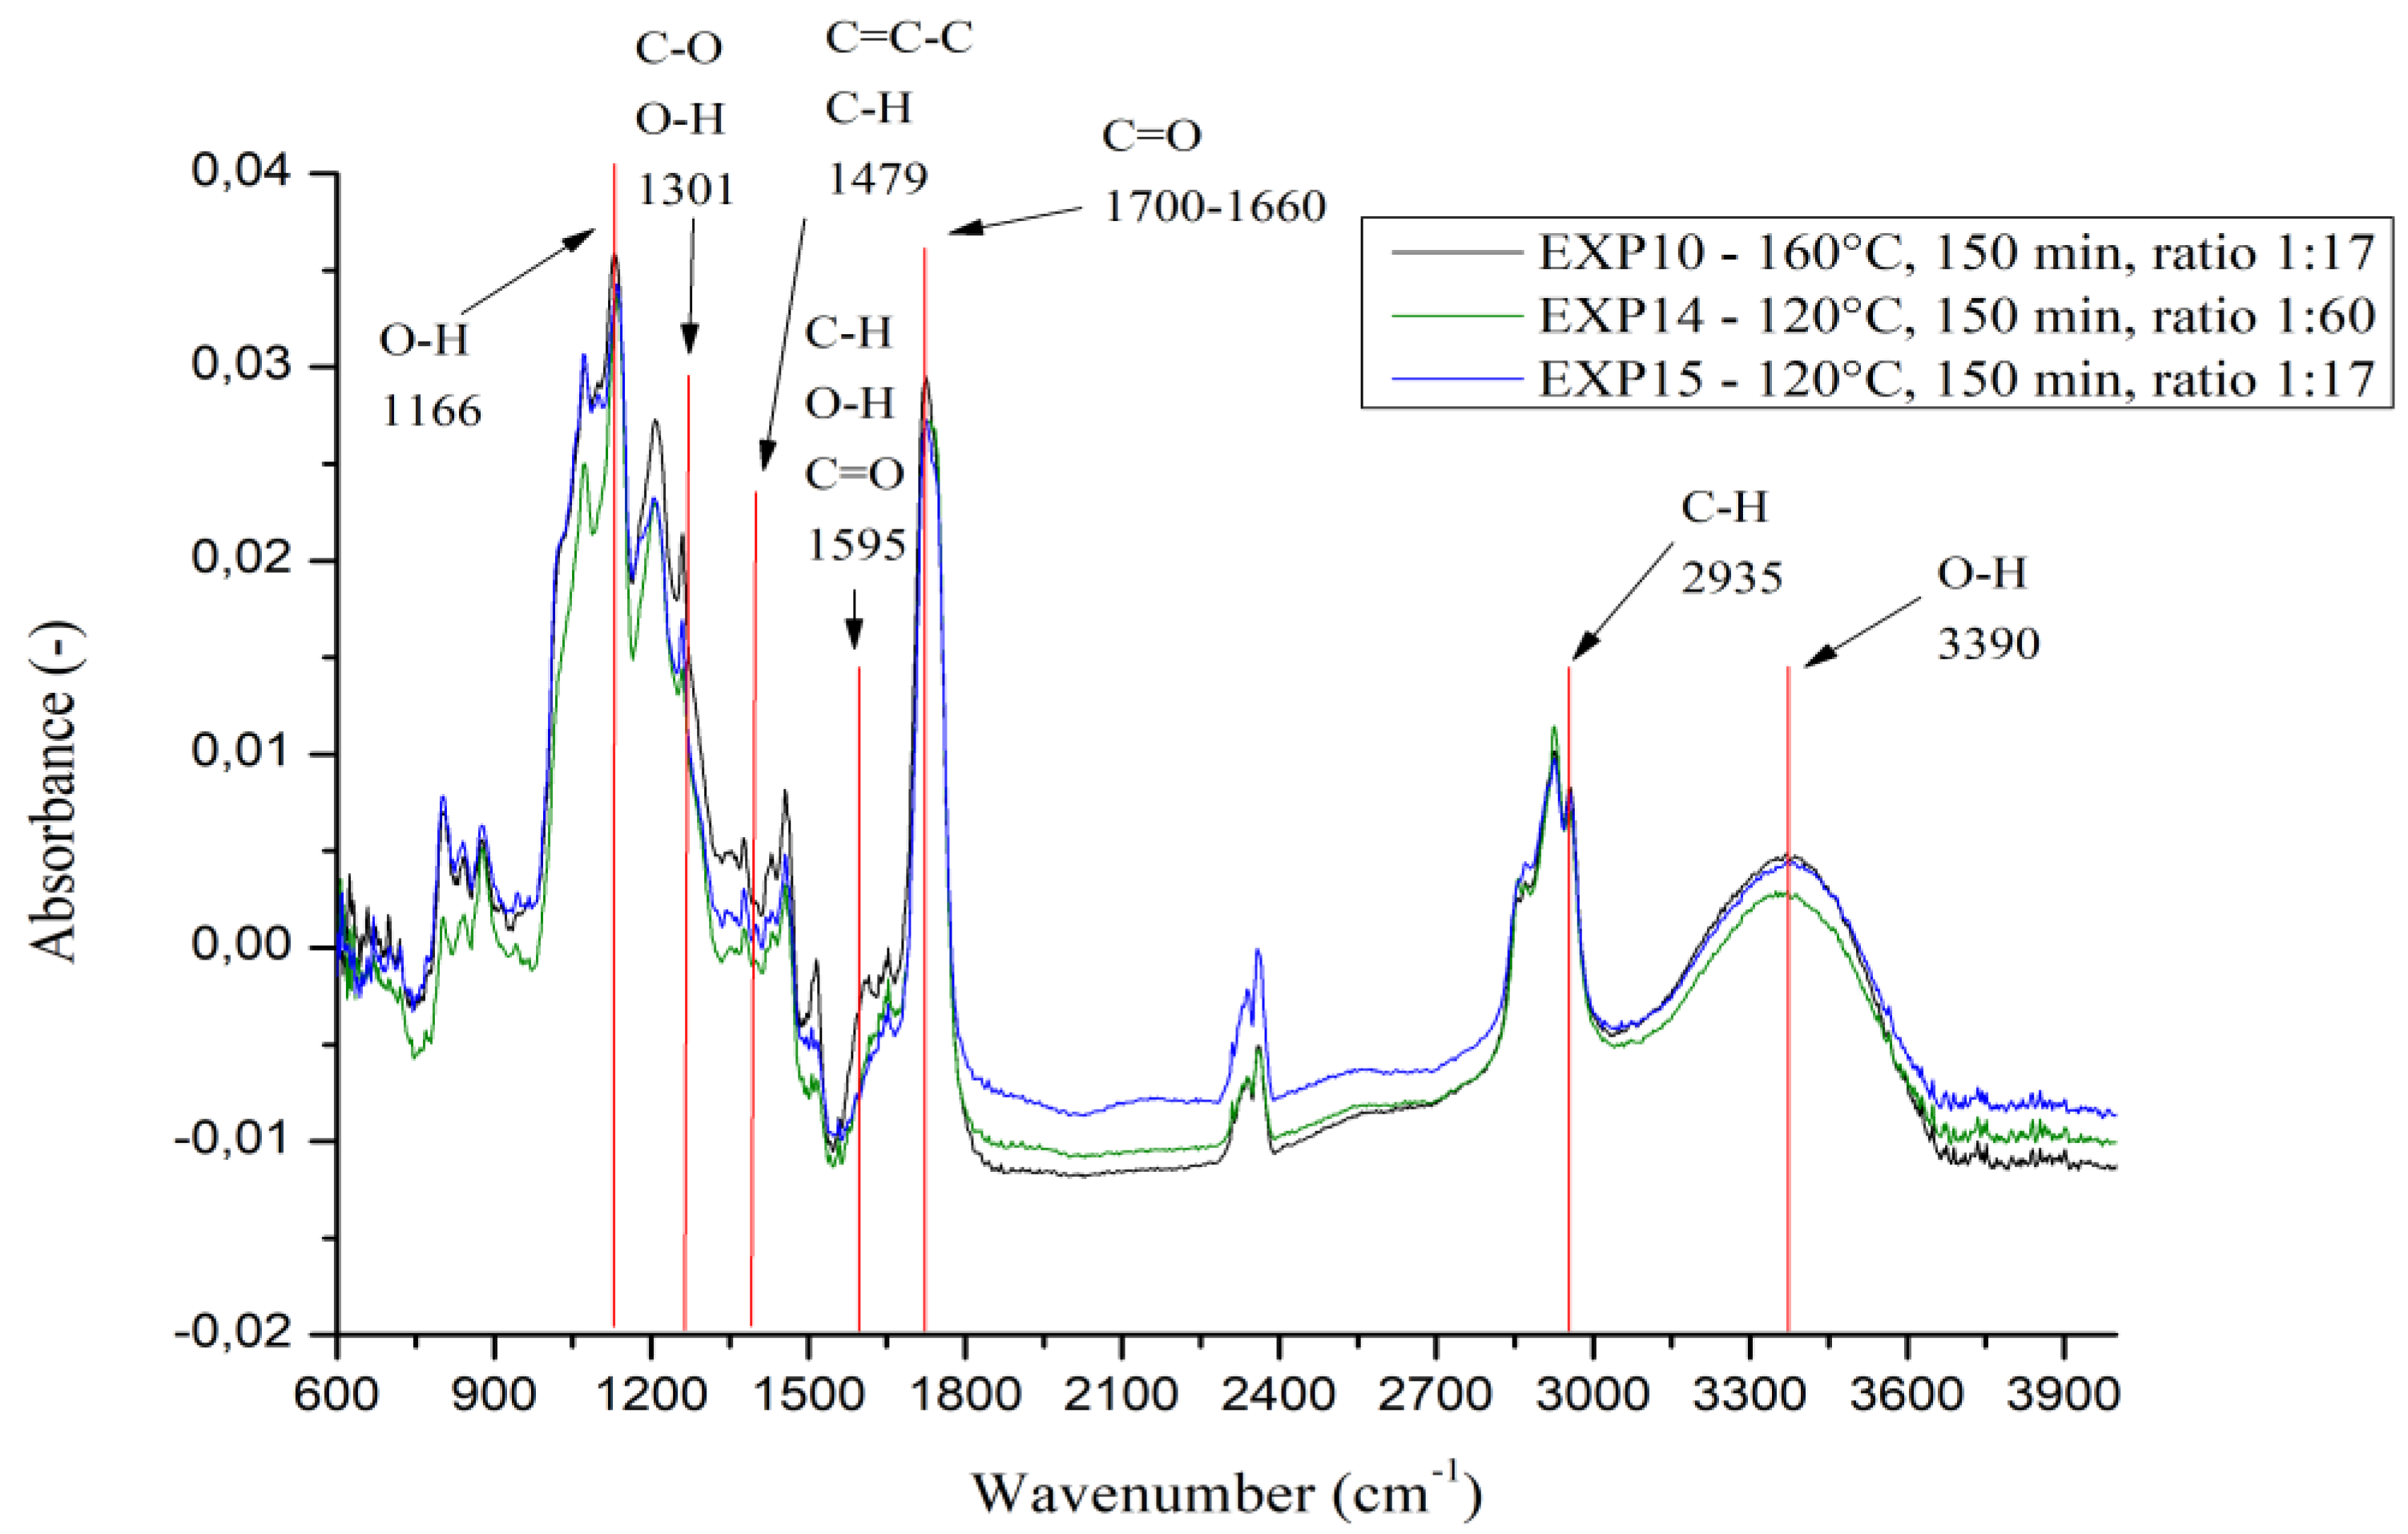
Subsequently, to further confirm our hypothesis, we left the dioxane solution with dissolved brown fragments to dry in the oven. After drying, we mixed the brown solid fraction with potassium bromide and measured the prepared samples by FT-IR analysis.
Figure 6 shows the obtained spectrum of lignin isolated by us from the fibers. In the given spectrum, peaks with relatively strong absorbance can be seen at wavenumbers of approximately 1100, 1700, 2900 and 3390 cm
−1. In 2023, Ivanova et al. [
17] addressed the characterization of alkali lignin, also using FT-IR analysis. The functional group belonging to the 3390 cm
−1 wavenumbers a hydroxyl group of phenolics that belongs to lignin. At the same time, we observe almost the same character of the spectrum at a wavenumber of 2935 cm
−1 which is characteristic of the vibration of the C-H groups [
17]. A slight increase in absorbance at 1595 cm
−1 also confirms the presence of lignin, since this wavenumber is characteristic of the C-H, C=O and O-H vibrations of the aromatic nuclei. High absorbance at 1166 cm
−1 is further evidence of the presence of lignin as it is attributed to the presence of guaiacyl, which is one of the monolignols from which the substructures of phenol are formed [
17]. At the same time, the wavenumber of 1301 cm
−1 is attributed to the functional groups of guaiacyl, but also to the O-H groups of phenolic and non-ether bonds [
17]. In contrast, the 1234 cm
−1 wavenumber is characteristic for the functional groups of syringyl, which also belongs to the monolignol-forming substructures phenolic subunits like guaiacyl [
17] Interval 1130–1160 cm
−1 is typical for O-H bonds of secondary alcohols and condensed aromatic nuclei [
17].
Using FT-IR analysis, we also compared the isolated lignin from the leachates after delignification. We chose samples 2, 4, 10 and 14 for comparison. The amount of C=C bonds belonging to lignin at a wavenumber of 1380 cm
−1 in sample 10 differs rapidly compared to the other three samples [
18,
19]. This smaller amount of lignin isolated from the leachate could be explained by the adsorption of lignin on the fibers during delignification, thus suggesting a lower lignin content in the leachate.
Subsequently, we compared the isolated lignin from the leachate with the lignin obtained from the fibers (
Figure 6). Observing the absorbance at a wavenumber of 897 cm
−1 and 1055 cm
−1 characteristic for cellulose, we see smaller values compared to the original biomass [
19]. We observe the same at a wavelength of 1247 cm
−1. Comparing the absorbance of lignin, we see only slight differences, but the largest difference can be observed at a wavenumber of 1700 cm
−1 characteristic of the vibration of C=O bonds in COOH functional groups. The absorbance values for lignin isolated from the fibers are considerably lower compared to lignin isolated directly from the leachate; however, by comparing the peaks for the functional group characteristic of lignin, we see that lignin is obtained in both cases, just in different amounts. This also confirms our hypothesis of lignin being adsorbed back onto the surface of the fibers. Additionally, thanks to this method together with the previous methods we were able to confirm our hypothesis of re-adsorbed lignin on the fiber surface. Other results can be found in the
Supplementary Material of this article (Table S9).
3.3. Comparison of Obtained Results with Others Delignification Processes
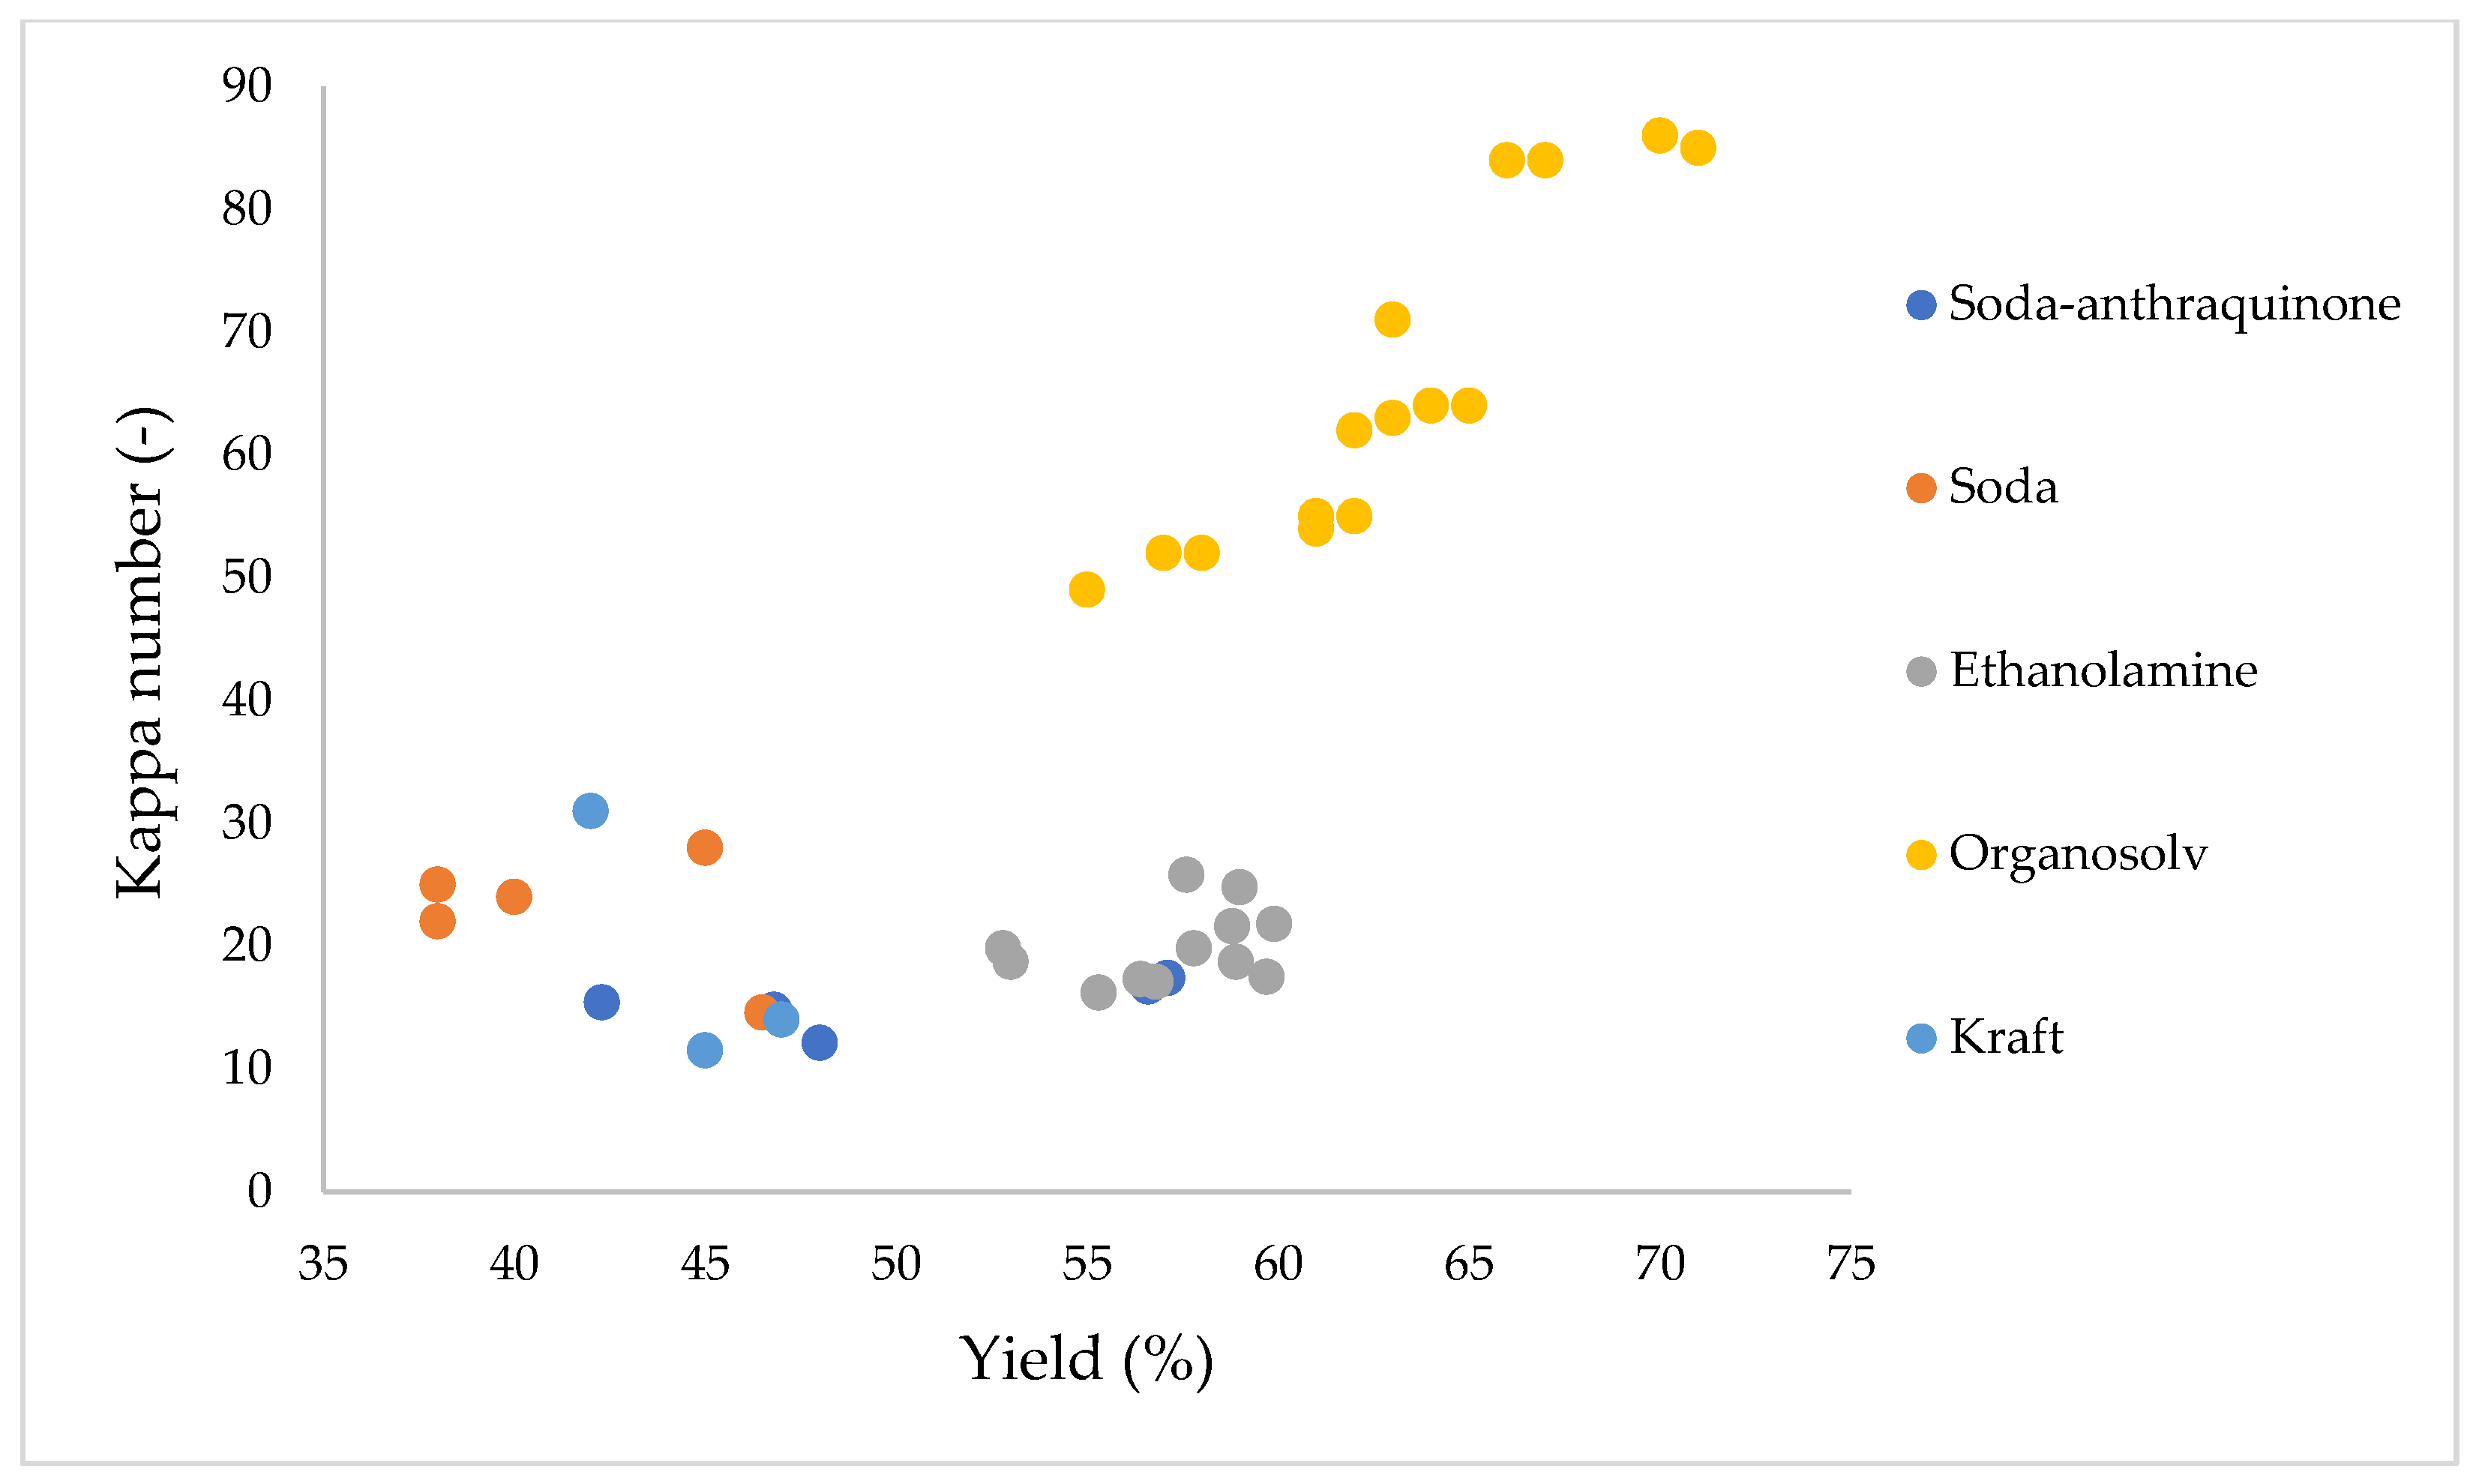
Our next step in this work was to compare the results we obtained with those of other studies that also delignified wheat straw. As a first step, we focused on comparing delignification of wheat straw using conventional solvents. In
Figure 7 we can see how the Kappa number changes when delignified with different processes—soda process, soda-anthraquinone process, Kraft process, organosolv process or delignification with ethanolamine.
The aim of delignification is to obtain the smallest possible Kappa number, since this number represents the amount of lignin removed. The soda, Kraft, and soda-anthraquinone processes give us approximately the same Kappa numbers at yields ranging from 38 to 57.1%. For example, compared to soda process, we see that delignification with ethanolamine yields approximately the same pulp Kappa number, but their yields are significantly different. For the soda process, the yields are approximately between 38 and 46.5%, and with ethanolamine the yields are as high as 52.8–59.7%. Saberikah et al. in 2011 [
22] delignified wheat straw with aqueous glycerol solution at different times. The pulp obtained in this way reached a Kappa number of 49–86, which is higher than that of other methods. At the same time, using the organosolv process, the highest yields were obtained, ranging between 55 and 70%. As can be seen from
Figure 6, the results obtained in the delignification of wheat straw depend not only on the nature of the fibers used, but also on the type of process used, time, temperature, or the presence of a catalyst.
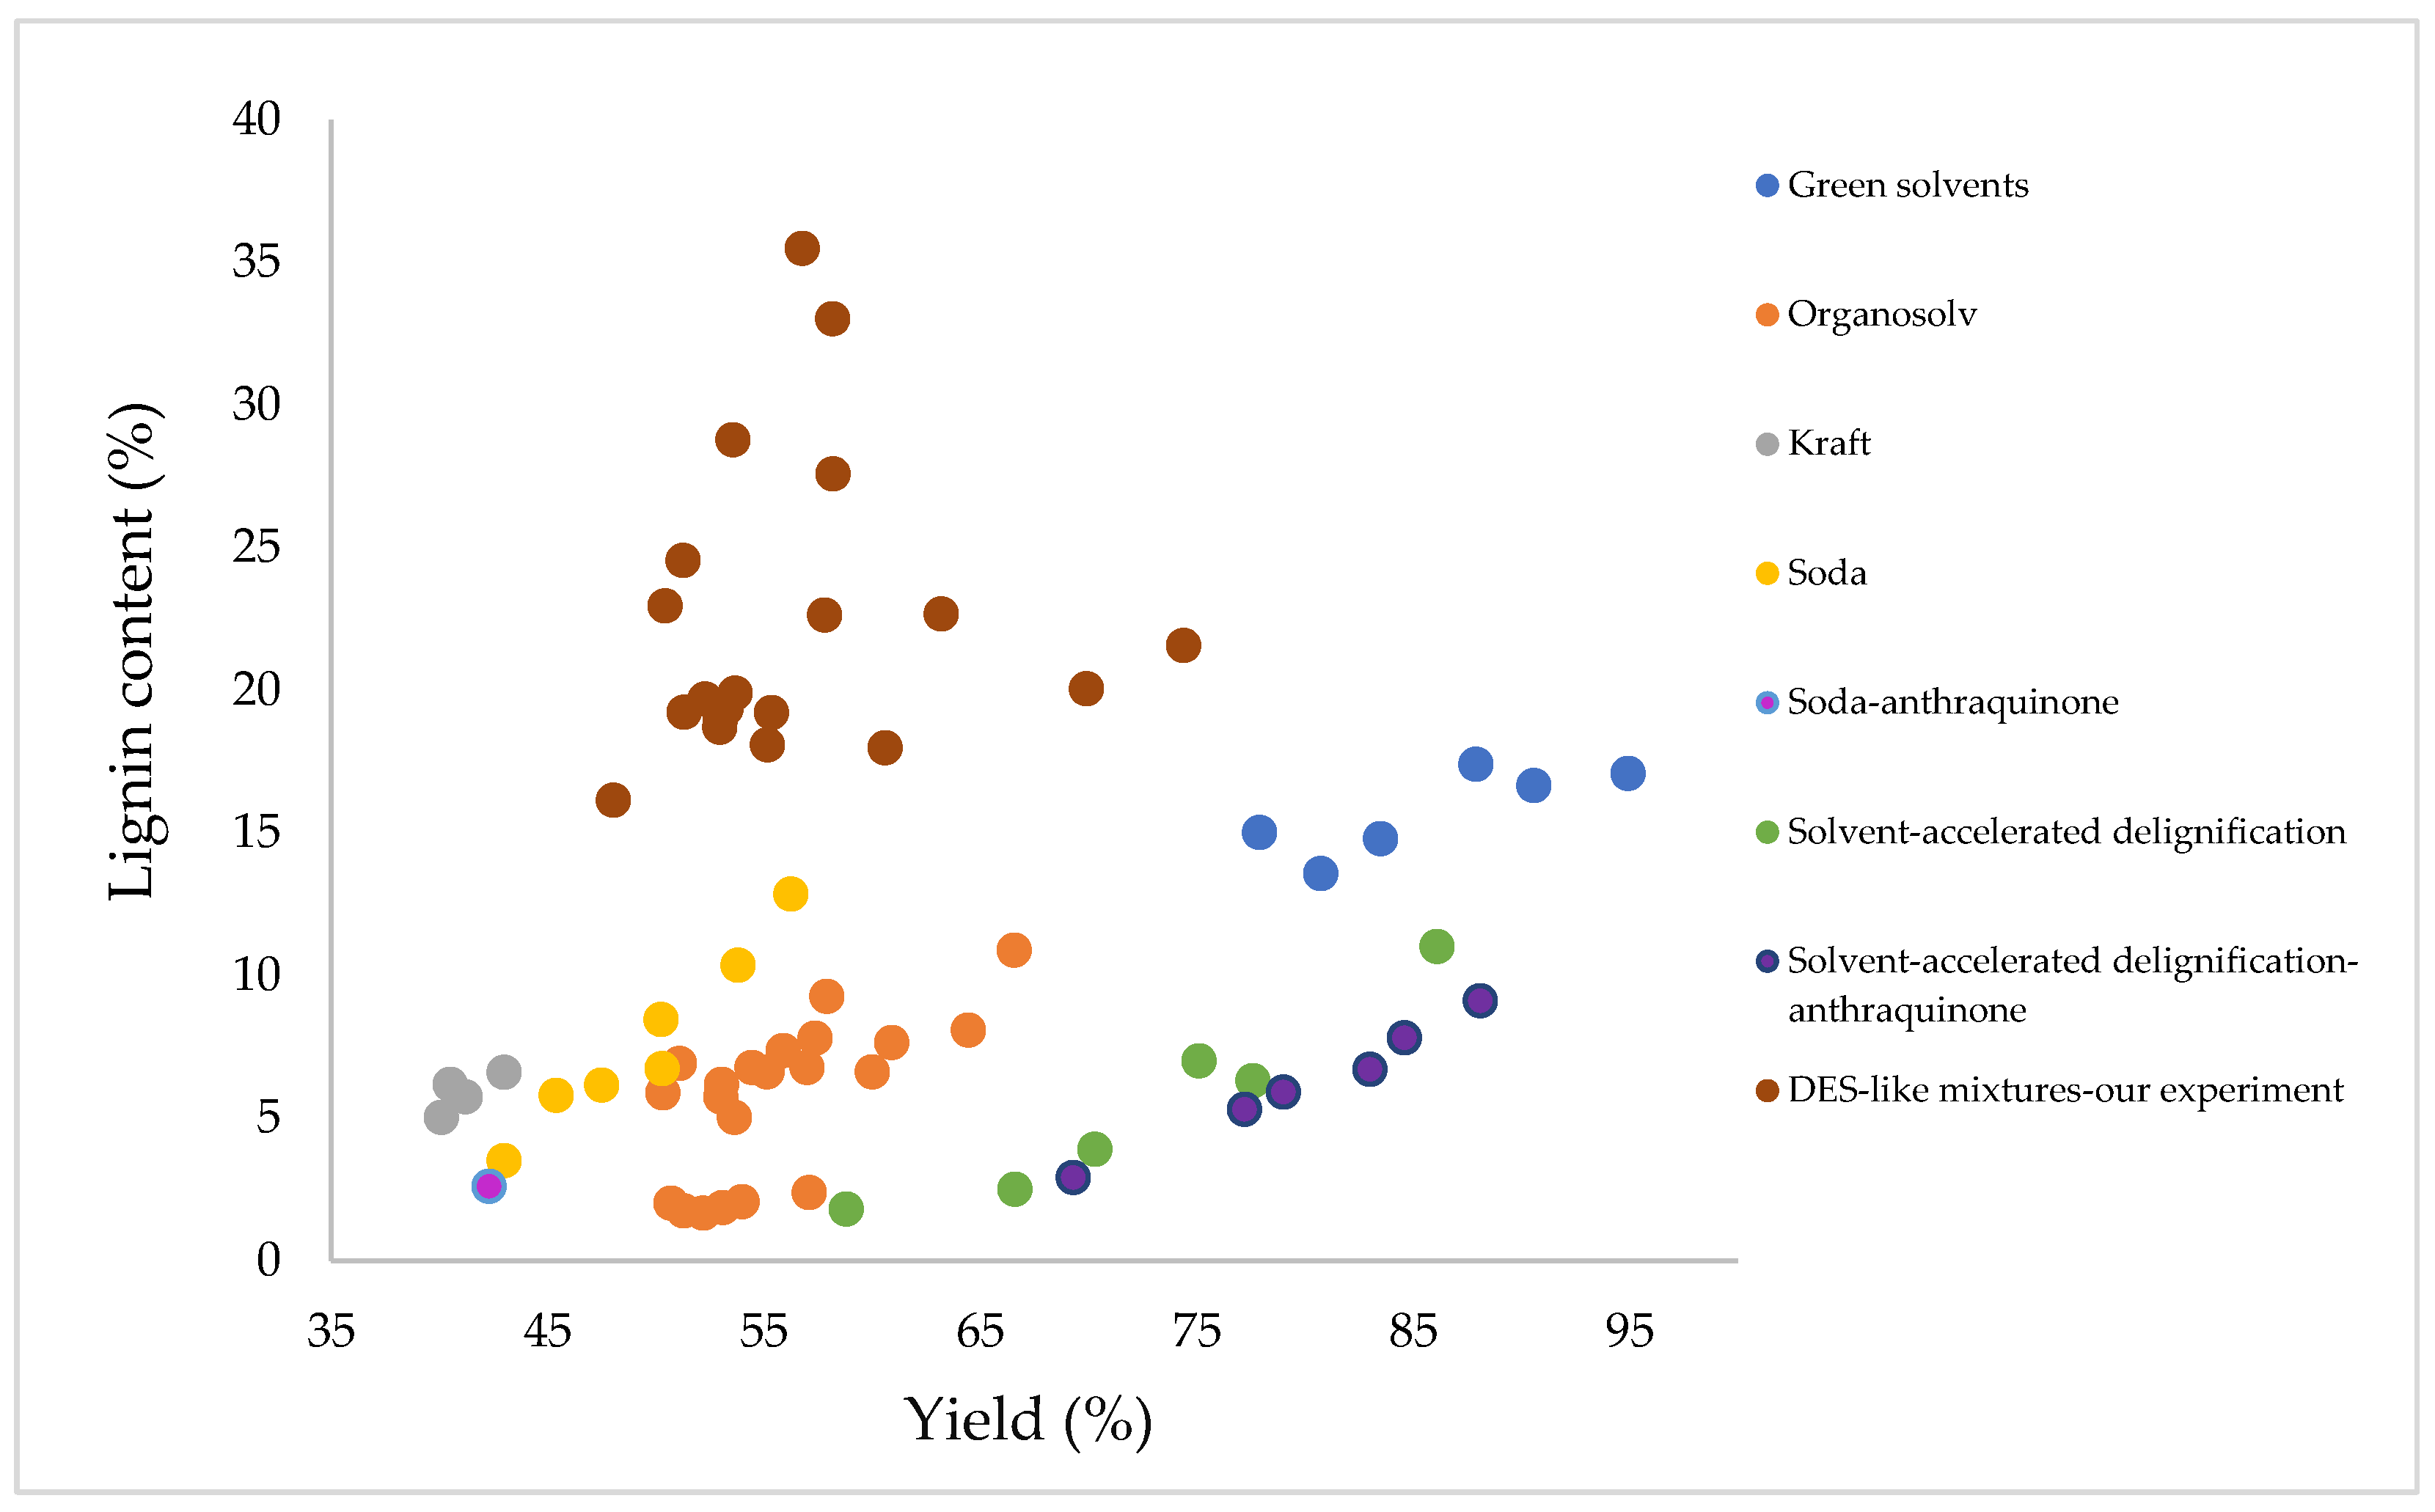
The next step was to conduct a literature search in terms of the resulting lignin content in wheat straw after delignification from yield using different solvents. Contents of lignin as well as yields differ when different delignification solvents are used, as can be seen on
Figure 8. Yields range from 40.1 to 94.93% and lignin content ranges from 1.66 to 17.4%. The lowest lignin contents are achieved with organosolv delignification, ASD (solvent-accelerated delignification) and ASD-anthraquinone by delignification or when using soda and soda-anthraquinone process. In 2007, Ziaie-Shirkolaee et al. [
24] obtained pulp after delignification by the Kraft process with a yield of 40.5–43% at a lignin content of only 5.01–6.6%. In contrast, pulp was obtained during delignification using the organosolv method with a yield of up to 50.33–66.56%, but with a higher lignin content, which was in the range of 5.01–10.88% [
24]. Similarly, the addition of anthraquinone to the solvent affects lignin content, with lower lignin content achieved in its presence.
Furthermore, we compared our results with those obtained in other studies. Our achieved pulp yields after delignification ranged from 48.05% to 74.39%. This means that we obtained higher yields compared to processes such as Kraft, soda, or soda-anthraquinone. However, the lignin content in our samples after delignification significantly differs, with values ranging from 16.13% to 35.49%. When comparing our results with conventional solvents, we observe a noticeable difference. Our yields are approximately the same as those obtained in the soda and organosolv processes, but the resulting lignin contents are significantly higher. Comparing with the Kraft process, our lignin content in the samples is about four to five times higher, while our yield is roughly 1.5 times higher. When comparing our results with those obtained with green solvents, we find that our yields are lower. Green solvent yields range from 80.74% to 94.93%, which is significantly higher than our yields. However, we observe higher lignin content in our samples, ranging from 16.13% to 35.49%, which is much higher compared to other green solvents.
In summary, the results obtained during the delignification of wheat straw depend on various factors such as the type of solvent, process conditions, and the presence of additives. Solvents resembling DES-like mixtures represent an alternative to delignifying lignocellulosic biomass using conventional chemical treatments. The development and study of new ecological green solvents are advancing due to the increasing demand for green technologies and research in green chemistry. Green solvents, including DES-like mixtures, are expected to have low toxicity for both humans and the environment, be biodegradable, and offer the possibility of regeneration. However, the application and recycling of DES-like mixtures are limited by their thermal instability and susceptibility to contaminants that could interfere with interactions between hydrogen bond acceptors and hydrogen bond donors. Research is needed to develop stable and recyclable DES-like mixtures systems, especially for conversions requiring elevated temperatures. The broad range of combinations of hydrogen bond acceptors and hydrogen bond donors in DES-like mixtures, and biomass complicates the selection of suitable DES-like mixtures for biomass pretreatment. The effect of acidity/alkalinity is significant in the application of solvents and systems for various applications and affects the chemical reactions that take place. This fact has a fundamental impact on the different selectivity, efficiency, and behaviour of solvent systems after their application in various areas—fractionation of biomass, catalytic reactions, dissolution of substances, and adsorption of substances. Understanding the basic mechanism between DES-like mixtures and biomass is key to effectively utilizing DES-like mixtures for biomass pretreatment [
26].


