Article

Long-Term Assessment of Bioclimatic Conditions at Micro and Local Scales in the Cities of the Western Part of the Balkan Peninsula during the 21st Century

1
Department of Geography, Tourism and Hotel Management, Faculty of Sciences, University of Novi Sad, 21000 Novi Sad, Serbia
2
Department of Geography, Faculty of Arts, University of Ljubljana, 1000 Ljubljana, Slovenia
3
Meteorology and Air Quality Group, Hydrology and Environmental Hydraulics Group, Wageningen University & Research, 6708 PB Wageningen, The Netherlands
4
Department of Geophysics, Faculty of Science, University of Zagreb, 10000 Zagreb, Croatia
5
Geographical Institute “Jovan Cvijić”, Serbian Academy of Science and Arts, 11000 Belgrade, Serbia
6
Department of Geography, Faculty of Philosophy, University of East Sarajevo, 71123 East Sarajevo, Bosnia and Herzegovina
7
Faculty of Geography, University of Belgrade, 11000 Belgrade, Serbia
8
Department of Spatial Planning, Faculty of Sciences, University of Banja Luka, 78000 Banja Luka, Bosnia and Herzegovina
9
Institute of Hydrometeorology and Seismology, 81000 Podgorica, Montenegro
10
Faculty of Tourism, Mediterranean University Podgorica, 81000 Podgorica, Montenegro
*
Author to whom correspondence should be addressed.
Sustainability 2023, 15(21), 15286; https://doi.org/10.3390/su152115286
Submission received: 3 October 2023 / Revised: 23 October 2023 / Accepted: 24 October 2023 / Published: 25 October 2023
(This article belongs to the Special Issue Urban Microclimate Monitoring, Mitigation and Adaptation)

Abstract

:
Thermal comfort assessments at local or micro-scales within urban areas can provide crucial insights for the urban adaptation strategies pertaining to climate-conscious urban planning and public health. However, the availability of long-term or mid-term daily or hourly meteorological data sets from urban environments remains a significant challenge even in the 21st century. Consequently, this study aimed to assess the thermal conditions in cities across the western part of the Balkan Peninsula, encompassing five countries (Slovenia, Croatia, Serbia, Bosnia and Herzegovina, and Montenegro), by utilizing the Physiological Equivalent Temperature (PET) index. Meteorological data sets, comprising air temperature, relative humidity, wind speed, and cloudiness, were collected from 32 national meteorological stations/measurement locations spanning the period from 2001 to 2020. The PET calculations were conducted based on meteorological data measured three times per day (7 a.m., 2 p.m., and 9 p.m.). Upon conducting a spatial analysis of the meteorological stations, it was observed that most of them (25 stations) were situated within built-up areas or urban suburbs, rendering them highly relevant for local or micro-scale climate and bioclimate assessments. The findings revealed that urban locations exhibited slightly higher PET heat stress levels, particularly during the summer season and at 2 p.m. Moreover, higher average PET values were observed in both urban and non-urban stations situated within a continental climate during warmer periods, such as summer. In contrast, during the colder seasons, namely winter and spring, higher PET values were prevalent in the Mediterranean region. Furthermore, the PET frequency analysis revealed a greater prevalence of extreme and severe heat stress levels in stations within continental climates, particularly those located in urban areas, as compared to stations in Mediterranean climates. In contrast, during the winter and spring seasons, monitoring stations in close proximity to the Adriatic Sea, characterized by a Mediterranean climate, exhibited significantly lower levels of cold stress compared to inland stations. Evidently, in addition to the climatic characteristics and surrounding terrain, the urban morphology significantly impacts the thermal conditions within cities.

1. Introduction

Thermal comfort can be defined as subjective contentment with thermal environmental conditions and can directly affect humans, animals, and plants. Thermal comfort can be divided into indoor and outdoor spaces. Outdoor thermal comfort (OTC) is highly influenced by climate and surface variations in the environment, as well as the subjective perception of individuals [1,2,3].
According to the IPCC report [4], the global surface temperature has increased by 0.99 °C comparing the periods 1850–1900 and 2001–2020, and by 1.09 °C comparing the periods 1850–1900 and 2011–2020. This means that the upward temperature trend is consistently growing with each decade, triggering more frequent and intense extreme thermal events in most land regions since the 1950s [4,5]. The trend has continued in recent years. Based on land surface temperatures in Europe for 2022, the temperature anomaly was 1.83 °C (relative to the 1961–1990 average), and the annual average temperature fell between the second and fourth highest on record [6]. Over the last twelve months (from October 2022 to September 2023), the average land surface temperature in Europe was 0.46 °C higher when compared to the period from 1991–2000 [7]. Parallel to global thermal amplification, intense urbanization has been observed in recent decades. Due to the ongoing urbanization trend, urban areas in different income countries are projected to experience significant growth. Specifically, urban areas will increase by 141% in low-income countries, by 44% in lower-middle-income countries, by 34% in high-income countries, and by 13% in upper-middle-income countries by 2070, compared to urban areas as of 2020 [8]. Consequently, a greater proportion of land and population will be exposed to a modified climate, referred to as urban climate, which will further intensify the challenges associated with achieving optimal thermal conditions.
While air temperature undeniably plays a significant role in OTC, it is important to recognize that solar radiation, relative humidity, and wind speed also contribute to this phenomenon [9]. In contrast to natural environments, urbanized areas have a stronger anthropogenic influence, resulting in heterogeneous urban morphology that consequently leads to different climate characteristics not only between cities, but also within an urban area (intra-urban differences). The values of climate elements are influenced by both natural and anthropogenic factors (topography, size of the city, density of buildings, type of materials, etc.). Consequently, climate conditions can vary significantly between different urban areas. Even within the same city, these values can vary due to other factors such as the presence of water bodies, green areas, and different building structures [10,11].
The increasing frequency of thermal discomfort, both in the short and long term, can be largely attributed to the combined effects of climate change and urbanization trends. This scenario will have profound and adverse consequences for ecosystems, public health, and the economy [12,13]. In addition, thermal comfort conditions can serve as a foundation for understanding the impacts of climate conditions on humans, and they place a special emphasis on social elements that either lessen or amplify the effects of environmental change [14]. Human thermal comfort has recently been considered in heat mitigation and urban adaptation strategies [5,15]. Hence, it is crucial to prioritize comprehensive monitoring and assessments of OTC conditions in both rural/non-urbanized and urban/built-up areas in the future. There has been a noticeable rise in interest among researchers in analyzing outdoor environmental conditions since the 2000s. Consequently, the number of studies focusing on OTC has steadily increased each year, leading to the development of a substantial database of information in this field [16]. Coccolo et al. [2] stated that OTC is an essential parameter for assessing the quality of the microclimate, and that important physical variables affecting human OTC include air temperature, relative humidity, wind speed, shortwave and longwave radiation, human activity, and clothing level. In addition, the same authors highlighted that not all indices are suitable for usage in every climate. For temperate climates (which are predominant in the research area), the acceptable indices are PET (Physiological Equivalent Temperature), UTCI (Universal Thermal Climate Index), SET (Standard Effective Temperature), and OUT_SET (Outdoor Standard Effective Temperature) [2]. Based on available studies, PET [17,18] is one of the most widely used human thermal indices worldwide [19,20]. At the same time, an increasing number of studies with a focus on OTC conditions are visible in the region of Southeast Europe, i.e., the Balkan Peninsula, too [20].
The main goal of this study is to provide systematic and comprehensive insight into the OTC conditions and trends in the cities of the western part of the Balkan Peninsula for the two decades in the 21st century (2001–2020). PET assessments were performed based on daily morning (7 a.m.), midday (2 p.m.), and evening (9 p.m.) measurements, and outcomes were presented on seasonal and annual level for 32 measurement locations across five countries. This research aims to address several scientific questions (SQ) pertaining to urban bioclimatic issues, such as SQ1–What are the bioclimatic condition tendencies in cities of the western part of the Balkan Peninsula in the last 20 years? and SQ2–This research investigates whether built-up types, relief, and climate types serve as the primary driving factors influencing thermal conditions in cities, or if there are other significant contributors to be considered.

2. OTC Background Research in the Balkan Peninsula

Over the past decade, there has been a noticeable and accelerated increase in the number of published papers focusing on thermal comfort analysis across the countries of the Balkan Peninsula [20]. According to the research of the same author [20], between 2010 and 2019, approximately 120 articles were published focusing on thermal comfort assessment in the Balkan Peninsula countries, as well as Hungary and Romania. This indicates a significant number of studies conducted during that period. Moreover, the upward trend in publication frequency related to thermal comfort assessments has continued beyond 2019 [21].
Pecelj et al. [22] assessed seasonal biothermal conditions in urban and suburban areas of Belgrade through the UTCI, PET, and mPET indices, using meteorological values measured at 7 a.m. and 2 p.m. Based on the results, the UTCI index showed that disparities between urban and suburban areas are most prominent during the period of minimum temperatures (7 a.m.), with an annual average difference of approximately 1.5 °C. The PET and mPET indices showed smaller differences (0.8 or 0.7 °C on the annual level), while the highest differences were in the period of maximum temperatures (2 p.m.). Milošević et al. [21] analyzed biometeorological conditions (during annual, summer, and heat-wave periods) across the whole territory of the Republic of Serbia, using 34 meteorological stations and calculating HUMIDEX, PET, and UTCI indices for the period 2000–2020. General outcomes showed that biometeorological indices on annual and summer levels have increasing tendencies throughout the country, and that during the heatwaves in summer, the most populated cities of Serbia are under dangerous and extreme heat stress.
The long-term OTC conditions in Banja Luka (Bosnia and Herzegovina) based on meteorological data from 1961 to 2020 were performed by Savić et al. [5]. The analysis of PET, UTCI, and Tmrt indices indicates a consistent and significant increase in the occurrence of extreme and strong heat days over the past 20 years. In comparison to the 1970s and 1980s, the number of days experiencing such high levels of heat stress has multiplied by a factor of five during the period from 2001 to 2020. The thermal comfort assessment, based on satellite monitoring and using a six-hour measurement frequency, was conducted for the cities of Sarajevo and Banja Luka [23]. Based on the results, mPET values showed higher and more frequent thermal stress in urban areas, compared to suburban areas. These differences are bigger during the summer and in midday and evening periods. At the same time, mPET values are in general lower in urban areas during the morning period, which can be considered because of building shadows, i.e., lack of direct sun radiation.
The summer thermal condition assessments across Slovenia using the UTCI index [24] and its impact on agricultural workers showed a statistically significant increasing trend of the UTCI values (0.7 °C/decade in summer). These positive trends are particularly noticeable in the southern part of the country and in general the thermal conditions during the hot summer days are not comfortable for moderate or severe agricultural workloads.
Like many other areas, Croatia is becoming warmer, and the bioclimatic conditions are changing as well. Borsy et al. [25] have already indicated the strengthening of unfavorable conditions for outdoor activities, especially in summer in the coastal area of Croatia. As shown by Nimac et al. [26], changes in urban climate conditions are caused by urbanization, but also by global warming. On the other hand, nor is the natural environment saved from climate change. Thus, for example, there is a positive trend of PET even in mountainous areas where there were no urban interventions or changes in the environment [27]. Bioclimatic changes affect many aspects of human activity with numerous unwanted effects. Some of them are dangerous for human health and even increase mortality [28]. For Croatia, Zaninović and Matzarakis [28] have found a connection between PET and mortality, which is significantly increased during long heat waves.
In addition to the mentioned studies, there is a wealth of research that investigates biometeorological conditions in various cities, natural spaces, and defined regions across Serbia, Slovenia, Croatia, Bosnia and Herzegovina, Montenegro, as well as Bulgaria, North Macedonia, Albania, and Greece. Numerous papers have been published on this topic, providing detailed analyses and insights. A comprehensive list of these papers, along with review explanations, can be found in the studies conducted by Dunjić et al. [20] and Milošević et al. [21].

3. Research Area and Measurement Locations
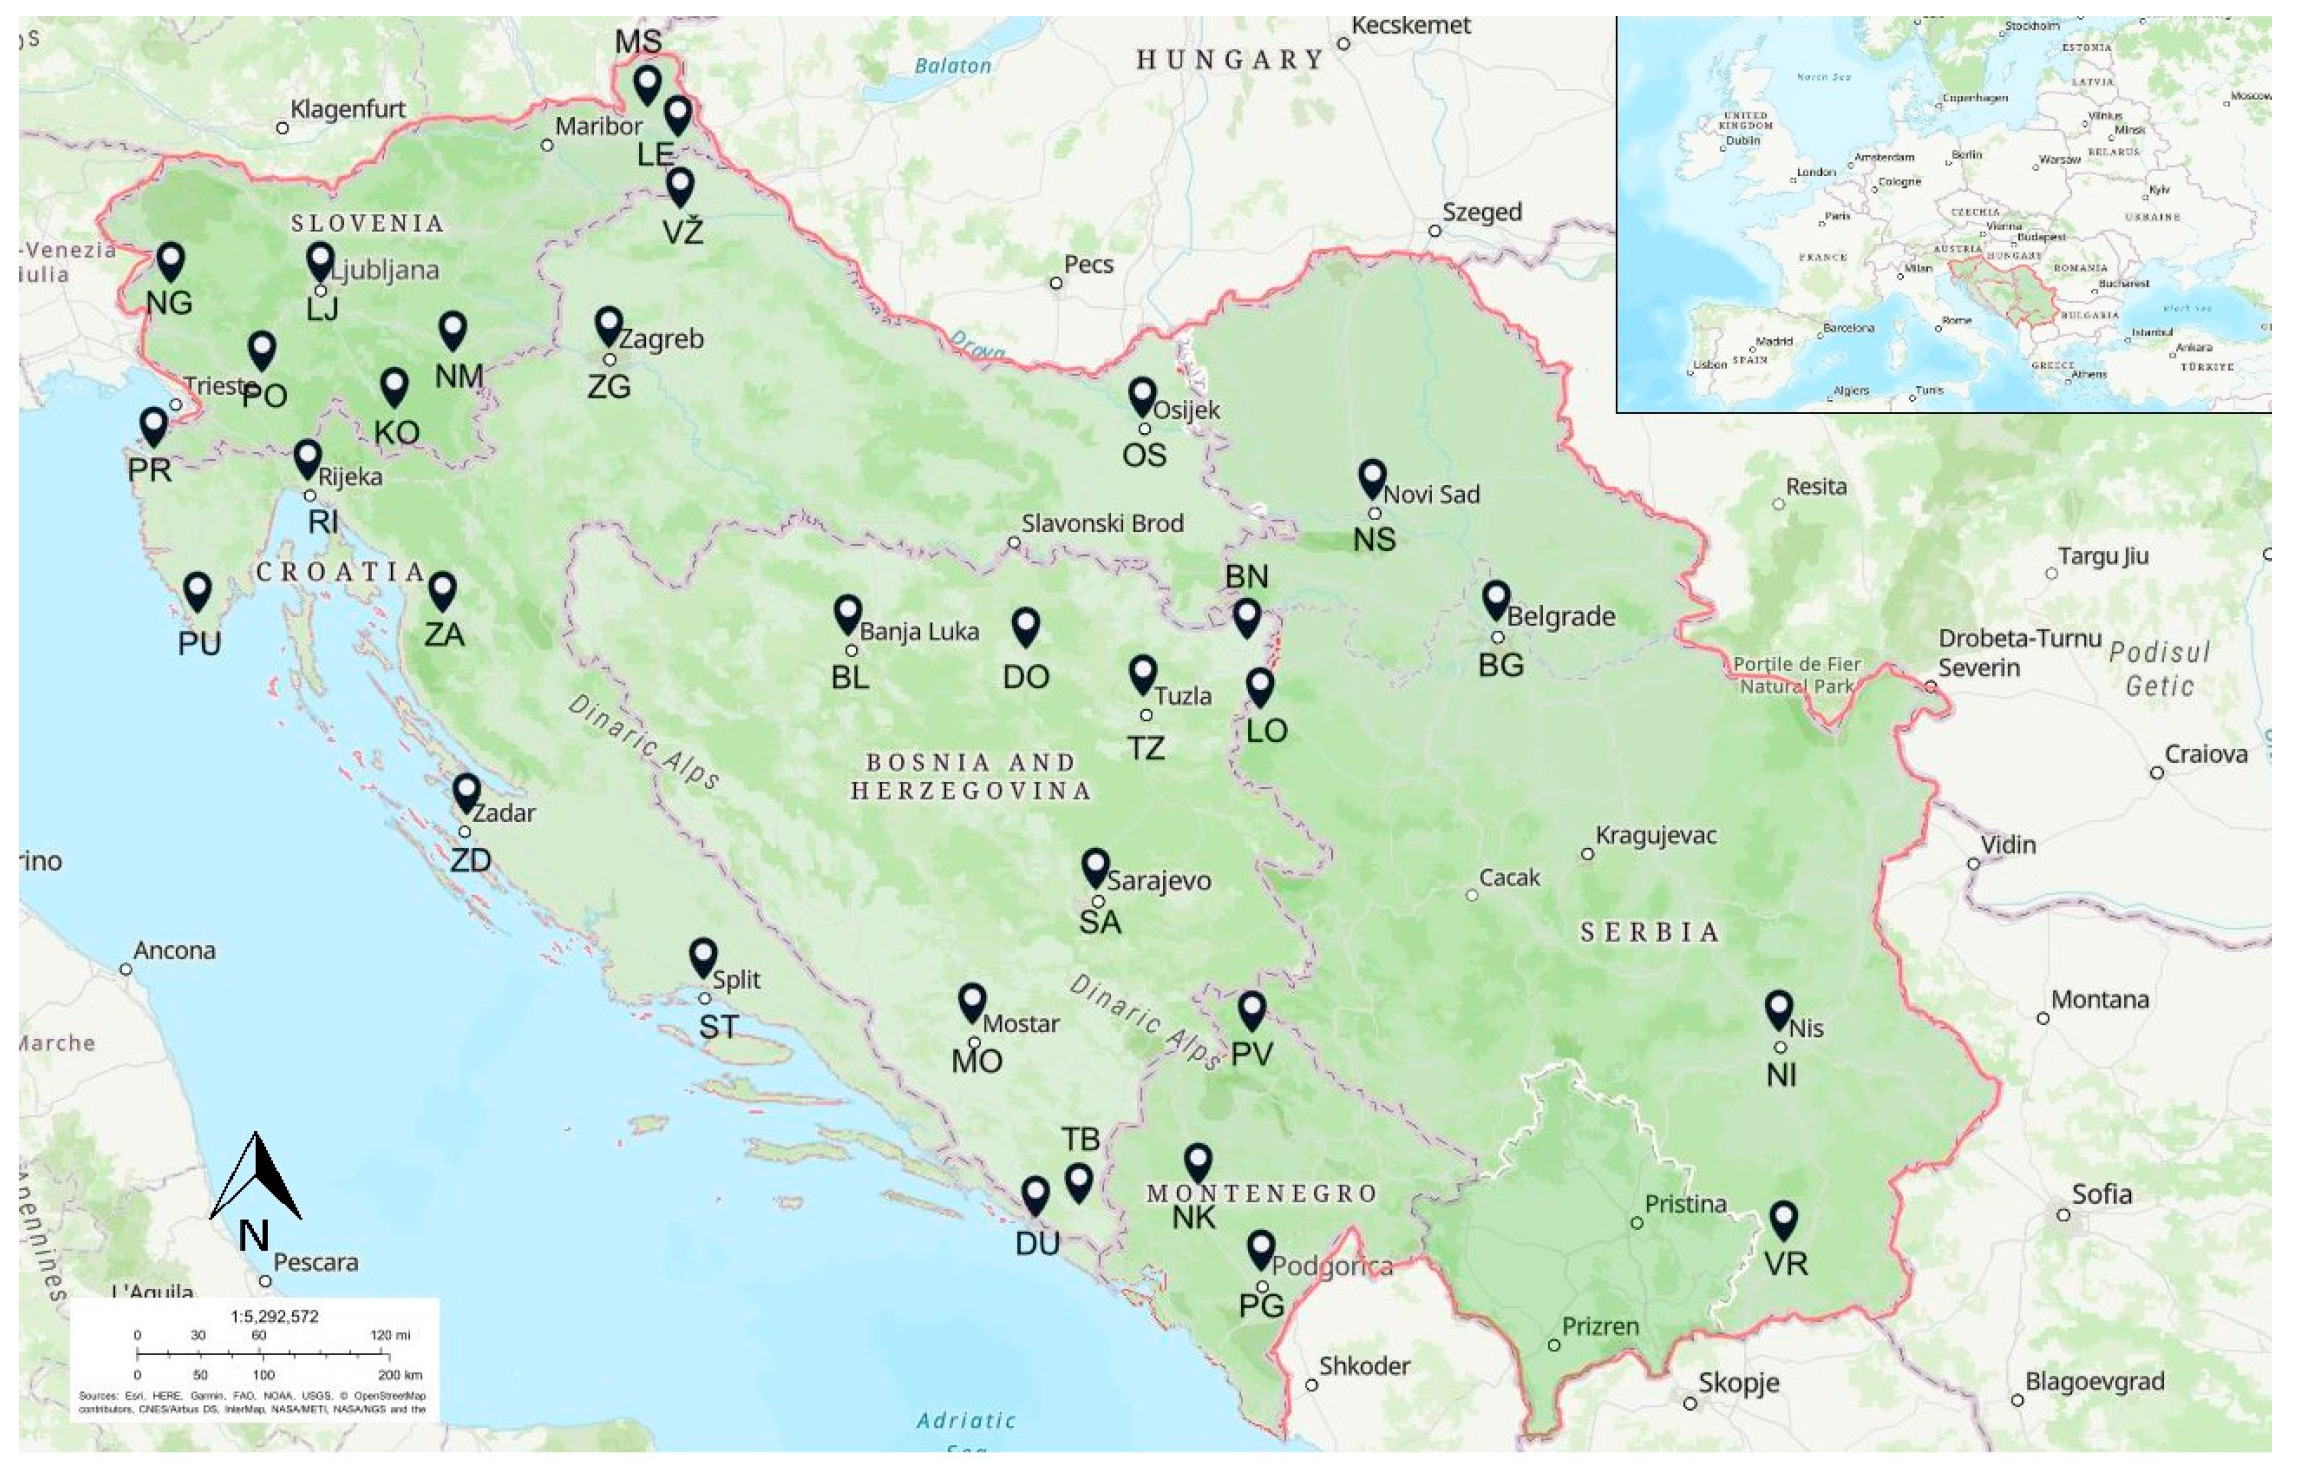
3.1. Research Area

The Balkan Peninsula extends throughout central and southeastern Europe, and its western part includes all or part of the territories of Slovenia, Croatia, Serbia, Bosnia and Herzegovina, and Montenegro (Figure 1). The main geographical characteristics of the studied area are presented in the Supplementary Materials (please see Table S1).
The climate is determined by its location between the Adriatic Sea and continental climate zones, as well as by the topography of the region. Annual air temperature ranges from 9.5 °C in higher elevations of the Dinarides/Alps to 17 °C along the Adriatic Sea (based on the data from 2000 to 2020). The average annual precipitation ranges from 600 mm in the southeast and east to over 2000 mm in the higher areas of the northwest and west [29]. Depending on the region, winters can be cold with abundant precipitation, while summers are hot and dry, especially along the Adriatic coast. Most of the area has a Cfb and Cfa continental climate (temperate climate, fully humid, warm summers, with at least 4 months of average air temperature above 10 °C), and only mountain areas have Dfb (snow climate, fully humid) or (isolated high mountain areas) even ET (tundra) climate (average temperature of warmest month between 0 °C and 10 °C) according to the Köppen-Geiger climate classification system. The climate of the Adriatic coast varies from Csa–hot-summer Mediterranean climate type (warm temperate climate with dry summer, at least four months of average air temperature above 10 °C) to Csc–cold-summer Mediterranean climate in the northern part of the area (cool, dry summers, with less than four months with an average air temperature at or above 10 °C). The Csb–warm summer Mediterranean climate type can be found in some areas of the southern Adriatic hinterland [30].

3.2. Selected Measurement Locations

Table 1 and Figure S1 provide an overview of the primary geographical, climate, and spatial characteristics of the 32 measurement locations included in this research. These locations span across five countries within the western part of the Balkan Peninsula: Serbia (5 stations), Slovenia (8 stations), Croatia (9 stations), Montenegro (3 stations), and Bosnia and Herzegovina (7 stations). Out of these stations, only five are not designated as the main meteorological stations. These five stations are Lendava, Murska Sobota, Nova Gorica, Novo Mesto (all in Slovenia), and Doboj (in Bosnia and Herzegovina). The general selection criteria for using presented measurement locations are as follows: (a) using good quality meteorological data sets that are mostly provided from the main meteorological stations, and in some cases non-main meteorological stations; (b) that data sets have missing data from 0% to 2.5%; (c) to provide, as much as possible, relevant spatial coverage of the research area.
While all stations are part of the official national meteorological networks in their respective countries, most of them (25 stations) are situated within urban areas or near city borders. These urban stations are labelled as ‘number 1’ in Table 1. On the other hand, the remaining seven stations are located outside urban areas at distances ranging from 1 km to 20 km from the urban zone boundaries. The distance listed in kilometers indicates the measurement location’s proximity to the urban border. To delineate the boundaries of urban areas, we used Google Earth and Google Maps, accessing data from June/July 2023. This process relied on the utilization of current satellite imagery to establish an accurate representation of the physical conditions on the ground.
For more precise details about each measurement location, including geographical coordinates, altitudes, and aerial photographs, please refer to Figure S1.
To explain the surrounding urban morphology parameters in more detail, each meteorological station was assigned its corresponding Local Climate Zone (LCZ) class based on the classification system by Stewart and Oke [31]. Some measurement sites are surrounded by intensive built-up types, like Belgrade, Podgorica, Ljubljana, Vranje, Zagreb, Banja Luka, or Mostar. The urbanization types of these locations are mostly recognized as LCZs 2, 5, 6, 8, B, or E. A few stations that are located on the outskirts of the urban areas have surroundings like LCZ 3, 6, 9, A, or D types. Finally, stations outside of the urban areas are mostly in land cover zones like LCZ A or D (see Figure S1).
Based on the climate classification system developed by Kottek et al. [30], eight meteorological stations fall under the category of continental climate with Cfa type. Additionally, 14 stations are classified as Cfb type. Four stations are categorized as Csa type, while two stations are classified as Csb type. Three stations are classified as Csc type, which also corresponds to the Mediterranean climate, but with a cooler summer. Notably, the Zavižan station stands out as the sole location characterized by a boreal climate with a Dfb classification. For more detailed information, please refer to Figure S1.

4. Data Sets and Methods

4.1. Meteorological Data Sets

This study utilized data collected at three different measurement times: morning (7 a.m.), midday (2 p.m.), and evening (9 p.m.). The data included measurements of air temperature (Ta), relative humidity (RH), wind speed (v), and cloudiness (N). These measurements were recorded daily over a period of 20 years, specifically from 1 January 2001 to 31 December 2020. The meteorological data sets were obtained from the national meteorological networks of five countries: Serbia, Croatia, Slovenia, Bosnia and Herzegovina, and Montenegro. During the quality control process, the meteorological data sets were carefully checked for outliers or missing data. Any data sets with more than 5% of missing data were excluded from further analysis. Among the selected 32 stations, half of them had 0% missing data, while nine stations had less than 1% missing data. The remaining stations had missing data ranging from 1% to 2.5% (see Figure S1). Missing data below the threshold of 2.5% are unlikely to significantly impact the accuracy and precision of the results of the study. Datasets from Belgrade, Novi Sad, Vranje, Loznica, and Niš were obtained from the Republic Hydrometeorological Service of Serbia [32]; data from nine stations in Croatia were provided by the Croatian Meteorological and Hydrological Service [33]; data sets from Slovenian stations were obtained from the Slovenian Environment Agency [34]; the Institute of Hydrometeorology and Seismology in Montenegro provided data sets from Podgorica, Nikšić, and Pljevlja stations [35]; and data sets from seven stations in Bosnia and Herzegovina were gathered from the Republic Hydrometeorological Institute [36] and the Federal Hydrometeorological Institute [37].

4.2. Research Methods

Besides numerous OTC indices, in the last 20 years, the PET index has been recognized as “the most popular” OTC index [18,38,39,40,41,42]. The PET index is defined as “the air temperature at which, in a typical indoor setting (without wind and solar radiation), the energy budget of the human body is balanced with the same core and skin temperature as under the complex outdoor conditions to be assessed“ [18]. In this study, the PET is calculated by using the RayMan model [43], which is based on the following data: (a) meteorological inputs (Ta, RH, v, N) from synoptic stations; and (b) standard values of clothing level, metabolic rate, age, and weight from the RayMan model (i.e., height 1.75 m, weight 75 kg, age 35 years, sex–male, clothing 0.9, activity 80 W, position–standing). In general, the RayMan model was developed to calculate OTC indices based on meteorological data (Ta, RH, v, N, and Tmrt), station locations, personal data, clothing, and activity. In addition, before the PET calculations, N values were transformed from tenths to octas based on the requirements of the Rayman model. Finally, the range of the PET thermo-physiological stress levels [17] that are used in this study is presented in Table S2.
To define the appearance ratio of heat stress, cold stress, or comfortable conditions during the research period, frequency analysis is performed. The frequency analysis outcomes are interpreted based on the nine PET thermal stress levels defined by Matzarakis and Mayer [17] categories which are presented in Table S2. To assess the annual and seasonal trends of the PET values throughout the measurements, a linear trend model was utilized. To determine the statistical significance of these trends, the t-test method was employed with a predetermined significance level (α) of 0.05, corresponding to a 95% confidence level.

5. Results

5.1. Seasonal and Annual Morning, Midday, and Evening Biometeorological Conditions Based on PET

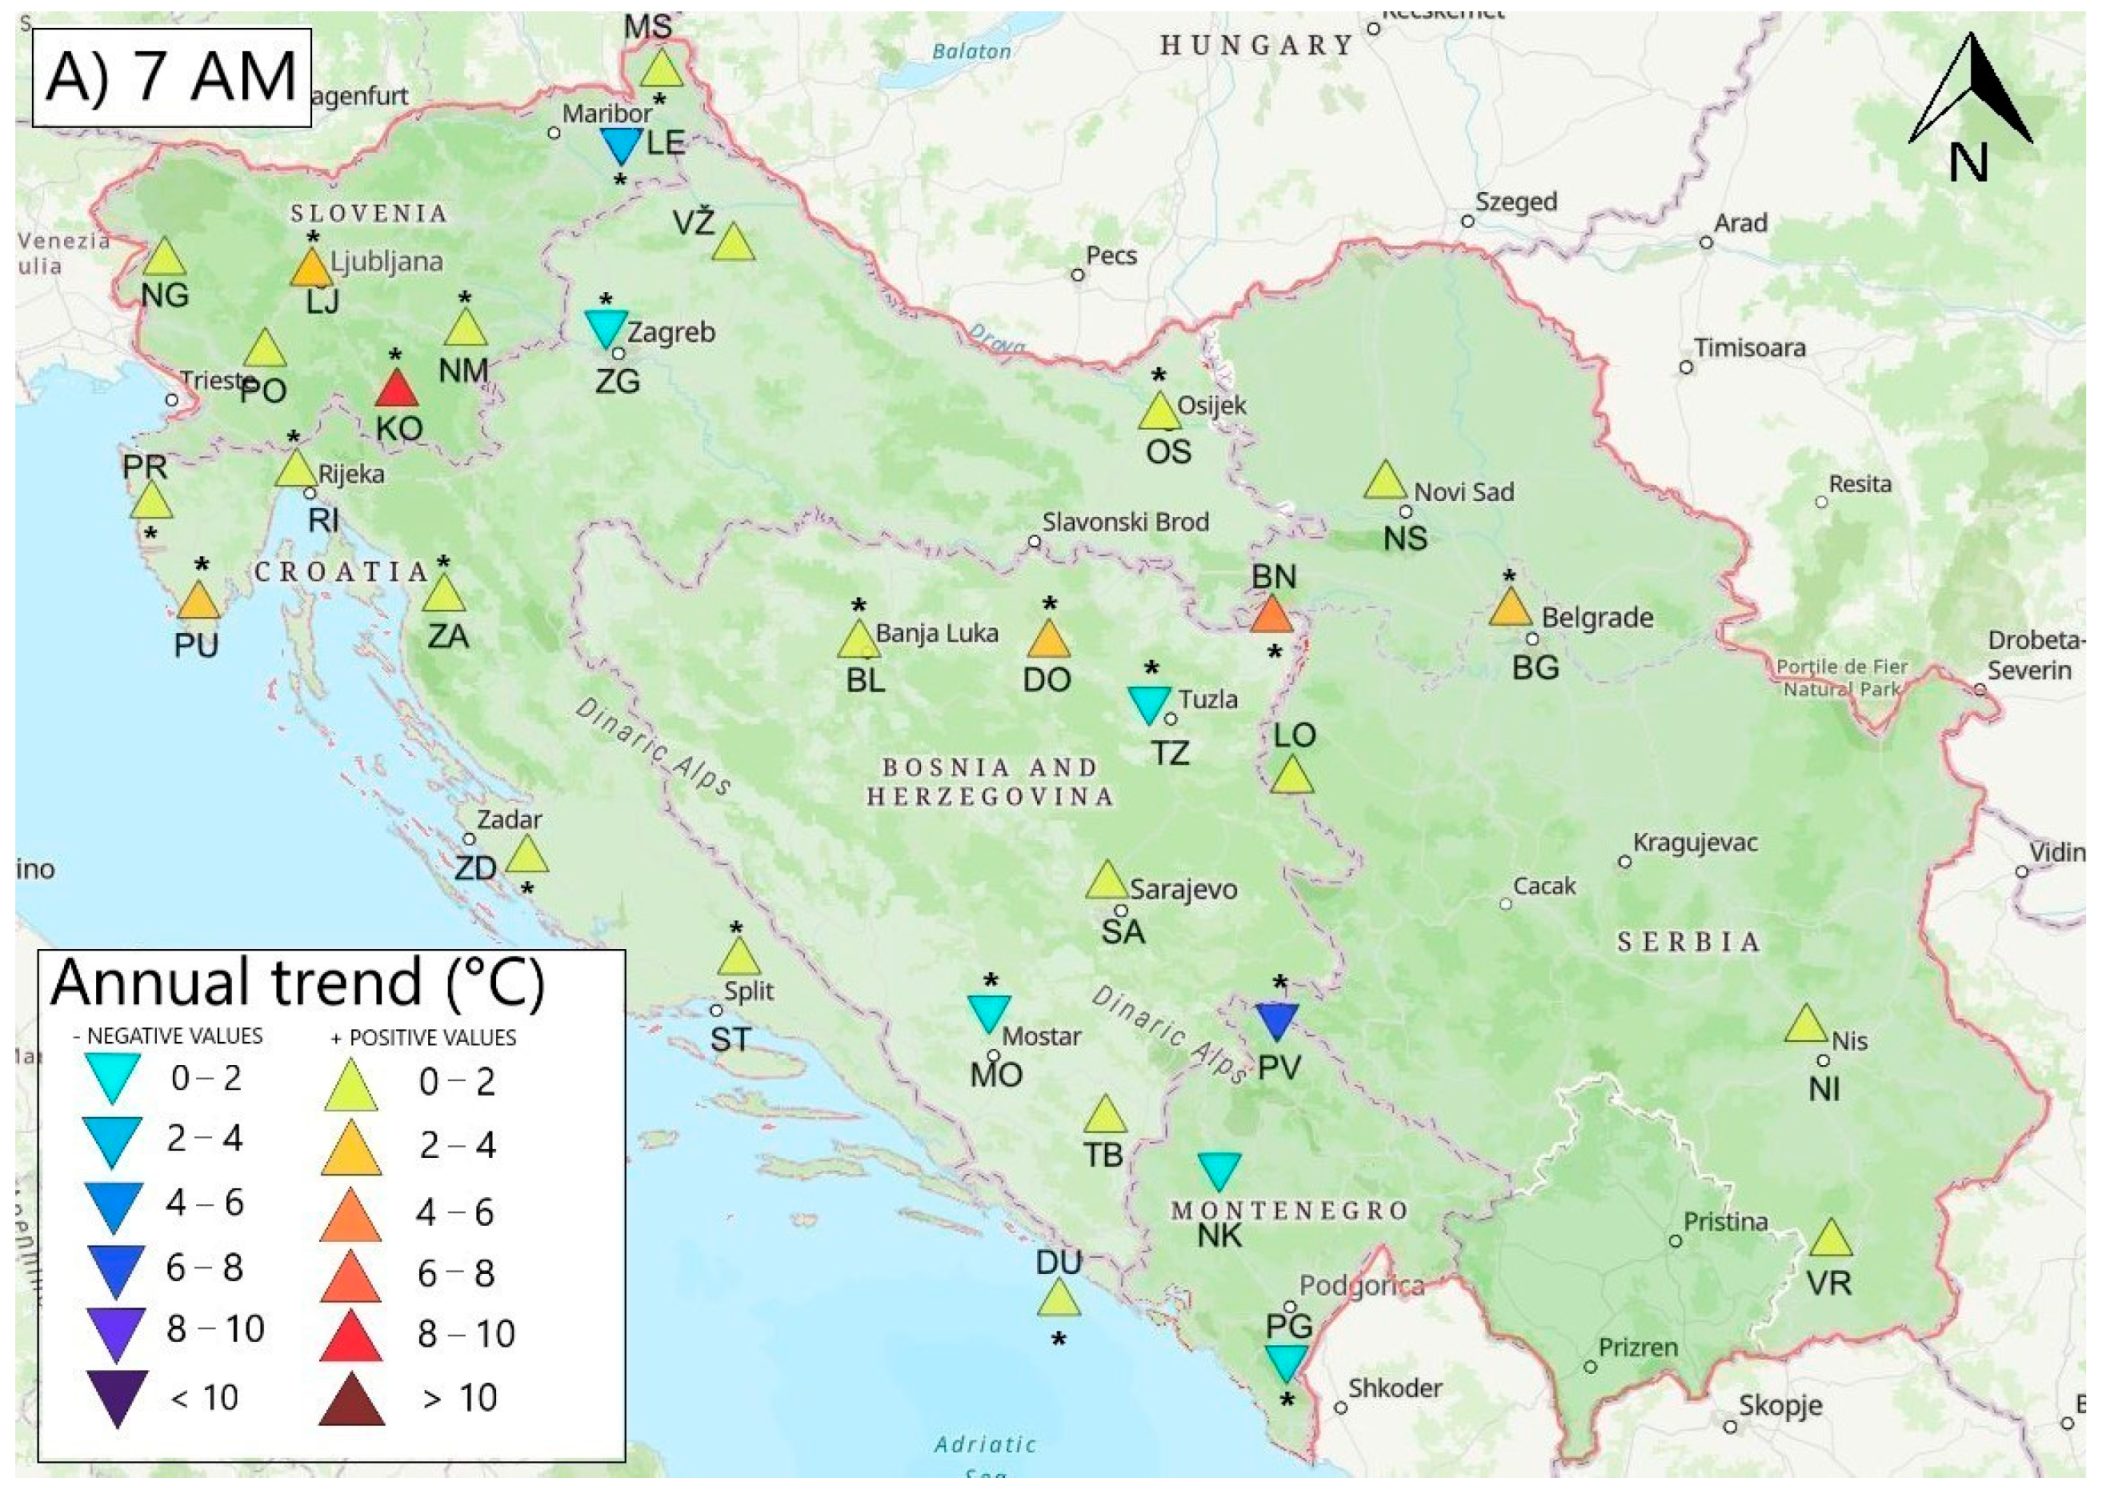
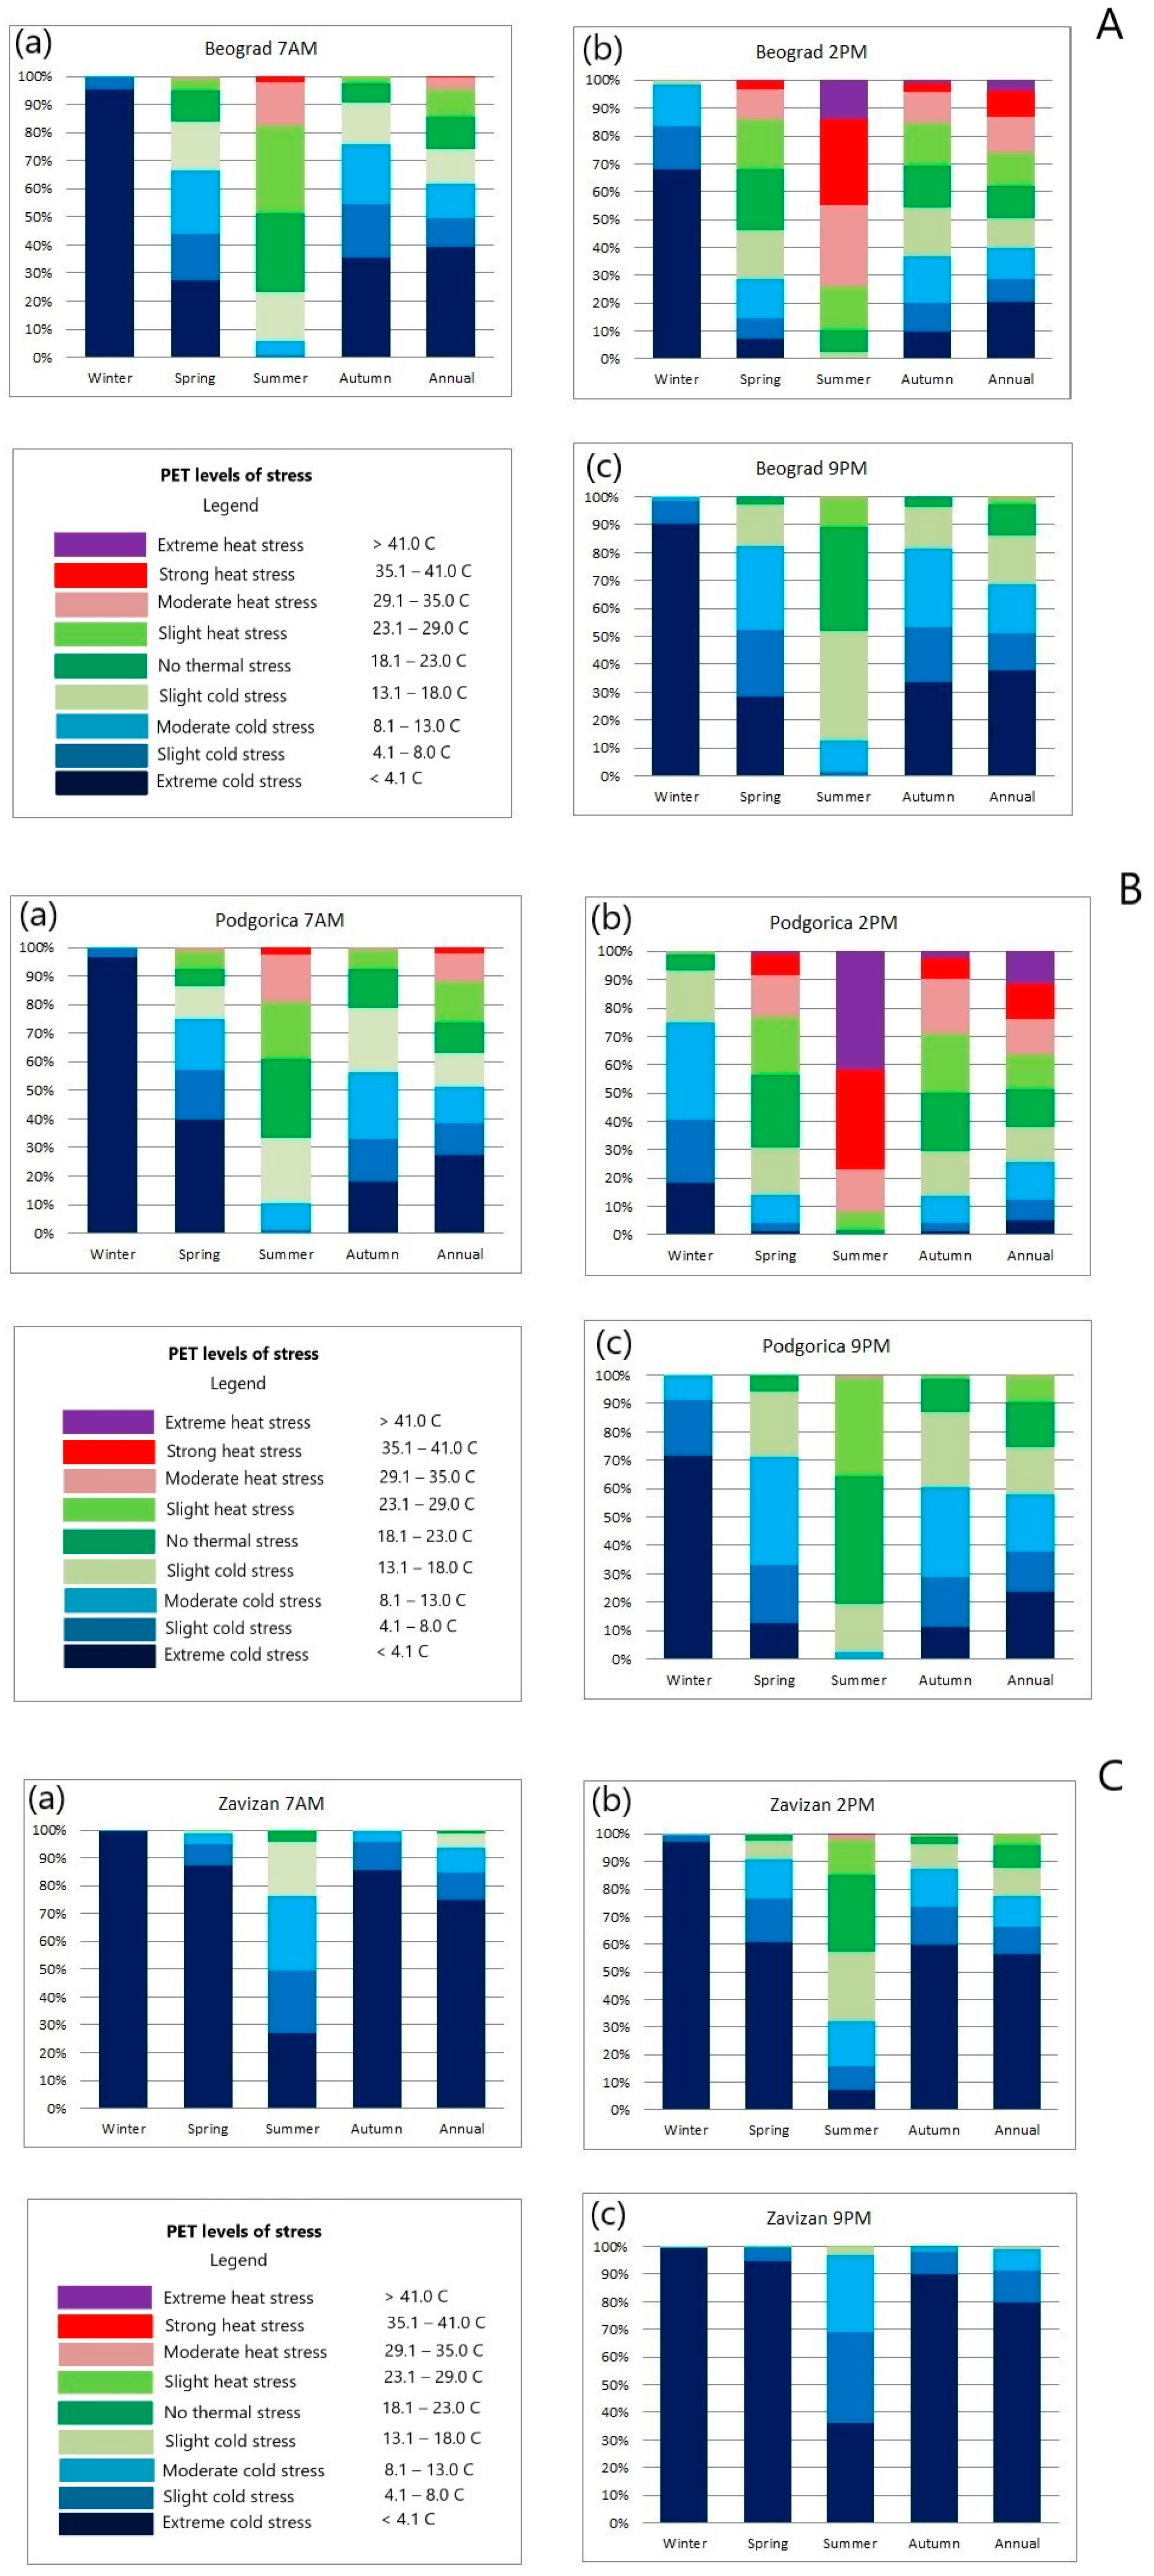
5.1.1. Morning Bioclimatic Conditions at 7 a.m.

Based on Table 2, in the morning hours, during the winter, spring, and autumn seasons, PET values from all stations are mostly similar, i.e., mostly they are within levels of “moderate cold stress” (between 8 °C and 13 °C) and “strong cold stress” (between 4 °C and 8 °C). Stations in higher altitude regions like Zavižan, Postojna, and Pljevlja or stations in plains like Murska Sobota or Osijek have “extreme cold stress” conditions (lower than 4 °C) during autumn. As expected, negative average PET values (lower than −2 °C) during all seasons (except summer) are obtained only for Zavižan, which is a mountain station with an altitude of almost 1500 m above sea level. On the other hand, stations like Dubrovnik and Podgorica, which are located at low altitudes and very close to the Adriatic Sea (Dubrovnik), have higher PET values, and in some seasons, they experience “slight cold stress” levels (between 13 °C and 18 °C).
In the summer season, higher altitude regions have “moderate cold stress” (Zavižan) or “slight cold stress” levels (Postojna and Pljevlja), while others have experienced no thermal stress or heat stress. Furthermore, average summer PET values at 15 stations belong to the “no thermal stress” category (between 18 °C and 23 °C) and 14 stations have “slight heat stress” summertime PET values (between 23 °C and 29 °C). The first group of stations (no thermal stress) mostly has a moderate continental climate and is located in plains outside of urban areas (Novi Sad, Murska Sobota, Varaždin, Osijek) or in valleys (Vranje, Kočevje, Ljubljana, Nova Gorica, Novo Mesto, Nikšić, Banja Luka, Doboj, Sarajevo, Trebinje). Stations with “slight heat stress” are neartheAdriatic Sea (Rijeka, Pula, Split, Dubrovnik, Zadar, Portorož, Podgorica), located in the plain regions (Lendava, Belgrade, Bijeljina), or wider valleys (Zagreb, Niš, Loznica, Mostar, Tuzla), and most of them are located within urban areas.
Average annual PET values reflect the influence of individual season. Thus, the “slight cold stress” occurred on ten stations that are mostly the hottest locations (based on seasonal data). Of the 19 stations that are in the “moderate cold stress”, 3 stations (Zavižan, Postojna, and Pljevlja) have the lowest PET values with stronger cold stress (Table 2).

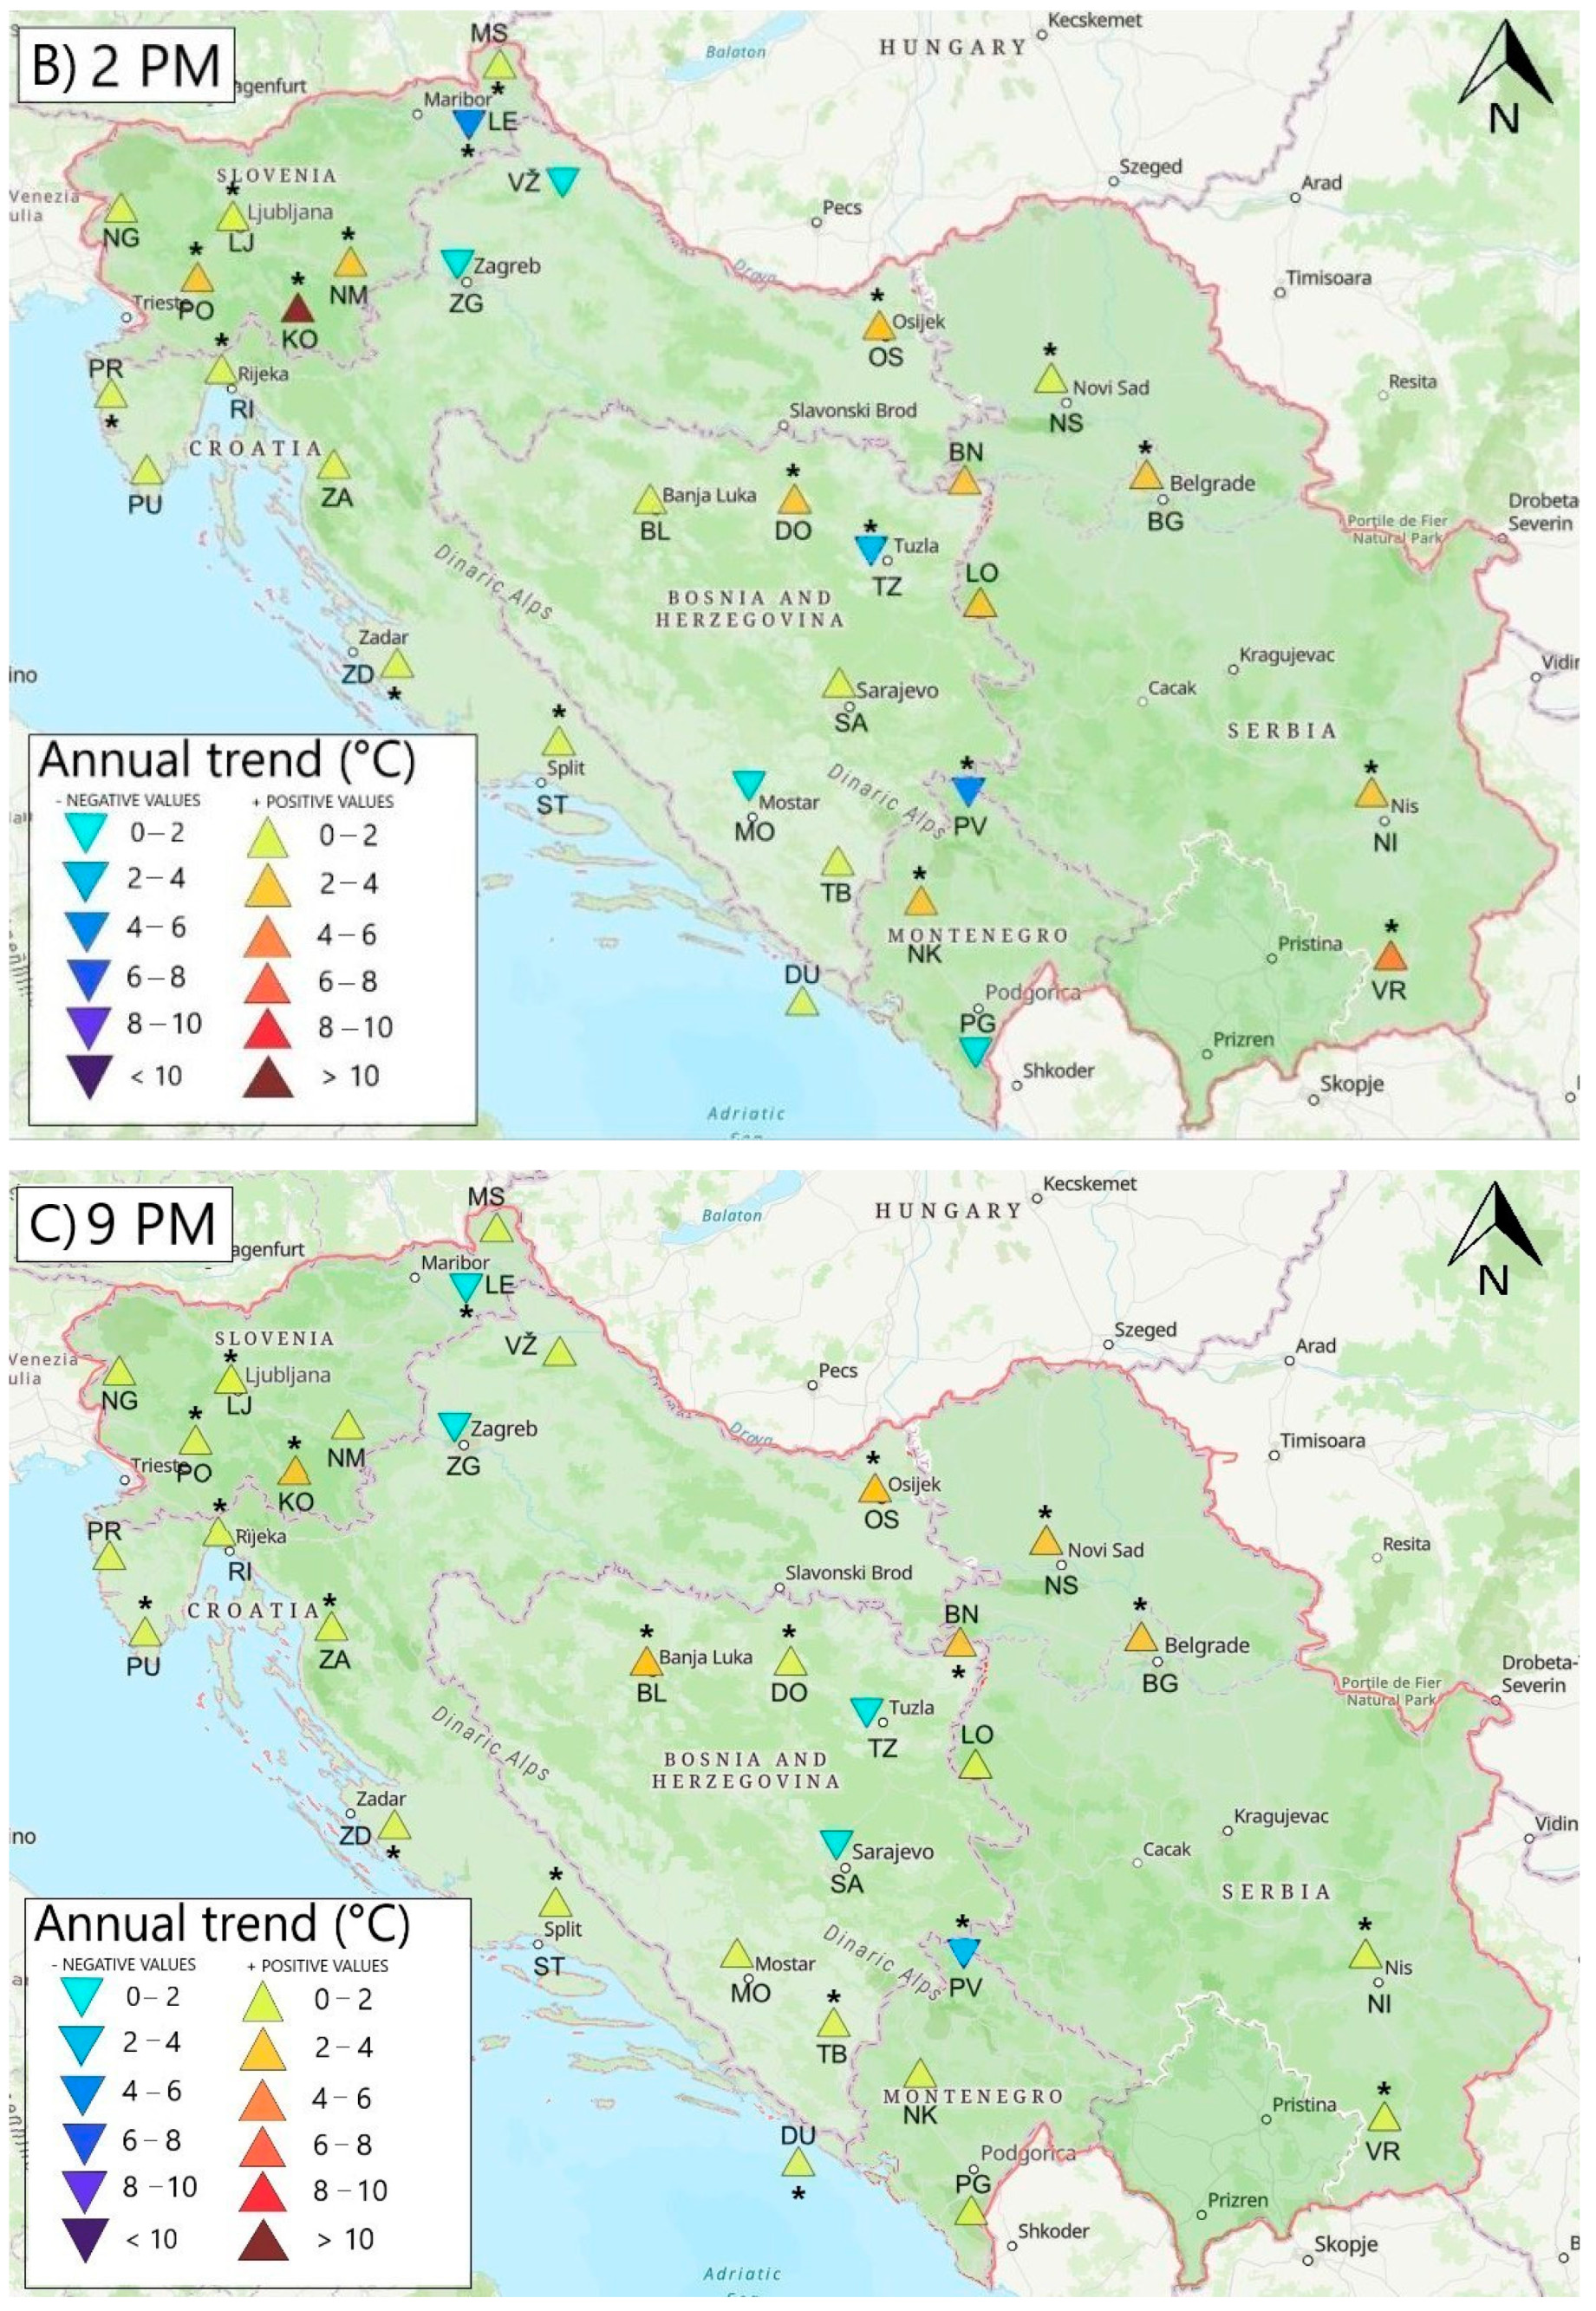
5.1.2. Midday Bioclimatic Conditions at 2 p.m.

Considering all stations, average seasonal PET values at 2 p.m. range from extreme cold to strong heat stresses throughout (Table 3). As expected, the station Zavižan is the coldest one. During winter, spring, and autumn, PET values reach an “extreme cold stress” level with values below 2.5 °C even in the central part of the day. During the summer, the average PET is 15.81 °C (“slight cold stress”) and the average annual level is “strong cold stress” with a PET of 5.4 °C. In addition, the station Nikšić has a lower PET in spring, i.e., in the range of “moderate cold stress” with a value of 13.0 °C. These cold stations are followed by other stations with PET values in the levels of “slight cold stress” or “no thermal stress” during the winter, spring, and autumn. Only Lendava in spring and Podgorica in winter and autumn achieve PET values higher than 23 °C, with a “slight heat stress” level. Finally, during the winter, spring, and autumn, between 50% and 60% of stations have “no thermal stress” level.
During the summer season, seven stations (Niš, Lendava, Podgorica, Bijeljina, Doboj, Tuzla, and Mostar) experienced “strong heat stress” with PET values higher than 35 °C. All other stations (except Zavižan) had “moderate heat stress” with PET values between 29 and 35 °C (Table 3). Based on thermal stress levels during summer, the highest thermal stress is revealed for stations located in plains and wider valleys, which are under continental or Mediterranean climate conditions, but also inside of cities. Annual average PET values are in the range of “no thermal stress” (19 stations) or “slight heat stress” (11 stations), while a cold stress level is detected for Postojna (“slight cold stress”) and Zavižan (“strong cold stress”).

5.1.3. Evening Bioclimatic Conditions at 9 p.m.

During winter, spring, and autumn, the evening thermal stress level at most stations belongs to the category of “strong cold stress” or “moderate cold stress” (Table 4). Stations with a Mediterranean climate and under stronger urban influence like Zadar, Split, Rijeka, Pula, Dubrovnik, Podgorica, Mostar, and Trebinje experienced higher thermal stress conditions with “moderate cold stress” levels during winter, spring, and autumn seasons. These thermal conditions are followed by Loznica station, which has a “moderate cold stress” level in all three seasons, and Dubrovnik station, with “slight cold stress” in autumn and a PET value of 13.24 °C. Similar to morning and midday values, the stations Zavižan, Postojna, and Pljevlja have the lowest evening PET values in winter, spring, and autumn, and they are in the range of “strong cold stress” or “extreme cold stress”, with a negative value in station Zavižan (lower than −2.5 °C).
During the summer season, stations Zavižan and Sarajevo experienced “strong cold stress” levels with an average PET value of 5.54 °C and “moderate cold stress” with an average PET value of 11.37 °C, respectively. Other stations have warmer evening thermal conditions, and 22 stations were faced with a “slight cold stress” level, while 8 stations (Zadar, Split, Pula, Dubrovnik, Podgorica, Bijeljina, Mostar, and Trebinje) experienced “no thermal stress” level (Table 4). The possible reason that these eight stations have optimal evening thermal conditions during the summer is that they are in areas of warmer climate conditions and influenced by the sea and low altitudes, but also of more significant urban influence. Finally, there are four different levels of average annual evening thermal stress. Naturally, the lowest PET value is obtained for Zavižan (“extreme cold stress”), and this cold stress condition is followed by seven stations with “strong cold stress”. Most locations (22 stations) have “moderate cold stress”, while the warmest stations are those with a Mediterranean type of climate (Dubrovnik and Podgorica), which experienced “slight cold stress” with average annual PET values exceeding 13.0 °C.

5.2. Seasonal and Annual Frequency of Morning, Midday, and Evening PET Stress Levels

Frequency analysis was used to determine the ratio of days with different thermal stress levels, based on daily temperature measurements at 7 a.m., 2 p.m., and 9 p.m. during the 20-year research period. Figure 2 and Figure S2 present the frequencies of PET thermal stress levels for all three measurement times, with these ratios shown as seasonal and annual averages. This discussion focuses on the results derived from three specific monitoring stations. Firstly, we examine the frequency analysis conducted in Belgrade, Serbia, which serves as a representative case illustrating the combined impact of a continental climate and urban environment on meteorological variables. Subsequently, we delve into the findings from Podgorica, Montenegro, a notably warm location influenced by a Mediterranean climate and urbanization. Finally, we analyze data from Zavižan, Croatia, characterized by a purely mountainous climate, devoid of any urban influences (see Figure 2). Detailed frequency analysis figures for the remaining 29 stations can be found in Supplementary Figure S2, with comprehensive interpretation provided in the subsequent sections of this paper.

5.2.1. Frequency Analysis of PET Values at 7 a.m.

In the morning period, during all seasons except summer, the most dominant thermal stress level is “extreme cold stress”, followed by “strong cold stress” and “moderate cold stress”. During winter, for stations located in plain, mountain, or urban areas with dominant continental climates or mountain areas influenced by Mediterranean climate, “extreme cold stress” occurred between 90% (Nova Gorica) and 99% of the time (Osijek). In spring, autumn, and on an annual basis, “extreme cold stress” ranged from 18% (autumn, Podgorica) to 55% (autumn, Sarajevo). In higher altitude regions (Zavižan, Postojna, and Pljevlja), the ratio of “extreme cold stress” is between 97% and 100% during the winter season, while in spring, autumn, and annual periods, the ratio is consistently higher than 40%, reaching up to 88% (spring, Zavižan) (Figure 2C). In locations near the Adriatic coast or in areas with Mediterranean influence (Dubrovnik, Pula, Rijeka, Zadar, Split, Portorož, Mostar, Trebinje), the ratio of “extreme cold stress” during winter ranges from 68% (Dubrovnik) to 90% (Trebinje). In other seasons and on an annual basis (except summer), “extreme cold stress” occurred at levels ranging from 9% (autumn, Dubrovnik) to 39% (annual, Mostar).
The ratio of “strong cold stress” and “moderate cold stress” during spring, autumn, and annually ranges from 9% (annual, Niš) to 26% (autumn, Zagreb). In the high mountain region (Zavižan), both cold thermal stresses are lower than 10% because of the dominant presence of “extreme cold stress” (Figure 2C). Mediterranean climate cities experienced a higher ratio of “moderate cold stress”, particularly in autumn, with a maximum frequency of 33% (Pula, Split, Zadar) (see Figure S2).
During spring and autumn, in regions with continental climates, “slight cold stress”, “no thermal stress”, “slight heat stress”, and in some cases “moderate heat stress”, occurred at frequencies ranging from 6% to 38%. Furthermore, at stations located in these regions, the “slight cold stress” and “no thermal stress” levels have higher frequencies. In mountain regions, these thermal stress levels have lower values—mostly less than 10% in total, and in the case of Zavižan, it is only 1%, due to the strong dominance of colder stress levels. Finally, stations located in regions influenced by the sea having a Mediterranean climate showed a higher frequency of these four thermal stresses during spring and autumn, with values ranging from 30% to 50% (see Figure S2).
During the summer period, there are distinct variations in the ratios of thermal stress compared to the winter, spring, and autumn seasons, as well as the annual period, across all stations. A notable influence of heat or thermal neutral conditions is observed, predominantly characterized by the prevalence of “no thermal stress”, “slight heat stress”, “moderate heat stress”, and “strong heat stress” levels (Figure 2 and Figure S2). Stations with continental climate, including plains, valleys, mountains, and cities, exhibited these four stress levels within a range of 47% (Kočevje) to 88% (Niš). Among these, the two levels“no thermal stress” and “slight heat stress” had higher values across nearly all stations, with a frequency ratio of approximately 10–20%, respectively. In stations such as Postojna, Murska Sobota, Pljevlja, and particularly Zavižan (Figure 2C), cold stress levels remained dominant, with a ratio exceeding 50%. Stations located in areas characterized by a Mediterranean climate displayed elevated values of “moderate heat stress” and “strong heat stress”. Almost all stations within this region experienced “strong heat stress” conditions at a few percentage points, with Dubrovnik recording the highest value of 11%. In contrast, stations with continental and mountain climates either did not exhibit the “strong heat stress” condition or did so with less than 10% frequency (see Figure S2).

5.2.2. Frequency Analysis of PET Values at 2 p.m.

The pattern of thermal stress frequencies, based on midday measurements, exhibits varying ratio values and a more diverse presence of thermal stress levels across all seasons and annual periods, compared to conditions observed at 7 a.m. and 9 p.m. (Figure 2 and Figure S2).
During the winter period, a prominent prevalence of intense cold stress conditions is evident across all stations, represented by the levels of “extreme cold stress”, “strong cold stress”, and “moderate cold stress.” However, these cold stress levels are not uniformly distributed among all stations, with variations reflecting spatial and climatic differences. Stations located in continental climates, such as plains, valleys, and cities, recorded these cold stress levels within a range from 79% (Loznica) to 98% (Ljubljana, Varaždin) (Figure 2A, see Belgrade station). Locations at higher altitudes consistently experienced all three cold stress levels in more than 90% of cases, with Zavižan reaching a maximum of 98% for “extreme cold stress” and 2% for “strong heat stress” (Figure 2C). In Mediterranean climate cities, the incidence of cold stress was lower, with intensive cold stress levels occurring from 75% (Podgorica, Figure 2B) to 95% (Zadar). Notably, “extreme cold stress” appeared less frequently in coastal locations compared to inland areas with continental climates. For instance, in Dubrovnik, “extreme cold stress” occurred in only 12% of cases (see Figure S2), while in Podgorica it was 18%, but in Belgrade, it was observed in 65% of cases (Figure 2A,B).
The thermal stress patterns for spring and autumn are highly similar across all locations (Figure 2 and Figure S2). All nine PET thermal stress levels were detected for stations under temperate or warm climates, whereas locations with milder climates exhibited thermal stress with eight different levels (excluding Zavižan). Stations in continental climates indicate that spring is slightly warmer than autumn, as reflected in the lower ratio of “extreme cold stress”, “strong cold stress”, and “moderate cold stress” (Figure 2A and Figure S2). Additionally, the ratio of these three cold stress levels falls within the range of 20% to 40%. Conversely, in higher altitude regions, these cold stresses occurred at rates from 50% to 90% (Figure 2C). In contrast, locations near or close to the Adriatic Sea experienced these intensive cold stress levels in less than 25% of cases, with the lowest values in Podgorica (Figure 2B and Figure S2). The most dominant stress levels in spring and autumn are optimal and near-optimal thermal conditions, specifically “slight cold stress”, “no thermal stress”, and “slight heat stress”. This is consistent across all 32 stations, with the main differences lying in the ratio of “moderate heat stress”, “strong heat stress”, and “extreme heat stress” that occurred in cities with Mediterranean climates at values of up to 30% (in Podgorica and Mostar) (Figure 2B).
During the summer season, locations experienced heat stress conditions, including “slight heat stress”, “moderate heat stress”, “strong heat stress”, and “extreme heat stress” with a ratio of approximately 90%, except for the Zavižan station (Figure 2 and Figure S2). The most dominant heat stress levels are “moderate heat stress” and “strong heat stress”, with ratios ranging from 15% to 30%, while “extreme heat stress” occurred in less than 15% of cases. However, some inland stations (Niš, Loznica, Lendava, Tuzla, Doboj, Bijeljina, Banja Luka) and Mediterranean climate regions (Mostar) experienced the highest levels of heat stress, reaching 20% or more (see Figure S2), with a maximum value of 43% in Podgorica (Figure 2B). Finally, locations near the Adriatic Sea stand out from other stations due to higher ratios of “moderate heat stress” and “strong heat stress” levels.
The annual level of PET thermal stress levels encompasses all categories and represents the average of all four seasonal thermal stress conditions. In general, seven thermal stress levels are evenly distributed across all stations (except Zavižan), but the ratios of “extreme cold stress” and “extreme heat stress” levels depend on specific geographical and climate characteristics (Figure 2 and Figure S2).

5.2.3. Frequency Analysis of PET Values at 9 p.m.

Evening measurements have revealed frequency tendencies in thermal stress levels very similar to those observed in the morning, especially during the winter, autumn, and annual periods. However, in spring and, even more so in summer, cold thermal stresses are more prevalent, with lower ratios of heat stress levels (Figure 2 and Figure S2).
The “extreme cold stress” level has frequency values ranging from 83% in Loznica, with other stations exhibiting higher values, peaking at 100% in Zavižan. Clearly, stations in continental or mountainous regions experience extreme cold conditions in less than 80% of cases, but this is not the case for Mediterranean climate regions, where the coldest conditions are less frequent, with all stations below 80% (with a minimum value of 60% in Dubrovnik). Consequently, “strong cold stress” and “moderate heat stress” occur in less than 10% of cases in stations located in inland regions. For stations near the Adriatic coast and influenced by the Mediterranean climate, both thermal stresses have higher ratio values, but “strong cold stress” is more dominant (Figure 2B and Figure S2).
When examining the spring and autumn seasons, it is apparent that the ratio of thermal stress levels is very similar in both seasons, with a slight increase in the values of “slight cold stress” and “no thermal stress” in autumn. Based on PET calculations from stations in continental climate regions (plains, mountains, valleys, and cities), “extreme cold stress”, “strong cold stress”, and “moderate cold stress” occur between 75% and 95% of cases. For stations in higher altitude areas such as Zavižan, Pljevlja, and Postojna, the ratio exceeds 90% in all cases. For stations with a Mediterranean climate, the ratio of these cold stress levels ranges from 60% to 85%. Other frequency ratios of thermal stress levels favor “slight cold stress” and “no thermal stress”, but in all 32 stations, the former stress level has higher percentage values.
Frequency analysis has revealed different patterns of thermal stresses in the summer season compared to the previous seasons. In stations located in plains and mountainous regions, the frequency of cold stress levels ranges from a minimum of 45% (Bijeljina) to a maximum of 50% (Niš, Loznica, Zagreb), with mountainous regions having a higher ratio of extreme/strong/moderate cold stresses, exceeding 90%, as seen for Zavižan (Figure 2C). At all locations, “slight cold stress” is more dominant than the colder stress levels (see Figure S2). Locations in Mediterranean climate areas experienced more than 50% of cases with “no thermal stress” or “slight heat stress” levels, with a maximum value of 81% in Podgorica (Figure 2B). Alongside these two thermal stresses, the “moderate heat stress” level also occurs with a ratio of 1%. Finally, in all stations, the “no thermal stress” level is more frequent than the “slight heat stress” level (see Figure S2).

5.3. Annual and Seasonal Morning, Midday, and Evening PET Trends

This chapter presents annual and seasonal trends in PET values for all three measurement times and all 32 stations. Additionally, Figure 3 illustrates annual PET trends, while seasonal PET trends are presented in Supplementary Figure S3.
Statistically significant increasing annual trends in PET values were obtained for 18 locations, primarily for 7 a.m. and 2 p.m. observation times. Belgrade exhibited statistically significant positive trends even at 9 p.m. These significant trend values were noted in measurement locations characterized by intensive urbanization, such as Belgrade, as well as in areas with fewer urban characteristics, encompassing natural settings with continental climates, mountains, or Mediterranean regions. In most cases, statistically significant PET values ranged from 1 °C/20 y to 4 °C/20 y, but some measurement locations experienced higher trend values, including Vranje (4.5 °C/20 y at 2 p.m.), Kočevje (10.7 °C/20 y at 2 p.m.), and Bijeljina (4.1 °C/20 y at 7 a.m.). A few stations showed positive or negative PET trends that were not statistically significant. Additionally, a handful of stations exhibited statistically significant decreasing trends, as seen in Lendava (in all three terms, max. −5.8 °C/20 y at 2 p.m.), Zagreb (−1.8 °C/20 y at 7 a.m.), Pljevlja (in all three terms, max. −4.6 °C/20 y at 2 p.m.), Podgorica (−1.7 °C/20 y at 7 a.m.), Mostar (−1.4 °C/20 y at 7 a.m.), and Tuzla (max. −3.7 °C/20 y at 2 p.m.) (Figure 3).
In the winter season, statistically significant PET trends were generally less prevalent. Nevertheless, Belgrade, Novi Sad, Vranje, Kočevje, Ljubljana, Novo Mesto, Portorož, Postojna, Osijek, Banja Luka, Bijeljina, and Doboj showed statistically significant increasing PET trends, with values of 2.5 °C/20 y or higher, primarily during midday (2 p.m.) and evening (9 p.m.) periods. Statistically significant decreasing trends were observed in Lendava (−4.8 °C/20 y at 2 p.m.) and Pljevlja (in all three terms, max. −7.1 °C/20 y at 2 p.m.) (Figure S3A).
No significant trends were evident in most measurement terms during the spring period. A few statistically significant increasing trends were observed, primarily during the evening period (at 9 p.m.), in Belgrade, Kočevje, Banja Luka, and Bijeljina, with values ranging from 1.4 °C/20 y to 3 °C/20 y. Strong increasing trends were noted in Kočevje (11.6 °C/20 y at 2 p.m. and 7.6 °C /20 yat 7 a.m.). Conversely, substantial decreasing trends were calculated in Lendava (in all three terms, max. −7.9 °C/20 y at 2 p.m.), Zagreb (−4.2 °C/20 y at 7 a.m.), Pljevlja (in all three terms, max. −9.2 °C/20 y at 7 a.m.), Podgorica (−3.9 °C/20 y), Mostar (−3.6 °C/20 y at 7 a.m.), and Tuzla (in all three terms, max. −5.5 °C/20 y at 2 p.m.) (Figure S3B).
During the summer period, a few cities exhibited statistically significant increasing trends, which were more common in this season compared to winter and spring. Kočevje showed very strong increasing trends in all three terms (max. 11 °C/20 y at 2 p.m.), followed by Belgrade (in all three terms, max. 3.7 °C/20 y at 2 p.m.), Vranje (4.6 °C/20 y at 2 p.m.), Novo Mesto (3.8 °C/20 y at 2 p.m.), and other cities, with significant increases during morning or evening times. Conversely, significant decreasing trends were noticed in Lendava, Pljevlja (with a maximum value of −12.4 °C/20 y), Mostar, and Tuzla (Figure S3C).
In the autumn season, statistically significant increasing trends were observed in most measurement terms. Substantial PET values ranged from 1.4 °C/20 y at 7 a.m. in Trebinje to 10.7 °C/20 y at 2 p.m. in Kočevje. Strong increasing trends were evident in measurement locations characterized by intensive urbanization, such as Belgrade (in all three terms), Vranje, Ljubljana, Banja Luka, Bijeljina, and Doboj. Similar tendencies were observed in less urbanized Novi Sad and Osijek, which are located in plains with a continental climate. Cities under the influence of the Mediterranean, like Trebinje and Split, also displayed statistically significant increasing trends in all three periods of the day. Additionally, some significant decreasing trends were recognized in Lendava and Pljevlja (in all three terms, max. −5.4 °C/20 y at 7 a.m.) (Figure S3D).

5.4. Comparison Results of Urban and Non-Urban Measurement Sites

In Table 5, we present a comparison of paired stations with similar geographical surroundings, such as plains, altitudes below 200 m above sea level, and similar climates. However, these stations differ in their built-up and land cover features, allowing us to compare urban and non-urban measurement sites (e.g., BG-VŽ, LJ-NM). Additionally, we include two measurement sites in Mediterranean climates with similar environments (ST-DU). The table also includes a brief comparison comment for each paired station.

6. Discussion

This study is one of the first that covers broader regions of Balkan countries and provides insight into the biometeorological conditions of five countries using the 20-year data from multiple stations from each country (32 stations in total). The use of thermal indices such as PET is more useful for thermal sensation evaluation than only information about single meteorological parameters, as it considers the effects of atmospheric conditions on the human body and is also easier for people to understand [14,25,44,45,46]. Analysis of annual and seasonal characteristics of PET distribution for each station, for the morning, midday, and evening hours, as well as PET categories frequencies and trends, provides a comprehensive overview of the biometeorological conditions over Balkan cities.
The results of this study reveal that the bioclimatological conditions of the Balkan cities strongly depend on their geographical location, climatological background, and landscape characteristics, as well as urban surroundings. For example, at the annual average, but also at the seasonal average, stations with the highest altitude express higher levels of cold stress. Thus, mountain station Zavižan almost in all cases records extreme or strong cold stress according to the PET index. In addition, stations Postojna and Pljevlja often record strong to extreme annual average levels of cold stress, but also in winter, spring, and autumn. Not only do highly elevated areas encounter increased cold stress, but also regions situated in continental plains such as Murska Sobota and Osijek. This phenomenon is likely attributed to the continental climate prevalent in these locations. Conversely, weather stations proximate to the Adriatic coast, including Dubrovnik and Podgorica, or those in more continental segments of the Balkan peninsula, like Lendava, Loznica, Bijeljina, Mostar, and Niš, often witness heightened heat stress or reduced cold stress during winter. This variance is likely due to local climate conditions influenced by factors such as topography, solar exposure, and latitude positioning, though urbanization effects may also play a role. There is a strong need for OTC data sets that can aid urban planners and architects [47], because urban geometry strongly influences the outdoor thermal conditions at micro-scale (street level) and could have implications for urban planning and design [48]. Therefore, the OTC data sets are important sources for further comprehensive and more detailed climate-cautious urban design, such as an assessment of the relationship between environmental data and building geometry [49]. Up to now, it is quite certain that urban microclimate and outdoor thermal conditions vary greatly within different urban morphology, i.e., depends on building heights, dense trees, and the ratio of shadows. For instance, streets with low-height buildings lead to more stressful thermal conditions, contrary to narrow streets with high buildings and dense trees where the PET values may reach comfortable conditions, particularly during the hot peak period and afternoon time [50].
Previous research from Balkan countries confirms that geographical location and local landscape characteristics have an impact on bioclimate conditions [44]. For example, Črepinšek et al. [24] showed that submediterranean (Bilje, Portorož) and subcontinental (Ljubljana, Maribor, Novo Mesto, Črnomelj) climate regions in Slovenia experience more intensive and longer stressful bioclimatic conditions, compared to the moderate climate of hilly (Slovenj Gradec, Postojna) and Alpine climate region (Rateče). They confirm that for the considered stations in the period 2000–2021, a large share of the summer days is characterized by moderate, strong, or very strong heat stress [24]. A study by Zaninović et al. [27] showed that in the period 1955–2004 in Zavižan (Croatian Dinaric Alps) and Kredarica (Slovenian Julian Alps), PET values showed prevailing very cold thermal sensation, varying from very cold winters to cold and cool summers. Basarin et al. [46] used a longer data set (1992–2013) for bioclimate assessment in Zlatibor mountain, in the morning, midday, and evening hours, and the results show that extreme cold stress is present in morning and evening hours in the late autumn, winter, and early spring. In early autumn and later spring, PET values show mostly comfortable conditions throughout the day. During summer, PET values in the morning and evening hours show comfortable conditions, while for midday hours, hot thermal stress is observed [46]. These results are consistent with the results from the current study that show that higher elevated stations (Zavižan, Postojna) and locations with pronounced continentality [51] (e.g., Murska Sobota, Osijek) experience colder thermal sensations. A recent study on biometeorological conditions in Serbia based on 20-year data from 27 official meteorological stations shows that the majority of the cities in summer experience some degree of heat stress, “slight heat stress” (recorded at 17 stations), or “moderate heat stress” (recorded at 9 stations). The most uncomfortable conditions are observed in Niš [21]. On the annual level, PET values indicate the occurrence of cold stress throughout the county, with “moderate cold stress” observed at 10 stations and “slight cold stress” observed at 17 stations. The highest values are observed in Niš and Loznica, which is in good accordance with this study, given that the PET values for all measurement times in Serbia are the highest for Niš and Loznica as well.
When analyzing frequencies of the occurrence of different thermal stress categories, this study shows that in the morning and evening hours, cold stress occurs more frequently than heat stress in the Balkan peninsula in winter, spring, autumn, and annually. The ratio of cold stress categories is distinct in different locations, depending on their geographical positions and the environmental characteristics of the station’s surroundings. In summer, periods with “no thermal stress” are more frequent, as well as periods with “slight cold stress” and “slight heat stress”. In the midday hours, periods with “no thermal stress” or “slight thermal stress” occur more frequently in spring and autumn; in winter, the most frequent are periods with a certain level of cold stress, while in summer, periods with a certain level of heat stress are the most pronounced. Recent studies from the Balkan countries show similar results [21,22,23]. The results from the long-term analysis of biometeorological conditions in Serbia indicate that on an annual level, cold stress (slight to extreme) occurs most frequently at almost all the observed stations (26 of 27). Cold stresses are more frequent in mountainous areas than plains and low-lying areas. Heat stress (slight to strong) occurs less frequently in Serbia compared to cold stress, e.g., from 12% at higher altitudes (Sjenica) to 39% in urban areas (Niš) [21]. Pecelj et al. [22] reported that in summer midday hours, the most dominant is “moderate heat stress” in Belgrade according to the UTCI index. A study by Malinović-Milićević [23] shows that due to the climatic characteristics of the area, Sarajevo has a higher frequency of cold stress categories than Banja Luka, while Banja Luka has a higher frequency of heat stress categories. Both Sarajevo and Banja Luka experience at least “strong heat stress” in summer midday hours. In winter midday hours, at least “strong cold stress” was reported, while in spring and autumn midday hours, “no thermal stress” occasions are the most frequent. In the morning and evening hours, cold stress was the most frequent in winter and transitional seasons (spring and autumn), while in summer it was the “no thermal stress” category in Sarajevo and “slight heat stress” in Banja Luka [23].
The analysis of the PET trends in Balkan countries shows that most of the sites in the Balkan peninsula (18 stations) will experience increased PET levels at least for two out of three measurement periods. An increasing trend of PET values is noticed in the highly urbanized areas, but also in other areas that are less urbanized, in some cases in mountain and coastal areas. The highest statistically significant PET increase trends are observed at the station Kočevje (up to 10.7 °C/20 y). However, there are some stations where the decreasing trend of PET values is observed, such as Lendava (up to −5.8 °C/20 y) and Pljevlja (up to −4.6 °C/20 y). The results in this study are in good accordance with previous studies for this area. For example, a study of biometeorological conditions in Banja Luka based on long-term data (1961–2020) shows an increasing trend of PET values, as of 0.7 °C per decade [5]. The same study shows that in the last three decades, mean values of PET are higher compared to the previous period. The results from the long-term (1961–2014) analysis of the bioclimate of Loznica indicate that statistically significant increasing trends in annual and seasonal values of PET exist. The study reveals the increase in the number of days with PET > 29 °C, an increasing trend in PET values of 0.63ºC per year, and that every year there are 0.44 more extremely warm days [52]. Slovenia’s bioclimatic conditions have changed during the period 1951–2000. Significant changes were noted for the PET, which increased significantly by almost 3 °C during the last 25 years in Ljubljana and Kredarica [51]. As noticed in the current study, an increasing trend of PET values is observed in the mountainous regions too, which was previously reported by Zaninović et al. [27] for Zavižan and Kredarica.
The research encountered several information and data obstacles, which can be categorized into the following elements:
  • Availability of daily meteorological data: Acquiring daily data for air temperature, relative humidity, wind, and cloudiness over a 20-year period posed a significant challenge. Even when data from national official stations were accessible, daily data were not publicly available in most countries. In some cases, several months were required to obtain data sets, and in one country, only co-authors from that specific nation were permitted to analyze the data. These hurdles collectively hindered the timely and efficient progress of thermal assessments.
  • Station location metadata: Obtaining daily data was challenging, and precise metadata, such as information regarding station relocations or the transition from analogue to automatic stations, were particularly difficult to obtain. Consequently, this study provides minimal presentation of metadata related to station changes. It is generally recognized that automatic weather stations are predominantly installed at primary station locations in almost all countries. Additionally, based on satellite imagery, it was deduced that the station in Podgorica had been recently relocated.
  • Network density: The study utilized stations with reliable data quality. Regrettably, during the conflicts of the last decade of the 20th century and the economic and political transitions at the beginning of the 21st century, many stations were discontinued in all countries. This reduction in station density limited the spatial coverage of the research area.
  • Metadata of micro-location surroundings: Official information regarding changes in urban morphology was exceedingly limited and unavailable for the majority of cities. Consequently, this study does not provide a separate explanation for these urban environment changes.
The comparisons with the previous studies are limited due to the lack of bioclimate studies for all regions included in this study. Furthermore, different bioclimate indices were used in the existing studies, which imply certain differences in the evaluation of thermal conditions when using different indices (PET, mPET, UTCI) [22]. However, certain patterns can be confirmed by the results from previous studies. Using the PET index and comparing bioclimate conditions in different areas across five Balkan countries makes this study comprehensive and allows a better understanding of the bioclimate conditions of 32 areas across the Balkans.

7. Conclusions

The acquisition and assessment of thermal conditions in cities have become increasingly important for addressing environmental and public health concerns. However, obtaining comprehensive and detailed urban meteorological data sets with high-density station networks and long-term measurements remains a significant challenge, even in the 21st century. This study aimed to conduct a bioclimate assessment in cities using the PET index and meteorological data sets from 32 official national meteorological stations across five countries in the western part of the Balkan Peninsula.
The data sets collected from these selected stations offer the potential for long-term, mid-term, or short-term climate analysis. The results of this study suggest that these stations or measurement locations can serve as representative sources of data for assessing thermal conditions in cities, considering their positions within urban areas. Out of the 32 stations, 25 are situated in densely built-up urban areas or suburban regions of the analyzed cities.
In addition to climate type and relief-related factors, urbanization also plays a crucial role in shaping climate characteristics and OTC conditions. Therefore, alongside climate monitoring through in situ station networks within urban areas or mobile measurement campaigns in built-up regions, national meteorological stations, in many cases, can provide relevant data for analyzing urban climate on a local or micro-scale.
Despite the considerable geographical scope of this research, which might suggest the emergence of certain groupings of stations experiencing similar thermal stress, no discernible spatial pattern or trends in thermal stress are identified. This underscores the substantial impact of local factors, including LCZs and built-up density, on the thermal attributes of urban areas. Consequently, when planning and implementing measures to mitigate heat stress within cities, it becomes imperative to conduct a thorough analysis of the climatic attributes and consider the unique characteristics of each urban locale.
National meteorological stations typically possess sufficiently extensive and reliable meteorological data sets, which are indispensable for investigating shifts in urban bioclimatic conditions. Nevertheless, it is important to recognize that heat stress does not uniformly pervade urban areas. The process of urbanization can accentuate thermal stress in specific urban zones. Hence, in addition to utilizing these established meteorological stations, there is a compelling need to expand the network of measurements. Furthermore, supplementing the data spatially can be achieved through targeted mobile measurement campaigns. This approach facilitates the acquisition of a more granular spatial understanding of thermal stress distribution within urban environments. Such detailed insights are indispensable for formulating strategic climate change mitigation and adaptation plans and measures, whether at the national or municipal level.
This research contributes valuable insights into assessing and addressing urban climate challenges in the western part of the Balkan Peninsula and serves as a model for similar studies in other regions.

Supplementary Materials

The following supporting information can be downloaded at: https://www.mdpi.com/article/10.3390/su152115286/s1, Figure S1: Spatial characteristics of each meteorological station surrounding; Figure S2: Frequency analysis (in %) of different PET stress levels at (a) 7 a.m., (b) 2 p.m. and (c) 9 p.m.; Figure S3: Seasonal (winter–A, spring–B, summer–C, autumn–D) trends of averaged PET values across the research area for the period 2001–2020; Table S1: The main geographical features of the research area; Table S2: Physiological Equivalent Temperature (PET) range for different levels of thermo-physiological stress.

Author Contributions

Conceptualization, S.S. and D.Đ.; methodology, D.M.; software, M.O.; validation, J.D., I.Š. and M.V.; formal analysis, M.P., S.Š., M.L., M.Ž., M.B., I.H.B. and M.I.; resources, G.T., L.M. and G.Ć.; writing—original draft preparation, D.Đ., S.S. and J.D.; writing—review and editing, D.Đ., M.V., D.M. and I.H.B.; visualization, M.Ž.; supervision, S.S. and M.O.; project administration, D.M.; funding acquisition, S.S., M.O. and I.H.B. All authors have read and agreed to the published version of the manuscript.

Funding

This research was funded by Ministry of Science, Technological Development and Innovation of the Republic of Serbia (Grant no. 451-03-47/2023-01/200125). The work of I.H.B., M.B. and M.Ž. has been supported in part by Croatian Science Foundation under the project HRZZ-UIP-2017-05-6396 (CroClimGoGreen). The work of M.B. was financed by Croatian Science Foundation (HRZZ-DOK-2021-02-9704).

Institutional Review Board Statement

Not applicable.

Informed Consent Statement

Not applicable.

Data Availability Statement

A reasonable request can be made to the corresponding author for the data that support the findings of this study.

Conflicts of Interest

The author Dejana Đurđević is an employee of MDPI, however she does not work for the journal Sustainability at the time of submission and publication.

References

  1. Standard 90.1-2004; Energy Standard for Buildings Except Low Rise Residential Buildings. American Society of Heating, Refrigerating and Air-Conditioning Engineers, Inc.: Atlanta, GA, USA, 2004.
  2. Coccolo, S.; Kämpf, J.; Scartezzini, J.L.; Pearlmutter, D. Outdoor human comfort and thermal stress: A comprehensive review on models and standards. Urban. Clim. 2016, 18, 33–57. [Google Scholar] [CrossRef]
  3. Hondula, D.M.; Balling, R.C.; Andrade, R.; Krayenhoff, E.S.; Middel, A.; Urban, A.; Georgescu, M.; Sailor, D.J. Biometeorology for cities. Int. J. Biometeorol. 2017, 61, 59–69. [Google Scholar] [CrossRef] [PubMed]
  4. Masson-Delmotte, V.; Zhai, P.; Pirani, A.; Connors, S.L.; Pean, C.; Berger, S.; Caud, N.; Chen, Y.; Goldfarb, L.; Gomis, M.I.; et al. (Eds.) IPCC, Summary for Policymakers. In Climate Change 2021: The Physical Science Basis. Contribution of Working Group I to the Sixth Assessment Report of the Intergovernmental Panel on Climate Change; Cambridge University Press: Cambridge, UK; New York, NY, USA, 2021; pp. 3–32. [Google Scholar] [CrossRef]
  5. Savić, S.; Trbić, G.; Milošević, D.; Dunjić, J.; Ivanišević, M.; Marković, M. Importance of assessing outdoor thermal comfort and its use in urban adaptation strategies: A case study of Banja Luka (Bosnia and Herzegovina). Theor. Appl. Climatol. 2022, 150, 1425–1441. [Google Scholar] [CrossRef]
  6. WMO. State of the Climate in Europe 2022; WMO-No. 1320; World Meteorological Organization: Geneva, Switzerland, 2023; p. 40. [Google Scholar]
  7. Copernicus Climate Change Service. The Last 12 Months—October 2022 to September 2023; European Commission. 2023. Available online: https://climate.copernicus.eu/surface-air-temperature-september-2023 (accessed on 2 October 2023).
  8. UN. World Cities Report 2022—Envisaging the Future of Cities; United Nations Human Settlements Programme (UN-Habitat): New York, NY, USA, 2022; p. 387. Available online: https://unhabitat.org/sites/default/files/2022/06/wcr_2022.pdf (accessed on 2 October 2023).
  9. Charalampopoulos, I.; Tsiros, I.; Chronopoulou-Sereli, A.; Matzarakis, A. Analysis of thermal bioclimate in various urban configurations in Athens, Greece. Urban. Ecosyst. 2013, 16, 217–233. [Google Scholar] [CrossRef]
  10. Oke, T.; Mills, G.; Christen, A.; Voogt, J. Urban Climates; Cambridge University Press: Cambridge, UK, 2017; p. 519. [Google Scholar] [CrossRef]
  11. Unger, J.; Skarbit, N.; Gal, T. Evaluation of outdoor human thermal sensation of local climate zones based on long-term database. Int. J. Biometeorol. 2018, 62, 183–193. [Google Scholar] [CrossRef] [PubMed]
  12. Perkins, S.E.; Alexander, L.V.; Nairn, J.R. Increasing frequency, intensity and duration of observed global heatwaves and warm spells. Geophys. Res. Lett. 2012, 39, L20714. [Google Scholar] [CrossRef]
  13. Rozbicka, K.; Rozbicki, T. Long-term variability of bioclimatic conditions and tourism potential for Warsaw agglomeration (Poland). Int. J. Biometeorol. 2021, 65, 1485–1495. [Google Scholar] [CrossRef]
  14. Bleta, A.; Nastos, P.T.; Matzarakis, A. Assessment of bioclimatic conditions on Crete Island, Greece. Reg. Environ. Chang. 2014, 14, 1967–1981. [Google Scholar] [CrossRef]
  15. Taleghani, M. Outdoor thermal comfort by different heat mitigation strategies—A review. Renew. Sust. Energ. Rev. 2023, 81, 2011–2018. [Google Scholar] [CrossRef]
  16. Johansson, E.; Thorsson, S.; Emmanuel, R.; Kruger, E. Instruments and methods in outdoor thermal comfort studies—The need for standardization. Urban. Clim. 2014, 10, 346–366. [Google Scholar] [CrossRef]
  17. Matzarakis, A.; Mayer, H. Another kind of environmental stress: Thermal stress. WHO Newsl. 1996, 18, 7–10. [Google Scholar]
  18. Hoppe, P. The physiological equivalent temperature–a universal index for the biometeorological assessment of the thermal environment. Int. J. Biometeorol. 1999, 43, 71–75. [Google Scholar] [CrossRef] [PubMed]
  19. Potchter, O.; Cohen, P.; Lin, T.P.; Matzarakis, A. Outdoor human thermal perception in various climates: A comprehensive review of approaches, methods and quantification. Sci. Total Environ. 2018, 631, 390–406. [Google Scholar] [CrossRef]
  20. Dunjić, J. Outdoor thermal comfort research in urban areas of Central and Southeast Europe: A review. Geogr. Pannonica 2019, 23, 359–373. [Google Scholar] [CrossRef]
  21. Milošević, D.; Dunjić, J.; Stojsavljević, R.; Žgela, M.; Savić, S.; Arsenović, D. Analysis of long- and short-term biometeorological conditions in the Republic of Serbia. Int. J. Biometeorol. 2023, 67, 1105–1123. [Google Scholar] [CrossRef] [PubMed]
  22. Pecelj, M.; Matzarakis, A.; Vujadinović, M.; Radovanović, M.; Vagić, N.; Đurić, D.; Cvetkovic, M. Temporal analysis of urban suburban PET, mPET and UTCI indices in Belgrade (Serbia). Atmosphere 2021, 12, 916. [Google Scholar] [CrossRef]
  23. Malinović-Milićević, S. Biometeorological conditions of urban and suburban areas in Bosnia and Herzegovina. Theor. Appl. Climatol. 2023, 153, 697–708. [Google Scholar] [CrossRef]
  24. Črepinšek, Z.; Žnidaršič, Z.; Pogačar, T. Spatio-Temporal Analysis of the Universal Thermal Climate Index (UTCI) for the Summertime in the Period 2000–2021 in Slovenia: The Implication of Heat Stress for Agricultural Workers. Agronomy 2023, 13, 331. [Google Scholar] [CrossRef]
  25. Brosy, C.; Zaninovic, K.; Matzarakis, A. Quantification of climate tourism potential of Croatia based on measured data and regional modeling. Int. J. Biometeorol. 2014, 58, 1369–1381. [Google Scholar] [CrossRef]
  26. Nimac, I.; Herceg-Bulić, I.; Žuvela-Aloise, M. The contribution of urbanisation and climate conditions to increased urban heat load in Zagreb (Croatia) since the 1960s. Urban Clim. 2022, 46, 101343. [Google Scholar] [CrossRef]
  27. Zaninović, K.; Matzarakis, A.; Cegnar, T. Thermal Comfort Trends and Variability in the Croatian and Slovenian Mountains. Meteorol. Z. 2006, 15, 243–251. [Google Scholar] [CrossRef] [PubMed]
  28. Zaninović, K.; Matzarakis, A. Impact of heat waves on mortality in Croatia. Int. J. Biometeorol. 2014, 58, 1135–1145. [Google Scholar] [CrossRef] [PubMed]
  29. ISRBC. 2nd Sava River Basin Analysis Report. Secretariat of the International Sava River Basin Commission. 2016. Available online: http://savacommission.org/publication (accessed on 2 October 2023).
  30. Kottek, M.; Grieser, J.; Beck, C.; Rudolf, B.; Rubel, F. World Map of the Koppen-Geiger climate classification updated. Meteorol. Z. 2006, 15, 259–263. [Google Scholar] [CrossRef]
  31. Stewart, I.D.; Oke, T.R. ‘Local Climate Zones’ for urban temperature studies. Bull. Am. Meteorol. Soc. 2012, 93, 1879–1900. [Google Scholar] [CrossRef]
  32. Republic Hydrometeorological Service of Serbia. Available online: https://www.hidmet.gov.rs/index_eng.php (accessed on 2 October 2023).
  33. Croatian Meteorological and Hydrological Service. Available online: https://meteo.hr/index_en.php (accessed on 2 October 2023).
  34. Slovenian Environment Agency, Ministry of Environment, Climate and Energy, Republic of Slovenia. Available online: http://www.arso.gov.si/en/ (accessed on 2 October 2023).
  35. Institute of Hydrometeorology and Seismology, Republic of Montenegro. Available online: http://www.meteo.co.me/ (accessed on 2 October 2023).
  36. Republic Hydrometeorological Institute, Republic of Srpska, B&H. Available online: https://rhmzrs.com/ (accessed on 2 October 2023).
  37. Federalni Hidrometeorološki Zavod, B&H. Available online: https://www.fhmzbih.gov.ba/latinica/ (accessed on 2 October 2023).
  38. Mayer, H.; Hoppe, P. Thermal comfort of man in different urban environments. Theor. Appl. Climatol. 1987, 38, 43–49. [Google Scholar] [CrossRef]
  39. Matzarakis, A.; Mayer, H.; Iziomon, M.G. Applications of a universal thermal index: Physiological equivalent temperature. Int. J. Biometeorol. 1999, 43, 76–84. [Google Scholar] [CrossRef] [PubMed]
  40. Ketterer, C.; Matzarakis, A. Mapping the Physiologically Equivalent Temperature in urban areas using artificial neural network. Landsc. Urban. Plan. 2016, 150, 1–9. [Google Scholar] [CrossRef]
  41. Chatterjee, S.; Khan, A.; Dinda, A.; Mithun, S.; Khatun, R.; Akbari, H.; Kusaka, H.; Mitra, C.; Sallem Bhatti, S.; Van Doan, Q.; et al. Simulating micro-scale thermal interactions in different building environments for mitigating urban heat islands. Sci. Total Environ. 2019, 663, 610–631. [Google Scholar] [CrossRef]
  42. Nouri, A.S.; Charalampopoulos, I.; Matzarakis, A. The application of the physiologically equivalent temperature to determine impacts of locally defined extreme heat events within vulnerable dwellings during the 2020 summer in Ankara. Sustain. Cities Soc. 2022, 81, 103833. [Google Scholar] [CrossRef]
  43. Matzarakis, A.; Rutz, F.; Mayer, H. Modelling radiation fluxes in simple and complex environments—Application of the RayMan model. Int. J. Biometeorol. 2007, 51, 323–334. [Google Scholar] [CrossRef]
  44. Zaninović, K.; Matzarakis, A. The bioclimatological leaflet as a means conveying climatological information to tourists and the tourism industry. Int. J. Biometeorol. 2009, 53, 369–374. [Google Scholar] [CrossRef] [PubMed]
  45. Basarin, B.; Kržič, A.; Lazić, L.; Lukić, T.; Đorđević, J.; Janićijević Petrović, B.; Ćopić, S.; Matić, D.; Hrnjak, I.; Matzarakis, A. Evaluation of bioclimate conditions in two special nature reserves in Vojvodina (Northern Serbia). Carpathian J. Earth Environ. Sci. 2014, 9, 93–108. [Google Scholar]
  46. Basarin, B.; Lukić, T.; Bjelajac, D.; Micić, T.; Stojićević, G.; Stamenković, I.; Đorđević, J.; Đorđević, T.; Matzarakis, A. Bioclimatic and climatic tourism conditions at Zlatibor Mountain (Western Serbia). IDŐJÁRÁS 2018, 122, 321–343. [Google Scholar] [CrossRef]
  47. Matzarakis, A.; Rutz, F.; Mayer, H. Modelling radiation fluxes in simple and complex environments: Basics of the RayMan model. Int. J. Biometeorol. 2010, 54, 131–139. [Google Scholar] [CrossRef] [PubMed]
  48. Johansson, E. Influence of urban geometry on outdoor thermal comfort in a hot dry climate: A study in Fez, Morocco. Build. Environ. 2006, 41, 1326–1338. [Google Scholar] [CrossRef]
  49. Roudsari, M.S.; Pak, M.; Smith, A. Ladybug: A parametric environmental plugin for Grasshopper to help designers create an environmentally-conscious design. In Proceedings of the 13th Conference of International Building Performance Simulation Association, Proceedings of BS2013, Chambery, France, 26–28 August 2013; International Building Performance Simulation Association (IBPSA): Verona, WI, USA, 2013; pp. 3128–3135. [Google Scholar]
  50. Yahia, M.W.; Johansson, E.; Thorsson, S.; Lindberg, F.; Rasmussen, M.I. Effect of urban design on microclimate and thermal comfort outdoors in warm-humid Dar es Salaam, Tanzania. Int. J. Biometeorol. 2018, 62, 373–385. [Google Scholar] [CrossRef]
  51. Cegnar, T.; Matzarakis, A. Climate and bioclimate variations in Slovenia and their application for tourism. Adv. Tour. Climatol. 2004, 12, 66–73. [Google Scholar]
  52. Stojićević, G.; Basarin, B.; Lukić, T. Detailed bioclimate analysis of Banja Koviljača (Serbia). Geogr. Pannonica 2016, 20, 127–135. [Google Scholar] [CrossRef]
Figure 1. Research area and locations of the analyzed meteorological stations. All stations on the map are presented with abbreviated names (see Table 1). Background map: Esri, HERE, Garmin, FAO, NOAA, USGS.
Sustainability 15 15286 g001
Figure 2. Frequency analysis (in %) of different PET stress levels for (A) Belgrade (Serbia), (B) Podgorica (Montenegro), and (C) Zavižan (Croatia). The small letter marks (ac) represent PET stress patterns from observation times at 7 a.m., 2 p.m., and 9 p.m. Note: Frequency analysis for the other 29 stations is presented in Figure S2.
Sustainability 15 15286 g002
Figure 3. Annual trends of averaged PET values across the research area in the period 2001–2020. Note: The trends are expressed in °C per 20-year period. Statistically significant trends (95% of confidence level) are marked with an asterisk (*). The letter marks (AC) represent PET trends from measurement terms at 7 a.m., 2 p.m., and 9 p.m. PET trends on seasonal levels are presented in Figure S3.
Sustainability 15 15286 g003aSustainability 15 15286 g003b
Table 1. The list of analyzed meteorological stations with their basic information.
No.CountryStation NameAbbr.Main Meteorological Station (Yes/No)Inside the Urban Area-1 or Outside of Urban Area-2
(Distance in km)
1SerbiaBelgradeBGYes1
2SerbiaLoznicaLOYes1
3SerbiaNišNIYes1
4SerbiaNovi SadNSYes2 (1.9 km)
5SerbiaVranjeVRYes1
6SloveniaKočevjeKOYes1
7SloveniaLendavaLENo1
8SloveniaLjubljanaLJYes1
9SloveniaMurska SobotaMSNo2 (1.2 km)
10SloveniaNova GoricaNGNo1
11SloveniaNovo MestoNMNo1
12SloveniaPortorožPRYes2 (3.4 km)
13SloveniaPostojnaPOYes1
14CroatiaZavižanZAYes2 (20.0 km)
15CroatiaZagrebZGYes1
16CroatiaZadarZDYes1
17CroatiaVaraždinYes2 (1.0 km)
18CroatiaSplitSTYes1
19CroatiaRijekaRIYes1
20CroatiaPulaPUYes2 (4.7 km)
21CroatiaOsijekOSYes2 (9.6 km)
22CroatiaDubrovnikDUYes1
23MontenegroNikšićNKYes1
24MontenegroPljevljaPVYes1
25MontenegroPodgoricaPGYes1
26Bosnia and HerzegovinaBanja LukaBLYes1
27Bosnia and HerzegovinaBijeljinaBNYes1
28Bosnia and HerzegovinaDobojDONo1
29Bosnia and HerzegovinaMostarMOYes1
30Bosnia and HerzegovinaSarajevoSAYes1
31Bosnia and HerzegovinaTrebinjeTBYes1
32Bosnia and HerzegovinaTuzlaTZYes1
Note: Abbr.–abbreviation, ’how far in km’–station distance in km from the border of the urban zone.
Table 2. Average seasonal and annual PET values at 7 a.m. at official meteorological stations in the study area for the period 2001–2020. Values are given in °C.
CountriesStationsWinterSpringSummerAutumnAnnual
SERBIABelgrade8.679.3123.037.4812.12
Loznica10.0511.2923.848.3613.39
Niš10.5311.6526.328.5814.27
Novi Sad6.797.4621.534.8710.16
Vranje8.039.1322.606.2911.51
SLOVENIAKočevje5.755.5118.305.368.73
Lendava8.739.3523.826.6812.15
Ljubljana6.466.3119.525.559.46
Murska Sobota5.155.4418.913.618.28
Nova Gorica7.437.0721.176.0110.42
Novo Mesto5.415.2118.544.228.34
Portorož8.247.7121.327.0311.08
Postojna4.153.3416.733.716.98
CROATIAZavižan−2.78−4.468.19−2.35−0.35
Zagreb9.249.7523.217.8712.52
Zadar10.569.4023.639.7313.33
Varaždin5.906.2819.814.089.02
Split12.1311.2026.0811.0015.10
Rijeka11.4311.0925.3810.0414.48
Pula10.339.0023.779.5213.16
Osijek5.656.0219.773.778.80
Dubrovnik13.6712.7527.5212.7516.67
MONTENEGRONikšić7.237.3321.695.6610.48
Pljevlja4.374.9116.593.087.24
Podgorica13.1513.6428.0311.7316.64
BOSNIA AND HERZEGOVINABanja Luka7.538.1021.225.6610.63
Bijeljina9.6510.3124.648.0713.17
Doboj7.287.5320.845.7410.35
Mostar10.8110.8124.479.4013.87
Sarajevo5.595.5918.264.418.46
Trebinje9.258.9022.158.4512.19
Tuzla8.168.9523.375.5911.52
Note: Colors indicate different thermal stress levels (legend is provided in the Figure S3).
Table 3. Average seasonal and annual PET values at 2 p.m. at official meteorological stations in the study area for the period 2001–2020. Values are given in °C.
CountriesStationsWinterSpringSummerAutumnAnnual
SERBIABelgrade17.7118.4933.1917.3021.67
Loznica20.1820.4134.2320.2123.76
Niš20.1920.0535.7020.5824.13
Novi Sad16.8317.4832.5416.5920.86
Vranje16.8716.7231.8017.1220.63
SLOVENIAKočevje18.7419.4232.8317.7522.19
Lendava21.7223.0237.5220.8925.79
Ljubljana16.9217.4431.6916.1120.54
Murska Sobota16.0716.8331.0915.2719.82
Nova Gorica19.2218.4433.4218.7322.45
Novo Mesto17.0417.4331.7116.2220.60
Portorož18.4117.1231.6818.3221.38
Postojna14.1813.9428.6713.3117.53
CROATIAZavižan2.471.1215.812.225.40
Zagreb17.5118.3632.4716.2221.14
Zadar18.5316.6431.4718.6821.33
Varaždin15.1615.7329.8414.2418.74
Split19.8318.1334.2019.5422.93
Rijeka19.9119.2033.8119.2223.03
Pula17.7015.9131.4617.5520.66
Osijek17.1018.1832.7616.4221.11
Dubrovnik20.4918.3933.5320.9123.33
MONTENEGRONikšić15.0713.0029.2715.0918.11
Pljevlja16.4915.9930.2516.7019.86
Podgorica23.6122.6938.9123.4727.17
BOSNIA AND HERZEGOVINABanja Luka19.1519.4234.2218.3922.79
Bijeljina21.2521.7737.4921.0325.38
Doboj20.6821.7635.7020.0324.54
Mostar22.9622.3238.8722.8926.76
Sarajevo17.4217.2331.8617.4620.99
Trebinje20.3718.6334.7220.6823.60
Tuzla21.0521.6435.8620.9324.87
Note: Colors indicate different thermal stress levels (legend is provided in the Figure S3).
Table 4. Average seasonal and annual PET values at 9 p.m. at official meteorological stations in the study area for the period 2001–2020. Values are given in °C.
CountriesStationsWinterSpringSummerAutumnAnnual
SERBIABelgrade7.107.1917.787.199.82
Loznica8.248.2817.778.4510.69
Niš7.567.5817.867.9610.24
Novi Sad5.856.0716.296.118.58
Vranje5.975.9615.856.508.57
SLOVENIAKočevje4.484.0013.565.156.80
Lendava6.026.0615.616.378.51
Ljubljana6.456.2016.476.808.98
Murska Sobota4.724.8214.824.897.31
Nova Gorica7.016.6116.487.429.38
Novo Mesto5.835.8615.895.948.38
Portorož6.795.7615.887.318.93
Postojna3.993.3913.674.496.38
CROATIAZavižan−3.71−5.305.54−2.85−1.58
Zagreb7.767.6917.827.9310.30
Zadar9.177.6518.219.9911.25
Varaždin4.995.0114.875.167.51
Split10.488.8520.3111.2012.71
Rijeka8.677.5617.809.2410.82
Pula9.157.6819.009.7611.40
Osijek5.415.5715.785.538.07
Dubrovnik11.118.9919.6413.2413.25
MONTENEGRONikšić5.384.4915.185.847.72
Pljevlja3.943.8213.384.146.32
Podgorica11.0110.1621.3411.3613.47
BOSNIA AND HERZEGOVINABanja Luka7.017.0117.146.999.54
Bijeljina7.697.6818.067.9410.34
Doboj7.207.3017.077.389.74
Mostar9.688.8919.5310.0312.03
Sarajevo4.154.5111.375.266.32
Trebinje8.417.2418.288.8910.70
Tuzla5.895.8615.216.198.29
Note: Colors indicate different thermal stress levels (legend is provided in the Figure S3).
Table 5. Comparison analysis of the PET values for paired stations.
Station NameAbb.Alt.LCZ TypeAverage Summer PET DifferencesLevels of Heat Stress (PET Scale)/Summer at 2 p.m.Significant Annual/Seasonal PET Trends
BelgradeBG132LCZB/2(BG-VŽ)
at 7 a.m.: 3.22 °C
at 2 p.m.:3.35 °C
at 9 p.m.: 2.91 °C
Extreme: 14%
Strong: 31%
Moderate: 29%
At 7 a.m.: 3 (summer, autumn, annual)
At 2 p.m.: 3 (like at 7 a.m.)
At 9 p.m.: all seasons
Varaždin167LCZDExtreme: 4%
Strong: 21%
Moderate: 34%
At 7 a.m.: 0
At 2 p.m.: 0
At 9 p.m.: 0
COMMENTThe station in BG is situated within a small green area, surrounded by densely built-up surroundings that have undergone intensive urbanization between 2001 and 2020. In contrast, the VŽ station is located in a rural setting, approximately 1 km away from the city, and surrounded by arable land. Both stations are primarily situated in plains with altitudes below 200 m.a.s.l. and experience a predominant continental climate. Across all observation times, the average differences in summer PET values are approximately 3 °C higher in BG. Moreover, extreme/strong heat stress levels are around 10% larger in BG during the summer period (particularly at 2 p.m.). Additionally, the station in BG exhibits significant PET trends in 10 out of a maximum of 15 cases, whereas VŽ shows no significant PET trends. These findings potentially indicate the presence of temperature amplification (even the RH and wind should be considered, too) within urban areas, as is observed in BG. Consequently, the station in BG holds relevance for further climate research on micro and local scales.
LjubljanaLJ298LCZ2/3(LJ-NM)
at 7 a.m.: 0.98 °C
at 2 p.m.: −0.02 °C
at 9 p.m.: 0.58 °C
Extreme: 6%
Strong: 28%
Moderate: 34%
At 7 a.m.: 4 (except winter)
At 2 p.m.: 3 (winter, autumn, annual)
At 9 p.m.: 4 (except spring)
Novo MestoNM214LCZB/6Extreme: 8%
Strong: 27%
Moderate: 34%
At 7 a.m.: 1 (annual)
At 2 p.m.: 4 (except spring)
At 9 p.m.: 0
COMMENTLJ and NM stations are situated in valleys with a continental climate at altitudes ranging from 200 to 300 m.a.s.l. The LJ station is located in a densely built-up area, indicating the likely presence of intensive urbanization in this area over the past 20 years. Conversely, the NM station is situated in a less urbanized area, surrounded by more green space. The results reveal higher PET values during the morning and evening hours at both stations, with a very similar ratio of PET heat stress levels. However, there is a greater occurrence of significant PET trends observed in LJ. In this case, the PET differences are not as pronounced, possibly due to the urbanization not being as diverse as in the case of BG-VŽ. Nevertheless, thermal amplification in the urban area of LJ is evident, underscoring the relevance of this measurement site for urban climate research.
SplitST122LCZB(ST-DU)
at 7 a.m.: −1.44 °C
at 2 p.m.: 0.67 °C
at 9 p.m.: 0.67 °C
Extreme: 10%
Strong: 40%
Moderate: 31%
At 7 a.m.: 2 (autumn, annual)
At 2 p.m.: 2 (like at 7 a.m.)
At 9 p.m.: 3 (summer, autumn, annual)
DubrovnikDU52LCZB/9/GExtreme: 6%
Strong: 37%
Moderate: 39%
At 7 a.m.: 2 (autumn, annual)
At 2 p.m.: 0
At 9 p.m.: 2 (like at 7 a.m.)
COMMENTIn this comparison, two stations with similar climate, relief, and LCZ were analyzed. Both stations are situated within urban areas but are predominantly surrounded by green spaces. Despite these similarities, some differences were observed in their thermal conditions. During the midday and evening hours in the summer, the average PET in ST was higher than in DU. This indicates that ST experiences higher heat stress during these times in the summer. However, this pattern was not consistent in the morning hours. ST also showed a slightly higher ratio of extreme and strong heat stress, compared to DU. However, this difference was not significant for moderate heat stress. Another observation shows that ST exhibited more significant PET trends compared to DU. Overall, the comparison results revealed relatively small differences between the two stations. This is expected since both stations are located in the same LCZ (LCZ B), but there are some variations likely due to factors such as proximity to the sea and coastal influences.
Disclaimer/Publisher’s Note: The statements, opinions and data contained in all publications are solely those of the individual author(s) and contributor(s) and not of MDPI and/or the editor(s). MDPI and/or the editor(s) disclaim responsibility for any injury to people or property resulting from any ideas, methods, instructions or products referred to in the content.

