Article

Construction of Multi-Level Ecological Security Pattern for World Natural Heritage Sites from the Perspective of Coupling and Coordination between Humans and Nature: A Case Study of Shilin Yi Autonomous County, China

1
College of Landscape Architecture and Horticulture Science, Southwest Forestry University, Kunming 650224, China
2
Southwest Survey and Planning Institute of National Forestry and Grassland Administration, Kunming 650031, China
3
School of Geography and Ecotourism, Southwest Forestry University, Kunming 650224, China
4
College of Forestry, Southwest Forestry University, Kunming 650224, China
*
Author to whom correspondence should be addressed.
Sustainability 2023, 15(20), 15052; https://doi.org/10.3390/su152015052
Submission received: 9 June 2023 / Revised: 22 September 2023 / Accepted: 28 September 2023 / Published: 19 October 2023

Abstract

:
Building ecological networks (ENs) is an important means to guarantee regional ecological security and achieve sustainable urban development. Development of ENs usually occurs at the county- or urban-area-scale, and there is a lack of linkage between ENs at different levels. Based on the systematic analysis of local environmental characteristics and ecological mechanisms of action in karst areas, the ENs at the county and urban areas levels are combined to build an ecological security pattern (ESP) for Shilin Yi Autonomous County (SYAC), a World Natural Heritage site. The results show that there are 18 Ecological resources in SYAC, with a total area of 326.512 km2 and 29 ecological corridors. In the northern part of the county, an absence of ecological resources and corridors occurred due to the fragmentation of landscape patches and poor ecological service functionality. In this study, three new ecological resources and seven corridors were added in the northern part of the county according to the patch area and landscape connectivity index (PALCI) to balance the layout of ecological resources and corridors in SYAC and improve regional habitat quality. In addition, a total of eight cultural and natural resources were identified in the urban areas of SYAC, and ten cultural and natural landscape corridors were identified. By overlaying the ENs of the county and the urban areas, we identified 3.977 km2 of Material Exchange Conversion Zone, 12.6593 km2 of Priority Restoration Zone, and ten Ecological Stepping Stones. This work helps to establish the interface between the upper and lower levels of the network, and correct for deficiencies of conflicting ecological processes at different levels, and integrate existing green-space system planning research about karst terrains.

1. Introduction

The rapid economic development and extensive land expansion of the past two decades have put a tremendous amount of pressure on ecosystems, which have led to ecological problems like biodiversity loss, landscape fragmentation, and water scarcity [1,2,3,4,5]. In particular, the pressures caused by agriculture and tourism on the fragile ecosystem services of karst landscape cities directly affect sustainable development and pose a serious threat to flora and fauna and the survival of humans [6]. It is therefore imperative to resolve the conflict between economic development and ecological security to achieve sustainable urban development [7]. The concept of ecological security was first introduced by the International Institute for Applied Systems Analysis (IIASA) in 1989 [8]. During the late 19th and early 20th centuries, authors such as Kongjian and Ming developed models of landscape and regional ESP to harmonize the relationship between society and nature [9,10]. ESP are ecological networks made up of scientifically and rationally allocated natural ecological resources and green infrastructure [11]. Protecting biodiversity, improving ecosystem services, and ensuring ecological security are all possible through it [12,13]. As more attention has been paid to ecology and the environment, ESP construction has become a hot topic [14,15]. Particularly in the past few decades, China’s rapid economic development has consumed a large number of natural resources, and conflict between ecological and economic development has emerged in some areas [16,17]. Rational planning of urban ecological space and the construction of ESP is important to promote the natural development of human-centered environments [18].
Building regional ESP through ENs is an effective method. Ecological network theory originated from biological conservation, which suggests connecting landscape elements with high ecological-service value into an organic, continuous spatial network system via corridors. This has practical significance for connecting fragmented habitats and improving the ecological carrying capacity [19]. Most ESPs are constructed through the screening of ecological resources, the construction of resistance surfaces and corridor identification, and then optimization using a gravity model [20,21]. Many scholars have studied ENs on a single scale in-depth recently. In China, cities, counties, and urban areas are nested, and the ENs built at different levels need to address different issues. Generally, the ENs built at the city or county level focus more on the ecosystem itself, providing ecosystem services and maintaining material and energy circulation, while the ENs in urban areas need to focus on the relationship between people, culture, and nature. It will create conflicts between different levels if we only construct ENs at one level, ignoring the interaction between ENs at various levels. Therefore, the spatial connection of a system should be strengthened in the construction of ESP, and multi-level ecological spatial planning should be carried out using synergistic thinking.
Ecological resources are patches with high habitat quality for plants and animals in the study area that provide habitat for native species. MSPA (morphological spatial pattern analysis) is commonly used to extract ecological resources [22,23]. With MSPA, metrics, identification, and the segmentation of raster images are developed according to the mathematical principles of morphology to determine the ecological type and landscape structure at the image element level by deciphering the class elements within the study area [24]. This method quantitatively evaluates patches on multiple aspects and integrates the intrinsic connections existing in landscape units, which has strong scientific validity [25,26]. The ecological resistance surface reflects the difficulty of migration for species or of information-energy flow processes [27]. Generally, ecological-resistance surfaces are constructed by land use [28]. The resistance surface generates corridors that are inconsistent with the reality of species migration. Due to this, we applied the InVEST model to modify the resistance surface by taking into account the habitat quality of the study area, so that the generated corridors could be more closely aligned with real migration paths. Ecological corridors, which are channels for plant and animal migration and material exchange, are commonly extracted by the minimum cumulative resistance (MCR) model [29]. Compared with other models, MCR can better express the interrelationship between landscape patterns and ecological processes.
Although the content and methods of current research on ESP are relatively mature, most of them focus on the county- or urban-area-scale, neglecting linkages across multiple spatial scales; this can cause problems such as difficulties in the connection between upper and lower levels [30]. In this study, SYAC, which is characterized by karst landscapes, was chosen as the study area, where the integration of ENs across different levels was assessed, concentrating on the coupling and synergy between natural and human features to provide a model for ecologically fragile areas in karst landscapes that can be developed sustainably. Therefore, this article raises the following scientific questions: (1) How do we accurately identify ecological resources and areas where corridors are missing? (2) How can ecosystems in the karst region be optimized structurally and functionally? (3) In the absence of ENs linkages at different levels, how do we solve this problem?
SYAC is a multi-city urban area and has a total area of 1719 km2 (Figure 1). It is located in Yunnan’s eastern central part (103.17° E to 103.68° E, 24.57° N to 25.05° N). SYAC includes Shilin (SL) town, Lufu (LF) town, Banqiao (BQ) town, Xijiekou (XJK) town, Changhu (CH) town, Guishan (GS) town, and Dake (DK) town. In the study area, there are 1616.6 h of sunshine and 954.2 mm of precipitation every year [31]. Almost all of SYAC’s major rivers and water source protection areas are located in the west, belonging to the Panjiang River basin of the Pearl River system. SYAC’s protected natural areas include Dadieshui protected natural areas, Shilin protected natural areas, and Guishan protected natural areas. In 2006, Shilin Karst in Yunnan and Libo Karst in Guizhou and Wulong Karst in Chongqing were added to the UNESCO World Heritage List as the “Southern China Karst” [32]. A total of 48.8% of the total urban area was cultivated land in 2020, followed by 34.86% by urban land. Intensive human activities have resulted in serious soil erosion within SYAC, and rocky desertification has also occurred within some of the districts [33]. Rocky desertification refers to the process of soil loss, bedrock exposure, agricultural loss, and ecological degradation [34]. SYAC was chosen as a pilot county for karst desertification management in Yunnan province in 2012. In 2017, according to the third monitoring data of rocky desertification, the land area of rocky desertification in SYAC was still as high as 252 km2. Thus, it is the preferred area of study. The following three objectives were detailed: (1) Utilize MSPA and PALCI to identify ecological resources in the county and urban area. MCR was optimized using InVEST for the identification of different levels of ENs. As a result of overlaying the above data with SYAC maps, missing ecological resources and corridors were identified. (2) We propose EN structure optimization and zonal ecological restoration based on a systematic analysis of local environmental characteristics and EN distribution in the study area. (3) The Priority Recovery Zone, the material exchange conversion zone, and the ecological stepping-stones were identified by superimposing the ENs on top of each other. SYAC can solve its problem of disconnected ENs at each level by accurately locating the Priority Recovery Zones, the Material Exchange Conversion Zones, and the Ecological Stepping-Stones.

2. Materials and Methods
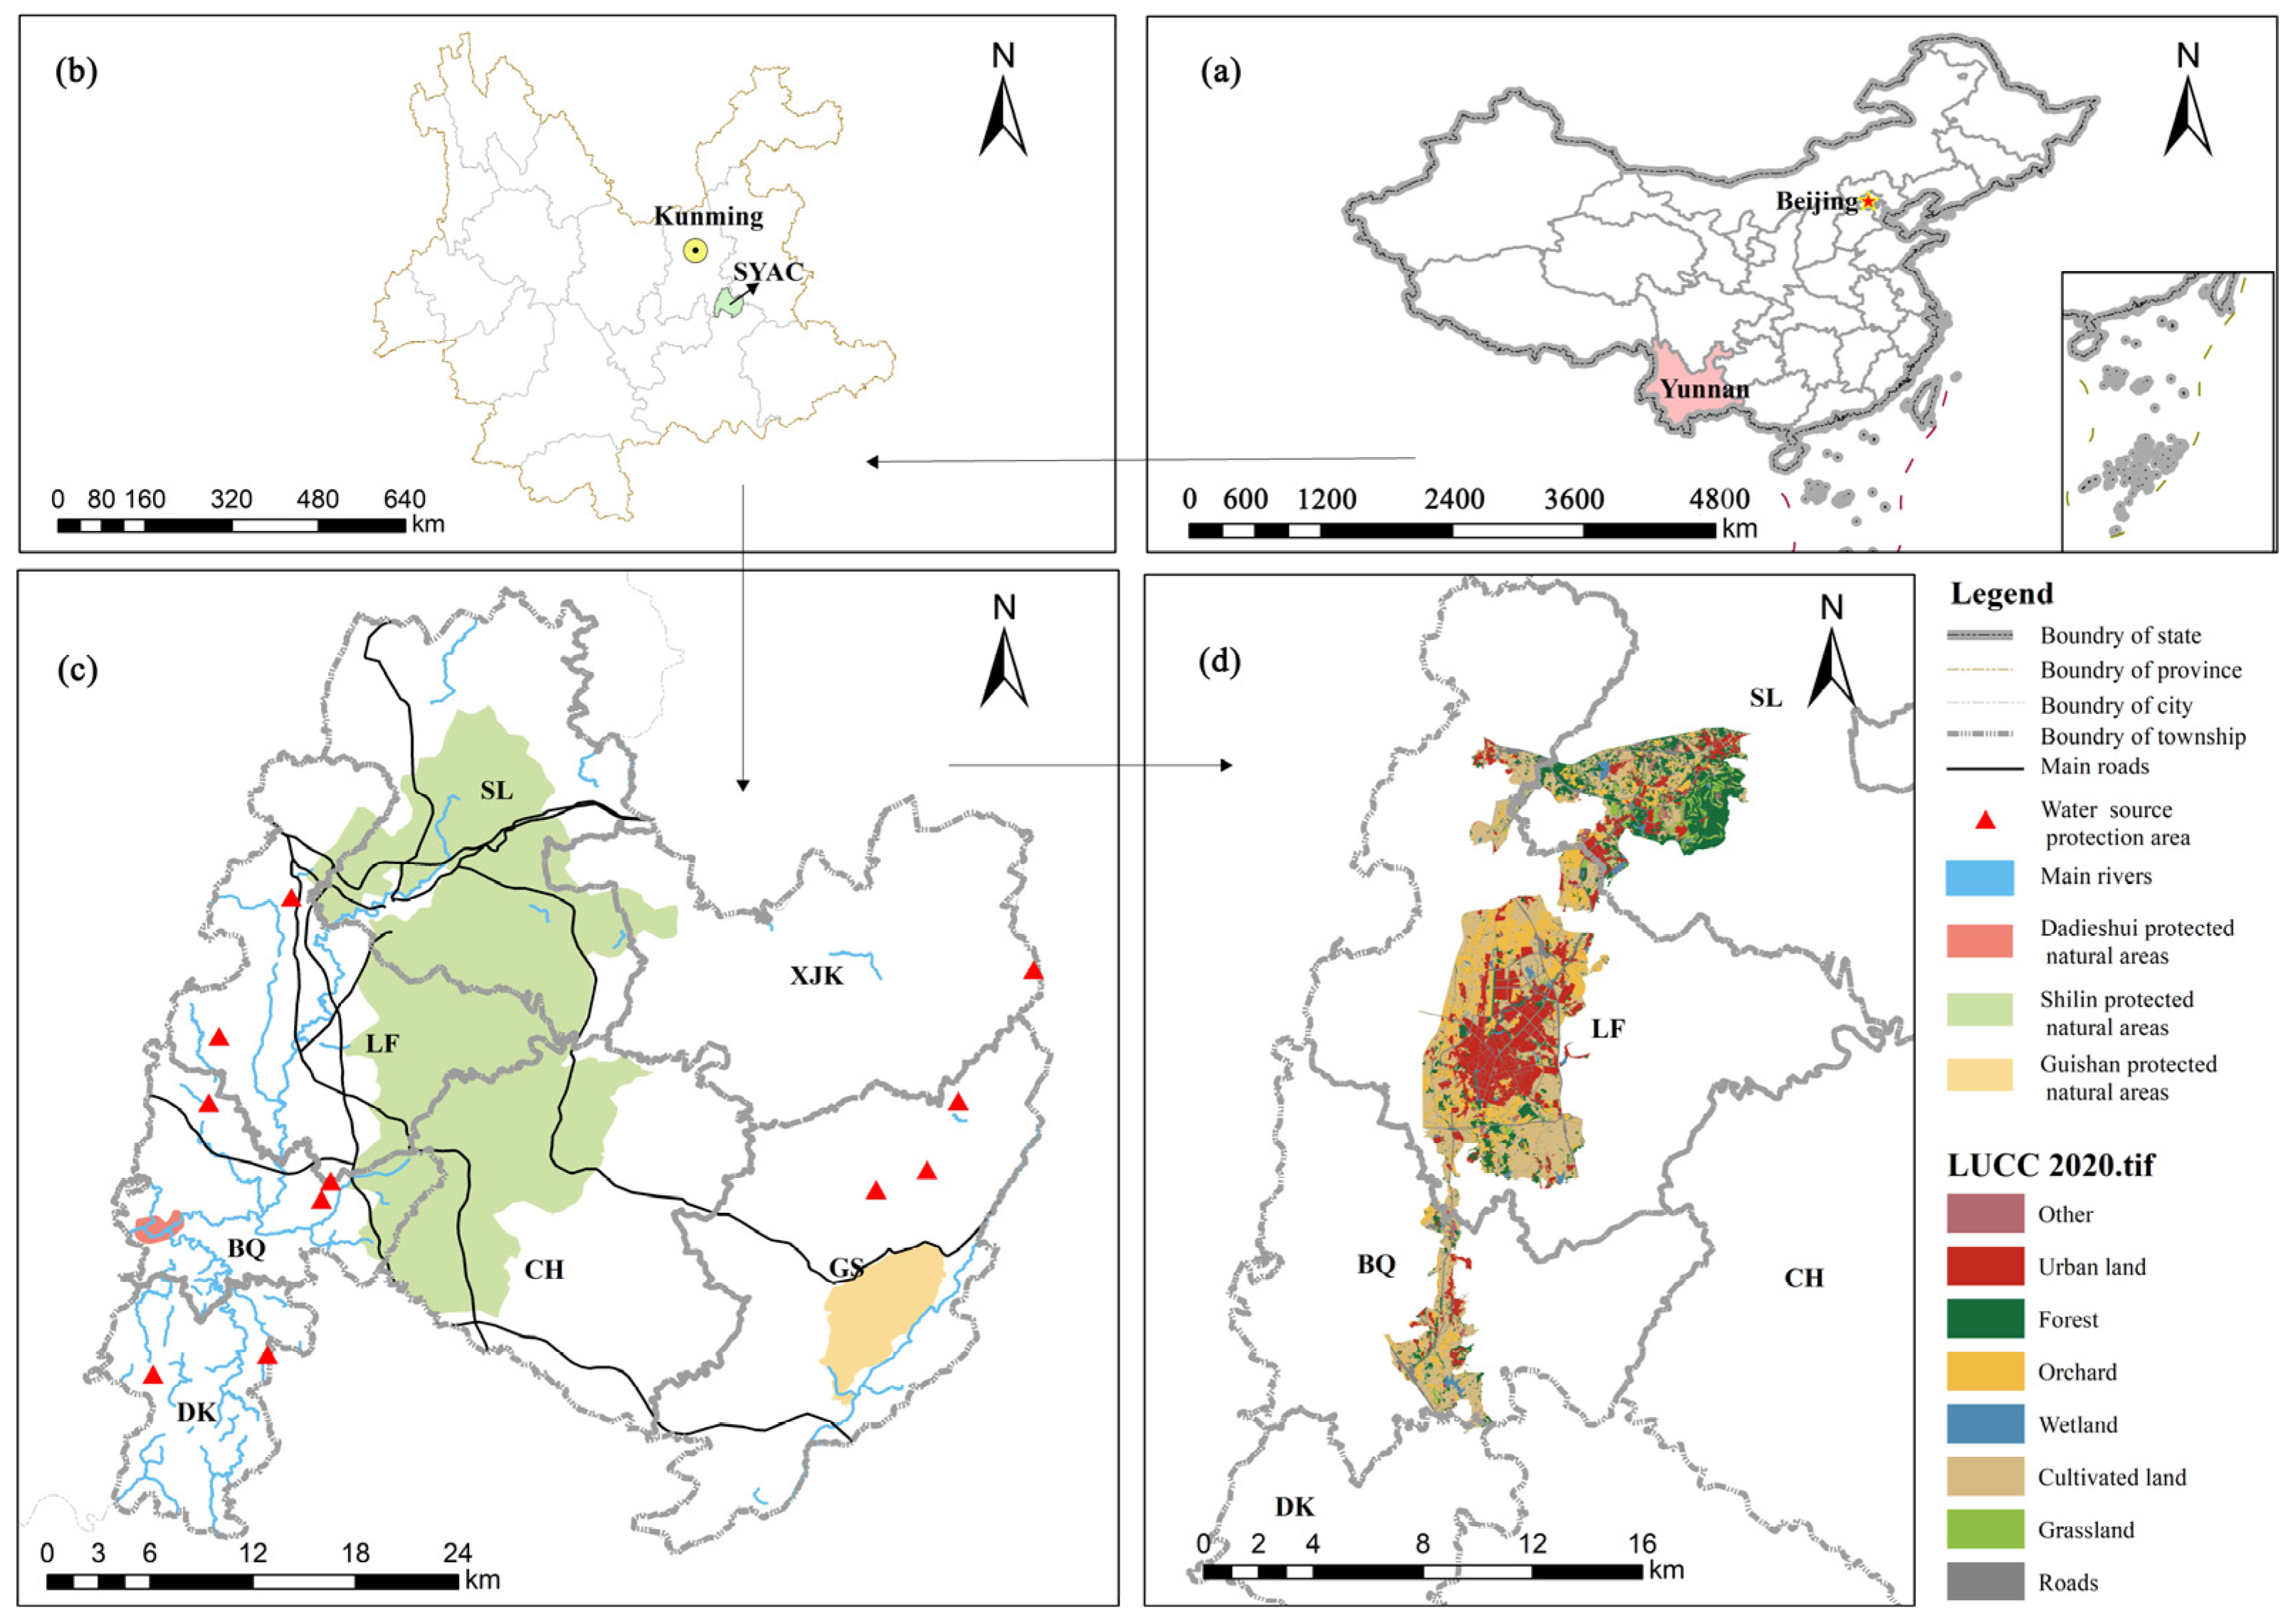
2.1. Data Sources

The remote sensing images from the National Forestry and Grassland Administration’s Southwest Survey and Planning Institute (NFGASSPI) are provided with a spatial resolution of 30 m in 2020. A range of image-processing options is available in ENVI5.3 to reduce the number of errors in an image, including band combination, radiation calibration, atmospheric correction, and many others. Arc GIS 10.3 was used to interpret the satellite images following the “Classification of Land Use Status (GB/T 21010-2017)” [35]. At the county level, there were eight main types of LUCC status (forests, cultivated land, grassland, wetlands, orchards, roads, urban land, and others). A natural ecological-resistance surface was constructed by extracting land use within the urban area with the mask extraction tool in Arc GIS, of which cultivated land accounted for the largest proportion (36.67%), followed by urban lands (18.19%) and orchards (15.53%). A cultural ecological resistance surface is constructed by dividing land-use types into five major categories (the areas suitable for people to conduct public education campaigns, residential areas, areas that can be used for human passage but are not suitable for activities, agricultural land, and others) through Arc GIS’s reclassification tool. The final step was to verify the field results using 224 randomly selected sample points. A 93.77 percent accuracy rate was achieved for land use type, which is in line with study requirements. The vector data for ecological red line distribution, protected natural areas, main rivers, and land use in the urban area were obtained from NFGASSPI. Bigemap provided the road and settlement vector data (http://www.bigemap.com/ accessed on 12 August 2021). Geospatial Data Cloud was used to obtain the DEM and normalized vegetation index data of SYAC (accessed on 7 September 2021 at https://www.gsclould.cn). DEM data were based on GDEMV2 digital elevation data with a spatial resolution of 30 m, and normalized vegetation indexes for July were based on 500 m spatial resolution. By using Arc GIS’ slope tool, slope data can be extracted from DEM. Except for remote sensing images, Ecological red line distribution data, protected natural areas distribution data, main river vector data, and urban area boundaries, which are restricted, all the data mentioned can be obtained through a free application on the website.

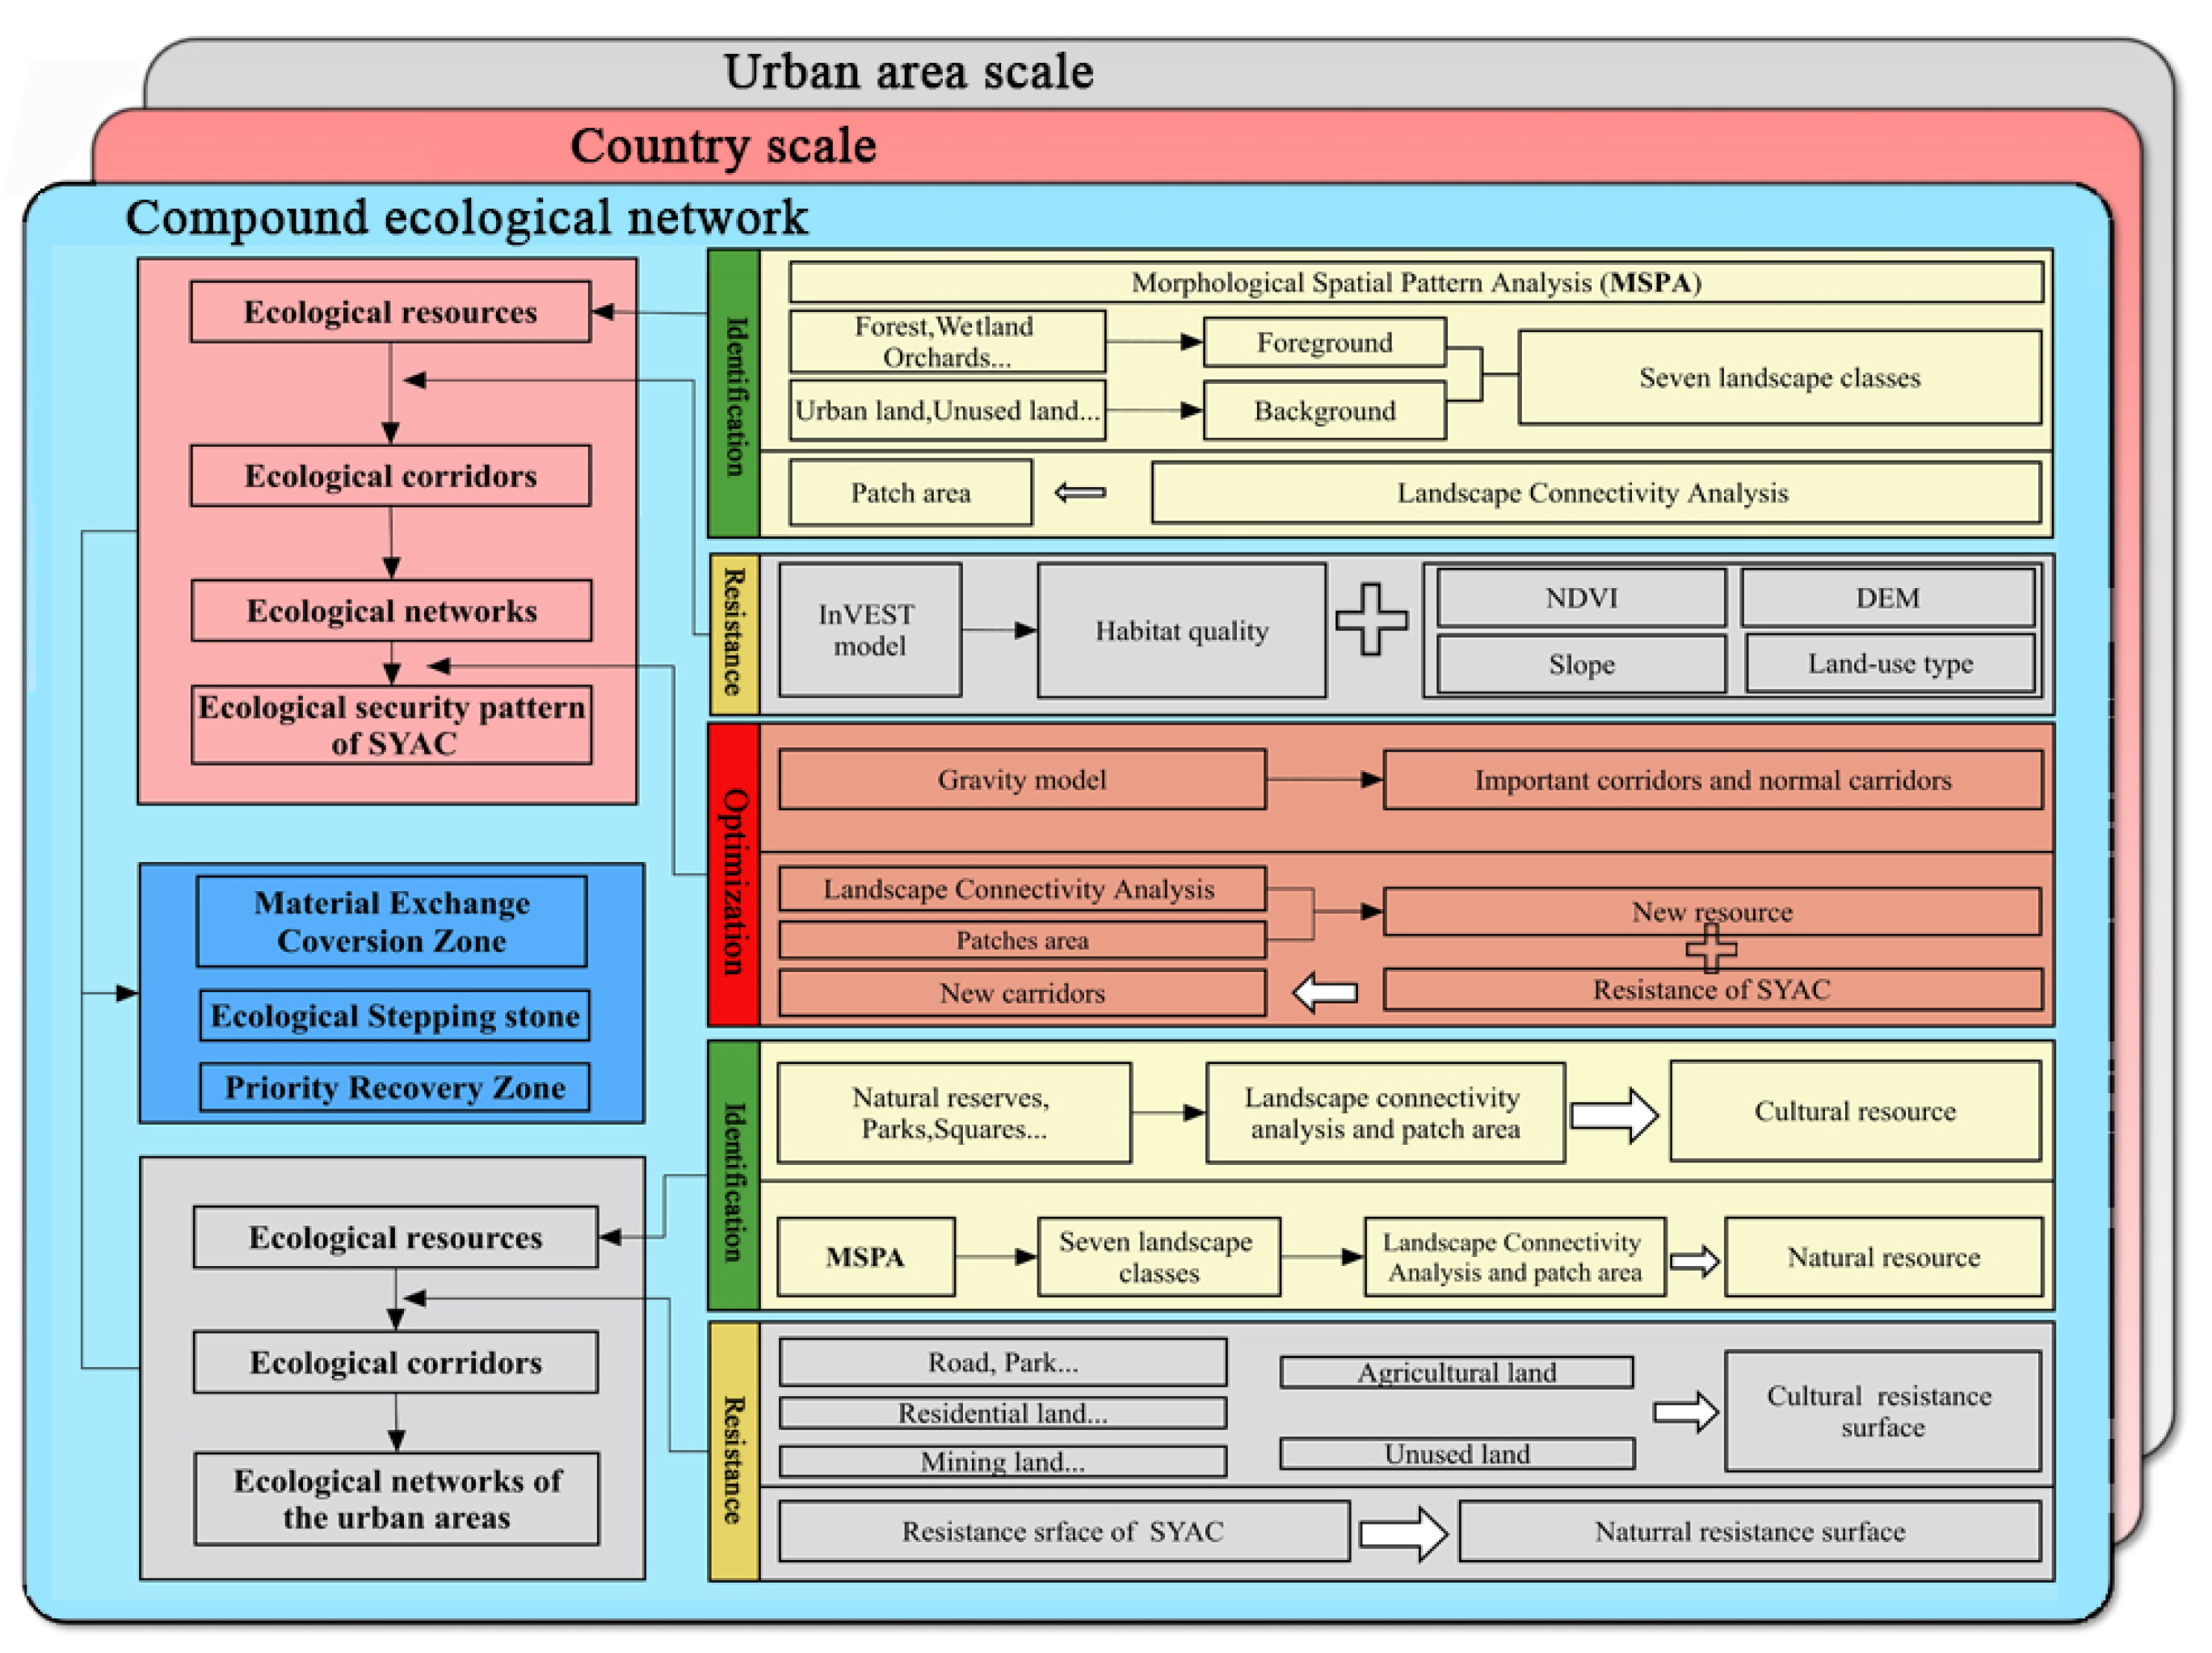
2.2. Research Methods

There are three main sections to this study. As a first step, we identify the county’s ecological resources through MSPA. SYAC habitat quality was used as a resistance factor, with DEM, slope, NDVI, and land use type as auxiliary resistance factors. The InVEST model was introduced to construct an ecological resistance system for counties. The MCR model was used to determine county ecological corridors. Create the ESP of the county using animals as service objects based on the gravity model and the current spatial distribution of resources and corridors in the study area. As a second step, anthropogenic landscapes (like natural reserves, parks, squares…) are inserted into the ecological resources. The urban ENs are constructed by setting different ecological resource and resistance surface parameters in the urban area. The third step is to overlay the ENs of each level to identify the pattern of compound ecological security within an urban area. Figure 2 illustrates the technical framework of this study.

2.2.1. County ENs Construction

Identification of Ecological Resources in the SYAC

Based on the Guidos Toolbox software 3.2, the MSPA method quantifies inter-resource connectivity and edge width, which alters the subjective nature of ecological resource selection to a certain extent [36,37]. In this study, forests, grasslands, orchards, and wetlands, which are less affected by human activities and have high ecological service functions, were extracted as foreground, and the binary grid data in .tiff format were measured, identified, and segmented by Guidos Toolbox software 3.2. In this analysis, we identified seven landscape types that are mutually exclusive (Core, Islet, Perforation, Edge, Loop, Bridge, and Branch).
In terms of ecological resources, patch area and landscape connectivity index (PALCI) is a critical structural indicator. Generally, a larger area contributes to the spread of ecological resources because it has a richer biodiversity. It is highly important for biodiversity conservation and ecosystem balance that landscape connectivity indicators are used to assess a region’s suitability for species exchange and migration. As important indicators of landscape patterns and functions, probability of connectivity (PC, Equation (1)) and importance value of patches (dPC, Equation (2)) are commonly used; they demonstrate how well core patches are connected regionally [38,39]. As defined by the formula, it is as follows:
P C = i = 1 m j = 1 m a i × a j × P i j * / A L 2
d P C ( % ) = 100 × ( P C P C r e m o v e ) / P C
where landscape patches numbered m; patches i and j had attributes ai and aj; P i j * represents a species’ maximum probability of dispersing directly between patches i and j; AL represents the total area of the landscape; landscape connectivity after removing random patches i is PCremove. Using PC, we assess how well patches and corridors contribute to the connectivity of ecological networks. dPC measures the connectivity between key patches in ENs. PC and dPC were calculated using Conefor 2.6 software for calculating species connectivity in ecosystems, which allows us to better understand interactions between patches.
As a result of previous research, in light of the actual situation in the study area, and also with consideration of the fact that the distance threshold is set too high, some large patches will be divided, some small patches will disappear, etc., a distance threshold of connectivity of the patches is 1000 m, and 0.5 is chosen as the probability of a patch connecting to a patch [21,40]. We evaluated the core areas and bridging areas extracted by MSPA quantitatively and selected 30 patches with dPC greater than 3. These 30 patches were deemed to be valuable ecological resources and were selected for further study and preservation efforts. Our analysis allowed us to pinpoint specific areas of ecological importance. The PALCI was used to assess ecological resources in this study, improving objective resource selection as well as providing a scientific basis for the construction of ENs for SYAC.

Design of ENs Using an InVEST Model and an MCR Model in the SYAC

Habitat quality refers to how well an ecosystem can support individuals and species in a given spatial and temporal context [41]. Generally, an area with a high Habitat Quality Index has a better ecological reputation and is more conducive to the movement of animals and materials. Habitat Quality Module in the InVEST model is an effective tool for quantifying habitat quality. It is one of the most mature and widely used ecosystem service assessment models today [42]. The habitat quality in the study area was estimated using the InVEST model based on information concerning land use and the ecological red line. Urban land, cultivated land, mining land, and unused land parameters were all considered stress factors in this study. It was determined that the maximum influence distance, weight, and spatial decay type of the InVEST Model are based on the User’s Guide for the InVEST Model and other related literature (Table 1) [43,44]. As defined by the formula, it is as follows:
Q xj = H j ( 1 D x j z D x j z + K Z )
In Equation (3), Qxj is the habitat quality index for land use type j for raster x, Hj denotes habitat suitability for type j of land use, k denotes the constant of half-saturation, and z is a conversion factor inherent in the system, generally taken as 2.5. Where Dxj denotes the extent of habitat degradation in the x grid of land use type j, it is as follows:
D xj = r = 1 R y = 1 Y r W r r = 1 R W r r y i r x y β x S j r
In Equation (4), there is a j for habitat, x is the habitat raster, and r is the threat raster. R represents the number of threat raster, Wr represents threat-source r’s weight, y denote all raster on the threat raster map r, Yr denotes a set of raster on the threat raster map r, ry the impact value of threat raster r on raster y, irxy represents the distance decay function between the habitat type raster x and the threat raster y, βx represents raster x’s accessibility level, and Sjr stands for land-use type sensitivity to threat raster r. Where irxy is calculated as follows:
{ i rxy = 1 d xy d r max if linear i r x y = e 2.99 d r max d x y if exponential
where the linear distance between the threat raster y and the habitat raster x is represented by day. The threat raster r’s maximum influence distance is represented by drmax.
Using the MCR model, the best path for species migration and dispersal is determined by calculating the minimum cumulative resistance distance between the source and the target [40]. This method, which reflects the possibility and tendency of biological species moving among habitat patches in order to protect biodiversity and fully takes into account the effects of geographical features and anthropogenic activities on migration, is one of the most widely used methods for identifying ecological corridors. The equation is as follows:
M C R = f min q = n p = m ( D p q × R p )
In Equation (6), where f denotes the positive correlation between the minimum cumulative resistance and the ecological process; Dpq denotes the spatial distance from resource q to landscape unit p; and the resistance coefficient of landscape unit p to species movement is called Rp.
The development of ecological infrastructure must take substrate effects into account. As a disturbance factor for species movement between habitat patches, the InVEST model was used in this paper to assess the habitat quality of the SYAC, and DEM, Slope, NDVI, and Land-use type were added as auxiliary factors to construct the county’s ecological-resistance system. A larger resistance value means greater obstacles to species migration, energy transmission, and information transmission. On the other hand, a smaller resistance value indicates a greater suitability of the landscape type and a smaller degree of obstruction. Considering all relevant research results, combining their effects on ecology and allocating the weights of each resistance surface accordingly based on the study area’s characteristics and their influence on the ecological importance of the landscape (Table 2). Using GIS raster calculators, ecologically integrated resistance surfaces were then generated using weighted overlay operations, which were used as data for the MCR model, which represents the cost of migration for species and information-energy flow processes in SYAC. Ecological resources and integrated resistance surfaces were used to calculate the minimum cumulative resistance surface using coastal distance. A total of 153 potential ecological corridors were determined to form the ENs of the study area by using coastal paths from the “source” to the “target”.

Optimization of County ENs

An important method for identifying corridors in an ecosystem is gravity modeling, which quantifies the strength of interactions between resources and the importance of the corridor between them. We calculated the interaction matrix between 18 ecological resources by gravity modeling. As the interaction force between resources increases, so does the resistance and closer connectivity between ecological resources. It becomes increasingly common for material energy and information to transfer between ecosystems, species to migrate, and corridors that connect them become more important.
In this study, the potential corridors were modified according to the interaction matrix of ecological resources, and corridors with Fij > 10 were selected as important corridors, 13 in total, and corridors with 5 < Fij < 10 were selected as common corridors, 16 in total. The equation is as follows:
F i j = N i N j / D i j 2 = L max 2 I n ( a i a j ) / L i j 2 P i P j
In Equation (7), where Fij represents the interaction force between resource i and resource j, Resource i and j weight coefficients are Ni and Nj, Dij represents the normalized resistance value of the potential corridors between resources i and j, the maximum resistance value of all corridors is Lmax, ai and aj represent the i and j areas of resources, Lij donates the cumulative resistance value of corridors between resources i to j, and the average resistance values for resources i and j are Pi and Pj.
In the EN constructed based on the MCR model, some areas will have missing ecological resources and ecological corridors. In this study, based on PALCI, patches with larger areas and higher possible connectivity were selected as supplementary resources in the missing resource areas, and new corridors were obtained by overlaying with the ecological-resistance surface of SYAC to increase the regional landscape connectivity. Based on the results of habitat quality assessment and ecological corridor identification, the county was divided into two ecotones and five zones (Ecological Function Construction Zone, Ecological Protection Demonstration Zone, Ecological Fragile Restoration Zone, Geological Landscape Feature Zone, and Agro-ecological Security Zone), and ecological stepping-stones are set at the intersection of zones and corridors, and corresponding planning and construction opinions are proposed for the five zones to form an ESP of SYAC, two ecotone and five zones with multiple points.

2.2.2. Construction of ENs in the Urban Areas

Identification of Ecological Resources in the Urban Areas

The ecological resources of the urban areas are constructed from two types: cultural landscape ecological resources and natural landscape ecological resources. The cultural landscape ecological resources mainly reflect the cultural services of the landscape. Selected natural reserves, parks, public squares, and land for science, education, and culture as screening objects, we selected the top 4 patches as the cultural landscape ecological resources with the PALCI as the evaluation index. The natural landscape ecological resources were selected by combining analysis results of MSPA and Conefor, and the cores and bridges with better habitat quality were used as screening objects, and four natural landscape ecological resources were extracted via PALCI. Due to the overlap of cultural and natural ecological resources, a total of seven ecological resources were extracted at the county level. Its patch distance threshold was set to 500 m and the connectivity probability was set to 0.5.

ENs Construction in the Urban Areas

Since the service objects of some ecological resources in the urban areas have changed, the resistance index of the urban areas should be adjusted accordingly. In the process of constructing the cultural ecological-resistance surface, the land use in the urban areas was divided into 5 categories, with “human” as the starting point. The areas suitable for people to carry out public education campaigns were selected and their resistance index was set at 1; the resistance index of residential land was set at 3; the areas that were not suitable for activities but allow human passage were selected and their resistance index was set at 20. Agricultural land (which incorporates cultivated fields, orchards, grassland, aquiculture area, pond, cultivated water conservancy facilities land, field roads, and land occupied by all other agricultural productive buildings) had its resistance index set at 100. The resistance index of other land-use types was set at 300 [28] (Table 3). Through the coordination and coupling of the cultural ecological corridor and natural ecological corridor, the integration of urban cultural landscapes and the natural environment can be promoted, the characteristics of SYAC can be highlighted, and the ecosystem services and landscape ecology of green space in urban areas can be improved.
At the level of the urban areas, we should consider not only the ecological corridor to provide ecological benefits for plants and animals but also its cultural, recreational, and entertainment attributes. Therefore, the ecological corridors in urban areas are divided into two types: cultural landscape ecological corridors and natural landscape ecological corridors. Cultural landscape ecological corridors were extracted by superimposing cultural landscape ecological resources and cultural resistance in the urban area. Natural landscape ecological corridors, on the other hand, extract natural ecological corridors by overlaying natural landscape ecological resources with the county resistance surface. Through the synergy and coupling of cultural landscape ecological corridors and natural landscape ecological corridors, the integration of urban artificial and natural environments is promoted, highlighting local environmental characteristics and improving the ecological and landscape service efficiency of green space units in urban areas.

2.2.3. Multi-Scale EN Establishment

The key to constructing multi-level ENs lies in the integration and connection of each ecological element. In this study, two levels of ENs are superimposed and nested, and the intersection points of corridors at all levels in the urban area are extracted as ecological stepping-stones to increase the connectivity between resources and thus increase the frequency of species’ activities. The areas where resources overlap are set as Material Exchange Conversion Zone, and the areas where resources and corridors are missing and ecologically fragile are set as Priority Recovery Zone. The Material Exchange Conversion Zone, Priority Recovery Zone, and cultural and natural landscape ecological resources and corridors are organically combined to form a compound ESP.

3. Results

3.1. The Establishment of the ESP within SLAC

3.1.1. The Spatial Distribution of Ecological Resources within SYAC

As can be seen from Figure 3 and Table 4, the total area of ecological resources in the study area is 326.512 km2, accounting for 19.4% of the total area of the SYAC, mainly distributed in the central and eastern parts of the SYAC. Among them, the highest landscape connectivity is in resource#1, which is located in the central part of the study area, with a dPC value of 34.72, an area of 10.6426 km2, and is relatively rich in biological resources. Resource#3 has the largest area of 45.9692 km2, accounting for 14.1% of the total area of ecological resources. This patch is located in the southeastern part of SYAC, with relatively high landscape connectivity. Patch 18 is located in the western part of the study area, and although this patch has a larger area, the dPC value is only 3.95.

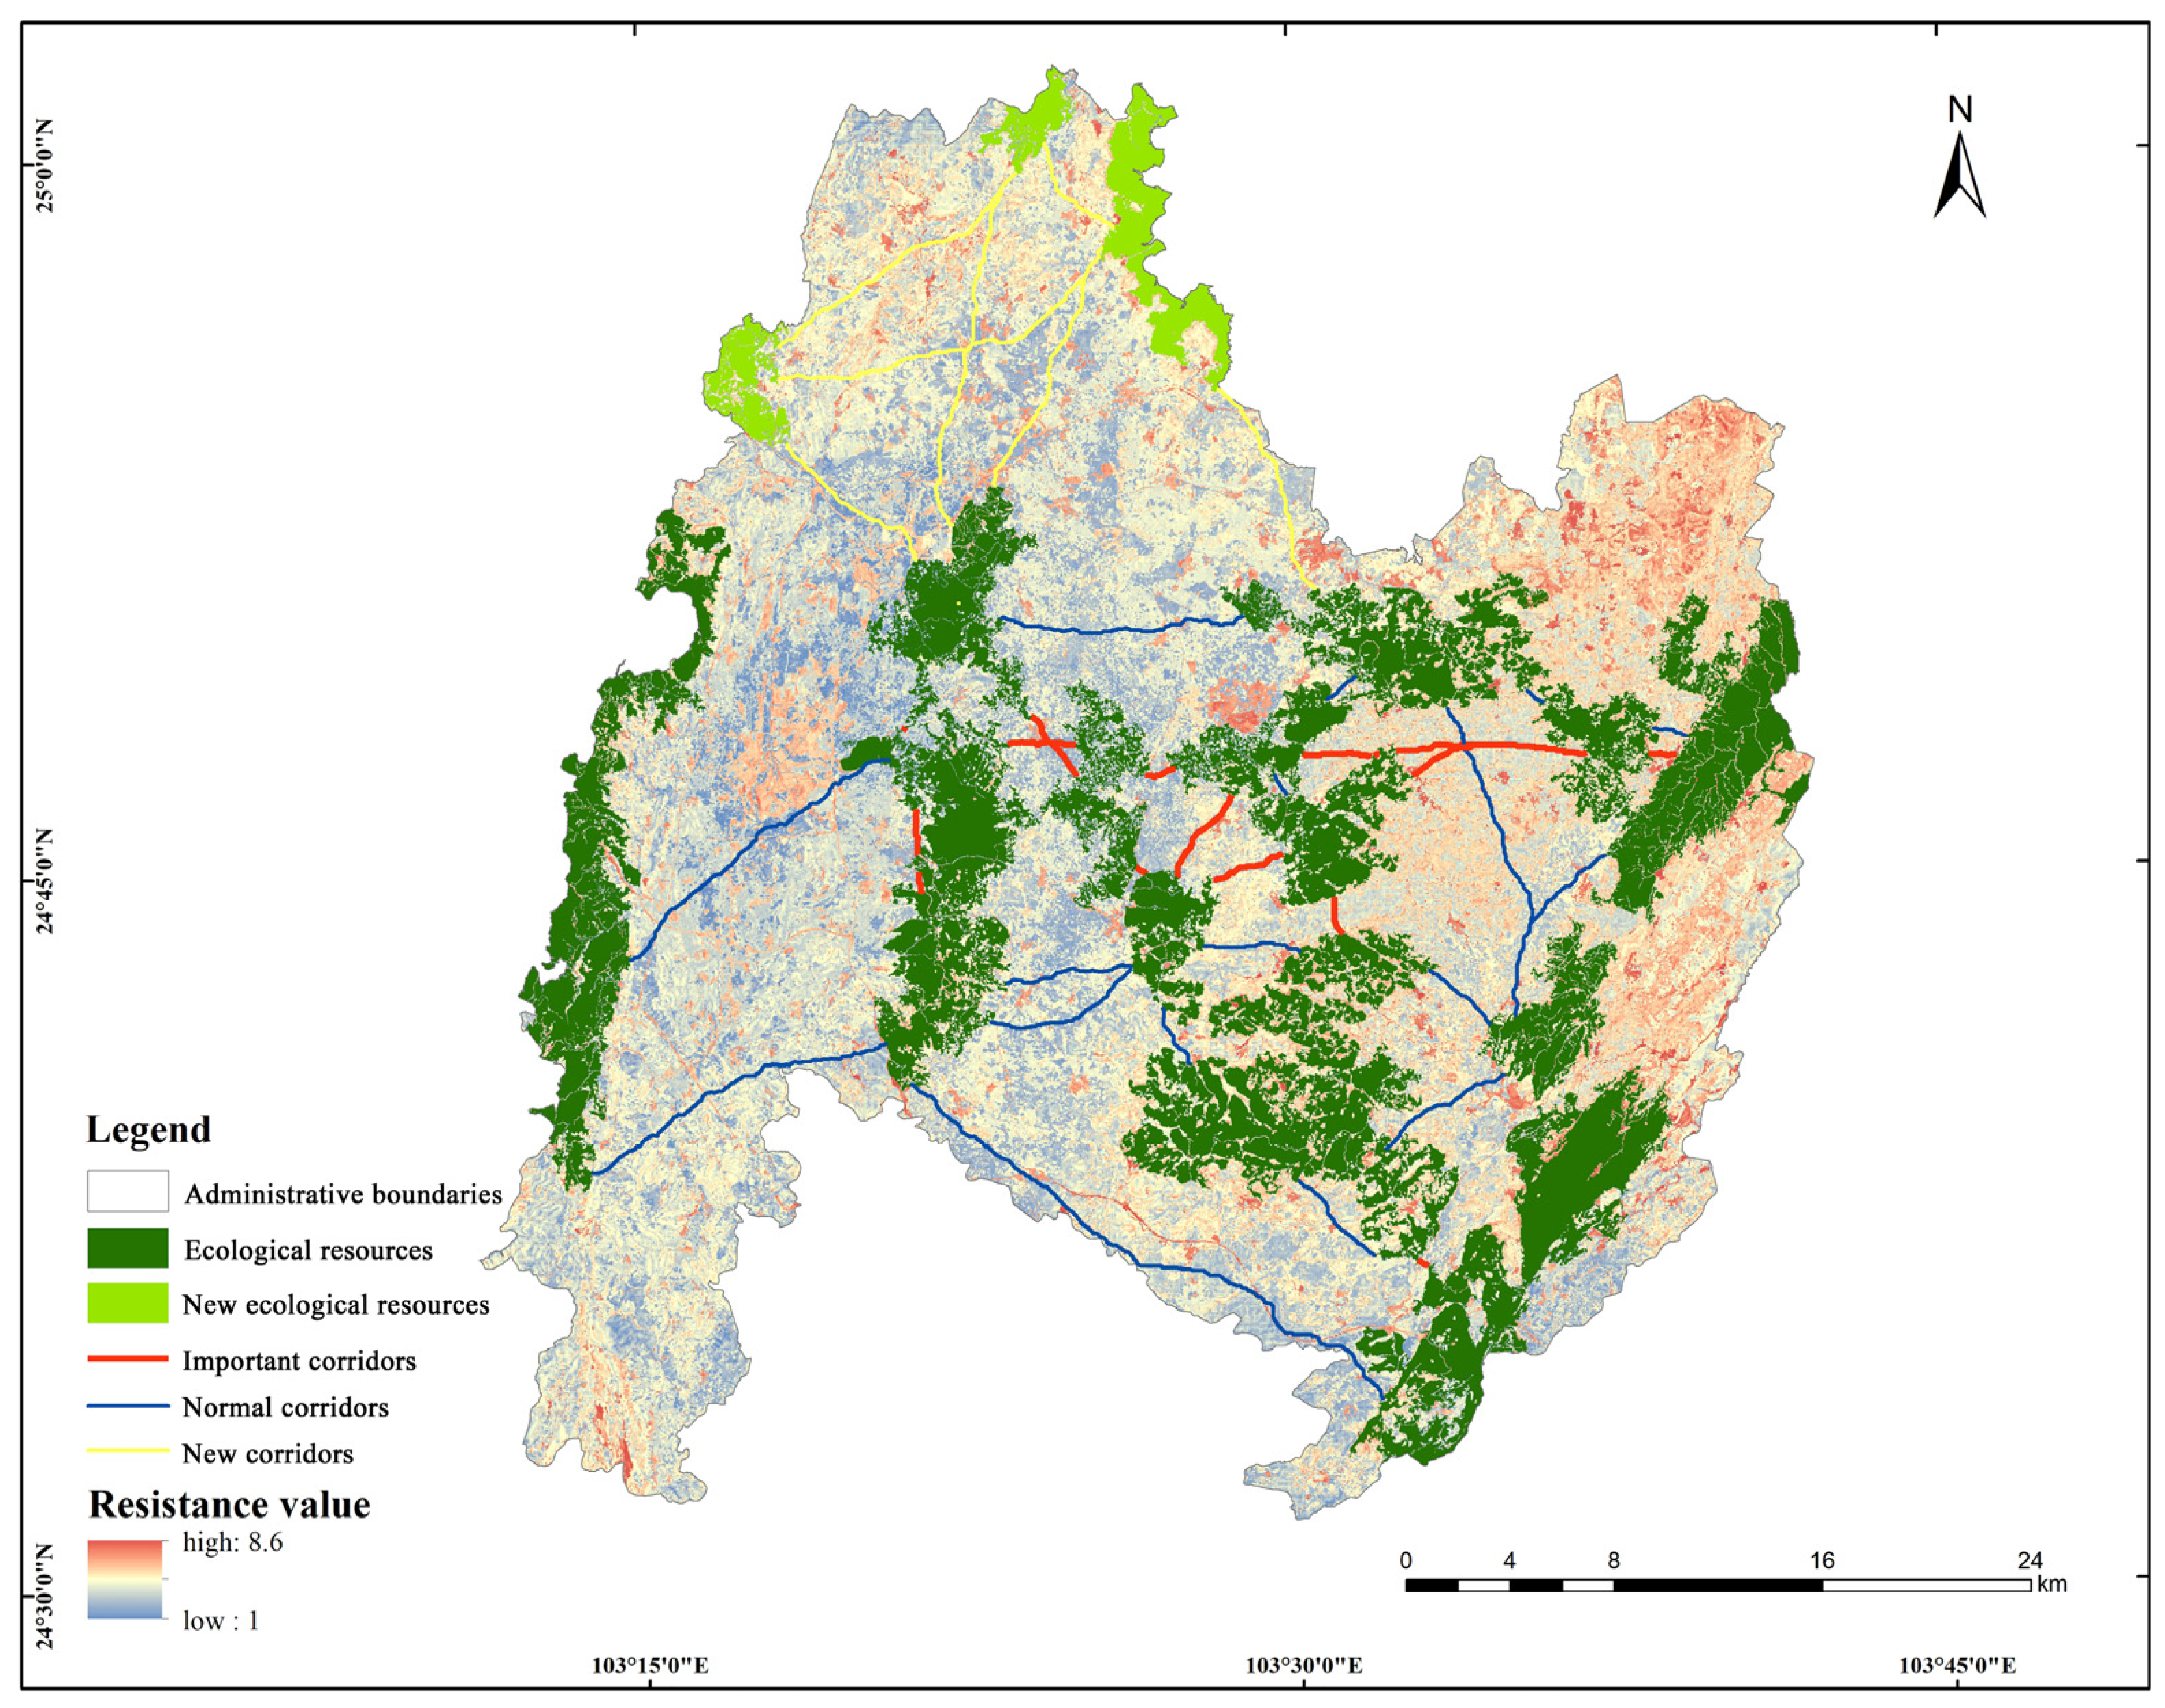
3.1.2. The Establishment and Optimization of ENs within SYAC

Considering that species generally choose paths with less resistance to migrate and move, this study generated 153 corridors by superimposing ecological-resistance surfaces and ecological resources. Then, 29 corridors were selected by the gravity model to quantify the interaction forces between patches (Figure 4). The 29 ecological corridors were divided into “important” and “common” ecological corridors. There were 13 important ecological corridors, mainly distributed in the middle of the county. Such corridors are irreplaceable, having the characteristics of high landscape connectivity and good ecological quality, and they are the best channels for species exchange and migration between ecological resources. There are 16 common ecological corridors, which are distributed widely around the county. Compared with the important ecological corridors, their landscape connectivity is weak, but common corridors are still important for maintaining the structural and functional connectivity of the county’s ecosystem.
In this study, 29 ecological corridors were quantitatively analyzed by the gravity model and combined with the current situation of the study area [45]. The northern part of the county is too fragmented, lacking ecological resources. Considering the demand of terrestrial species migration between ecological resources, three ecological resources were selected as supplementary resources according to the core area obtained from MSPA analysis and combined with the ecological corridor distribution in the county. The new ecological resources and ecological resistance surface of SYAC from Arc GIS were imported into the MCR model to obtain nine new corridors (Figure 4). The newly added corridors effectively solve the problem of the uneven distribution of ecological corridors in the county. Considering the ecological fragility of the northern part of the study area and the landscape fragility of the eastern karst landform communities, we determined there to be two ecological ecotones that could function as barriers at the macro level to protect the fragile ecological landscape. Ecotone No. 1 is located in the northwestern part of SYAC and is bounded by ecological resources and the township. Ecotone No. 2 is located in the southeast of the study area and consists of the boundary of ecological resources No. 3.
In this study, SYAC is divided into five zones: the Ecological Fragile Restoration Zone is located in Shilin town, where the ecological patches are fragmented and the landscape connectivity of the patches is poor. The Geological Landscape Feature Zone is located in the southeastern part of the county, which mainly consists of the Guishan National Forest Park of China. The Agro-ecological security Zone is located in both the southwest and northeast of the county. The habitat quality in southwestern SYAC, which has excellent quality cultivated land, is relatively gentle. The northeastern SYAC has a higher elevation and a relatively cold climate, which is suitable for the growth of grasses and is a good basis for the development of livestock farming. The Ecological Protection Demonstration Zone is located in the central part of the county, which is rich in forest resources and has a good ability to save water, fix carbon, and regulate climate, and is the main core area for the provision of ecosystem service functions. The Ecological Function Construction Zone is located at the periphery of the Ecological Protection Demonstration Zone, which protects the demonstration area from the east, west, and south. By superimposing each level of the corridor on five zoning areas, these intersections were selected and set as ecological stepping-stones to provide a temporary landing point for the migration of plants and animals across the zone.
Based on the results of the ENs described above, the ESP of SYAC was constructed from the local characteristics of the study area with two ecotones as a barrier and five zones and multiple points as a whole to achieve the goal of coordinated development of ecological protection and restoration (Figure 5).

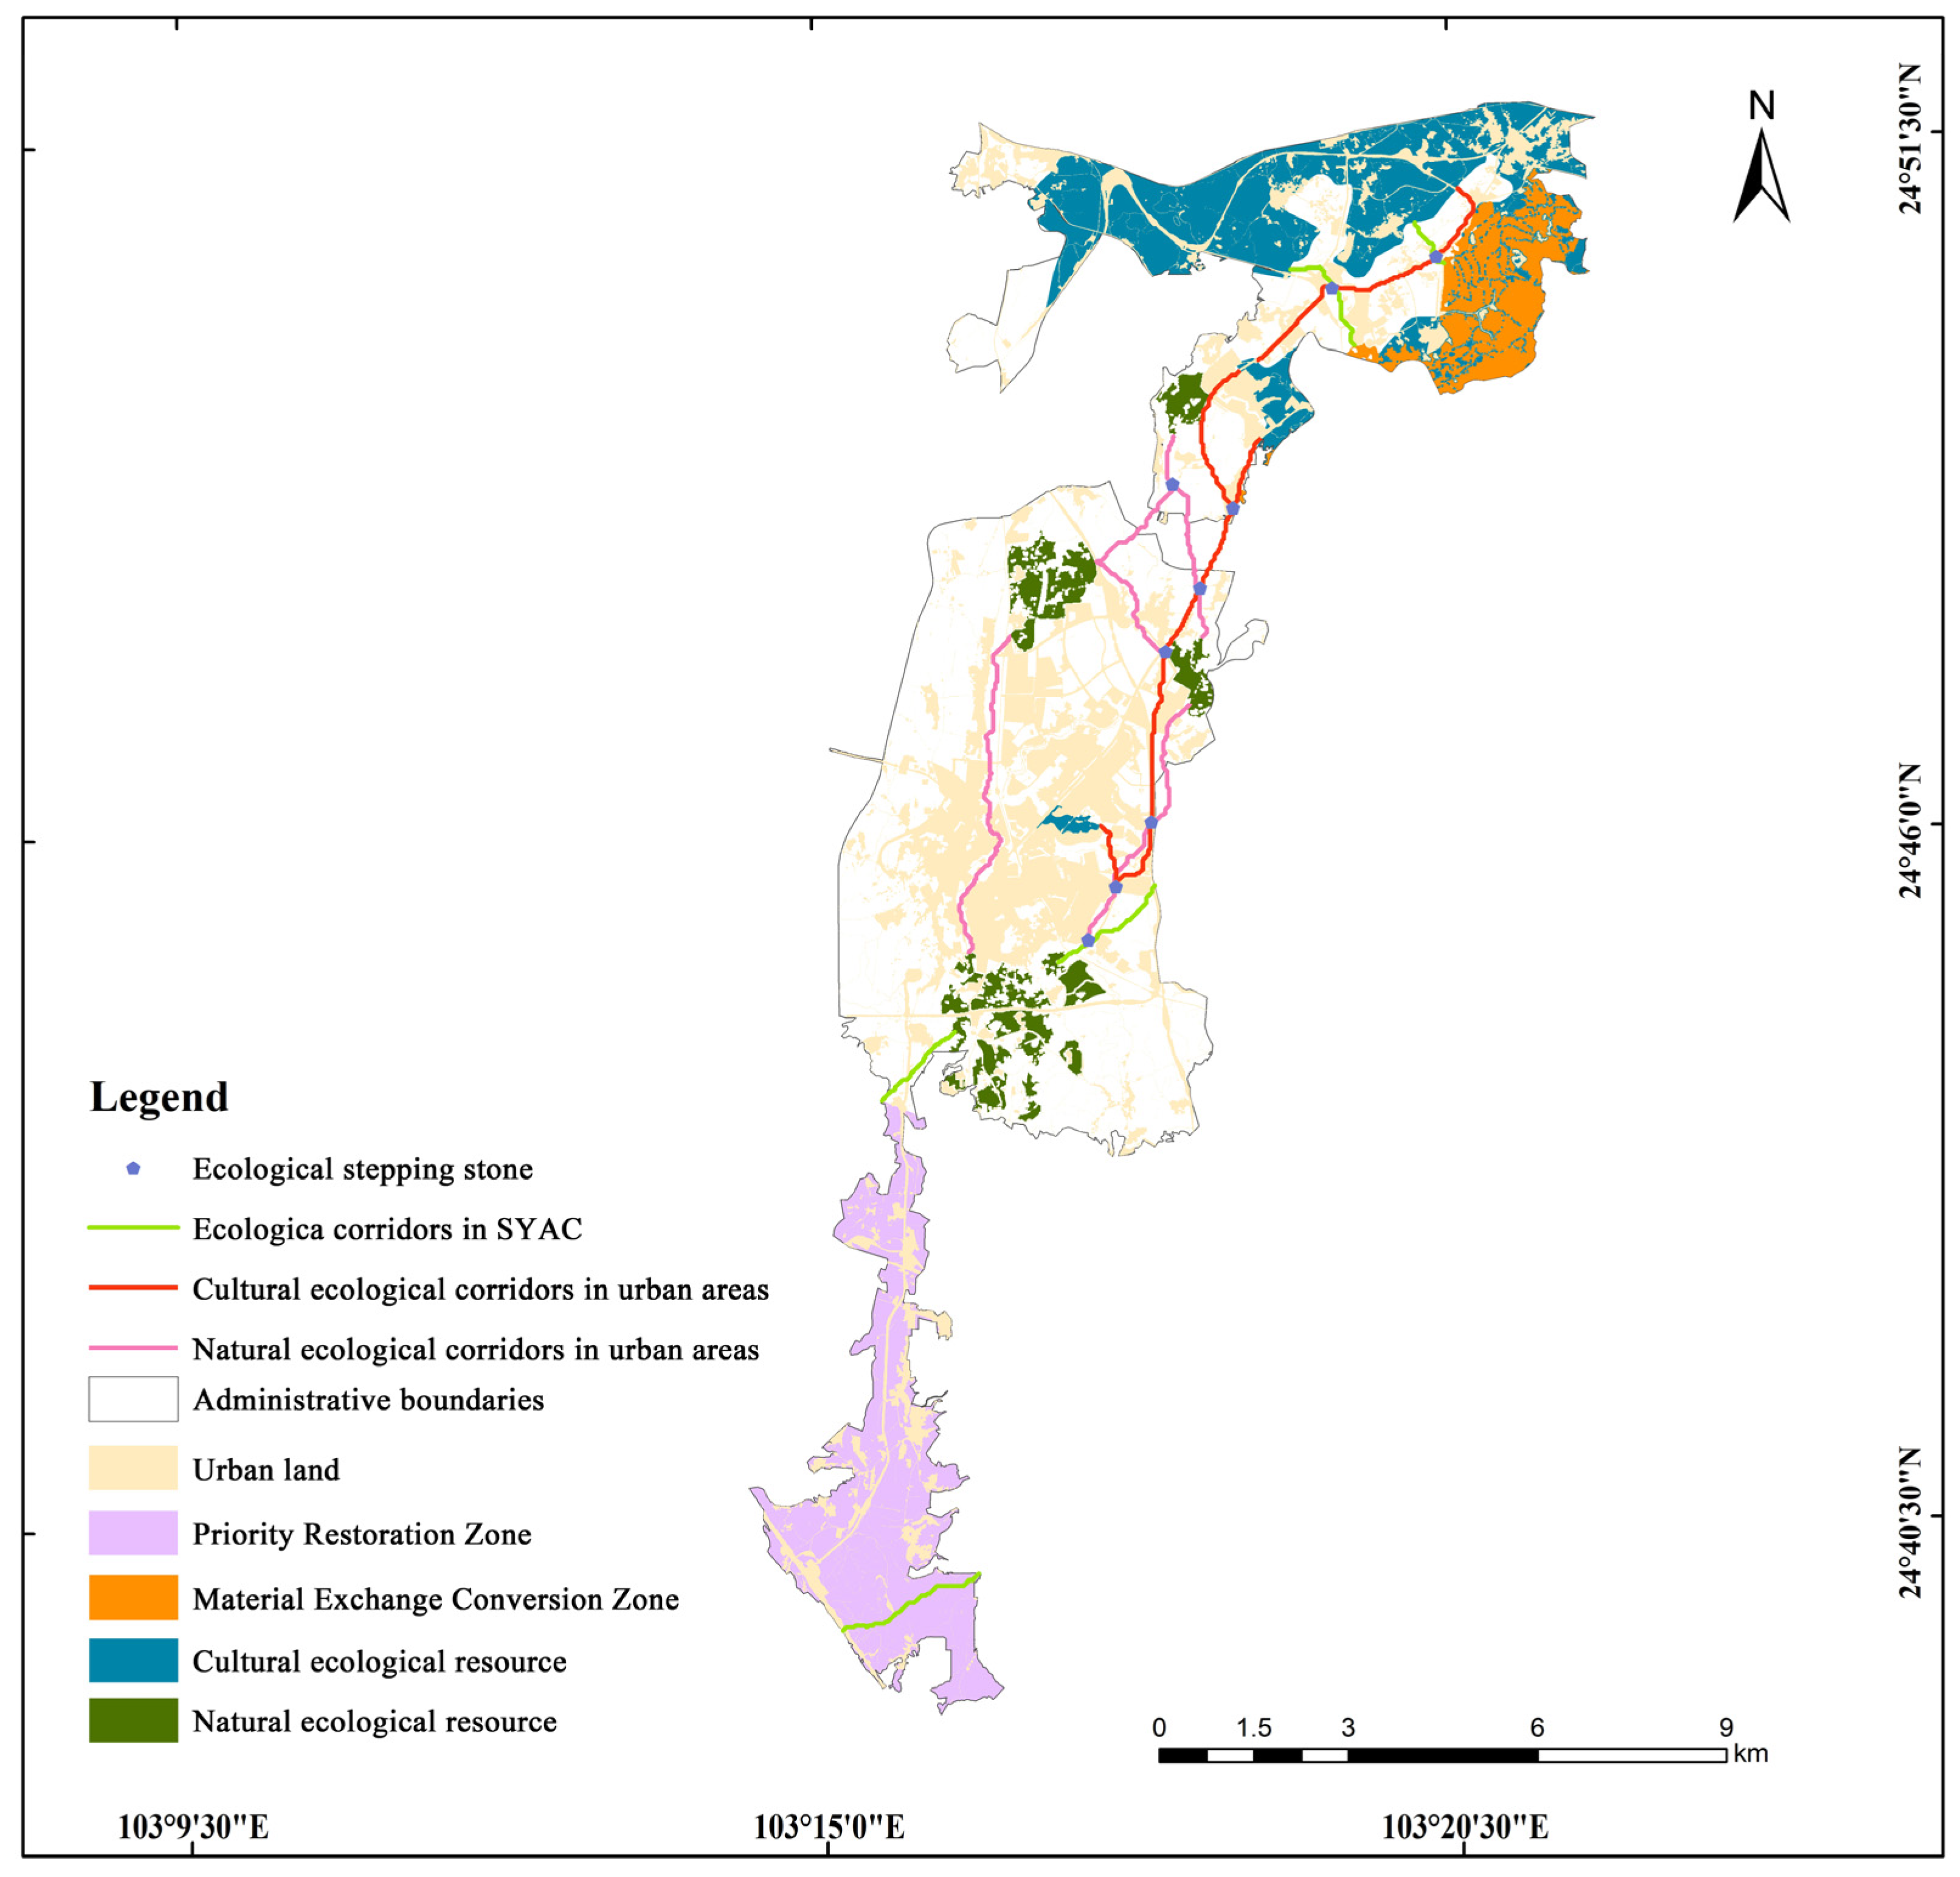
3.2. The Establishment of the ENs within the Urban Area

3.2.1. The Spatial Distribution of Ecological Resources within the Urban Area

At the level of the urban area, with the service objective as the guide and the supply function, regulation function, and cultural function of the patches as the focus, Shilin protected natural areas and Ashima Cultural and Ecological Park were selected as objects of cultural ecological resources, the core area after MSPA analysis was selected as of natural ecological resources, and the two were analyzed for landscape connectivity, and the patches with dPC > 5 were selected as ecological resources. As shown in Figure 6, the total area of ecological resources in the urban area is 22.3209 km2, which is mainly distributed in the northern and central parts of the urban area. The vegetation coverage in this area is high, and the land-use types are mostly forests, grasslands, and villages; the intensity of human development is low.

3.2.2. The Establishment of Ens within the Urban Area

The resistance values of the urban area ecological resource buffer, land use buffers, and other indicators were superimposed to obtain an integrated cultural resistance surface of the urban area of SYAC (Figure 7).
Natural landscape corridors were extracted mainly to protect urban biodiversity and provide ecosystem service functions for the urban area. This study combines natural ecological resources and resistance surfaces, and extracts four natural ecological corridors, mainly located in the central part of the urban area, with a total length of 19.03 km. Cultural landscape ecological corridors are mainly for screening the channels for human access to ecosystem services, taking into account local social, economic, and cultural factors, and comprise six corridors with a total length of 22.7 km. The distribution pattern of cultural landscape ecological corridors is roughly consistent with the road network of the urban area.

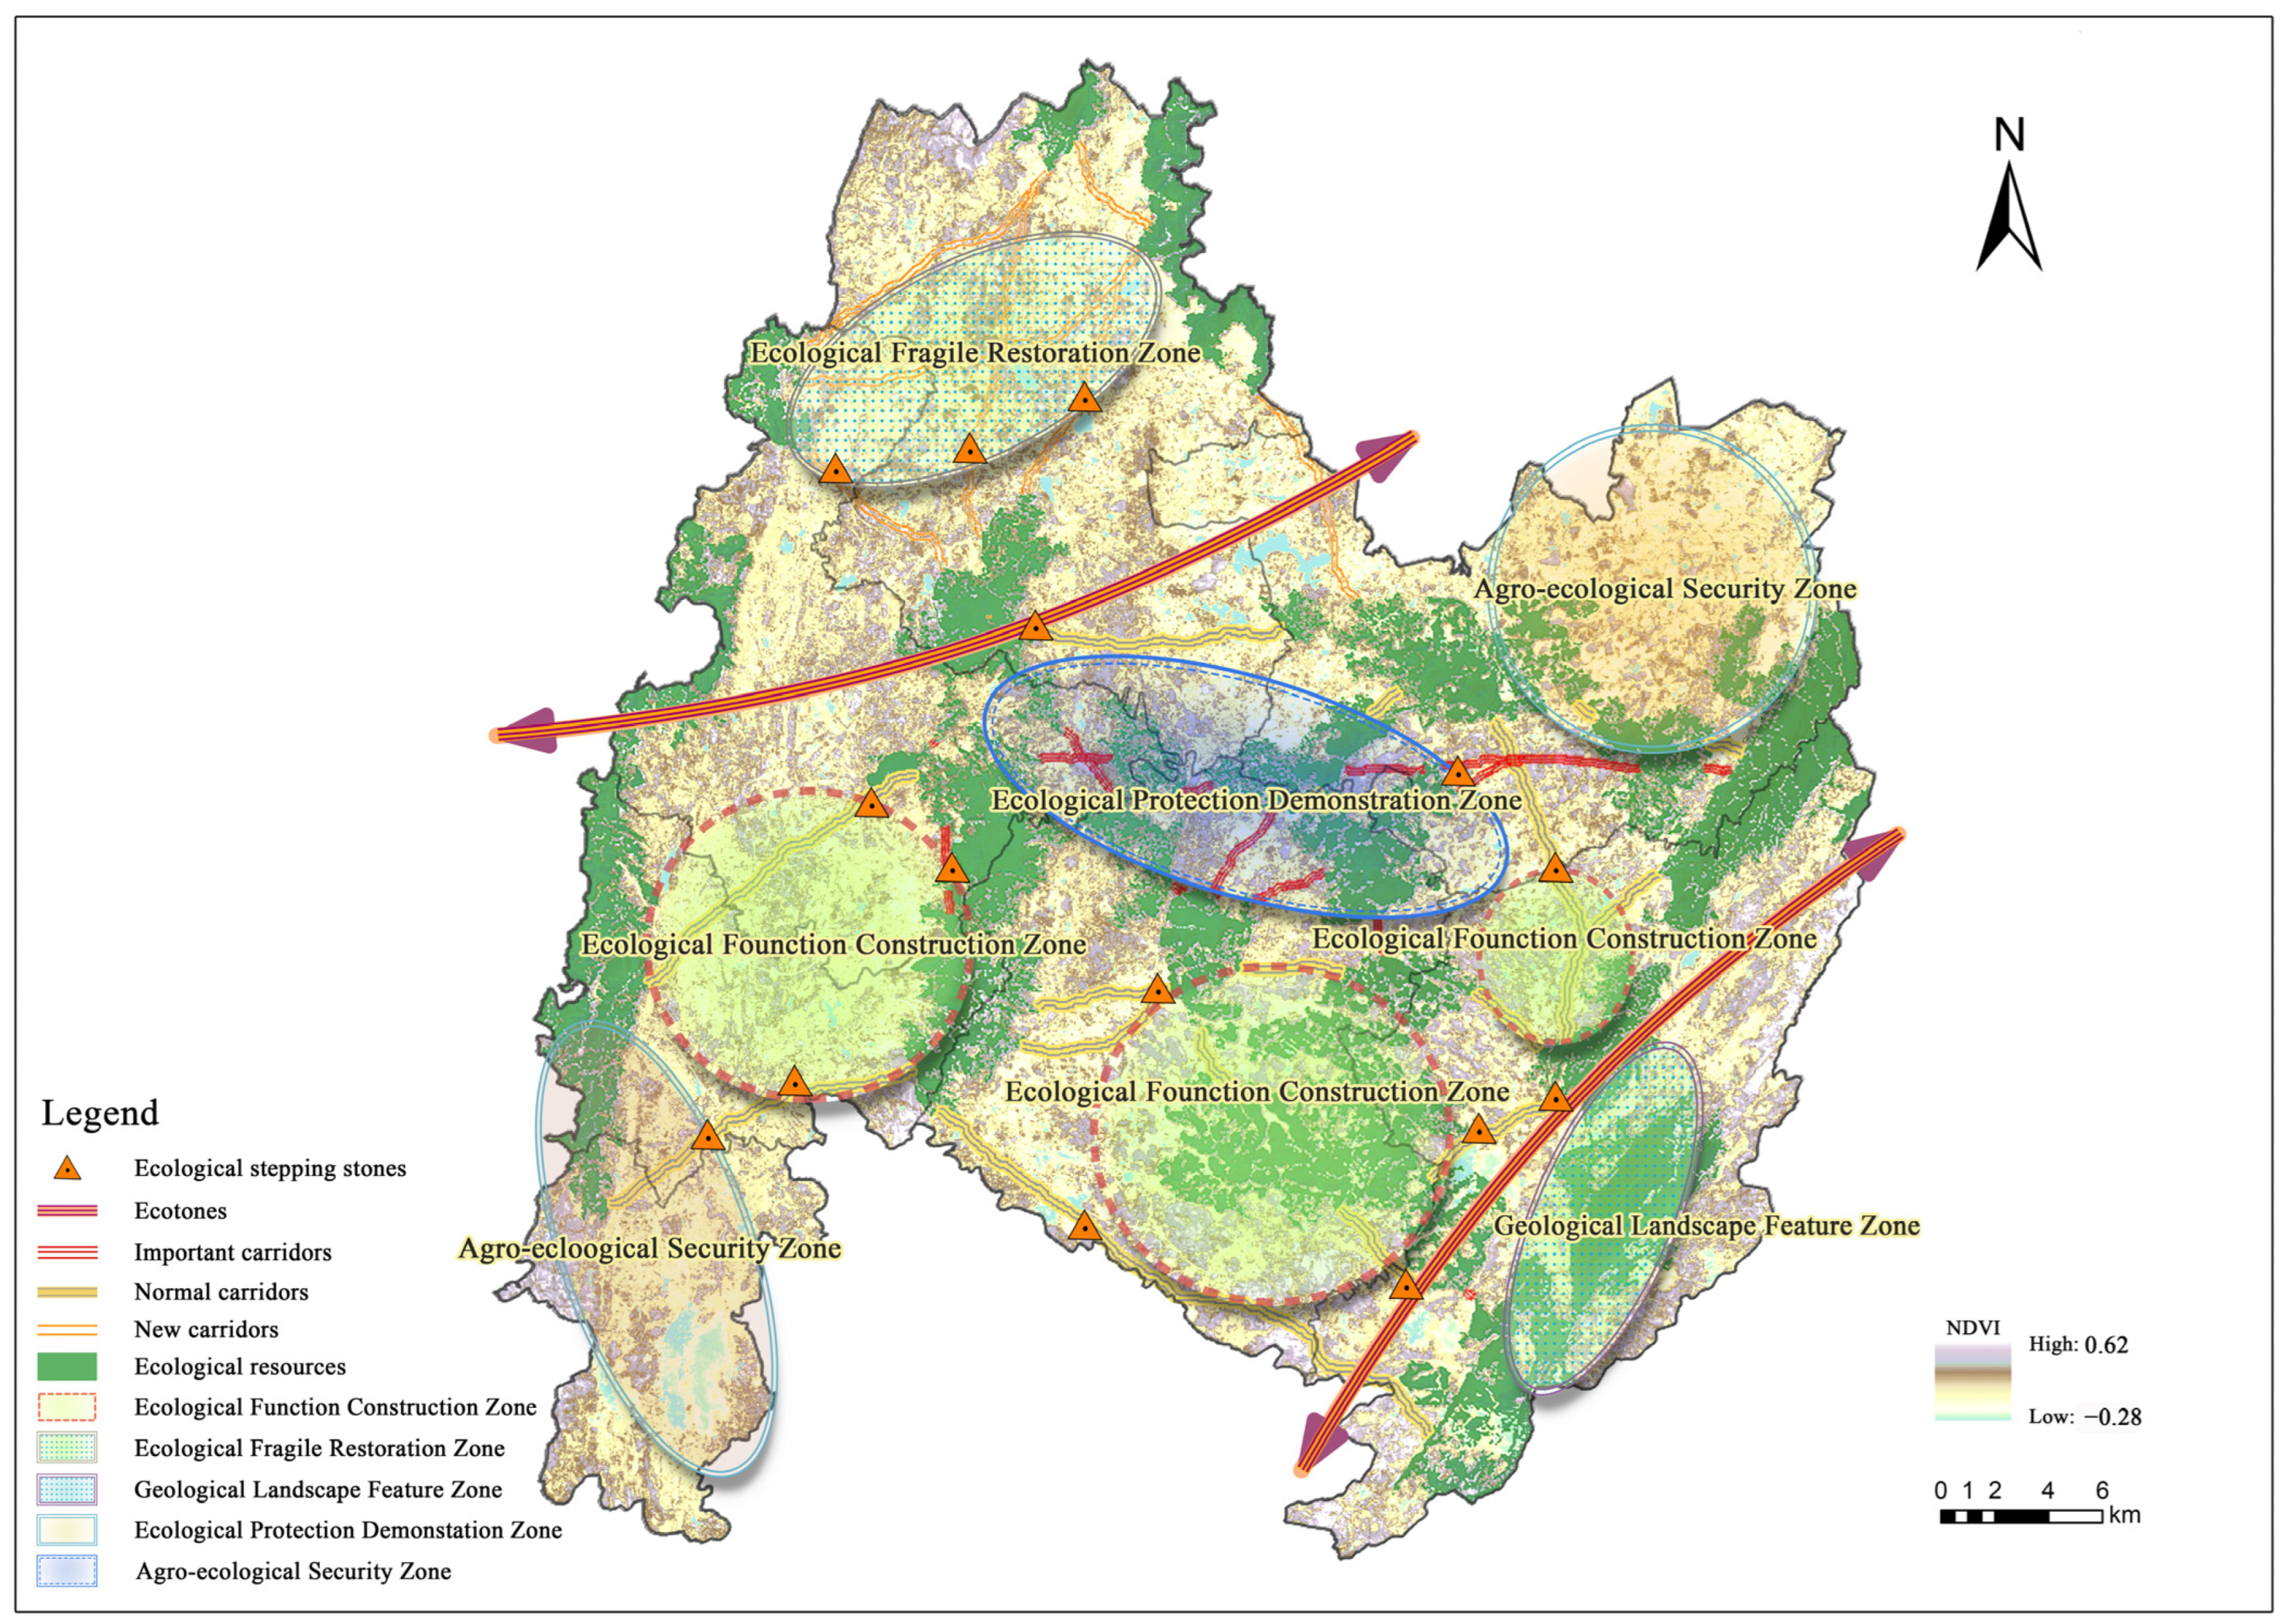
3.3. The Establishment of the Multi-Level ESP

The ecological resources at both the county and urban area levels were nested to obtain the Material Exchange Conversion Zone (Figure 6). This area is located in the northeastern part of the urban area and is part of the Shilin protected natural areas. This area, as the intersection of cultural ecological resources, natural ecological resources, and county ecological resources, has high vegetation coverage and prominent ecological value as well as a cultural value. In the south of the urban area, there is a phenomenon of missing ecological resources and corridors. Therefore, this area is set as a Priority Recovery Zone. Ecological stepping-stones were added at the intersection of cultural, natural, and county ecological corridors. This provides temporary landing sites for long-distance dispersing plants and animals while increasing interaction with humans, which is important for species migration within the county, improving human habitat quality, and promoting positive interactions between natural ecological elements and humans [46,47].

4. Discussion

4.1. Discussion of the SYAC’s ENs

In this study, ecological resources are identified within a county using MSPA, as well as PALCI as an indicator, which maximizes the consideration of ecosystem connectivity and wholeness. As opposed to identifying ecological land with protective properties, such as protected natural areas and water source protection areas, directly as an ecological resource, this method will maximize ecosystem wholeness and connectivity [48]. Protected natural areas and water source protection areas within the SYAC are spatially superposed with identified ecological resources, indicating that the ecological spaces in need of key protection, such as water source protection areas, protected natural areas, and ecological protection red line in SYAC, are all located within the ecological resources. The ecological resource layer superimposed on the habitat quality layer revealed that 83.64% of the ecologically high-quality areas were within ecological resources. It has been shown that this study uses a more reliable method of identifying ecological resources and that it is capable of identifying areas suitable for plant and animal habitats in SYAC scientifically, which provides a reference basis for preserving biodiversity, protecting urban ecological space, and protecting urban ecological security.
As shown in Figure 3, the ecological resources were unevenly distributed within the county, and dPC values varied widely among different resources. The ecological quality of the eastern and central parts of the SYAC is high, while the western and northern patches are smaller in size and have lower landscape connectivity, which prevents species from migrating and dispersing. For example, even though Patch 18 has a larger area, its dPC value is only 3.95, indicating high fragmentation within the patch, low connectivity with neighboring patches, and relatively poor habitat quality compared with the eastern part of the SYAC. Thus, the area’s ecological infrastructure should be strengthened to enhance the integrity of the patches.

4.2. Discussion of the Urban Area’s ENs

The direct selection method combined with PALCI is used to screen ecological resources within the urban area. In this section, this study incorporates parks, public squares, and other anthropogenic landscapes into the ecological resources category. The goal is to provide high-quality habitats for animals while meeting human, spiritual, and anthropogenic needs as much as possible and embodying the harmonious symbiosis between humans and nature. Forests, parks, and waters dominate cultural ecological resources in urban areas, while cultivated land dominates natural ecological resources. Among all the ecological resources, Taoyuanhu Park has the highest dPC value due to its large wetlands and high vegetation cover, providing favorable conditions for biodiversity conservation. To preserve ecosystem diversity, this patch should be prioritized for conservation in the later stages. In total, 85.71% of the ecological resources within the urban area have a dPC value of less than 0.2. The government’s lack of attention to environmental protection may be responsible for the failure of urban ecological resources to be ecologically effective.
According to the spatial distribution of urban resources, the southern part of the area is deficient in ecological resources. It is mainly due to the large amount of bare land and urban land in the area that is causing this phenomenon. As a result of the lack of ecological resources in the south, corridor construction is also hindered. As shown in Figure 6 natural landscape ecological corridors are generally concentrated in central parts of the urban area, and their directions are roughly aligned with those of the river. This corridor is mainly distributed in unused lands, cultivated lands, wetlands, and forests that are less disturbed by human activities. Cultural landscape ecological corridors are most prevalent in the northern part of the study area, with their directions roughly aligned with those of the road network. Therefore, the urban area shows dense corridors in the north and center but lacks corridors in the south. Due to the characteristic of an asymmetric structure and the sparse distribution of ecological landscape patterns in the urban area, the SYAC should reinforce the construction and protection of ecological resources and corridors in the southern part of the urban area, focusing on ecological restoration, to increase the connectivity among ecological patches.

4.3. Discussion of the Multi-Level ESP

Highly intensive land development has led to increasing fragmentation of urban habitat patches. Increasingly, regional development and ecological protection have become incompatible. As the ecological problem spreads from cities to counties, it is causing great concern. Most current studies are focused only on the construction of ESP at the scale of counties and urban, lacking linkage for spatial ecological planning studies at different levels. The ESP at different levels is complimentary: the concept of integrated planning is expressed in integrated planning from lower to upper levels, and the construction of the security pattern at the lower level forms the foundation for the security pattern at the upper level [49,50,51]. In the case of only constructing a single-level ESP, the main structure of the ESP will become disconnected at different scales within the same region, resulting in poor internal mechanisms for the ecosystem and affecting ESP as a systemic entity [52,53]. Considering the target audience for the service, the service targets of ecological space differ at different levels, and thus the planning ideas of the ESP also differ. At the macro level, an ESP should ensure the service provision by ecosystems for a whole region (from a county perspective) and coordinate both ecosystem and economic development from a macro-perspective, which is the essential measure for the development of a region [54]. A micro-level ESP construction, by contrast, should take into account the integration of ecological services with landscape beautification, recreation, and leisure. Therefore, this paper chooses two levels to renew the spatial distribution of ESP within the urban areas by utilizing the county ENs. During the preparation and transmission of ecological plans at the upper and lower levels, the two levels of ENs are hoped to play a positive role.

4.4. Research Limitations

Although this study helps implement ESP construction in typical karst landscape areas at the county level and clarifies the responsibility of ecological construction in townships, there are some shortcomings in our methodology.
This study only considered the relative positions of ecological resources and corridors and lacked any determination of the width of ecological corridors. From the ecological point of view, an ecological corridor that is too wide will result in a waste of land resources, while a corridor that is too narrow will not be able to meet the needs of the migration of plants and animals [55]. Therefore, future studies will need to discuss the corridor width that can best achieve the development of ecological and economic benefits [18].

5. Conclusions and Optimization Proposals

5.1. Conclusions

This study updates the ESP layout of the urban area by combining ENs at different levels and coupling cultural and natural resources in the urban area by taking the county’s ESP as a guide. By accurately locating the overlapping areas of ecological resources and corridors, the problem of the disconnected main structure of the ENs at each level in SYAC is solved. By building a multi-level ESP, the natural ecological resources and cultural ecological resources are better coupled to achieve the integrity of the regional landscape structure and ecosystem structure and to ensure the composite diversity of ecological service functions. In order to compound the ESP to help the SYAC enhance the ecosystem resilience while providing technical support for the construction of a harmonious habitat in the karst landscape region.
At the county level, we divided the study area into five major divisions: an Ecologically Fragile Restoration Zone, a Geological Landscape Feature Zone, an Agro-ecological Security Zone, an Ecological Protection Demonstration Zone, and an Ecological Function Construction Zone. Then, the county ecological network is nested with the ENs of the urban areas to identify three main zones within the urban area: a Priority Recovery Zone, a Material Exchange Conversion Zone, and Ecological Stepping-Stones.

5.2. Optimization Proposals for the County’s Ecological Control Zoning

Based on the spatial distribution characteristics of the ecological environment in the study area, SYAC was divided into five zones for ecological restoration and protection.
The Ecologically Fragile Zone is in the northern and central parts of Shilin Town, where the connectivity between patches is hindered by excessive disturbance from human activities, and the environmental quality is significantly lower than that of other areas. Compared with other areas, the need for ecological restoration in this area is more urgent and the cost of ecological restoration is higher. For these areas, comprehensive ecological management projects and corridor connectivity restoration projects should be the main focus. It is recommended to consider reducing human interference activities in the central-eastern part of Shilin Town, combining geomorphology, climate, soil, and other local conditions with scientific and technological support, scientific selection, and the cultivation of artificial forestation species. The central, northern, and western parts of Shilin Town focus on regulating industrial structure, encouraging the implementation of land transfer, and establishing an ecosystem compensation mechanism, implementing the policy of returning farmland to forest and grass.
The Agro-ecological Security Zone, located in Dake Town and the northeastern part of Xijiekou Town, features a large area of agricultural practice with medium ecological quality. However, the agricultural industrial structure is unreasonable, the advantages of special agriculture are not fully developed, and there are potential security risks. The region should guide the construction of ecological agriculture with the coordinated and sustainable development of ecology and economy and regulate the structure of the agricultural industry; accelerate the construction of natural pastureland protection; promote highly efficient, low toxicity, and low residue pesticides and organic fertilizers; make full use of the natural scenery of the countryside and Yi folk customs to create leisure, agriculture, and rural tourism areas; and promote the quality of agricultural products with ecological restoration to ensure regional food security.
The Geological Landscape Feature Zone is located in the central and eastern parts of Guishan town. The karst landscape in this area is more typical, with relatively high ecological quality and complex geological conditions, but the environment is more sensitive due to the soil and altitude. The area should be focused on landscape protection projects as well as geological disaster management projects, so as to improve the sustainability of the regional landscape. The habitat quality of the Guishan National Forest Park of China is improved through the focused protection of the advantageous landscape resources and the prohibition of a series of activities that are detrimental to ecological stability. For instance, the geomorphological environment of damaged mountains in the karst region can be improved through landscape reconstruction of degraded forests.
The Ecological Protection Demonstration Zone and Ecological Function Construction Zone are located in the central part of the study area, which is rich in forest sources, strong in water conservation and carbon sequestration, and high in ecological quality, and should be a focus of biodiversity protection projects. The important corridor area should be protected in a way that reduces human influence; the stepping-stone construction project should be implemented to provide landing points for long-distance migration of plants and animals and enhance the rate of successful dispersal; the focus of attention should be shifted from controlling the ecological resource proportion to improving the ecological service quality of the resource utilizing mountain afforestation and improving forest quality.

5.3. Optimization Proposals for the Urban Area’s ESP

Based on the characteristics of the resource distribution and spatial distribution of resistance values in the urban areas, the urban areas are divided into three main categories for ecological construction.
Priority Recovery Zone: This area is located in the southern part of the urban areas, with a large area of bare land and the degradation of ecological functions resulting in the erosion of the natural landscape and extremely fragile ecology. This area should be prioritized for vegetation landscape restoration projects as well as wetland ecological restoration projects. Vegetation restoration is carried out by leaving some fields fallow; important water sources are safeguarded by adhering to bottom-line thinking and the implementation of shoreline protection and restoration measures.
Material exchange conversion zone: This area is located in the northeast of the urban area and is the overlap area between the resources of the county and the resources of the urban areas, which is important for the coupling of humans and nature and exchanges between species. The protection of the conversion zone can be strengthened by optimizing the vegetation structure on the edge of the zone; species diversity in the zone can be improved by identifying and protecting the habitats of nationally endangered plants and animals in the conversion zone.
The ecological stepping-stones are the intersection of corridors at all levels in the urban areas, and the native state and activity of the stepping-stones should be maintained as much as possible to avoid crossing and cutting them by roads, while maintaining the natural connection of the natural system as much as possible and focusing on the improvement of the quality of the ecological services of the patch background.

Author Contributions

Conceptualization, X.M. and J.P.; methodology, X.M.; software, X.M. and S.D.; validation, X.M. and J.J.; formal analysis, X.M.; investigation, X.M.; resources, C.L.; data curation, X.M.; writing—original draft, X.M.; writing—review & editing, X.M., S.D., J.J. and J.P.; visualization, X.M. and S.D.; supervision, J.P. All authors have read and agreed to the published version of the manuscript.

Funding

This research received no external funding.

Institutional Review Board Statement

Not applicable.

Informed Consent Statement

Not applicable.

Data Availability Statement

Not applicable.

Acknowledgments

Xue Miao wants to thank, in particular, the love, care, and support from Yuzhi Zhang and Zhenhui Miao. Thanks for making me a better person.

Conflicts of Interest

The authors declare no conflict of interest.

References

  1. Bourgoin, C.; Oszwald, J.; Bourgoin, J.; Gond, V.; Blanc, L.; Dessard, H.; Phan, T.V.; Sist, P.; Läderach, P.; Reymondin, L. Assessing the ecological vulnerability of forest landscape to agricultural frontier expansion in the Central Highlands of Vietnam. Int. Appl. Earth Obs. Geoinf. 2020, 84, 101958–101970. [Google Scholar] [CrossRef]
  2. Li, S.; Zhao, X.; Pu, J.; Miao, P.; Tan, K. Optimize and control territorial spatial functional areas to improve the ecological stability and total environment in Karst areas of southwest China. Land Use Policy 2021, 100, 104940–104955. [Google Scholar] [CrossRef]
  3. Dai, L.; Liu, Y.; Luo, X. Integrating the MCR and DOI models to construct an ecological security network for the urban agglomeration around Poyang Lake, China. Sci. Total Environ. 2020, 754, 141868. [Google Scholar] [CrossRef] [PubMed]
  4. Baloch, M.A. The effect of financial development on ecological footprint in BRI countries: Evidence from panel data estimation. Environ. Sci. Pollut. Res. 2019, 26, 6199–6208. [Google Scholar] [CrossRef]
  5. Ma, T.; Liu, R.; Li, Z.; Ma, T. Research on the Evolution Characteristics and Dynamic Simulation of Habitat Quality in the Southwest Mountainous Urban Agglomeration from 1990 to 2030. Land 2023, 12, 1488. [Google Scholar] [CrossRef]
  6. Zhao, X.; Shi, X.; Li, Y.; Li, Y.; Huang, P. Spatio-temporal pattern and functional zoning of ecosystem services in the karst mountainous areas of southeastern Yunnan. Acta Geogr. Sin. 2022, 77, 736–756. [Google Scholar]
  7. Wu, X.; Zhang, J.J.; Geng, X.L.; Wang, T. Increasing green infrastructure-based ecological resilience in urban systems: A perspective from locating ecological and disturbance sources in a resource-based city. Sustain. Cities Soc. 2020, 61, 102354. [Google Scholar] [CrossRef]
  8. Gerten, D.; Rockstrm, J.; Heinke, J.; Steffen, W.; Richardson, K.; Cornell, S. Response to comment on “planetary boundaries: Guiding human development on a changing planet”. Science 2015, 348, 1217. [Google Scholar] [CrossRef]
  9. Yu, K. Landscape ecological security patterns in biological conservation. Acta Ecol. Sin. 1999, 19, 8–15. [Google Scholar]
  10. Ma, K.; Bo, B.; Li, X.; Guan, W. The regional pattern for ecological security (RPES): The concept and theoretical basis. Acta Ecol. Sin. 2004, 24, 761–768. [Google Scholar]
  11. Su, Y.; Chen, X.; Liao, J.; Zhang, H.; Wang, C.; Ye, Y.; Wang, Y. Modeling the optimal ecological security pattern for guiding the urban constructed land expansions. Urban For. Urban Green. 2016, 19, 35–46. [Google Scholar] [CrossRef]
  12. Lin, L.; Wei, X.; Luo, P.; Wang, S.; Kong, D.; Yang, J. Ecological Security Patterns at Different Spatial Scales on the Loess Plateau. Remote Sens. 2023, 15, 1011. [Google Scholar] [CrossRef]
  13. Wei, Q.; Halike, A.; Yao, K.; Chen, L.; Balati, M. Construction and optimization of ecological security pattern in Ebinur Lake Basin based on MSPA-MCR models. Ecol. Indic. 2022, 138, 108857. [Google Scholar] [CrossRef]
  14. Li, C.; Wu, Y.; Gao, B.; Zheng, K.; Wu, Y.; Wang, M. Construction of ecological security pattern of national ecological barriers for ecosystem health maintenance. Ecol. Indic. 2023, 146, 109801. [Google Scholar] [CrossRef]
  15. Wang, Y.; Zhang, F.; Li, X.; Johnson, V.C.; Tan, M.L.; Kung, H.-T.; Shi, J.; Bahtebay, J.; He, X. Methodology for Mapping the Ecological Security Pattern and Ecological Network in the Arid Region of Xinjiang, China. Remote Sens. 2023, 15, 2836. [Google Scholar] [CrossRef]
  16. Wang, Z.; Zhang, L.; Li, X.; Li, Y. Integrating Ecosystem Service Supply and Demand into Ecological Risk Assessment: A Comprehensive Framework and Case Study. Landsc. Ecol. 2021, 36, 2977–2995. [Google Scholar] [CrossRef]
  17. Cui, S.; Han, Z.; Yan, X.; Li, X.; Zhao, W.; Liu, C.; Li, X.; Zhong, J. Link Ecological and Social Composite Systems to Construct Sustainable Landscape Patterns: A New Framework Based on Ecosystem Service Flows. Remote Sens. 2022, 14, 4663. [Google Scholar] [CrossRef]
  18. Gao, M.; Hu, Y.; Bai, Y. Construction of ecological security pattern in national land space from the perspective of the community of life in mountain, water, forest, field, lake and grass: A case study in Guangxi Hechi, China. Ecol. Indic. 2022, 139, 108867. [Google Scholar] [CrossRef]
  19. Gurrutxaga, M.; Lozano, P.; Barrio, G. GIS-Based Approach for Incorporating the Connectivity of Ecological Networks into Regional Planning. J. Nat. Conserv. 2010, 18, 318–326. [Google Scholar] [CrossRef]
  20. Zhang, J.; Cao, Y.; Ding, F.; Wu, J.; Chang, I.-S. Regional Ecological Security Pattern Construction Based on Ecological Barriers: A Case Study of the Bohai Bay Terrestrial Ecosystem. Sustainability 2022, 14, 5384. [Google Scholar] [CrossRef]
  21. Yang, C.; Guo, H.; Huang, X.; Wang, Y.; Li, X.; Cui, X. Ecological Network Construction of a National Park Based on MSPA and MCR Models: An Example of the Proposed National Parks of “Ailaoshan-Wuliangshan” in China. Land 2022, 11, 1913. [Google Scholar] [CrossRef]
  22. Cui, L.; Wang, J.; Sun, L.; Lv, C. Construction and optimization of green space ecological networks in urban fringe areas: A case study with the urban fringe area of Tongzhou district in Beijing. J. Clean. Prod. 2020, 276, 124266. [Google Scholar] [CrossRef]
  23. Wickham, J.D.; Riitters, K.H.; Wade, T.G.; Vogt, P. A national assessment of green infrastructure and change for the conterminous United States using morphological image processing. Landsc. Urban Plan. 2010, 94, 186–195. [Google Scholar] [CrossRef]
  24. Soille, P.; Vogt, P. Morphological segmentation of binary patterns. Pattern Recognit. Lett. 2009, 30, 456–459. [Google Scholar] [CrossRef]
  25. Ye, H.; Yang, Z.; Xu, X. Ecological Corridors Analysis Based on MSPA and MCR Model—A Case Study of the Tomur World Natural Heritage Region. Sustainability 2020, 12, 959. [Google Scholar] [CrossRef]
  26. Zhou, S.; Song, Y.; Li, Y.; Wang, J.; Zhang, L. Construction of Ecological Security Pattern for Plateau Lake Based on MSPA–MCR Model: A Case Study of Dianchi Lake Area. Sustainability 2022, 14, 14532. [Google Scholar] [CrossRef]
  27. Fan, F.; Liu, Y.; Chen, J.; Dong, J. Scenario-based ecological security patterns to indicate landscape sustainability: A case study on the Qinghai-Tibet Plateau. Landsc. Ecol. 2021, 36, 2175–2188. [Google Scholar] [CrossRef]
  28. Dong, J.; Peng, J.; Xu, Z.; Liu, Y.; Wang, X.; Li, B. Integrating regional and interregional approaches to identify ecological security patterns. Landsc. Ecol. 2021, 36, 2151–2164. [Google Scholar] [CrossRef]
  29. Wu, B.; Bao, Y.; Wang, Z.; Chen, X.; Wei, W. Multi-temporal evaluation and optimization of ecological network in multi-mountainous city. Ecol. Indic. 2023, 146, 109794. [Google Scholar] [CrossRef]
  30. Xie, J.; Xie, B.; Zhou, K.; Li, J.; Xiao, J.; Liu, C.; Zhang, X. Multiple Probability Ecological Network and County-Scale Management. Land 2023, 12, 1600. [Google Scholar] [CrossRef]
  31. National Bureau of Statistics of China (Yunnan). Yunnan Statistical Yearbook 2019; China Statistics Press: Beijing, China, 2019.
  32. Huo, S.; Sun, J.; Sun, K. An Analysis on Resource Management of Geoheritage: A Case Study of South China Karst. Adv. Mater. Res. 2012, 518–523, 5909–5920. [Google Scholar] [CrossRef]
  33. Li, K.; Zhang, M.; Li, Y.; Xing, X. Karren Habitat as the Key in Influencing Plant Distribution and Species Diversity in Shilin Geopark, Southwest China. Sustainability 2020, 12, 5808. [Google Scholar] [CrossRef]
  34. Guo, B.; Yang, F.; Li, J.; Lu, Y. A novel-optimal monitoring index of rocky desertification based on feature space model and red edge indices that derived from sentinel-2 MSI image. Geomat. Nat. Hazards Risk 2022, 13, 1571–1592. [Google Scholar] [CrossRef]
  35. General Administration of Quality Supervision, Inspection and Quarantine of the People’s Republic of China, Standardization Administration of China. GB/T 21010-2017; Current Land Use Classification. Standards Press of China: Beijing, China, 2017.
  36. Vogt, P.; Riitters, K. GuidosToolbox: Universal digital image object analysis. Eur. J. Remote Sens. 2017, 50, 352–361. [Google Scholar] [CrossRef]
  37. Vogt, P.; Riitters, K.; Estreguil, C.; Kozak, J.; Wickham, J. Mapping Spatial Patterns with Morphological Image Processing. Landsc. Ecol. 2007, 22, 171–177. [Google Scholar] [CrossRef]
  38. Saura, S.; Rubio, L. A common currency for the different ways in which patches and links can contribute to habitat availability and connectivity in the landscape. Ecography 2010, 33, 523–537. [Google Scholar] [CrossRef]
  39. Saura, S.; Torné, J. Conefor Sensinode 2.2: A software package for quantifying the importance of habitat patches for landscape connectivity. Environ. Model. Softw. 2009, 24, 135–139. [Google Scholar] [CrossRef]
  40. Fu, Y.; Shi, X.; He, J.; Yuan, Y.; Qu, L. Identification and optimization strategy of county ecological security pattern: A case study in the Loess Plateau, China. Ecol. Indic. 2020, 112, 106030. [Google Scholar] [CrossRef]
  41. Hu, N.; Xu, D.; Zou, N.; Fan, S.; Wang, P.; Li, Y. Multi-Scenario Simulations of Land Use and Habitat Quality Based on a PLUS-InVEST Model: A Case Study of Baoding, China. Sustainability 2022, 15, 557. [Google Scholar] [CrossRef]
  42. Wang, C.; Yu, C.; Chen, T.; Feng, Z.; Hu, Y.; Wu, K. Can the establishment of ecological security patterns improve ecological protection? An example of Nanchang, China. Sci. Total Environ. 2020, 740, 140051. [Google Scholar] [CrossRef]
  43. Lu, Y.; Zhao, J.; Qi, J.; Rong, T.; Wang, Z.; Yang, Z.; Han, F. Monitoring the Spatiotemporal Dynamics of Habitat Quality and Its Driving Factors Based on the Coupled NDVI-InVEST Model: A Case Study from the Tianshan Mountains in Xinjiang, China. Land 2022, 11, 1805. [Google Scholar] [CrossRef]
  44. Li, S.; Xiao, W.; Zhao, Y.; Lv, X. Incorporating ecological risk index in the multi-process MCRE model to optimize the ecological security pattern in a semi-arid area with intensive coal mining: A case study in northern China. J. Clean. Prod. 2020, 247, 119143. [Google Scholar] [CrossRef]
  45. Zhao, S.; Ma, Y.; Wang, J.; You, X. Landscape pattern analysis and ecological network planning of Tianjin City. Urban For. Urban Green. 2019, 46, 126479. [Google Scholar] [CrossRef]
  46. Zhou, D.; Song, W. Identifying Ecological Corridors and Networks in Mountainous Areas. Int. J. Environ. Res. Public Health 2021, 18, 4797. [Google Scholar] [CrossRef]
  47. Zhang, X.; Wang, X.; Zhang, C.; Nie, J. Development of a cross-scale landscape infrastructure network guided by the new Jiangnan Watertown urbanism: A case study of the ecological green integration demonstration zone in the Yangtze River Delta, China. Ecol. Indic. 2022, 143, 109317. [Google Scholar] [CrossRef]
  48. Yang, Z.; Ma, C.; Liu, Y.; Zhao, H.; Hua, Y.; Ou, S.; Fan, X. Provincial-Scale Research on the Eco-Security Structure in the Form of an Ecological Network of the Upper Yellow River: A Case Study of the Ningxia Hui Autonomous Region. Land 2023, 12, 1341. [Google Scholar] [CrossRef]
  49. Yu, Q.; Du, M.; Li, H.; Tang, X.; Li, X. Research on the Integrated Planning of Blue-Green Space towards Urban-Rural Resilience: Conceptual Framework and Practicable Approach. J. Resour. Ecol. 2022, 13, 347–359. [Google Scholar]
  50. Yang, Y.; Feng, Z.; Wu, K.; Lin, Q. How to construct a coordinated ecological network at different levels: A case from Ningbo city, China. Ecol. Inform. 2022, 70, 101742. [Google Scholar] [CrossRef]
  51. Li, K.; Yu, T.; Li, J.; Cui, C.; Wu, S. Optimization of the Method of Constructing Ecological Security Pattern with Rapid Urban Expansion. E3S Web Conf. 2021, 299, 02016. [Google Scholar] [CrossRef]
  52. Wu, Y.; Wang, Y.; Wang, Y. Ecological security of economic belt from the symbiosis perspective—A case study of the Yangtze river economic belt. IOP Conf. Ser. Earth Environ. Sci. 2020, 568, 012008. [Google Scholar] [CrossRef]
  53. Shen, Z.; Wu, W.; Tian, S.; Wang, J. A multi-scale analysis framework of different methods used in establishing ecological networks. Landsc. Urban Plan. 2022, 228, 104579. [Google Scholar] [CrossRef]
  54. Ou, D.; Xia, J.; Zhang, L.; Zhao, Z. Research Progress on Regional Ecological Security Pattern Planning and Discussion of Planning Techniqueflow. Ecol. Environ. Sci. 2015, 24, 163–173. [Google Scholar]
  55. Leng, S.; Gao, X.; Pei, T.; Zhang, G.; Chen, L.; Chen, X.; He, C.; He, D.; Li, X.; Lin, C.; et al. The Geographical Sciences during 1986–2015; Springer: Berlin/Heidelberg, Germany, 2017. [Google Scholar] [CrossRef]
Figure 1. The geographical location of the study area. (a) Map showing the location of Yunnan in China. (b) Map showing the location of SYAC in Yunnan. (c) Map showing basic information about SYAC. (d) Map showing the distribution of land-use in the urban area.
Sustainability 15 15052 g001
Figure 2. Framework for identifying compound ESP.
Sustainability 15 15052 g002
Figure 3. Spatial distributions of ecological resources in SLAC.
Sustainability 15 15052 g003
Figure 4. Spatial distributions of ENs in SLAC.
Sustainability 15 15052 g004
Figure 5. Spatial distributions of ESP of SLAC.
Sustainability 15 15052 g005
Figure 6. Spatial distributions of compound ESP in the urban areas.
Sustainability 15 15052 g006
Figure 7. Spatial distributions of accumulated cultural ecological resistance surface in urban areas. (a) Road resistance surface. (b) Slope resistance surface. (c) Land-use resistance surface. (d) Ecological resource buffer resistance surface. (e) DEM resistance surface. (f) Accumulated cultural resistance in the urban areas.
Sustainability 15 15052 g007
Table 1. Details of the determination of habitat quality using the InVEST model.
Stress FactorsMaximum Influence Range (km)WeightSpatial Decay Type
Cultivated land0.81linear
Urban land0.50.7exponential
Mining land0.30.2exponential
Unused land0.30.2exponential
Table 2. Weights and coefficients of ecological-resistance surfaces in SYAC.
Resistance FactorWeightResistance Coefficient
13579
Habitat quality index0.30.6–10.3–0.60.2–0.30.1–0.20–0.1
NDVI0.10–6.466.45–14.3014.30–22.7922.79–33.9733.97–73.86
DEM (m)0.251458–17891789–19141914–20202020–21592159–2596
Slope (°)0.250–4.344.34–11.5911.59–20.2820.28–31.8631.86–73.86
Land-use type0.1ForestCultivated landWetlandUnused landUrban land
Table 3. Weights and coefficients of ecological-resistance surfaces in the urban areas.
Land Use TypeResistance Coefficient
Roads; Land for public facilities, Science, Education, Culture, and Health; Park; Transportation service stations; Commercial service facility land1
Residential land3
Mining land; Industrial Land; Airport; Press and publication administration; Water conservancy facilities land; Specially designated land; Land for logistics and warehouse20
Agricultural land100
Unused land300
Table 4. Ranking the importance of core areas (ecological resources) based on landscape connectivity.
NodeArea (km2)dPCNodeArea (km2)dPC
110.642634.721017.167910.75
239.416429.91114.33958.98
345.969228.311212.51898.8
421.017824.67136.18798.8
534.47622.82143.65997.58
624.288419.09153.76996.93
710.163612.49163.18586.51
819.168111.72177.55684.85
99.922210.821843.06113.95
Disclaimer/Publisher’s Note: The statements, opinions and data contained in all publications are solely those of the individual author(s) and contributor(s) and not of MDPI and/or the editor(s). MDPI and/or the editor(s) disclaim responsibility for any injury to people or property resulting from any ideas, methods, instructions or products referred to in the content.

