Abstract
Solar energy, as a clean energy source, has tremendous potential for utilization. The advancement of solar energy utilization technology has led to an increasing demand for solar energy, resulting in a growing need for the accurate prediction of solar radiation. The main objective of this study is to develop a novel model for predicting solar radiation intervals, in order to obtain accurate and high-quality predictions. In this study, the daily sunshine duration (SD), average relative humidity (RHU), and daily average temperature (AT) were selected as the indicators affecting the daily global solar radiation (DGSR). The empirical study conducted in this research utilized daily solar radiation data and daily meteorological data collected at the Hami station in Xinjiang from January 2009 to December 2016. In this study, a novel solar radiation interval prediction model was developed based on the concept of “point prediction + interval prediction”. The Conformer model was employed for the point prediction of solar radiation, while the Generalized Laplace (GLaplace) distribution was chosen as the prior distribution to account for the prediction error. Furthermore, the Solar DeepAR Forecasting (SDAR) model was utilized to estimate parameters of the fitted residual distribution and achieve the interval prediction of solar radiation. The results showed that both models performed well, with the Conformer model achieving a Mean Squared Error (MSE) of 0.8645, a Mean Absolute Error (MAE) of 0.7033 and the fitting coefficient of 0.7751, while the SDAR model demonstrated a Coverage Width-based Criterion (CWC) value of 0.068. Compared to other conventional interval prediction methods, our study’s model exhibited superior accuracy and provided a more reliable solar radiation prediction interval, offering valuable information for ensuring power system safety and stability.
1. Introduction
China, as the world’s second largest economy and sustainable development, bears significant responsibilities as a major player on the global stage [1]. Currently, achieving high-quality development and promoting green transformation has become a crucial topic in China’s modernization process. The latest report from the International Energy Agency (IEA) reveals that China remains at the forefront of solar photovoltaic (PV), with new installations reaching 100 GW in 2022, a nearly 60% increase compared to 2021. This accounts for approximately 38% in global solar PV power generation growth. Achieving high-quality development and promoting green transformation has become a crucial topic in China’s modernization process. The goal of “carbon peak and carbon neutrality” presents new challenges and opportunities for China’s solar energy technology. Accurate global solar radiation data is crucial for energy utilization, climate research, ecology, and economic development-especially in the field of solar energy [2]. Reliable predictions can guide the supervision and operation of solar power plants [3]. Additionally, solar radiation information can be utilized for space weather forecasting and satellite communications, thereby improving the safety and dependability of space technology. However, current instruments for measuring solar radiation may have temperature control issues in different regions, resulting in challenges. To accurately predict future solar radiation levels and address these issues, there is an urgent need to develop a prediction method based on general meteorological data. This will not only promote the growth of the solar energy industry but also enhance the utilization of sustainable energy.
Solar radiation prediction is a well-explored research field [4,5,6], with various methods including physical models (e.g., Collares-Pereira and Rabl [7]), statistical models (e.g., ARIMA model [8], VAR model [9], Exponential Smoothing [10]), and hybrid methods combining multiple models and data sources, such as using the output of physical models as input for statistical models or fusing remote sensing data with statistical models. Recently, machine learning models have become widely studied and applied in solar radiation prediction. These models can automatically learn and process large amounts of data to improve prediction accuracy. Fan et al. [11] evaluated the performance of Support Vector Machines (SVM) and four tree-based soft computing models in predicting horizontal solar radiation, comparing their accuracy. Zeng et al. [12] constructed a high-density network of global daily solar radiation using a Random Forest (RF) model, accurately predicting daily solar radiation under different climatic and geographical conditions in China.
Deep learning is a recent machine learning method with great advantages in processing time series data [13]. Deep learning models include Convolutional Neural Networks (CNNs), Recurrent Neural Networks (RNNs) [14], and Transformer [15] models. CNNs are deep feed-forward neural networks with convolution and pooling operations as the core, suitable for short-term time series prediction tasks but limited when dealing with long-term patterns, complex relationships, and large prediction step sizes. RNNs excel at short sequence prediction and capturing temporal dependencies but face limitations in processing long sequences, training difficulty, and computational efficiency. Transformer is a deep learning model based on a full attention mechanism that represents the global dependence between the input and output of the model. Compared to CNNs and RNNs, Transformer can capture long-distance dependence while maintaining high parallel computing power and scalability for time series prediction problems; however, it still faces challenges regarding learning complexity and hyperparameter adjustment.
In the field of solar energy, it holds practical significance and research value to predict the uncertainty of solar radiation [3]. The differentiation from traditional deterministic forecasting methods lies in presenting forecasts as intervals or probability distributions, rather than solely individual point estimates. This method of uncertainty forecasting can offer more comprehensive statistical information [16]. By providing upper and lower limits for forecast results, interval forecasting can provide decision-makers with more intuitive information, enabling them to fully comprehend the range of forecast results and potential risks. The existing interval forecasting methods are primarily categorized into two types: probability forecasting methods and boundary estimation methods [17]. The boundary estimation method typically predicts the upper and lower bounds of the interval directly through machine learning. However, probabilistic prediction methods usually represent uncertainty using probability density function, quantile, mean, and variance [18], which encompasses parametric methods [19] as well as non-parametric methods.
In this paper, a novel approach for solar radiation interval prediction is developed. A comprehensive indicator system is established and the Conformer model is employed for point prediction of solar radiation. Then, the statistical distribution of residuals in solar radiation is investigated and fitted, and the relevant parameters of the distribution are calculated using the Solar DeepAR Forecasting (SDAR) [20] model. Finally, interval prediction for solar radiation is made at various confidence levels. The contributions of our study are summarized as follows.
- This study combines the Conformer model with the SDAR model and applies it to the interval prediction of solar radiation. In comparison to traditional time series prediction models, the model developed in our study shows significant superiority in terms of accuracy and reliability, thereby greatly enhancing the predictive performance.
- The Conformer model uses fast Fourier transform to extract correlations among multivariate variables, completing the modeling of relationships between multiple variables. By utilizing multi-scale dynamics, temporal patterns across different scales of representation are captured in this study. Additionally, employing a stationary and instant recurrent network reduces time complexity. The Conformer model compensates for the global information loss caused by the sliding-window attention method, while also improving the accuracy and generalization ability through a normalizing flow to identify hidden patterns.
- By conducting calculations, it is determined that the residuals of solar radiation exhibit a fat-tailed distribution form. Consequently, in contrast to previous studies employing the normal distribution, this paper selects the GLaplace distribution as the prior distribution to more accurately depict the distribution of solar radiation and thereby enhance model performance.
The remaining sections of this paper are organized as follows: Section 2 provides a thorough explanation of the essential principles underlying the Conformer model and SDAR model, and introduces evaluation indexes for both point prediction and interval prediction. In Section 3, the authors present details about the dataset used in this study, describe the construction of our indicator system, and conduct a preprocessing and descriptive analysis on the data. Section 4 carries out empirical analysis using the Conformer model to obtain point prediction results for solar radiation. The statistical distribution of solar radiation residuals is then fitted using the SDAR model to complete interval prediction. Additionally, our developed model is compared and analyzed with other traditional prediction methods. Finally, Section 5 comprehensively summarizes the modeling work and main conclusions obtained while analyzing advantages offered by our developed model.
2. Methodology
This article aims to develop a solar radiation interval prediction model based on general meteorological data, using the concept of “point prediction + interval prediction”. To enhance information utilization, reduce time complexity and ensure accurate solar radiation prediction, the Conformer model will be utilized for deterministic forecasting after comparing various existing methods. Additionally, the parameterization of the solar radiation interval prediction is achieved by assuming a prior distribution, and the SDAR model is employed to predict its parameters. Figure 1 illustrates the flowchart of our solar radiation interval prediction model.
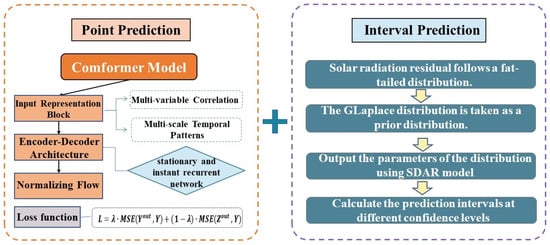
Figure 1.
Flowchart of Solar Radiation Interval Prediction.
2.1. The Principle of Conformer Model
The Conformer model, proposed by Google Research [21] in 2020, is an advanced neural network architecture that introduces innovative designs based on the Transformer model. The Conformer model shows significantly improved performance and training speed due to innovations such as incorporating multi-variable and temporal dependencies, utilizing both stationary and instant recurrent network blocks, and implementing a hybrid convolutional module. The Conformer model developed by Yan Li et al. [22] in 2023 efficiently and stably predicts long-period sequences with obvious periodicity in multivariate time-series data, addressing associated computational efficiency and stability issues. The Conformer model comprises three main components: the input representation block, the encoder–decoder architecture, and the normalizing flow block.
2.1.1. Input Representation Block
Firstly, the input data are preprocessed and then represented in a vector form. Let denote the time-series where the length of index i is .
- Multi-variable Correlation.
The Conformer model uses fast Fourier transform to identify hidden patterns and relationships among multiple variables, which have different degrees of correlation with the dependent variable. The fast Fourier transform [23] is an efficient algorithm for computing the discrete Fourier transform, commonly used in signal processing and statistics to calculate the spectral density and correlation of a signal or data. A time domain signal is transformed into its frequency domain representation using the fast Fourier transform, enabling the identification of the included frequency components. Additionally, comparing multiple time series through a fast Fourier transform analysis allows for a correlation assessment in the frequency domain.
The correlation among multi-variables can be expressed using the fast Fourier transform method, as shown in the following equation:
Here, denotes the Fourier transform of denotes the inverse Fourier transform, and the asterisk denotes the conjugate operation.
- Multi-scale Temporal Patterns
Based on multi-scale dynamics, a time-series frequently displays distinctive temporal patterns at different resolutions [22]. In order to extract the temporal patterns across various scales, this study extracted the four temporal frequencies of the year, month, week and day to establish a temporal resolution set year, month, week, day}. And the set of sample is represented as the . Therefore, the multi-scale temporal patterns can be expressed as follows:
where and denote the model trainable weights and bias, respectively.
- Fusion of Multi-variable Correlation and Temporal Patterns
In order to better capture the interrelationships among different variables in multivariate time series, the convolution operation is employed to discern temporal dependencies. The convolution operation can identify temporal patterns within the data and assign weights to each variable’s contribution towards these patterns. Specifically, it is defined as a function that utilizes a sliding window across the time series data [22], computing a weighted sum of values within each window, which is illustrated as follows:
where ⊙ represents the convolution calculation, represents the weights, and represents the bias.
Ultimately, the above multi-variable correlation and multi-scale temporal patterns are integrated to derive the subsequent equation:
2.1.2. Encoder–Decoder Architecture
The encoder–decoder architecture, commonly used in sequence-to-sequence tasks, consists of two main parts: an encoder and a decoder. By introducing this architecture, the Conformer model effectively captures dependencies and relationships within the input sequence to generate coherent and meaningful output sequences. The encoder transforms the input sequence into a fixed-dimensional representation or context vector that captures relevant information. Then, the decoder utilizes this encoded hidden representation to generate an output sequence for the next time step by learning historical correlations. Consequently, the encoder–decoder architecture improves operational efficiency and forecast accuracy while enhancing the Conformer model’s capacity to identify the time series data.
The sliding-window attention mechanism, which was proposed by Liu et al. [24], is a local variant of the self-attention commonly used in transformer-based models. In this case, each point only attends to a subset of nearby points within a fixed window size or range. However, this may sacrifice information utilization for long-period time series prediction due to sparse connections at individual points. The Conformer model enhances the recurrent network to improve information utilization without increasing time and memory complexity by leveraging RNN’s ability to capture dynamic information through cycles in the node network. The trend and seasonal terms are extracted from the input sequence and integrated with local temporal patterns, forming the stationary and instant recurrent network [22]. This compensates for the global information loss caused by sliding-window attention while reducing time complexity. Figure 2 illustrates its structural diagram.
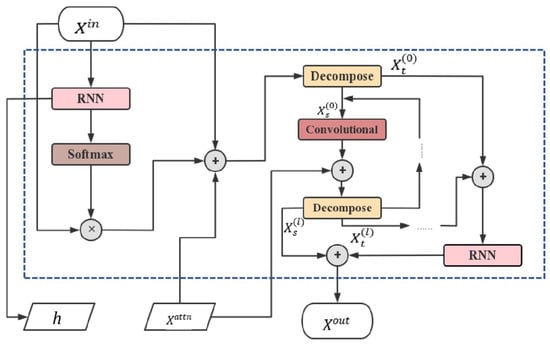
Figure 2.
The Stationary and Instant Recurrent Network Module.
According to the flowchart of the stationary and instant recurrent network module shown in Figure 2, the input vector is provided for the first RNN block:
where represents the sliding-window self-attention mechanism.
The Conformer model utilizes the Moving Average (MA) technique to identify the long-term trend and calculate the trend term, as shown in the following equation.
Here denotes the average pooling operation, and is a padding operation in a convolutional network, which aims to make each input block serve as the center of the convolution window.
Next, the seasonal term is therefore defined as the initial time series residuals minus the MA.
Then, the seasonal patterns are embedded using a convolutional layer, and the resulting embedded representation is then combined with the local representation. This combined representation is fed into another decomposition block in order to extract additional seasonal patterns in the subsequent loop. The recurrent way is as follows:
Here represents the decomposition block, and denotes the convolution and polynomial multiplication.
Ultimately, the refined multi-faceted temporal dynamics are ultimately integrated, and the output results are expressed as follows:
2.1.3. Normalizing Flow
The normalizing flow, proposed by Rezende et al. [25], is a generative model that transforms a simple distribution into a more complex one to match the data distribution. Each transformation involves mapping from the data space to an intermediate space, with its inverse mapping back to the data space. The model can effectively capture complex patterns and dependencies within the data by combining multiple transformations. The key advantage of normalizing flows lies in their ability to compute the exact likelihood of observed data, enabling effective training through a maximum likelihood estimation. The Conformer model introduces a normalizing flow block to identify hidden state distributions, improving prediction reliability and generalization capability.
Let h be the hidden state generated by the first RNN block in the stationary and instant recurrent network module. Then, suppose that a random variable is drawn from a standardized normal distribution. Thus, the hidden state distribution in the encoder block can be mathematically expressed as follows:
where and are both completely linked networks, while represents the encoder’s concealed state.
Subsequently, the normalizing flow is commenced with the latent representation and the decoder hidden state as inputs, as demonstrated by the subsequent equation:
Then, the normalizing flow block is used to iteratively compute the sequence in the following recurrent way:
2.1.4. Loss Function
The loss function quantifies the discrepancy between predicted and actual values in a mathematical way. It plays a crucial role in the Conformer model by defining the training objective for optimizing parameters and improving prediction performance. The more widely used log-likelihood is substituted for the Mean Squared Error (MSE) in a sequence prediction on the encoder–decoder architecture and the normalizing flow block. The definition of this loss function is provided below:
Here the decoder’s output is denoted by and the output of the normalizing flow is denoted by . The hyper-parameter is used to trade off the relative contributions of the normalizing flow and the encoder–decoder architecture.
2.2. The Principle of SDAR Model
The SDAR model [20], built upon the DeepAR model [26] and incorporating a fat-tailed distribution, facilitates the interval prediction of solar radiation. By employing to capture the dynamics and to handle the high-level characteristics in the time series, the SDAR model achieves enhanced accuracy.
2.2.1. Generalized Laplace Distribution
To remove the limitation of symmetry, the original Laplace distribution was generalized into the Generalized Laplace (GLaplace) distribution [20], whose density profile is no longer symmetric with respect to the position parameter . The probability density function of the Generalized Laplace distribution [20] is defined as:
where , and are the two scale parameters that control the asymmetric shape of the GLaplace distribution.
2.2.2. The Process of SDAR Model
Let represent the time series of solar radiation, and let:
be the m covariates, where L is the length of a predefined time window.
Figure 3 shows the flowchart of the SDAR model. are the hidden layer function and output layer function, respectively, with U and V being the parameter sets for these two functions, respectively. In the SDAR model, the hidden layer function is made up of multiple Long-short Term Memory (LSTM) layers with a specified number of LSTM layers, denoted as a.
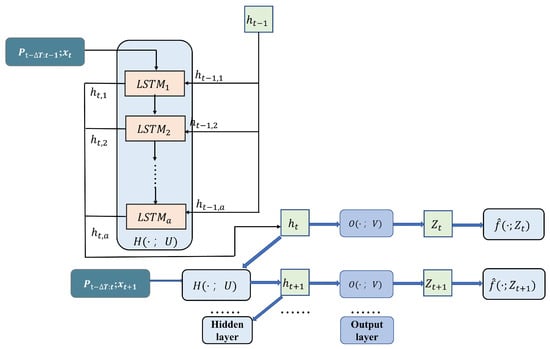
Figure 3.
Flowchart of the SDAR Model.
The last output state , observation , and covariate are firstly inputted into the hidden layer function at the time t. Subsequently, the resulting output state is utilized as the input to the output layer . The current state is then mapped to the parameter set of the GLaplace distribution by the output layer function . Ultimately, the final model outputs the GLaplace distribution of solar radiation.
The SDAR model uses the closed form of the Continuous Ranked Probability Score (CRPS) [20] integral based on the GLaplace distribution as its loss function, which is defined as follows:
where D denotes the Daily Global Solar Radiation (DGSR), .
2.3. Evaluation Indexes for Point Prediction
In this section, six indexes are chosen to evaluate the difference between the point forecasting model’s predicted outcomes and the true values, including MSE, Root Mean Square Error (RMSE), Mean Absolute Error (MAE), Mean Absolute Percentage Error (MAPE) and Mean Square Percentage Error (MSPE), and fitting coefficient [6]. The specific expressions for these six indexes are given below:
Here represents the true value, represents the mean of the true values, represents the point predicted value, and N is the sample size.
MSE, RMSE, MAE, MAPE, and MSPE are indexes that assess the relationship between the predicted values of a model and the true values. Smaller values for these indexes indicate lower prediction errors and higher accuracy and reliability in the model’s predictions. On the other hand, represents the extent to which the independent variable accounts for the variability in the response variable, i.e., the proportionality between the predicted value and the true value, and the closer is to 1, the better the model’s fitting effect is.
2.4. Evaluation Indexes for Interval Prediction
To comprehensively evaluate the quality of prediction intervals, this study selects Prediction Interval Coverage Probability (PICP), Prediction Interval Normalized Averaged Width (PINAW), and Coverage Width-based Criterion (CWC) as measures.
- PICP
The PICP [27] represents the probability of the actual observation falling within the prediction interval, indicating interval reliability. When the PICP closely matches the confidence level, it signifies a higher predictive reliability. The formula for calculating PICP is shown below:
Here, N is the total number of samples, is the lower confidence limit and is the upper confidence limit. is a schematic function that evaluates whether the true value of falls within the prediction interval .
- PINAW.
The PINAW [27] represents the average width of normalized prediction intervals, serving as a measure to assess interval prediction accuracy and effectiveness. The formula for calculating PINAW is shown below:
Here, R represents the difference between the prediction set’s maximum and minimum values, which standardizes the average width of the prediction interval. When maintaining a consistent PICP, a smaller PINAW indicates reduced uncertainty in predictions and signifies improved predictive accuracy.
- CWC
CWC [28] is an evaluation metric that combines PICP and PINAW, and the formula for CWC is shown below:
where is the confidence level and is the adjusted factor.
The value of PINAW is penalized to increase the magnitude of CWC when PICP is smaller than the confidence level . Conversely, when PICP is greater than or equal to , only the value of CWC contributes to PINAW. Therefore, a lower value of CWC indicates a superior interval prediction model.
3. Data Source and Data Analysis
3.1. Data Sources
The data used in this study were obtained from the National Meteorological Information Center of China, which are the daily solar radiation data and the daily meteorological data collected at the Hami station in Xinjiang from January 2009 to December 2016, including Daily Sunshine Duration (SD), Average Relative Humidity (RHU), Daily Average Temperature (AT), and DGSR.
3.2. Data Preprocessing
In the data analysis and the training of machine learning models, the quality of the data is crucial. Therefore, the data used in this study were rigorously cleaned and corrected. The operations we performed included subset selection, noise processing, data cleaning, and data type transformation to ensure the accuracy, completeness, and consistency of the data. Furthermore, the entire dataset was divided into a training set, validation set, and test set in a ratio of 7:2:1. This division aids in evaluating the model’s performance and comparing the advantages and disadvantages of different models.
3.3. Construction of Indicator System
The amount of solar radiation reaching the surface is influenced by several factors, including insolation, aerosols, clouds, and relative humidity according to meteorological studies. A longer sunshine duration means that the solar radiation has more time to hit the surface directly, and therefore the surface receives more solar radiation. Some related studies have shown that the increase in low clouds and water vapor in the western regions can lead to a decrease in the amount of solar radiation received by the surface [29]. This is due to the ability of aerosol particles to scatter solar radiation and block its direct path to the surface, thereby reducing the amount of solar radiation received at the surface. On the other hand, water vapor molecules in the air take up more space and absorb solar radiation when the relative humidity is high, thereby decreasing the amount of solar radiation that can reach the surface. In general, the longer the light duration, the greater the amount of radiation received by the ground. The influence of atmospheric transparency on terrestrial solar radiation is uncertain, but there is no quantitative and exact conclusion at present, which needs further research. Since the data are only collected at the Hami station in Xinjiang, there is no need to consider geographical location and altitude.
In summary, the role of these factors needs to be comprehensively considered in order to improve the accuracy and reliability of the prediction model of solar radiation quantity. In this paper, four indicators including SD, RHU, AT and DGSR are selected to construct the indicator system of this model, as shown in Table 1:

Table 1.
Indicator System for Predicting Solar Radiation.
3.4. Descriptive Analysis
3.4.1. Trends of SD, RHU, AT, and DGSR Over Time
Based on the data measured at Hami station in Xinjiang, Figure 4 illustrates the trend of SD, RHU, AT, and DGSR over time. These trends are consistent with the temperate continental arid climate to which Hami belongs, which provides an important reference for further research and analysis.
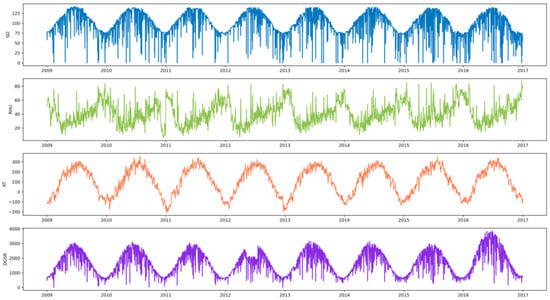
Figure 4.
Trends of SD, RHU, AT, and DGSR Over Time.
The analysis of Figure 4 reveals cyclic and seasonal variations with a one-year cycle in SD, RHU, AT, and DGSR. The DGSR showed a significant change within a year, with the basic pattern of being lowest in winter, and then increasing significantly over time, reaching its peak in summer before showing a downward trend. However, the DGSR value in the middle of summer 2012 was low and did not reach the annual peak, making it relatively lower compared with other years. In contrast, the DGSR in 2016 was significantly higher, which may be attributed to the strong El Nino phenomenon that occurred during that year. This further suggests that predicting solar radiation for an anomalous year like 2016 is somewhat challenging.
Significant autocorrelation in solar radiation data can be observed from Figure 5. In this paper, the solar radiation data of three lag values and are selected.
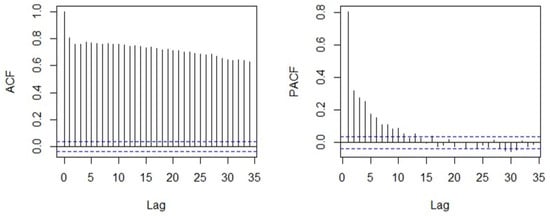
Figure 5.
Autocorrelation and Partial Correlation of DGSR.
3.4.2. Correlation Between Variables
The heat map of Pearson correlation coefficient between the four indicators selected in this paper and the three lagged variables is shown in Figure 6:
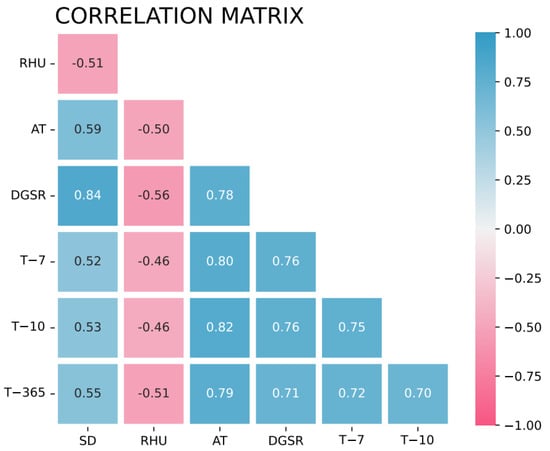
Figure 6.
Heat Map of Pearson Correlation Coefficient.
4. The Construction and Results of the Model
4.1. Point Prediction Based on Conformer Model
The input in this experiment is the processed vector representation data of four indicators: SD, RHU, AT, and DGSR, which means the number of metrics is four. The selection of hyperparameters plays a crucial role in the model’s performance. Therefore, grid search and cross-validation are utilized to evaluate the model’s performance on the validation set and determine the optimal hyperparameters for the Conformer model [30]. These hyperparameters are set as follows: the input sequence length is set to 96 and the prediction sequence length is 30; there are 8 attention heads, 2 encoder layers, 1 decoder layer, a sliding window size of 2; and there is a learning rate of .
The Conformer model was iteratively trained in the Python environment of Paddle and tested on a separate dataset to obtain the point prediction results for DGSR.
4.2. Interval Prediction Based on SDAR Model
4.2.1. Statistical Distribution of Solar Radiation
The point prediction results of the Conformer model are denoted as . Consequently, the prediction error of solar radiation can be derived in the following equation:
Except for the location parameter, the prediction error follows the same probability distribution form as the solar radiation itself. Therefore, the distribution of solar radiation is indirectly analyzed by examining the distribution form of prediction errors.
Python is employed to draw the histogram and the probability density function of the residual, as shown in Figure 7:
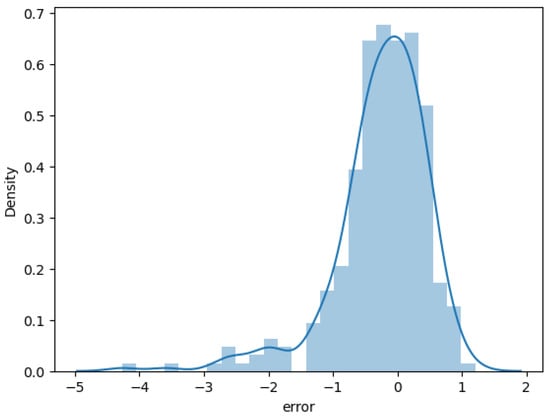
Figure 7.
Histogram of Residuals and Probability Density Function.
The distribution of the residual solar radiation, as shown in Figure 7, deviates from the normal distribution with a heavier tail and an asymmetric shape.
The kurtosis of a probability distribution quantifies its tailness, and it is formally defined as follows:
where represents the expectation operator, denotes the mean and is the standard deviation of the random variable X, respectively.
The kurtosis value of 3 indicates a normal distribution, while a higher kurtosis suggests the presence of fat tails in the distribution. Table 2 presents the statistical characteristics of the DGSR residuals obtained from the Conformer model.

Table 2.
Statistical Characteristics of the Residues.
The results indicate that solar radiation follows a distribution with fat tails. Due to its asymmetry, the GLaplace distribution will be used in Section 2.2.1 to fit the distribution of solar radiation.
4.2.2. Interval Prediction Results
Regarding the SDAR model using the GLaplace distribution, Fourier decomposition is used to perform seasonal adjustment on the solar radiation data. This indicates eliminating the seasonal component from the solar radiation time series.
The point prediction results obtained from the Conformer model are inputted into the SDAR model, and the confidence values are set as , respectively. The interval prediction results of DGSR are obtained by using Python, as shown in Figure 8.
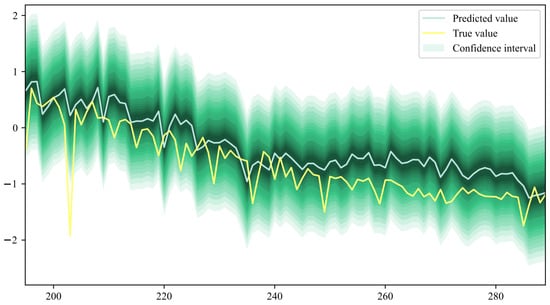
Figure 8.
Interval Prediction Results Based on SDAR Model.
4.3. Comparison and Evaluation of Point Prediction Results
4.3.1. Introduction to Contrast Models
This section will compare the prediction results of the Conformer model with those of other common time series models, including the Autoregressive Moving Average with Exogenous Variables (ARMAX), LSTM, the Random Forest (RF), and the Support Vector Regression (SVR).
- ARMAX: The Autoregressive Moving Average with Exogenous Variables model [31] is a statistical model for time series analysis and forecasting that combines the characteristics of Autoregressive (AR), Moving Average (MA), and exogenous variable X. The ARMAX model is suitable for time series data with linear relationships and external influencing factors, allowing it to effectively capture autocorrelation, lag effects, and the influence of external factors in non-stationary time series data, which make it highly effective in modeling long-term dependence.
- LSTM: The Long Short-Term Memory model [32] is a commonly used neural network model in sequence data processing. It is designed to address issues such as the vanishing gradient and exploding gradient problems faced by traditional RNN models. LSTM introduces three gate structures, namely the input gate, forget gate, and output gate, to control the flow of information.
- RF: Random Forest [33] is an ensemble learning algorithm based on decision trees. It uses a bottom-up tree building method and splits nodes by randomly selecting feature subsets in the training set to build multiple different decision trees. During prediction, the results of each decision tree are voted or averaged to obtain the final classification or regression results.
- SVR: Support Vector Machine Regression [11] is a nonlinear regression analysis method based on support vector machines. The core idea of SVR is to map the original space to a high-dimensional space and construct the best fitting hyperplane in the high-dimensional space. The functional mapping relationship between the hyperplane and the original space is described using a kernel function, which transforms the original nonlinear problem into a linear one in a high-dimensional space.
4.3.2. Comparison of Results
This study uses the above models for the point prediction of DGSR and calculates their MSE, RMSE, MAE, MAPE, and MSPE, respectively. The results are obtained as shown in Table 3 below:

Table 3.
Comparison of Evaluation Indexes of Point Prediction Models.
Compared with the other models, MAE, RMSE, MAE, MAPE, and MSPE were the smallest in the Conformer model, and was the closest to 1, which significantly demonstrates that the Conformer model has superior performance.
4.4. Comparison and Evaluation of Interval Prediction Results
Introduction to Contrast Models
In this section, the SDAR model is compared with the Kernel Density Estimation (KDE), the Natural Gradient Boosting (NGB) and the Quantile Regression Forests (QRF).
- KDE: Kernel Density Estimation [34] is a widely used non-parametric technique, proposed by Rosenblatt (1955) and Emanuel Parzen (1962), for identifying and analyzing latent patterns and trends hidden in time series data. The basic idea behind KDE is to represent the probability density function as a summation of kernel functions centered at each observed data point. Its advantage is that it provides a smooth estimate of the underlying distribution without making any assumptions about its shape, thereby enabling a better adaptation to the complexity of the data.
- NGB: Natural Gradient Boosting [35] is a gradient boosting regression method that is used to predict the conditional probability distribution of a target variable and subsequently construct prediction intervals. The calculation of natural gradients involves computing the Fisher information matrix, which is utilized to transform the Euclidean gradients into natural gradients. It is an extension of traditional gradient boosting tree algorithms, which has demonstrated improvements in terms of convergence speed and generalization performance. NGB has exhibited excellent performance in many machine learning tasks, particularly in scenarios where the parameter space has a non-flat or curved structure and high-dimensional datasets.
- QRF: Quantile Regression Forest [36] is a non-parametric conditional quantile method. In QRF, the random forest algorithm is adapted to perform quantile regression instead of traditional regression or classification. The main idea is to train each decision tree in the forest to approximate a specific quantile of the conditional distribution of the response variable. It provides a more comprehensive understanding of the relationship between predictors and response by estimating quantiles throughout the distribution rather than just the mean.
The authors computed PICP, PINAW and CWC for each of the aforementioned interval prediction methods based on the point prediction results generated by the Conformer model, respectively. Moreover, PICP, PINAW, and CWC of the RMAX-SDAR method [20] were calculated. The specific results at 95% and 90% confidence levels are shown in Table 4:

Table 4.
Comparison of Evaluation Indexes of Interval Prediction Models.
The results of Table 4 show that, although the PICP values of Conformer-KDE, Conformer-NGB, Conformer-QRF, and ARMAX-SDAR are all basically in close proximity to the confidence level, the PINAW is relatively too wide and lacks accuracy. Additionally, these models exhibit a relatively large CWC. In addition, the PICP of the Conformer-SDAR model aligns closely with the confidence level while demonstrating a narrower PINAW and a comparatively smaller CWC. Overall, compared with the other four interval prediction models, the proposed Conformer-SDAR interval prediction model exhibits a superior predictive performance.
5. Conclusions
5.1. Main Conclusions
The aim of this paper is to accurately predict solar radiation by using the Conformer model and the SDAR model based on the idea of “point prediction + interval prediction”. Four indicator variables, SD, AT, RHU, and DGSR, are selected from the data set as input variables for predicting solar radiation.
For point prediction, the Conformer model is used for iterative training to obtain the predicted value of solar radiation. By calculating the residual between the true value and the predicted value, it is observed that the residual follows a fat-tailed distribution. In order to describe the distribution of the residual more accurately, the GLaplace distribution is used as the prior distribution, and the parameters of the residual distribution are estimated by the SDAR model, so as to realize the interval prediction of solar radiation.
Compared to traditional models, the Conformer model exhibits superior fitting capability and overall predictive performance. The SDAR model takes into account the characteristics of the data distribution, which is not normal distribution but asymmetric with fat tails. This distribution demonstrates higher kurtosis and wider tails, enabling the better handling of outliers and extreme cases, and thereby enhancing the robustness of the model.
5.2. Practical Significance and Practical Value of the Model
The model proposed in this paper can provide reliable solar radiation interval prediction results, which is of great significance to solar energy and many other fields. Solar radiation is the main source of solar power generation, and the reliability and sustainability of solar power generation can also be improved by accurately predicting solar radiation, thus contributing to the development of the solar energy field [37]. In addition, information on solar radiation can also be used for space weather prediction and satellite communications, thereby improving the reliability and safety of space technology. Furthermore, the implications of this model extend beyond energy, climate, and communications sectors. In the transportation industry, for example, the model can optimize traffic planning and the design of intelligent transportation systems by analyzing traffic flow and road conditions. Similarly, in the financial sector, the model can assist in predicting market trends and conducting risk assessments, thereby providing valuable insights for investment decisions. However, in the application, it is necessary to consider the actual situation and application requirements. It is important to note that further validation and fine-tuning of the method are required in practical applications. Especially in the aspects of constructing the indicator system, fitting the residual distribution and selecting the confidence levels, the actual situation and application requirements need to be considered comprehensively to ensure the effectiveness and accuracy of the method.
Author Contributions
Conceptualization, Z.L.,Y.S., Y.Z. and T.H.; methodology, Y.S., Y.Z. and T.H.; software, Z.L.; validation, Z.L. and Y.Z.; formal analysis, Y.S. and T.H.; investigation, Z.L., Y.S. and Y.Z.; resources, Y.Z. and T.H.; data curation, Y.S.; writing—original draft preparation, Z.L., Y.S. and Y.Z.; writing—review and editing, T.H.; visualization, Z.L.; supervision, T.H.; project administration, T.H.; funding acquisition, T.H. All authors have read and agreed to the published version of the manuscript.
Funding
This research was funded by the Beijing Natural Science Foundation (Z210003).
Institutional Review Board Statement
Not applicable.
Informed Consent Statement
Informed consent was obtained from all subjects involved in the study.
Data Availability Statement
This will be made available upon request through the corresponding author.
Conflicts of Interest
The authors declare no conflict of interest.
References
- International Energy Agency. Tracking Clean Energy Progress 2023. [EB/OL]. 2023. Available online: https://www.iea.org/reports/tra-cking-clean-energy-progress-2023 (accessed on 18 October 2023).
- Hissou, H.; Benkirane, S.; Guezzaz, A.; Azrour, M.; Beni-Hssane, A. A Novel Machine Learning Approach for Solar Radiation Estimation. Sustainability 2023, 15, 10609. [Google Scholar] [CrossRef]
- Sengupta, M.; Xie, Y.; Lopez, A.; Habte, A.; Maclaurin, G.; Shelby, J. The national solar radiation data base (NSRDB). Renew. Sustain. Energy Rev. 2018, 89, 51–60. [Google Scholar] [CrossRef]
- Essam, Y.; Ahmed, A.N.; Ramli, R.; Chau, K.W.; Idris Ibrahim, M.S.; Sherif, M.; Sefelnasr, A.; El-Shafie, A. Investigating photovoltaic solar power output forecasting using machine learning algorithms. Eng. Appl. Comput. Fluid Mech. 2022, 16, 2002–2034. [Google Scholar] [CrossRef]
- Heng, S.Y.; Ridwan, W.M.; Kumar, P.; Ahmed, A.N.; Fai, C.M.; Birima, A.H.; El-Shafie, A. Artificial neural network model with different backpropagation algorithms and meteorological data for solar radiation prediction. Sci. Rep. 2022, 12, 10457. [Google Scholar] [CrossRef] [PubMed]
- Ehteram, M.; Ahmed, A.N.; Fai, C.M.; Afan, H.A.; El-Shafie, A. Accuracy Enhancement for Zone Mapping of a Solar Radiation Forecasting Based Multi-Objective Model for Better Management of the Generation of Renewable Energy. Eng. Appl. Comput. Fluid Mech. 2022, 16, 2730. [Google Scholar] [CrossRef]
- Ahmad, M.J.; Tiwari, G.N. Solar radiation models—A review. Int. J. Energy Res. 2011, 35, 271–290. [Google Scholar] [CrossRef]
- Chodakowska, E.; Nazarko, J.; Nazarko, Ł.; Rabayah, H.S.; Abendeh, R.M.; Alawneh, R. ARIMA Models in Solar Radiation Forecasting in Different Geographic Locations. Energies 2023, 16, 5029. [Google Scholar] [CrossRef]
- Jung, A.H.; Lee, D.H.; Kim, J.Y.; Kim, C.K.; Kim, H.G.; Lee, Y.S. Regional Photovoltaic Power Forecasting Using Vector Autoregression Model in South Korea. Energies 2022, 15, 7853. [Google Scholar] [CrossRef]
- Dudek, G.; Pełka, P.; Smyl, S. A hybrid residual dilated LSTM and exponential smoothing model for midterm electric load forecasting. IEEE Trans. Neural Netw. Learn. Syst. 2021, 33, 2879–2891. [Google Scholar] [CrossRef]
- Fan, J.; Wang, X.; Zhang, F.; Ma, X.; Wu, L. Predicting daily diffuse horizontal solar radiation in various climatic regions of China using support vector machine and tree-based soft computing models with local and extrinsic climatic data. J. Clean. Prod. 2020, 248, 119264. [Google Scholar] [CrossRef]
- Zeng, Z.; Wang, Z.; Gui, K.; Yan, X.; Gao, M.; Luo, M.; Geng, H.; Liao, T.; Li, X.; An, J.; et al. Daily global solar radiation in China estimated from high-density meteorological observations: A random forest model framework. Earth Space Sci. 2020, 7, e2019EA001058. [Google Scholar] [CrossRef]
- Alizamir, M.; Othman Ahmed, K.; Shiri, J.; Fakheri Fard, A.; Kim, S.; Heddam, S.; Kisi, O. A New Insight for Daily Solar Radiation Prediction by Meteorological Data Using an Advanced Artificial Intelligence Algorithm: Deep Extreme Learning Machine Integrated with Variational Mode Decomposition Technique. Sustainability 2023, 15, 11275. [Google Scholar] [CrossRef]
- Goodfellow, I.; Bengio, Y.; Courville, A. Deep Learning; MIT Press: Cambridge, MA, USA, 2016. [Google Scholar]
- Vaswani, A.; Shazeer, N.; Parmar, N.; Uszkoreit, J.; Jones, L.; Gomez, A.N.; Kaiser, Ł.; Polosukhin, I. Attention is all you need. Adv. Neural Inf. Process. Syst. 2017, 30, 5998–6008. [Google Scholar]
- Li, X.; Can, W.; Ping, J. Review of interval Analysis of Power system Considering Uncertainty. Electr. Power Autom. Equip. 2023, 43, 1–11. [Google Scholar]
- Kaiwen, L. Research on Time Series Interval Prediction Theory and Method Based on Computational Intelligence; National University of Defense Technology: Changsha, China, 2018. [Google Scholar]
- Zhang, Y.; Wang, J.; Wang, X. Review on probabilistic forecasting of wind power generation. Renew. Sustain. Energy Rev. 2014, 32, 255–270. [Google Scholar] [CrossRef]
- Kaplani, E.; Kaplanis, S. A stochastic simulation model for reliable PV system sizing providing for solar radiation fluctuations. Appl. Energy 2012, 97, 970–981. [Google Scholar] [CrossRef]
- Lin, F.; Zhang, Y.; Wang, K.; Wang, J.; Zhu, M. Parametric probabilistic forecasting of solar power with fat-tailed distributions and deep neural networks. IEEE Trans. Sustain. Energy 2022, 13, 2133–2147. [Google Scholar] [CrossRef]
- Gulati, A.; Qin, J.; Chiu, C.C.; Parmar, N.; Zhang, Y.; Yu, J.; Han, W.; Wang, S.; Zhang, Z.; Wu, Y.; et al. Conformer: Convolution-augmented transformer for speech recognition. arXiv 2020, arXiv:2005.08100. [Google Scholar]
- Li, Y.; Lu, X.; Xiong, H.; Tang, J.; Su, J.; Jin, B.; Dou, D. Towards Long-Term Time-Series Forecasting: Feature, Pattern, and Distribution. arXiv 2023, arXiv:2301.02068. [Google Scholar]
- Nussbaumer, H.J.; Nussbaumer, H.J. The Fast Fourier Transform; Springer: Berlin/Heidelberg, Germany, 1981. [Google Scholar]
- Liu, P.J.; Saleh, M.; Pot, E.; Goodrich, B.; Sepassi, R.; Kaiser, L.; Shazeer, N. Generating wikipedia by summarizing long sequences. arXiv 2018, arXiv:1801.10198. [Google Scholar]
- Rezende, D.; Mohamed, S. Variational inference with normalizing flows. In Proceedings of the International Conference on Machine Learning, PMLR, Lille, France, 6–11 July 2015; pp. 1530–1538. [Google Scholar]
- Salinas, D.; Flunkert, V.; Gasthaus, J.; Januschowski, T. DeepAR: Probabilistic forecasting with autoregressive recurrent networks. Int. J. Forecast. 2020, 36, 1181–1191. [Google Scholar] [CrossRef]
- Alcántara, A.; Galván, I.M.; Aler, R. Direct estimation of prediction intervals for solar and wind regional energy forecasting with deep neural networks. Eng. Appl. Artif. Intell. 2022, 114, 105128. [Google Scholar] [CrossRef]
- Jiang, P.; Li, R.; Li, H. Multi-objective algorithm for the design of prediction intervals for wind power forecasting model. Appl. Math. Model. 2019, 67, 101–122. [Google Scholar] [CrossRef]
- Wei, F.Y. Modern Climate Statistical Diagnosis and Prediction Technology; China Meteorological Press: Beijing, China, 2007. [Google Scholar]
- Ahmad, T.; Manzoor, S.; Zhang, D. Forecasting high penetration of solar and wind power in the smart grid environment using robust ensemble learning approach for large-dimensional data. Sustain. Cities Soc. 2021, 75, 103269. [Google Scholar] [CrossRef]
- Li, Y.; Su, Y.; Shu, L. An ARMAX model for forecasting the power output of a grid connected photovoltaic system. Renew. Energy 2014, 66, 78–89. [Google Scholar] [CrossRef]
- Gensler, A.; Henze, J.; Sick, B.; Raabe, N. Deep Learning for solar power forecasting—An approach using AutoEncoder and LSTM Neural Networks. In Proceedings of the 2016 IEEE International Conference on Systems, Man, and Cybernetics (SMC), Budapest, Hungary, 9–12 October 2016; IEEE: Piscataway, NJ, USA, 2016; pp. 002858–002865. [Google Scholar]
- Jebli, I.; Belouadha, F.Z.; Kabbaj, M.I.; Tilioua, A. Prediction of solar energy guided by pearson correlation using machine learning. Energy 2021, 224, 120109. [Google Scholar] [CrossRef]
- Yamazaki, T.; Homma, H.; Wakao, S.; Fujimoto, Y.; Hayashi, Y. Estimation prediction interval of solar irradiance based on just-in-time modeling for photovoltaic output prediction. Electr. Eng. Jpn. 2016, 195, 1–10. [Google Scholar] [CrossRef]
- Efron, B. Bootstrap methods: Another look at the jackknife. In Breakthroughs in Statistics: Methodology and Distribution; Springer: New York, NY, USA, 1992; Volume 195, pp. 569–593. [Google Scholar]
- Lotfi, M.; Javadi, M.; Osório, G.J.; Monteiro, C.; Catalão, J.P. A novel ensemble algorithm for solar power forecasting based on kernel density estimation. Energies 2020, 13, 216. [Google Scholar] [CrossRef]
- Zhao, M.; Zhang, Y.; Hu, T.; Wang, P. Interval Prediction Method for Solar Radiation Based on Kernel Density Estimation and Machine Learning. Complexity 2022, 2022, 7495651. [Google Scholar] [CrossRef]
Disclaimer/Publisher’s Note: The statements, opinions and data contained in all publications are solely those of the individual author(s) and contributor(s) and not of MDPI and/or the editor(s). MDPI and/or the editor(s) disclaim responsibility for any injury to people or property resulting from any ideas, methods, instructions or products referred to in the content. |
© 2023 by the authors. Licensee MDPI, Basel, Switzerland. This article is an open access article distributed under the terms and conditions of the Creative Commons Attribution (CC BY) license (https://creativecommons.org/licenses/by/4.0/).