Article

Multi-Objective Considered Process Parameter Optimization of Welding Robots Based on Small Sample Size Dataset

1
School of Mechatronics Engineering, Harbin Institute of Technology, Harbin 150001, China
2
College of Engineering and Physical Sciences, Aston University, Birmingham B4 7ET, UK
*
Author to whom correspondence should be addressed.
Sustainability 2023, 15(20), 15051; https://doi.org/10.3390/su152015051
Submission received: 22 August 2023 / Revised: 3 October 2023 / Accepted: 13 October 2023 / Published: 19 October 2023

Abstract

:
The welding process is characterized by its high energy density, making it imperative to optimize the energy consumption of welding robots without compromising the quality and efficiency of the welding process for their sustainable development. The above evaluation objectives in a particular welding situation are mostly influenced by the welding process parameters. Although numerical analysis and simulation methods have demonstrated their viability in optimizing process parameters, there are still limitations in terms of modeling accuracy and efficiency. This paper presented a framework for optimizing process parameters of welding robots in industry settings, where data augmentation was applied to expand sample size, auto machine learning theory was incorporated to quantify reflections from process parameters to evaluation objectives, and the enhanced non-dominated sorting algorithm was employed to identify an optimal solution by balancing these objectives. Additionally, an experiment using Q235 as welding plates was designed and conducted on a welding platform, and the findings indicated that the prediction accuracy on different objectives obtained by the enlarged dataset through ensembled models all exceeded 95%. It is proven that the proposed methods enabled the efficient and optimal determination of parameter instructions for welding scenarios and exhibited superior performance compared with other optimization methods in terms of model correctness, modeling efficiency, and method applicability.

1. Introduction

Over the course of several decades, industrial robots have increasingly become integral to contemporary industry, as they are capable of fulfilling the demands for individualized, customized, and small batch production [1,2]. With the wild application of industrial robots, the research focus on them has shifted to their optimal operations, aiming at the enhancement of sustainable, skilled, and efficient functioning. Welding is a widely employed material joining technology in various industries, such as vehicles, construction machinery, and shipbuilding [3,4]. It involves the heating and fusing of basic materials, making it a prominent manufacturing process. According to the statistics provided by the International Federation of Robotics [5], welding robots (WRs) are ranked second globally with an 18.4% market share, just falling behind handling robots in terms of installation quantity. This can be attributed to the strong reliability and maneuverability of WRs, which enable them to outperform hand-worked specialty in terms of precision and consistency. Additionally, WRs offer the advantage of protecting workers from exposure to dirty and hazardous environments [6,7]. Nevertheless, it is important to note that the welding process is characterized by its high energy density [8], and the widespread utilization of WRs has significant environmental implications. Hence, it is imperative to enhance the energy efficiency of WRs without compromising product quality or productivity. This is crucial for reducing the carbon footprint of production and ensuring the sustainable development of industry. Such efforts align with the technological trends of industrial robots [5,9] and also bolster their overall operating capabilities and facilitate their intelligent evolution in the era of Industry 4.0.
Research on the operating optimization of WRs can be categorized into two categories: the act of introducing novel equipment or processes and modifying current operating parameters. In the first category, academics have employed vision sensors to address the issue of limited adaptability resulting from the teach and playback working style of WRs. These vision sensors are utilized for tasks such as seam tracking and weld pool inspection [10,11]. New components in welding machines are also redesigned, like the vacuum chamber proposed by Yue et al. [12] to reduce deformation in the welding process. Additionally, a novel technique known as electrically-aided preheating has been suggested in the context of hot-wire laser welding [13]. This approach aims to enhance both the stability of the welding procedure and its energy efficiency simultaneously. However, expenses and potential hazards significantly increase when changing existing equipment or processes in industry since extensive testing and validation are needed to ensure their stability and efficacy.
The optimization of operating parameters represents a highly effective approach for enhancing the performance of existing WRs. This solution focuses on refining parameters that have been tailored by human administrators by using intelligent techniques. For a single welding motion, it is seen that process parameters (PP), encompassing both the parameters in manipulator commands and those in welding tools, dominate physical and chemical changes during the welding process and determine the product quality, energy costs, and operating efficiency of WR. In the field of PP optimization, there are often two primary components: the assessment and selection of PP solutions.
The assessment of PP solutions entails the establishment of models that quantify the influence of PP on objectives, where processing mechanisms, simulation, analysis of experimental data, and other related methodologies are employed. In terms of the evaluation models based on welding mechanisms and numerical simulation, Ahmad et al. [14] predicted the weld-induced strains on the substrate by the finite element method, in which geometrical modeling and the inherent strain theory were used. Lu et al. [15] modeled the heat consumption to describe the influence of weaving parameters on the weld hear input, through which a velocity-adaptive control parameter generation strategy was proposed to improve the quality of multi-pass welding. A heat-source model was proposed in [16] for the Gaussian-distributed rotating body according to the shape parameters of welds and the welding heat-affected zone. Then, a numerical simulation of the welding temperature field was used to depict the correlation between thermal cycling and the microstructure of the welded joint. Additionally, Ribeiro et al. [17] performed numerical simulations in which process welding current (WC), welding speed (WS), and torch angle were involved to determine the optimal combination of PP for aluminum alloys with distortion and residual stresses considered. Li et al. [18] established a thermal-fluid coupling model to simulate the temperature field and flow field in laser and melt inert-gas hybrid welding processes, and PP such as laser power, WC, and filling speed were involved in experiments of molten pool analysis. Commercial simulation software like Simufact was used to simulate the welding process, and the surface quality of the weldment was compared and analyzed to settle the welding PP, including WC, welding voltage (WV), and WS [19]. The utilization of numerical analysis and simulation methods relies heavily on intricate modeling, making it challenging to promptly rectify any distinctions due to alterations in modeling objects, such as welding processes or base materials. Moreover, the performance of a particular PP in different settings exhibits inconsistency as a result of the variability in equipment stability and environmental factors.
Hence, certain researchers prioritized the experimental analysis as a means to value the PP from the perspective of processing results. Tyagi et al. [20] used a grey correlation analysis method to optimize robot spot welding PP based on orthogonal experiments, where the electrode diameter, electrode pressure, WC, and welding time were optimized with the heat-affected zone and tensile shear strength of the steel plate as objectives for welding quality evaluation. Srivastava et al. [21] established a mathematical model through the response surface method to determine how PP, like WC, and the type of shielding gas affect the geometric dimensions of welds. Ali et al. [22] conducted an experimental study on the influence of PP, including WV, WC, WS, and wire feed speed, on the strength and hardness of welded steel using the variance analysis method. An ensemble of variable neighborhood search-based gene expression programming and black-box metamodels is presented by Wu et al. [23] to ensure the reflection from welding PP to welding quality and energy consumption. Additionally, some machine learning (ML) methods like radial basis function, artificial neural network, and CatBoost [24,25] are applied to construct models between PP and responses based on the experiment data. The experiment-driven, data-driven modeling method exhibits more applicability in comparison to numerical approaches. However, the practical implementation of experiment-based methods still has some drawbacks, as follows:
  • The establishment of a high-accuracy model requires a substantial quantity of samples. The effectiveness of machine learning models typically hinges on the quality and quantity of the training data provided. The ample fitting of models necessitates the availability of adequate experimental data. Additionally, these models may not perform optimally when confronted with process scenarios that lie outside the scope of the dataset. Nevertheless, it is imperative to take the costs associated with materials, labor, and time into account when generating datasets in an industrial setting. These requirements often result in a dearth of the essential prerequisites for sampling extensive datasets in welding scenarios.
  • Selecting and tuning machine learning models necessitates manual expertise. The optimization of PP in the context of WRs is oriented towards several objectives. It is challenging to describe the coupling reflection from PP to these responses depending on a single model. Therefore, many models are required to be trained in this process. Meanwhile, typical hyperparameters of ML models involve network structure, loss function, learning rate, etc., whose modifications need to be made according to the model’s performance. Hence, the cost is significantly higher for the manual selection and parameter tweaking of several models.
To solve these problems, the PP evaluation method, which combines data augmentation and auto-machine learning (AutoML), is investigated in this project. Data augmentation aims to enlarge the dataset for a more rational sample distribution by algorithms or models [26,27], rather than increasing experiments. The AutoML method is deployed to achieve autonomous combination of models and selection of hyperparameters [28] through intelligent algorithms. With more input data and self-adaptive model generation, the proposed solution is capable of improving both the modeling accuracy and efficiency for welding scenarios featuring a small sample size dataset and multiple objectives.
As for the selection of the PP solution, it aims to find the optimal result using the established evaluation models with multiple objectives considered. Yao et al. [29] obtained the optimal parameter combinations through the range analysis of results from the orthogonal experiment. Kim et al. [30] applied the sequential quadratic programming method to determine the optimal welding condition with consideration of penetration and bead shape. It has been proven that heuristic search algorithms such as genetic algorithms and particle swarm optimization are feasible and efficient ways to find optimal results for neural networks and machine learning models [31,32,33,34]. Therefore, heuristic algorithms are selected in this paper as the PP optimization method to trade off among multiple objectives that are quantified based on the AutoML method.
The rest of this paper is organized as follows: Section 2 discusses the flow of the investigated data-driven optimization method for PP of WRs; 
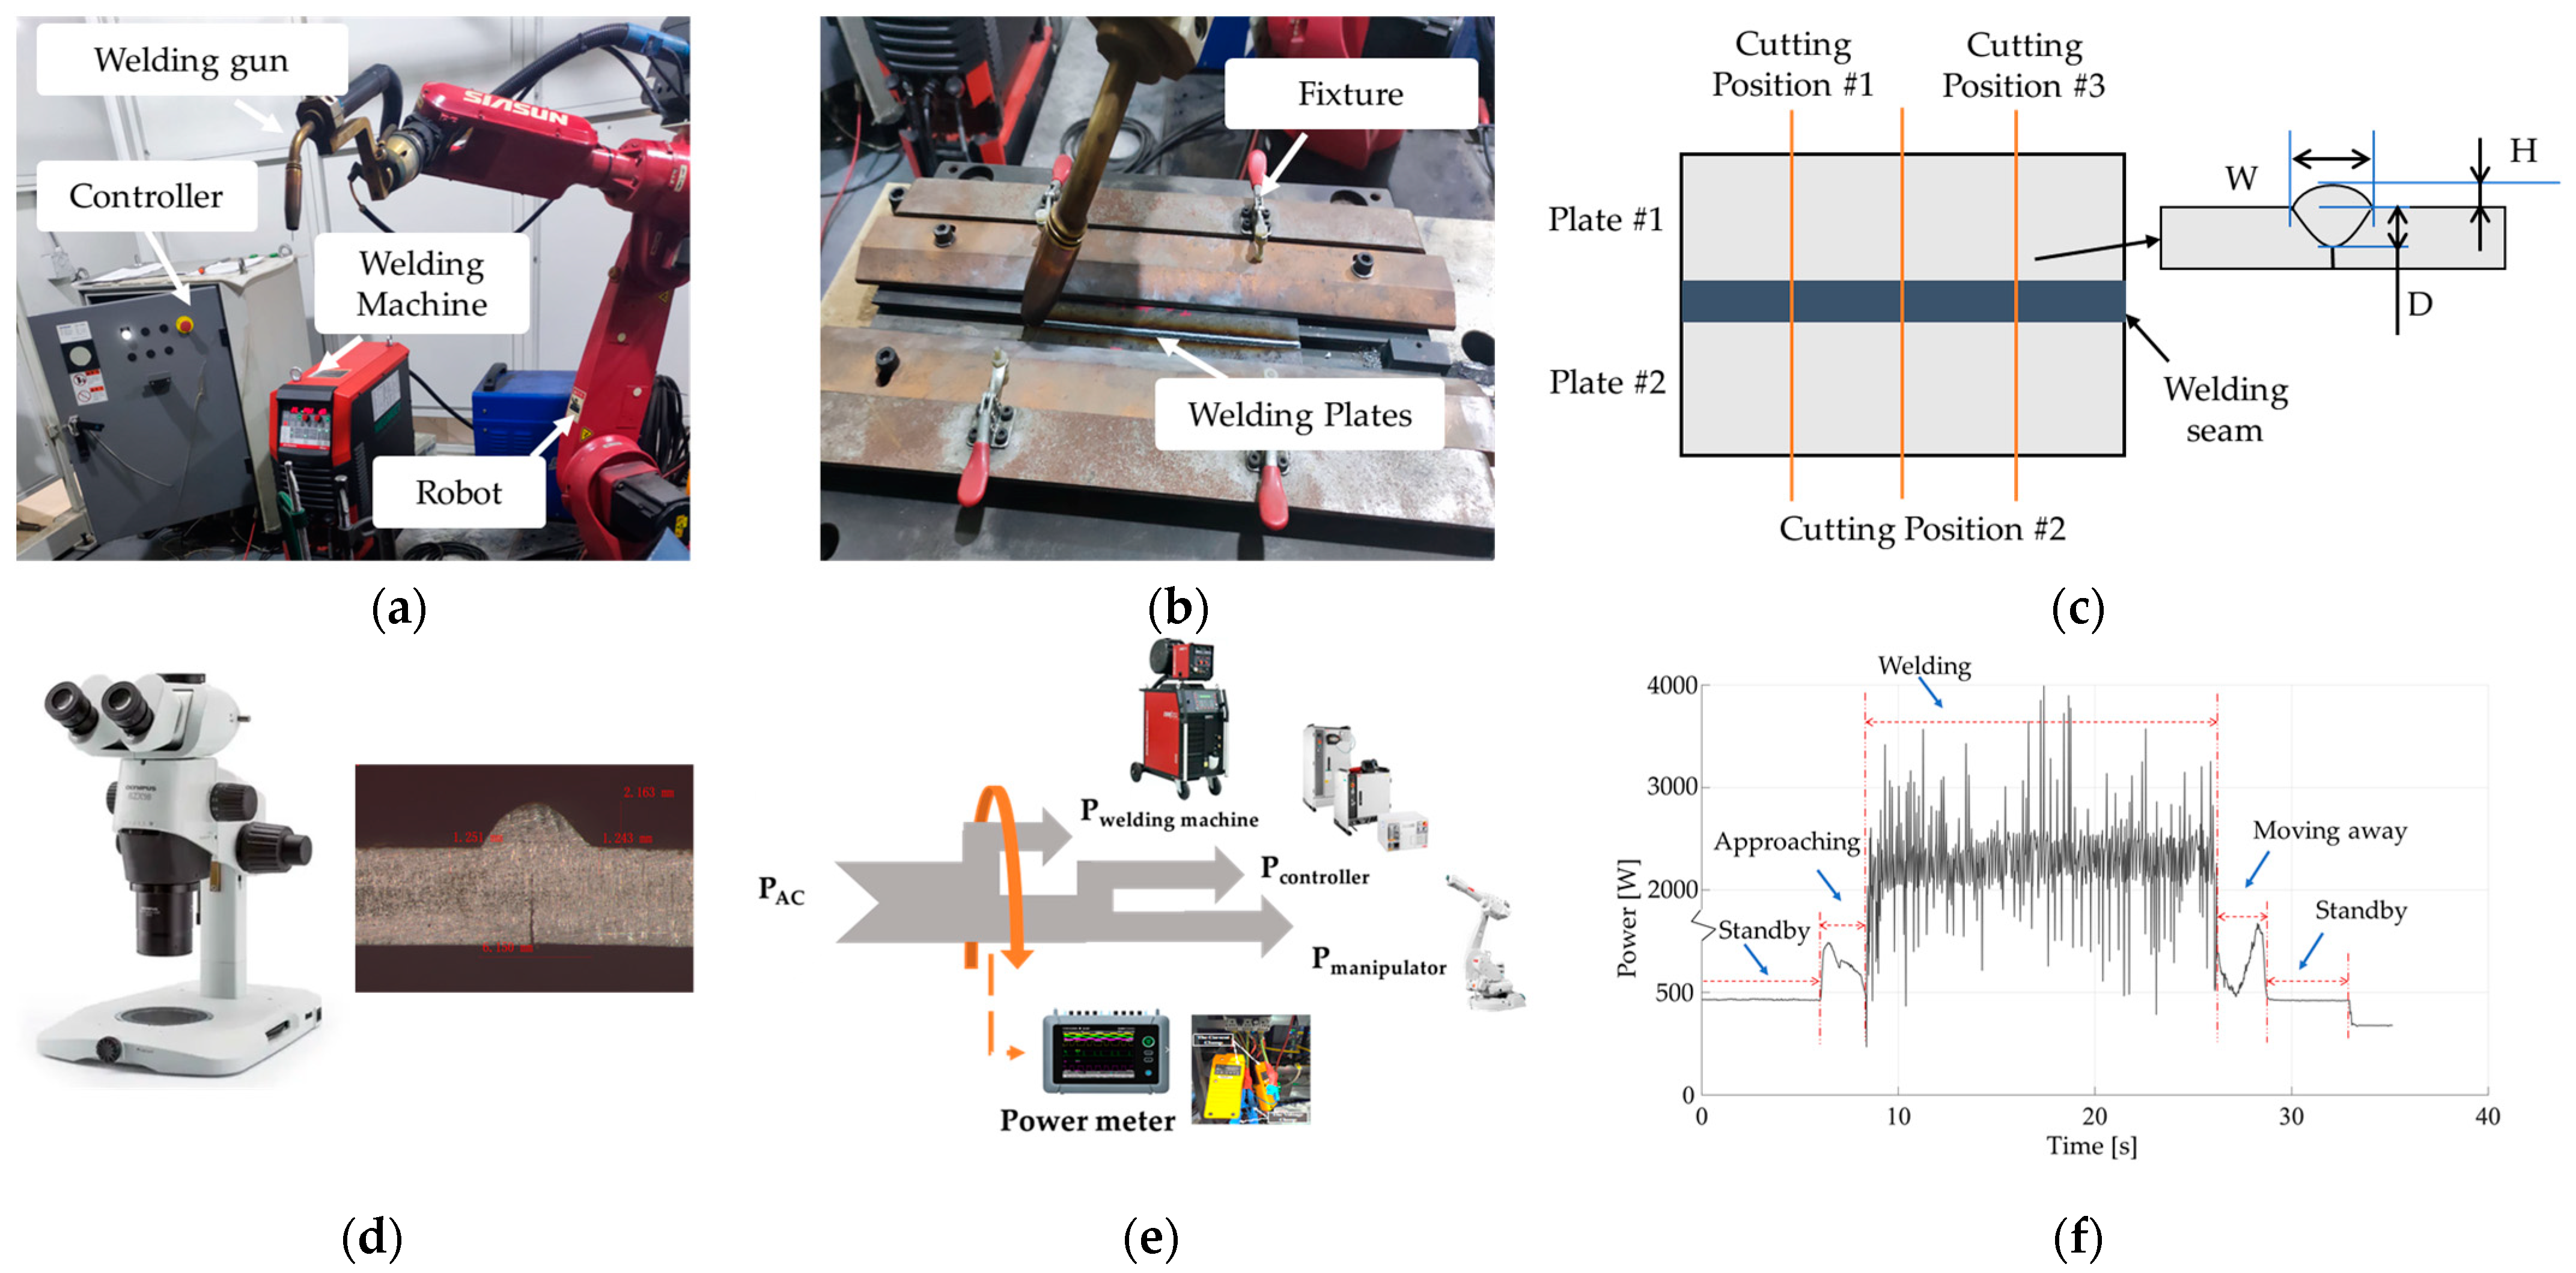
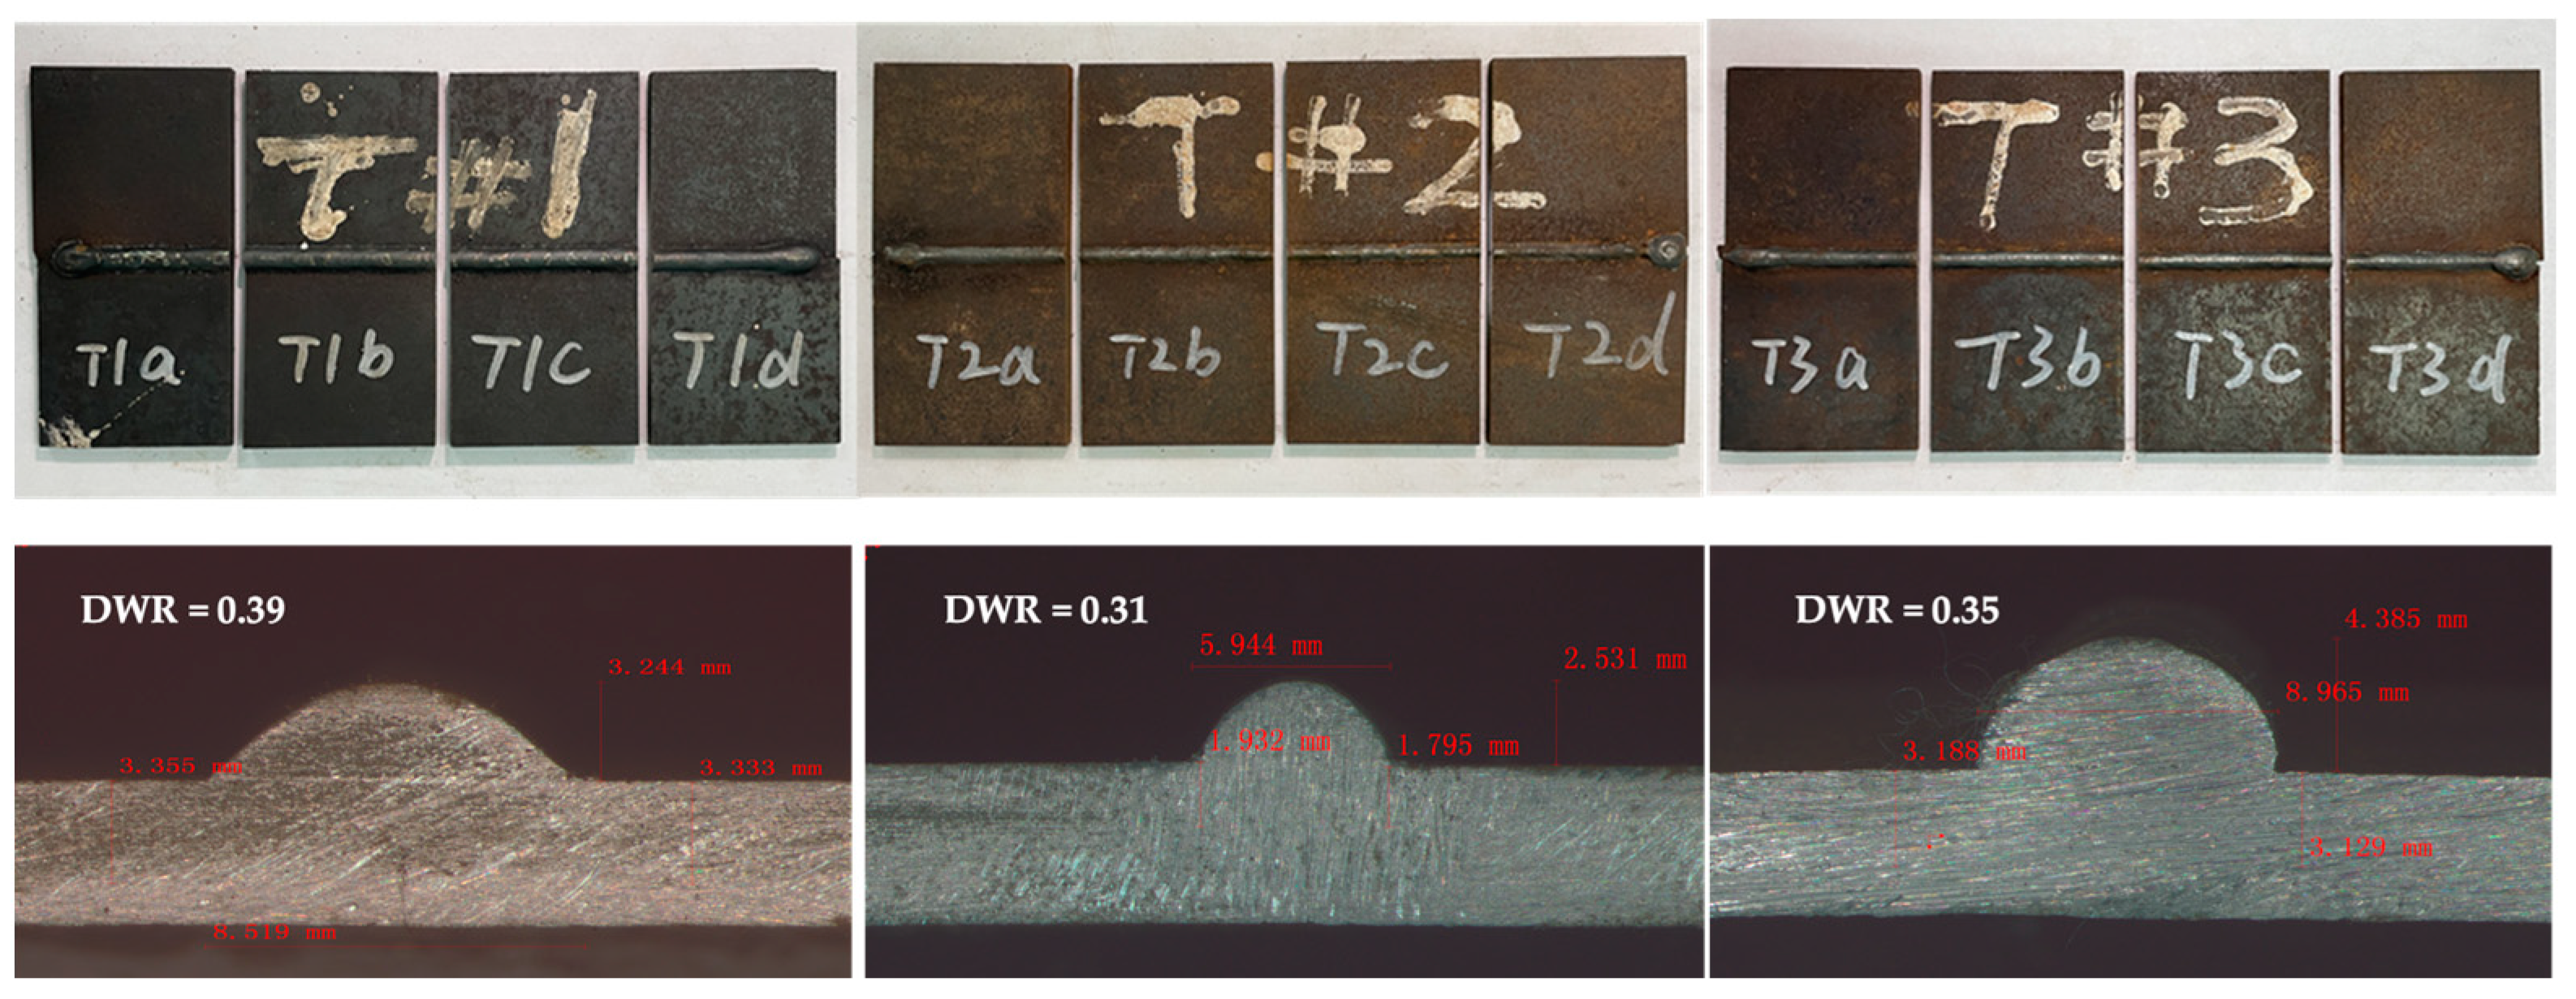
Section 3 builds a platform and conducts experiments performed by a Siasun welding robot on Q235 steel; Section 4 demonstrates the validity and effectiveness of the proposed solution through detailed result analysis; and Section 5 draws conclusions and gives future directions for improvement.

2. Methodology

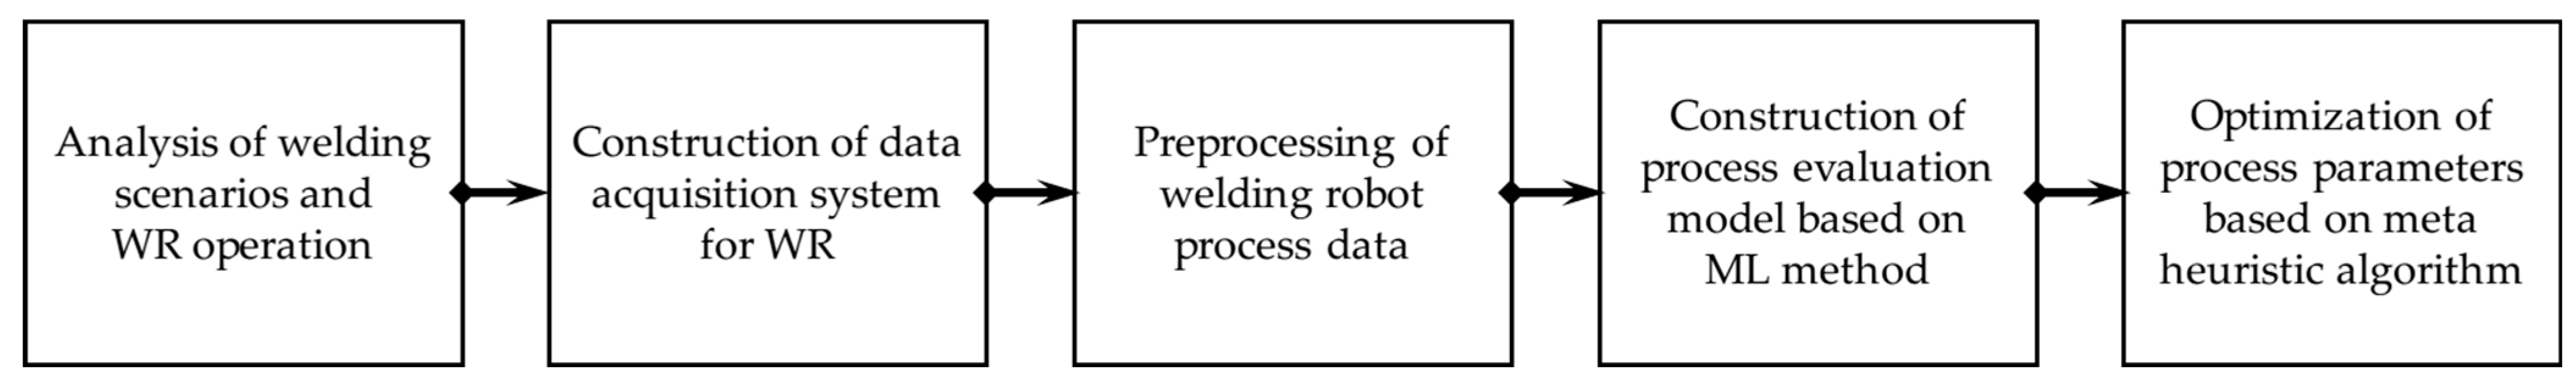
Steps of investigated PP optimization for WRs are shown in Figure 1. Firstly, a detailed analysis has to be conducted on the welding scenarios and the operation process of WRs to ensure welding types such as arc and spot welding, welding materials such as aluminum alloy and Q235 steel, welding equipment, and the welding operating environment. Then the studied objects are determined, including welding parameters and corresponding evaluation objectives, with production requirement considered. Secondly, features of data during the welding process are supposed to be studied, paving the way for data acquisition system construction and data sampling. In this system, synchronous collections of sequential and discrete data are achieved by reading from the WR system and deployed sensors like power flow and images.
Next, the acquired data are preprocessed to formulate the sample set for this case. Target labels are generated for each PP combination through treatments such as data cleaning and sequential data segmentation. For example, integrating the power flow in the time dimension is able to obtain the EC value of WR under each PP scenario. In addition, in response to the small volume of datasets for WRs, this research adopts the data augmentation method, which is frequently utilized in the field of few-lot learning, to expand the sample set for industrial cases. Data augmentation methods in the field of machine vision include algorithm-based generation such as data flipping, image scaling, etc., and model-based generation like GAN [35,36,37]. However, unlike images, the reflection from PP to responses of the welding process contains clear physical and chemical changes, and the generated data needs to undergo detailed discrimination to examine its effectiveness in industrial scenes. Therefore, considering the fluctuation of welding PP set at once during the actual welding process, this article expands the sample by adding noise to PP. Furthermore, standardization and normalization of the designed parameters and acquired evaluation objectives are performed to create the final dataset.
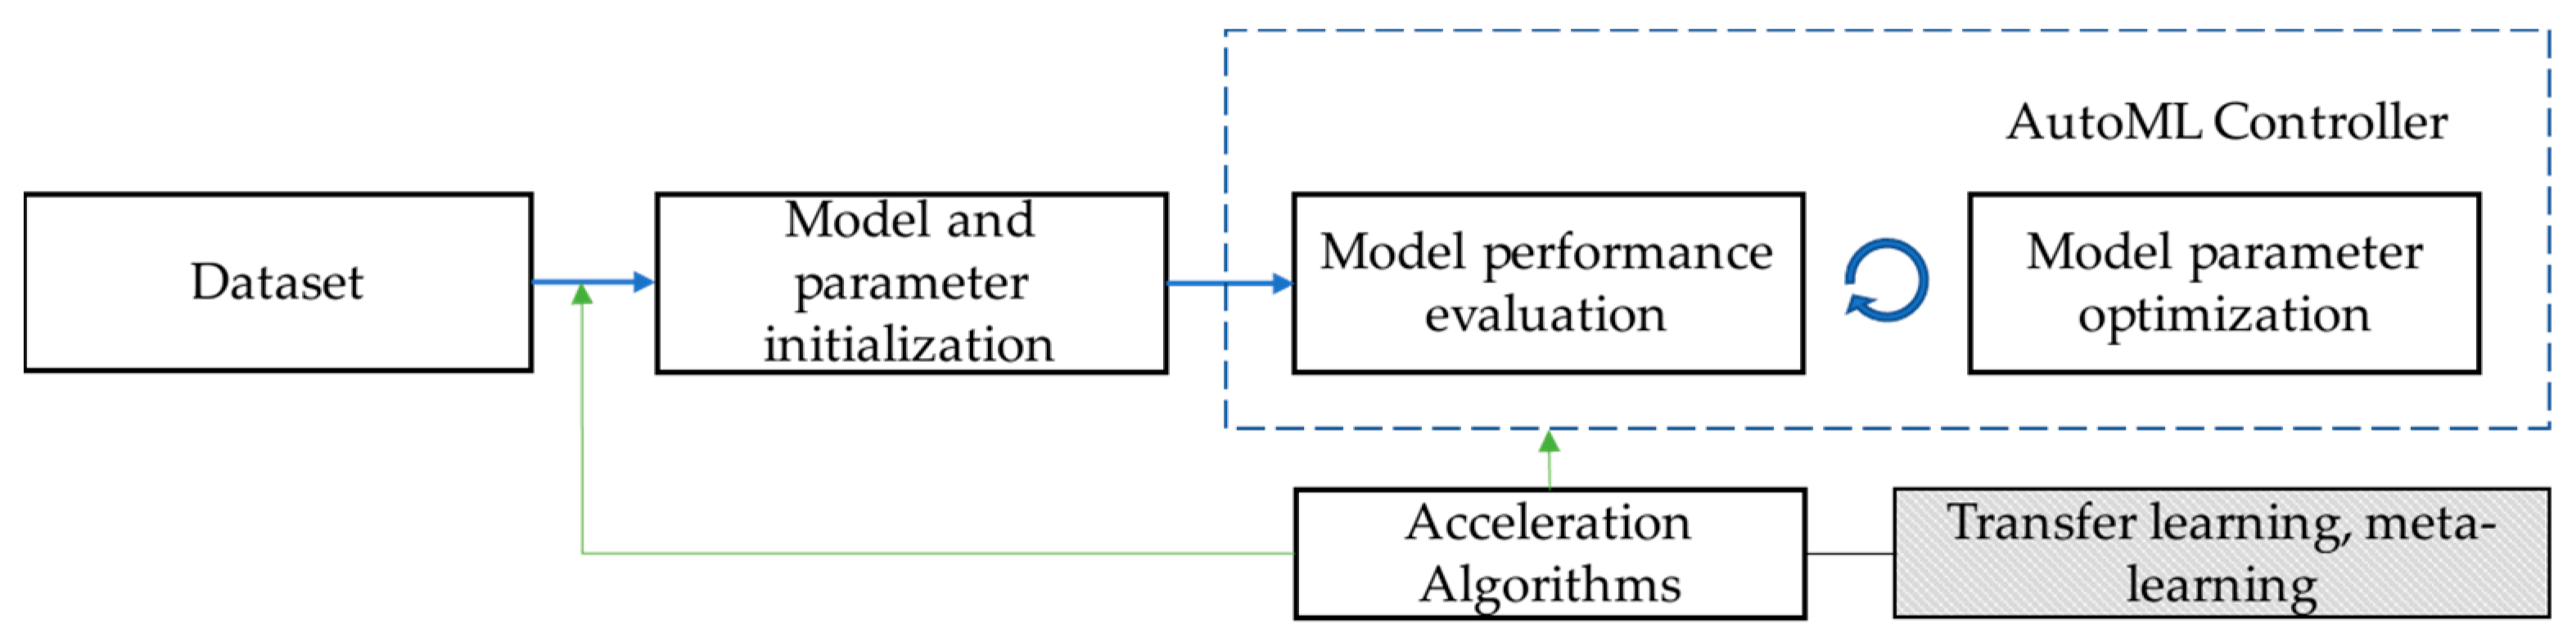
Then, ML models are applied to construct the welding process evaluation models and quantify the relations between PP and the chosen objectives. The common process of ML modeling for regression or classification problems includes three parts: feature engineering, model selection, and parameter optimization, where all parts require human participation to assist in decision-making. AutoML attempts to replace the role of expert experience in model construction through a series of methods with limited computational costs. The model construction by AutoML is able to be described as a typical optimization problem [38,39,40]. The goal of the optimization problem is to improve the model’s performance on given tasks. Its constraints include automatic configuration of the modeling process and limited computational resource requirements, and objects are the selected models and their corresponding hyperparameters. Most AutoML frameworks are formatted around the selection of optimization algorithms, the design of model performance valuation, the initialization of models or parameters, and convergence acceleration methods, corresponding to the optimizing methods, objective functions, and operators in terms of optimization problems, as shown in Figure 2. Autosklearn, as one of the mainstream AutoML open-source frameworks [41], proposes a solution innovating in model initialization and model generation. Relying on Bayesian model-based optimization methods and numerous regression/classification algorithms, data preprocessing, and feature engineering algorithms in the Sklearn ML library, Autosklearn has superior performance in model fitting accuracy and efficiency. Therefore, this research chooses Autosklearn as the basis for constructing a multi-objective considered evaluation for the PP of WRs.
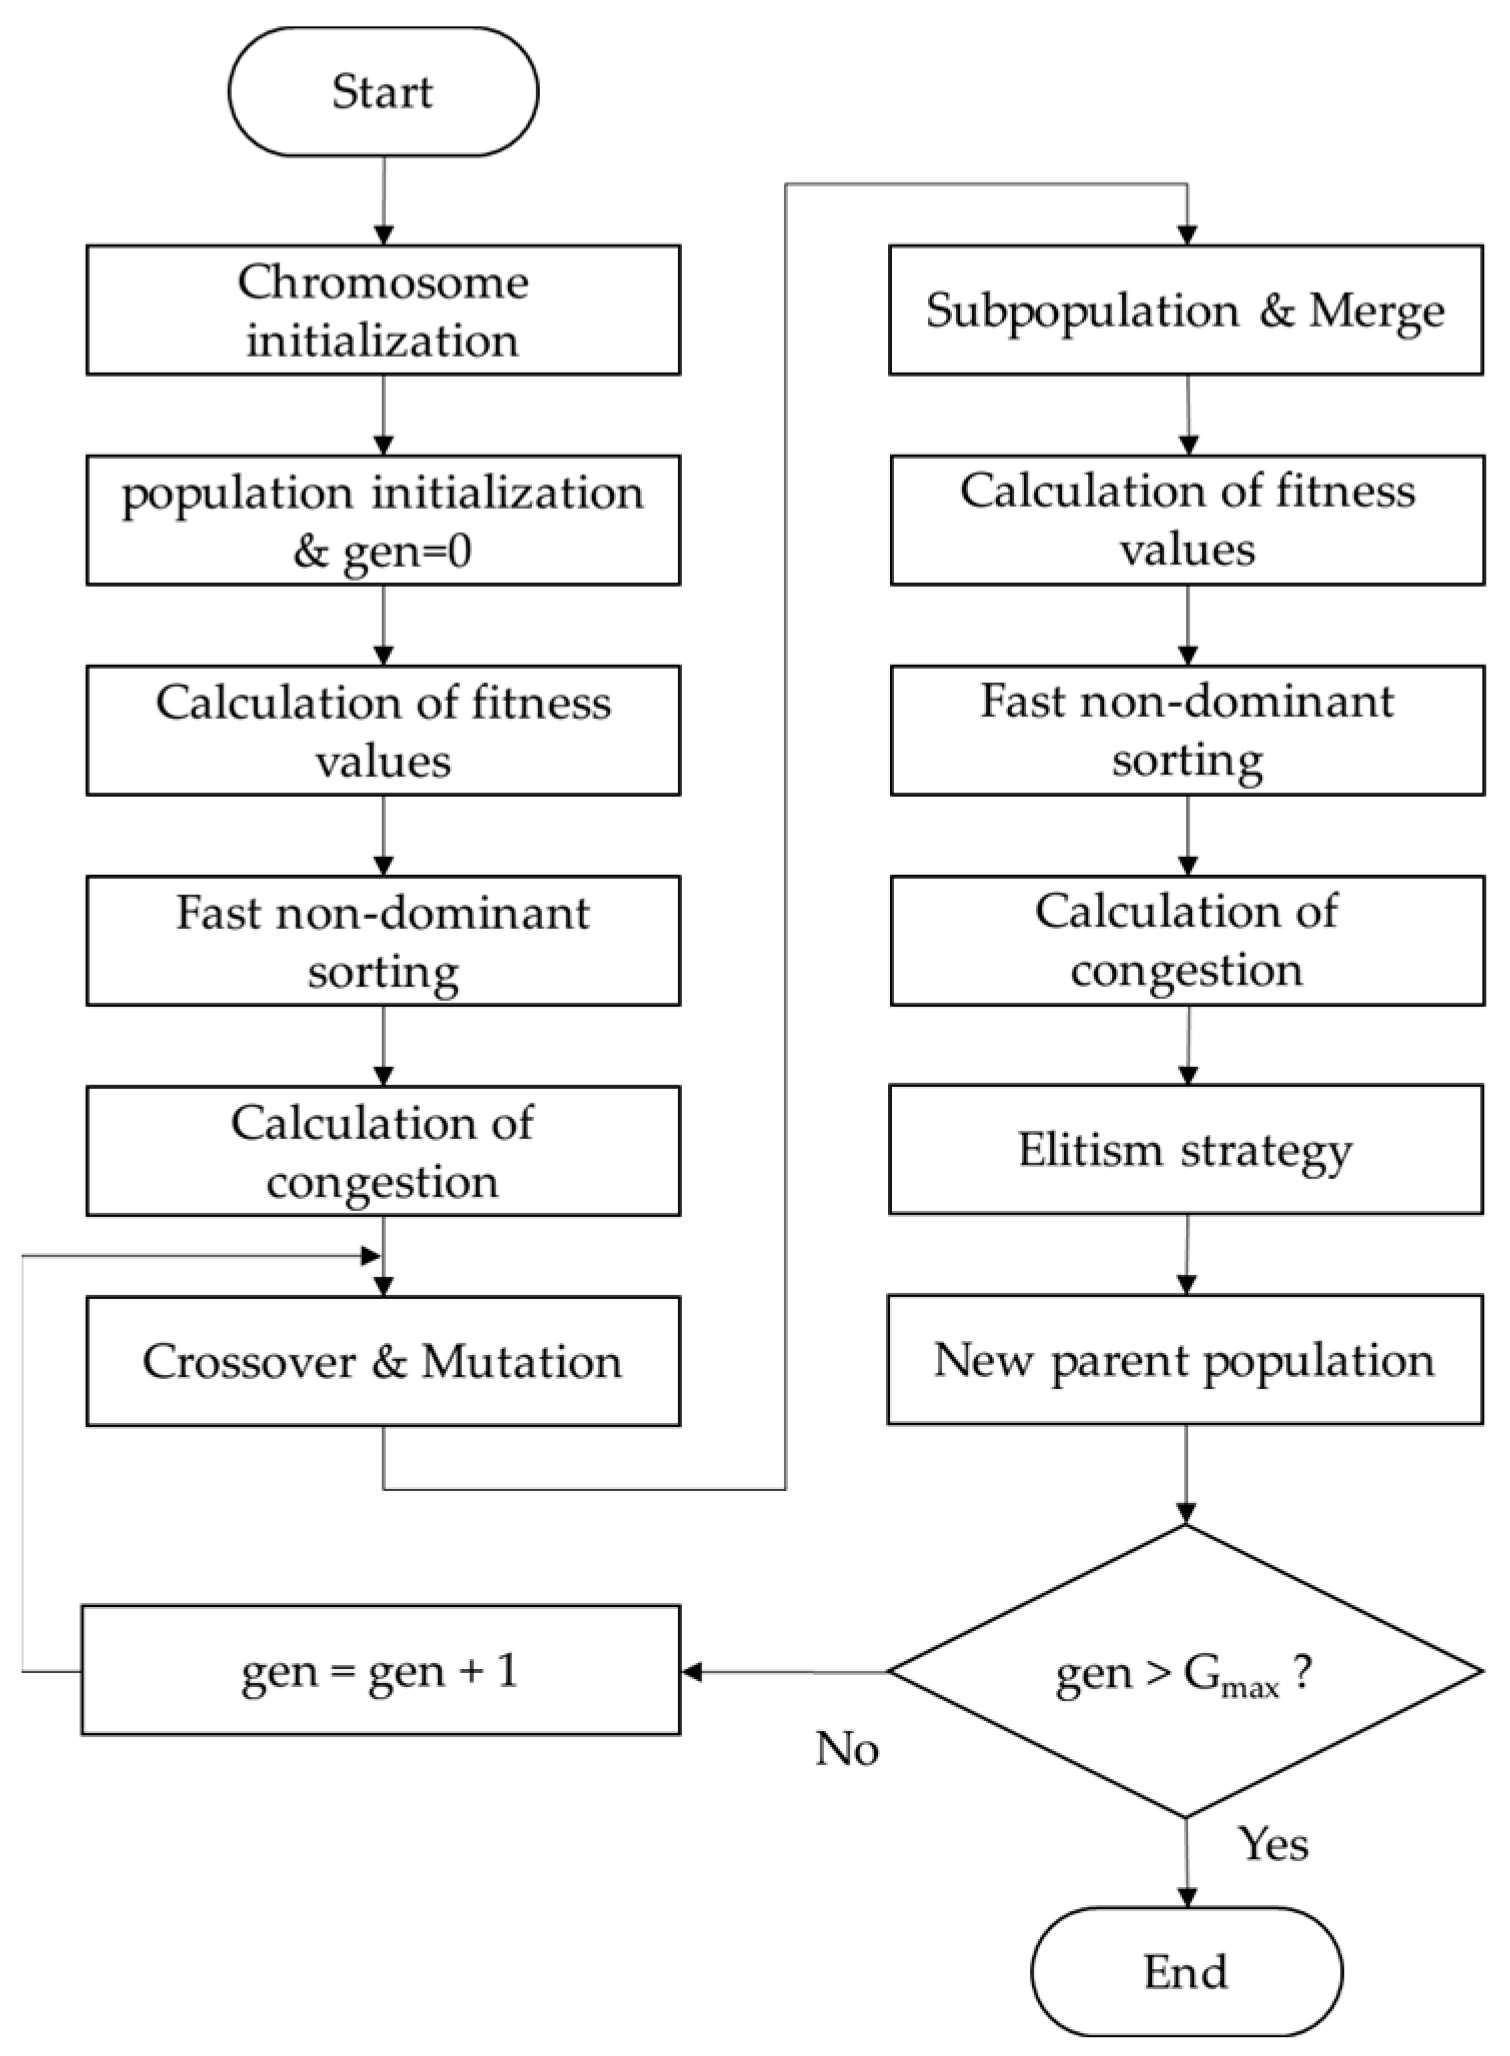
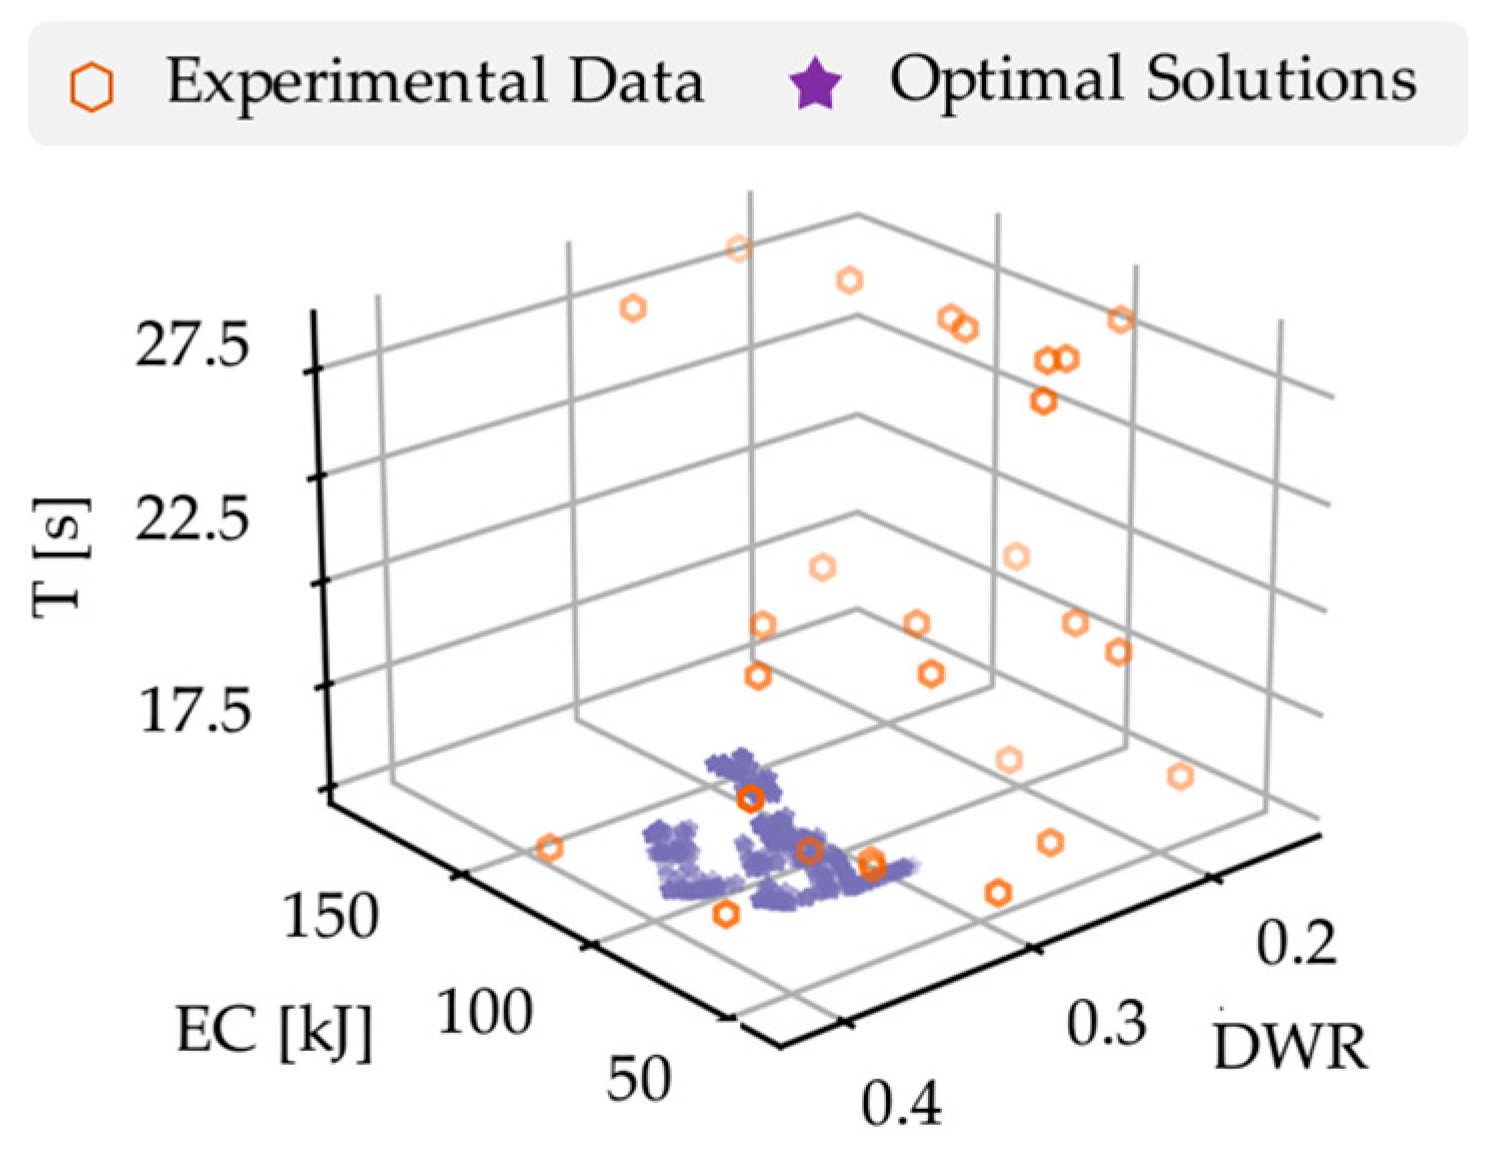
Finally, ideal PP are found using constructed evaluation criteria and heuristic algorithms to trade off among multiple objectives. Multi-objective optimization problems can be defined as obtaining a set of solutions where the optimized variables, X = [ x 1 , x 2 , , x i , , x n ] , satisfy various constraints such as upper and lower bounds, equations, inequalities, etc. in the search space Ω , and the corresponding value of all objectives is the minimum or maximum. In these problems, the superiority of solutions X 1 and X 2 are judged by comparing their fitness values under each objective. If all fitness values of the solution X 1 is not worse than X 2 , and there is at least one target better than the value of X 2 , it is considered that X 1 is Pareto dominant compared with X 2 . Therefore, the non-dominated sorting of variables has become one of the keys to solve multi-objective optimization problems. The non-dominated sorting genetic algorithm (NSGA) is based on the basic genetic algorithm, which advances the population selection and regeneration methods. The evolution of each generation in NSGA needs to construct a non-dominated set, which has high computational complexity. NSGA-II proposes a non-dominated fast sorting way for population classification and adopts a crowding degree and elite retention strategy to improve the search efficiency of the optimized solution set, becoming a classic algorithm for solving multi-objective optimization problems. The overall flow of NSGA-II is shown in Figure 3.

3. Experiments

3.1. Experimental Platform and Data Acquisition System

Q235 steel, a common material in welding, is wildly utilized in the structures of bridges and ships. Butt welding with Q235 medium-thick plates are selected in this research to investigate the influence of PP on the welding quality and other factors. The material size is 200 mm × 50 mm × 5 mm, and the weld length is 200 mm. The welding schematic diagram is shown in Figure 4a. Additionally, to prevent material deformation from affecting the welding responses, both ends on the back of the welding plate are fixed in advance, as shown in Figure 4b.
The carbon dioxide arc welding robot system is selected for the experiment and is composed of a Sansun SR10C robot, a Magmet Artsen Plus welding machine, and a welding gun. The diameter of welding wire is 1.2 mm, and its material meets the standard of the GB/T 8110-2008 of China. The welding plates are locked by a fixture, and the overall welding experiment arrangement is shown in Figure 5. Welding quality, energy consumption, and efficiency are selected in this research for the comprehensive operation ability evaluation of robots. Welding quality evaluation at industrial sites is mainly carried out through visual inspection of the surface defects of the welds. In order to provide a numerical welding quality evaluation, welding plates are cut into four parts by wire electrical discharge machining, and then the width and depth of welding seams are measured in this research. Figure 5c,d shows the cutting schemes and the geometric dimension measurement tool, a microscope OLYMPUS SXZ12. Meanwhile, for a more accurate assessment of welding ability, the depth-to-width ratio (DWR) is selected as an indicator of welding quality. Generally, the larger the value of DWR, the better the welding quality.
The energy consumption of the welding process is calculated by integrating welding power over time. By installing current and voltage sensors near the main switch, shown in Figure 5e, the total power of the welding system is measured using the oscillograph recorder (YOKOGAWA DL350 with a sample frequency of 1KHz). The perceptual power flow of the complete welding process is shown in Figure 5f, which includes stages, such as standby, approaching the welding plate, welding, and moving away. It is also illustrated that the welding time can be sorted out as an efficiency indicator through this profile.

3.2. Design of Experiments and Data Preprocessing

In the above-settled welding system, the total adjustable welding PP includes welding current, welding voltage (WV), welding speed, length of welding wire (LW), weld direction angle (WA), and shielding gas flow (GF). To ensure the various impacts of these parameters on the preferred objectives, the welding experiment is designed in a Taguchi pattern, and the L27(36) matrix is selected with six factors and three levels considering the implementation cost. Ranges of each parameter are recommended by welding equipment and related welding manuals, as shown in Table 1.
During the experiment, the WC and WV are input into the welding machine. The LW is adjusted by the wire feeding mechanism of the welding gun, and the GF is fixed by the valve on the gas cylinder. The WS and WA are set by the teaching device of the robot, where the value of the WA is 60°, meaning welding in the pull direction and 120° in the push direction. The images of the welded plate are shown in Figure 6. It can be illustrated that under different PP, the weld profile varies and the smoothness of the welding seam fluctuates, which indicates the parameter combination ruled by the orthogonal experiment basically covers the shifts of targets and can be used for subsequent research on welding process modeling.
After the experiments, the average DWR of three cross sections for each welding plate is calculated to evaluate the welding quality. The welding EC under the corresponding scenarios is computed by power curves, and at the same time, time intervals between the starting and ending arcing moments are recorded as the welding time, T. The PP scenarios and corresponding values of objectives are shown in Table 2.

4. Method Implementation and Result Analysis

4.1. Multi-Objective Oriented Modeling for PP Evaluation

The above 27 samples are divided into training and testing sets in a ratio of 8.5:1.5, and Autosklearn with a version of 0.15.0 is applied to fit models and quantify the relationships between welding PP and selected objectives, respectively. After convergence of models, the average absolute error of the total sample set (denoted as MAEtotal), the average absolute error of the testing set (denoted as MAEtest), the average absolute percentage error of the training set (denoted as MAPEtrain), and the average absolute percentage error of the testing set (MAPEtest) are computed for the evaluation of model capability. The coefficient of determination, also known as R2, for single best models on the training set (denoted as Ssingle_tr), single best models on the validation set (denoted as Ssingle_val), and ensembled models on the validation set (denoted as Sensem_val), is adopted as the metric for the analysis of iterations.
Figure 7a shows the value of R2 during the modeling process with the dataset in Table 2 on the quality objective, DWR, and Figure 7b gives the scatter plot for measured value (MV) and predicted value (PV) by the trained ensembled model. It is shown that though the ensembled model performs better than the single model in predicting values of DWR by comparing Sensem_val with Ssingle_val, the final model has not gotten good teaching since the prediction accuracy in the validation set is much lower than that in the training set, as proven by the curves of Ssingle_val and Ssingle_tr. As seen in the scatter plot, many prediction points deviate significantly from the baseline. Though MAE values are not large, MAPE values for training and testing sets are 13.19% and 9.82%, which are worse than these in [21], confirming the poor performance of the ensembled model. Combined with the R2 and indicators in Table 3, it indicates that the trained model is underfitting and the sample size for DWR modeling is too small to get high accuracy.
To improve the accuracy of the regression model, the data augmentation strategies for the dataset of DWR in Table 2 are proposed in this research. In fact, welding actions are sequential, in which process values of PP are not constants and are influenced by materials, the operation stability of equipment, and so on. Therefore, this article introduces Gaussian noise into the PP. Based on factors such as the positioning error of the robot (SR10C with an absolute positioning error of ±0.44 mm) and the measured power fluctuations during the welding process shown in Figure 5f, a disturbance range of 5% is determined for these input parameters. Fusing the original 81 cut welding plates with the dataset in Table 2, an enlarged dataset with a total of 108 samples involved is formed and utilized to establish the welding quality evaluation model.
The modeling process and results fitting the above-enlarged dataset are shown in Figure 8. It can be illustrated that the performance and prediction accuracy of the new ensembled model are much higher than those generated on the original dataset. Sensem_val and Ssingle_val show that both the single model and the ensembled model have gained good scores in DWR prediction, and most points are near the baseline compared with results obtained by the unexpanded dataset. Table 4 lists the MAPE of training and testing samples in the original dataset, 2.41% and 5.70%, respectively, which are better than results in other papers [23]. It demonstrates that the proposed modeling method has high prediction accuracy and is capable of obtaining accurate welding quality indicator values using a small sample dataset. In addition, the component models and corresponding weights of the ensembled model are shown in Table 5, where the Extreme Randomized Trees (ExtRa Trees) model has the highest proportion of 0.76, the Stochastic Gradient Descent (SGD) receives a proportion of 0.20, and the Gradient Boosting algorithm is assigned a proportion of 0.04. The above algorithms are combined to form the final model for its accuracy improvement and generalization performance. Since the determination of models and their hyperparameters is autonomous, the efficiency of AutoML is also confirmed.
The modeling process of energy cost indicators for welding robots is the same as DWR. From a theoretical perspective, the number of PP that affect the EC is relatively smaller compared with the DWR, for example, parameter GF. Therefore, the complexity of model fitting will be reduced. The experimental dataset and EC labels in Table 2 are utilized, and the iterative curves with a prediction diagram shown in Figure 9 are obtained. Sensem_val shows that the ensembled model has an excellent score in EC prediction, and the score is even better than these for Ssingle_val and Ssingle_tr. Based on the scatter points and MAPE indicators in Table 4, it is seen that the EC model has been fully trained and achieved a prediction accuracy of 2.55%, better than these in [42]. The ensembled model for EC mainly includes two sub-models: SGD and Gaussian Process Regression.
As for welding efficiency, due to the fixed length of weld seam, only the WS set through the robot influences the welding time, T, and there is a simple linear relationship. Fitting a single-factor regression model using only three levels will inevitably cause overfitting. Therefore, a linear model is a choice to describe the relationship between WS and T, or the original sets are up to be expanded by randomly generating 81 sets of experimental data within the range of 7 mm/s~11 mm/s for WS. Then, the proposed method is applied, and the iteration curves and prediction diagram are obtained, as shown in Figure 10. It is illustrated that R2 for each model is nearly 1, and all points in the original dataset are well located. The curves and MAPE indicators in Table 4 show that the model for T is well trained by the enlarged dataset, and the corresponding sub-models are listed in Table 5.

4.2. Multi-Objective Considered PP Optimization

The ensembled models in Table 5 are established to describe the complicated relationships between the PP and objectives, after which the optimization problem takes shape and can be described in the form as follows:
m i n   D W R ( X ) m i n   E C ( X ) m i n   T ( X )
s.t.
X = [ x 1 , x 2 , x 3 , x 4 , x 5 , x 6 ]
x i L x i x i U ,   i = 1,2 , , 6
X U = [ x 1 U , x 2 U , x 3 U , x 4 U , x 5 U , x 6 U ]   =   [ 240 ,   24 ,   22 ,   11 ,   20 ,   120 ]
X L = [ x 1 L , x 2 L , x 3 L , x 4 L , x 5 L , x 6 L ]   =   [ 160 ,   16 ,   16 ,   7 ,   10 ,   60 ]
where i is the index of PP and x i , x i L , and x i U are PP variables and their lower and upper bounds.
Then, the NSGA-II is practiced to solve the above optimization problem and obtain the optimal combination of PP with a tradeoff of the three objectives. The detailed parameters of NSGA-II are shown in Table 6. Individuals with a non-dominant order of 1 in the final population are selected as the optimal solutions for PP. To determine the convergence of the algorithm, the Running Metric Index [43] is selected in this research to evaluate the difference in objective spaces during the iteration process, and the reverse generation distance is calculated through the convergence index and separation index, which are shown in Figure 11. The non-dominated solution set tends to stabilize after 120 generations, indicating that the Paretro front has been obtained within the population. The optimal solutions compared with the experimental dataset in the DWR, EC, and T target spaces are shown in Figure 12. It is not hard to figure out that the improvement of DWR often accompanies the increase of EC. Through the subtle adjustment of PP, it is possible to obtain the optimized DWR and EC levels that meet industrial requirements at a reasonable cost.

4.3. Result Analysis

The permutation feature importance, which measures the increase in prediction error of the established model after permuting the values of input, is calculated in our research to analyze the weights of the impact of each PP on the evaluation targets, as shown in Figure 13. For the welding quality, it indicates that the WS, WV, and WC gain maximum weights, while the influence caused by the GF, LW, and WA is relatively small. For welding EC, the results illustrate that the effects of GF and push or pull welding methods on EC are able to be ignored, and the energy cost is mainly decided by the WC, WV, and WS. In addition, for the welding efficiency, the permutation importance of each PP clarifies that it is only affected by the WS, which is consistent with the model-establishing process designed in this research. The feature importance acquired from the proposed method is unanimous with the theoretical analysis, which proves the key role of the data augmentation and AutoML methods in solving the multi-objective modeling problem for a small sample size dataset for model accuracy and generalization ability improvements.
Additionally, three solutions on the Pareto front are picked and performed practically for verification, as shown in Table 7. The main comparison is made on the DWR level under different WS and the impact of WC on EC. Using the obtained parameters, three scenarios are carried out on the same welding experimental platform. Welding plates and data in the welding process were handled, and then the PV and MV of the welding quality, the energy consumption, and the time cost were obtained, as shown in Table 7 and Figure 14. It is indicated that the average error of DWR prediction is 4.60%, the average error of EC prediction is 3.97%, and the average error of T prediction is 1.03%. It is verified that the AutoML method and the data augmentation strategy are capable of accurately quantifying the relationship between PP and indicators, and the NSGA-II is feasible in finding sustainable and reasonable welding PP for industrial practice.

5. Conclusions and Future Research

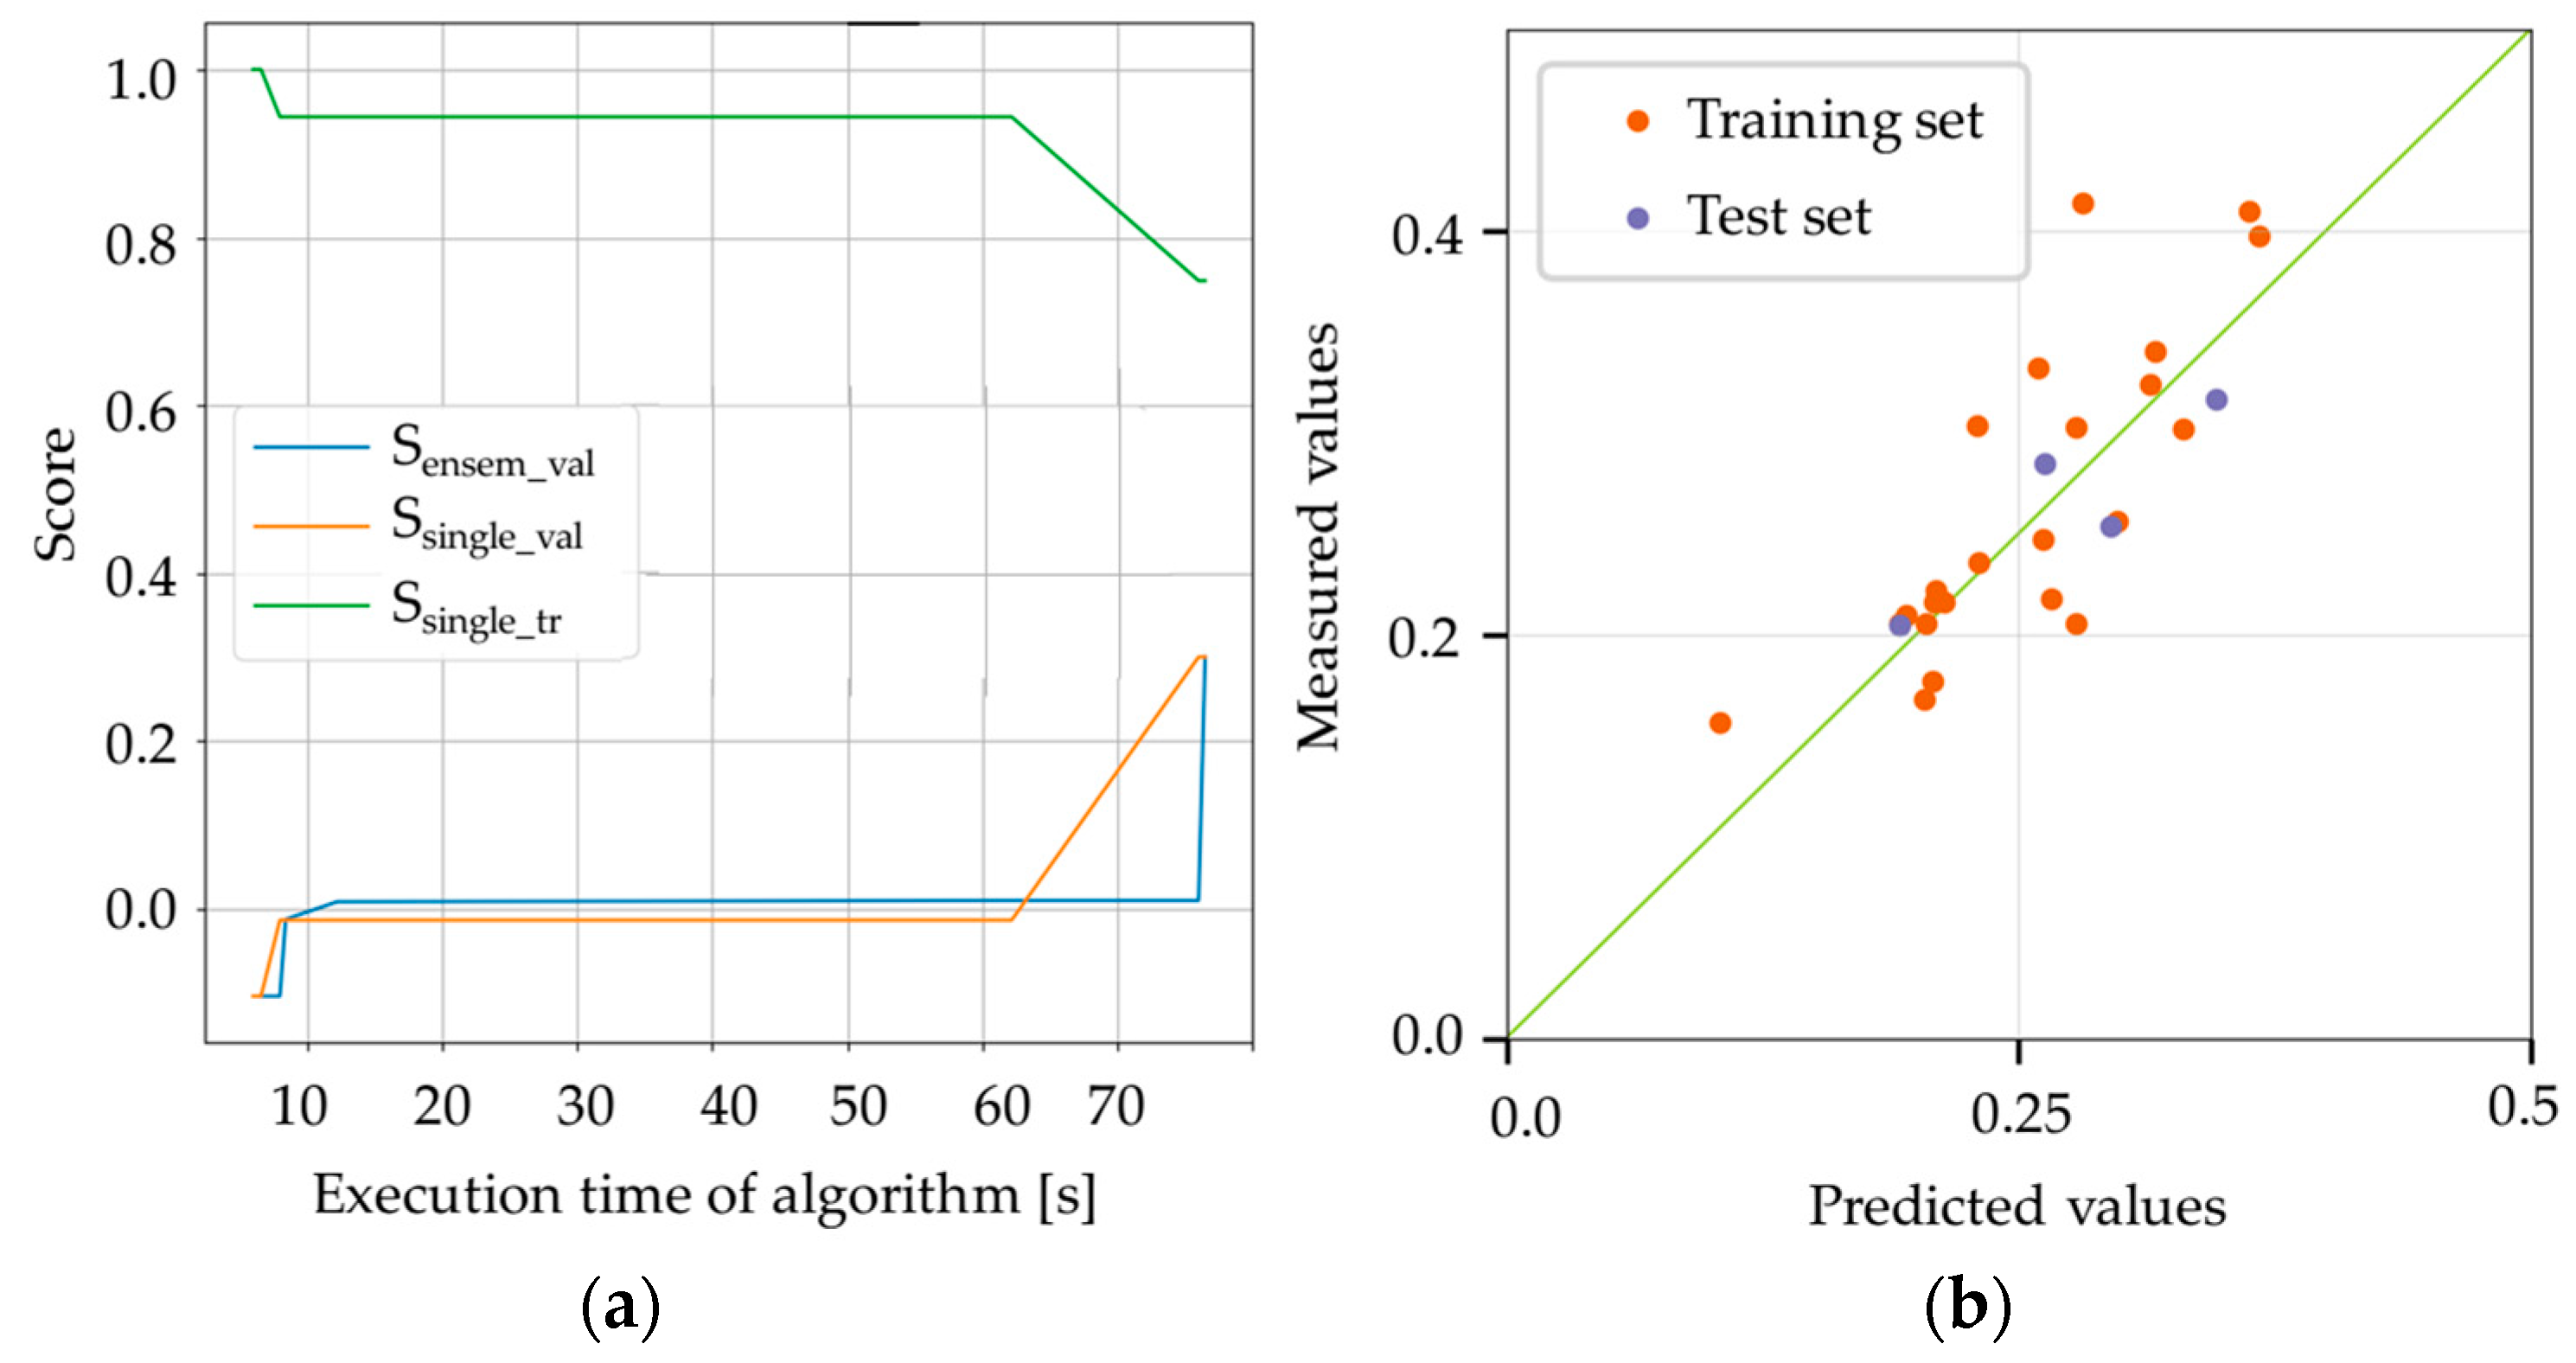
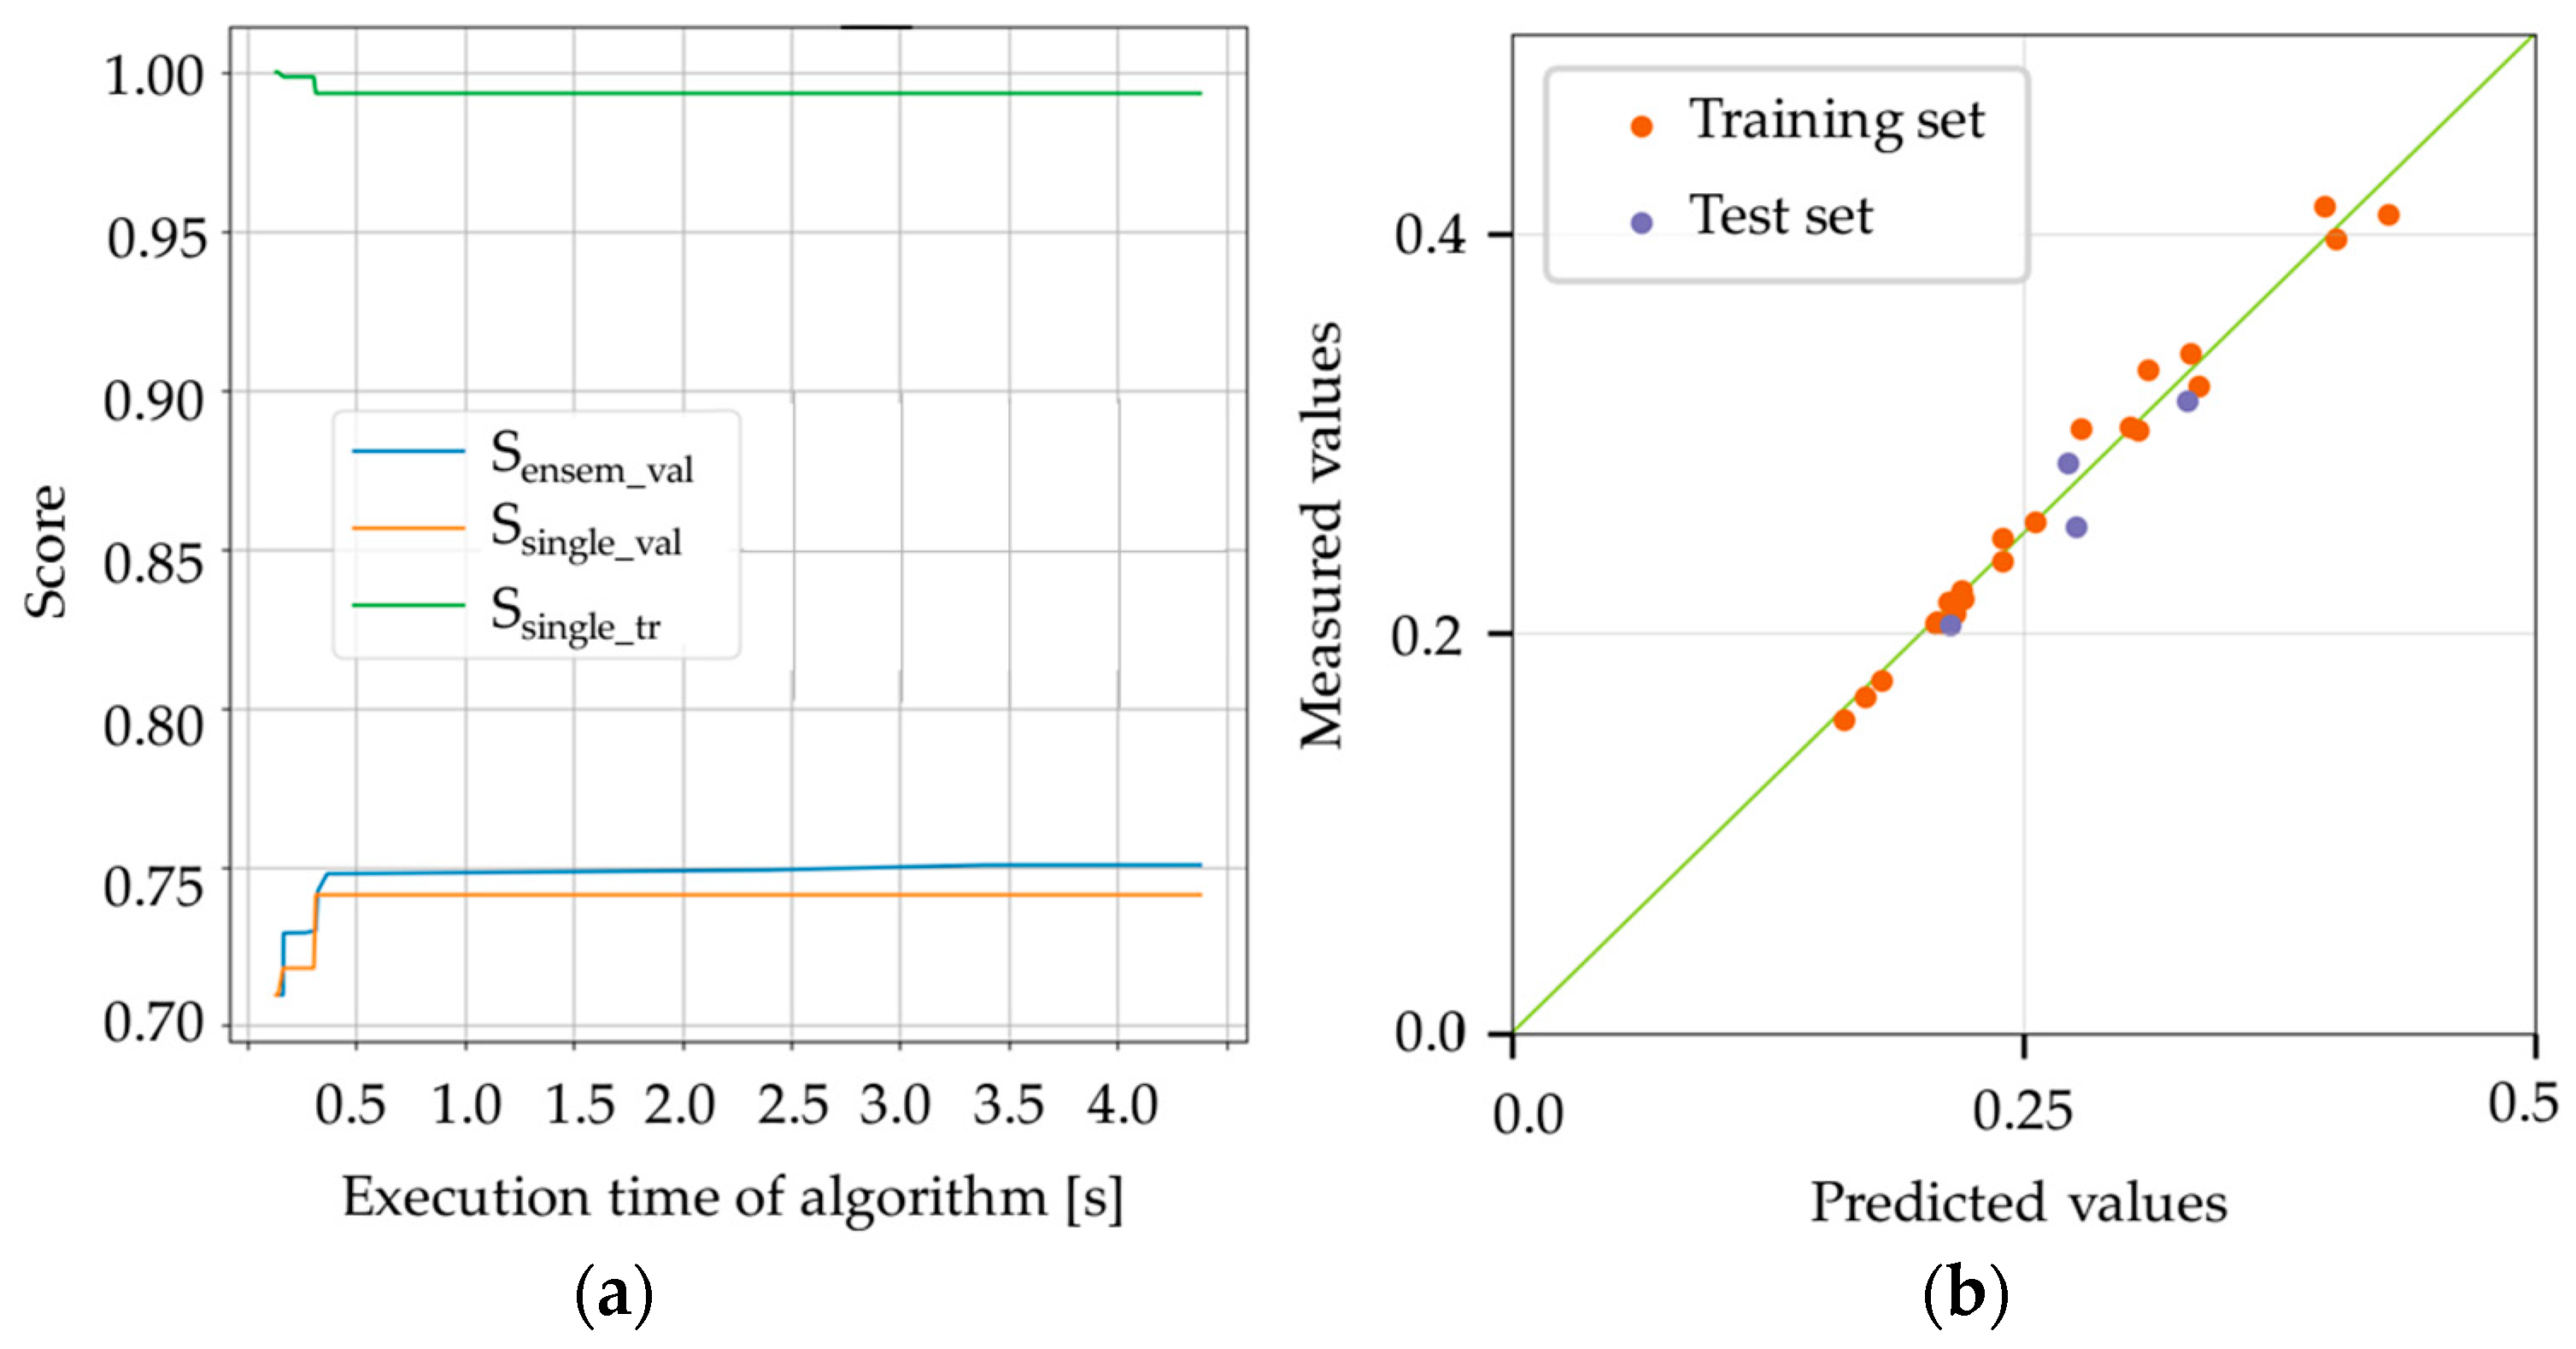
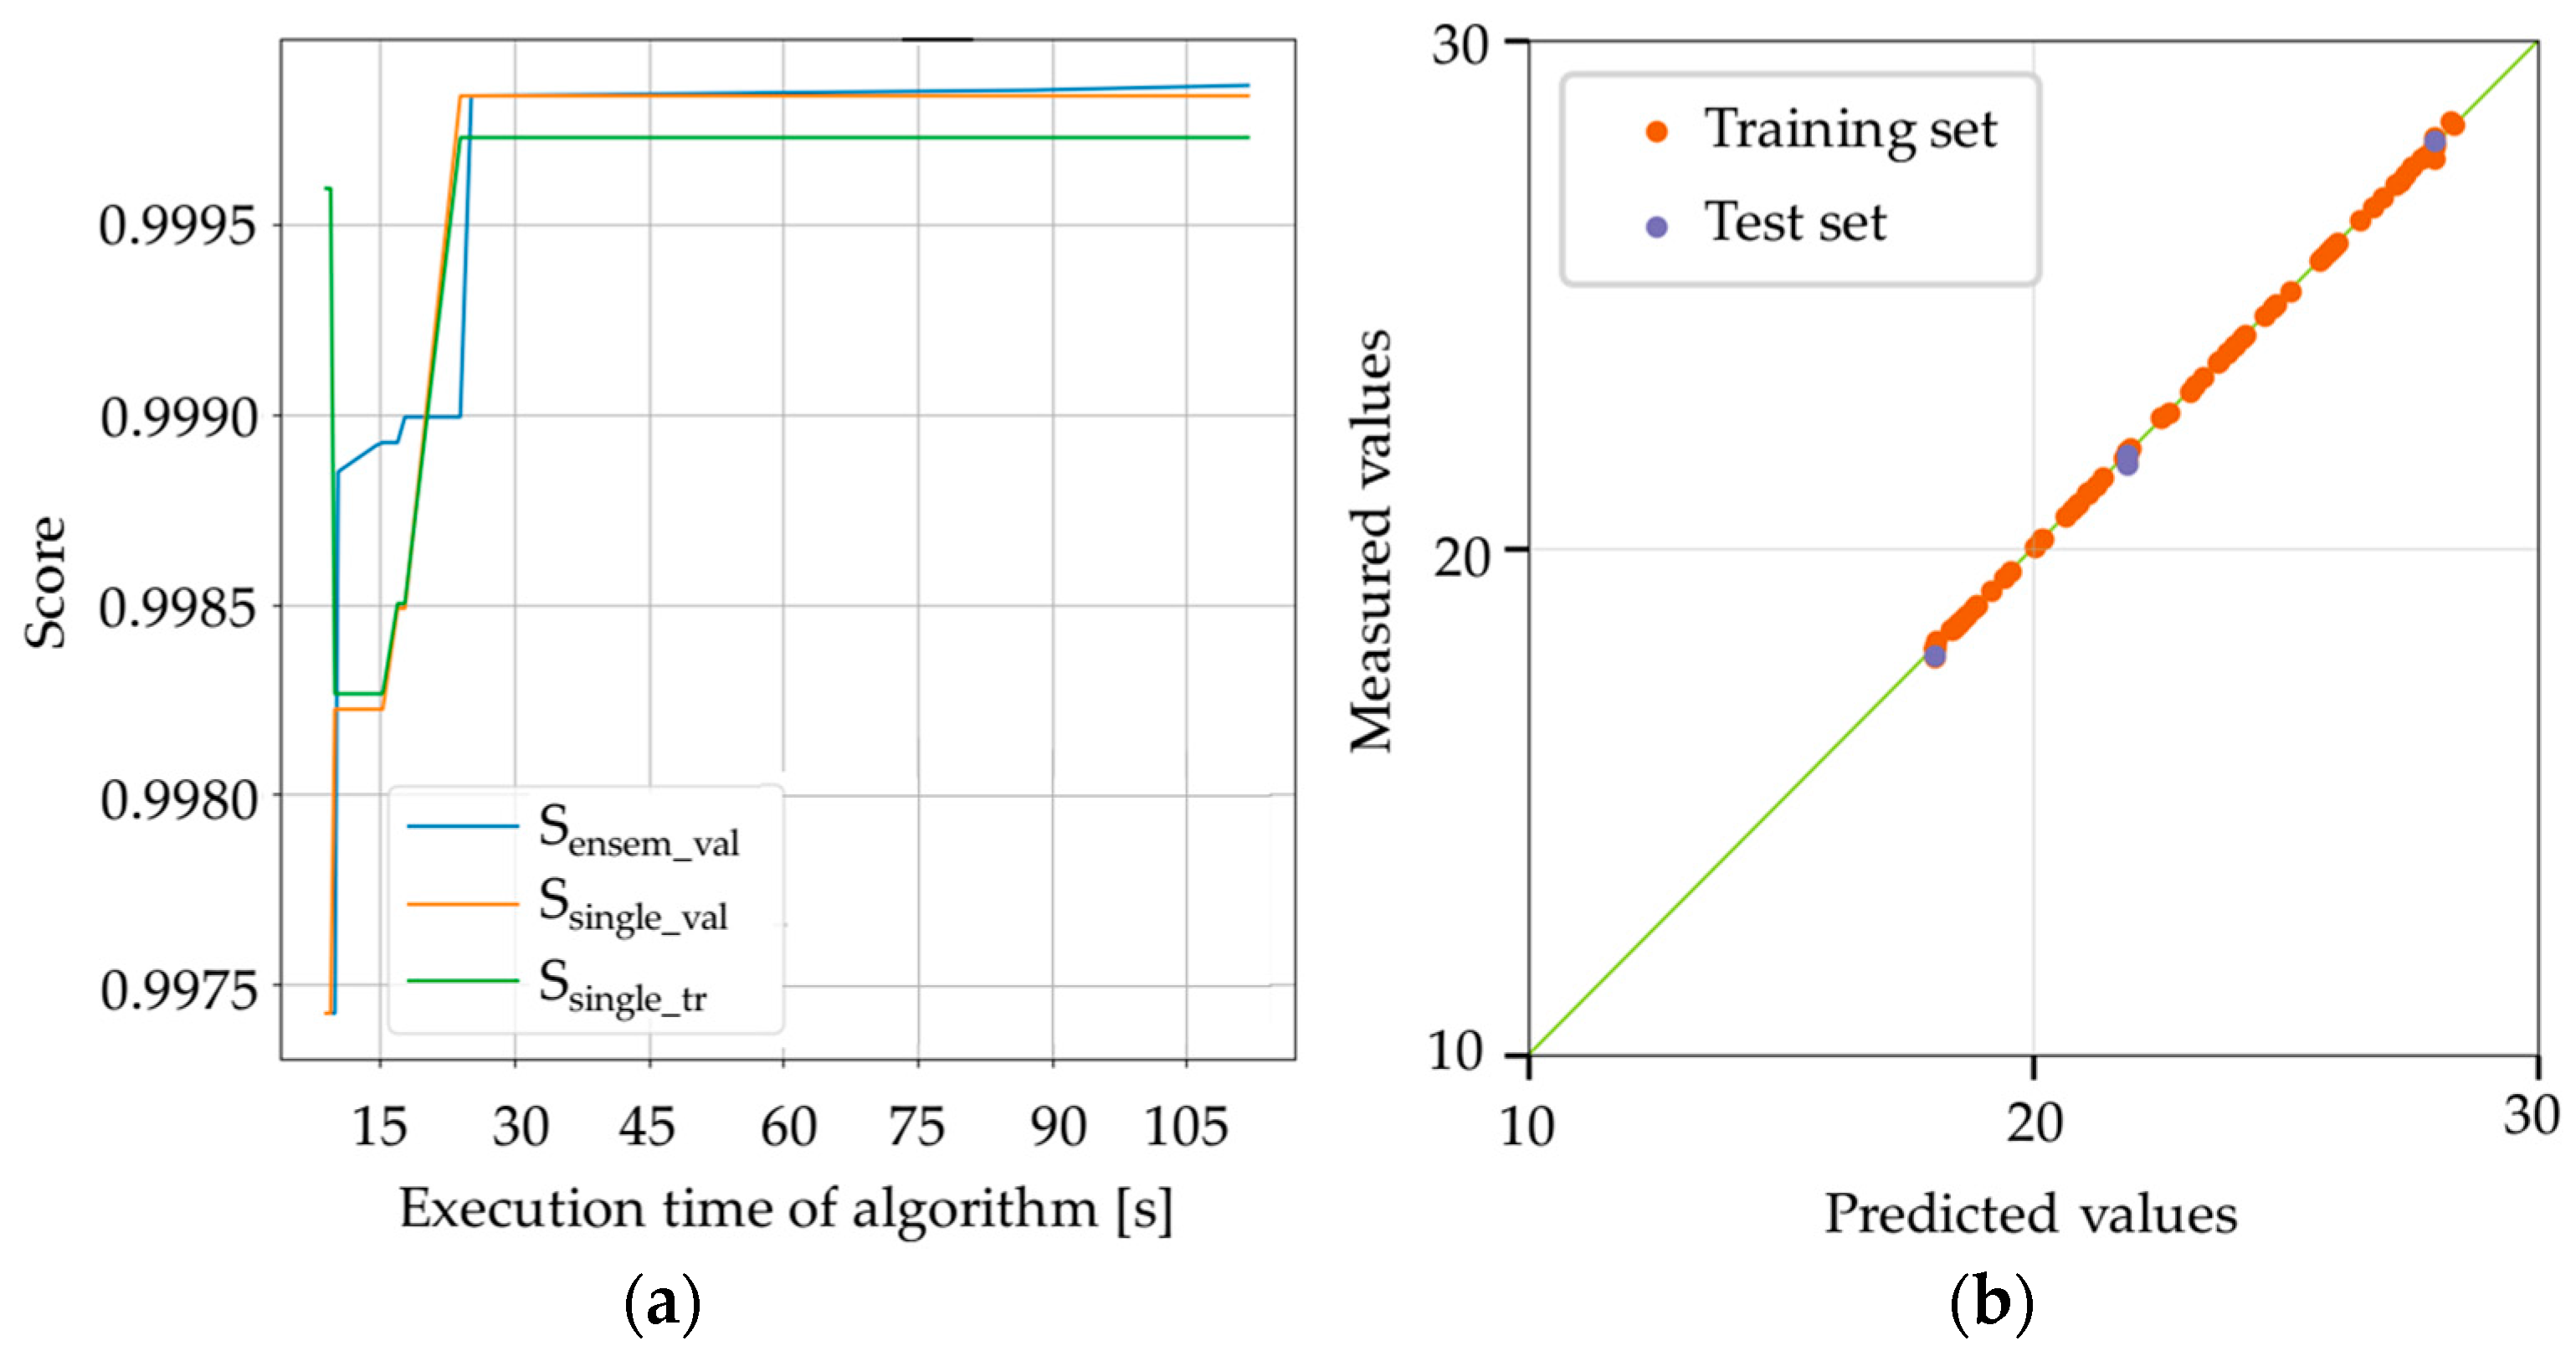
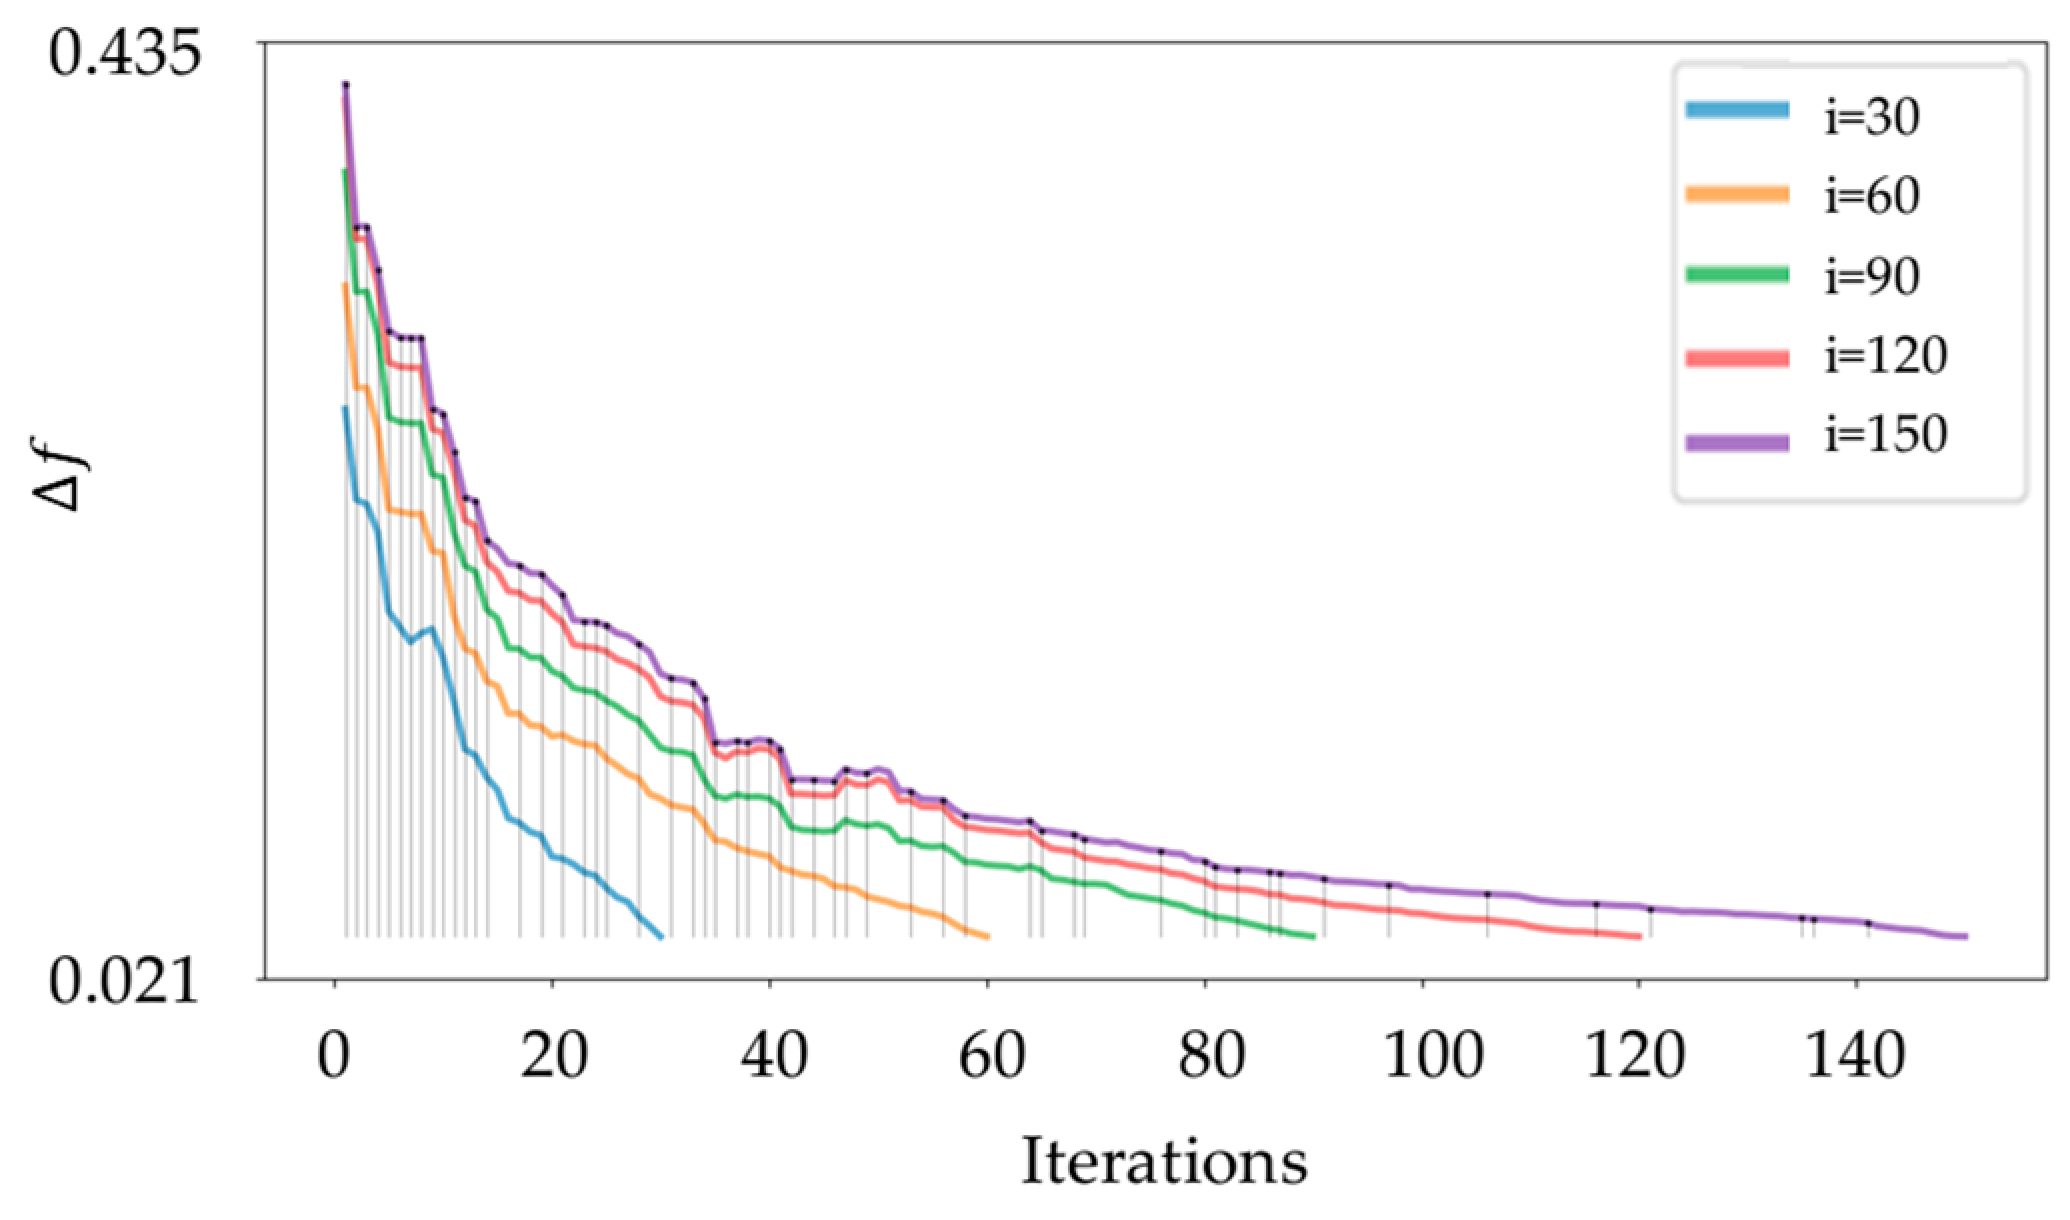
PP optimization is crucial in order to improve the environmental friendliness and sustainability of WRs. This work introduces novel strategies for obtaining optimal PP combinations by focusing on experimental data analysis. The quantification of the associations between PP and targets has been achieved by the augmentation of the sample and the utilization of AutoML models. Then, the NSGA-II is utilized to identify the Pareto front, enabling a trade-off between welding quality, energy consumption, and time cost. Experiments are conducted on Q235 welding plates and the welding platform built by a Siasun SR10 industrial robot and a Magmeet welding machine for verification. It is seen that the model accuracy for welding quality prediction has been dramatically enhanced by using the enlarged dataset. It is proven that the ensembled models obtained by the AutoML method perform better than single ones. The efficacy of the proposed method is convincingly demonstrated by the best solutions and the less than 5% error between the verified and predicted results.
In conclusion, compared with the other PP optimization methods for WRs, the data augmentation and AutoML-based modeling methods achieved satisfying results in terms of modeling accuracy and efficiency. Without requiring a large number of samples and human-dominated parameter adjusting in machine learning, it can be considered an important step toward the intelligent and sustainable operation of WRs.
The study was carried out only taking the geometry feature of welding quality into account. Subsequent investigations might expand upon the existing indicators, such as tensile strength, hardness, and the examination of weld seam microstructure, in order to achieve a more thorough and comprehensive study. In addition, the experiment is carried out in the pattern of butt welding. Furthermore, there are still many intricate PPs for welding, like the swing frequency of the arc, that need to be investigated. Moreover, considering the potential benefits of ML modeling, it is imperative to explore zero- or few-shot learning techniques in order to leverage existing information and well-trained models for enhanced accuracy and efficiency in modeling diverse welding scenarios.

Author Contributions

Conceptualization, methodology, resources, project administration, writing—review, editing and supervision, J.Y.; software, formal analysis, validation, writing—original draft preparation, M.Z.; formal analysis, writing—review and editing, Y.X. All authors have read and agreed to the published version of the manuscript.

Funding

The research was funded by the National Science Foundation of China (#52275482) and the National Key R&D Program of China (#2022ZD0115404).

Institutional Review Board Statement

Not applicable.

Informed Consent Statement

Not applicable.

Data Availability Statement

Not applicable.

Acknowledgments

The authors wish to thank Shenyi Yan from Harbin Institute of Technology and Li Miao from Siasun Robot for providing technical support during the experiments.

Conflicts of Interest

The authors declare no conflict of interest.

References

  1. Liu, Z.H.; Liu, Q.; Xu, W.J.; Wang, L.H.; Zhou, Z.D. Robot learning towards smart robotic manufacturing: A review. Robot. Comput. Integr. Manuf. 2022, 77, 102360. [Google Scholar] [CrossRef]
  2. Gao, Z.; Wanyama, T.; Singh, I.; Gadhrri, A.; Schmidt, R. From Industry 4.0 to Robotics 4.0—A Conceptual Framework for Collaborative and Intelligent Robotic Systems. Procedia Manuf. 2020, 46, 591–599. [Google Scholar] [CrossRef]
  3. Wang, X.W.; Xie, Z.H.; Zhou, X.; Gao, J.; Li, F.; Gu, X.S. Adaptive path planning for the gantry welding robot system. J. Manuf. Process. 2022, 81, 386–395. [Google Scholar] [CrossRef]
  4. Zhao, X.Y.; Wu, C.S.; Liu, D.Y. Comparative Analysis of the Life-Cycle Cost of Robot Substitution: A Case of Automobile Welding Production in China. Symmetry 2021, 13, 226. [Google Scholar] [CrossRef]
  5. IFR. World Robotics 2022. Available online: https://ifr.org/downloads/press2018/2022_WR_extended_version.pdf (accessed on 18 August 2023).
  6. Ande, S.K.; Kuchibotla, M.R.; Adavi, B.K. Robot acquisition, control and interfacing using multimodal feedback. J. Ambient Intell. Humaniz. Comput. 2021, 12, 3909–3919. [Google Scholar] [CrossRef]
  7. Lee, D.; Lee, S.; Ku, N.; Lim, C.; Lee, K.Y.; Kim, T.W.; Kim, J.; Kim, S.H. Development of a mobile robotic system for working in the double-hulled structure of a ship. Robot. Comput. Integr. Manuf. 2010, 26, 13–23. [Google Scholar] [CrossRef]
  8. Shaukat, M.M.; Ashraf, F.; Asif, M.; Pashah, S.; Makawi, M. Environmental Impact Analysis of Oil and Gas Pipe Repair Techniques Using Life Cycle Assessment (LCA). Sustainability 2022, 14, 9499. [Google Scholar] [CrossRef]
  9. Arents, J.; Greitans, M. Smart Industrial Robot Control Trends, Challenges and Opportunities within Manufacturing. Appl. Sci. 2022, 12, 937. [Google Scholar] [CrossRef]
  10. Rout, A.; Deepak, B.; Biswal, B.B.; Mahanta, G.B. Weld Seam Detection, Finding, and Setting of Process Parameters for Varying Weld Gap by the Utilization of Laser and Vision Sensor in Robotic Arc Welding. IEEE Trans. Ind. Electron. 2022, 69, 622–632. [Google Scholar] [CrossRef]
  11. Xu, Y.L.; Yu, H.W.; Zhong, J.Y.; Lin, T.; Chen, S.B. Real-time image capturing and processing of seam and pool during robotic welding process. Ind. Robot. 2012, 39, 513–523. [Google Scholar] [CrossRef]
  12. Yue, W.W.; Song, Y.M.; Zhou, D.B.; Liao, C.; Liu, D.P. The Optimization Design of Vacuum Chamber in Vacuum Electron Beam Welding Machine. In Proceedings of the 2nd International Conference on Mechatronics and Intelligent Materials (MIM 2012), Guilin, China, 18–19 May 2012; pp. 1699–1703. [Google Scholar]
  13. Hatala, G.W.; Wang, Q.; Reutzel, E.W.; Fisher, C.R.; Semple, J.K. A Thermo-Mechanical Analysis of Laser Hot Wire Additive Manufacturing of NAB. Metals 2021, 11, 1023. [Google Scholar] [CrossRef]
  14. Ahmad, S.N.; Manurung, Y.H.P.; Prajadhiana, K.P.; Busari, Y.O.; Mat, M.F.; Muhammad, N.; Leitner, M.; Saidin, S. Numerical modelling and experimental analysis on angular strain induced by bead-on-plate SS316L GMAW using inherent strain and thermomechanical methods. Int. J. Adv. Manuf. Technol. 2022, 120, 627–644. [Google Scholar] [CrossRef]
  15. Lu, H.; Wu, Z.D.; Zhang, Y.Q.; Wang, Y.J.; Liu, S.; Huang, H.; Liu, M.; Liu, S.J. Towards a Uniform Welding Quality: A Novel Weaving Welding Control Algorithm Based on Constant Heat Input. Materials 2022, 15, 3796. [Google Scholar] [CrossRef]
  16. Wang, G.; Wang, J.Z.; Yin, L.M.; Hu, H.Q.; Yao, Z.X. Quantitative Correlation between Thermal Cycling and the Microstructures of X100 Pipeline Steel Laser-Welded Joints. Materials 2020, 13, 121. [Google Scholar] [CrossRef]
  17. Ribeiro, J.; Goncalves, J.; Mineiro, N. Welding process automation of aluminum alloys for the transport industry: An industrial robotics approach. In Proceedings of the 14th APCA International Conference on Automatic Control and Soft Computing (CONTROLO), Braganca, Portugal, 1–3 July 2020; pp. 72–81. [Google Scholar]
  18. Li, Y.; Zhao, Y.Q.; Zhou, X.D.; Zhan, X.H. Effect of droplet transition on the dynamic behavior of the keyhole during 6061 aluminum alloy laser-MIG hybrid welding. Int. J. Adv. Manuf. Technol. 2022, 119, 897–909. [Google Scholar] [CrossRef]
  19. Guo, H.; Fan, C.; Yang, S.; Wang, J.; Pei, W.; Chu, Z. Numerical Simulation of Layered Bimetallic ZChSnSb8Cu4/Steel TIG-MIG Hybrid Welding Based on Simufact. Materials 2023, 16, 5346. [Google Scholar] [CrossRef]
  20. Tyagi, A.; Kumar, G.; Kumar, M.; Atif Wahid, M. Analysis the effect of process parameters on robot spot welding of JSC 590RN mild steel using Taguchi based GRA. Mater. Today Proc. 2022, 51, 1006–1011. [Google Scholar] [CrossRef]
  21. Srivastava, S.; Garg, R.K. Process parameter optimization of gas metal arc welding on IS:2062 mild steel using response surface methodology. J. Manuf. Process. 2017, 25, 296–305. [Google Scholar] [CrossRef]
  22. Ali, S.; Agrawal, A.P.; Ahamad, N.; Singh, T.; Wahid, A. Robotic MIG welding process parameter optimization of steel EN24T. Mater. Today Proc. 2022, 62, 239–244. [Google Scholar] [CrossRef]
  23. Wu, J.Z.; Lian, K.L.; Deng, Y.L.; Jiang, P.; Zhang, C.Y. Multi-Objective Parameter Optimization of Fiber Laser Welding Considering Energy Consumption and Bead Geometry. IEEE Trans. Autom. Sci. Eng. 2022, 19, 3561–3574. [Google Scholar] [CrossRef]
  24. Shim, J.-Y.; Zhang, J.-W.; Yoon, H.-Y.; Kang, B.-Y.; Kim, I.-S. Prediction model for bead reinforcement area in automatic gas metal arc welding. Adv. Mech. Eng. 2018, 10, 1687814018781492. [Google Scholar] [CrossRef]
  25. Zhang, Y.; Xiao, J.; Zhang, Z.; Dong, H. Intelligent Design of Robotic Welding Process Parameters Using Learning-Based Methods. IEEE Access 2022, 10, 13442–13450. [Google Scholar] [CrossRef]
  26. Shorten, C.; Khoshgoftaar, T.M. A survey on Image Data Augmentation for Deep Learning. J. Big Data. 2019, 6, 60. [Google Scholar] [CrossRef]
  27. Rosa, F.L.; Gomez-Sirvent, J.L.; Sanchez-Reolid, R.; Morales, R.; Fernandez-Caballero, A. Geometric transformation-based data augmentation on defect classification of segmented images of semiconductor materials using a ResNet50 convolutional neural network. Expert Syst. Appl. 2022, 206, 117731. [Google Scholar] [CrossRef]
  28. Zeng, Y.; Zhang, J.M. A machine learning model for detecting invasive ductal carcinoma with Google Cloud AutoML Vision. Comput. Biol. Med. 2020, 122, 103861. [Google Scholar] [CrossRef]
  29. Yao, P.; Zhou, K.; Huang, S. Process and Parameter Optimization of the Double-Pulsed GMAW Process. Metals 2019, 9, 1009. [Google Scholar] [CrossRef]
  30. Kim, J.Y.; Lee, D.Y.; Lee, J.; Lee, S.H. Parameter Optimization of Hybrid-Tandem Gas Metal Arc Welding Using Analysis of Variance-Based Gaussian Process Regression. Metals 2021, 11, 1087. [Google Scholar] [CrossRef]
  31. Jha, A.K.; Sit, N. Comparison of response surface methodology (RSM) and artificial neural network (ANN) modelling for supercritical fluid extraction of phytochemicals from Terminalia chebula pulp and optimization using RSM coupled with desirability function (DF) and genetic algorithm (GA) and ANN with GA. Ind. Crop. Prod. 2021, 170, 113769. [Google Scholar]
  32. Chandgude, A.K.; Barve, S.B. Modeling And Multi-Response Optimization Of Abrasive Water Jet Machining Using Ann Coupled With NSGA-II. Surf. Rev. Lett. 2022, 29, 2250035. [Google Scholar] [CrossRef]
  33. Kumar, C.; Doja, M.N. An optimizing utility for portfolio selection based on optimal values computed using ANN, NSGA-II and Machine learning technique. In Proceedings of the International Conference on Power Electronics, Control and Automation (ICPECA), New Delhi, India, 16–17 November 2019; pp. 597–601. [Google Scholar]
  34. Işık, M.F.; Avcil, F.; Harirchian, E.; Bülbül, M.A.; Hadzima-Nyarko, M.; Işık, E.; İzol, R.; Radu, D. A Hybrid Artificial Neural Network—Particle Swarm Optimization Algorithm Model for the Determination of Target Displacements in Mid-Rise Regular Reinforced-Concrete Buildings. Sustainability 2023, 15, 9715. [Google Scholar]
  35. Takahashi, R.; Matsubara, T.; Uehara, K. Data Augmentation Using Random Image Cropping and Patching for Deep CNNs. IEEE Trans. Circuits Syst. Video Technol. 2020, 30, 2917–2931. [Google Scholar] [CrossRef]
  36. Wang, J.Y.; Liu, K.X.; Zhang, Y.C.; Leng, B.; Lu, J.H. Recent advances of few-shot learning methods and applications. Sci. China Technol. Sci. 2023, 66, 920–944. [Google Scholar] [CrossRef]
  37. Zheng, Q.H.; Yang, M.Q.; Tian, X.Y.; Jiang, N.; Wang, D.Q. A Full Stage Data Augmentation Method in Deep Convolutional Neural Network for Natural Image Classification. Discret. Dyn. Nat. Soc. 2020, 2020, 4706576. [Google Scholar] [CrossRef]
  38. Yao, Q.; Wang, M.; Chen, Y.; Dai, W.; Li, Y.F.; Tu, W.W.; Yang, Q.; Yu, Y. Taking Human out of Learning Applications: A Survey on Automated Machine Learning. arXiv 2018, arXiv:1810.13306. [Google Scholar]
  39. He, X.; Zhao, K.Y.; Chu, X.W. AutoML: A survey of the state-of-the-art. Knowl. Based Syst. 2021, 212, 106622. [Google Scholar] [CrossRef]
  40. Waring, J.; Lindvall, C.; Umeton, R. Automated machine learning: Review of the state-of-the-art and opportunities for healthcare. Artif. Intell. Med. 2020, 104, 101822. [Google Scholar] [CrossRef] [PubMed]
  41. Feurer, M.; Springenberg, J.T.; Klein, A.; Blum, M.; Eggensperger, K.; Hutter, F. Efficient and robust automated machine learning. In Proceedings of the 29th Annual Conference on Neural Information Processing Systems (NIPS), Montreal, QC, Canada, 11–12 December 2015. [Google Scholar]
  42. Zhang, M.Y.; Yan, J.H. A data-driven method for optimizing the energy consumption of industrial robots. J. Clean. Prod. 2021, 285, 124862. [Google Scholar] [CrossRef]
  43. Blank, J.; Deb, K. A Running Performance Metric and Termination Criterion for Evaluating Evolutionary Multi- and Many-objective Optimization Algorithms. In Proceedings of the IEEE Congress on Evolutionary Computation (CEC) as Part of the IEEE World Congress on Computational Intelligence (IEEE WCCI), Electr Network, Glasgow, UK, 19–24 July 2020. [Google Scholar]
Figure 1. Flowchart of proposed PP optimization method for WRs.
Sustainability 15 15051 g001
Figure 2. Framework of AutoML.
Sustainability 15 15051 g002
Figure 3. Flowchart of NSGA-II.
Sustainability 15 15051 g003
Figure 4. (a) Schematic diagram of size of welding plates and weldment, and (b) preparation of welding plates.
Sustainability 15 15051 g004
Figure 5. (a) Welding robot system of experiment platform; (b) fixture for welding plates in the platform; (c) schematic diagrams of cutting positions for welding plates and measurement of welding seams; (d) the microscope, OLYMPUS SXZ12, for measurement of welding seams; (e) the oscillograph recorder, YOKOGAWA DL350, and the power flow measurement scheme; and (f) power flow of the WR system for welding process.
Sustainability 15 15051 g005
Figure 6. Weld profiles under different PP scenarios.
Sustainability 15 15051 g006
Figure 7. (a) R2 during model training for DWR and (b) MV vs. PV of DWR.
Sustainability 15 15051 g007
Figure 8. (a) R2 during model training for DWR with an enlarged dataset, and (b) MV vs. PV of DWR.
Sustainability 15 15051 g008
Figure 9. (a) R2 during model training for EC and (b) MV vs. PV of EC.
Sustainability 15 15051 g009
Figure 10. (a) R2 during model training for T with an enlarged dataset, and (b) MV vs. PV of T.
Sustainability 15 15051 g010
Figure 11. Convergence curves of NSGA-II.
Sustainability 15 15051 g011
Figure 12. Experimental data and optimal solutions in the target space.
Sustainability 15 15051 g012
Figure 13. (a) Weight analysis for the impact of PP on DWR, (b) Weight analysis for the impact of PP on EC and (c) Weight analysis for the impact of PP on T.
Sustainability 15 15051 g013
Figure 14. Cut welding plates for verifications.
Sustainability 15 15051 g014
Table 1. PP in the experiment and their levels.
LevelsWC (A)WV (V)GF (L/min)WS (mm/s)LW (mm)WA (°)
1120161671060
2180201991590
324024221120120
Table 2. PP and results for experiments of L27(36).
Case No.WC (A)WV (V)GF (L/min)WS (mm/s)LW (mm)WA (°)DWREC (kJ)T (s)
11201616710600.23670.8527.68
21802016910900.256102.1421.86
3240241611101200.410132.3917.94
412020191110900.25454.8318.06
518024197101200.21615428.08
62401619910600.341102.6621.88
712024229101200.20677.2521.88
818016221110600.32472.5318.02
92402022710900.304175.0728.00
1012024221115600.16862.3518.04
111801622715900.21682.2428.04
1224020229151200.303127.2621.78
1312020197151200.20483.3927.90
141802419915600.177116.9521.90
1524016191115900.39775.6718.04
161201616915900.41454.6721.68
17180201611151200.31777.7517.90
182402416715600.222192.1527.96
19120161611201200.30242.4718.06
201802016720600.210120.6227.96
212402416920900.248142.4721.92
221202019920600.20661.9521.64
2318024191120900.33290.0617.98
2424016197201200.218110.2428.08
251202422720900.15793.5227.94
2618016229201200.28577.7621.84
2724020221120600.206100.1817.84
Table 3. Performance results of the ensembled model for DWR.
ObjectiveMAEtotalMAEtestMAPEtrain (%)MAPEtest (%)
DWR0.03340.026213.199.82
Table 4. Performance results of ensembled models on enlarged datasets.
No.ObjectiveMAEtotalMAEtestMAPEtrain (%)MAPEtest (%)
1DWR0.00810.01492.415.70
2EC4.23902.22832.554.78
3T0.07210.12120.280.57
Table 5. Sub-models and weights for ensembled models.
No.ObjectiveSub-Module No.Sub-ModelWeight
1DWR1ExtRa Trees0.76
2SGD0.20
3Gradient Boosting0.04
2EC1SGD0.98
2Guassian Process0.02
3T1Guassian Process0.70
2ExtRa Trees0.28
3Gradient Boosting0.02
Table 6. Parameters of NSGA-II.
No.ParametersMAEtotalNo.MAPEtrain (%)MAPEtest (%)
1Population size3004Crossover rate0.6
2Elite count1005Mutation rate0.2
3Max iterations1506Stop criteria1 × 10−3
Table 7. Selected optimal welding PP combinations and their responses.
Case No.WC (A)WV (V)GF (L/min)WS (mm/s)LW (mm)WA (°)DWREC (kJ)T (s)
PVMV PVMVPV MV
120116.51115.719.089.30.400.3883.7389.0018.1018.04
212016.01120.117.51110.30.3155.8057.1118.1017.96
316516.29.816.216.686.70.380.3665.7168.2420.219.8
Disclaimer/Publisher’s Note: The statements, opinions and data contained in all publications are solely those of the individual author(s) and contributor(s) and not of MDPI and/or the editor(s). MDPI and/or the editor(s) disclaim responsibility for any injury to people or property resulting from any ideas, methods, instructions or products referred to in the content.

