Article

Influence of Atmospheric Non-Uniform Saturation on Extreme Hourly Precipitation Cloud Microphysical Processes in a Heavy Rainfall Case in Zhengzhou

1
Laboratory of Cloud-Precipitation Physics and Severe Storms (LACS), Institute of Atmospheric Physics, Chinese Academy of Sciences, Beijing 100029, China
2
University of Chinese Academy of Sciences, Beijing 100049, China
3
Institute of Applied Meteorology, Beijing 100190, China
*
Authors to whom correspondence should be addressed.
Sustainability 2023, 15(20), 15047; https://doi.org/10.3390/su152015047
Submission received: 26 August 2023 / Revised: 4 October 2023 / Accepted: 13 October 2023 / Published: 19 October 2023
(This article belongs to the Special Issue Advances in Weather Prediction and Numerical Simulation)

Abstract

:
Heavy rainfall not only affects urban infrastructure, it also impacts environmental changes, and which then influence the sustainability of development and ecology. Therefore, researching and forecasting heavy rainfall to prevent disaster-related damages is essential. A high-resolution numerical simulation was carried out for a heavy rainfall case in Zhengzhou, Henan Province, China, from 19–20 July 2021. The analysis of weather conditions revealed that the main cause of heavy rainfall in Zhengzhou was the supersaturation and condensation of water vapor, resulting from the invasion of dry and cold air from the upper and middle atmospheric layers. This weather condition is ideally suited for applying generalized potential temperature that is informed by the non-uniform saturation theory. Based on this, the new scheme revised the cloud microphysical scheme of the cloud water condensation parameterization process by substituting generalized potential temperature. The characteristics of the mesoscale environment and water condensates were comparatively analyzed between the original and the new scheme. Then, the quantitative mass budget and latent heat budget related to microphysical conversions were comparatively calculated over Zhengzhou. Furthermore, the possible two-scheme mechanisms through which the cloud microphysics processes affected the rainfall were investigated and discussed. It was found that: (1) The new scheme, which takes into account generalized potential temperature, produced precipitation fields more in line with observations and simulated stronger hourly precipitation compared to the original scheme. (2) The conversions of snow were the main source of microphysical processes that produced precipitation and released latent heat due to the dry and cold air invasion. (3) Given that the condensation of water vapor was hypothesized to occur at 70% relative humidity (RH) or above, rather than the original 100% RH, the new scheme simulated more supercooled water and ice-phase particles than the original scheme. This enhancement, in turn, intensified convective development owing to positive feedback within the cloud microphysics processes and cloud environment, ultimately leading to the simulation of more intense hourly precipitation.

1. Introduction

Heavy rainfall can result in flooding and urban ponding, exerting significant pressure on the city’s infrastructure, such as roads, bridges, and other public infrastructure. It can seriously threaten the lives and property of people, transportation, and industrial activity [1]. Heavy rainfall can also have profound effects on environmental changes, such as causing rivers to overflow, inundating farmlands, and damaging ecosystems [2]. This can have adverse effects on local flora and fauna. Such environmental shifts can impact biodiversity, thereby having long-term implications for sustainable development. Consequently, it is necessary to improve the forecasting ability of heavy precipitation. Regional prediction of heavy precipitation depends mainly on the successful development and application of numerical models. Although the mainstream international models demonstrate the predictability of heavy precipitation, large systematic errors in the prediction process still exist [3]. For example, the ECMWF (European Centre for Medium-Range Weather Forecasts) model and the GFS (Global Forecast System) produce better rainfall areas than other models in the “21.7” Henan Extremely Heavy Rainfall Event, but the rainfall intensity is much lower. This systematic bias is due to the inevitable connection with mesoscale systems [4]. Current operational forecasting models are still inadequate at forecasting the mesoscale convective systems (MCSs) that trigger and develop rainstorms [5,6].
The following aspects are being meticulously investigated to refine the prediction accuracy of Mesoscale Convective Systems (MCSs) that contribute to heavy rainfall. Dynamical frameworks have the capability of substantially enhancing the accuracy of forecasting in model simulations [7]. Elevated model resolution can offer more precise simulations of mesoscale structural features, thereby refining the portrayal of rainfall intensity and areas [8,9]. Obtaining more precise initial conditions is also crucial. When assimilation techniques, like 3DVar, 4DVar, and ensemble Kalman filtering, are used in data assimilation, they can harmonize multiple observation sources to refine the initial field and incorporate mesoscale information into it [10]. Moreover, the internal physical process parameterization, such as the cloud microphysics scheme and the planetary boundary layer scheme within the model, significantly influences the outcomes. Cloud microphysical processes in particular often have a substantial impact on the forecasts generated by numerical models [5]. For the numerical model to accurately reflect various weather conditions, it needs to provide a reasonable representation of atmospheric dynamic and thermodynamic processes. Cloud microphysical processes can alter the thermodynamic processes of convective systems [11]. Consequently, the IPCC (Intergovernmental Panel on Climate Change) has explicitly recognized cloud microphysical processes and their feedback mechanisms as the primary sources of uncertainty impacting model precision [12].
To enhance the simulation of cloud microphysical processes in heavy rainfall, it is crucial to understand the mechanisms by which these processes influence rainstorms. Gao S.T et al. [13] and Fan J. et al. [14] have suggested that latent heat released from cloud microphysical processes can significantly change the mesoscale thermodynamic structure in clouds and affect the development of convective systems. The release of latent heat is associated with the phase conversion of ice-phase particles (such as snow and graupel), liquid-phase particles, and water vapor, subsequently affecting the thermodynamic and dynamic structures within the cloud. Mao et al. [15] found that the intense sublimation process of graupel and snow is accompanied by the rain-graupel collection through numerical simulations of the rainstorm that occurred in Beijing on 21 July 2012. This process can lead to more latent heat release, driving the updraft to higher convective heights. Yin L et al. [16] argued that processes such as condensation, evaporation, and deposition change the water vapor distribution and affect the release and absorption of latent heat, which provides an important heat source and heat sink for cloud dynamic processes.
Therefore, on the basis of the study of cloud microphysical process mechanisms for different types of rainfall in different regions, modifications of cloud microphysical process parameters for heavy rainfall characteristics of the region can improve heavy rainfall forecasting capabilities. Commonly modified cloud microphysical parameter processes include the concentration of cloud condensation nuclei, raindrop spectral shape parameters, and fall velocity of graupel. In addition to these parameter processes, the modification of possible functions of cloud water condensation considering non-uniform saturation is also an important parameter process. This is mainly due to the fact that the downward intrusion of dry and cold air intermixed with warm and wet air in the lower troposphere can transport high values of potential vorticity downward during precipitation events, leading to non-uniform saturation instability and thus maintenance of a rainfall event [17]. The concept and application of non-uniform saturation are focused on in Section 3.1 and Section 3.2 of this paper.
In summary, although it is already clear that the cloud microphysical processes in the MCSs of heavy precipitation events in Zhengzhou have an important impact on development, the following scientific questions still need to be addressed. (1) Is there a dry intrusion process that leads to the non-uniform saturation of the atmosphere during such events? (2) Can the introduction of generalized potential temperature that considers non-uniform saturation in the atmosphere in the cloud water condensation process result in a more effective simulation of extreme hourly rainfall intensity? (3) How does using a non-uniformly saturated cloud water condensation function affect the three-dimensional structure of a rainstorm’s cloud microphysical processes and cloud microphysical mechanisms?
On the basis of the above questions, a cloud-resolving numerical weather model was used to compare cloud microphysical schemes with and without the non-uniformly saturated cloud water condensation process for a selected extreme rainstorm case in Zhengzhou. The two results of simulations were verified using automatic Weather Station and Doppler radar data. Among the non-conventional information, Doppler weather radar observations have high spatial and temporal resolution and are currently the main information source that can provide mesoscale weather system observations for numerical models [18]. Therefore, Doppler radar is an important tool to evaluate and validate the results of numerical model simulations. The characteristics of cloud environment and cloud microphysics were also compared and analyzed. The quantitative rainwater mass budget and latent heat budget of microphysical conversions about cloud hydrometeors were compared and calculated. The possible physical mechanisms of the cloud microphysical processes affecting the storm’s extreme hourly precipitation were also compared and summarized.
Section 1 of this paper provides an introduction. Section 2 provides a case overview and the synoptic conditions. Section 3 describes the concept and application of non-uniform saturation theory and model experiment design. Section 4 describes the model verification. Section 5 describes the mesoscale environment and the cloud microphysical features of the extreme rainfall intensity over Zhengzhou. Section 6 discusses the possible mechanisms by which cloud microphysical processes affect extreme hourly precipitation between two schemes. Section 7 provides a conclusion.

2. Case Overview and Synoptic Conditions

2.1. Case Overview

Zhengzhou, the capital and largest city of Henan Province, China, experienced a rare and continuous heavy precipitation event on 20 July 2021, during which the 24 h cumulative precipitation amount reached 627.4 mm and the maximum hourly precipitation amount exceeded historical extremes of hourly precipitation on land [19]. This disastrous rainstorm event left 292 residents of Zhengzhou dead and a further 4 still recorded as missing.

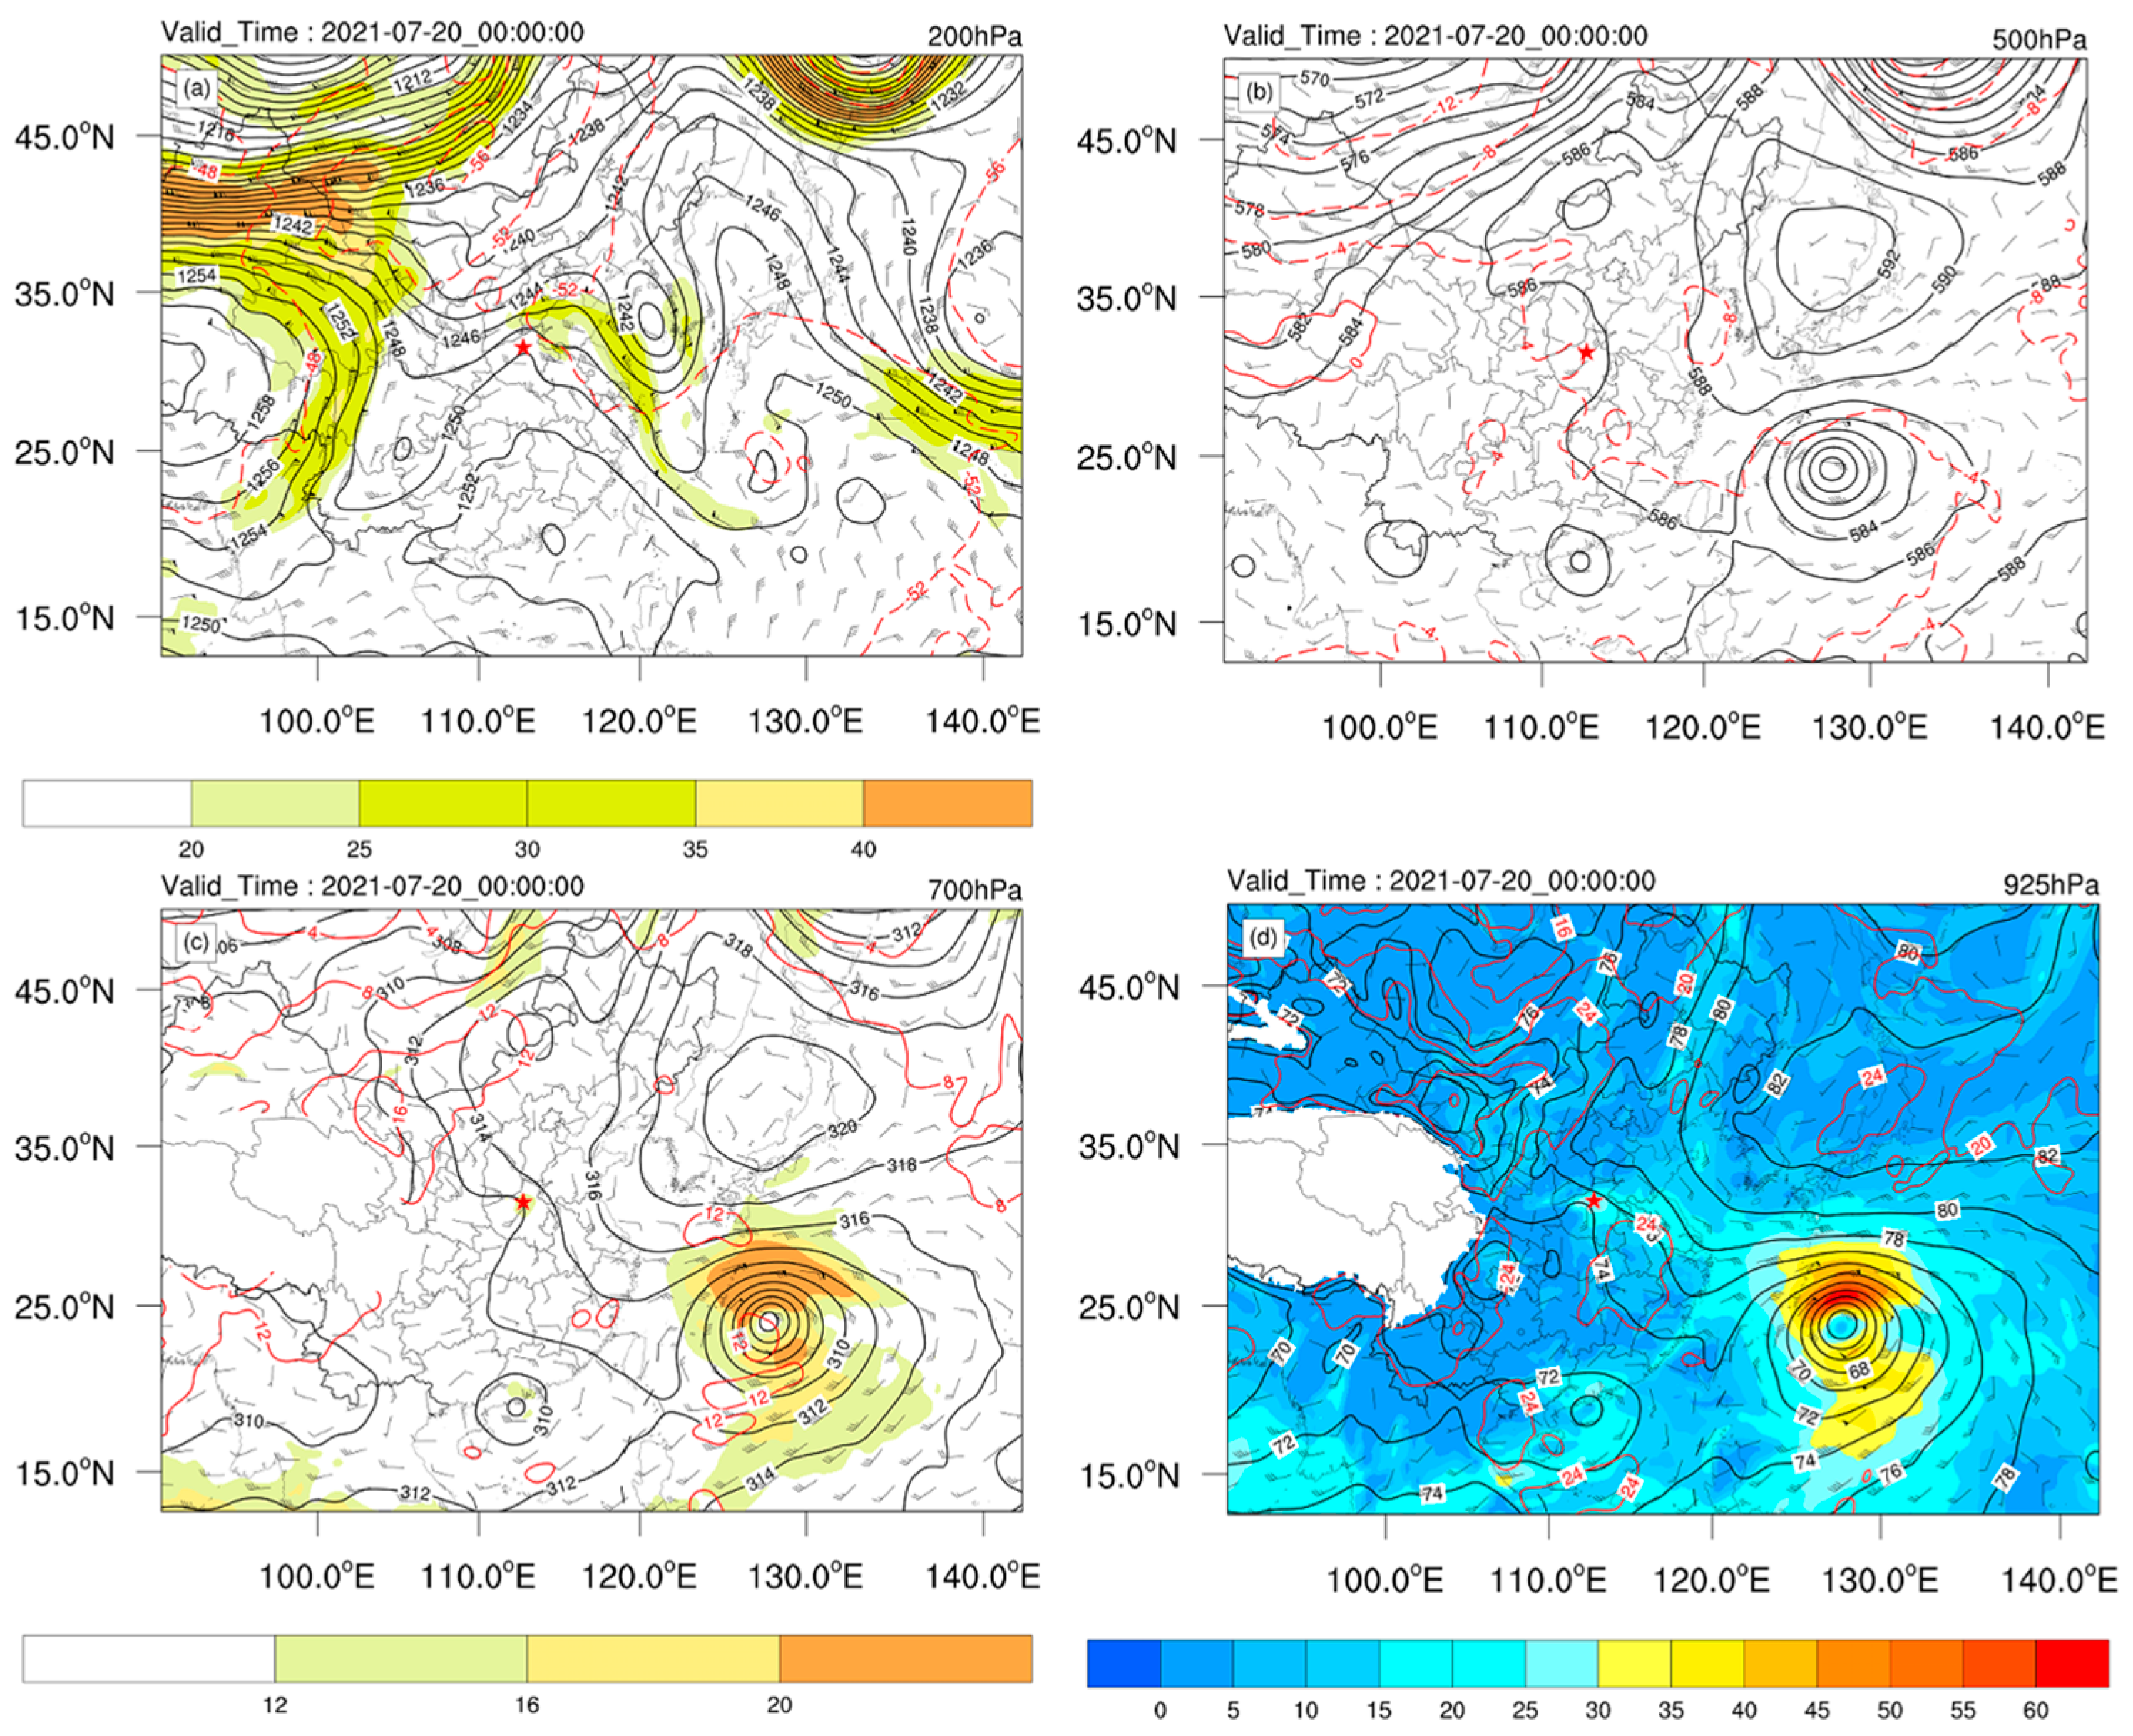
2.2. Analysis of Synoptic Conditions

In this section, ECMWF reanalysis data and sounding observations are used to analyze the weather situation before the occurrence of extreme rainfall and to investigate the precipitation process of the synoptic conditions.

2.2.1. Circulation Configuration

Data from the fifth-generation global reanalysis produced by ECMWF (ERA5) (spatial resolution, 0.25°; temporal resolution, 1 h) were used to analyze the circulation situation before the occurrence of heavy precipitation in Zhengzhou. Shi et al. [4] evaluated the precipitation forecast results of both the ECMWF and GFS models, finding that, overall, the predictive performance of the ECMWF model was slightly superior to that of the GFS model. Additionally, ECMWF is capable of providing initial and boundary fields with the time resolution of one hour, which is more conducive to subsequent simulations of hourly precipitation. Therefore, ERA5 data was chosen as the research and simulation data.
As shown in Figure 1, the circulation and upper-level jet field at 200 hPa indicate that Zhengzhou was located behind a ridge and in front of a trough. The upper-level divergence and low-level convergence were favorable for upward motion. The cold advection upstream deepened the trough over Zhengzhou. The southward extension of low pressure downstream deepened the trough over Zhengzhou due to the downstream effect. Eventually, this led to the further development of upward motion and the invasion of cold air over Zhengzhou. The circulation and temperature field at 500 hPa indicate that Typhoon Infa was active over the western Pacific Ocean. The warm center of the temperature field and the low-pressure center of the geopotential height field overlapped, causing a warm-center structure to develop around the typhoon. The western Pacific subtropical high was located over Japan, which guided the external flow of the typhoon to Zhengzhou. The atmospheric circulation and lower-level jet field at 700 hPa indicate that there was a strong westward low-level jet on the northern side of Typhoon Infa. Zhengzhou was located downstream of strong low-level jets, where the convergence of air produced upward motion and concentrated water vapor. At the same time, the southwest jets of Typhoon Cempaka also transported momentum, heat, and water vapor to Zhengzhou. The circulation and water vapor fluxes at 925 hPa indicate that the strong southeastward airflow between Typhoon Infa and the subtropical high transported water vapor from the western Pacific Ocean. The southward airflow of Typhoon Cempaka transported water vapor from the South China Sea. The two airflows converged over Zhengzhou. Then, owing to the blocking effect of the Taihang Mountains (34°34′–40°43′ N, 110°14′–114°33′ E), water vapor was forced to rise up the windward slope of the mountain range, which promoted further development of upward motion.
In summary, the extreme rainfall intensity in Zhengzhou was dominated by cold trough, blocking high, subtropical high, typhoons (Infa and Cempaka) and mountains. At the middle and lower levels, the effect of subtropical high and two typhoons results in the transport of low-latitude water vapor and heat to the atmosphere over Zhengzhou. Meanwhile, cold trough brings in dry, cold air from high-latitude regions. The intrusion of dry and cold air results in supersaturation and condensation of water vapor under the influence of terrain-forced lift, ultimately leading to extreme precipitation events in the area. Yin L et al. [20] also achieved similar conclusions about the intrusion of dry and cold air resulting in supersaturation and condensation of water vapor.

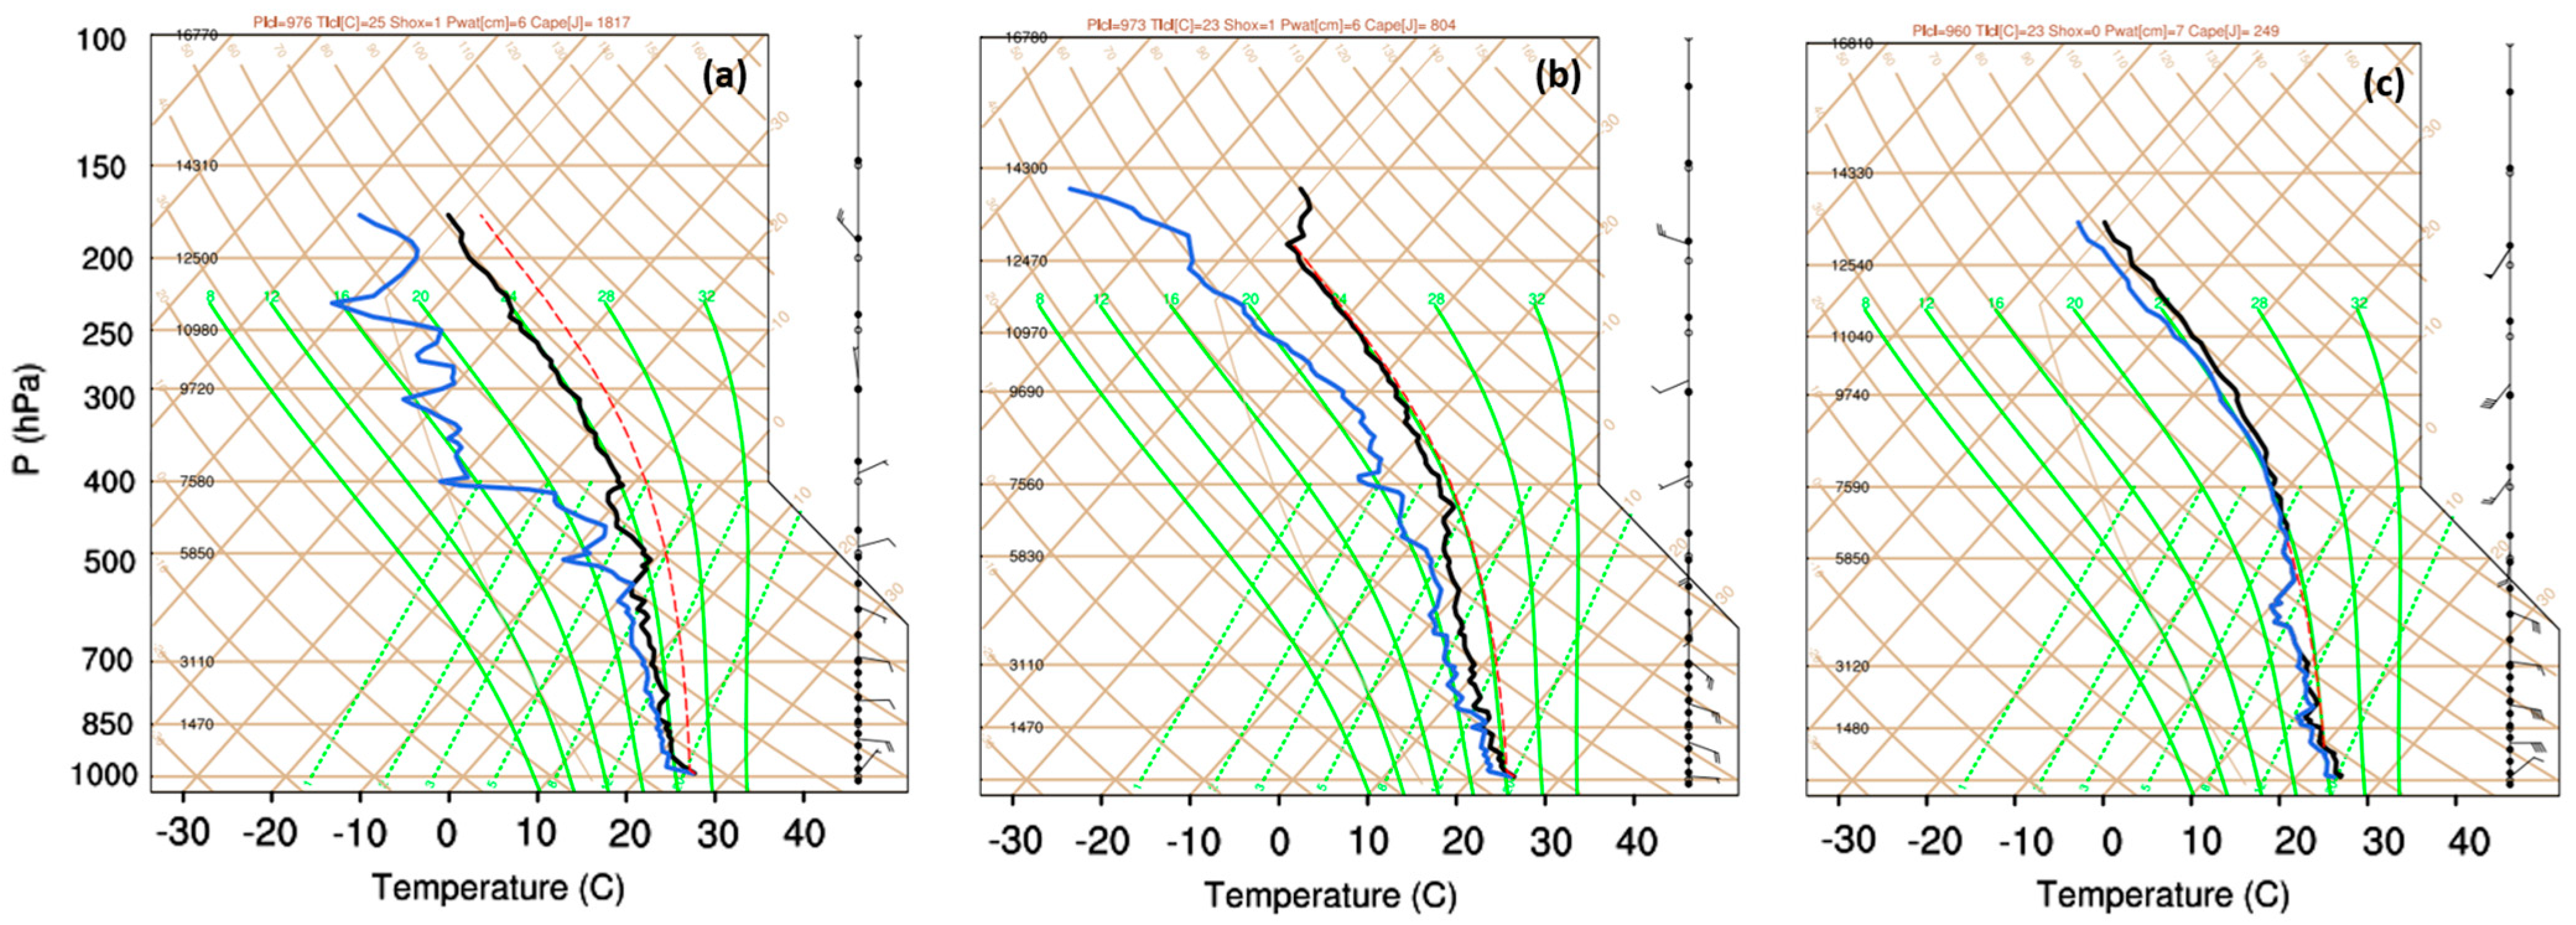
2.2.2. Skew T/Log p Analysis

Figure 2 shows the sounding observations from Zhengzhou station (provided by the Beijing Meteorological Detection Center), which were used to characterize the atmospheric stratification conditions before the extreme rainfall intensity. At 12:00 on 18 July 2021 UTC, the area between the temperature curve and the dew-point temperature curve showed a wide trumpet shape. The gap between the temperature curve and the dew-point temperature curve above 400 hPa was large owing to the invasion of the upper-level dry and cold air. The atmosphere in a state of upper-level dry air and lower-level wet air had accumulated unstable energy [convective available potential energy (CAPE) 1817 J kg−1]. At 00:00 UTC on 19 July 2021, the atmosphere was also in a dry state at the upper levels and a wet state at the lower levels. The accumulation of CAPE decreased (804 J·kg−1). The temperature curve and dew-point temperature curve showed a narrow trumpet shape. At 12:00 UTC on 19 July 2021, the temperature profile below 400 hPa and the dewpoint temperature profile almost coincided, suggesting that the atmosphere below 400 hPa had basically reached saturation. The lower and middle tropospheric layers were mostly warm and wet, which was highly favorable for the occurrence of convection.

2.2.3. Analysis of Water Vapor and Heat Conditions

Figure 3 shows profiles of the vertical motion, the perturbation temperature, and the water vapor flux divergence. Extreme hourly precipitation occurred just before 12:00 UTC 19 and 00:00 UTC 20 in July. The extreme hour of precipitation occurred just before 09:00 UTC 20 in July. Beginning at 12:00 UTC 19 and 09:00 UTC 20 in July, there were strong upward motions over Zhengzhou, reaching their maximum at 09:00 UTC 20 in July. The updrafts were generated mainly due to the forced uplift of the terrain. There were significant negative perturbation temperature values from 250 hpa to 100 hpa, indicating the intrusion of dry and cold air at the upper levels. As the rainstorm developed, the range and values of positive perturbation temperature in the mid-level gradually increased due to the effects of cloud microphysical processes, which also contributed to the development of the convection. Due to the blocking effect of the mountains, there were accumulations of heat in the lower levels of Zhengzhou. Simultaneously, there were also strong convergences and divergences of water vapor flux in the lower layer, which were highly favorable for further development of strong precipitation under the influence of upward motion.

3. Non-Uniform Saturation and Comparative Experiment Design

This section first introduces the concept of non-uniform saturation in the atmosphere and generalized potential temperature. Then, it describes how to apply atmospheric non-uniform saturation to the parameter processes of the WRF (Weather Research and Forecasting) model. Finally, the experiment design regarding whether to consider atmospheric non-uniform saturation is presented.

3.1. Introduction of Non-Uniform Saturation and Generalized Potential Temperature

The real atmosphere is neither completely dry nor completely saturated, but is non-uniformly saturated. Non-uniform saturation refers to a state of saturation in which the concentration of water condensates is not uniform in a certain spatial location or direction. Observational data have led to the finding that, when the relative humidity of the actual atmosphere exceeds 70%, condensation may have occurred locally in the atmosphere, and the process increases with moderate enhancement, meaning there is non-uniform saturation of the atmosphere, with a mix of dry, wet, and saturated air [21]
However, when describing the atmospheric thermal state, the potential temperature in the dry air and the pseudo-equivalent potential temperature in the wet air are mainly used to characterize the atmospheric thermal state. These two parameters do not reflect the real non-uniform state of the atmosphere. It is expressed in the equation as discontinuity of the latent heat term that can occur in the thermodynamic equation in the transition area between unsaturated and saturated air, where latent heat is released in association with condensation in saturated air and not released in unsaturated air.
To fix this discontinuity, a condensation probability function is introduced into the thermodynamic framework to describe the real thermal situation of the atmosphere, Gao S et al. [22] proposed the generalized potential temperature θ Gao in an atmosphere with non-uniform saturation that includes the condensation process based on observational facts, as follows (Equation (1)):
θ Gao = θ exp [ L v 0 q s c p T ( q v q s ) k ]
where θ Gao is generalized potential temperature, θ is potential temperature, qv is the water vapor specific humidity, qs is the water vapor saturation specific humidity, ( q v q s ) k is the condensation probability function, which is a factor reflecting the non-uniform saturation characteristics of the atmosphere, k = 9 is an empirical index of the condensation probability function [23], T is air temperature, Lv is the latent heat of condensation per unit mass, and Cp is the constant pressure specific heat capacity of wet air per unit mass.
In dry air, q v = 0 , ( q v q s ) k = 0 will degrade to the dry potential temperature.
In wet air, q v = q s , ( q v q s ) k = 1 will degrade to the pseudo-equivalent potential temperature.
Therefore, the generalized potential temperature can consider not only dry air, but also wet air, as well as the real atmosphere, which is not completely dry or completely wet.
Since Gao S et al. [22] proposed the concept of generalized potential temperature, many scholars have proven and applied it. Yang S et al. [17] defined a new generalized frontogenesis function based on the definition of generalized potential temperature. The generalized frontogenesis function in a non-uniformly saturated moist atmosphere can be used in situations involving either a strong temperature or moisture gradient and is closely correlated with precipitation through diagnostic studies of real cases. Ping F et al. [24] discovered that the generalized potential temperature accurately diagnoses the location, as well as the spatial and temporal distribution, of vertical activity related to the plum rain front by using continuous daily time series data from June to July between 1990 and 2010.

3.2. Application of Non-Uniform Saturation to Cloud Microphysical Schemes

Owing to the low resolution of the data, it was not easy to investigate the influence of cloud microphysical processes and feedback from the mesoscale environments during the period of extreme rainfall over Zhengzhou. Therefore, it was necessary to use the WRF model to carry out a high spatial resolution numerical simulation of the processes. The WRF model is a mesoscale forecasting model developed by the National Center For Atmospheric Research, the National Oceanic and Atmospheric Administration, and other research departments, which has been widely studied and applied worldwide. There are many parameterization schemes provided by WRF mesoscale models with the depiction of the specific microphysical process, such as the Morrison 2-moment scheme [25]. The Morrison 2-moment scheme is a new, physically based parameterization that is developed for simulating homogeneous and heterogeneous ice nucleation, droplet activation, and the spectral index (width) of the droplet size spectra. This cloud microphysics scheme is commonly used for rainfall simulation.
There are two important core processes in the precipitation process; one is the melting of graupel and snow, and the other is the condensation process. The generalized potential temperature is essentially the thermal state of the atmosphere in the non-uniform saturated state. That is, the atmosphere does not produce condensation when the humidity reaches 100%, but it is still possible to produce condensation when it reaches 70%. Therefore, the generalized potential temperature can directly affect the condensation process, and thus it may indirectly affect the melting process of graupel and snow. The cloud water droplet condensation became the main modification process.
The cloud water droplet condensation rate in the thermodynamic framework of Morrison 2-moment scheme is expressed as Equation (2):
PCD = δ Δ t ( 1 + L v 2 q sw c p r v θ 2 ) 1
where δ′ is supersaturation at the advanced time, q sw is the mixing ratio at water saturation, θ is temperature, Lv is the latent heat of condensation, cp = 1004 J kg−1 K−1 is the constant pressure specific heat of dry air, and rv = 287.05 J kg−1 K−1 is the gas constant of dry air.
The application of non-uniform saturation theory is θ in the formula and is replaced by θ Gao (Equation (3)):
PCD = δ Δ t ( 1 + L v 2 q sw c p r v ( θ exp [ L v 0 q s c p T ( q v q s ) k ] ) 2 ) 1
Replacing the temperature variable in the cloud droplet condensation rate equation with the generalized potential temperature considering a non-uniform saturated atmosphere allows the cloud droplet condensation process to consider the unsaturated atmosphere as well as the condensation process, thus participating in influencing the thermal characteristics of the atmosphere [26]. The altered condensation process impacts the distribution of water vapor and liquid water, subsequently influencing relative humidity. The existence of convection within clouds induces drastic phase changes, thereby affecting the distribution of ice-phase particles. The phase transformations of ice-phase particles are crucial cloud microphysical processes during heavy rainfall events, impacting not only raindrops but also the release of latent heat, ultimately altering precipitation amounts.

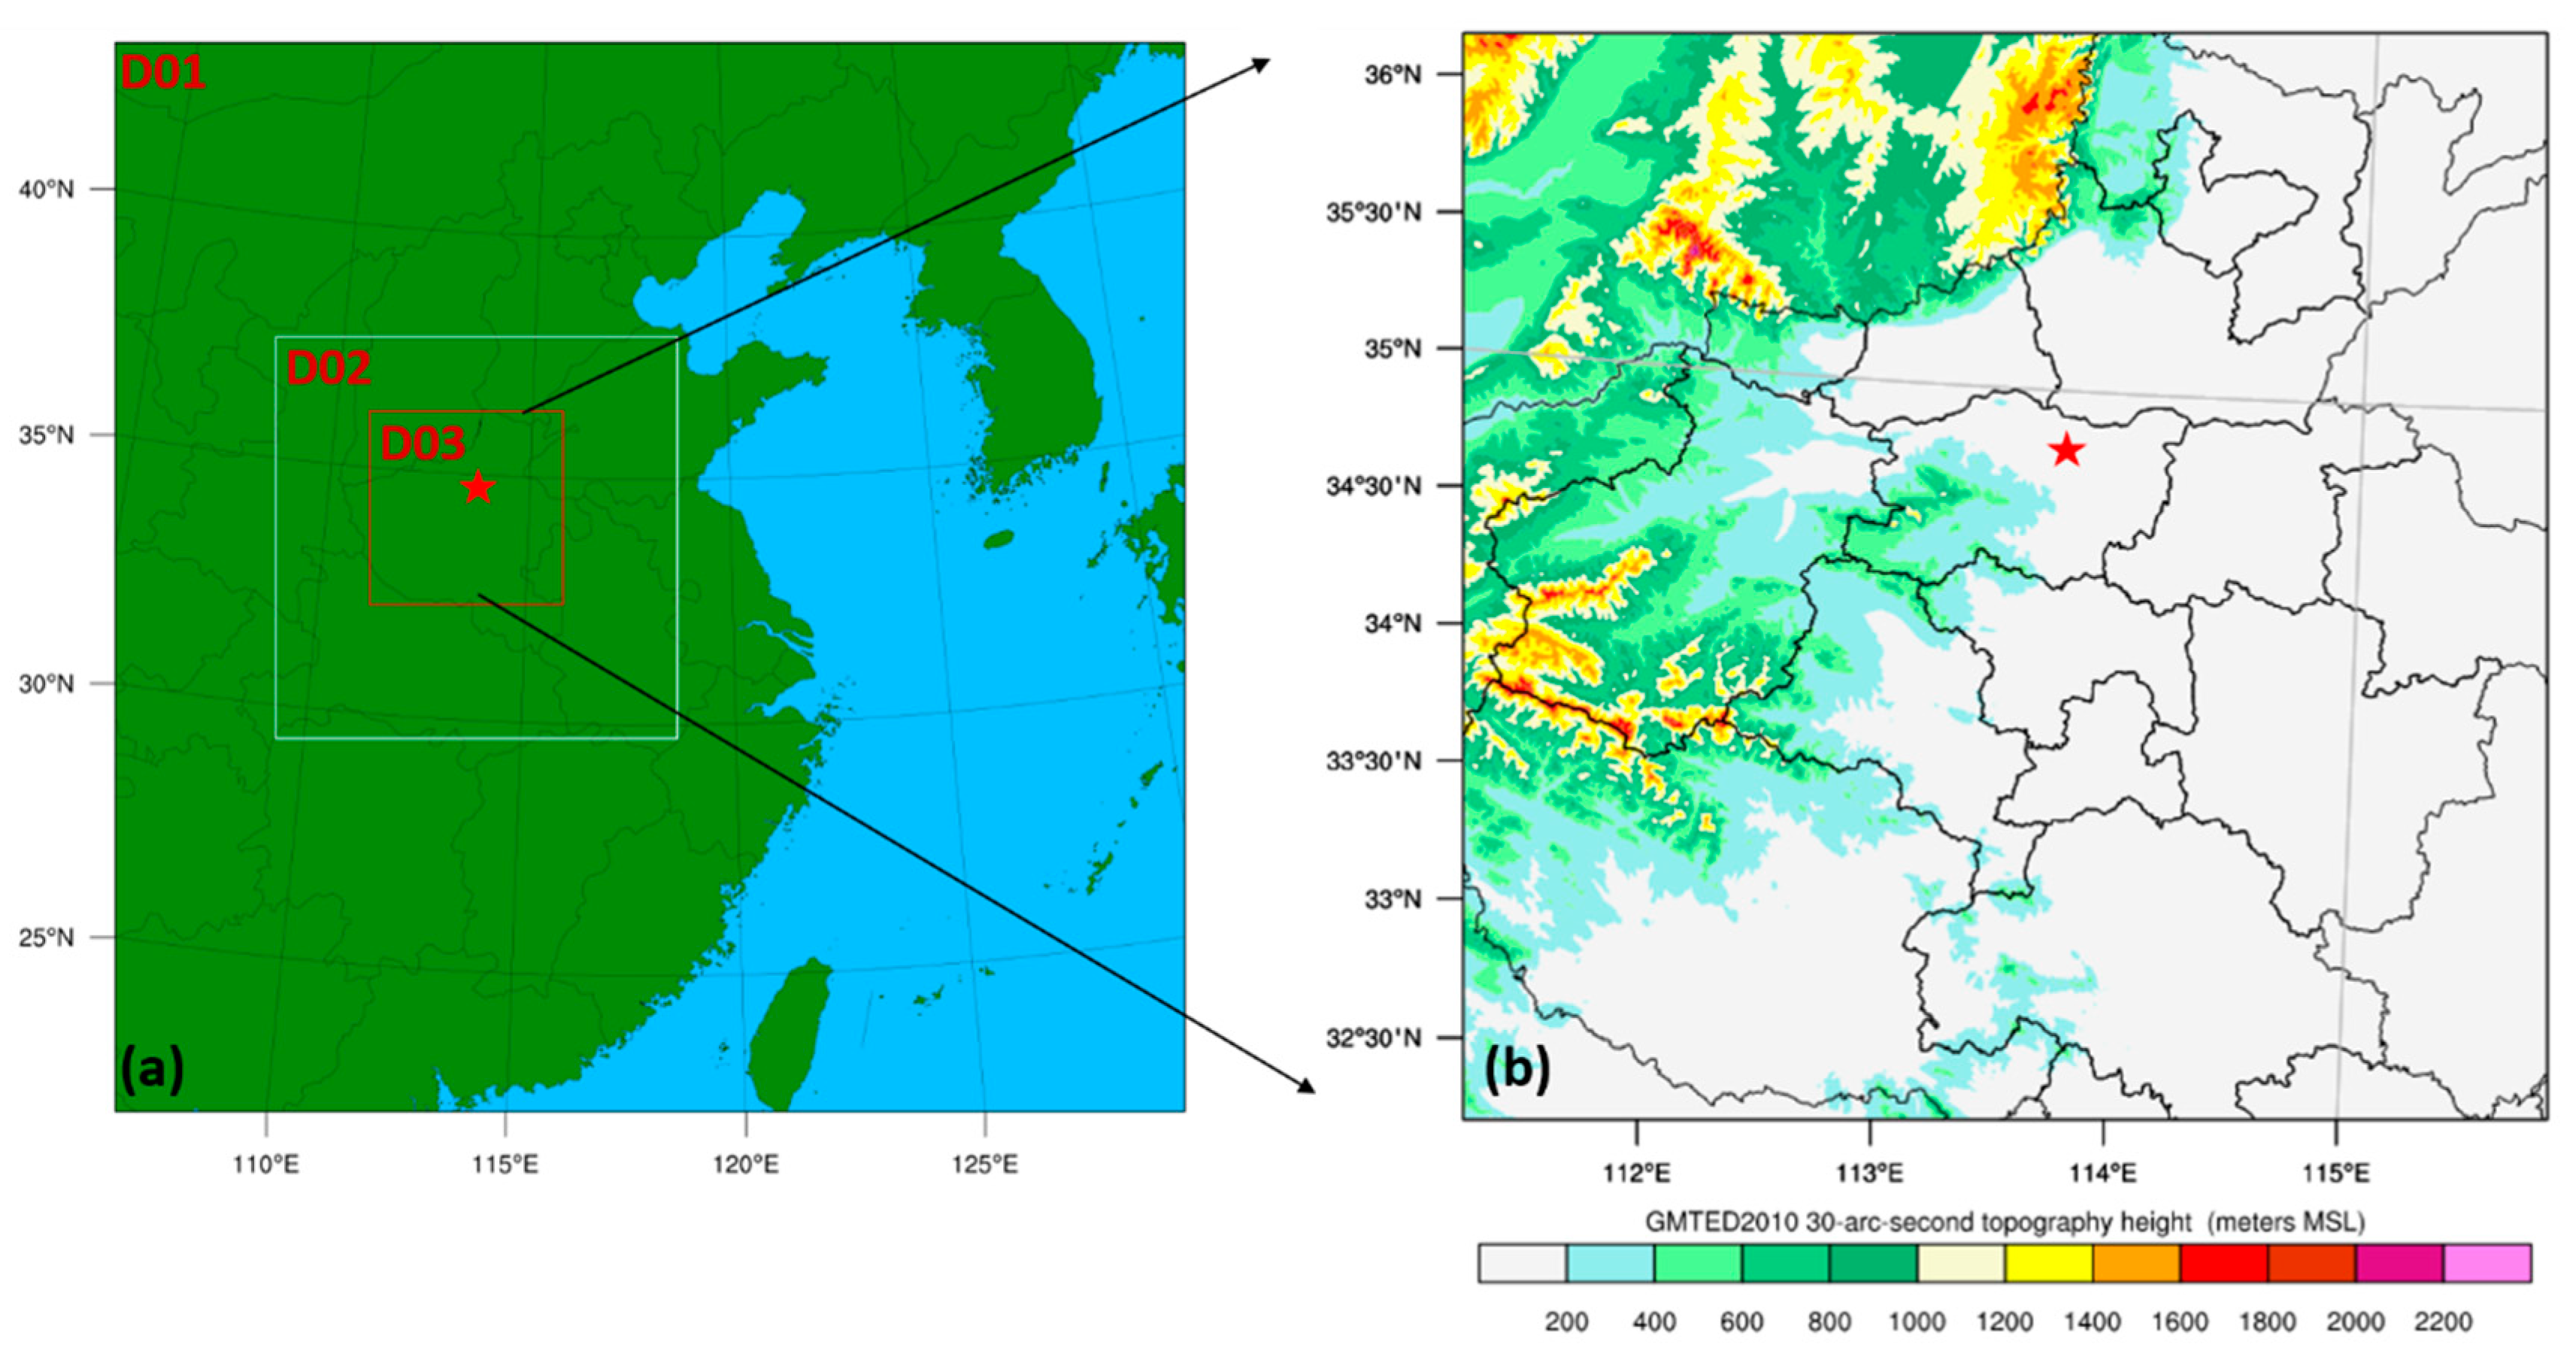
3.3. Model Experiment Design

The mesoscale model WRFV4.2-ARW was used to numerically simulate the intense precipitation process over Zhengzhou. Due to the presence of dry and cold air intrusion over Zhengzhou, rapid supersaturation was produced, leading to the formation of extreme rain intensity in Zhengzhou. A comparative study considers the effect of the non-uniform saturation theory on the extreme rain intensity of the Zhengzhou rainstorm, as shown in Table 1. The main modification is the condensation function because the generalized potential temperature in an atmosphere with non-uniform saturation that includes the condensation process is based on observational facts. The design of the remainder of both experiments was consistent, as shown in Table 1.
The simulation area of the WRF model was nested in three layers (Figure 4a). Domain 1 (D01) and domain 2 (D02) were bidirectionally nested, while domain 3 (D03) was one-way downscaled due to computing ability. The spatial resolution was set to 3 km, 1 km, and 333 m, respectively. The horizontal girds were set to (800, 800), (901, 901), and (1303, 1303), respectively. The vertical levels were set to 51. The time steps for integration were all 6 s. The model’s valid period was from 00:00 UTC on 19 July 2021 to 00:00 UTC on 21 July 2021. The output time interval was set to 10 min. The three-dimensional atmospheric initial conditions in the model and the time-dependent boundary conditions were from the ERA5 data at a spatial resolution of 0.25° × 0.25°. The cloud microphysical scheme selected for the model was the Morrison 2-moment scheme. In addition, the RRTM scheme was used for longwave radiation, the Dudhia scheme for shortwave radiation, and the MM5 Monin–Obukhov scheme for the planetary boundary layer. The Morrison 2-moment scheme includes the mixing ratios of five water substances: cloud water, rain, cloud ice, snow, and graupel.
In the numerical simulation experiments conducted in this study, the spectral nudging relaxation approximation was used [27]. This four-dimension data assimilation method performs filtering by setting the number of waves, filtering out high-frequency waves larger than this number in space, and retaining the large-scale fluctuations. This fraction of large-scale fluctuations is added to the forecast field of the model according to a certain weighting. Thus, the simulation state can be kept close to the large-scale driving state, and the large-scale error can be better reduced. The model variables are free to develop central-scale processes while responding to smaller-scale properties [28]. The wave number set in the four-dimension data assimilation method is wavenumber 6.
Huang et al. [29] found that the terminal velocity of various water condensates differs greatly during the periods of heavy precipitation, which is favorable to the relative motion, aggregation interaction, and transformation between particles. Therefore, improving the representation of the terminal velocity of falling water condensates should improve the simulation. The WRF model was chosen from the falling graupel terminal velocity scheme proposed by Heymsfield and Wright [30] (Equation (4)).
V ( D ) = ( ρ 0 ρ a ) 0.5 α D β
where V(D) denotes the terminal velocity of falling particles with diameter D, ρa is the air density, ρ0 is the ground-level air density, and a and b are parameters that vary with particle shape and size, respectively (in this study, a = 19.3 and b = 0.37).
In order to research the influence of microphysical processes, the quantitative rainwater mass and heat budget of cloud microphysical conversions need to be analyzed. The microphysical conversions of the Morrison 2-moment scheme used in the numerical weather simulations in this paper are shown in the Reference. The phase-change latent heat process was divided into the process of releasing phase-change latent heat to warm the air and the process of absorbing phase-change latent heat to cool the air. According to the method of Hjelmfelt et al. [31] and Guo et al. [32] for calculating the latent heat of phase change, the diabatic heating rate, diabatic cooling rate, and net heating rate can be calculated using the following equations (Equation (5)):
R w = ( L v C p ) × P cond + ( L f C p ) × P frz + ( L s C p ) × P dep R c = ( L v C p ) × P evp + ( L f C p ) × P mlt + ( L s C p ) × P sub R t = R w + R c
Here, Rw is the total latent heat heating rate, Rc is the total latent heat cooling rate, Rt is the net latent heat heating/cooling rate, Lv is the latent heat constant of evaporation and has a value of 2.5 × 10⁶, Lf is the latent heat constant of melting and has a value of 3.34 × 10⁵, Ls is the latent heat constant of sublimation and has a value of 2.8 × 10⁶ (in J kg−1), Cp is the constant pressure specific heat capacity of moist air at room temperature and has a value of 1.007 × 10³ (in J kg−1 K−1), Pcond is the conversion rate of the condensation term, Pfrz is the conversion rate of the freezing term, Pdep is the conversion rate of the condensation term, Pevp is the conversion rate of the evaporation term, Pmlt is the conversion rate of the melting term, and Psub is the conversion rate of the sublimation term (all in kg kg−1 s−1).

4. Model Verification

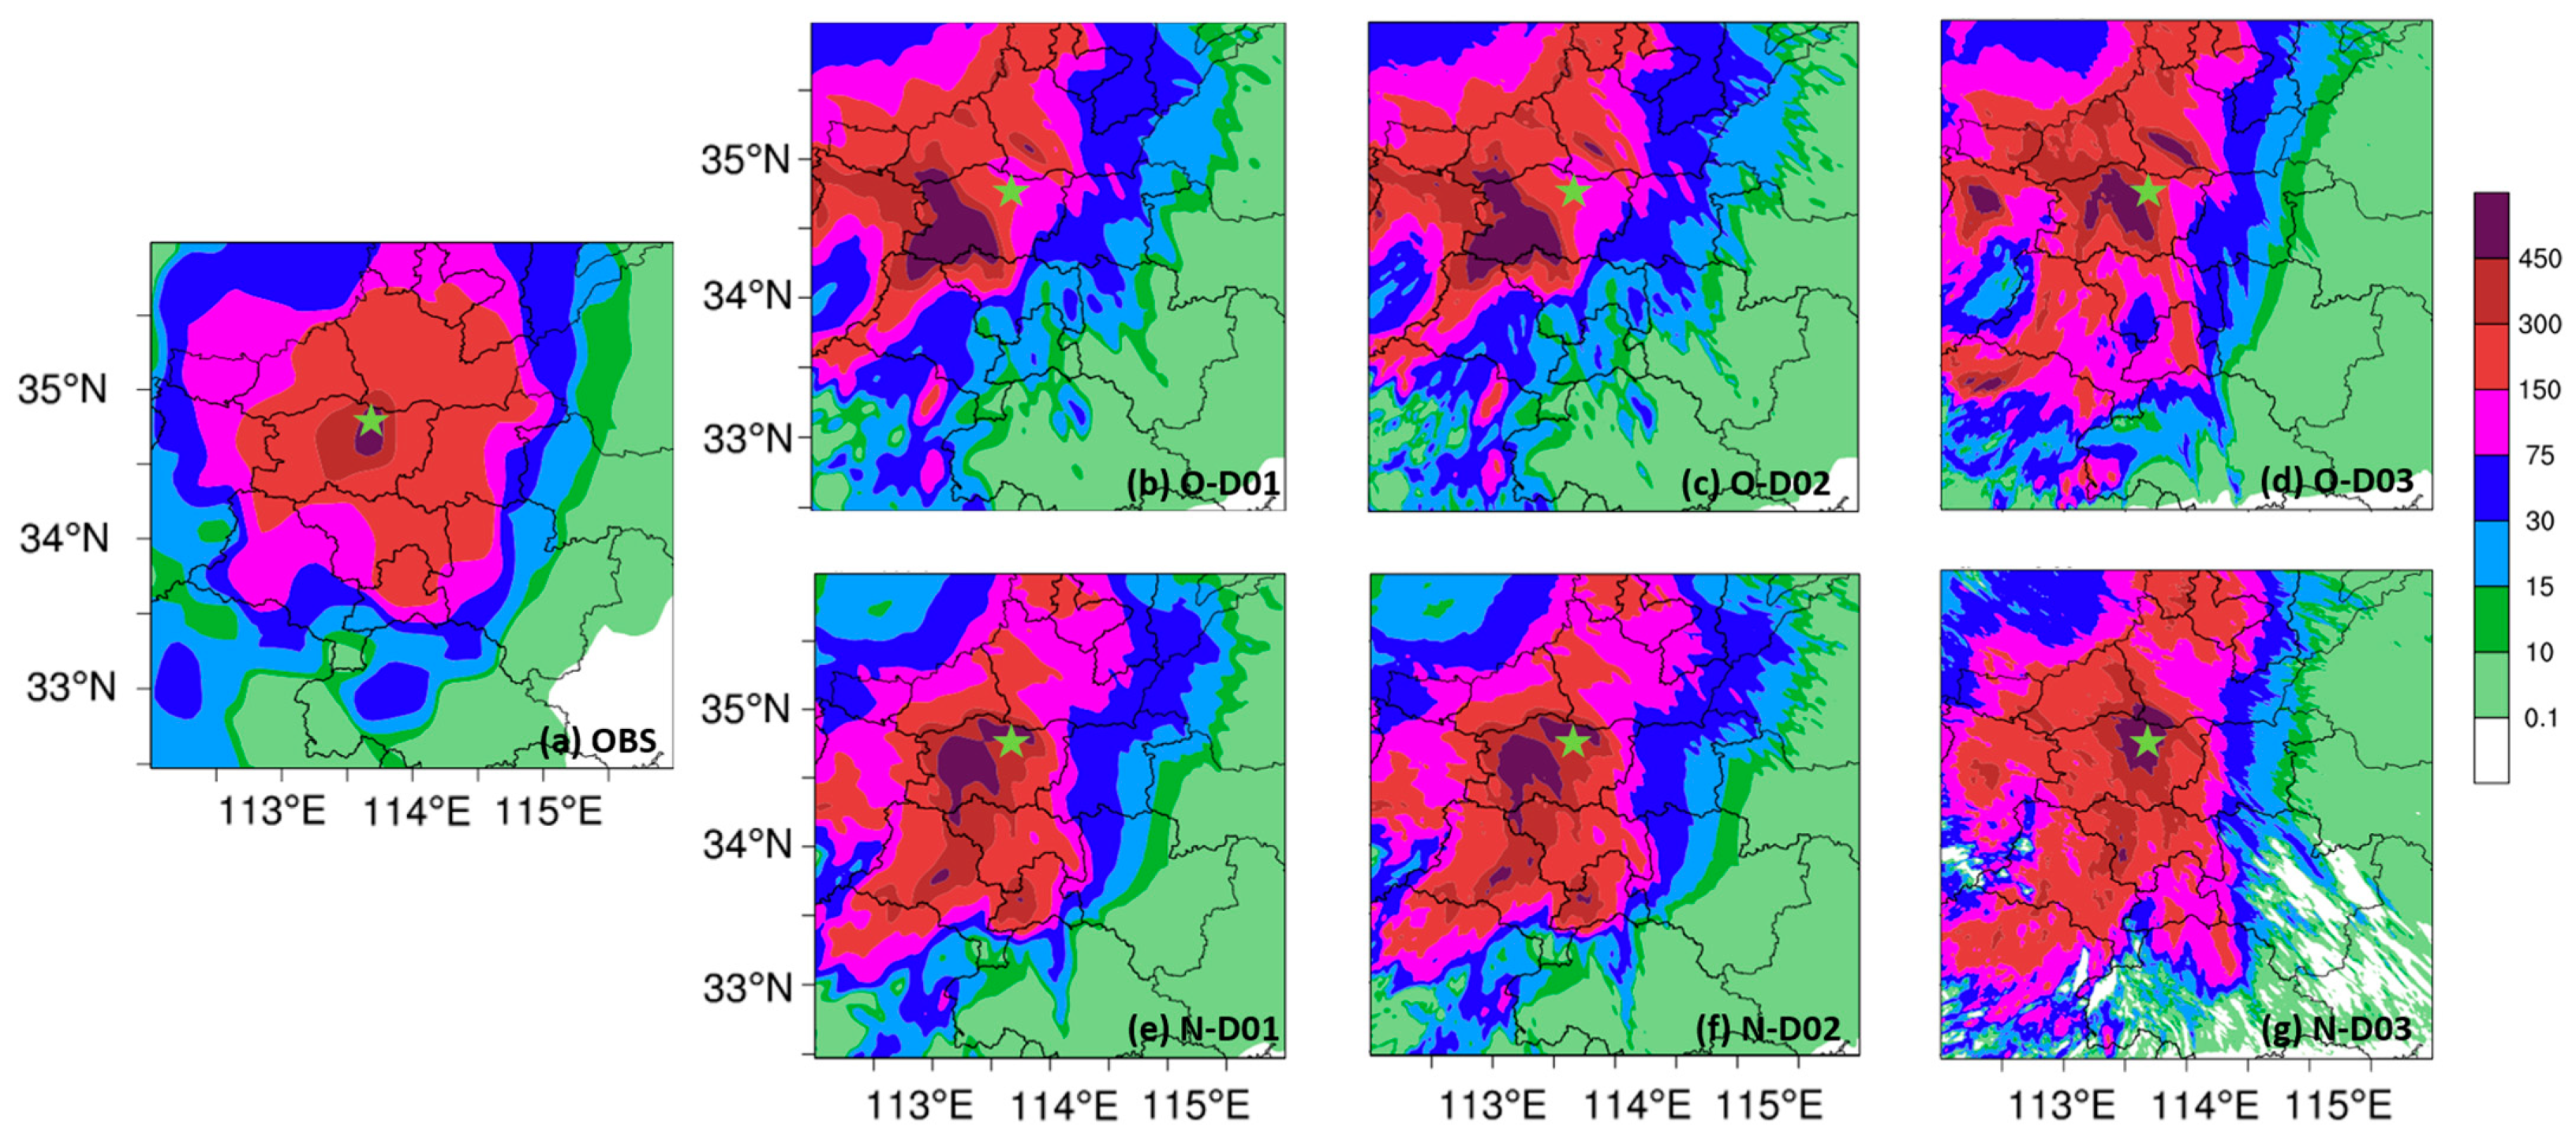
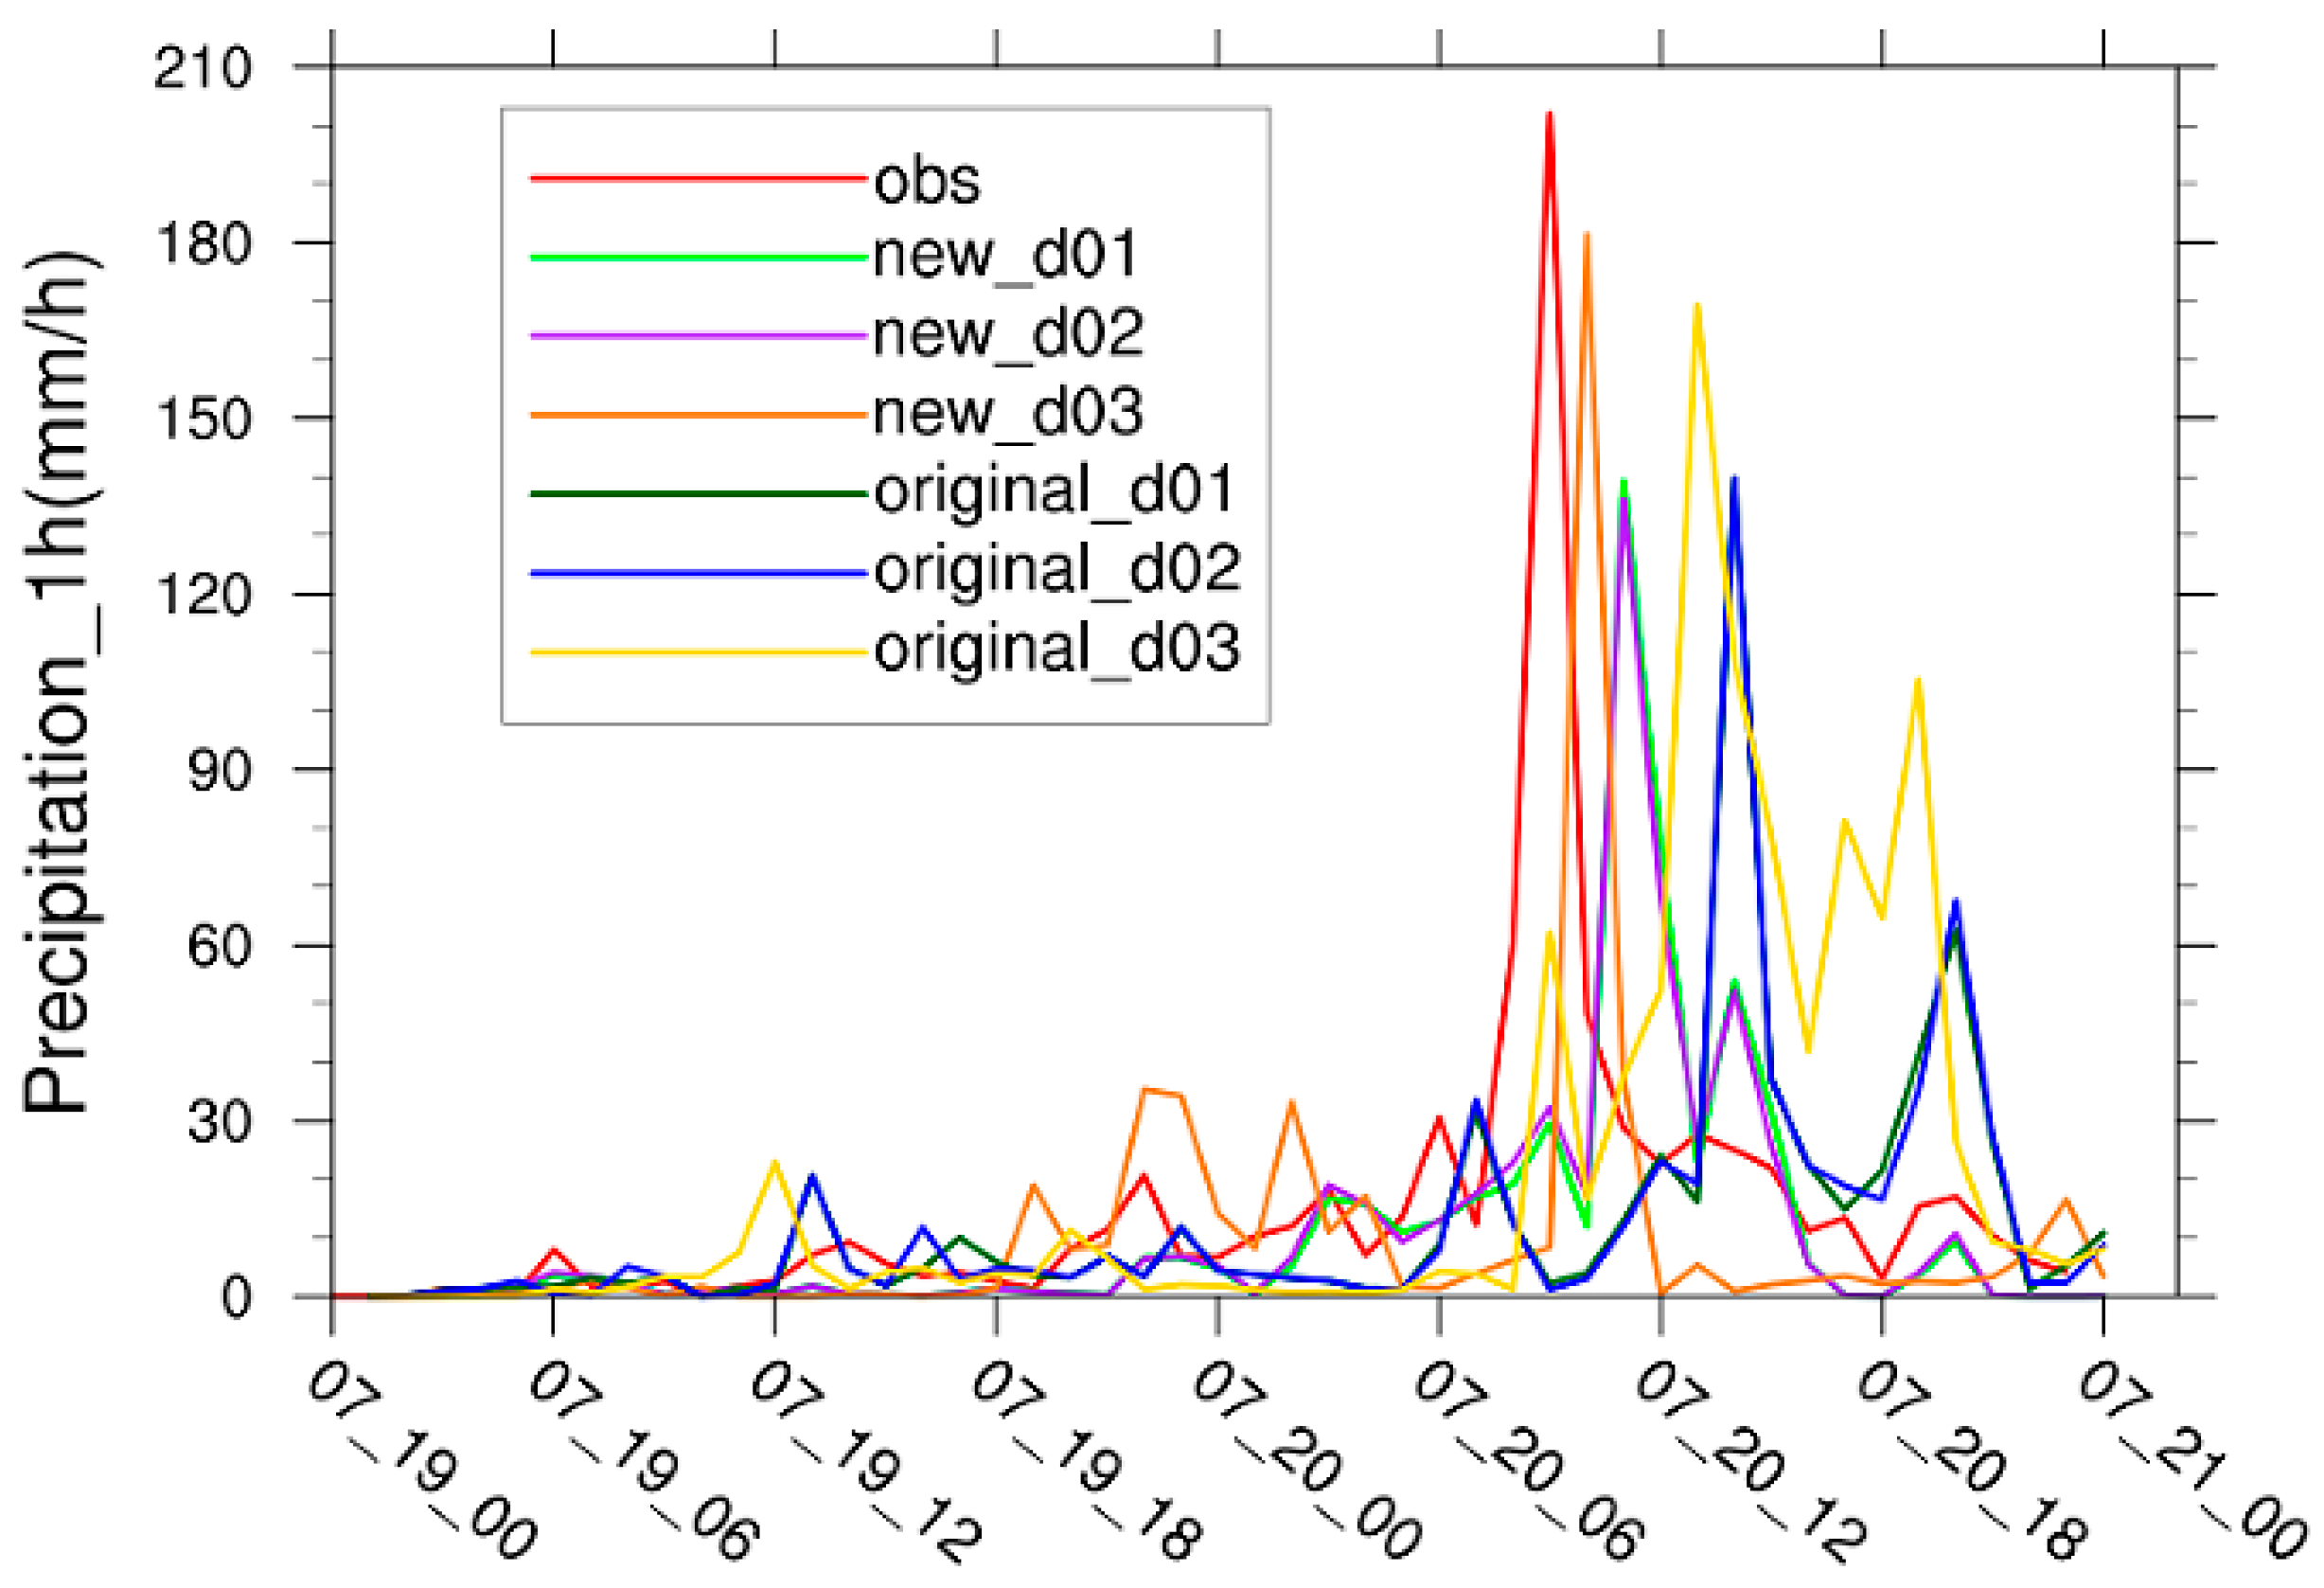
4.1. Verification by Automatic Weather Station

To compare the accuracy of the results of the original and new condensation process parameterization schemes, precipitation fields interpolated from the rainfall data of the National Automatic Weather Station were selected for comparison with the simulated cumulative precipitation fields, as shown in Figure 5. In terms of rainfall intensity, 24 h cumulative precipitation simulations by both the original and the new schemes exceeded the observed rainfall. Between them, the new scheme in D03 simulated the strongest rainfall intensity. In terms of rainfall zone, the rainfall zone simulated by the two schemes in D03 was better respective to D01 and D02. The rainfall zone of the new scheme in D03 was closer to the observations than the original scheme. Table 2 provides quantitative evaluations of the precipitation field for each scheme and resolution. The calculation of RMSE involves interpolating the simulated results to the grid of the observation stations, followed by computing the RMSE between the two two-dimensional fields. As shown in Table 2, it can be found that, as the resolution increased, the mean correlation coefficient also increased and the RMSE decreased. The improvement between D01 and D02 was not significant because the bidirectional feedback was open in WRF design, but D03 had a larger improvement compared to either D01 or D02 because D03 was the one-way nested (Ndown). On the other hand, the new scheme simulated a better precipitation field than the original scheme at the same resolution. To sum up, the observations in the new scheme in D03 had the largest correlation coefficient and the smallest, indicating that this scheme had the most consistent observations compared to other schemes.
To further demonstrate the reliability of the results of the original and the new schemes, the time series of observed hourly precipitation at Zhengzhou station was compared with simulated hourly precipitation for both experiments, as shown in Figure 6. The two schemes in D01 and D02 were more consistent in the variation of single-point precipitation with time owing to the two-way nesting. The results of D03 for the two schemes were better than those of D01 and D02 for the intensity and time of peak precipitation occurrence. The original simulated extreme hourly precipitation peaks in D03 lagged by 4 h and the peak rainfall intensity was 167 mm h−1, which was smaller than the observed peak (201.9 mm h−1). The new simulated extreme hourly precipitation peaks in D03 lagged by 1 h, and the peak rainfall intensity was higher (181 mm h−1). Table 3 provides quantitative evaluations of the station precipitation for each scheme and resolution. As Table 3 shows, it can be found that, as the resolution increased, the correlation coefficient also increased and the RMSE decreased. The new scheme generally simulated better station precipitation than the original scheme at the same resolution. In short, the new scheme in D03 produced the best results.
In summary, the 333 m resolution results in the simulated precipitation fall zone and hourly precipitation peaks were closer to the observations compared with the 3 km and 1 km resolutions. Therefore, the simulation results of the two schemes with 333 m resolutions were selected for comparison in the next paper. The 24 h cumulative precipitation of the original scheme in the D03 simulation was closer to the observations. The precipitation fall zone of the new scheme in the D03 simulation was closer to the observations. The peak rainfall intensity of the new scheme in D03 was also closer to the observed data. A high resolution and condensation process that considers the thermal parameters of non-uniformly saturated atmosphere may be better suited to investigate the physical mechanisms of cloud microphysical processes and mesoscale environmental feedback of extreme hourly rainfall intensity over Zhengzhou for extreme precipitation events.

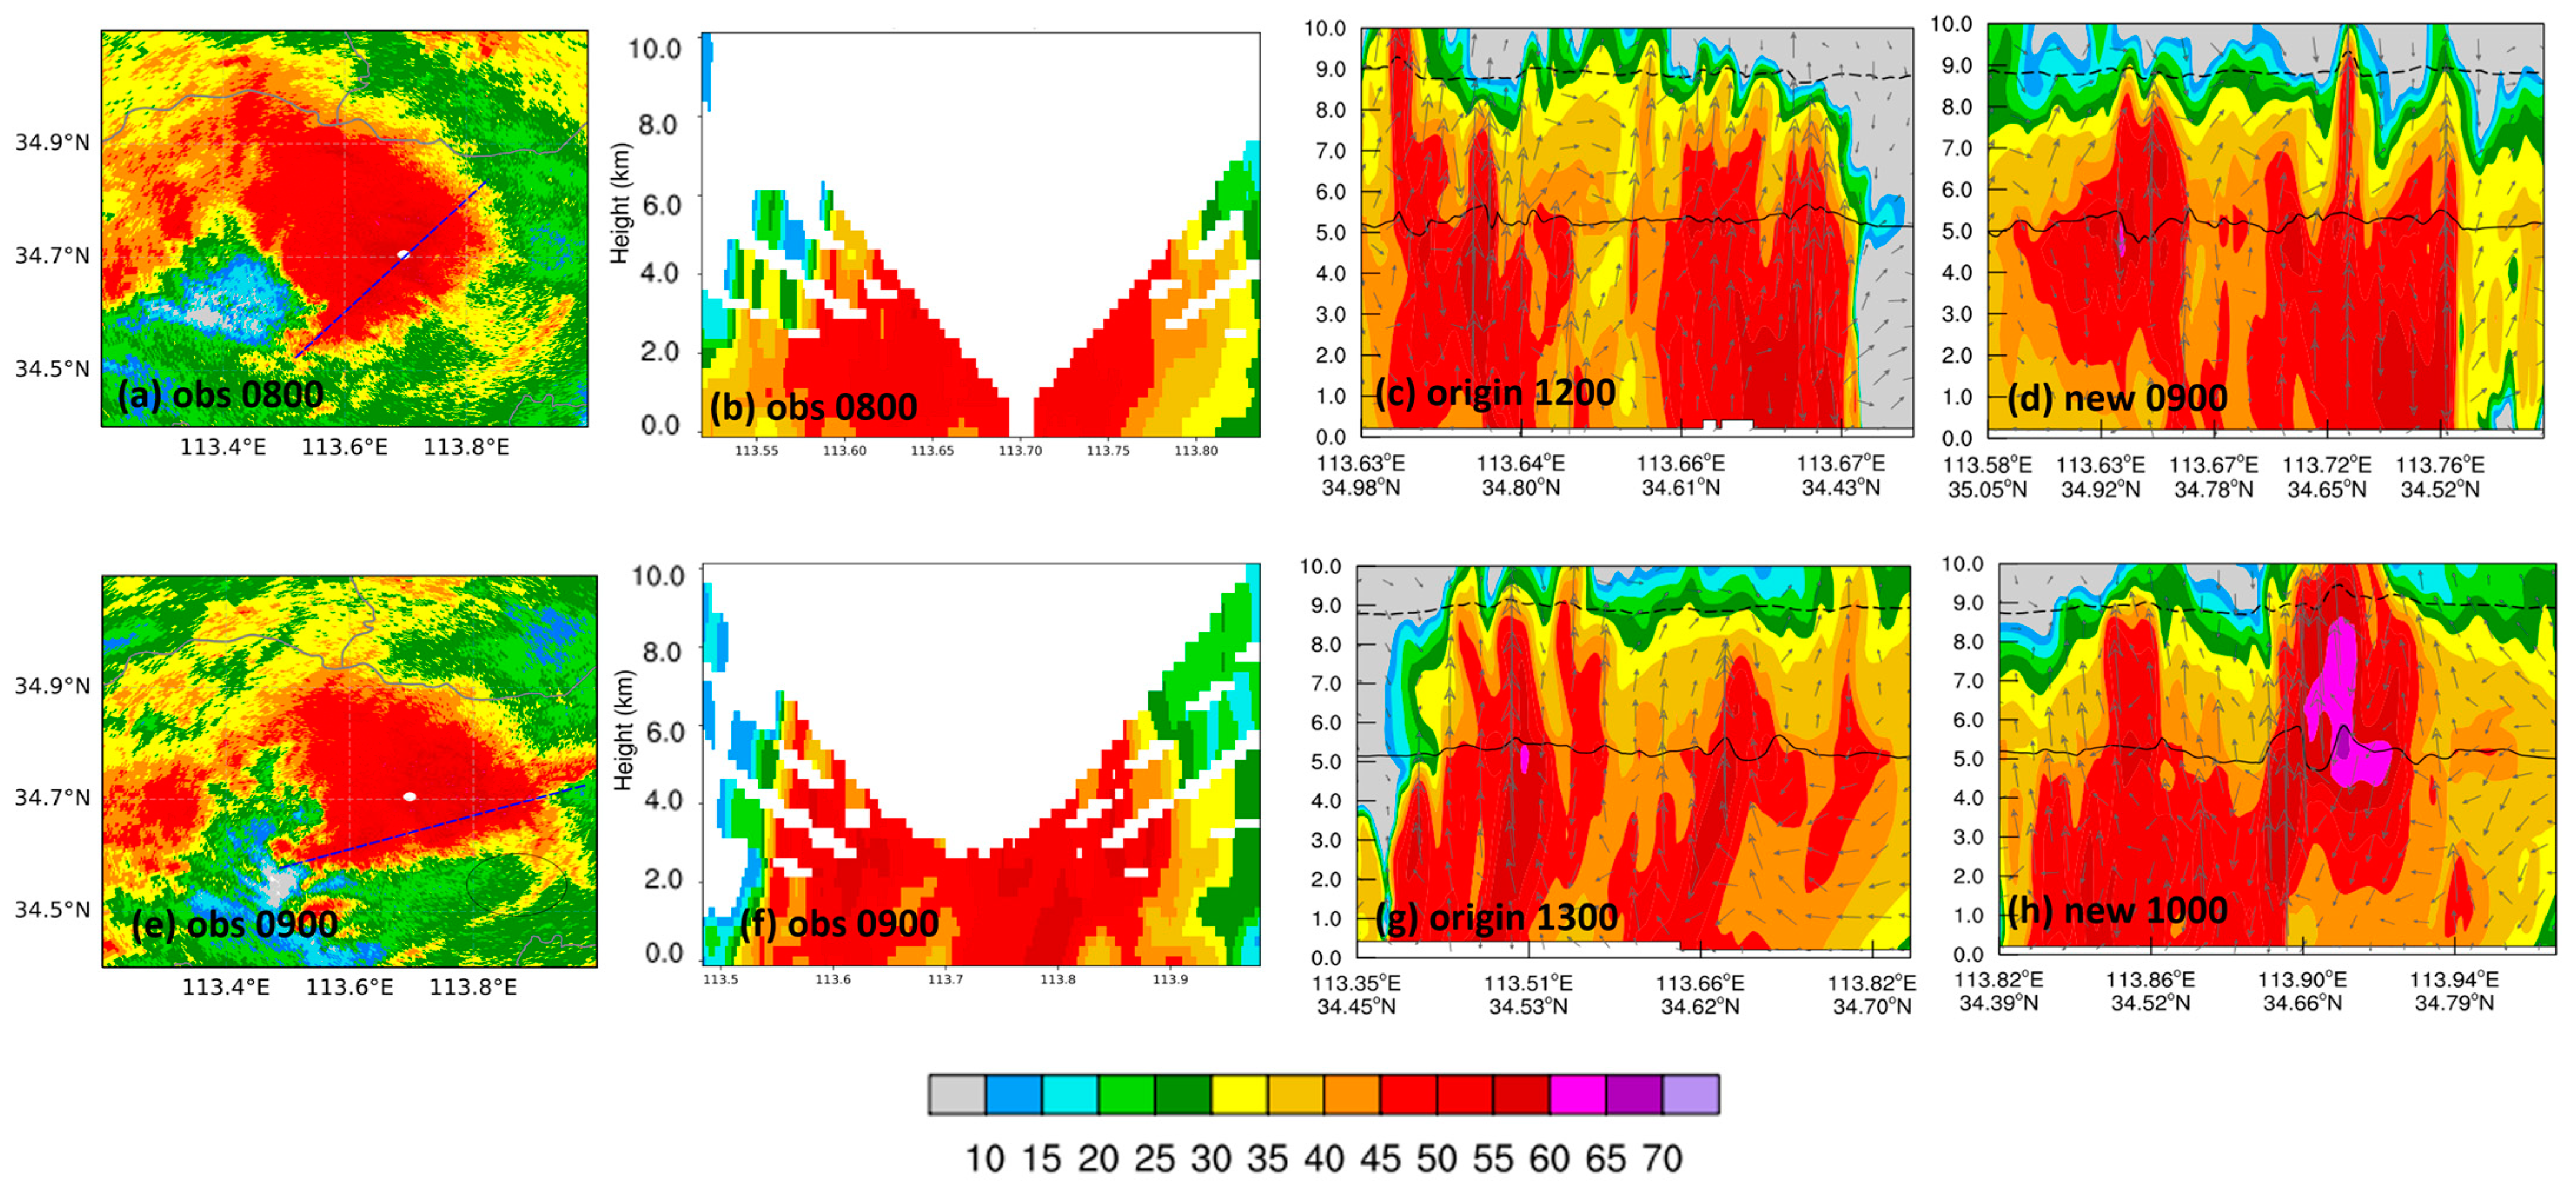
4.2. Verification by Doppler Weather Radar

Doppler weather radar information is playing an increasingly important role in mesoscale numerical weather forecasting. The new generation of Doppler weather radar monitoring network in China has a large number of bands and wavelengths of radar, which can make accurate quantitative precipitation measurements, and observe and warn of thunderstorms, typhoons, and heavy rainfall [33]. In this study, dual-polarization radar in the S-band was applied to investigate the spatial distribution and vertical structure of the extremely heavy rainfall over Zhengzhou. The S-band radial resolutions of the reflectivity factor and velocity field are 1 km and 0.25 km, respectively. The beam width is 1°, and the maximum radius of radar detection is 230 km. Sun [34] found that a 21-h long-lived mesoscale convective vortex was a key system that produced extreme hourly rainfall of 201.9 mm h−1. Therefore, the analysis in this study using observation and simulation results focuses on the development of a convective vortex before and during the occurrence of extreme hourly rainfall intensity, as shown in Figure 7.
The comparative validation of radar observations and simulated horizontal composite reflectivity effectively reveals discrepancies in the location and intensity of convection. The horizontal radar reflectivity is based on the composite reflectivity observed by the Zhengzhou radar station. Quality control measures are taken for ground clutter and isolated echoes when processing the radar observation data to ensure the accuracy of the information. As can be seen from Figure 7a,d, the evolution of radar reflectivity from the observations indicates a strong MCS (Mesoscale Convective System) over Zhengzhou at 08:00 UTC, positioned at 113°–114°E, 34.5°–35°N, with the trend of moving southeast. Multiple strong convection centers (reflectivity greater than 55 dBZ) in MCS. At 09:00 UTC, the MCS was more intense than an hour earlier and the radar reflectivity of the strong convection centers in the MCS was greater than 60 dBZ. Extreme hourly rainfall intensity occurred over Zhengzhou at this time.
From the results in Figure 6, the extreme hourly rainfall intensity peak in the original scheme lagged the observations by 4 h.
It was found that the results from the original model can simulate the mesoscale vortex over Zhengzhou. However, to the southwest of Zhengzhou, there is a strong reflectivity center compared to the radar observations. There are two possible reasons for this discrepancy: (1) As shown in Figure 4b, there are mountains near the southern part of Zhengzhou (33° N, 113° E). Given the mountain-forcing effect that occurs during heavy rainfall in Zhengzhou, the model takes into account the influence of terrain-induced gravity waves, leading to the presence of a strong reflectivity center in the southwest of Zhengzhou. (2) The radar observation represents the composite reflectivity directly above the Zhengzhou station, rather than a networked radar presentation. Thus, it might not effectively capture the radar echoes from the southwest. As the primary focus of this paper is on the mesoscale vortex over Zhengzhou, the reflectivity center in the southwest of Zhengzhou will not be discussed further in the subsequent sections. This paper focused on the occurrence of extreme hourly rainfall, which means that the evolution of radar reflectivity in the original scheme also needed to lag by 4 h for comparison. The evolution of radar reflectivity from the original scheme can also be seen in Figure 7b,e. At 12:00 UTC, the mesoscale convective system that controlled the heavy rainfall, positioned at 113.2°–114° E, 34.3°–35° N, consisted of strong convection centers that were southeast trending. The distribution between strong convection centers was more dispersed. The radar reflectivity of strong convection centers was greater than 55 dBZ. At 13:00 UTC, the strong convection centers continued to move southeast and approached with organized tendency. The maximum reflectivity of strong convection centers exceeded 60 dBZ.
From the results in Figure 6, the evolution of radar reflectivity in the new scheme needed to lag by 1 h for comparison. The evolution of radar reflectivity from the new scheme can also be seen in Figure 7c,f. At 09:00 UTC, the strong MCS, positioned at 113°–114° E, 34.5°–35° N, were southeast trending. The MCS radar reflectivity reached 55 dBZ and had an organized tendency. At 10:00 UTC, the MCS developed to the southeast and was positioned at 113.2°–114.1° E, 34.4°–35° N. The maximum reflectivity of strong convection centers exceeds 65 dBZ, and the range exceeding 60 dBZ is greater than the simulated range of the original scheme at 13:00 UTC.
In summary, the positions of MCS affecting the heavy rainfall with the original scheme and the new scheme were slightly south compared with the radar observations. The shape of the MCS simulated by the new scheme is closer to the observation than the original scheme, as reflected by the more dispersed distribution of strong convection centers in the MCS simulated by the original scheme. The maximum radar reflectivity simulated by the new scheme for the MCS is stronger than that of the original scheme. This aligns with the results in Figure 6, where the peak hourly precipitation simulated by the new scheme surpasses that of the original scheme. Therefore, the results of the two simulations are slightly different from the observations, but there is reliability in the radar reflectivity intensity and positions. The intensity of the radar reflectivity simulated by the new scheme is greater than that of the original scheme.
To further discuss the three-dimensional structure of the MCS affecting the extreme hourly rainfall intensity, an analysis of the MCS profile is required, as shown in Figure 8. Observed radar results have discontinuity in upper levels of profiles. This is because a single-station radar was used. During the interpolation process, there were gaps between the higher elevation angles and the lower ones, leading to internal interpolations of the radar cross-sections. However, this did not affect our judgment about echo conditions in the lower and middle levels. As can be seen in Figure 8b,f, the observed vertical profiles of radar reflectivity indicate that there are two main convection centers in the MCS, and the maximum radar reflectivity reached 50 dBZ at 08:00 UTC. At 09:00 UTC, the intensity of the two strong convection centers in the MCS was enhanced with a maximum radar reflectivity greater than 55 dBZ. However, from the horizontal figure of radar reflectivity in Figure 8e, it can be found pixel points larger than 60 dBZ at the black circles, indicating the presence of radar echoes larger than 60 dBZ within this strong convective system. Due to the absence of high-level data, the upper echo distribution cannot be judged, but it is believed that echoes larger than 60 dBZ should also exist in the echoes.
As can be seen in Figure 8c,g, the vertical profiles of radar reflectivity from the original scheme indicate that the distributions of the two strong convection centers are more independent compared with the observations at 12:00 UTC. The intensity of both strong convection centers was slightly stronger than that of the observations. There was airflow from the left strong convection center into the right strong convection center, which suggested a tendency to organize. At 13:00 UTC, for the left convection center, the maximum radar reflectivity exceeded 60 dBZ and was located at 5 km. For the right strong convection center, the convection development height decreased, and the airflow went into the strong convection center, which produced oblique upward airflow.
As can be seen in Figure 8d,h, the vertical profiles of radar reflectivity from the new scheme were slightly stronger than the observations at 09:00 UTC for the two convection centers, especially the right strong convection center. Both convection centers have strong upward motion from the lower levels to 9 km. At 10:00 UTC, the right convection center that developed was strongly accompanied by strong upward motion up to 10 km and radar reflectivity of more than 65 dBZ at 5 km, which indicted that there were a large number of ice-phase particles melting into the 0 °C layer to form a large number of large raindrops accompanied by downward motion. For the left convection center, downward motion also occurred in the lower levels, while strong upward motion still existed in the upper levels but was not stronger than the right convection center.
In summary, the simulated radar echo intensity in the middle to lower troposphere aligns well with observations. However, due to the limitations of the single-station radar, the mid-to-upper levels do not effectively display the radar echo conditions. However, based on the composite radar reflectivity display, there are pixel points within the radar echo center over Zhengzhou that exceed 60 dBZ. At the time of extreme hourly heavy rainfall occurrence, the simulated radar reflectivity in both schemes exceeded 60 dBZ, but the intensity of the new scheme echo (at 10:00 UTC) was stronger than that of the original scheme echo (at 13:00 UTC). In addition, upward motion corresponding to the strongest convection center of the new scheme was also stronger than that of the original scheme, indicating that these results are consistent with the finding that the peak of hourly rainfall intensity in the new scheme is stronger than that in the original scheme in Figure 6.
Comparing the observations and simulations of precipitation and radar reflectivity, both simulation results show the characteristics of MCS development occurring. The position of the MCS development simulated by the original scheme is close to the observations, but the occurrence of extreme rainfall intensity is lagged by 4 h and the hourly rainfall intensity is insufficient. The new scheme simulated a stronger MCS with a stronger extreme hourly rainfall intensity and only 1 h lag. And the new scheme simulates the shape and position of the MCS closer to the observation. These results were beneficial for this study, allowing it to investigate the relationship between the enhancement of the MCS during the occurrence of extreme hourly rainfall intensity and feedback from cloud microphysical processes and the mesoscale environment, as well as the effect on the enhancement of extreme rainfall intensity considering atmospheric non-uniform saturation.

5. Mesoscale Environment and Cloud Microphysical Features of Extreme Rainfall Intensity

Figure 7 shows that the extreme hourly rainfall intensity of this heavy precipitation case over Zhengzhou was mainly caused by the organization and development of MCS, which itself could have been significantly influenced by feedback of cloud microphysical processes [15]. This is because cloud microphysical processes can affect the thermodynamics and mesoscale environment of a convective system. Therefore, this section is divided into two main parts. First, the vertical thermodynamic structures before and during the occurrence of extreme hourly rainfall intensity are discussed. Then, the vertical distribution of liquid and ice particles before and during the occurrence of extreme hourly rainfall intensity is described, which is then used to analyze the cloud microphysical features of the MCS.

5.1. Mesoscale Environment of Extreme Rainfall Intensity

There is a link between the organizational development of an MCS and positive feedback between micro-physical processes and the mesoscale environment during extreme hourly rainfall intensity. Thermal change characteristics within clouds are a visual reflection of cloud microphysical processes in response to mesoscale environmental feedback because of latent heat change from the phase-change process.
Figure 9 shows vertical profiles of the spatial and temporal evolution of the perturbation potential temperature and wind field simulated by the original and the new schemes before and during extreme hourly rainfall intensity. It can be seen that the mesoscale thermal environment of the MCS simulated by the two schemes has some similar characteristics. The heating zone is within an altitude of 5–10 km, and a large-value zone of upward motion corresponds to the center of the positive perturbation potential temperature, which indicates that lower-level water vapor is rising by upward motion, leading to condensation/deposition and the release of latent heat. Negative perturbation potential temperature centers at the lower levels (1–5 km) correspond to downward motion, which indicates the formation of cold pools owing to heat absorption due to evaporation of precipitation. An upper-level heating zone as well as lower-level cold pools can increase the instability energy of the environment, which is good for the development of convection.
However, the mesoscale thermal environment of the MCS simulated by the two schemes has some different characteristics. The simulated heating zone and cold pools of the new scheme are stronger than those in the original scheme during the occurrence of extreme hourly rainfall intensity, which indicates that the intensity of MCS simulated by the new scheme is greater than that of the original scheme. Especially the comparison of the original scheme at 13:00 and the new scheme at 10:00, there is a strong positive perturbation potential temperature near the −20 °C isotherm in the new scheme, indicating the presence of severe phase change and latent heat release at that height. This causes the temperature in the cloud environment to increase, resulting in enhanced buoyancy and stronger upward motion within the cloud due to the feedback of microphysical conversion processes. This is also clearly reflected in Figure 9d.
In summary, Figure 9 shows that the condensation function considering generalized potential temperature leads to stronger latent heat release, the higher height for the release of latent heat, and stronger cold pools in the MCS. This mesoscale environment is more favorable to the development of convection. This is because latent heat is not released in the unsaturated air in the original scheme. In the new scheme, the non-uniform saturation theory considers the latent heat release that may occur in the transition region between unsaturated and saturated air within the thermodynamic equations, resulting in the greater release of latent heat. This enhanced release of latent heat can provide feedback to the cloud microphysical processes within the cloud, thereby affecting precipitation efficiency.

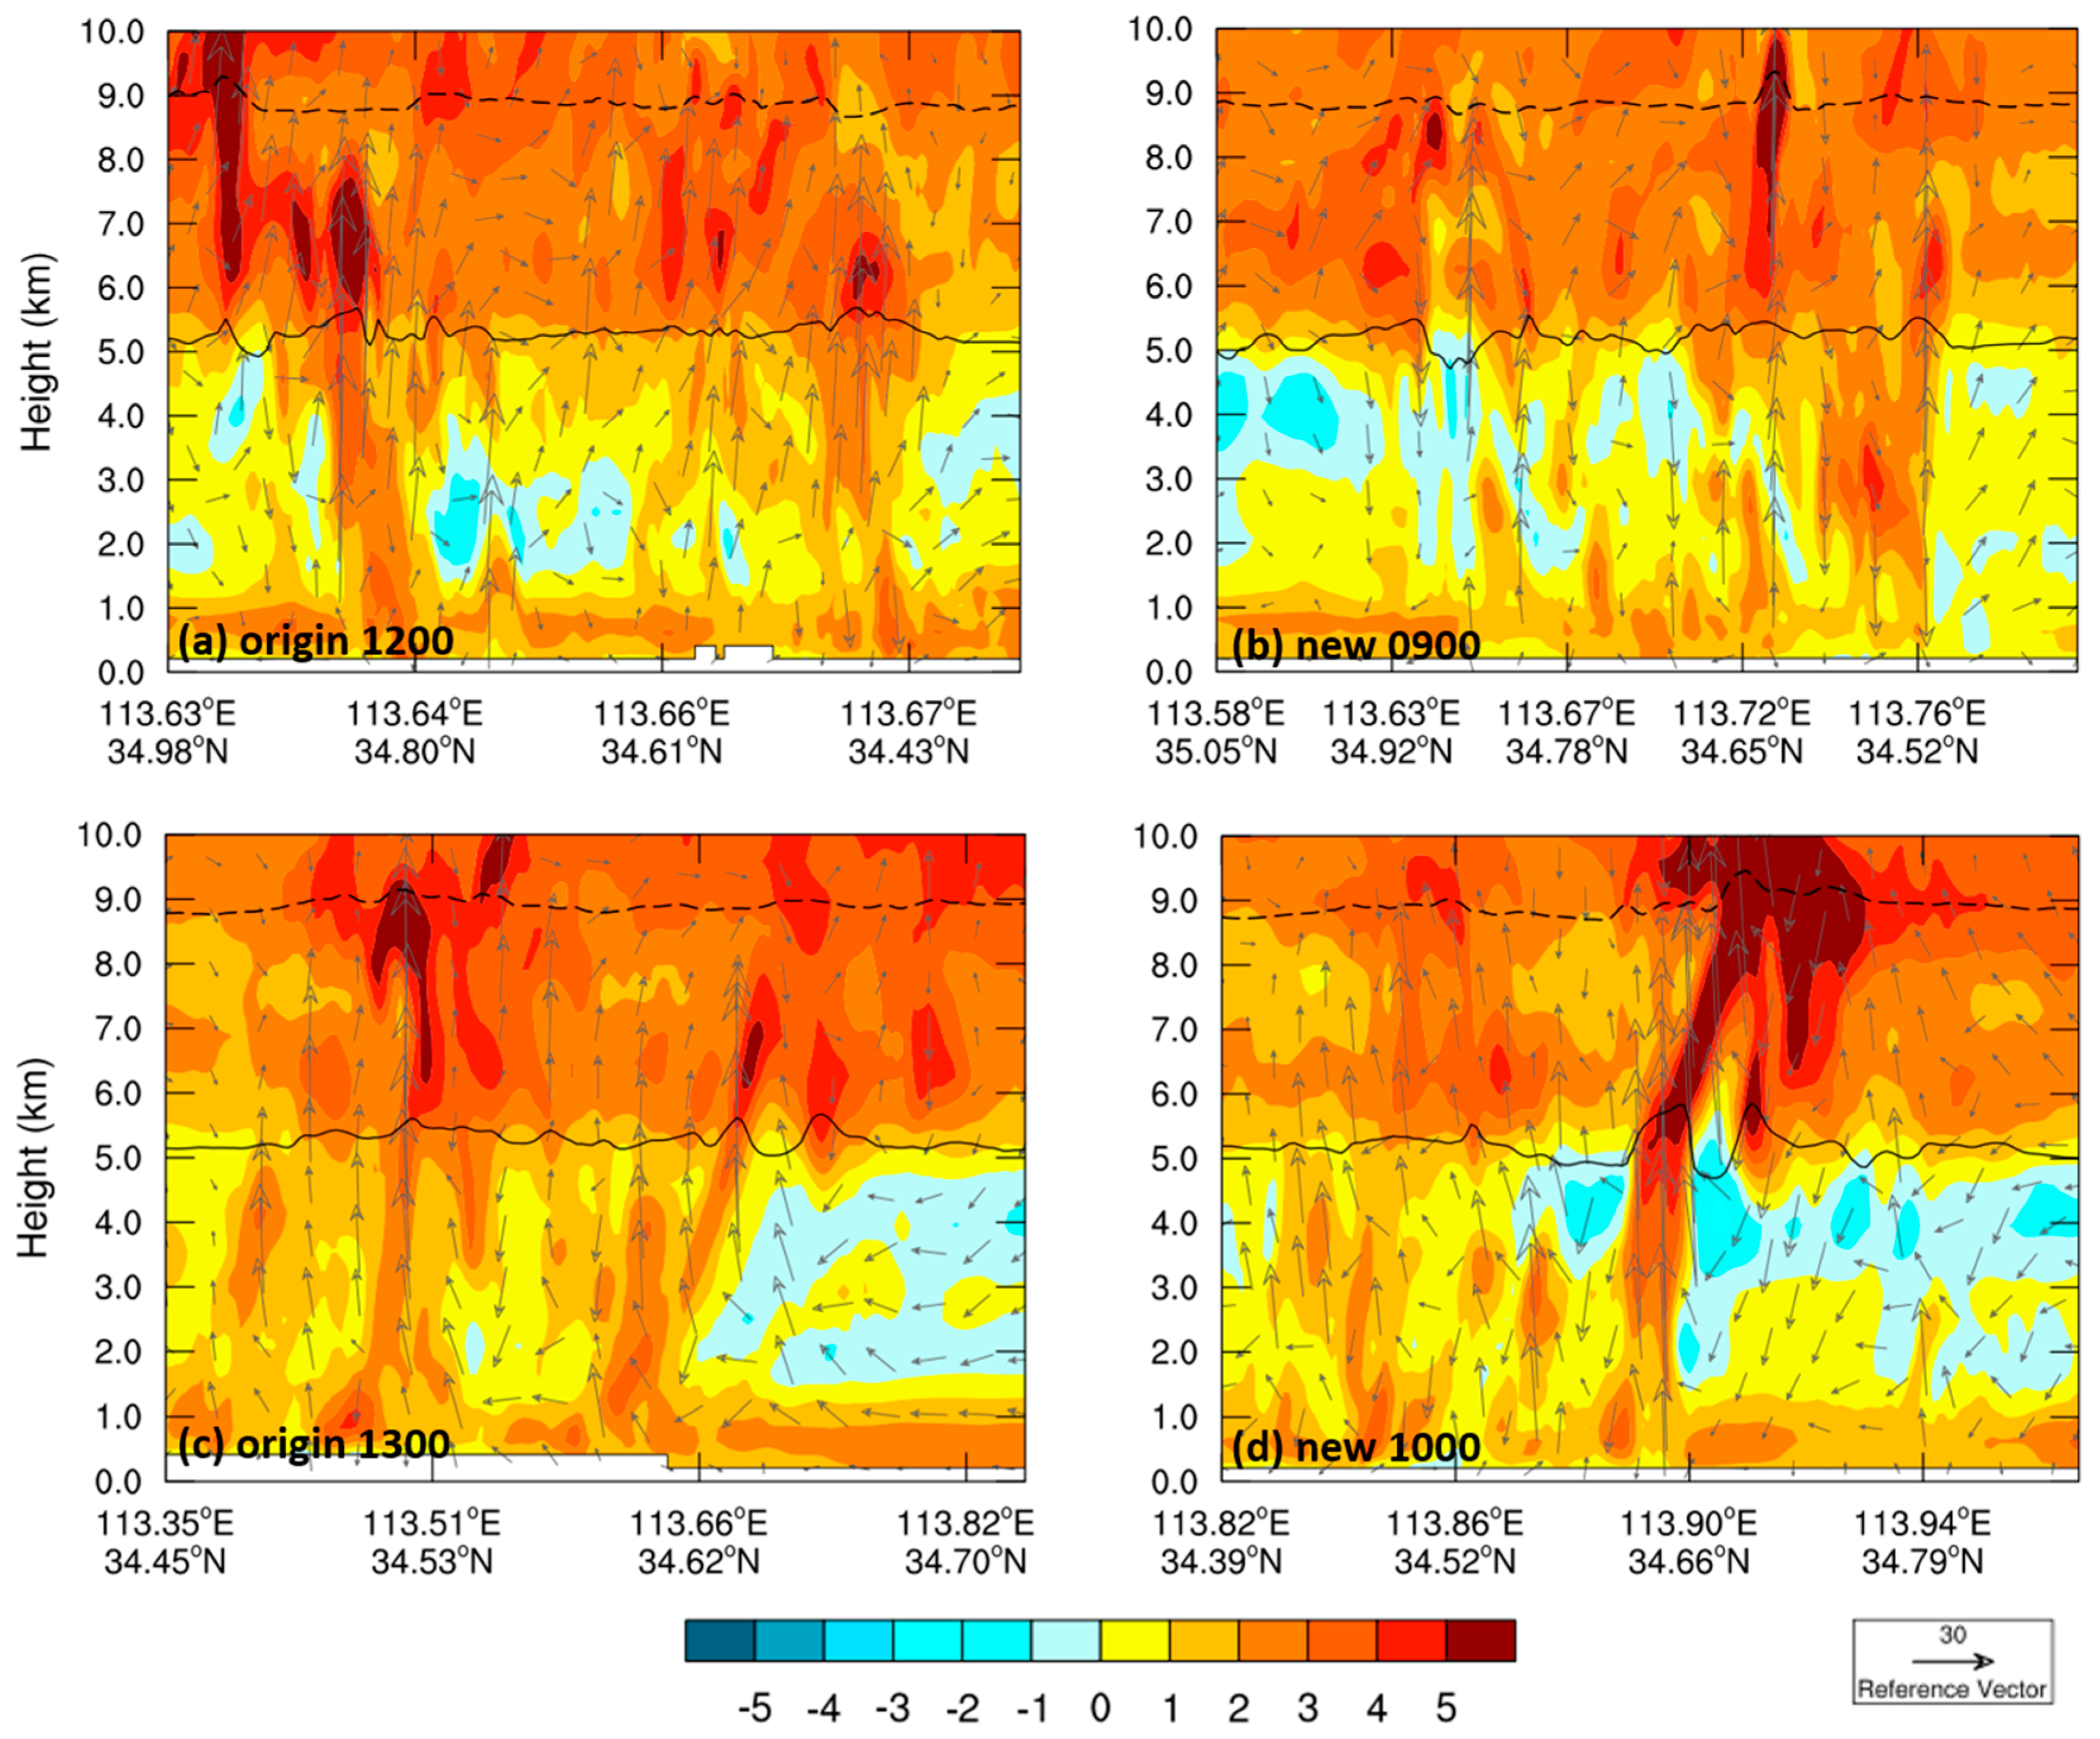
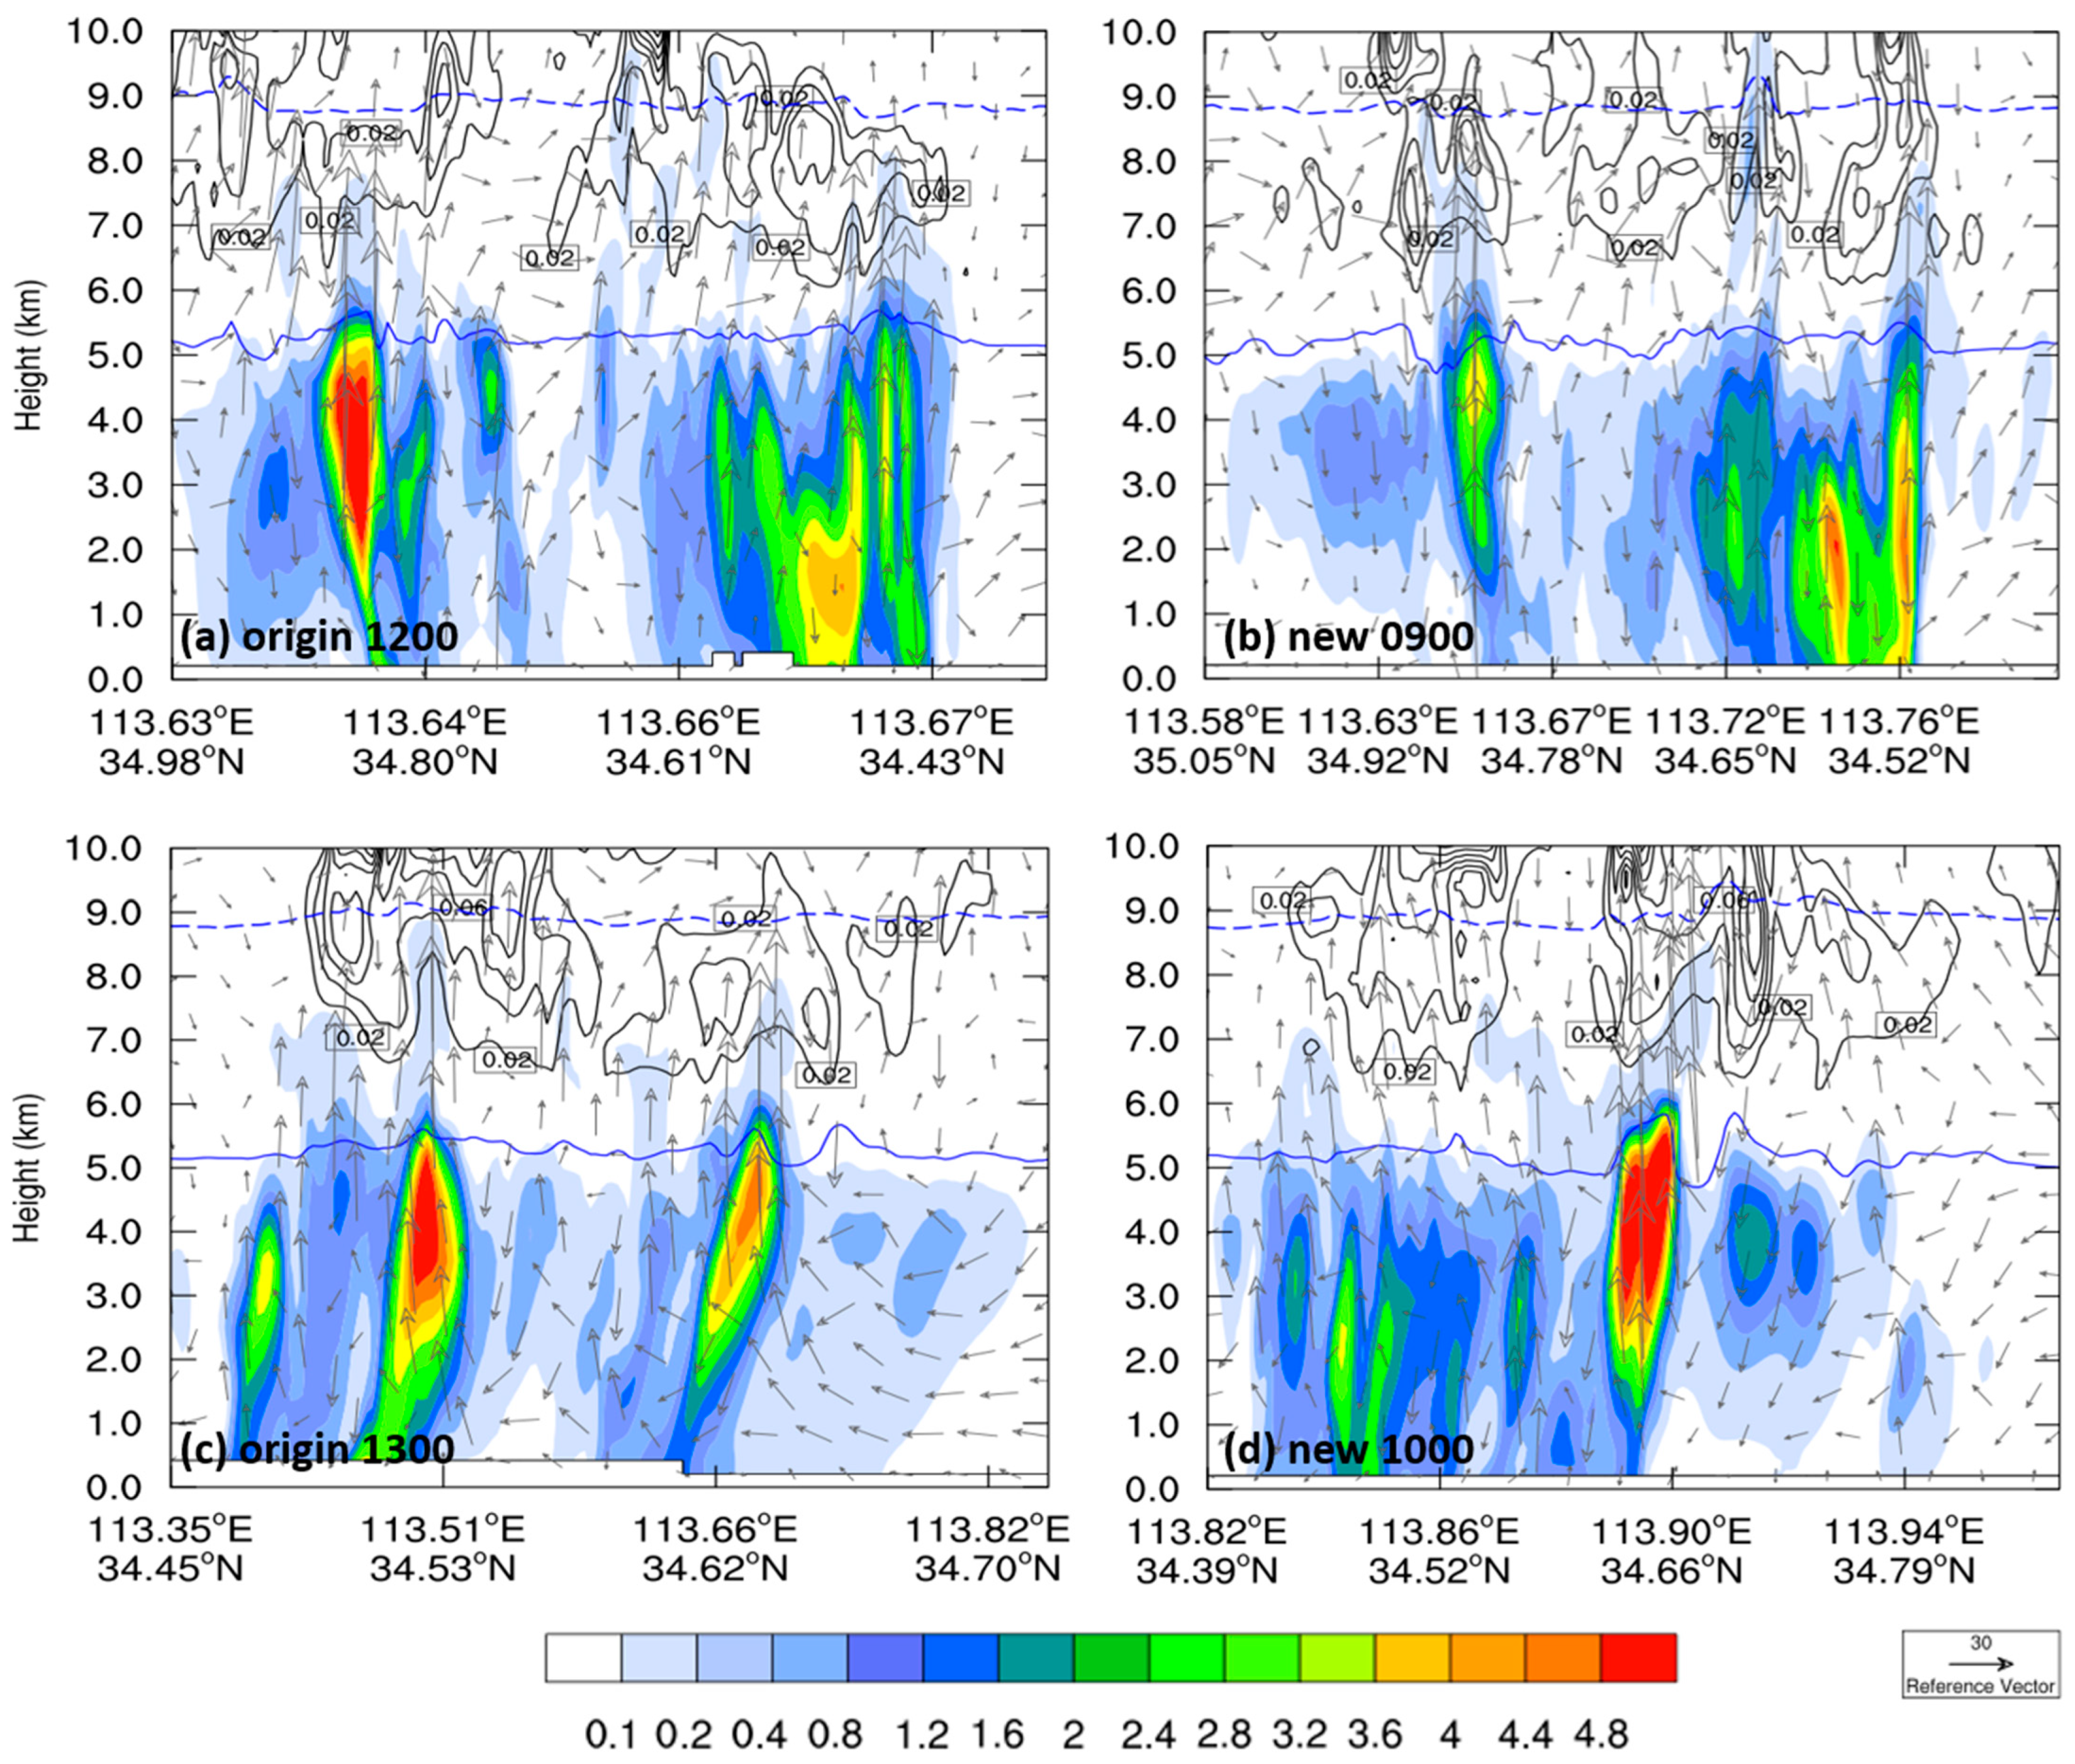
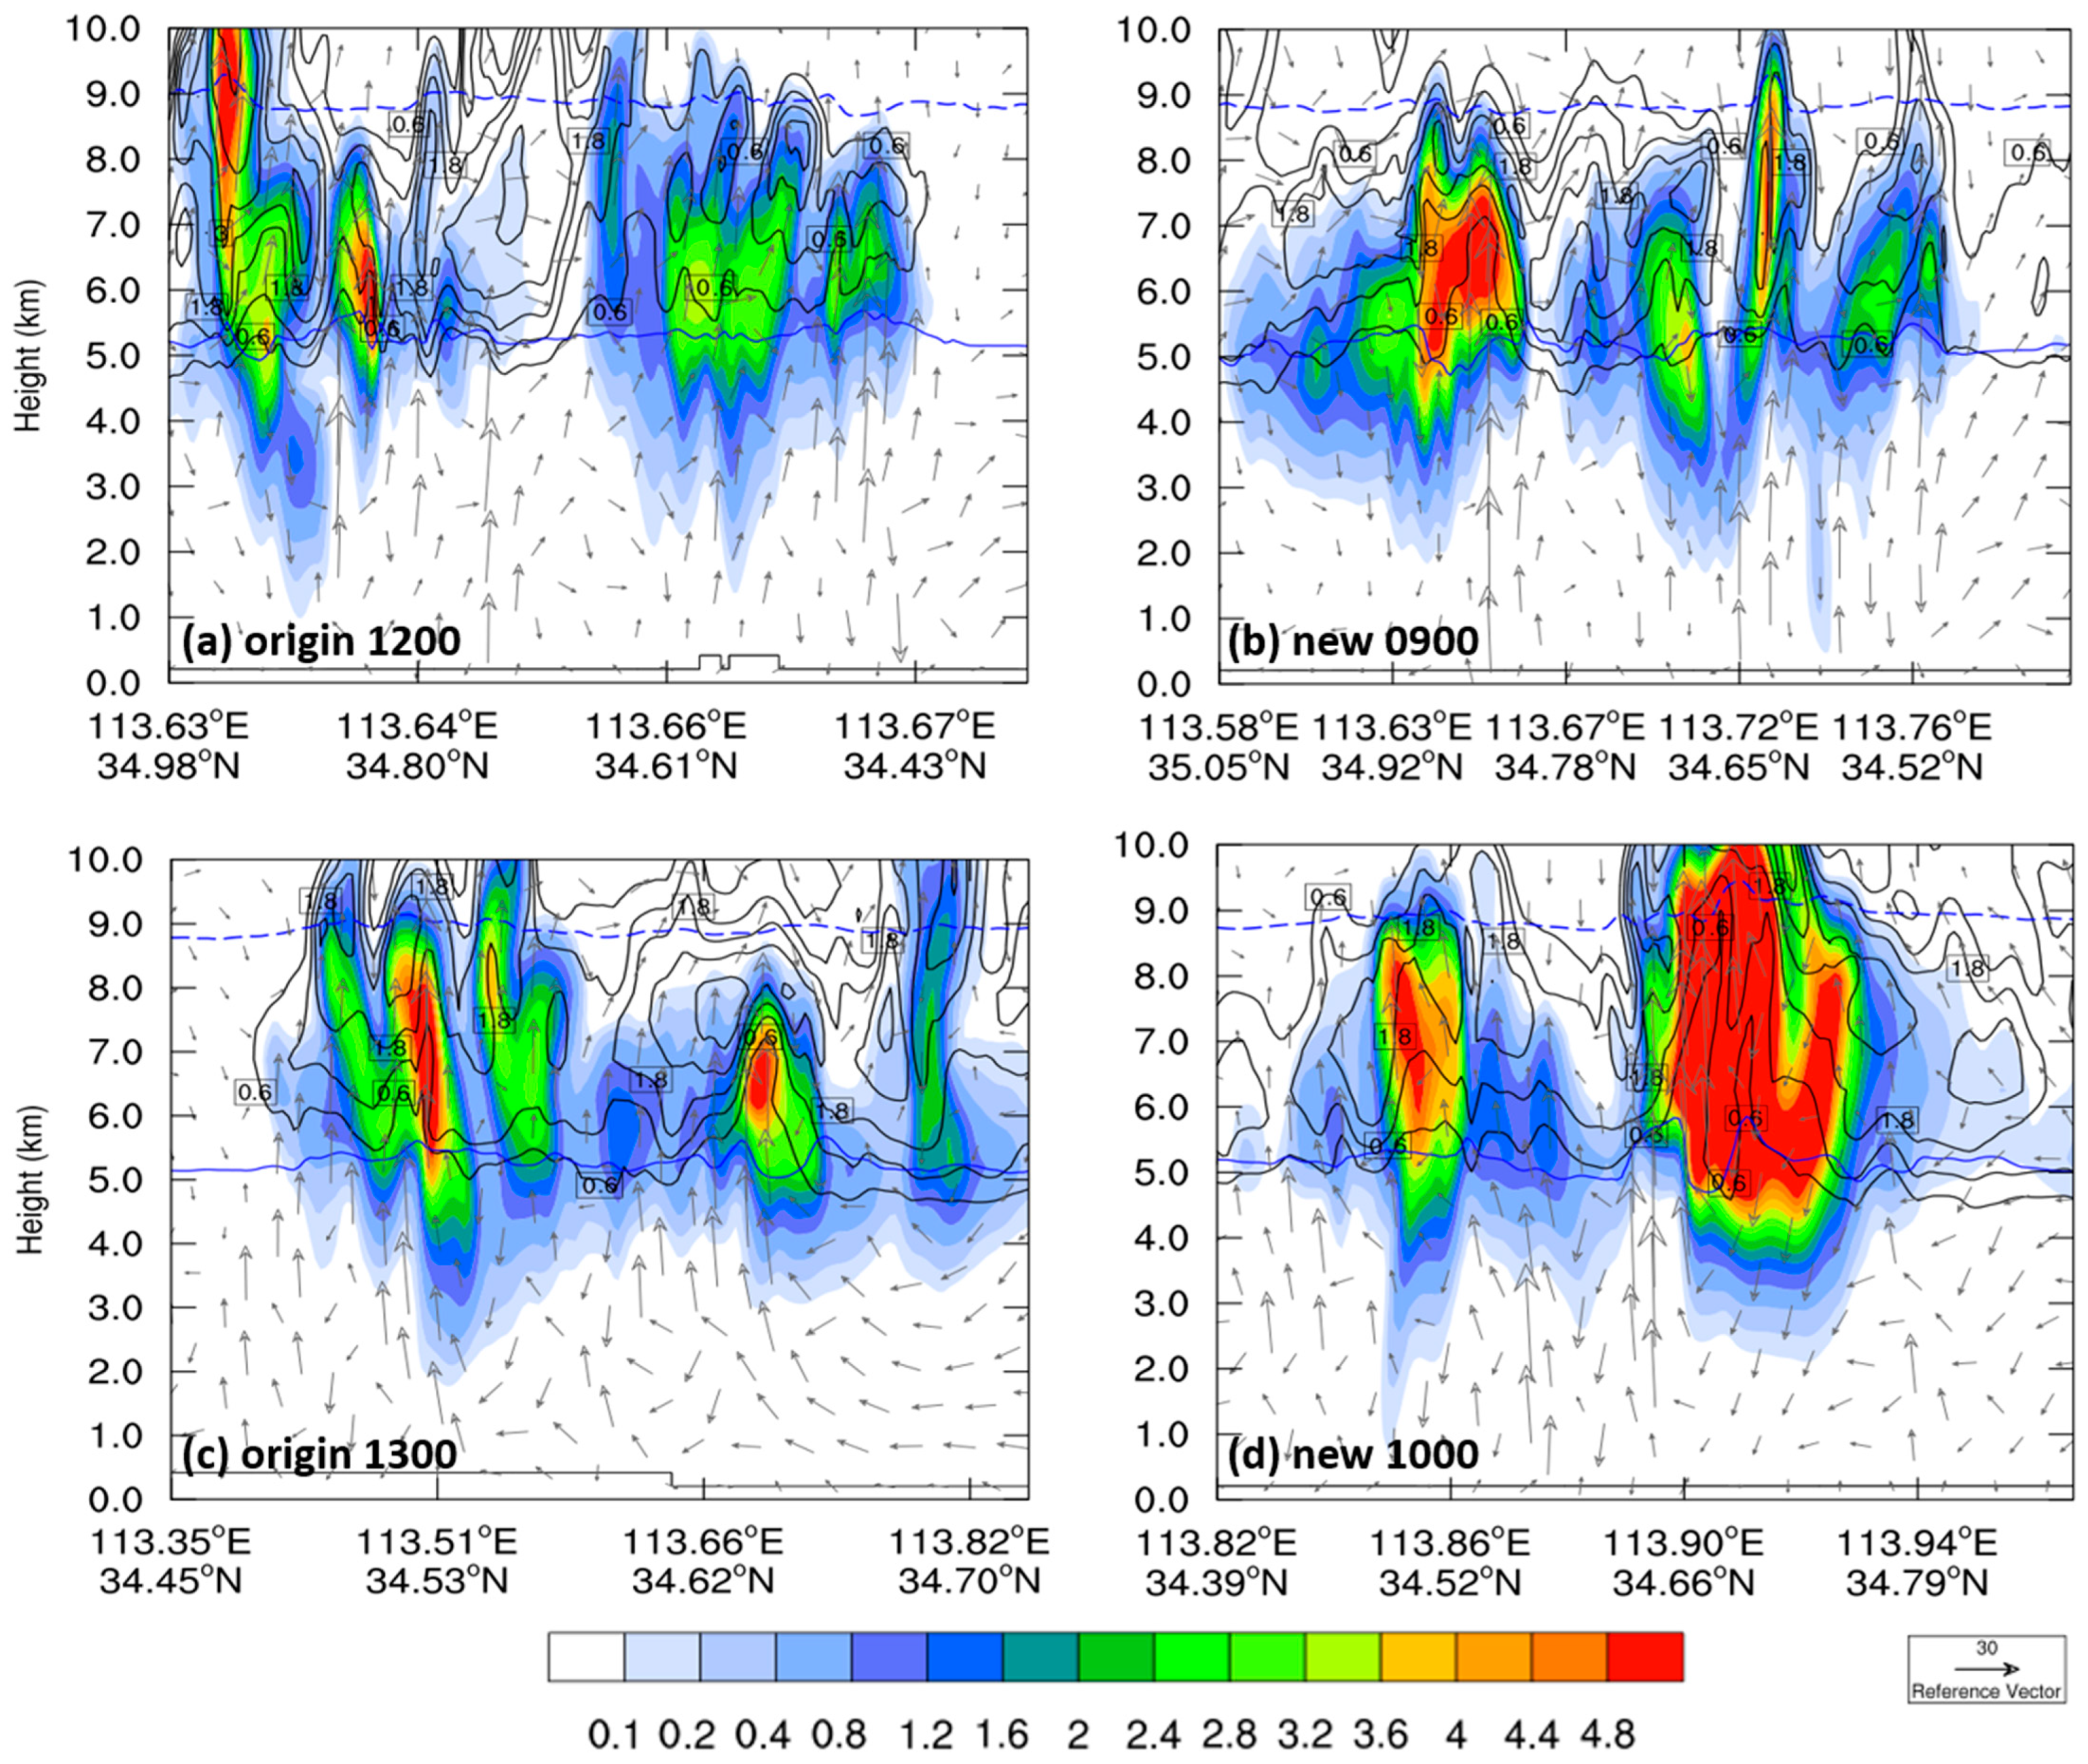
5.2. Cloud Microphysical Features of Extreme Rainfall Intensity

The generation of extreme rainfall intensity is associated with positive feedback between the mesoscale environment and the cloud microphysical processes. Therefore, an understanding of cloud microphysical characteristics before and during the occurrence of extreme hourly rainfall intensity, and thus positive feedback processes within the MCS, is needed. To study the influence of the variation of each water condensate on the precipitation, before and during extreme hourly rainfall intensity, Figure 10 and Figure 11 show the vertical profiles of mixing ratios and wind fields of different water condensates, which allows us to determine links between water condensates field and thermodynamic field.
Figure 10 shows the temporal evolution of the vertical profiles of the liquid-water and cloud-ice mixing ratios, and the wind field, simulated by the original and new schemes before and during extreme hourly rainfall intensity. It can be seen that the liquid water and cloud ice mixing ratios of the MCS show some similar characteristics in the two schemes. There are two obvious large-value areas of liquid water below 5–6 km before and during extreme hourly rainfall intensity. The large-value areas of the liquid water mixing ratio correspond to the strong updraft, which lifts some of the liquid water above the 0 °C layer and produces supercooled water droplets. Supercooled water droplets rise above the 0 °C layer and easily freeze to produce ice-phase particles, so there is a large-value area of the cloud-ice mixing ratio above the large-value area of the liquid water mixing ratio, and the mixing ratio of both is positively correlated. At the same time, strong updraft motion also brings water vapor from the lower levels into the upper levels. As the upper-level temperature is lower than the lower-level temperature, the saturation water vapor pressure drops, and the water vapor is more likely to sublimate into ice through the Bergeron process. Freezing and sublimation processes release a large amount of latent heat, which leads to increased cloud buoyancy, providing a good environment for the development of convection. The large-value area of cloud ice and the large-value area of liquid water were superimposed in the vertical direction, which demonstrates a seeding effect of ice-phase particles, which was conducive to the generation of extreme precipitation.
However, the liquid water and cloud ice mixing ratios in the MCS of the two schemes simulations had some different characteristics. Before the occurrence of extreme rainfall intensity, for the original scheme at 12:00 UTC, two large-value areas of the liquid water mixing ratio (maximum value more than 8.8 g·kg−1) existed below 0–5 km, and two large-value areas of the cloud ice mixing ratio (maximum value more than 0.6 g·kg−1) occurred above this height. For the new scheme at 09:00 UTC, the liquid water mixing ratio in the lower levels (maximum value more than 8 g·kg−1) was not as large as in the original scenario 1200, corresponding to the slight decrease in the cloud ice mixing ratio (maximum value more than 0.6 g·kg−1) at the upper levels. However, due to the strong upward motion, more supercooled water was carried to the upper levels. During the occurrence of extreme rainfall intensity, for the original scheme at 12:00 UTC, the mixing ratios of liquid water and cloud ice in the left convection center were slightly different from the previous moment, and that in the right convection center was enhanced compared with the previous moment. This may be related to the development of convective organization. For the new scheme, the mixing ratios of liquid water and cloud ice in the right convection center increased sharply (maximum mixing ratio of liquid water more than 9.6 g·kg−1; maximum mixing ratio of cloud ice more than 1 g·kg−1) at 10:00 UTC. Upward motion strongly developed to more than 10 km. Liquid water in the new scheme at 10:00 UTC produced more supercooled water droplets than in the original scheme at 13:00 UTC due to stronger updraft motion and stronger liquid-water content in the new scheme at 10:00 UTC.
In summary, before the occurrence of extreme hourly rainfall intensity in Zhengzhou, there were strong large-value areas of liquid water in the lower layers accompanied by strong upward motion and corresponding large-value areas of cloud ice in the upper layers. During the occurrence of extreme hourly rainfall intensity, all these factors intensified. The convection center that produced extreme rainfall intensity in the new scheme had a larger mixing ratio of liquid water than that in original scheme. The reason for this phenomenon may be due to the condensation function considering non-uniform saturation theory, which is based on the objective fact that condensation may occur when relative humidity does not reach 100% in the new scheme. The intrusion of dry and cold air will cause the saturated water vapor pressure to decrease, and the water vapor will condense more easily into liquid water in the new scheme than in the original scheme. Due to the increase in liquid water content, more ice phase particles will be produced by the upward motion and cause feedback on the upward motion, which in turn leads to changes in the environment within the cloud. The study of the variation of the mixing ratio of the ice phase particles will be discussed in Figure 11.
Figure 11 shows the temporal evolution of the vertical profiles of the graupel and snow mixing ratios and the wind field, simulated by the original and new schemes before and during extreme hourly rainfall intensity. It can be seen that the graupel and snow mixing ratios of the MCS simulated by the two schemes have some similar characteristics. A large-value area of upward motion above the melting layer (0 °C layer) corresponds to a large-value area of the mixing ratios of graupel and snow before and during extreme hourly rainfall intensity. Some of the graupel that grew too large fell below the melting layer along with downward motion, which indicates that graupel easily melted into raindrops and promoted precipitation in this area. The centers of the large-value area of the mixing ratio of graupel were always below the centers of the large-value area of the mixing ratio of snow. At the same time, the large-value area of the mixing ratio of cloud ice always corresponds to the large-value area of the mixing ratio of snow when comparing Figure 10 and Figure 11. This is owing to fact that graupel is generated by the process of attachment between supercooled water and ice, and snow is generated by the process of aggregation between ice and ice. When the value of the ice mixing ratio in the cloud is large, it is easier for snow to develop. At the same time, comparing Figure 9 and Figure 11, the large-value areas of the two ice-phase particles match with the large-value areas of the disturbed potential temperature, indicating not only that ice-phase particles are generated by interaction between upward motion and low-level water vapor and liquid water, but also that the two ice-phase particles are sublimating to release latent heat and increase the temperature in the cloud environment. On the one hand, the increase in the temperature of the cloud environment leads to enhancement of buoyancy force and convection in cloud. On the other hand, the increase in temperature of cloud environment leads to an increase in saturated water pressure on water and ice surfaces, which in turn generates water vapor easily.
However, the graupel and snow mixing ratios in the MCS simulated by the two schemes had some different characteristics. Before the occurrence of extreme rainfall intensity, the new scheme (snow maximum value more than 2.25 g·kg−1) simulated smaller snow mixing ratios than the original scheme (snow maximum value more than 3 g·kg−1). The graupel mixing ratio simulated by the new scheme is significantly larger than that of the original scheme. During the occurrence of extreme rainfall intensity, the snow and graupel mixing ratio in the original scheme decreased overall compared to the previous moment. For the new scheme, the mixing ratios of snow and graupel were the highest in the right convection center which was significantly larger than that in the original scheme. Two large-value areas of the snow mixing ratio (left: maximum values more than 2.25 g·kg−1; right: maximum values more than 3 g·kg−1) existed on two sides of the upward motion at 8–9 km in the right convection center of the new scheme, which indicated that the upward motion brought water vapor and liquid water from the lower levels to the upper levels, and form snow and then fall. The graupel mixing ratio increased considerably compared with the previous moment, and a large-value area of the graupel mixing ratio extended to 3 km, which was below the melting layer in the right convection center of the new scheme. The graupel and snow mixing ratios of the left convection center of the new scheme were significantly enhanced compared with the previous moment, but the snow (graupel) mixing ratio was also stronger (weaker) compared with the original scheme.
In summary, before and during the occurrence of extreme hourly rainfall intensity over Zhengzhou, there were strong snow and graupel mixing ratios in the upper layers due to strong upward motion, which increases over time. The convection center that produced extreme rainfall intensity in the new scheme had larger mixing ratios of snow and graupel than that in the original scheme. The reason for this phenomenon may be having more liquid water and supercooled water droplets when considering the non-uniform saturation theory analyzed in Figure 10. More liquid and supercooled water droplets produce more ice phase particles by strong upward motion and the deposition of ice phase particles produce water vapor and release heat, which promotes the development of cloud convection and makes positive feedback on the strong upward motion.

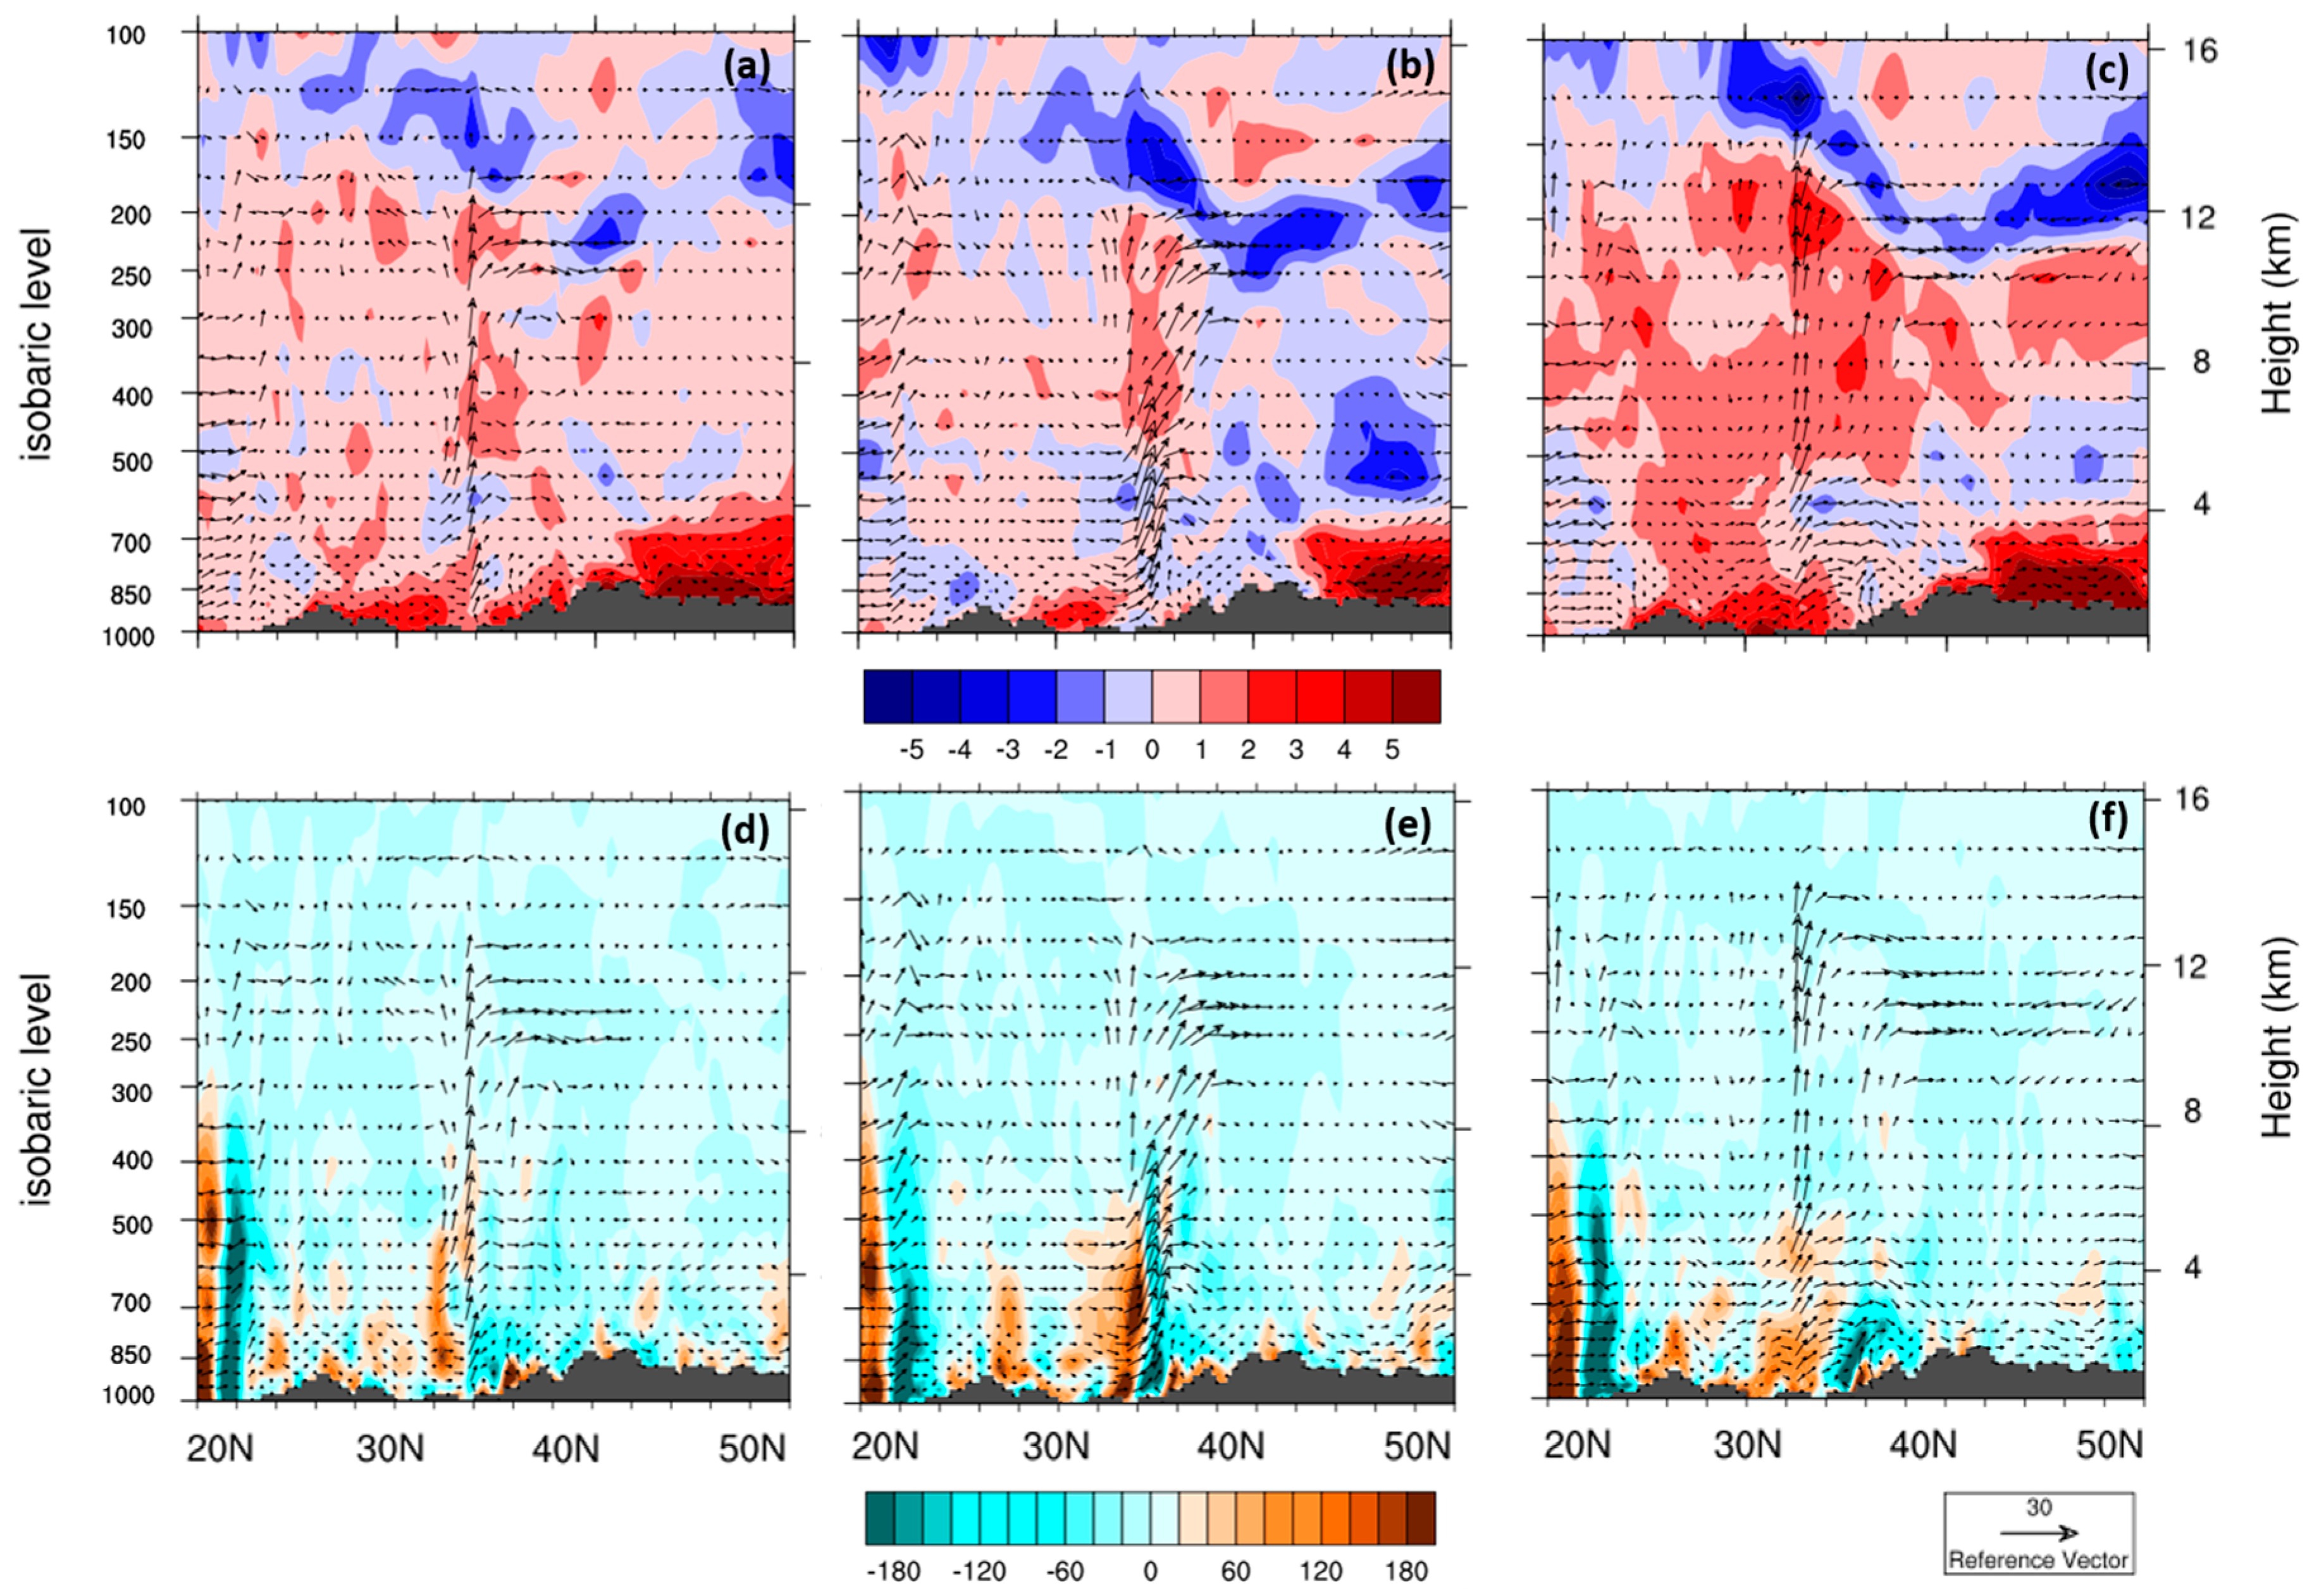
6. Possible Mechanisms by Which Cloud Microphysical Processes Affected the Extreme Hourly Precipitation

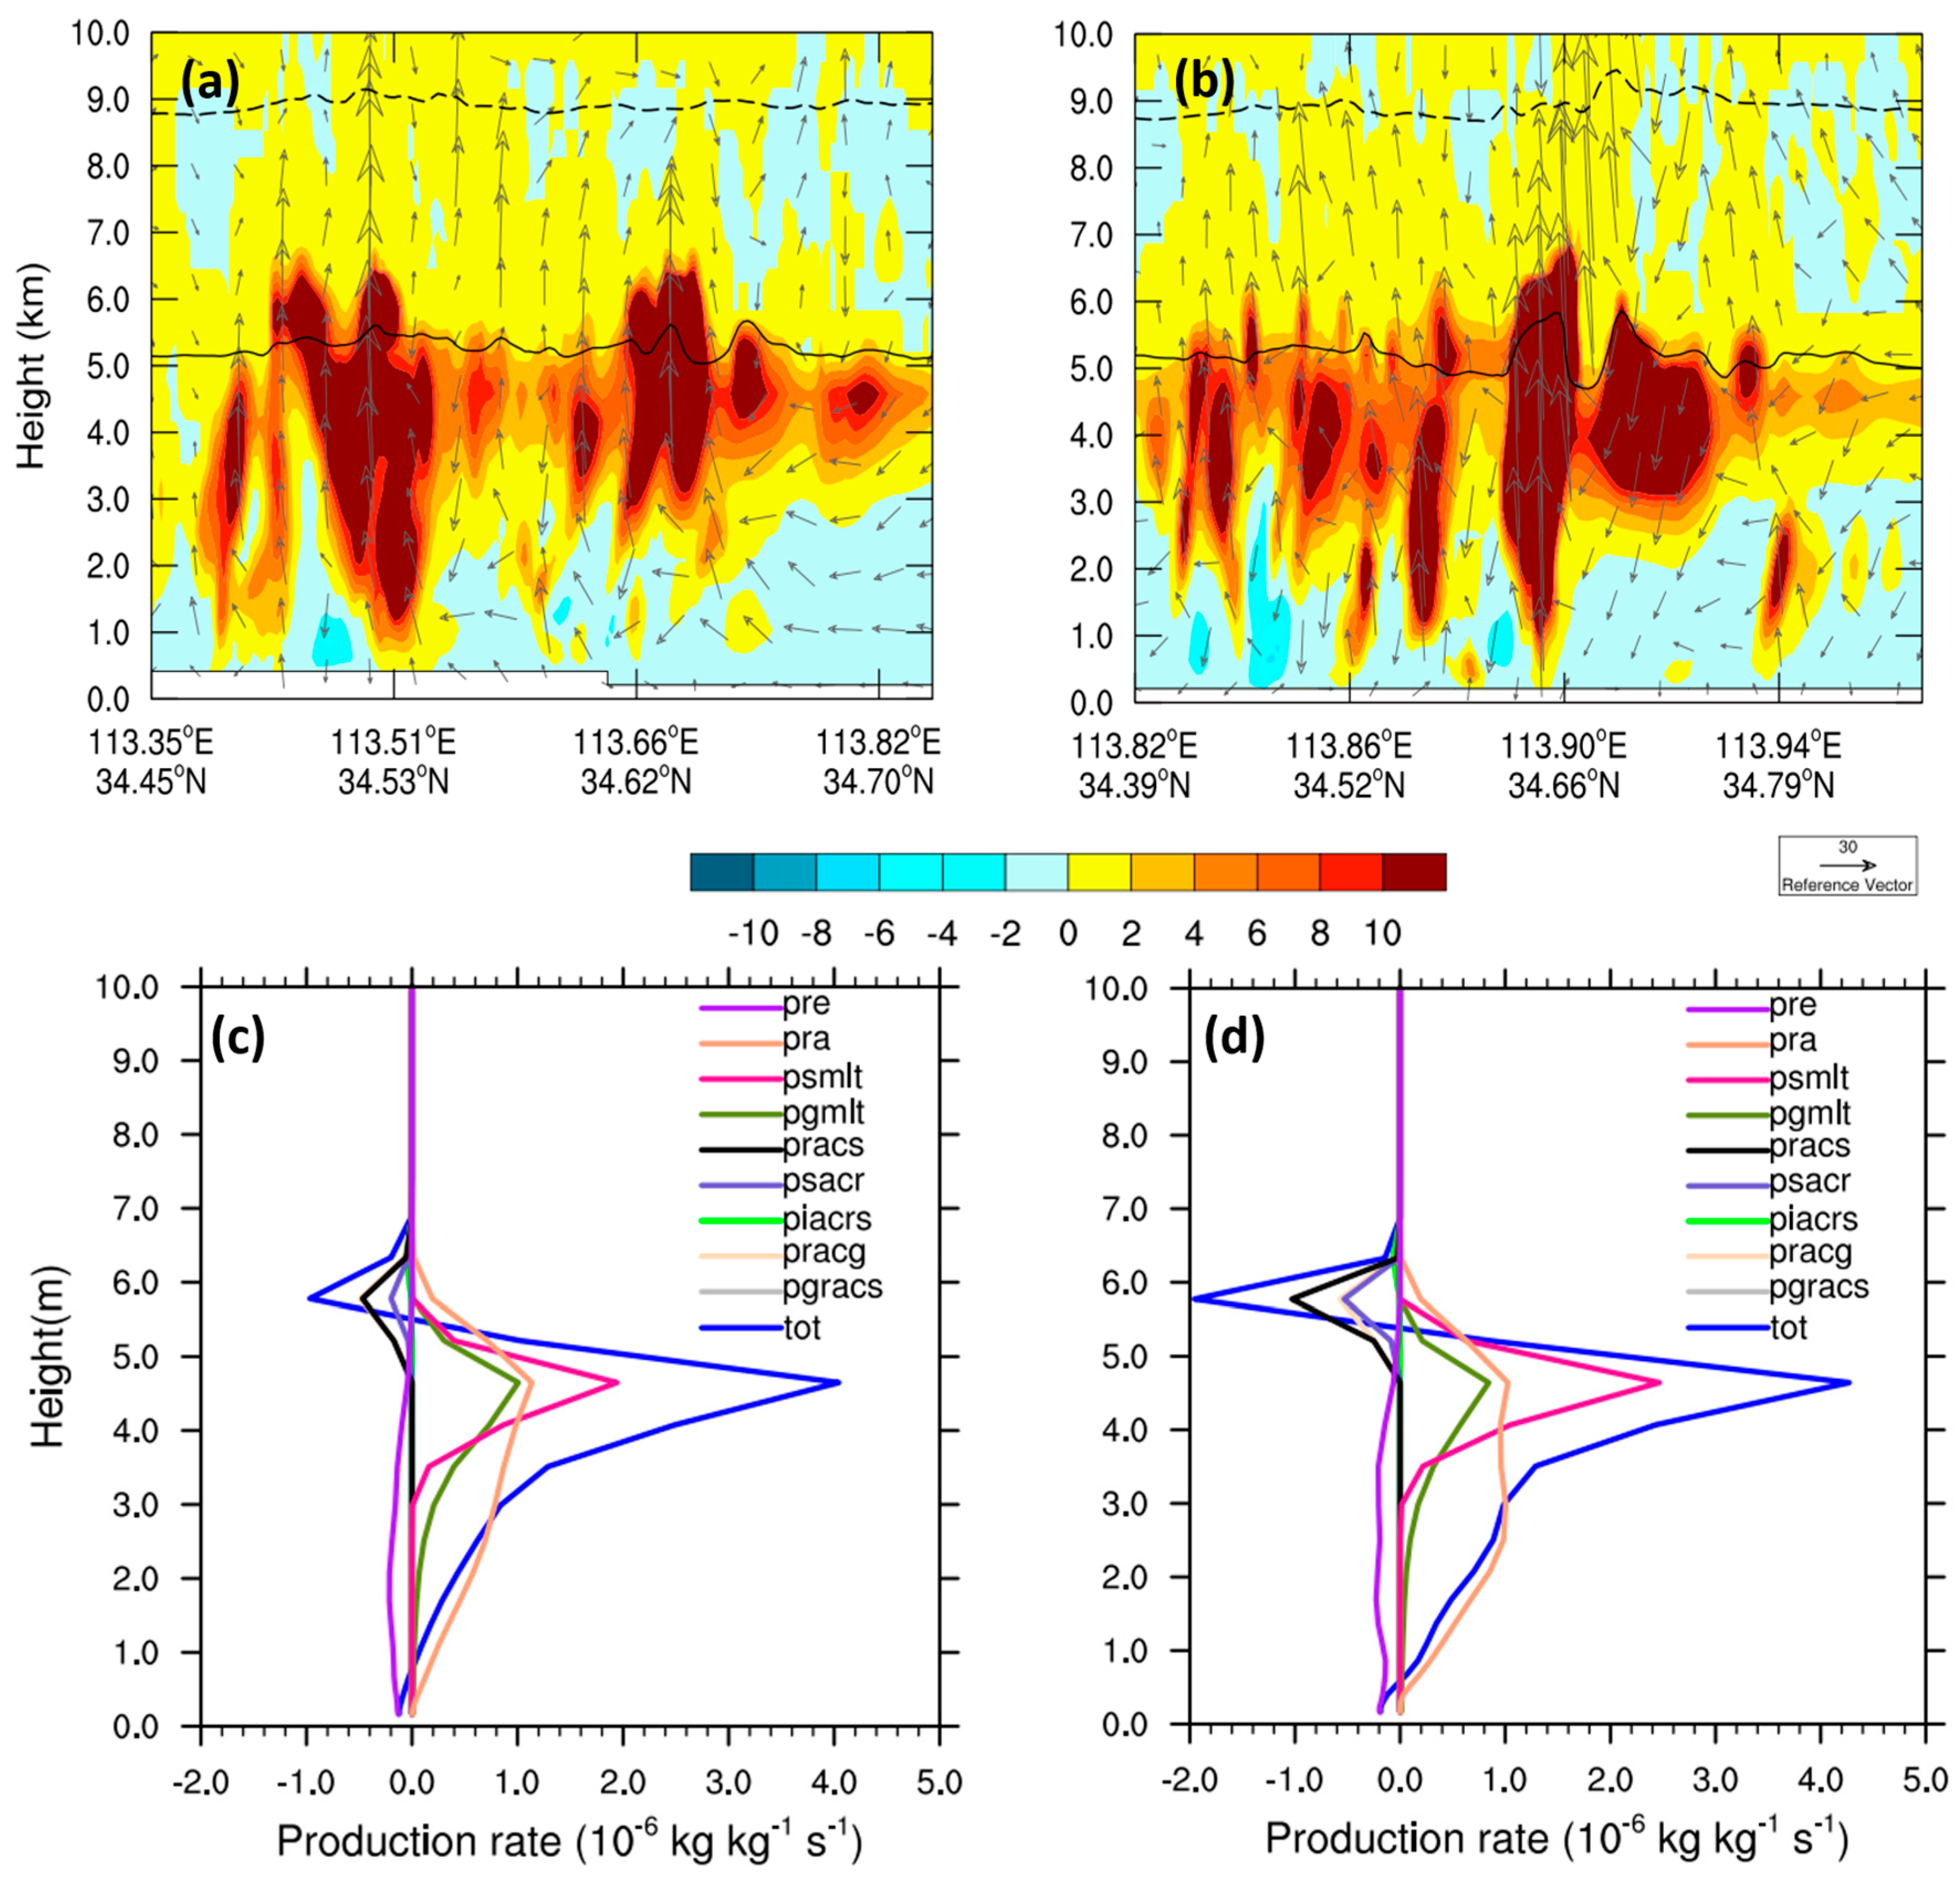
6.1. Mass and Heat Balance of Water Condensates in the MCS

Section 5 focused on the characteristics of the mesoscale environment and cloud microphysical processes within the convection centers that produced extreme hourly rainfall intensity, but an overall quantitative understanding of cloud microphysical processes and diabatic heating processes that produce precipitation over the Zhengzhou area is not clear in these processes (Appendix A for the specific process). To understand the influence of the microphysical processes on the extreme hourly precipitation over Zhengzhou, further analysis of the mass balance of rainwater particles and the latent heat budget of the water condensates is required.

6.1.1. Mass Balance of Rainwater Particles

Figure 12a,b compares the total microphysical conversion production rate between the original and new schemes in convection during the occurrence of extreme hourly precipitation. The distribution of the total precipitation rate simulated by the new scheme is greater than that of the original scheme. The precipitation sources are primarily distributed at and below the melting layer, and the general distribution of these source aligns with the area of high liquid water content shown in Figure 10. This indicates a significant relationship between the precipitation source and the microphysical conversion processes in the melting layer. The following will delve deeper into the main physical processes that constitute the source and sink to gain a better understanding of which cloud microphysical processes lead to the increase in precipitation.
Figure 12c,d compare the area mean of source and sink of rainfall particles in the original and new schemes for precipitation over Zhengzhou. The distribution characteristics of the microphysical conversion production rates in the two schemes are similar. It can be seen that the main microphysical conversion processes for the source of rainfall particles are raindrops collecting cloud drops (Pra), snow melting into rain (Psmlt), and graupel melting into rain (Pgmlt). The main micro-physical conversions for the sink of rainfall particles are snow collecting raindrops (Pracs), raindrops collecting snow and increasing to graupel (Psacr), and rain evaporating into water vapor (Pre).
The peak of the three main microphysical conversions for sources of rainfall particles occurred mainly at 4–5 km, which was under the 0 °C temperature line. This indicates that the main sources of rain particles are raindrops collecting cloud drops within the melting layer and the melting of ice-phase particles. In the new scheme, the Pra process is stronger than in the original scheme. This enhancement is due to the consideration that, with non-uniform atmospheric saturation, water vapor can condense without necessarily reaching 100% saturation. As a result, more water vapor is available for condensation, leading to the formation of more cloud droplets or even raindrops, thereby amplifying the Pra process. There was an obvious difference in values of the Psmlt process simulated by the two schemes. The Psmlt process simulated by the new scheme was larger than that in the original scheme. On the one hand, there is stronger heating near the melting layer in the new scheme, as reflected in Figure 9d. On the other hand, there is larger value of the snow particle mixing ratio gradient near the melting layer in the new scheme, as reflected in Figure 11d. This finding can also be used to explain the larger value of the Pracs process, which is the main micro-physical conversion of the sink of rainfall particles in the new scheme, which is in contrast to the original scheme. The pre-process happened below 5 km, which was caused by evaporation of precipitation during the rainfall.

6.1.2. Latent Heat Balance of Water Condensates

Figure 13a,b compares the total latent heating rate between the original and new schemes in convection during the occurrence of extreme hourly precipitation. The latent heat source and sink simulated by the new scheme are significantly larger than those of the original scheme. The areas of high values for the source and sink primarily occur above the melting layer and in regions of strong upward motion, correlating well with the ice-phase particles depicted in Figure 11. This indicates a significant relationship between the latent heat and the transformation of ice-phase particles in the upper layers. The following paragraphs will discuss the key physical processes that make up the latent heat source and sink, aiming to better understand which cloud microphysical processes lead to heating and cooling within the cloud.
Figure 13c,d compares the area mean of the source and sink of latent heating in the original and new schemes for precipitation over Zhengzhou. The distribution characteristics of the microphysical conversion latent heating rates in the two schemes are similar. It can be seen that the main microphysical conversions for heating are deposition of snow (Prds) and deposition of graupel (Prdg). The main microphysical conversions for cooling were sublimation of snow (Eprds), sublimation of graupel (Eprdg), evaporates of rain (Pre), ice sublimation as water vapor (Eprd), and melting and evaporation of snow (Evpms).
The peak of Prds and Prdg occurred mainly at 6–9 km, which was under the −20 °C temperature line. This indicated that large amounts of water vapor into the snow and graupel by deposition processes heated cloud environment, which was consistent with the findings in Figure 9. This was because upward motion carries water vapor and supercooled water from the lower levels to a height of 6–9 km, resulting in the production of ice-phase particles. There was an obvious difference in values of the Prds and Prdg processes simulated by the two schemes. The peak position of the Prds and Prdg processes simulated by the new scheme was larger and higher than that in the original scheme. The reason for this phenomenon was that non-uniform saturation theory thermodynamically took into account the heating release air region between the saturated air and unsaturated air. From another point of view about non-uniform saturation theory, non-uniform saturation considers the fact: the atmosphere is non-uniformly saturated, so the relative humidity may not have to reach 100% to saturate, and saturation may occur at 70%. Condensation was more efficient in the new scheme, resulting in the production of more supercooled water droplets. High-efficiency condensation generated more heat, producing stronger upward motion with positive feedback. Stronger upward motion pushes water vapor and supercooled water higher up, producing more ice phase particles which then release more heat, leading to higher environment temperature, more unstable energy, and stronger buoyancy in convective clouds. This can lead to enhanced convection within the cloud and thus positive feedback on the upward motion. The peak of Eprds and Eprdg occurred mainly at 6 km, which was above the 0 °C temperature line. This indicates that upper ice-phase particles fall and sublimate to absorb heat at 6 km. The peak of Evpms and Evpmg occurred mainly at 5 km, which was near the 0 °C temperature line. The cooling rate of the Evpms process in the new scheme was greater than that in the original scheme, which was consistent with the reason for the Psmlt process explained in Section 6.1.1. There was a large value for cooling of the pre-process below 5 km, which was due to evaporation during rainfall, leading to cooling forming cold pools in the reaction in Figure 9.

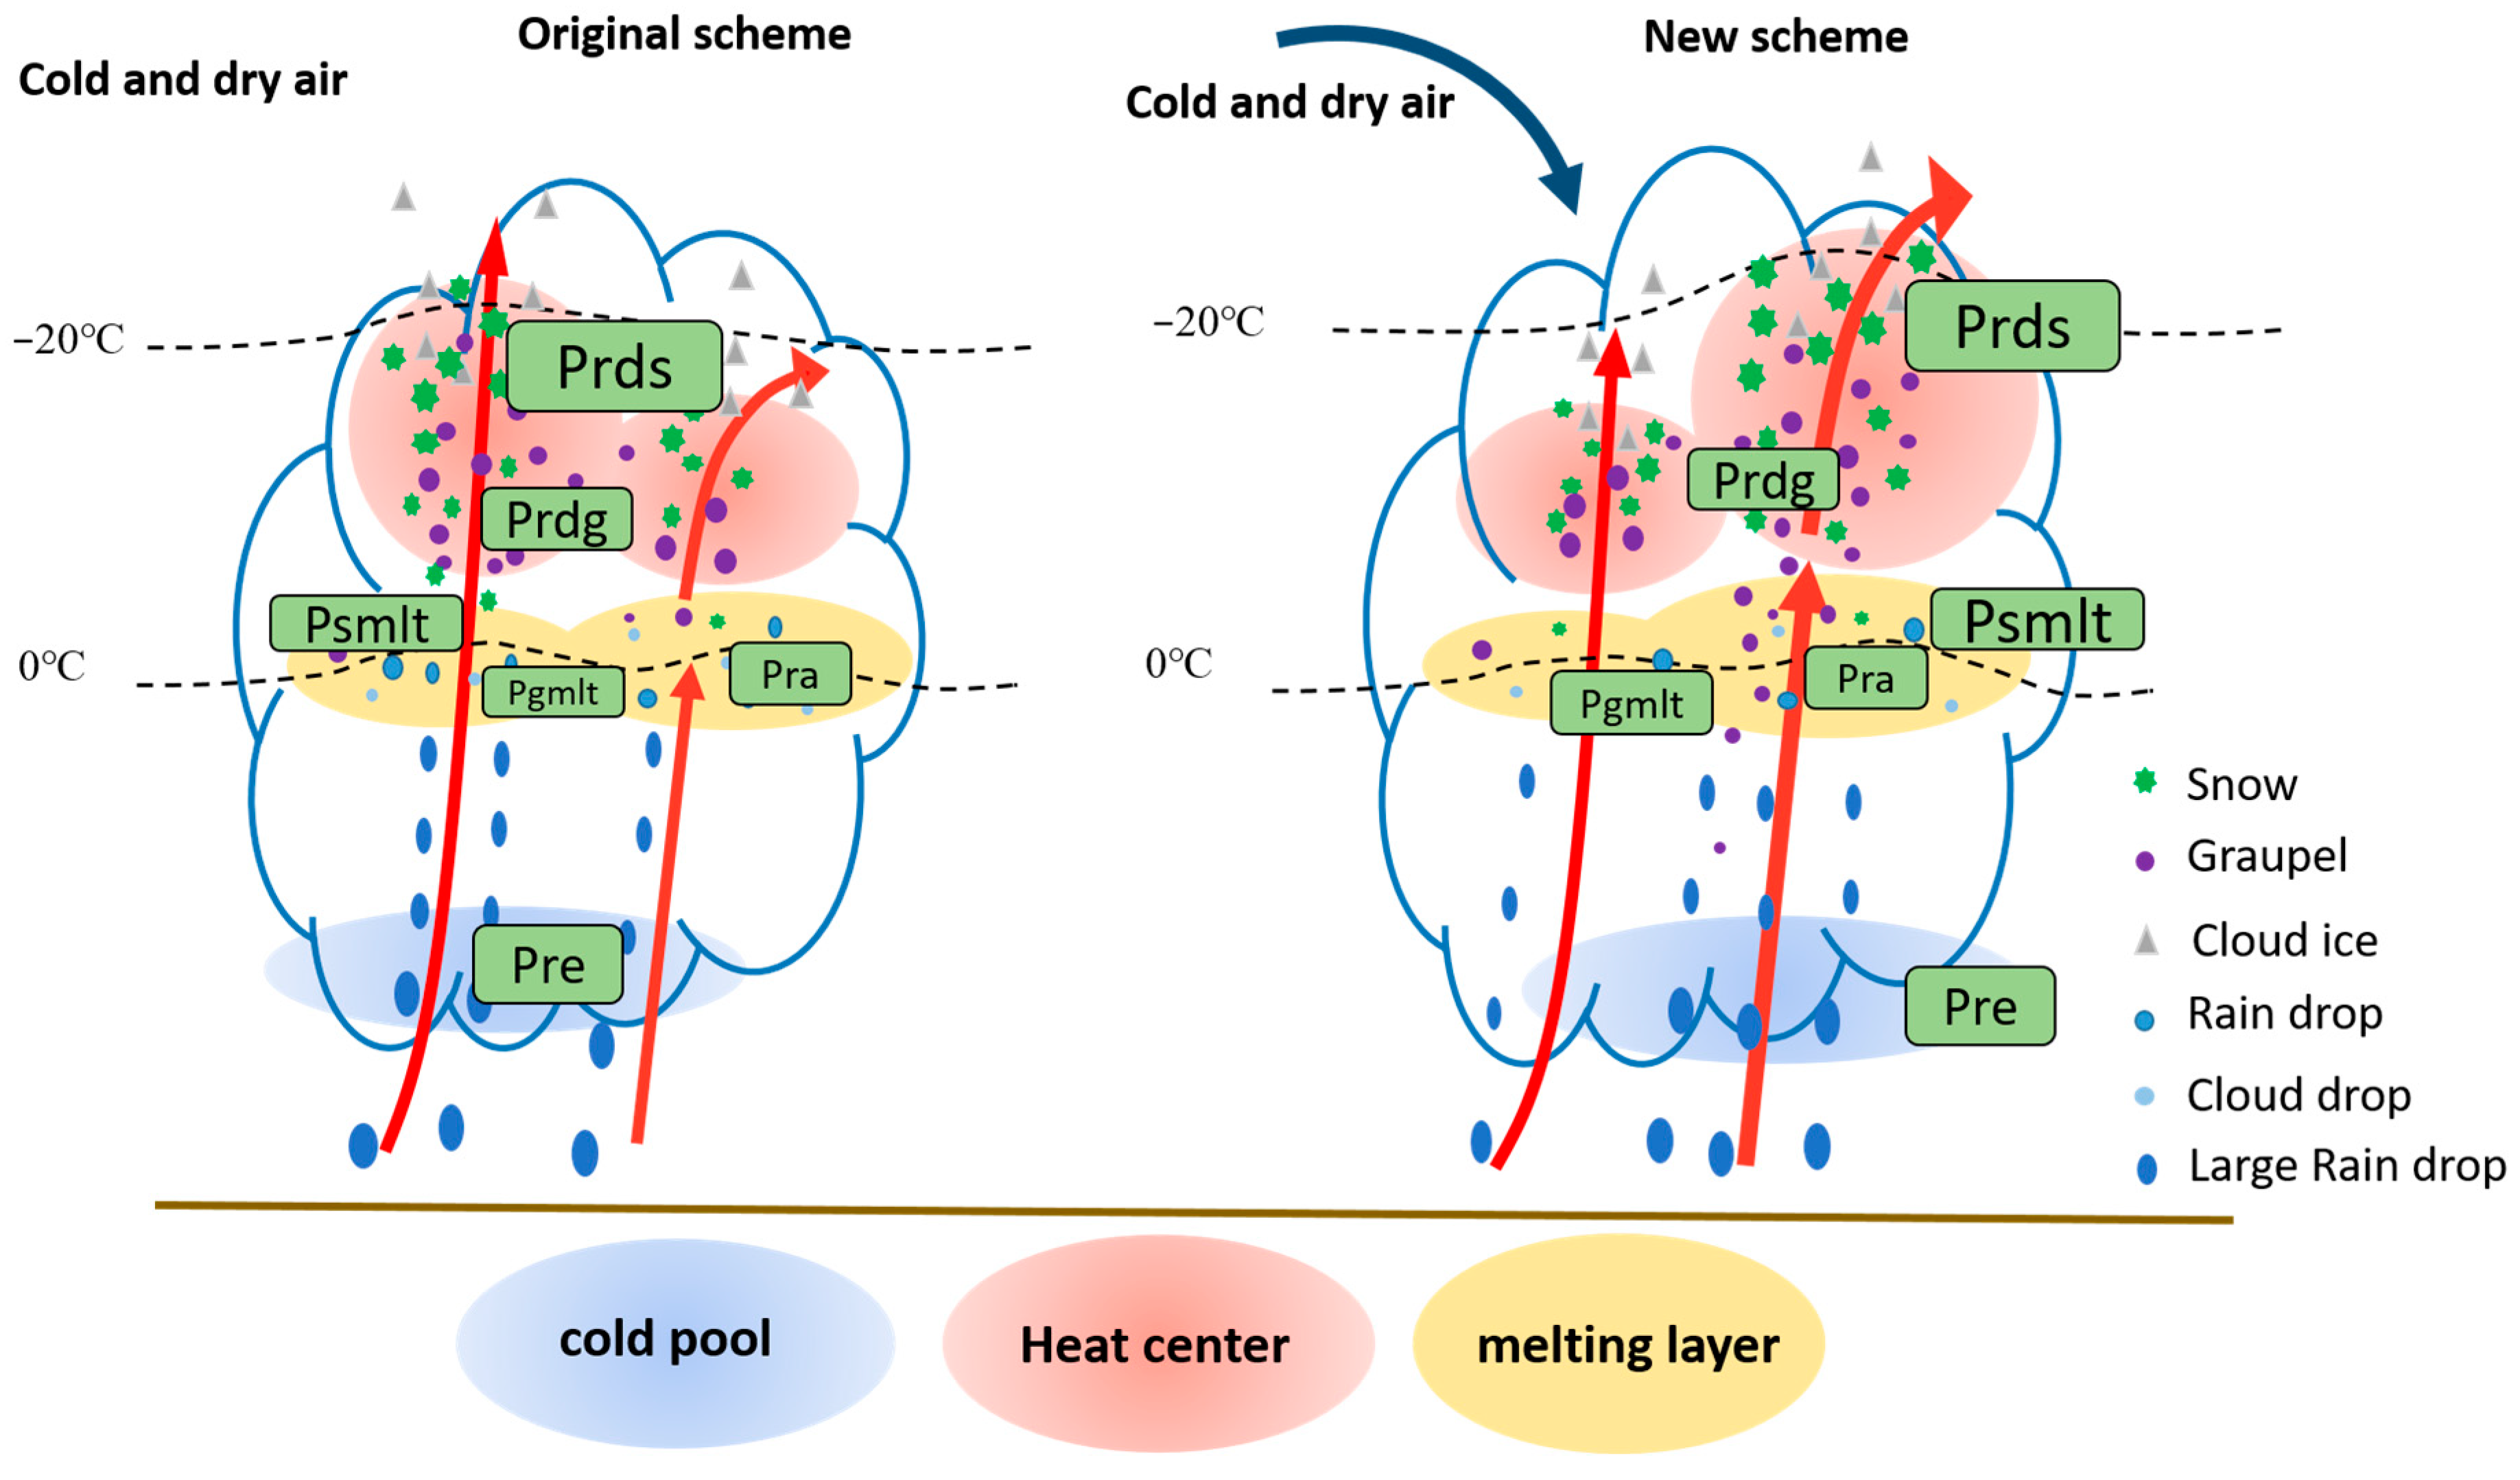
6.2. Possible Cloud Microphysical Mechanism during Extreme Hourly Precipitation

On the basis of the above analysis, a picture of cloud microphysical mechanisms affecting this extreme hourly heavy rainfall process in Zhengzhou can be given, as shown in Figure 14. A comprehensive analysis of the above findings showed that cloud microphysical mechanisms in the original and the new schemes have similar characteristics. Under the action of strong updrafts, part of the liquid water was lifted above the melting layer. A large amount of supercooled water formed near the melting layer and a large amount of ice formed above the melting layer through the Bergeron process and the freezing process, respectively. The ice formed ice-phase particles, such as graupel and snow, through the processes of collision and aggregation. The processes through which ice-phase particles were formed, such as the Prds, Prdg, and Prd processes, released a large amount of latent heat, which led to an increase in the temperature of the cloud environment. These processes led to an increase in the buoyancy within the cloud and an increase in the height of the cloud top, which in turn led to an increase in the thickness of the convective cloud layer and promoted the development of convective motion within the cloud. The ice-phase particles grew larger and then fell above the 0 °C temperature line through melting and evaporation processes, such as the Eprd and Eprdg processes. These processes cooled the temperature of the environment, resulting in elevation of the melting layer and an increase in the content of supercooled water within the melting layer. The water vapor produced by the Eprd and Eprdg processes in turn promoted the Prds, Prdg, and Prd processes. Other ice-phase particles fell into the 0 °C temperature layer and melted into liquid-water droplets through the Psmlt and Pgmlt processes. There were also existing raindrops collecting cloud drops (Pra) in the melting layer. It is worth noting that snow was the most important component of the abovementioned ice-phase conversion process. The strong upward motion was accompanied by the strong downward motion. Downward motion led to evaporative cooling of rainwater in the bottom layer. This formed cold pools on the ground, such as the pre-process, which interacted with latent heating in the upper layers and thus fed back positively to the vertical circulation. This circulation led to the phase transition of liquid water, ice-phase particles, and water vapor, which produced positive feedback to the thermal and dynamical environment within the cloud, thereby forming this extreme hourly heavy rainfall event.
However, the cloud microphysical processes simulated by the original and new schemes still had some differences, which is mainly reflected in two aspects. One is that the Psmlt process is much larger in the new scheme. The other is that the peak of the Prds process is higher in the new scheme. One of the main reasons for this phenomenon is that water vapor is more likely to saturate and condensate when considering non-uniform saturation in the atmosphere in the new scheme. More supercooled water entered above the melting layer due to upward motion. More ice was formed under the action of the Bergeron process and the freezing process. It was easier for snow with larger particles to be produced, which lead to a larger Psmlt process and stronger upward motion due to positive feedback through latent heat produced by phase transition process of snow. The larger Psmlt process in the new scheme directly led to a larger rainfall production rate, so the new scheme produced stronger extreme hourly rainfall intensities than the original scheme. This indicates that the hourly peak rainfall of the new scheme is closer to the observations when taking the non-uniform saturation theory into consideration. Additionally, the process of Pra has also increased. This is primarily due to the enhanced condensation efficiency influenced by the consideration of non-uniform saturation. The pre-process in the new scheme has also shown a slight increase over the original scheme. This is primarily due to the increased liquid water content and enlargement of raindrops after considering non-uniform saturation, accompanied by the enhanced sinking drag effect.

7. Conclusions

A numerical simulation was carried out for an extreme rainfall case in Zhengzhou, Henan Province, China, on 19–20 July 2021. The cloud microphysical scheme of the cloud water condensation parameterization process was modified by taking the non-uniform saturation theory into consideration, and the results were compared with those of the original scheme. More specifically, the mesoscale environment and the cloud microphysical features affecting the MCS of the extreme hourly precipitation system in Zhengzhou were analyzed. The rainwater mass balance and latent heat balance of the water condensates in the Zhengzhou area were calculated. The possible mechanism by which cloud microphysical processes influenced the extreme rainfall was studied. The main conclusions are summarized as follows.
  • The supersaturation and water vapor condensation caused by the intrusion of dry and cold air from the upper and middle levels is the main reason for the heavy rainfall in Zhengzhou. This environment of high temperature gradients and humidity gradients is more suitable for the application of generalized potential temperature. The new cloud microphysical scheme that takes into consideration that the non-uniform saturation theory was effective in improving the simulation capability of extreme hourly cumulative rainfall intensity and 24 h cumulative rainfall zone for heavy rainfall over Zhengzhou.
  • Extreme hourly cumulative precipitation over Zhengzhou occurred with strong upward motion, which brought supercooled water and water vapor from the lower levels to the upper levels, forming ice-phase particles through the Bergeron process and the freezing process. Ice-phase particle sublimation and deposition processes produced positive feedback to the mesoscale environment, such as the Prd, Prds, Prdg, Eprd, and Eprdg processes. A mesoscale environment that is more conducive to convective generation will in turn enhance upward motion and ice-phase particle mixing ratios. The ice-phase particles fall into the melting layer and melt into raindrops, such as the Psmlt and Pgmlt processes.
  • Comparing the new scheme with the original scheme, there are two obvious differences in the cloud microphysical processes. One is that the Psmlt process is much larger in new scheme. The other is that the peak of the Prds process is higher in the new scheme. The main reason for this phenomenon is that water vapor is more likely to saturate and condensate when considering the non-uniformity of saturation in the atmosphere in the new scheme. This resulted in more supercooled water droplets, more snow melting, and stronger motion. These phenomena interact with positive feedback to contribute to stronger rainfall intensity in the new scheme.

Author Contributions

Conceptualization, J.X. and F.P.; methodology, J.X.; software, J.X.; validation, J.X., Y.W. and L.Y.; formal analysis, J.X. and L.X.; investigation, J.X. and F.P.; resources, L.X.; data curation, J.X. and Y.W; writing—original draft preparation, J.X.; writing—review and editing, J.X.; visualization, J.X.; supervision, F.P., L.Y. and L.X.; project administration, F.P., L.Y. and L.X.; funding acquisition, F.P., L.Y. and L.X. All authors have read and agreed to the published version of the manuscript.

Funding

This research was funded by [Disaster-causing mechanism of the northeast cold vortex and key technology of forecasting] grant number [2023YFC3007700]; This research was also funded by [Three-dimensional structure of typical hail clouds in North China and the influence of cloud microphysical processes on hail formation] grant number [42105013]; This research was also funded by [Study on the evolutionary mechanism of linear thunderstorms and gales under the background of the East China Cold Vortex] grant number [42305012].

Institutional Review Board Statement

Not applicable.

Informed Consent Statement

Not applicable.

Data Availability Statement

Data are available upon request from the authors.

Conflicts of Interest

The authors declare no conflict of interest.

Appendix A

Table A1. List of microphysical transformation terms for the Morrison 2-mom scheme.
Cloud Microphysical Process AbbreviationDescription
EprdsSublimation of snow
EprdgSublimation of snow graupel
EprdSublimation of cloud ice
PrdsDeposition of snow
PrdgDeposition of graupel
PrdDeposition of cloud ice
EvpmgMelting and evaporation of graupel
EvpmsMelting and evaporation of snow
PreEvaporates of rain
PgracsConversion to graupel due to collection rain by snow
MnuccrContact freezing of rain
PracgRain-graupel collection
PracsRain-snow collection
PraciChange QI, ice-rain collection
PiacrsChange QR, ice-rain collision, added to snow
PracisChange QI, ice-rain collision, added to snow
PsacrConversion due to collection of snow by rain
PraiConversion due to collection of snow by cloud ice
PrciIce-ice collision, added to snow
PsacwgChange Q droplets collection by graupel
PsacwsChange Q droplets accretion by snow
PsacwiChange Q droplets accretion by cloud ice
PgmltMelting of graupel
PsmltMelting of snow
PccCondensation/evaporation of cloud droplets
PraAccretion droplets by rain
PrcAuto-conversion of droplets

References

  1. Zhang, H.; Hou, J.Z.; Qiao, J. A comprehensive analysis of some characteristics of heavy rainfall in Shaanxi. Disaster Sci. 2011, 26, 70–74. [Google Scholar]
  2. Guo, Y.; Shao, C.; Su, A. Investigation of land–atmosphere coupling during the extreme rainstorm of 20 July 2021 over Central East China. Atmosphere 2023, 14, 1474. [Google Scholar] [CrossRef]
  3. Xu, J.; Ping, F.; Li, J.Y.; Du, H. A study of cloud microphysical processes and a mesoscale environment in a heavy rainfall case over Yan’an. Front. Earth Sci. 2023, 11, 1149856. [Google Scholar] [CrossRef]
  4. Shi, W.; Li, X.; Zeng, M.; Yang, H.; Ma, S.; Zhou, K.; Shen, D.; Jiao, B.; Li, N. Multi-model comparison and analysis of high-resolution regional model forecasts for the “7–20” heavy rainstorm in Zhengzhou. J. Atmos. Sci. 2021, 44, 88702. [Google Scholar]
  5. Chen, Y.; Ping, F.; Zhou, S.; Shen, X.; Sun, Y. Influence of microphysical processes on the initiation of the mesoscale convective system of a rainstorm over Beijing. Atmos. Res. 2021, 254, 105518. [Google Scholar] [CrossRef]
  6. Thoithi, W.; Blamey, R.C.; Reason, C.J.C. April 2022 floods over East Coast South Africa: Interactions between a mesoscale convective system and a coastal Meso-Low. Atmosphere 2023, 14, 78. [Google Scholar] [CrossRef]
  7. Randall, D.A.; Bitz, C.M.; Danabasoglu, G.; Denning, A.S.; Gent, P.R.; Gettelman, A.; Griffies, S.M.; Lynch, P.; Morrison, H.; Pincus, R.; et al. 100 years of earth system model development. Meteorol. Monogr. 2019, 59, 12.1–12.66. [Google Scholar] [CrossRef]
  8. Schwartz, C.S.; Romine, G.S.; Fossell, K.R.; Sobash, R.A.; Weisman, M.L. Toward 1-km ensemble forecasts over large domains. Mon. Weather. Rev. 2017, 145, 2943–2969. [Google Scholar] [CrossRef]
  9. Zhang, B.; Zheng, Y.Y.; Shen, F.F.; Zeng, Y.; Wang, Y. Characteristics and simulation of a torrential rainstorm over southern Jiangsu in 2017 revealed by a high-resolution numerical model. J. Meteorol. Sci. 2021, 41, 386–397. [Google Scholar]
  10. Li, H.Q.; Zhang, D.L. Recent advances and future challenges in high-resolution numerical simulation of mesoscale convective systems. Adv. Meteorol. Sci. Technol. 2021, 11, 75–91. [Google Scholar]
  11. Van, W.K.; Van, L.N.P.M.; Delobbe, L. Evaluation of moist processes during intense precipitation in km-scale NWP models using remote sensing and in-situ data: Impact of microphysics size distribution assumptions. Atmos. Res. 2011, 99, 15–38. [Google Scholar]
  12. Houghton, J.T.; Ding, Y.; Griggs, D.J.; Noguer, M. Climate Change 2001: The Scientific Basis; Cambridge University Press: Cambridge, UK, 2001. [Google Scholar]
  13. Gao, S.T.; Cui, X.P.; Zhou, Y.S.; Li, X. Surface rainfall processes as simulated in a cloud-resolving model. J. Geophys. Res. 2005, 110, D10202. [Google Scholar] [CrossRef]
  14. Fan, J.W.; Zhang, R.Y.; Li, G.H.; Tao, W.K. Effects of aerosols and relative humidity on cumulus clouds. J. Geophys. Res. 2007, 112, D1420. [Google Scholar] [CrossRef]
  15. Mao, J.H.; Ping, F.; Yin, L.; Qiu, X. A study of cloud microphysical processes associated with torrential rainfall event over Beijing. J. Geophys. Res. Atmos. 2018, 123, 8768–8791. [Google Scholar] [CrossRef]
  16. Yin, L.; Ping, F.; Mao, J.H. Impact of cloud microphysical processes on the simulation of a hailstorm in East China. Atmos. Res. 2019, 219, 36–56. [Google Scholar] [CrossRef]
  17. Yang, S.; Gao, S.; Lu, C. A generalized frontogenesis function and its application. Adv. Atmos. Sci. 2014, 31, 1065–1078. [Google Scholar] [CrossRef]
  18. Gao, S.B. Research on the Application of Radar Data Assimilation in Strong Convective Weather Forecasting. Ph.D. Thesis, Nanjing University of Information Engineering, Nanjing, China, 2018. [Google Scholar]
  19. Sun, Y.; Xiao, H.; Yang, H.L.; Ding, J.; Fu, D.; Guo, X.; Feng, L. Analysis of dynamic conditions and water condensates transport characteristics of the 2021 Zhengzhou “7–20” heavy rainstorm based on remote sensing data optical flow field. Atmos. Sci. 2021, 45, 1384–1399. [Google Scholar]
  20. Yin, L.; Ping, F.; Mao, J.H.; Jin, S. Analysis on precipitation efficiency of the “21.7” Henan extremely heavy rainfall event. Adv. Atmos. Sci. 2023, 40, 374–392. [Google Scholar] [CrossRef]
  21. Zhou, Y.S.; Cao, J.; Wang, D.H. Application of non-uniform saturated generalized moist potential vorticity in heavy rainfall analysis and forecasting. J. Appl. Meteorol. Sci. 2007, 18, 754–759. [Google Scholar]
  22. Gao, S.; Wang, X.; Zhou, Y. Generation of generalized moist potential vorticity in a frictionless and moist adiabatic flow. Geophys. Res. Lett. 2004, 31, 12113. [Google Scholar] [CrossRef]
  23. Wang, X.R.; Wu, K.J.; Shi, C.E. Introduction of condensation probability functions and a set of non-uniform saturated wet air dynamics equations. J. Trop. Meteorol. 1999, 15, 64–70. [Google Scholar]
  24. Ping, F.; Tang, X.B.; Gao, S.T.; Luo, Z. A comparative study of the atmospheric circulations associated with rainy-season floods between the Yangtze and Huaihe River Basins. Sci. China Earth Sci. 2014, 57, 1464–1479. [Google Scholar] [CrossRef]
  25. Morrison, H.; Gettelman, A. A new two-moment bulk stratiform cloud microphysics scheme in the Community Atmosphere Model, Version 3 (CAM3). Part I: Description and numerical tests. J. Clim. 2008, 21, 3642–3659. [Google Scholar] [CrossRef]
  26. Zhou, K.L.; Ran, Q.Y.; Gao, Z. Characteristic analysis of general potential temperature and potential vorticity including freezing process. Atmos. Sci. 2020, 44, 816–834. [Google Scholar]
  27. Von, S.H.; Langenberg, H.; Feser, F. A spectral nudging technique for dynamical downscaling purposes. Mon. Weather. Rev. 2000, 128, 3664–3673. [Google Scholar]
  28. Glisan, J.M.; Gutowski, J.W.J.; Cassano, J.J.; Higgins, M.E. Effects of spectral nudging in WRF on Arctic temperature and precipitation simulations. J. Clim. 2013, 26, 3985–3999. [Google Scholar] [CrossRef]
  29. Huang, Y.J.; Cui, X.P. Dominant cloud microphysical processes of a torrential rainfall event in Sichuan, China. Adv. Atmos. Sci. 2015, 32, 389–400. [Google Scholar] [CrossRef]
  30. Heymsfield, A.; Wright, R. Graupel and hail terminal velocities: Does a “supercritical” Reynolds number apply. J. Atmos. Sci. 2014, 71, 3392–3403. [Google Scholar] [CrossRef]
  31. Hjelmfelt, M.R.; Roberts, R.D.; Orville, H.D.; Chen, J.-P. Observational and numerical study of a microburst line-producing storm. J. Atmos. Sci. 1989, 46, 2731–2744. [Google Scholar] [CrossRef]
  32. Guo, X.; Niino, H.; Kimura, R. Numerical modeling on a hazardous microburst-producing hailstorm. In Towards Digital Earth—Proceedings of the International Symposium on Digital Earth; Science Press: Beijing, China, 1999; pp. 383–398. [Google Scholar]
  33. He, G.X. Study on Velocity Decluttering of New Generation Doppler Weather Radar in China. Ph.D. Thesis, Nanjing University of Information Engineering, Nanjing, China, 2012. [Google Scholar]
  34. Sun, J.; Fu, S.; Wang, H.; Zhang, Y.; Zhang, Y.; Zhang, Y.; Zhang, Y.; Zhang, Y.; Ma, R. Primary characteristics of the extreme heavy rainfall event over Henan in July 2021. Atmos. Sci. Lett. 2022, 24, e1131. [Google Scholar] [CrossRef]
Figure 1. The weather situation in the study region based on ERA5 data at 00:00 UTC on 20 July 2021. (a) 200-hPa geopotential height (blue contours; unit, dagpm), temperature (red contours; unit, °C), and jets (color fill; unit, m·s−1). (b) 500-hPa geopotential height (blue contours; unit, dagpm) and temperature (red contours; unit, °C). (c) 700-hPa geopotential height (blue contours; unit, dagpm), temperature (red contours; unit, °C), and jets (color fill; unit, m·s−1). (d) 925-hPa geopotential height (blue contours; unit, dagpm), temperature (red contours; unit, °C), and relative humidity (color fill; unit, g·kg−1); red star is positioned at Zhengzhou.
Sustainability 15 15047 g001
Figure 2. Skew-temperature−log-pressure plots for Zhengzhou station; the black solid line shows the temperature, the blue solid line shows the dew point temperature, and the red dashed line is the lift curve; at (a) 12:00 on 18 July 2021 UTC, (b) 00:00 UTC on 19 July 2021, and (c) 12:00 UTC on 19 July 2021.
Sustainability 15 15047 g002
Figure 3. Profiles of the perturbation temperature and the water vapor flux divergence. the perturbation temperature at (a) 12:00 UTC 19 and (b) 00:00 UTC 20 (c) 09:00 UTC 20 in July 2021; the water vapor flux divergence at d 12:00 UTC 19 and (e) 00:00 UTC 20 (f) 09:00 UTC 20 in July 2021.
Sustainability 15 15047 g003
Figure 4. (a) Configuration of the WRF model simulation. (b) Terrain of the WRF model simulation in Domain 3. Red star is positioned at Zhengzhou.
Sustainability 15 15047 g004
Figure 5. Comparison of observed and simulated 24 h cumulative precipitation from 00:00 UTC on 20 July 2021 to 00:00 UTC on 21 July 2021. (a) Observations. (b) Original scheme in D01. (c) Original scheme in D02. (d) Original scheme in D03. (e) New scheme in D01. (f) New scheme in D02. (g) New scheme in D03; green star is positioned at Zhengzhou.
Sustainability 15 15047 g005
Figure 6. Comparison of the observed and simulated time series of hourly cumulative precipitation in Station “Zhengzhou” (station number:”57083”).
Sustainability 15 15047 g006
Figure 7. Horizontal evolution of radar reflectivity (color fill; unit, dBZ). (a) Observed at 08:00 UTC on 20 July 2021. (b) Original scheme at 12:00 UTC on 20 July 2021. (c) New scheme at 09:00 UTC on 20 July 2021. (d) Observed at 09:00 on UTC 20 July 2021. (e) Original scheme at 13:00 UTC on 20 July 2021. (f) New scheme at 10:00 UTC on 20 July 2021; green star is positioned at the radar site in Zhengzhou. The black line in the figure indicates the profile position.
Sustainability 15 15047 g007
Figure 8. Vertical profiles of radar reflectivity in two moments of MCS development. (a) Horizontally Observed at 08:00 UTC on 20 July 2021. (b) Observed at 08:00 UTC on 20 July 2021. (c) Original scheme at 12:00 UTC on 20 July 2021. (d) New scheme at 09:00 UTC on 20 July 2021. (e) Horizontally Observed at 09:00 UTC on 20 July 2021. (f) Observed at 09:00 UTC on 20 July 2021. (g) Original scheme at 13:00 UTC on 20 July 2021. (h) New scheme at 10:00 UTC on 20 July 2021. The profile locations are shown in Figure 7. The black solid line represents 0 °C layer. The black dash line represents −20 °C layer.
Sustainability 15 15047 g008
Figure 9. Vertical profiles of the disturbance level of the temperature field (color fill; unit, K) and wind field (vector arrows; unit, m·s−1) for the three phases of the original and new MCS simulations. (a) Original scheme at 12:00 UTC on 20 July 2021. (b) New scheme at 09:00 UTC on 20 July 2021. (c) Original scheme at 13:00 UTC on 20 July 2021. (d) New scheme at 10:00 UTC on 20 July 2021. The profile locations are shown in Figure 7. The black solid line represents 0 °C layer. The black dash line represents −20 °C layer.
Sustainability 15 15047 g009
Figure 10. Mixing ratios of rainfall and cloud water (color fill; unit, g kg−1) and cloud ice (contours; unit, g kg−1), and the wind field (vector arrows; unit, m·s−1) simulated in the three MCS phases by the original and new schemes. (a) Original scheme at 12:00 UTC on 20 July 2021. (b) New scheme at 09:00 UTC on 20 July 2021. (c) Original scheme at 13:00 UTC on 20 July 2021. (d) New scheme at 10:00 UTC on 20 July 2021. The profile locations are shown in Figure 7. The blue dash line represents 0 °C layer. The black dash line represents −20 °C layer.
Sustainability 15 15047 g010
Figure 11. Mixing ratios of graupel (color fill; unit, g·kg−1) and snow (contours; unit, g·kg−1), and the wind field (vector arrows; unit, m·s−1) simulated in the three MCS phases by the original and new schemes. (a) Original scheme at 12:00 UTC on 20 July 2021. (b) New scheme at 09:00 UTC on 20 July 2021. (c) Original scheme at 13:00 UTC on 20 July 2021. (d) New scheme at 10:00 UTC on 20 July 2021. The profile locations are shown in Figure 7. The blue dash line represents 0 °C layer. The black dash line represents −20 °C layer.
Sustainability 15 15047 g011
Figure 12. (a) Total microphysical conversion production rate (unit, 10−6 kg kg−1 s−1) in convection in the original scheme at 13:00; (b) Total microphysical conversion production rate (unit, 10−6 kg kg−1 s−1) in convection in the new scheme at 10:00. (c) Average microphysical conversion production rate (unit, 10−6 kg kg−1 s−1) with height over the Zhengzhou area in the original scheme; (d) Average microphysical conversion production rate (unit, 10−6 kg kg−1 s−1) with height over the Zhengzhou area in the new scheme.
Sustainability 15 15047 g012
Figure 13. (a) Total latent heating rate (unit, 10−3 K s−1) in convection in the original scheme at 13:00; (b) Total latent heating rate (unit, 10−3 K s−1) in convection in the new scheme at 10:00. (c) Average latent heating rate (unit, 10−3 K s−1) with height over the Zhengzhou area in the original scheme; (d) Average latent heating rate (unit, 10−3 K s−1) with height over the Zhengzhou area in the new scheme.
Sustainability 15 15047 g013
Figure 14. Comparison of conceptual model of the extreme hourly precipitation of a heavy rainstorm over Zhengzhou between Original scheme and New scheme.
Sustainability 15 15047 g014
Table 1. Experimental design.
ExperimentCondensation Function
Original PCD = δ Δ t ( 1 + L v 2 q sw c p r v θ 2 ) 1
New PCD = δ Δ t ( 1 + L v 2 q sw c p r v ( θ exp [ L v 0 q s c p T ( q v q s ) k ] ) 2 ) 1
Table 2. Quantitative evaluation of precipitation fields.
ExperimentAREA Mean Correlation CoefficientAREA Mean Root Mean Square Error
Original_d010.484735.385
Original_d020.50637.154
Original_d030.55931.159
New_d010.50933.817
New_d020.51934.792
New_d030.59428.657
Table 3. Quantitative evaluation of station precipitation.
ExperimentCorrelation CoefficientRoot Mean Square Error
Original_d010.0636.77
Original_d020.0536.98
Original_d030.2834.06
New_d010.2932.81
New_d020.3031.69
New_d030.3631.95
Disclaimer/Publisher’s Note: The statements, opinions and data contained in all publications are solely those of the individual author(s) and contributor(s) and not of MDPI and/or the editor(s). MDPI and/or the editor(s) disclaim responsibility for any injury to people or property resulting from any ideas, methods, instructions or products referred to in the content.

