Article

Identification and Assessment of Potential Microplastic Emissions within the Lake Tollense Catchment Area, Mecklenburg-Western Pomerania, Germany

by
Elke Kerstin Fischer
*,
Tilmann Gahrau
and
Matthias Tamminga
Center for Earth System Research and Sustainability, Working Group Microplastic Research at CEN, University of Hamburg, Bundesstrasse 55, 20146 Hamburg, Germany
*
Author to whom correspondence should be addressed.
Sustainability 2023, 15(20), 15048; https://doi.org/10.3390/su152015048
Submission received: 6 September 2023 / Revised: 16 October 2023 / Accepted: 17 October 2023 / Published: 19 October 2023
(This article belongs to the Section Pollution Prevention, Mitigation and Sustainability)

Abstract

:
The present study was carried out within the MICROLIM project funded by the German Research Foundation DFG, which aims at an overall assessment of microplastic concentrations in different environmental compartments of the Lake Tollense catchment. Here, we address potential input sources of microplastic and their occurrence in the catchment and provide first estimates of emission volumes based on population density, agricultural activities and traffic. The land cover of the Lake Tollense catchment, located in Mecklenburg-Western Pomerania, Germany, is dominated by agriculture and comprises the city of Neubrandenburg in the Northern part of the lake and additional minor settlements in the rural areas. The catchment area is divided into six sub-catchments according to the lake’s tributaries. The methodological approach comprised (1) a literature review of potential sources of microplastic, their potential composition, application approaches and possible effects on the environment, (2) the determination of land use types within the lake Tollense catchment via a descriptive land-use analysis and examination of the identified land-use types for the occurrence of microplastic-emitting applications according to the initial literature review and (3) a quantitative estimation of the emission volumes of the population (including tourists), transport and agricultural activities in the catchment area, applying specific emission rates. Potential microplastic emissions could be identified from urban agglomerations and the agricultural and transport sectors. The first quantifications of the emission potential of particulate matter in the size of 10 µm (PM10) from the transport sector resulted in an average of 14.5 tons per year on state and federal roads. The total annual emission volume of the population in the study area is estimated at an average of 138.6 tons per year. The calculated volumes of particulate emissions from roads and traffic indicate that transport is the most important emission source in the Lake Tollense catchment area.

1. Introduction

Plastics play an essential role in everyday life. Due to their properties, there are countless forms in which plastics are used, which results in a massive demand for plastics [1]. In 2019, global plastics production reached almost 368 million tons, while in Europe, plastics production reached almost 62 million tons [2].
Microplastics (MPs), plastic particles < 5 mm, are intentionally produced in this size as primary MPs (used e.g., in the cosmetics industry) [3,4]. Secondary MPs particles result from the environmental degradation of larger plastic items [3]. MPs, as such, can easily be transported throughout our ecosystems and have been detected in various environments and biotic and abiotic media [5,6,7,8,9]. Due to their ubiquitous presence in our environment, MPs can enter the human metabolism through inhalation and ingestion, which has most recently been demonstrated by the presence of MPs in human tissue and blood [10,11]. Besides the direct hazardous effects on ecosystems and organisms, MPs exhibit an ecotoxicological threat due to their potential to adsorb organic pollutants and heavy metals and to act as vectors [12,13].
Littering, wear and tear of macroplastics, inadequate waste management systems, wastewater and transport are the main contributions of microplastics to the ecosystem [14,15]. According to a consortium study conducted by the Fraunhofer Institute, the per capita emission rates of microplastics in Germany were estimated based on an extensive literature survey and research. The study evaluates 51 different sources of plastics from all sectors and assumes a per capita emission of 4000 g/cap (a). Among other sources, emissions relate to tire wear (1229 g/cap (a)) followed by releases from waste disposal (303 g/cap (a)), abrasion of bitumen in asphalt (228), pellet spills (182) and drift from sports and playgrounds (132) [14].
Compared to marine ecosystems, lake catchment areas are characterized by specific features. Most importantly, they usually have significantly smaller dimensions than marine basins, facilitating a holistic investigation. This results in altered ratios of area and volume of the water body to catchment size. Thus, potential influencing factors are likely to cause a more distinct signal—for example, heavy or persistent precipitation and flood events or anthropogenic pressure resulting from higher settlement densities and different use options [16,17,18,19].
Internal emitters of MPs in limnic ecosystems are, e.g., fisheries, shipping, and recreational activities. However, a significant proportion of MPs in lakes originate from external terrestrial sources via receiving streams [20] and also via the atmosphere [21].
Research on the origin, fate and behavior of microplastics in lake ecosystems still has limitations due to the lack of comprehensive, comparable data from holistic monitoring of the many sources. Furthermore, empirical studies on MP occurrences in our ecosystems often do not sufficiently take into account the actual presence of potential sources, from which a direct link between emission sources and measurement results in ecosystem compartments could be justified. This study aims to circumvent these limitations by implementing a top-down approach to identify the main emitters of microplastics from terrestrial sources in the catchment area of Lake Tollense, Mecklenburg-Western Pomerania. We address potential major input sources for MPs and provide first estimates of emission volumes based on population density, agricultural activities and traffic. This is achieved by (1) identifying potential MP sources from the literature, (2) identifying and evaluating their occurrence within the catchment of Lake Tollense and (3) assessing which sub-catchments bear significant MP emission potential.

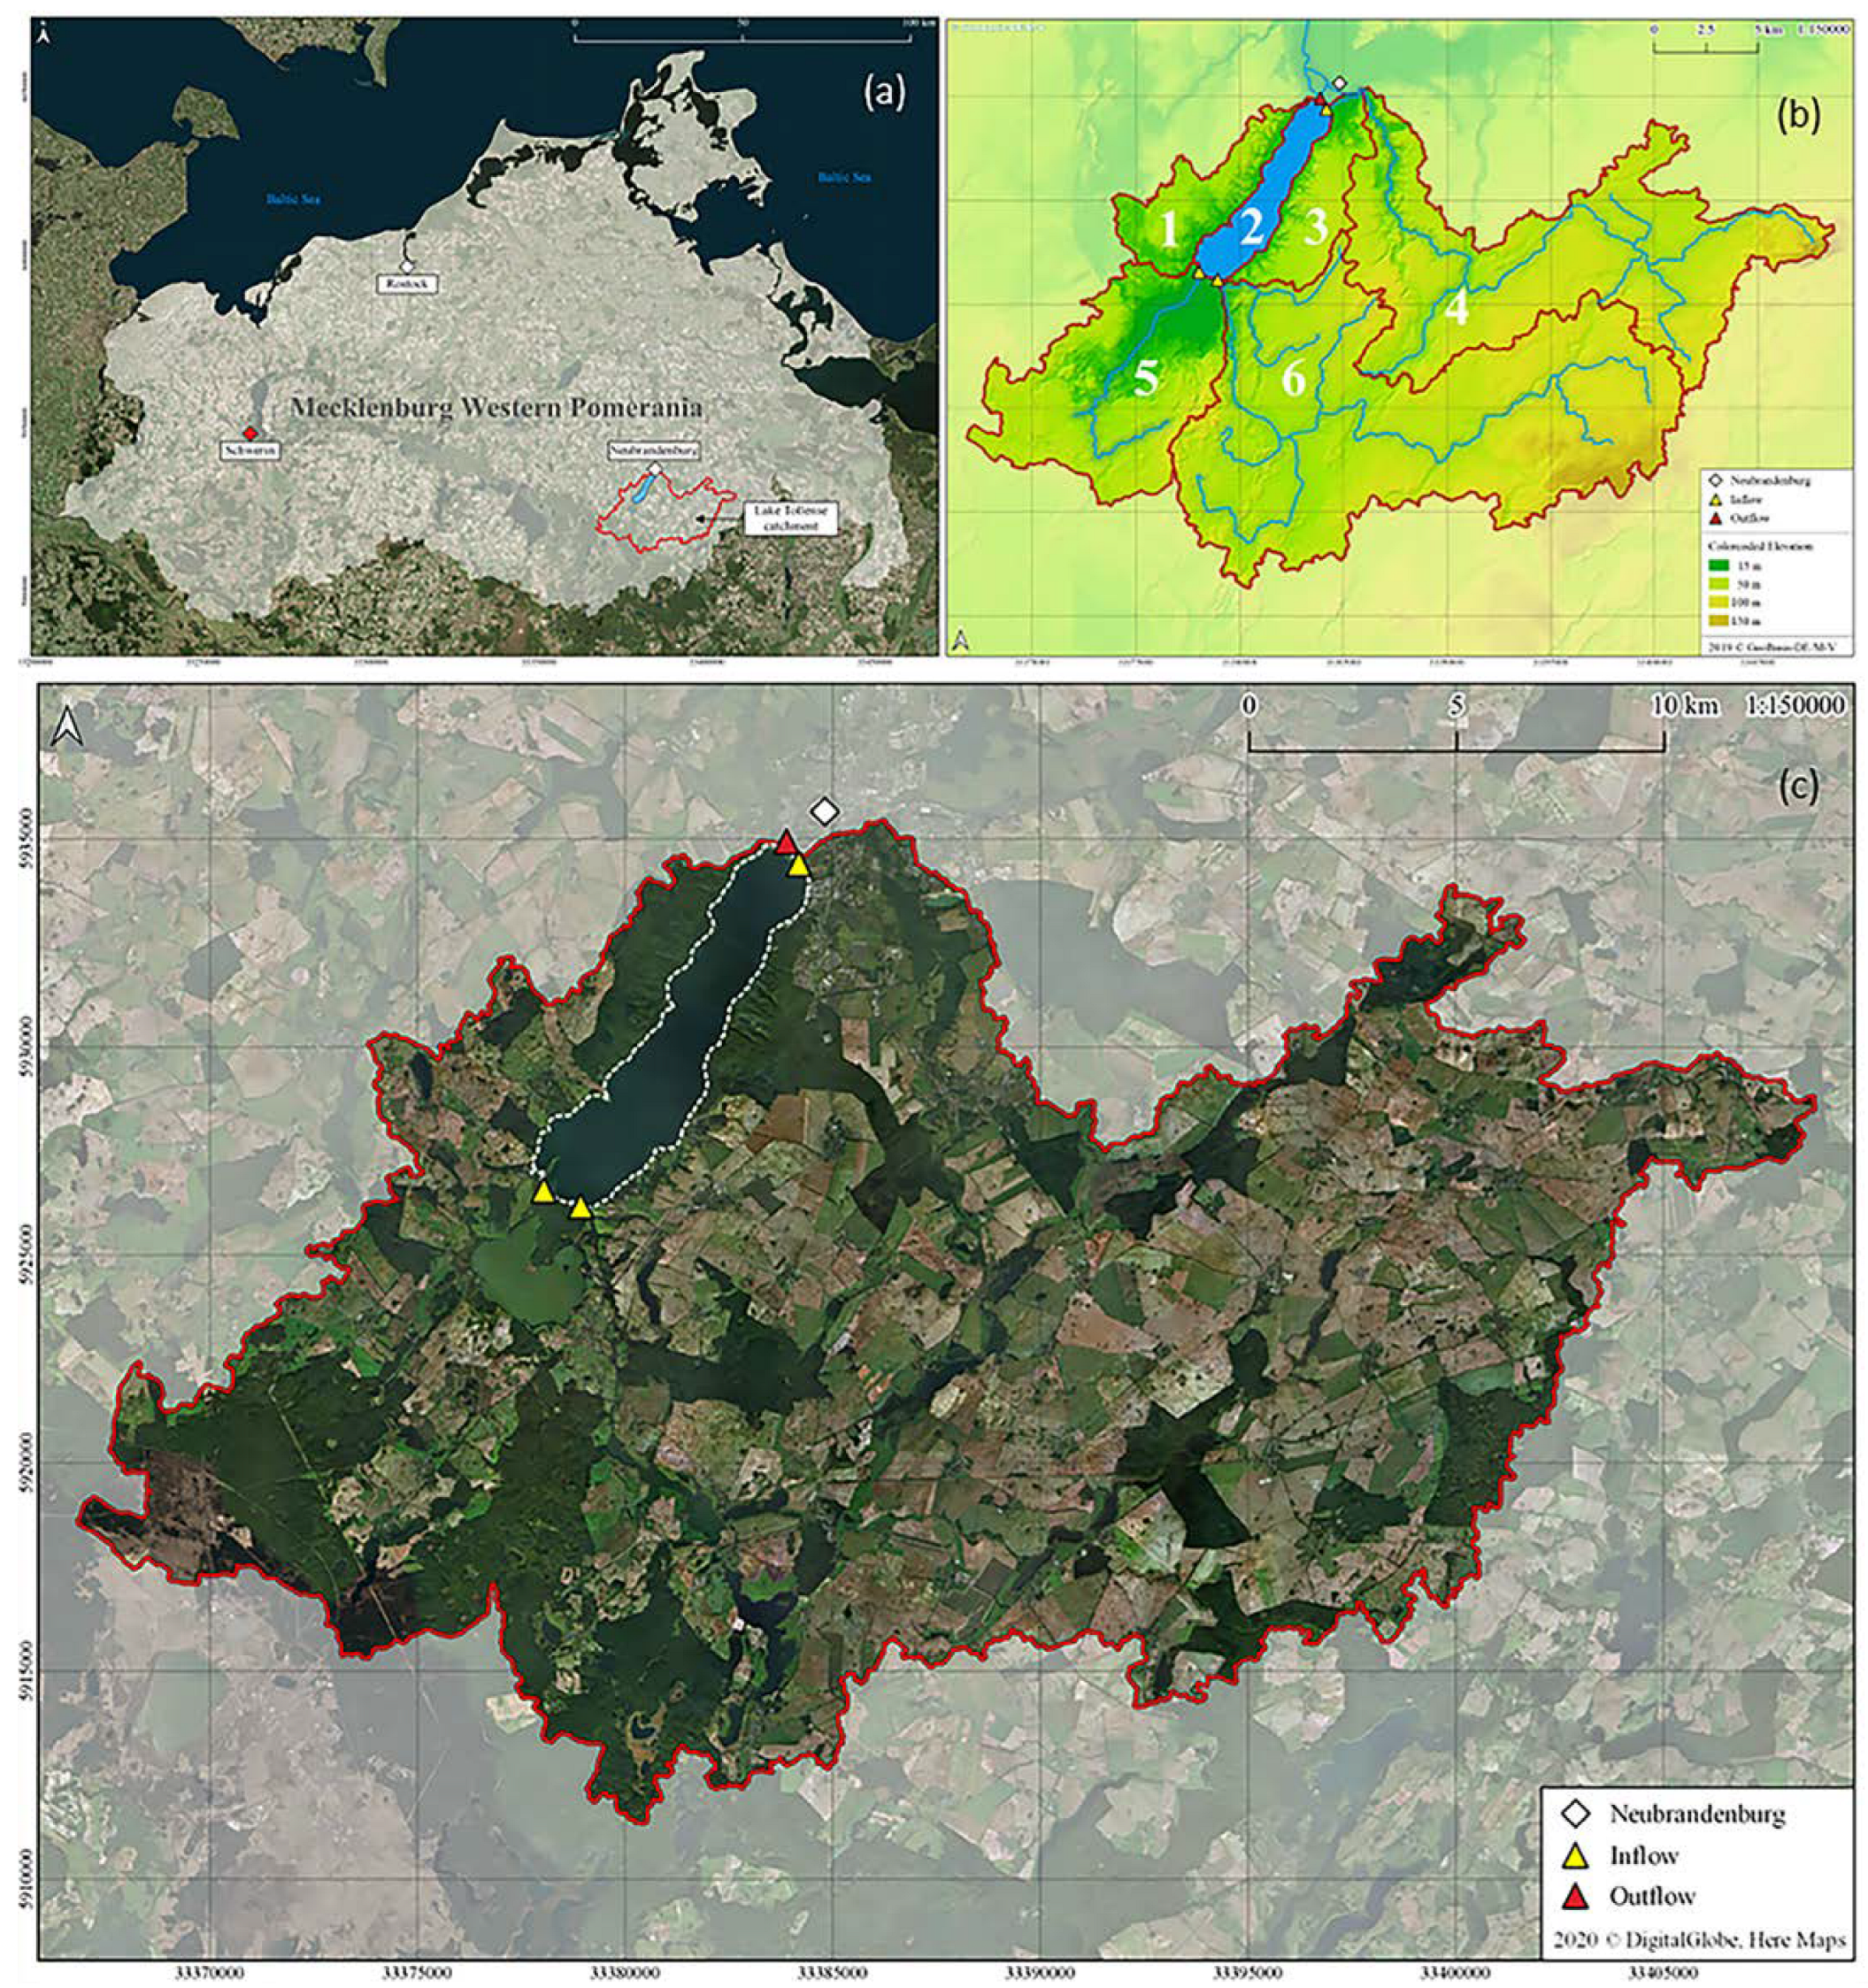
2. Materials and Methods

Lake Tollense is located in the southeast of Mecklenburg-Western Pomerania, Germany, bordering on the city of Neubrandenburg (Figure 1). The Lake Tollense catchment stretches between Blumenholz and Weisdin in the south and the city of Neubrandenburg in the north (63,040 inhabitants [21]). The lake and its catchment area belong to the landscape and tourist area of the district “Mecklenburgische Seenplatte” [22]. In 2018, Neubrandenburg had a total of 54,747 visitors, an increase of 11.5% from the previous year, and 109,535 overnight stays. The average length of stay was two days [23].
The lake’s surface of 17.77 km2 extends from southwest to northeast. Lake Tollense is 10.3 km long, up to 2.4 km wide, up to 30 m deep and has an average water depth of 17.3 m. Thus, it is one of the largest lakes in Mecklenburg-Western Pomerania.
Most of the Lake Tollense tributaries are located at its southern shoreline, while it drains to the north (Figure 1). Tributaries and their respective average discharge (given in brackets) are the Gätenbach (Linde) (0.55 m3/s), Nonnenbach (0.57 m3/s), Lieps (0.49 m3/s), Krickower Bach (0.10 m3/s) and Wustrower Bach (0.10 m3/s) [24,25,26,27,28,29]. At its northernmost point, Lake Tollense drains through Neubrandenburg with an average flow rate that amounts to 2.6 m3/s at medium water and 0.27 m3/s at low water [30] and merges with the Lindenbach into the Tollense river (1.87 m3/s) [26,27,28,29,30,31]. Within 40 km to the north-east, the Tollense river flows into the river Peene and ultimately reaches the Baltic Sea [32].
The environment of the catchment area, which overlaps the Special Area of Conservation (SAC) “Lake Tollense”, consists of forest and water landscapes with meso- and eutrophic lakes and streams. The area around the lake is characterized by semi-natural dry lime grasslands to the west and moor grass meadows to the south, as well as marshes, calcareous swamps, woodruff and woodruff swamps [25]. Coniferous forests line the higher northeastern part, while beech forests, moorland and floodplain forests shape the southern area around the shallow water area of Lieps. Cladium swamps, bog and alluvial forests can be found, too, and receive individual attention as priority habitat types [31,32,33]. The heterogeneous landscape and a large number of nature reserves, environmental and specific protected areas provide important conditions for niche populations of vegetation and fauna, which contribute to the generally high biodiversity of the region [34,35].
The Tollense catchment area was intensively investigated within the MICROLIM project aiming to record and analyze the occurring concentrations of MPs in the different ecosystem compartments: water—sediment and atmosphere. This included the analysis of the shoreline sediments in spatial and temporal resolution and sediment samples from the lake bottom along the longitudinal extent of Tollensesee. The mean microplastic concentration determined was 1410 particles/kg dry weight for lakeshore sediments and 10,476 particles/kg dry weight for lake bottom sediments. Elevated microplastic levels were detected on the beach with the lowest anthropogenic influence, but this is near a tributary whose watershed consists primarily of agricultural land that acts as a potential pathway for microplastics to enter Lake Tollense [36]. In addition, microplastics in the lake’s water body revealed MP concentrations between 123 and 1728 particles m3, with decreasing MP fragment concentrations with increasing depth. In addition to the inherent properties of the particles, the spatial distribution patterns indicate wind-induced mixing, which also affects the intensity of the vertical concentration gradients [37]. With regard to atmospheric inputs, the daily deposition is in the range of 53 and 72 MP particles/m2 without showing significant differences between geographic expositions; it does, however, show dependencies to predominating wind directions [38].
In a top-down approach, an exploratory analysis of the potential sources of microplastics in the environment formed the framework of the study determining the occurrence and potential of microplastic emissions.
A literature review was carried out, retrieving information on potential emitters, including composition of the source material, the type of application and possible effects on the environment. Citavi 6 [39] was used to find and gain access to relevant publications using the keywords “microplastic*” and “plastic*” in combination with further classifying terms related to sources and applications. Furthermore, the spatial relation of potential emissions derived from the literature survey to the study area was established by descriptive land-use analysis. Subsequently, a remote sensing analysis was carried out to determine potential sources in the study area, applying Excel 2016 [40] and QGIS [41] within projection of the European Terrestrial Reference System from 1989, UTM zone 33N, EPGS 5653. Data on the river Tollense catchment were obtained from the agency Landesamt für Umwelt, Naturschutz und Geologie, Mecklenburg-Vorpommern (LUNG MV [42]). These were processed to excerpt the catchment and sub-catchments of the lake and to calculate the area of the sub-catchments. Land-use data for the analysis was obtained from Corine Land Cover (CLC) via Copernicus [43]. Within QGIS, The CLC 2018 shapefile was integrated into an SQLite database and intersected with the catchment area and data on land-use types, and associated sectors were retrieved. In order to derive the specific emission potential from the extensive use of high-density polyethylene films of fodder storages within agricultural sectors, a visual interpretation of satellite data intersected with “agricultural areas” derived from the CLC land-use analysis was carried out based on Digital Glove/Here Maps [44].
Potential emissions of population and transport in the catchment area according to emission rates were derived from the literature review. The average population density per km2 per sub-catchment was calculated based on population numbers (per capita values) retrieved from local municipalities and numbers of annual visitors from statistical reports [24]. These data were intersected with sub-catchment boundaries. Plastic emission rates per capita were calculated according to Bertling et al. [14] by multiplying the published emission values in g per day and capita with the population data, taking into account the respective length of stay concerning tourists and assuming similar behavior in residents.
For evaluating emission rates caused by traffic, the road network and statistics related to traffic volume were retrieved from Geoportal MV [45]. The latter was used to display motorways, federal, state and district roads. Within this study, only federal and country routes with monitoring points (IDs) and their recorded sections were included and data were divided into light and heavy traffic with annual figures. These results were related to the length of the specific road class within each sub-catchment, and the emission factor was calculated according to Quass et al. [46], referring to the annual particulate matter (PM10) emissions by multiplying them with the vehicle kilometers travelled by the respective vehicle category. According to these vehicle categories, the emission factors were 0.033 (g/km*LV) for “light vehicles”, e.g., cars and lighter, and 0.187 (g/km*HV) for “heavy vehicles”, e.g., trucks and similar [46].
In synthesis, data and findings derived from land-use analysis per sub-catchment, distribution and intensity of anthropogenic pressure via population, agriculture and transport and the related emission potentials were combined and evaluated and ranked accordingly.

3. Results

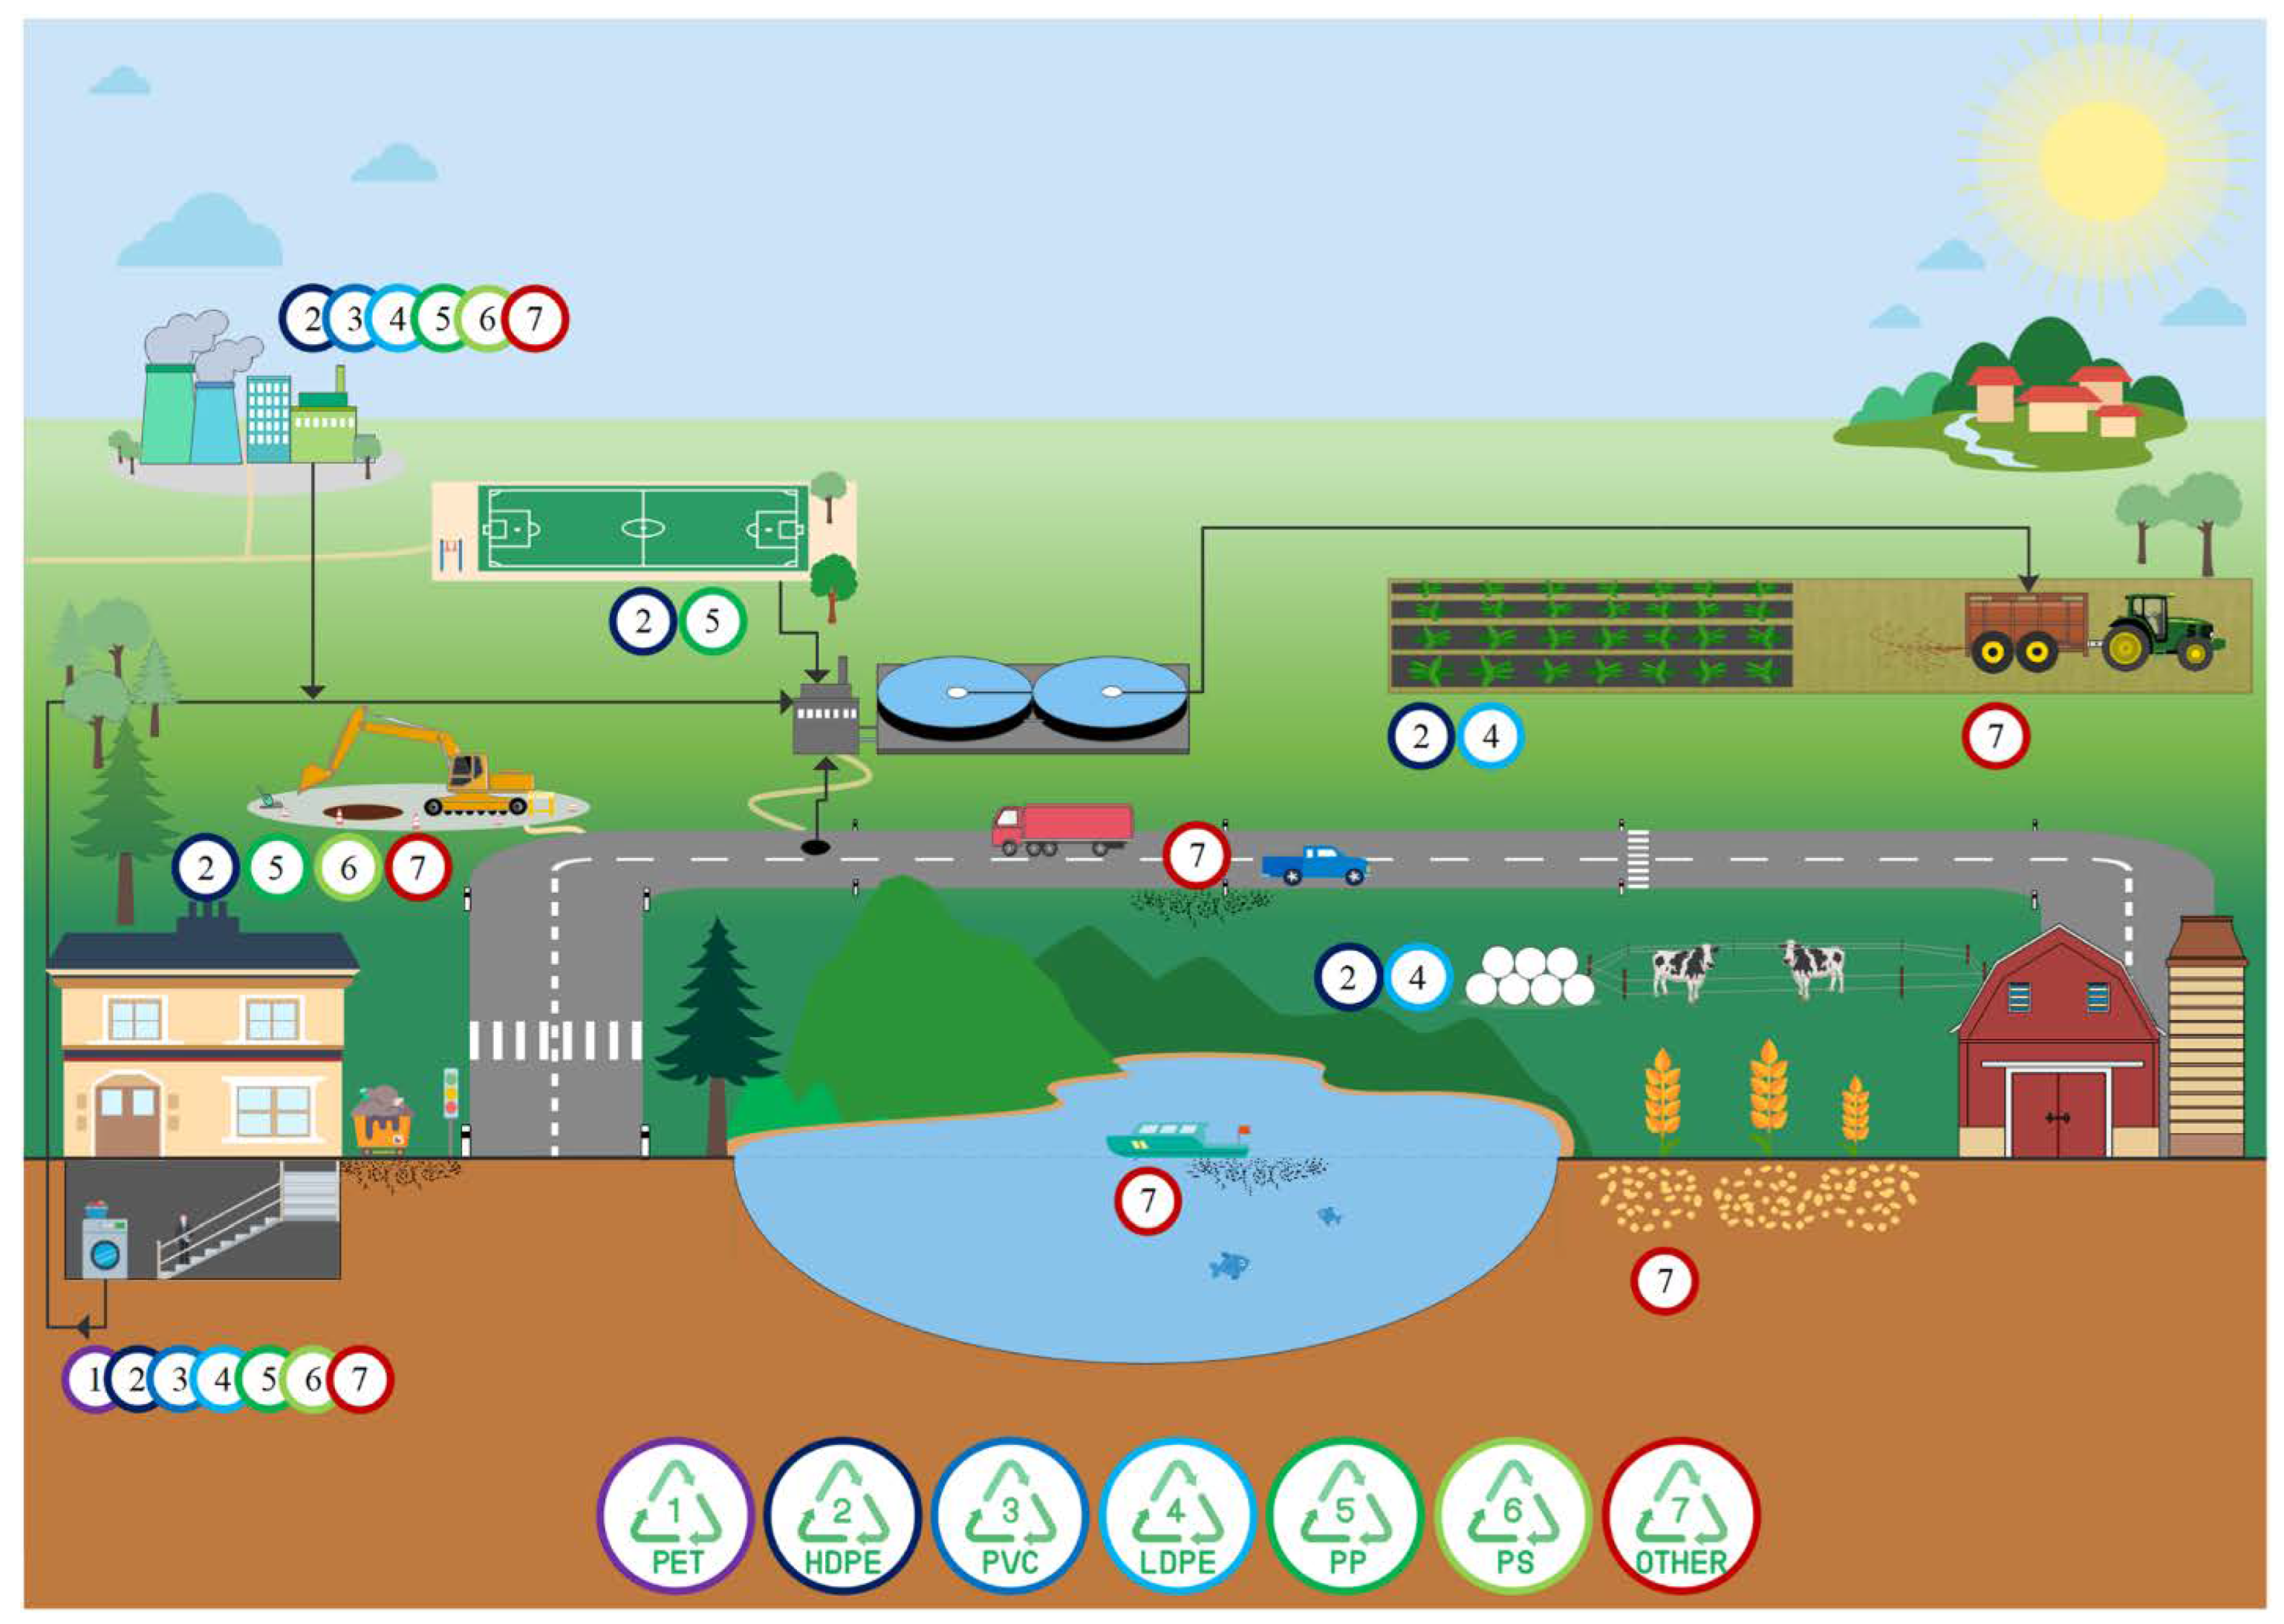
3.1. Literature Survey—Exploratory Identification of Potential Sources of Microplastics

Within the literature survey, a total of 102 publications were analyzed towards microplastic sources and entry paths. The majority of these were 68 publications in scientific journals, followed by 18 scientific contributions in books, 9 reports from governmental agencies and institutes, 4 conference papers and 3 press releases.
The potential sources of MP emissions excerpted from the literature survey are multitude and comprise agriculture applications, construction sites, transport, households and recreational activities (Figure 2).

3.1.1. Sources of Microplastics in Agriculture

In agricultural areas, sewage sludge is applied to farmland as a biosolids fertilizer containing large amounts of microplastics [47]. Within wastewater treatment facilities, which are optimized for particle retention, up to 98% of the microplastics from the wastewater can be retained [48]. However, considerable amounts of meso- and microplastic particles are contained in the sewage sludge [49,50,51,52,53,54]. A relevant proportion of microplastics in sewage sludge are fibers that are more prone to pass filter systems due to their morphology and may subsequently be released back into the environment via sludge application in agriculture [55,56,57,58]. Discharges from urban areas, especially via surface run-off from sealed surfaces to the sewage treatment plant, increase the potential microplastic amount. Large proportions of sewage sludge are incinerated and can be used for thermal energy generation [59], whereas less than one third of the approximately 1.8 million tons of municipal sewage sludge in Germany is used for fertilization purposes in agriculture and landscaping. The remaining amount is used as secondary fuel, in power plants, for example, or is deposited in landfills [59,60].
Covers and foils made predominately from polyethylene (PE) have been used in agriculture extensively since 1938 [61,62,63,64,65,66,67]. However, when embedded in the soil, plastic films and foils also applied in bales and so-called drive-in silos serving as fodder storages undergo physical crushing, chemical ageing and biodegradation and are ultimately converted into microplastics [68,69,70] (supplementary information, Figures S1 and S2).
A third agricultural application of plastics is present with polymer-based seed coating that are put onto the surface of seeds to improve seed properties and handle characteristics [71]. It is used for applying colors and tracers; protectants (e.g., pesticides); soil adjuvants (e.g., hydro-absorbers); compounds that stimulate germination, growth, and stress resistance; nutrients and inoculants [72,73,74,75]. Surface abrasion from handling in the seeding process can contribute additional dust-off and atmospheric deposition to the emission potential [71].

3.1.2. Sources of Microplastics in Urban Areas—Population and Industrial Activities

Urban areas have been observed to be a significant driver of microplastic emissions. Higher abundances of microplastic emissions at sites close to urban areas have been found [76]. Soil sealing amplifies discharge from surface run-off in urban areas, as the degree of sealing is related to the type of land-use and the population density [77].
The emission potential of a household within urban areas depends on the number of inhabitants and their consumer behavior. The main potential lies in the releases from waste disposal and composting [14]. The abundance of packaging materials, containers and bottles, cosmetics and cleaning products in urban households increases the risk of pollution during their disposal process. Synthetic clothing, carpets, furniture and cleaning cloths made of acrylic, nylon, polyester or similar synthetic fabrics contribute to emission potential due to abrasion [4,49,78]. Abrasion of insulation material, paints and varnishes on buildings contributes to further emission potential through surface run-off [15].
Recreational activities at sports facilities and playgrounds made of artificial turf or other surfaces that include polymers such as ethylene propylene diene monomer (EPDM) are especially prone to microplastic emissions [15,79]. Leisure equipment, such as scooters, skateboards and bicycles, also contributes to the emission potential of urban areas through tire abrasion [78]. Boats and vessels are potential sources by shedding and releasing particles from paints, varnishes and antifouling coatings, directly discharging into the water bodies [80].
Industrial applications and construction sites also contribute to microplastic emission, as they add to the waste volumes containing macro- and microplastics. Furthermore, primary microplastics from powder coatings can enter the wastewater cycle or enter the environment directly [81,82]. Although this sector has not been sufficiently studied yet, spillage of industrial microplastics from production plants have been reported [83].

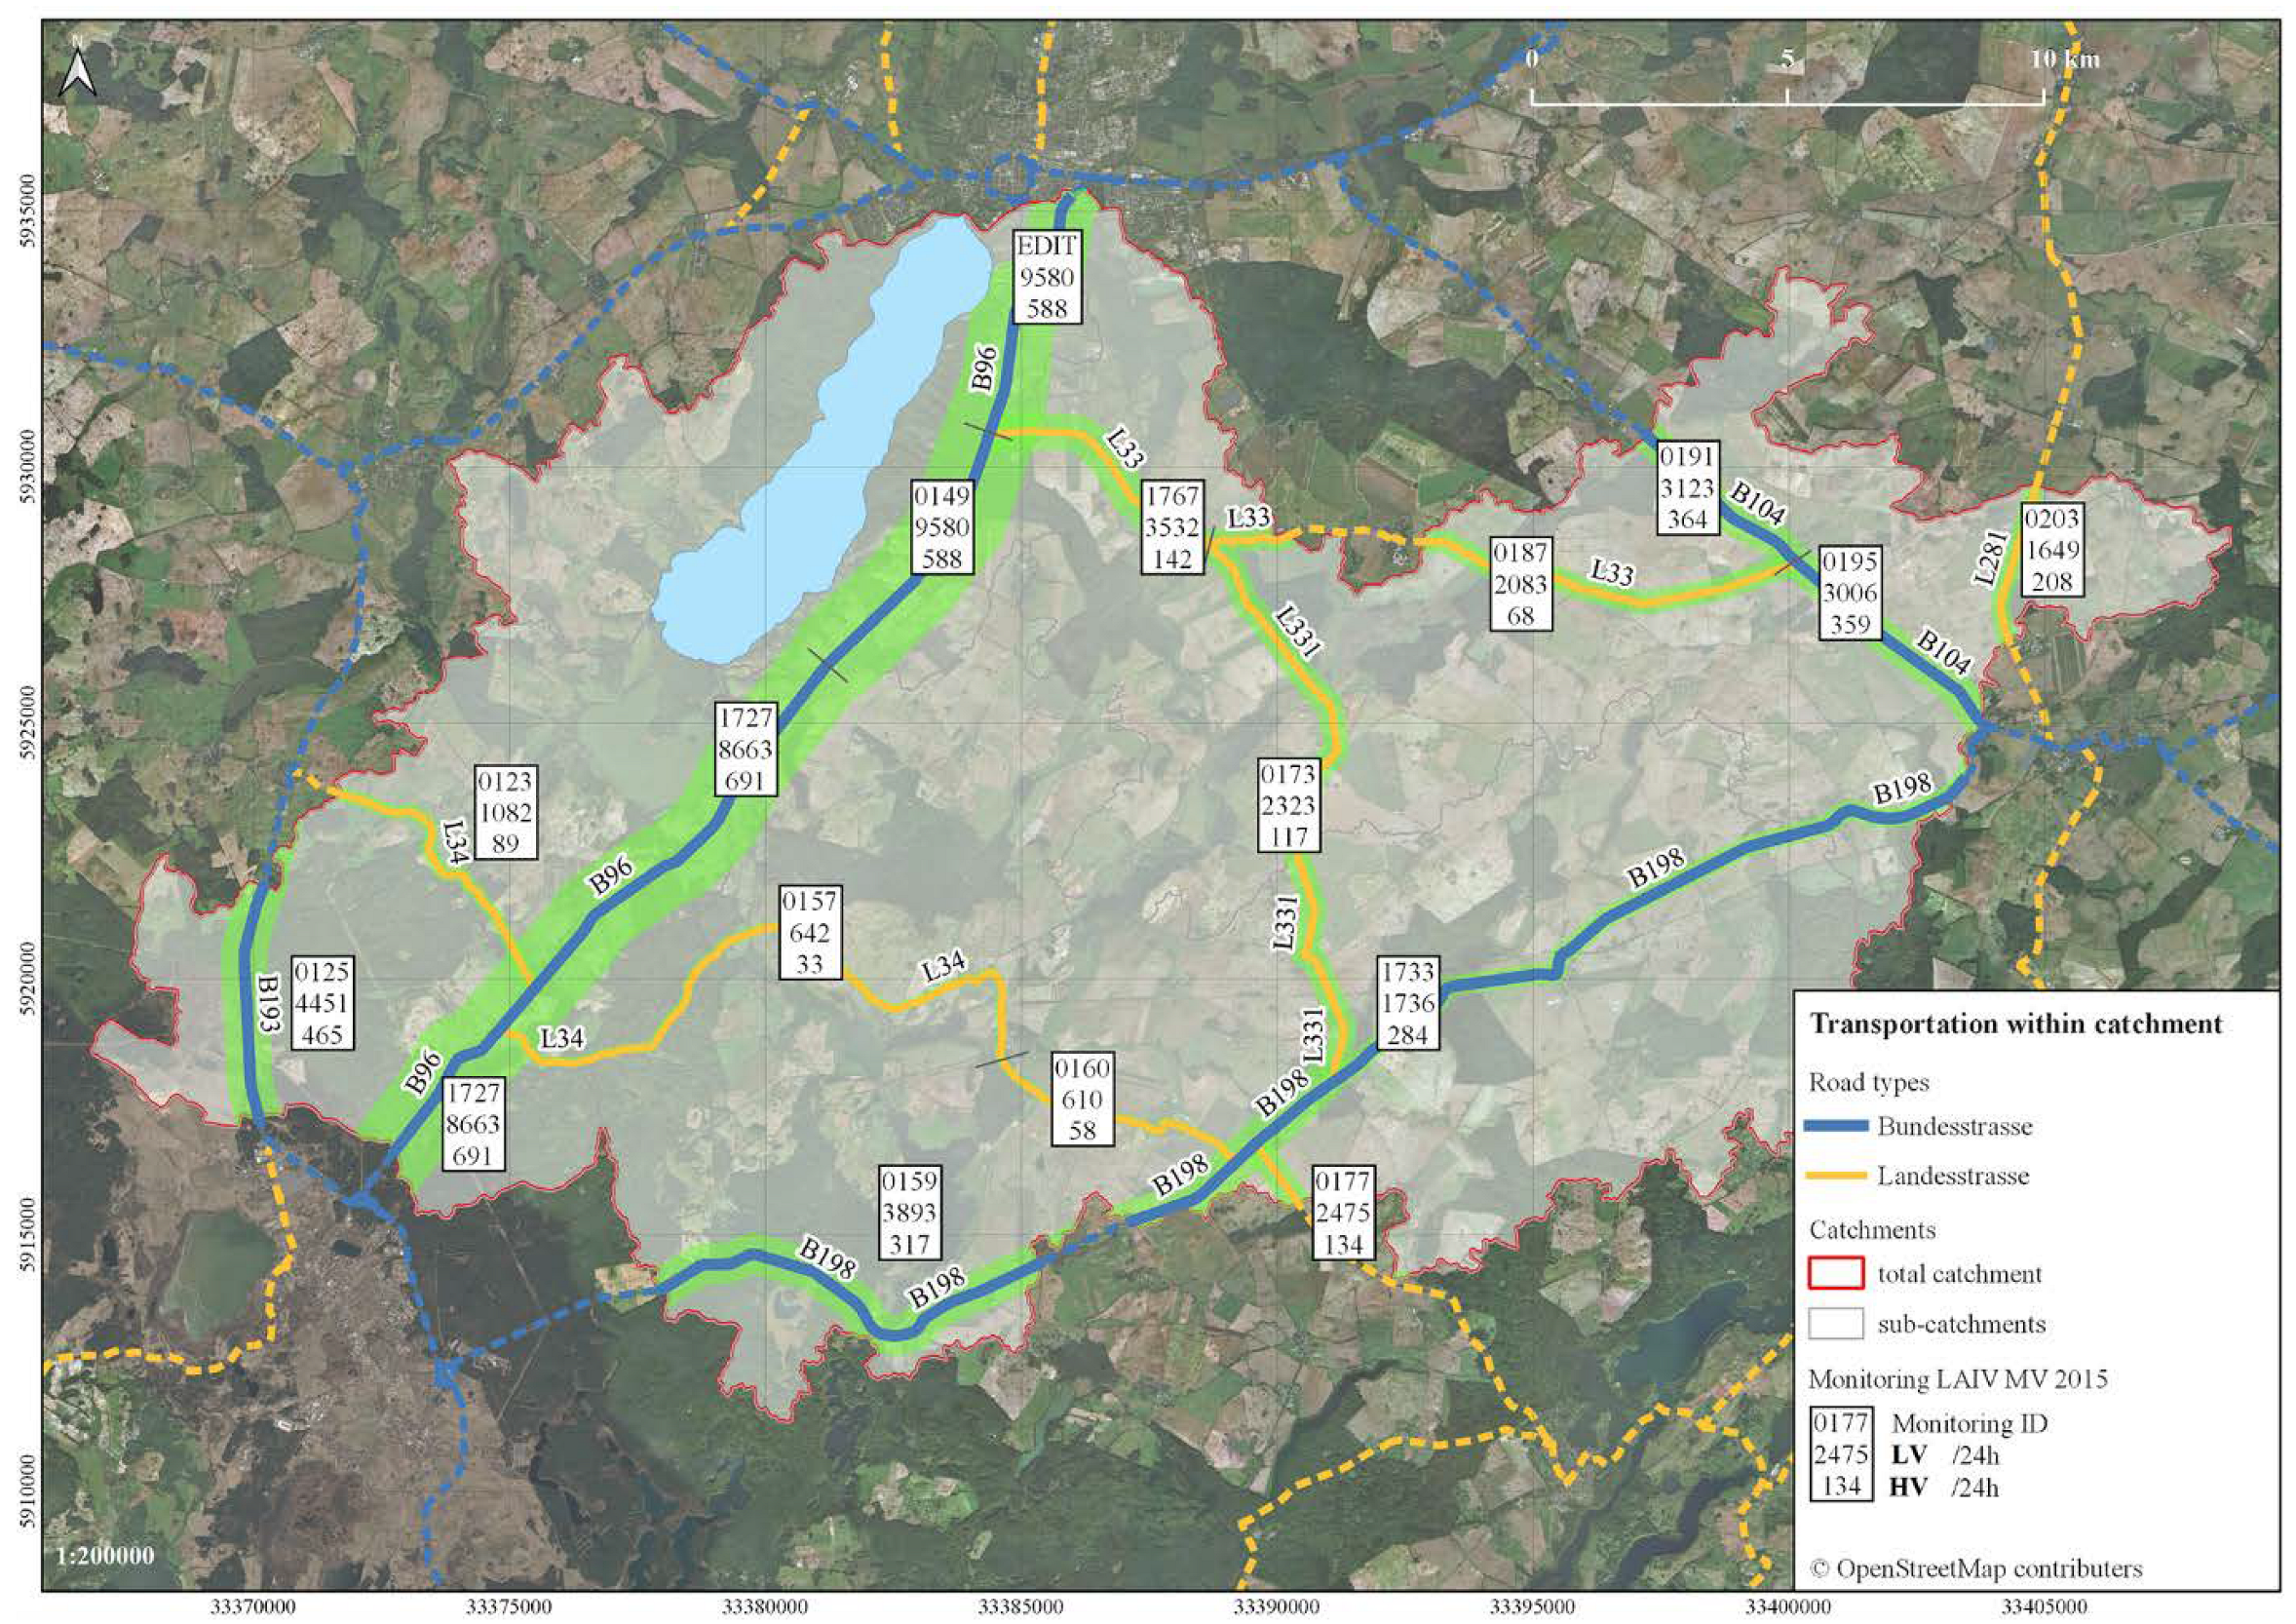
3.1.3. Sources of Microplastics from Transport

In the transport sector, particles containing polymers are released into the environment by abrasion of the tire or the road itself, wear and tear of brakes and other strained components of the vehicles [84]. Several studies have highlighted the microplastic contribution to the PM10 (particulate matter of 10 μm size) emissions alongside roads [46]. Rubber in tire treads, polymers in bitumen used in road pavement and thermoplastic elastomers in road-marking paints are believed to be the main contributors to microplastic emissions [85,86]. Adding to the tire material, the road itself bears emission potential through abrasion. Stone mastic asphalt, also used in the investigated catchment area, also contains additives such as cellulose fibers, polymer granulate and other fillers [87] (supplementary information Figure S3). Polymer-modified bitumen (PMB) is used to increase the strength, stability and adhesive properties of the pavement. Both thermoplastic markings and water-based polymer paints are used on German roads [83,88,89]. Analysis within flow and deposition modeling indicate that 74% of the total emission volume is deposited in road-side soils, 22% in surface water, and 4% in soils [90].

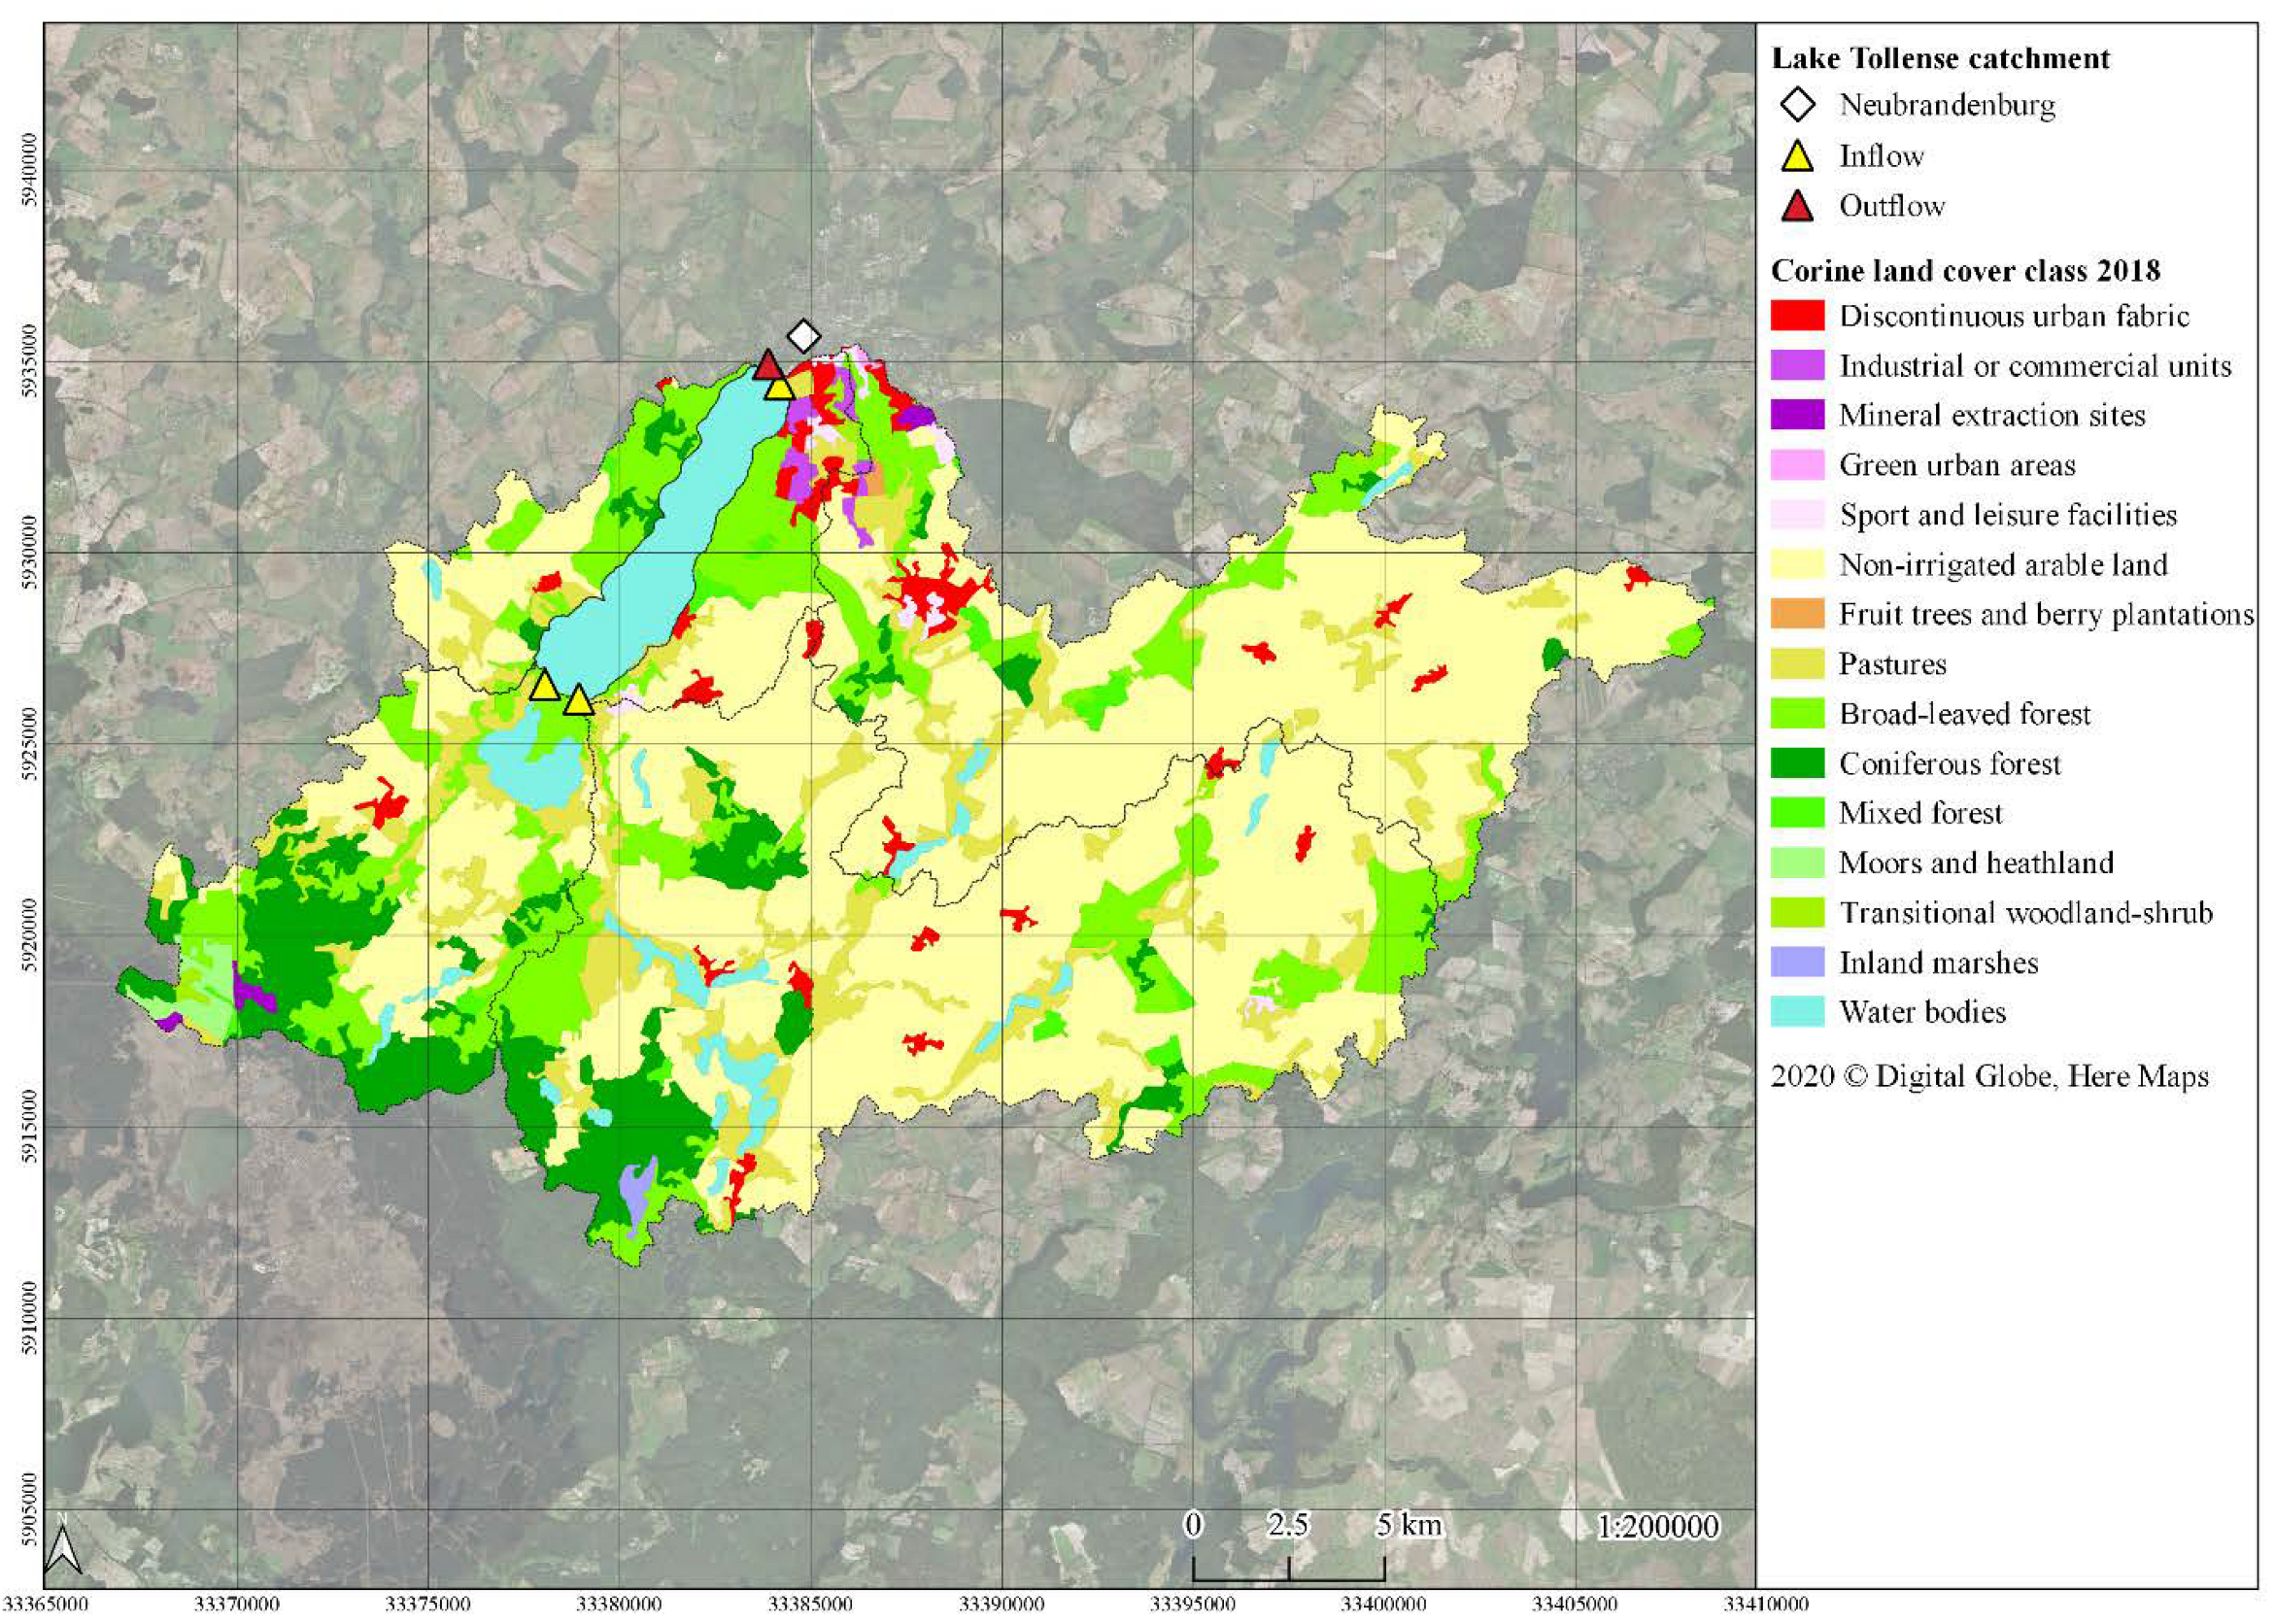
3.2. Land-Use Analysis

The initial analysis of sub-catchment areas revealed that the largest area is covered by the sub-catchment Nonnenbach (219.1 km2), followed by Linde (148.4 km2), Lieps (84.9 km2), Lake Tollense west (27.4 km2) and Lake Tollense east (26.2 km2). The lake itself accounts for 17.8 km2, summing up a total catchment area of 523.7 km2.
The land-use analysis of the total catchment area of Lake Tollense, aggregating land-use types (supplementary information Table S1, Figure S4), revealed that agriculture (63.9%) and forestry (25.3%) dominate the landscape area. Especially, non-irrigated arable land for cultivation occupies 278.5 km2, which represents 53.2% of the total catchment area. Water bodies including Lake Tollense and smaller lakes take up 31.88 km2 or 6% of the catchment, excluding tributaries and streams. Urban areas cover 16.96 km2 or 3.2% of the total catchment (Figure 3, supplementary information Table S2).
The southeastern sub-catchment of “Nonnenbach” and “Linde” in the northeast are characterized by agriculture, with the highest percentage of agricultural land-use compared with the other sub-catchments surrounding the lake, with 59.9% and 69.0% of “Non-irrigated arable land”, respectively. The sub-catchment “Lieps” is shaped by its distinctive natural areas, like “Moors and heathland” and a large share of forest area (48.7% or 41.4 km2 when all forest types are combined), especially “Coniferous forest” (21.1 km2). “Sport and leisure facilities” can be found in all sub-catchments except “Lieps”, generally occupying a relatively small spatial consumption. “Lake Tollense east” shares the highest presence of urban areas like “Discontinuous urban fabric”, with 11.6% or 3.0 km2, as well as “Industrial and commercial units” occupying 6.7% or 1.8 km2 of the sub-catchment. The western side of the lake, with its sub-catchment “Lake Tollense west”, is predominantly covered by “Non-irrigated arable land” (46.9% or 12.8 km2) and “Pastures” (11.7% or 10.0 km2), as well as the highest share of “Coniferous forests” (24.8% or 21.1 km2) along the northern lakeside (supplementary information Table S4 provides detailed information according to the sub-catchments).
The validation of emission potential-related application within agriculture, via remote sensing of satellite imagery of the Lake Tollense catchment, revealed 69 occurrences of fodder storages with polyethylene film within the catchment area, in the form of drive-in silos, hay bales or both at the same location. They were exclusively situated in areas described as arable land or adjacent (supplementary information Figure S5).

3.3. Assessment of Microplastic Emissions

The microplastic emissions per year caused by the population of 34,361 inhabitants in the catchment area (supplementary information Table S3) is estimated as 137.4 tons per year. Emissions by tourists increase this mass by 1.2 tons per year.
The results on MP emissions related to transport are summarized in Table S6 (supplementary information) and Figure 4 (see individual tables on sub-catchments in the supplementary information Table S5a–d). The transport network within the catchment area is well developed and covers all sub-catchments. Federal roads (“Bundesstrassen”) account for 64 km, while state roads (“Landesstrassen”) cover 57 km. The traffic volume, surveyed on federal and country roads and separated into light and heavy traffic as daily cars, is distributed unequally in the catchment area of Lake Tollense. On average, state roads are less frequented than federal roads. Especially, urban areas south of the city of Neubrandenburg, alongside the B96, are frequented by both classes. State roads like the L33 connect small towns like Burg Stargard in the “Linde” sub-catchment and villages, while connecting the federal roads as well. The sub-catchment with the most road kilometers of both road types is “Lieps” (Table S6, supplementary information). This area is also the most heavily trafficked in terms of vehicle kilometers, with the highest PM10 emissions, from tire, clutch, brake and wearing course abrasion, totaling 8.84 tons per year. The total estimated PM10 emission potential in the transport sector is estimated at an average of 14.52 tons per year on state and federal roads within the catchment area.

3.4. Synthesis and Ranking of MP Emission Potentials in the Sub-Catchments of Lake Tollense

At this point, a preliminary ranking was applied to the sub-catchments that allowed a comparative overview of their respective emission potential. They could be ranked according to either the results from the land-use analysis or by their estimated emission volume. The sub-catchments were ranked from 5 points (highest emission potential) to 0 points (lowest emission potential), equaling the number of sub-catchments. The ranking is relative to all the values within the row.
Ranked by land-use, emissions from agricultural applications are most probable in “Linde” and “Nonnenbach” in the northeast of the catchment area, as they share the highest agricultural spatial consumption (Table 1). This is attributed to the individual sub-catchments through the land-use ratio, as well as to the total catchment by the sum of agricultural area. The sub-catchment “Lake Tollense east” is, due to its land-use ratio, deemed susceptible to microplastic emissions from urban areas, while “Linde” shares the highest urban area in the total catchment. In terms of emissions related to transport and population, the emission volumes related to population are far greater than those related to traffic in general.

4. Discussion

The research approach taken in this study resembles various approaches taken in scientific studies on microplastic emissions and faces similar significance and limitations. In a study on the total Swedish discharge of microplastics to the sea, the Swedish Environmental Research Institute mentioned the lack of quantitative data and found it impossible to summarize the total discharge. An attempt to rank the sources according to their contribution was made but found to suffer from a large degree of uncertainty [78]. In Italy, agricultural plastic waste was estimated using satellite images [91]. For more reliable data, comparable methodology and monitoring is currently lacking and needs to be expanded to a larger scale in the future [92,93,94]. Research into the technical, environmental, economic and social aspects of microplastic emissions needs to be standardized and expanded accordingly to capture and monitor the entire cycle of plastics.
The Lake Tollense catchment is characterized by ubiquitous microplastic emissions from numerous sources, with fluctuating intensity and uneven spatial distribution. The literature review identified multiple sources of microplastics from various applications the catchment is volatile to, and this was supported by the land-use analysis. In particular, the predominant land-use of agriculture is a characteristic regional feature of the catchment area, leaving 67% of the area susceptible to emissions from this sector. Agricultural practices, such as the application of polymers in cultivation and storage, contribute to the emission potential, while trans-sectoral practices, such as the application of sewage sludge containing microplastics from the wastewater of urban areas, raise the potential additionally. Although urban areas take up a comparatively small share of the catchment, households consume a wide range of polymers with high emission potential due to the array of applications.
The emissions from tire, clutch, brake and wearing course abrasion occurring on the federal and state roads of the catchment contribute to a relevant extent to the emissions. Comparing estimates of total emissions from the catchment area and transport, the role of transport as the main source of emissions has been decisively confirmed in the catchment area of Lake Tollense.
The major objectives and tasks within the MICROLIM project are related to empirical investigations of MP abundance and spatial and temporal distribution in different compartments. The findings on MP concentrations in both shoreline and seabed sediments, as well as those determined for lake and tributary waters, were generated independently from this study. These empirically collected data mostly support the findings of this study. The findings of highest emissions within the northern “Linde” sub-catchment representing the highest agricultural land-use ratio amongst the sub-catchments (79%) corresponds with results from MP analyses in the tributaries. The highest concentrations were detected for the Gaetenbach, which is part of the “Linde” catchment. Within the lake body there is also a tendency of higher concentrations in the northern part of the lake, though the spatial differences of MP concentrations were not significant [37]. In contrast, within the lakeshore sediments, the highest MP abundances occur at the south beach, referring to the “Nonnenbach” sub-catchment that is characterized by the second highest agriculture land-use ratio (72%). Lakebed sediments were taken along a north-to-south transect in the middle position of the lake width. Here, the highest abundances were detected in the center sampling point of the lake, where the width of the lake is narrowing, and the largest lake depths are present [36].
Though in consensus across the different areas of investigation, methods and results, the applied survey methods, as well as the estimates, differed fundamentally and had to be critically examined for their transferability to the study area. Up to now, most investigations on microplastic emissions have been based on either empirical estimates or findings on-site, which, do not allow for a direct conclusion on the source or quantification of the emissions [71,84]. For this, several conditions need to apply. Comparability must be guaranteed between the study area in which the values were calculated and the study area to which they are to be transferred. Therefore, the results can only serve as a reference [71]. For the calculation of the emission potential of the transport sector, the corresponding asphalt mix needs to be considered, while other decisive factors, such as average driving speed, driving behavior and tire composition, could only be assumed and not verified due to the lack of data. Also, there is an inconsistency of the monitoring, as not all types of roads were monitored, which reduces the accuracy of the calculation. Although there is uncertainty and variability in the estimates, transport is the largest source. In order to achieve a reduction of MP emissions, it is, above all, necessary to raise public awareness within the local population and among tourists. This can be achieved, for example, through improved waste management or more conscious traffic behavior, e.g., by cutting down on unnecessary journeys or speed limits. Agricultural businesses can be motivated to consider alternatives, for e.g., plastic films. This can be supported by targeted actions by authorities and environmental organizations and, especially, by increased environmental education.
To conclude, this study shows the importance of evaluating existing sources in empirical ecosystem studies. These vary from catchment to catchment, and empirical analytical results can only be classified when potential sources are included, which also refers to concrete measures and their potential impact. In the catchment area of Lake Tollense, in particular, the predominant land-use of agriculture is a characteristic regional feature. Further relevant contributions are provided through trans-sectoral practices such as the application of sewage sludge containing microplastics from households and the wastewater of urban areas. Above all, the decisive roles of population and transport as the main source of emissions could be confirmed.

Supplementary Materials

The following supporting information can be downloaded at https://www.mdpi.com/article/10.3390/su152015048/s1. Table S1. Land-use types coverage in comparison: Study area of Lake Tollense catchment and Germany according to total area (km2) and percentage of coverage (%); Table S2. Areas covered according to land-use types (in km2 and percentage of coverage of the total catchment); Table S3. Calculation of the population density within the catchment area of Lake Tollense according to municipalities; Table S4. Results of the land-use analysis, by sub-catchment, sector and Corine Land Cover classes (clc), with highlighted values; Table S5. Tire, clutch, brake and wearing course abrasion (PM10) according to sub-catchments. Table S6. Summary on tire, clutch, brake and wearing course abrasion (PM10) per sub-catchment (refer to Table S5 for a detailed breakdown (note: in the sub-catchment of Lake Tollense west, there is no presence of federal or state roads)); Figure S1. Drive-in fodder silo with PE film and rubber tires, near Woldegk, and hay bales made of PE nets, near Wulkenzin; Figure S2. Left: Polyethylene from the net covering hay bales, near Wulkenzin. Right: Polyethylene from the cover film of a drive-in silo, near Woldegk; Figure S3. Stone mastic asphalt with road markings, near Wulkenzin; Figure S4. Agricultural land-use in the catchment. 1: Maize (Zea mays) near the Rehberger See, 2: Rape (Brassica napus) in the Lindetal, 3: Sugar beet (Beta vulgaris) near Woldegk, 4: Forage meadows near Penzlin, 5: Wheat (Triticum) in the Lindetal. 6: Rape (Brassica napus) near Ballin, 7: Wheat (Triticicum) near Ballin; Figure S5. Remote sensing agricultural depots. (Projection: ETRS89/UTM zone 33N. Source: Copernicus Land Monitoring Service 2018).

Author Contributions

Conceptualization, E.K.F., M.T. and T.G.; methodology, T.G. and M.T.; validation, E.K.F., M.T. and T.G.; formal analysis, T.G. and M.T.; investigation, T.G.; resources, E.K.F.; data curation, E.K.F.; writing—original draft preparation, T.G. and E.K.F.; writing—review and editing, E.K.F., M.T. and T.G.; visualization, T.G.; supervision, E.K.F.; project administration, E.K.F.; funding acquisition, E.K.F. All authors have read and agreed to the published version of the manuscript.

Funding

This study was partly funded by the German Research Foundation (Deutsche Forschungsgemeinschaft) within the MICROLIM project (project number 411261467).

Data Availability Statement

The data presented in this study are available on request from the corresponding author.

Acknowledgments

We would like to thank the German Research Foundation for funding the MICROLIM project. We thank the “Staatliches Amt für Landwirtschaft und Umwelt Mecklenburgische Seenplatte”, who strongly supported the MICROLIM project and provided data and expertise that greatly assisted the research.

Conflicts of Interest

The authors declare no conflict of interest.

References

  1. Geyer, R.; Jambeck, J.R.; Law, K.L. Production, use, and fate of all plastics ever made. Sci. Adv. 2017, 3, e1700782. [Google Scholar] [CrossRef] [PubMed]
  2. Plastics Europe. Plastics the Facts. 2020. Available online: https://plasticseurope.org/de/knowledge-hub/plastics-the-facts-2020-2/ (accessed on 29 August 2022).
  3. Andrady, A.L. (Ed.) Plastics and the Environment; Wiley-Interscience: Hoboken, NJ, USA, 2003. [Google Scholar]
  4. Napper, I.E.; Thompson, R.C. Release of synthetic microplastic plastic fibers from domestic washing machines: Effects of fabric type and washing conditions. Mar. Pollut. Bull. 2016, 112, 39–45. [Google Scholar] [CrossRef] [PubMed]
  5. Mani, T.; Hauk, A.; Walter, U.; Burkhardt-Holm, P. Microplastics profile along the Rhine River. Sci. Rep. 2015, 5, 17988. [Google Scholar] [CrossRef] [PubMed]
  6. van Cauwenberghe, L.; Janssen, C.R. Microplastics in bivalves cultured for human consumption. Environ. Pollut. 2014, 193, 65–70. [Google Scholar] [CrossRef] [PubMed]
  7. Weber, A.; Jeckel, N.; Wagner, M. Combined effects of polystyrene microplastics and thermal stress on the freshwater mussel Dreissena polymorpha. Sci. Total Environ. 2020, 718, 137253. [Google Scholar] [CrossRef]
  8. Allen, S.; Allen, D.; Phoenix, V.R.; Le Roux, G.; Durántez Jiménez, P.; Simonneau, A.; Binet, S.; Galop, D. Atmospheric Transport and Deposition of Microplastics in a Remote Mountain Catchment. Nat. Geosci. 2019, 12, 339–344. [Google Scholar] [CrossRef]
  9. Klein, M.; Fischer, E.K. Microplastic Abundance in Atmospheric Deposition within the Metropolitan Area of Hamburg, Germany. Sci. Total Environ. 2019, 685, 96–103. [Google Scholar] [CrossRef]
  10. Leslie, H.A.; van Velzen, M.J.M.; Brandsma, S.H.; Vethaak, A.D.; Garcia-Vallejo, J.J.; Lamoree, M.H. Discovery and Quantification of Plastic Particle Pollution in Human Blood. Environ. Int. 2022, 163, 107199. [Google Scholar] [CrossRef]
  11. Horvatits, T.; Tamminga, M.; Liu, B.; Sebode, M.; Carambia, A.; Fischer, L.; Püschel, K.; Huber, S.; Fischer, E.K. Microplastics Detected in Cirrhotic Liver Tissue. EBioMedicine 2022, 88, 104147. [Google Scholar] [CrossRef]
  12. Rakib, M.R.J.; Sarker, A.; Ram, K.; Uddin, M.G.; Walker, T.R.; Chowdhury, T.; Uddin, J.; Khandaker, M.U.; Rahman, M.M.; Idris, A.M. Microplastic Toxicity in Aquatic Organisms and Aquatic Ecosystems: A Review. Water Air Soil Pollut. 2023, 234, 52. [Google Scholar] [CrossRef]
  13. Ding, R.; Tong, L.; Zhang, W. Microplastics in Freshwater Environments: Sources, Fates and Toxicity. Water Air Soil Pollut. 2021, 232, 181. [Google Scholar] [CrossRef]
  14. Bertling, J.; Bertling, R.; Hamann, L.; Weber, T.; Hiebel, M. 2018 Kunststoffe in der Umwelt: Mikro- und Makroplastik. Quellen, Mengen, Ausbreitung, Wirkungen und Lösungsansätze; Konsortialstudie Fraunhofer Umsicht: Oberhausen, Germany, 2019; Volume 193. [Google Scholar] [CrossRef]
  15. de Souza Machado, A.A.; Kloas, W.; Zarfl, C.; Hempel, S.; Rillig, M.C. Microplastics as an emerging threat to terrestrial ecosystems. Glob. Change Biol. 2018, 24, 1405–1416. [Google Scholar] [CrossRef] [PubMed]
  16. Prata, J.C. Microplastics in wastewater: State of the knowledge on sources, fate and solutions. Mar. Pollut. Bull. 2018, 129, 262–265. [Google Scholar] [CrossRef] [PubMed]
  17. Jang, M.; Shim, W.J.; Cho, Y.; Han, G.M.; Song, Y.K.; Hong, S.H. A Close Relationship between Microplastic Contamination and Coastal Area Use Pattern. Water Res. 2020, 171, 115400. [Google Scholar] [CrossRef]
  18. Kawecki, D.; Nowack, B. A Proxy-Based Approach to Predict Spatially Resolved Emissions of Macro- and Microplastic to the Environment. Sci. Total Environ. 2020, 748, 141137. [Google Scholar] [CrossRef]
  19. Kawecki, D.; Nowack, B. Polymer-Specific Modeling of the Environmental Emissions of Seven Commodity Plastics As Macro- and Microplastics. Environ. Sci. Technol. 2019, 53, 9664–9676. [Google Scholar] [CrossRef]
  20. van Wijnen, J.; Ragas, A.M.J.; Kroeze, C. Modelling Global River Export of Microplastics to the Marine Environment: Sources and Future Trends. Sci. Total Environ. 2019, 673, 392–401. [Google Scholar] [CrossRef]
  21. Zhang, Y.; Kang, S.; Allen, S.; Allen, D.; Gao, T.; Sillanpää, M. Atmospheric Microplastics: A Review on Current Status and Perspectives. Earth-Sci. Rev. 2020, 203, 103118. [Google Scholar] [CrossRef]
  22. Landesamt für Innere Verwaltung Statistisches Amt, Germany—LAiV. Bevölkerungsstand der Kreise, Ämter und Gemeinden in Mecklenburg-Vorpommern. 2021. Available online: https://www.laiv-mv.de/static/LAIV/Statistik/Dateien/Publikationen/A%20I%20Bev%C3%B6lkerungsstand/A123/2021/A123%202021%2022.pdf (accessed on 29 August 2022).
  23. Witt, S. Der Tollensesee Vier-Tore-Stadt Neubrandenburg. 2020. Available online: https://www.neubrandenburg.de/Sport-Kultur/Tourismus/Der-Tollensesee/ (accessed on 28 August 2022).
  24. Statistisches Bundesamt. Statistisches Amt Mecklenburg-Vorpommern 2019 Statistisches Jahrbuch Mecklenburg-Vorpommern 2019; Mecklenburg-Vorpommern/Statistisches Amt: Schwerin, Germany, 2019. [Google Scholar]
  25. Koschel, R.; Kasprazak, P. Der Tollensesee; Institut für Gewässerökologie und Binnenfischerei: Berlin, Germany, 1994. [Google Scholar]
  26. Ratzke, U.; Mohr, H.-J. Böden in Mecklenburg-Vorpommern. Abriss ihrer Entstehung, Verbreitung und Nutzung. Beiträge zum Bodenschutz in Mecklenburg-Vorpommern, Landesamt für Umwelt, Naturschutz und Geologie Mecklenburg-Vorpommern. 2005. Available online: https://www.lung.mv-regierung.de/dateien/boedenmv.pdf (accessed on 31 August 2022).
  27. Harloff, J.; Rebenstorf, R.-W.; Beisheim, H. Flurneuordnung als Instrument zur Umsetzung der EU-Wasserrahmenrichtlinie für das Einzugsgebiet Tollense. Bachelor’s Thesis, University of Europe for Applied Sciences, Berlin, Germany, 2008. [Google Scholar]
  28. WBV-MV 2015 Wasser- und Bodenverband Untere Tollense/Mittlere Peene. Körperschaft des öffentlichen Rechts 1990–2015 25 Jahre. Available online: https://wbv-untere-tollense-mittlere-peene.de/start/ (accessed on 29 August 2022).
  29. Mohr, G. Wundervolle Tollense. Unterwegs an See und Fluss Gestern und Heute; mit Ausflugs- und Wanderzielen von A-Z; Archiv-Verlag: Steffen, Friedland, 2005; 82p. [Google Scholar]
  30. LUNG (Landesamt für Umwelt, Naturschutz und Geologie Mecklenburg-Vorpommern) Pegelportal. Available online: https://pegelportal-mv.de/pegel_mv.html (accessed on 29 August 2022).
  31. Behrens, H. Auswertung neuer Vorgehensweisen für die Regionale Umsetzung Ökologischer Ziele am Beispiel der Mecklenburgischen Seenplatte. Forschungsbericht 29882203; Umweltforschungsplan des Bundesministeriums für Umwelt, Naturschutz und Reaktorsicherheit; Bundesministeriums für Umwelt, Naturschutz und Reaktorsicherheit: Bonn, Germany, 2002. [Google Scholar]
  32. Nixdorf, B. Dokumentation von Zustand und Entwicklung der Wichtigsten Seen Deutschlands. Forschungsbericht 29924274; Umweltforschungsplan des Bundesministeriums für Umwelt, Naturschutz und Reaktorsicherheit: Bonn, Germany, 2004. [Google Scholar]
  33. Sluschny, A.; Hahne, W.; Kaffke, A. Managementplan für das FFH-Gebiet DE 2545-303 Tollensesee mit Zuflüssen und Umliegenden Wäldern; Staatliches Amt für Landwirtschaft und Umwelt Mecklenburgische Seenplatte: Neubrandenburg, Germany, 2013. [Google Scholar]
  34. BirdLife Data Zone. Available online: http://datazone.birdlife.org/site/factsheet/southern-tollense-basin-iba-germany/details (accessed on 3 October 2023).
  35. WAVE Living Lab Neubrandenburg 2021—Wave. Available online: https://wave.hfwu.de/index.php?title=WAVE_Living_Lab_Neubrandenburg_2021 (accessed on 3 October 2023).
  36. Hengstmann, E.; Weil, E.; Wallbott, P.C.; Tamminga, M.; Fischer, E.K. Microplastics in Lakeshore and Lakebed Sediments—External Influences and Temporal and Spatial Variabilities of Concentrations. Environ. Res. 2021, 197, 111141. [Google Scholar] [CrossRef]
  37. Tamminga, M.; Hengstmann, E.; Deuke, A.-K.; Fischer, E.K. Microplastic Concentrations, Characteristics, and Fluxes in Water Bodies of the Tollense Catchment, Germany, with Regard to Different Sampling Systems. Environ. Sci. Pollut. Res. 2022, 29, 11345–11358. [Google Scholar] [CrossRef]
  38. Klein, M.; Bechtel, B.; Brecht, T.; Fischer, E.K. Spatial Distribution of Atmospheric Microplastics in Bulk-Deposition of Urban and Rural Environments—A One-Year Follow-up Study in Northern Germany. Sci. Total Environ. 2023, 901, 165923. [Google Scholar] [CrossRef]
  39. Swiss Academic Software GmbH 2020 Citavi 6 Manual. Available online: https://www1.citavi.com (accessed on 29 August 2022).
  40. Microsoft Corporation. Microsoft Excel. 2018. Available online: https://office.microsoft.com/excel (accessed on 29 August 2022).
  41. QGIS Development Team. QGIS Geographic Information System. Open Source Geospatial Foundation Project. 2019. Available online: http://qgis.osgeo.org (accessed on 29 August 2022).
  42. Landesamt für Umwelt, Naturschutz und Geologie Mecklenburg-Vorpommern (2020) Fachinformationen. Available online: https://www.lung.mv-regierung.de/ (accessed on 29 August 2022).
  43. Copernicus Programme 2020 CLC 2018. Copernicus Land Monitoring Service. Available online: https://www.esa.int/Applications/Observing_the_Earth/Copernicus/Europe_s_Copernicus_programme (accessed on 29 August 2022).
  44. HERE Global B.V. HERE Maps API. 2019. Available online: https://developer.here.com/documentation/maps/3.1.40.0/dev_guide/index.html (accessed on 29 August 2022).
  45. Landesamt für innere Verwaltung Mecklenburg-Vorpommern Amt für Geoinformation, Vermessungs- und Katasterwesen: Geoportal MV 31.08.2022. Available online: https://www.geoportal-mv.de/portal/ (accessed on 29 August 2022).
  46. Quass, U.; John, A.; Beyer, M.; Lindermann, J.; Kuhlbusch, T.A.J.; Hirner, A.V.; Sulkowski, M.; Sulkowski, M. Ermittlung des Beitrages von Reifen-, Kupplungs-, Brems- und Fahrbahnabrieb an den PM10-Emissionen von Straßen. Berichte der Bundesanstalt für Straßenwesen V, Verkehrstechnik 2008, 165; Wirtschaftsverl. NW Verl. für neue Wiss, Bremerhaven: Bremerhaven, Germany, 2008. [Google Scholar]
  47. Qiu, R.; Song, Y.; Zhang, X.; Xie, B.; He, D. Microplastics in Urban Environments: Sources, Pathways, and Distribution. In The Handbook of Environmental Chemistry; Springer: Berlin/Heidelberg, Germany, 2020. [Google Scholar]
  48. Gies, E.A.; LeNoble, J.L.; Noël, M.; Bishay, E.A.F.; Hall, E.R.; Ross, P.S. Retention of microplastics in a major secondary wastewater treatment plant in Vancouver, Canada. Mar. Pollut. Bull. 2018, 133, 553–561. [Google Scholar] [CrossRef]
  49. Mason, S.A.; Garneau, D.; Sutton, R.; Chu, Y.; Ehmann, K.; Barnes, J.; Fink, P.; Papazissimos, D.; Rogers, D.L. Microplastic pollution is widely detected in US municipal wastewater treatment plant effluent. Environ. Pollut. 2016, 218, 1045–1054. [Google Scholar] [CrossRef] [PubMed]
  50. Mahon, A.M.; O’Connell, B.; Healy, M.G.; O’Connor, I.; Officer, R.; Nash, R.; Morrison, L. Microplastics in Sewage Sludge: Effects of Treatment. Environ. Sci. Technol. 2017, 51, 810–818. [Google Scholar] [CrossRef]
  51. Zubris, K.A.V.; Richards, B.K. Synthetic fibers as an indicator of land application of sludge. Environ. Pollut. 2005, 138, 201–211. [Google Scholar] [CrossRef] [PubMed]
  52. Horton, A.A.; Walton, A.; Spurgeon, D.J.; Lahive, E.; Svendsen, C. Microplastics in freshwater and terrestrial environments: Evaluating the current understanding to identify the knowledge gaps and future research priorities. Sci. Total Environ. 2017, 586, 127–141. [Google Scholar] [CrossRef]
  53. Dris, R.; Gasperi, J.; Tassin, B. Sources and Fate of Microplastics in Urban Areas: A Focus on Paris Megacity. In Freshwater Microplastics: Emerging Environmental Contaminants? The Handbook of Environmental Chemistry/Founded by Hutzinger, O.; Wagner, M., Lambert, S., Besseling, E., Biginagwa, F.J., Eds.; Springer: Cham, Germany, 2018; Volume 58, pp. 69–83. [Google Scholar]
  54. He, D.; Luo, Y.; Lu, S.; Liu, M.; Song, Y.; Lei, L. Microplastics in soils: Analytical methods, pollution characteristics and ecological risks. TrAC Trends Anal. Chem. 2018, 109, 163–172. [Google Scholar] [CrossRef]
  55. Blair, M.; Waldron, S.; Phoenix, V.; Gauchotte-Lindsay, C. Micro- and Nanoplastic Pollution of Freshwater and Wastewater Treatment Systems. Springer Sci. Rev. 2017, 5, 19–30. [Google Scholar] [CrossRef]
  56. Tirler, C. Occurrence of Microplastics in the Effluent of Wastewater Treatment Plants: Growing Threat to the Environment? Master Thesis, Technische Universität Wien, Vienna, Austria, 2016. [Google Scholar]
  57. Browne, M.A.; Crump, P.; Niven, S.J.; Teuten, E.; Tonkin, A.; Galloway, T.; Thompson, R. Accumulation of microplastic on shorelines woldwide: Sources and sinks. Environ. Sci. Technol. 2011, 45, 9175–9179. [Google Scholar] [CrossRef]
  58. Mintenig, S. Mikroplastik in Ausgewählten Kläranlagen des Oldenburgisch-Ostfriesischen Wasserverbandes (OOWV) in Niedersachsen; Probenanalyse mittels Mikro-FTIR Spektroskopie.Technischer Bericht; Alfred-Wegener-Institut, Helmholtz-Zentrum für Polar-und Meeresforschung (AWI) Biologische Anstalt Helgoland: Helgoland, Germany, 2014. [Google Scholar]
  59. Bundesumweltministerium 2020 Verordnung zur Neuordnung der Klärschlammverwertung. BMU-Gesetze und Verordnungen. V. v. 27.09.2017 BGBl. I S. 3465. Available online: https://dip.bundestag.de/vorgang/verordnung-zur-neuordnung-der-kl%C3%A4rschlammverwertung/79356 (accessed on 29 August 2022).
  60. AbfKlärV—Klärschlammverordnung, Verordnung über die Verwertung von Klärschlamm, Klärschlammgemisch und Klärschlammkompost, 27.09.2017. BGBl. I S. 3465. Available online: https://www.gesetze-im-internet.de/abfkl_rv_2017/BJNR346510017.html (accessed on 29 August 2022).
  61. Lamont, W.J. Plastic Mulches for the Production of Vegetable Crops. HortTechnology 1993, 3, 35–39. [Google Scholar] [CrossRef]
  62. Steinmetz, Z.; Wollmann, C.; Schaefer, M.; Buchmann, C.; David, J.; Tröger, J.; Muñoz, K.; Frör, O.; Schaumann, G.E. Plastic mulching in agriculture. Trading short-term agronomic benefits for long-term soil degradation? Sci. Total Environ. 2016, 550, 690–705. [Google Scholar] [CrossRef]
  63. Wang, J.; Liu, X.; Li, Y.; Powell, T.; Wang, X.; Wang, G.; Zhang, P. Microplastics as contaminants in the soil environment: A mini-review. Sci. Total Environ. 2019, 691, 848–857. [Google Scholar] [CrossRef]
  64. Ramos, L.; Berenstein, G.; Hughes, E.A.; Zalts, A.; Montserrat, J.M. Polyethylene film incorporation into the horticultural soil of small periurban production units in Argentina. Sci. Total Environ. 2015, 523, 74–81. [Google Scholar] [CrossRef]
  65. Muralisrinivasan, N.S. Plastics Waste Management. Processing and Disposal; Wiley: Hoboken, NJ, USA, 2019. [Google Scholar]
  66. Li, Y.-S.; Wu, L.-H.; Zhao, L.-M.; Lu, X.-H.; Fan, Q.-L.; Zhang, F.-S. Influence of continuous plastic film mulching on yield, water use efficiency and soil properties of rice fields under non-flooding condition. Soil Tillage Res. 2007, 93, 370–378. [Google Scholar] [CrossRef]
  67. Li, J.; Zhang, K.; Zhang, H. Adsorption of antibiotics on microplastics. Environ. Pollut. 2018, 237, 460–467. [Google Scholar] [CrossRef]
  68. Bläsing, M.; Amelung, W. Plastics in soil: Analytical methods and possible sources. Sci. Total Environ. 2018, 612, 422–435. [Google Scholar] [CrossRef] [PubMed]
  69. Skórka, P.; Lenda, M.; Moroń, D.; Tryjanowski, P. New methods of crop production and farmland birds: Effects of plastic mulches on species richness and abundance. J. Appl. Ecol. 2013, 50, 1387–1396. [Google Scholar] [CrossRef]
  70. Rillig, M.C. Microplastic in terrestrial ecosystems and the soil? Environ. Sci. Technol. 2012, 46, 6453–6454. [Google Scholar] [CrossRef]
  71. Pedrini, S.; Merritt, D.J.; Stevens, J.; Dixon, K. Seed Coating: Science or Marketing Spin? Trends Plant Sci. 2017, 22, 106–116. [Google Scholar] [CrossRef]
  72. Accinelli, C.; Abbas, H.K.; Shier, W.T.; Vicari, A.; Little, N.S.; Aloise, M.R.; Giacomini, S. Degradation of microplastic seed film-coating fragments in soil. Chemosphere 2019, 226, 645–650. [Google Scholar] [CrossRef]
  73. Rocha, I.; Ma, Y.; Souza-Alonso, P.; Vosátka, M.; Freitas, H.; Oliveira, R.S. Seed Coating: A Tool for Delivering Beneficial Microbes to Agricultural Crops. Front. Plant Sci. 2019, 10, 1357. [Google Scholar] [CrossRef] [PubMed]
  74. Ekebafe, L.O.; Ogbeifun, D.E.; Okieimen, F.E. Polymer Applications in Agriculture. Biokemistri 2011, 23, 81–89. [Google Scholar]
  75. Kyrikou, I.; Briassoulis, D. Biodegradation of Agricultural Plastic Films: A Critical Review. J. Polym. Environ. Former. J. Environ. Polym. Degrad. 2007, 15, 125–150. [Google Scholar]
  76. Yonkos, L.T.; Friedel, E.A.; Perez-Reyes, A.C.; Ghosal, S.; Arthur, C.D. Microplastics in four estuarine rivers in the Chesapeake Bay, U.S.A. Environ. Sci. Technol. 2014, 48, 14195–14202. [Google Scholar] [CrossRef] [PubMed]
  77. Burghardt, W. Soil Sealing and Soil Properties Related to Sealing; Geological Society, Special Publications: London, UK, 2006; Volume 266, pp. 117–124. [Google Scholar]
  78. Magnusson, K.; Eliasson, K.A.; Fråne, A.; Haikonen, K.; Hultén, J.; Olshammar, M.; Stadmark, J.; Voisin, A. Swedish sources and pathways for microplastics to the marine environment. Environmental Science. Technical Report, IVL Swedish Environmental Research Institute, Stockholm, Sweden. 2016. Available online: https://www.diva-portal.org/smash/record.jsf?pid=diva2%3A1549783&dswid=-4544 (accessed on 22 August 2022).
  79. Kleunen, M.; Brumer, A.; Gutbrod, L.; Zhang, Z. A microplastic used as infill material in artificial sport turfs reduces plant growth. Plants People Planet 2020, 2, 157–166. [Google Scholar] [CrossRef]
  80. Verschoor, A.; de Poorter, L.; Dröge, R.; Kuenen, J.; de Valk, E. Emission of Microplastics and Potential Mitigation Measures. Abrasive Cleaning Agents, Paints and Tyre Wear. RIVM Report; National Institute for Public Health and the Environment: Utrecht, The Netherlands, 2016. [Google Scholar]
  81. Sundt, P.; Schulze, P.-E.; Syversen, F. Sources of Microplastic-Pollution to the Marine Environment; Mepex for the Norwegian Environment Agency 86: Asker, Norway, 2014. [Google Scholar]
  82. Wagner, M.; Lambert, S.; Besseling, E.; Biginagwa, F.J.; Barceló, D.; Kostianoy, A.G. (Eds.) Freshwater microplastics. Emerging environmental contaminants? In The Handbook of Environmental Chemistry/Founded by Otto Hutzinger; Springer: Cham, Germany, 2018; Volume 58. [Google Scholar]
  83. Lechner, A.; Ramler, D. The discharge of certain amounts of industrial microplastic from a production plant into the River Danube is permitted by the Austrian legislation. Environ. Pollut. 2015, 200, 159–160. [Google Scholar] [CrossRef]
  84. Sommer, F.; Dietze, V.; Baum, A.; Sauer, J.; Gilge, S.; Maschowski, C.; Gieré, R. Tire Abrasion as a Major Source of Microplastics in the Environment. Aerosol Air Qual. Res. 2018, 18, 2014–2028. [Google Scholar] [CrossRef]
  85. Vogelsang, C.; Lusher, A.L.; Dadkhah, M.E.; Sundvor, I.; Umar, M.; Ranneklev, S.B.; Eidsvoll, D.; Meland, S. Microplastics in Road Dust. Characteristics Pathways and Measures; Norwegian Institute for Water Research: Oslo, Norway, 2018. [Google Scholar]
  86. Krömer, S.; Kreipe, E.; Reichenbach, D.; Stark, R. Produkt-Ökobilanz eines Pkw-Reifens; Schrift der Continental AG, Continental AG: Hannover, Germany, 1999. [Google Scholar]
  87. Ripke, O. Lärmmindernder Splittmastixasphalt. In Bericht zum Forschungsprojekt AP F1100.3505001. Berichte der Bundesanstalt für Strassenwesen-Strassenbau; Wirtschaftsverl. NW Verl. für neue Wiss: Bremerhaven, Germany, 2011. [Google Scholar]
  88. Magnusson, K.; Jrundsdttir, H.; Norn, F.; Lloyd, H.; Talvitie, J.; Setälä, O. 2016 Microlitter in Sewage Treatment Systems; Nordic Council of Ministers: Copenhagen, Denmark, 2016. [Google Scholar]
  89. Lassen, C.; Hansen, S.F.; Magnusson, K.; Hartmann, K.B.; Jensen, P.R.; Nielsen, T.G.; Brinch, A. 2016 Sundere Grundere. Alternatives to Alkylphenolethoxylates; Miljøstyrelsen: Odense, Denmark, 2016. [Google Scholar]
  90. Sieber, R.; Kawecki, D.; Nowack, B. Dynamic probabilistic material flow analysis of rubber release from tires into the environment. Environ. Pollut. 2020, 258, 113573. [Google Scholar] [CrossRef]
  91. Lanorte, A.; de Santis, F.; Nolè, G.; Blanco, L.; Loisi, R.V.; Schettini, E.; Vox, G. Agricultural plastic waste spatial estimation by Landsat 8 satellite images. Comput. Electron. Agric. 2017, 141, 35–45. [Google Scholar] [CrossRef]
  92. Miklos, D.; Obermaier, N.; Jekel, M. Mikroplastik: Entwicklung eines Umweltbewertungskonzepts. Erste Überlegungen zur Relevanz von Synthetischen Polymeren in der Umwelt; Texte des Umweltbundesamts 32/2016; Umweltbundesamts: Dessau-Roßlau, Germany, 2016. [Google Scholar]
  93. Hartmann, N.B.; Hüffer, T.; Thompson, R.C.; Hassellöv, M.; Verschoor, A.; Daugaard, A.E.; Rist, S.; Karlsson, T.; Brennholt, N.; Cole, M.; et al. Are We Speaking the Same Language? Recommendations for a Definition and Categorization Framework for Plastic Debris. Environ. Sci. Technol. 2019, 53, 1039–1047. [Google Scholar] [CrossRef]
  94. Forrest, A.; Holman, L.; Murphy, M.; Vermaire, C. Citizen science sampling programs as a technique for monitoring microplastic pollution: Results, lessons learned and recommendations for working with volunteers for monitoring plastic pollution in freshwater ecosystems. Environ. Monit. Assess. 2019, 191, 172. [Google Scholar] [CrossRef] [PubMed]
Figure 1. (a) Lake Tollense in Mecklenburg-Western Pomerania, Germany. (Projection: ETRS89/UTM zone 33N, Source: Digital Globe, Here Maps 2020), (b) Lake Tollense catchment with major inflows and outflows. (Projection: ETRS89/UTM zone 33N, Source: Digital Globe, Here Maps 2020), (c) Color-coded elevation map with sub-catchments and tributaries: 1: Tollense west, 2: Lake Tollense, 3: Tollense east, 4: Linde, 5: Lieps, 6: Nonnenbach (Projection: ETRS89/UTM zone 33N, Source: GeoBasis-DE/M-V 2020).
Sustainability 15 15048 g001
Figure 2. Potential microplastic sources with polymers used in their application. From top left to top right: Potential input from industries, sporting grounds, plastic mulch/sewage sludge applied in agriculture; from mid left to mid right: construction sites, transport; from low left to low right: households, recreational activities, fodder storages and seed coating applied in agriculture; numbers refer to main polymers as listed in the figure (bottom). (Icon source: © 2020 Smashicons).
Sustainability 15 15048 g002
Figure 3. Land-use analysis of the catchment area of Lake Tollense. (Projection: ETRS89/UTM zone 33N. Source: Copernicus Land Monitoring Service 2018).
Sustainability 15 15048 g003
Figure 4. Roads and traffic volume in the catchment. (Projection: ETRS89/UTM zone 33N, Source: LUNG MV, LS MV).
Sustainability 15 15048 g004
Table 1. Evaluation of potential influencing factors for MP emissions for the sub-catchments (excl. lake surface).
Lake
Tollense East
Lake
Tollense West
LiepsLindeNonnenbach
land-use ratio agriculture (%)39.856.140.078.972.2
agricultural area (km2)10.415.434.0117.1158.2
land-use ratio urban area (%)21.71.20.84.81.4
urban area (km2)5.70.30.67.13.1
emission volume related to transport (t/a)1.80.08.81.72.3
emission volume related to population (t/a)31.47.628.244.226.1
Disclaimer/Publisher’s Note: The statements, opinions and data contained in all publications are solely those of the individual author(s) and contributor(s) and not of MDPI and/or the editor(s). MDPI and/or the editor(s) disclaim responsibility for any injury to people or property resulting from any ideas, methods, instructions or products referred to in the content.

