Article

Spatial Accessibility Analysis and Optimization Simulation of Urban Riverfront Space Based on Space Syntax and POIs: A Case Study of Songxi County, China

School of Architecture and Urban-Rural Planning, Fuzhou University, Fuzhou 350108, China
*
Author to whom correspondence should be addressed.
Sustainability 2023, 15(20), 14929; https://doi.org/10.3390/su152014929
Submission received: 8 September 2023 / Revised: 7 October 2023 / Accepted: 11 October 2023 / Published: 16 October 2023

Abstract

:
Optimizing accessibility to urban riverfront spaces plays a pivotal role in enhancing the spatial vitality of urban regions and promoting the high-quality development of such areas. The degree of riverfront space accessibility can be assessed through the connectivity of urban roads, which directly impacts the spatial vitality of these areas. This study constructs an axial and segmental model of the urban road network based on the space syntax theory. Through the Geographic Information System (GIS), kernel density analysis is performed on the Points of Interest (POI) and Depthmap data of Songxi County to comprehensively examine the reasonableness of the segmental network model and its visual representation. Quantitative evaluation of the accessibility of riverfront space in Songxi County from three dimensions, namely topological accessibility, geometrical accessibility, and perceptual accessibility, is conducted. The results show that (1) the accessibility of high-value area of riverfront space in Songxi County’s central city exhibits an unbalanced distribution, with a concentration in the central area. (2) A certain degree of mismatch exists between the distribution area of high accessibility in urban space and that of the waterfront space, highlighting the need for improved traffic planning in the riverfront area. (3) Weak spatial connections are shown between the north and south riverfronts, with areas of high accessibility values showing a clear break at the riverbank. Based on the results of the quantitative analysis, the proposed approach involves optimizing the spatial layout of urban roads and riverfront spaces through several key strategies. These strategies encompass enhancing the layout of the transport network, strengthening the coupling links between the two sides of the river, enriching the functions of the riverfront space, and conducting simulations to test the feasibility of these measures. The simulation results revealed a noteworthy enhancement in the integration and choice value of urban roads and riverfront spaces. Therefore, the optimization strategy employed in this study significantly improved the connectivity and accessibility of the overall transport network, leading to a more balanced distribution of high accessibility value areas within the city and riverfront space. This paper centers on the interaction between individuals and the river, to enhance the restoration of riverfront vitality. As a result, it is anticipated to provide valuable insights into the sustainable development of riverfront spaces.

1. Introduction

With the continuous development of the city, and the early one-sided development in the riverbank of the city, space resources are gradually saturated, and cross-river development has become its inevitable choice [1,2,3]. Enhancing the accessibility of riverfront spaces not only caters to the increasing demand for recreational activities by residents but also contributes to striking a balance in the urban pattern of cross-river development.
The riverfront is defined as the area where water and land converge within a city [4,5], which is the main public open space in the city and plays a vital role in urban development. As the standard of living continues to improve, people are beginning to re-evaluate the multi-dimensional value of the riverfront. Due to rising urbanization, there are fewer and fewer high-quality public areas for citizens to engage in outdoor activities. Riverfront space offers an effective solution to this problem, and its blue-green resources are also essential to the city’s sustainable development. However, because the riverfront area generally lies towards the outside of the city, with a complicated transportation system and inadequate accessibility of the routes, accessibility is a significant element affecting the riverfront space’s vitality.
Accessibility, initially defined as the magnitude of opportunities for nodes in a spatial network to interact with each other [6], is a flexible concept with different understandings and expressions for different application areas and research objects [7,8,9,10,11,12]. The commonly used definition of urban spatial accessibility is the ease or difficulty of overcoming spatial barriers, expressed in terms of distance, time, cost, and other indicators, emphasizing the location of urban space and the resistance to accessing that urban space [8,12]. The accessibility of the riverfront space refers to the level of difficulty in reaching this area from the starting point using various urban transportation modes, which is primarily influenced by its position in the urban layout [3,13,14,15].
Accessibility constitutes a crucial metric for evaluating the spatial rationality of urban social service facilities [16,17]. In recent years, urban spatial accessibility research has primarily focused on urban green space [18,19,20,21] and park layout [22]. The research methods include GIS network analysis [19,21], space syntax [23], POI data analysis [24,25], and a two-step mobile search method [26,27,28]. Commonly used evaluation metrics for accessibility include calculating the travel distances and times between spatial nodes [11], evaluating the advantages and disadvantages of the urban layout of the spatial nodes, using big data to evaluate the density of people and infrastructure within a certain range around the spatial nodes, thus reflecting the accessibility of the spatial nodes [25,29], supply indexes to measure the supply and demand, and service indexes that measure supply and demand which reflect spatial accessibility, thus locating site selection areas [28], etc.
Space syntax theory is based on graph theory and urban morphology, and it splits and slices space into line segments or points to analyze its topological and geometric relationships and explores the relationship between human activities and space morphology [30,31]. POI (point of interest) data are a new type of spatial data source, which contains multiple geographic information, and its distribution pattern and distribution density, to a certain extent, reflect the distribution of infrastructure and functional complexity and other indicators of urban analysis. In the era of big data, analyzing urban spatial accessibility based on ArcGIS and POI big data can more accurately reflect the degree of matching between the distribution of spatial potential vitality and urban space and improve the scientificity and accuracy of research [24,32]. The research related to space syntax theory can be broadly categorized into two levels: topological and geometrical [33]. The first level is to determine the topological distance between axes by Spatial Integration Accessibility (SIA) by analyzing the number of steps from one axis to another, which reflects the overall level of spatial accessibility [34,35]. The second level is to further study geometrical accessibility of urban spatial layout based on Angular Segment Analysis by Metric Distance (ASAMD) by considering the impact of incidence angles between lines, segmentation at axis junctions, and metric radius on the choice of routes and trip destinations [36,37]. It is summarized that fewer studies evaluate spatial accessibility from both Spatial Integration Accessibility (SIA) and Angular Segment Analysis by Metric Distance (ASAMD). Unlike most previous studies that used space syntax theory, this study combines SIA and ASAMD, supplemented by POI big data for model calibration, to provide more comprehensive data support.
Based on the spatial pattern of the unilateral riverfront development in Songxi County, exploring scientific and reasonable methods of accessibility analysis is of great practical value for improving the usage rate of urban waterfront space in cross-river development. This paper constructs an urban road axis model based on spatial syntax theory and utilizes POI big data to confirm its authenticity in reflecting urban functions. Quantitative analysis of the riverfront space is carried out from three dimensions of topological accessibility, geometric accessibility, and perceptual accessibility, and the analyzed data of space syntax software Depthmap v0.8.0 are imported into ArcGIS for visual analysis. Based on the analysis results, the optimization strategy of urban riverfront space accessibility is proposed, and its feasibility is tested by simulation. The aim is to provide a quantitative basis for optimizing the accessibility of the riverfront space so that the riverfront space can become the city’s core public space and stimulate the city’s vitality.

2. Materials and Methods

2.1. Study Area

Songxi, a millennium-ancient county, is located at China’s border of Fujian and Zhejiang provinces (Figure 1). Songxi is a small frontier county north of Fujian Province, located between 118°33′~118°55′ E and 27°24′~27°51′ N. The county is 34 km wide from east to west and 49 km long from north to south, with a total land area of 1043 square kilometers, a resident population of 130,800, and an urbanization rate of 49.3%. Songxi County climate belongs to the middle subtropical humid monsoon climate. The average temperature for many years is 18.1 °C, with a frost-free period of 269 days and a rainfall of 1658.8 mm. The county has many medium and low mountains, with mountains accounting for 81.62% of the total area and rich forest resources. Cultivated land accounts for 10.4% of the total area, mainly producing rice. Songxi has a dense water system and rich forestry resources, with a forest coverage rate of 75.7% and a greening degree of 89.8%. The density of the river network is 0.22 km per square kilometer, the main stream Songxi River runs diagonally across the whole territory, and there are many pines along the banks of the river from ancient times, which is known as “a hundred miles of pine shade,” and “Songxi” is thus named.
In the initial stages of its construction, Songxi County developed on one side of the river. The Songxi River is the mother river of Songxi County, and in the early days of the city’s founding, Songxi County developed only on the north bank of the river on one side, as shown in Figure 2b. With the history of evolution, the city space resources were gradually saturated, and the city was gradually expanded to the south bank. Nowadays, the urban area of Songxi County not only expands to the south bank but also gradually extends to the east and west direction of the river. The Songxi River, flowing through the central urban area, has played a pivotal role in shaping and developing the spatial landscape of Songxi. As the city progressed, the central urban area gradually expanded, leading to the adoption of cross-river development—“East City West Expansion”—as an essential choice for further urban development. The Songxi River serves as a significant east–west urban green corridor cutting through Songxi city, and it plays a crucial role as the “main artery” in the city’s cross-river development (Figure 2).
In the Songxi County Territorial Spatial Plan (2020–2035), the Songxi River is designated as an ecological development zone in the central city. Subsequent urban planning endeavors should prioritize revitalizing the riverfront area and facilitate optimizing and enhancing public amenities on both sides of the river. Given its irreplaceable ecological resource, the riverfront space flanking the Songxi River holds special value and significance in driving the high-quality development of the region’s economy, society, and environment. Therefore, investigating the spatial accessibility on both sides of the Songxi River holds immense significance for ensuring the usability of urban riverfront spaces by residents and optimizing the overall urban spatial layout.
Given the context mentioned above, this paper selects the Songxi River section within the central urban area, as delineated in the “Territorial Spatial Plan of Songxi County (2020–2035)” (referred to as the “Plan”). This section spans from the western boundary of Lintun to the eastern boundary of Chengdong, covering a river stretch of approximately 16.5 km. The study area is defined as a 500-m buffer zone extending from the riverbanks into the city, and it encompasses a riverfront space with an area of approximately 1.83 million square meters, as analyzed using the Geographic Information System (GIS-ArcGIS 10.2).
The riverfront section of Songxi Central City is the main urban development belt and urban public open space of Songxi, which is divided into six zones, including Lintun, Zhanlu, Laocheng, Hedong, Chengdong, and Zhanqian. Among them, zones 1 and 2 are the intervals of Lintun and Zhanlu, zones 3 and 4 are Laocheng and Hedong, and zones 5 and 6 are Chengdong and Zhanqian (Figure 3). To avoid the boundary effect, the Ring Road is selected as the study boundary, which is the closed-loop demarcation line and covers the main part of the riverfront space and the central city area.

2.2. Research Methodology

Measuring the traffic vitality of the road network under a certain radius coverage around the space is the essence of space syntax to measure accessibility [30,38]. At the level of urban design, analyzing and researching with the theory of space syntax can test the future feasibility of the plan at a certain level and help to revise and adjust the urban plan better to meet the needs and goals of urban development [2].
Space syntax theory proposes three classical spatial segmentation models: axial map, convex map, and visibility graph analysis (Table 1). The axis model mainly analyzes the topological accessibility of the urban road network, which is suitable for urban macro-scale research but does not consider the physical distance [39,40]. The line segment model adds scale analysis based on the axis model, and the angular depth under the radius restriction is a significant variable to measure accessibility [33,41]. This study adopts the combination of axis analysis and line segment analysis in Depthmap software to quantitatively analyze the accessibility of the riverfront space through the integration and the synergy of the urban road axis model and the choice of the line segment model, and the research dimensions and quantitative indexes are shown in Figure 4 and Table 2.

2.2.1. Topological Accessibility—Integration

Topological accessibility is assessed through the integration value in the axial model. The integration value measures the extent of clustering or dispersion between the nodal space and other nodes in the system, indicating the potential of the space to attract traffic flows. It comprises global and local integration values, with the local integration value radius (R) associated with the traffic range. A higher global integration value of the riverfront space indicates stronger connections to the surrounding traffic, making it more convenient for residents to access the riverfront space and consequently resulting in higher accessibility, formulated as Formula (1) [32].
I n t e g r a t i o n a = 2 M D 1 n 2
In the above formula, n stands for the total number of axes or nodes, and MD is the average depth value.

2.2.2. Geometrical Accessibility—Choice

Geometrical accessibility, measured as the choice in the line segment model, signifies the frequency with which a space in the system appears on the shortest path. This choice is directly linked to the space’s potential to attract crossing traffic, illustrating its penetration capacity. Moreover, a high choice value indicates that the road network surrounding the space is more likely to be chosen as the shortest route. Consequently, this enhances the likelihood of the space traversing, resulting in heightened spatial vitality. Integration mainly indicates the accessibility of the destination space that is closely related to residential activities, while choice mainly indicates the accessibility of the space when it is used as a transportation space, which is formulated as Formula (2) [39].
C h o i c e ( b ) = i = 1 n i = 1 n σ l ( i , x , j )   such   that   i j
In Depthmap, when calculating each shortest angular path in the system, each line segment on the path is assigned a value of 1. If both shortest paths pass through an element, then that element’s angular value of choice is 2. If x is not on the shortest path between i and j and is not the start or end point of the shortest path from i or j, then the value of choice is 0.

2.2.3. Perceptual Accessibility—Synergy

Perceptual accessibility is measured by the synergy value in the axial model, which analyzes the extent to which residents perceive the urban road network within a certain range of the riverfront space. Mathematically understood, the synergy is the correlation between a local and global variable, reflecting how an individual understands the global system when experiencing a local space. Synergy is positively correlated with the ability of residents to perceive the entire urban space through the local urban space, and usually, the synergy is calculated as the correlation between global integration and local integration R = 3—Formula (3) [30,42].
s y n e r g y ( c ) = I n t r I n t r ¯ I n t n I n t n ¯ 2 I n t r I n t r ¯ 2 I n t n I n t n ¯ 2
In the formula, Intr and Intn are denoted for local integration and global integration.

2.2.4. GIS Kernel Density Analysis

Kernel density analysis of the Geographic Information System (GIS) is used to calculate the density of data points in its surrounding neighborhood, which can be applied to the riverfront spatial analysis to analyze the value of spatial integration, synergy, and sparseness of POI data distribution, to express the spatial accessibility and the degree of aggregation and disaggregation of POIs visually [43]. To maximize the variance of the data for grading and stratification, and consequently, to make the hierarchy of accessibility of the study area clearer, the Natural Breaks (Jenks) method was used to classify the calculated values. Considering the data accuracy and drawing expression, combined with the actual situation of Songxi County and related research, this paper chooses 500 m as the search radius. It adopts the weighted kernel density analysis of the urban area to calculate the kernel density of each index of the riverfront space.

2.3. Data Sources and Processing

The map information required for this study comes from the Plan, the 2022 remote sensing image map of the main urban area of Songxi, and the web data of Baidu Maps. Historical opinion maps and demographic, cultural, social, and other humanistic information come from the relevant data recorded in the Songxi County Chronicle [44].
Based on the space syntax theory, the axial model was established in the Geographic Information System (GIS) based on the current road network, which was used as the basic data for studying urban riverfront spatial accessibility. A total of 2667 nodes of POI data of 12 categories, such as restaurants, shopping, and business residences, were obtained from the Amap developer platform in 2022 in the central urban area of Songxi County (Table 3), which were used for the calibration of the road network model.

3. Results

3.1. Syntactic Model Calibration

A total of 2667 POI data points, encompassing 12 categories such as catering, shopping, business, and residential, were collected from Amap using the API port. The data composition and spatial distribution are in Table 3 and Figure 5. The spatial analysis tool of the Geographic Information System (GIS) was employed to conduct kernel density analysis on the POIs. The results of the calculations were then categorized into nine groups, utilizing the Natural Breaks (Jenks) method. In order to verify the accuracy of the urban axial model constructed based on spatial syntax theory, the kernel density analysis maps of the globally integrated values were compared with the kernel density analysis maps of the POI. This comparison aimed to assess the alignment between the urban infrastructure and traffic flow with the current urban situation.
Importing POI data (Figure 5) and integration values (Figure 6) into GIS for kernel density analysis obtained kernel density maps for POI and integration. Upon comparing the POI kernel density analysis map (Figure 7) and the kernel density analysis map of the integration value of the urban area (Figure 8), it was observed that the integration value kernel density in Songxi County displayed a decreasing trend from the center to the periphery. This trend broadly corresponded to the distribution pattern of the POI kernel density. Thus, it can be inferred that the established axial model effectively reflects the distribution of urban functions with a certain degree of authenticity. Consequently, it demonstrates high credibility when employed for subsequent analysis of the riverfront space.

3.2. Topological Accessibility—Integration

The global integration map was generated using Depthmap software (Figure 6). The line colors in the figure vary based on the integration values, with warmer colors representing higher integration and cooler colors indicating lower integration. Integration is a measure of the connectivity between spaces, thus indicating that spaces with higher integration exhibit better accessibility.
Analyzing the integration value kernel density analysis figure (Figure 8), it becomes evident that the urban area’s global integration displays a pattern of high integration in the center and low integration in the surrounding areas. Specifically, the region surrounding the Songxi Laocheng area demonstrates high topological accessibility, gradually decreasing as one moves away from Laocheng at the center to the outskirts. Typically, the area with the highest integration value is referred to as the integration core, often serving as a city’s central hub.
As Figure 9 highlights, the integration core of the Songxi urban area is situated around the old city. This region is central to Songxi County’s ribbon urban form, linking Zhanlu and Chengdong while also serving as a vital nexus for north–south traffic within the Songxi urban area.
The global integration level of all road network axes within the study area was utilized as weights for kernel density analysis in the Geographic Information System (GIS). The resulting analysis was then overlaid to generate a schematic representation of integration and waterfront space overlay (Figure 9). Upon observing the figure, it becomes apparent that the riverfront zoning traverses through the core area of the urban region’s integration value. However, notable disparities exist in the integration levels of each zoning segment. In order to determine the integration value for each riverfront zoning district, an average value of the global integration value of all axes within the 500-m buffer zone of the riverfront was calculated. The riverfront subareas were subsequently ranked in descending order based on their mean value of global integration (Figure 10), as presented in Table 4.
The average global integration value for the waterfront area is 0.425332. Statistically, it becomes evident that the waterfront space near the old city of Songxi generally exhibits higher topological accessibility, particularly in the Chengdong and Zhanlu areas. However, when comparing the higher integration value in the Chengdong area with the lower integration value in the Lintun area, a substantial difference of 0.224846 in global integration becomes apparent.
This significant variation in accessibility among different waterfront areas necessitates careful consideration during the city’s subsequent road planning. Specifically, special attention should be given to optimizing the road infrastructure near the Zhanqian and the Lintun riverfront sub-district.

3.3. Geometrical Accessibility—Choice

The choice is closely related to traffic potential, with higher choice implying higher passing volumes and greater potential to attract traffic flows, which is reflected in the warmer axis colors in the figure. On the contrary, a lower choice value implies a low passing volume and a lower potential for attracting pedestrian and vehicular traffic, reflected in the figure’s colder axial colors (Figure 11). The radius is taken as 300 to observe the area analysis results for a 5-min walk; the radius is taken as 3000 to observe mainly the range of a 15-min car journey [35,45,46].
Walking 5 min (R300) analysis results are shown in Figure 11. From its kernel density analysis map (Figure 12), it can be seen that the distribution of areas with high choice is more scattered. Vehicle 15 min-R3000 (Figure 13) analysis results in the high choice value of the road, and the current situation of the city’s main streets is consistent, but the east of the city and Lintun area have a lower choice value—the subsequent need to improve.
Kernel density analysis was performed in the Geographic Information System (GIS) using the choice values of all roadway network segments in the study area as weights, and an overlay analysis of choice value kernel densities versus the spatial distribution of the waterfront was superimposed and mapped (Figure 12). It can be observed that the waterfront space is mainly distributed in the area with lower choice values. By comparing the kernel density analysis map of the integration value (Figure 8), it can be found that the areas with higher choice values in the urban area of Songxi County are looser than the areas with higher integration values. By calculating the average value of choice for waterfront zones (Figure 14) and organizing the waterfront zones in descending order based on choice value, Table 5 was generated.

3.4. Perceptual Accessibility—Synergy

In the synergy analysis, Table 6 is obtained by comparing the correlation coefficient R2 between the global integration value and the local integration value at different values of R and listing them in descending order.
Upon analyzing Table 6, it becomes evident that a significant variation exists in the correlation coefficients of the synergy value under different radii. The synergy value tends to increase with the rise in the value of the local integration value radius, denoted as R. The correlation coefficients of the synergy value at the radius of the local integration value are higher than those at the radius of the local integration value. Specifically, when R = 3, the comprehensibility of all roads in the urban area is 0.418, indicating that the overall comprehensibility of the urban area is low. As a result, perceiving the entirety of the urban space solely through the recognition of local space becomes challenging. In other words, the synergy in the walking dimension is low, the spatial connectivity between the riverfront space and the entire city is insufficient, and people’s ability to perceive the overall urban space through local space is limited. However, as R = 5, the synergy gradually increases, and on the whole, the spatial synergy in the Songxi urban area is high, with the connection between different spaces relatively close.
After counting the values of local integration at R = 3 and global integration within the coverage of each waterfront zoning district, the data were imported into SPSS software (IBM SPSS Statistics 26) to calculate the Pearson correlation values between the two. This calculation allowed for the determination of the synergy value of each waterfront district. Subsequently, the synergy value of the waterfront zones was ranked in descending order, and the results are presented in Table 7.
Based on the data from Table 7, it is evident that the synergy value of Lintun does not exceed 0.5. This indicates that the perceptual accessibility of this waterfront area is at a relatively low level. In an effort to improve the overall accessibility and connectivity of the area, the surrounding road infrastructure needs to be further enhanced and optimized in subsequent urban designs. The correlation of the other waterfront areas exceeds 0.5 and is higher than the average value of 0.690. As a result, the perceptual accessibility of these waterfront areas is relatively high. Residents located in the riverfront space are more likely to perceive the overall road network of the city more efficiently, leading to higher accuracy in reaching their destinations.
The topological accessibility, geographical accessibility, and perceptual accessibility indices of the riverfront zoning districts were ranked in descending order from 6-1 and plotted on a radar map (Figure 15). The graph shows that the three dimensions of Hedong are the most balanced in terms of accessibility, while Zhanlu, Chengdong, and Zhanqian are the second most balanced. The performance of the three indices in Laocheng and Lintun is extremely uneven. For areas with unbalanced accessibility, such as Lintun, local optimization adjustments can be made in the subsequent planning and construction of the city.

4. Discussion

The index ranks of the three dimensions of accessibility for each riverfront sub-district are ranked from 6-1 in descending order. From the summarized radar charts (Figure 16), it can be seen that the accessibility of the central sub-districts, such as Laocheng and Hedong, is better than that of the east–west sub-districts, such as Zhanqian and Lintun. According to the results of the previous study, the urban region exhibits an unequal distribution of accessibility, with the development of the south bank notably lagging. The majority of the places with high accessibility values are spread out along the river’s north bank, and the urban spatial arrangement is unbalanced, which is not optimal for the city’s continuing high-quality development. The following optimization strategies are suggested to enhance the accessibility of the riverfront space, taking into account the current condition and environmental characteristics of Songxi County.

4.1. Improving the Layout of Transport Networks

Improve the transportation network layout of the central city as a whole to enhance the accessibility of the riverfront space. The urban road network is regularized and refined on the prerequisite of not destroying the natural ecology. A multitude of arterial and branch roads are added, and “broken roads” are opened, aiming to improve the road network system of the central city, enhance operational efficiency, and increase the accessibility and coverage of the urban road network system. For the riverfront zoning with low global integration and choice, the connection of the surrounding slow roads is strengthened to enhance the permeability between the riverfront space and the city. To verify the reasonableness of the optimization measures, the optimized urban road (Figure 17) was subjected to syntactic measurements and kernel density analysis (Figure 18). The results show that the topological accessibility and geometrical accessibility of the urban road are significantly improved compared to the status quo. The average integration value is 0.57 (higher than 0.48 before optimization).
In terms of the urban design dimension, Figure 18 reveals a notable increase in the global integration of the West Bank, along with a shift in topological accessibility towards that area within the urban region. Furthermore, the core of urban integration has moved southwards, effectively alleviating the pressure on the old city and facilitating the “urban expansion from the West Bank to the East Bank”.

4.2. Strengthening Cross-Strait Coupling Links

Strengthen the coupling connection between the two sides of the river. The connection between the two sides of the existing riverfront space is opened up, and a more complete urban public space system is constructed. After optimization, the topological accessibility and angular permeability of the riverfront space are significantly improved compared with the current situation, and the average value of global integration is 0.57 (higher than 0.48 before optimization). The integration values of the riverside subregions before and after statistical optimization are tabulated (Table 8). It can be seen from the table that the integration value of each riverside subdivision has improved. The most significant improvement is Zhanqian (1.2 higher than the pre-optimization area), and the remaining zones have an average improvement of about 0.7. It can be seen that the optimization strategy not only improves the accessibility of the city as a whole but also significantly improves the accessibility of the local riverfront space. The validation results show that the road system around the riverfront space has been further enhanced, which will be more conducive to urban residents obtaining a rich recreational experience.
The following can be visualized from Figure 19: After the optimization, the nuclear density value of the central city is significantly increased. Compared with the status quo, the phenomenon of disconnection due to rivers in areas with higher nuclear density values has also been improved, and the distribution of areas with high values of choice of riverfront space is more balanced. There should also be a focus on improving access to inaccessible areas and strengthening synergistic management with road infrastructure. Areas with poor accessibility, such as Lintun, can be optimized by adjusting bus routes to improve the spatial accessibility of these areas.

4.3. Enriching the Function of Riverfront Space

According to the distribution of POIs (Figure 20), it can be seen that the current public facility support along the south bank is insufficient. Further consideration needs to be given to integrating green ecological space elements and giving urban functions to the riverfront space based on improving the slow-moving roads around the riverfront space. As a millennium-ancient county, Songxi County is rich in cultural deposits, and many historical sites in the urban area present typical cultural characteristics. It is suggested to selectively combine the historical and cultural elements with each riverfront area’s natural features, cultural connotation, and functional needs and give diversified themes and functions to meet residents’ diversified leisure and recreational needs. This will not only effectively bring into play the ecological support and leisure and recreational role of the riverfront areas but also promote the sustainable development of the city.

5. Conclusions

Based on the theory and technology of space syntax, this paper quantitatively evaluates the accessibility of Songxi’s waterfront space, considering three dimensions: topological accessibility, geometrical accessibility, and perceptual accessibility. This study yields the following conclusions:
  • The distribution of areas with high waterfront spatial accessibility exhibits an imbalance, with a concentration of high accessibility values in the central area. The core area of Laocheng demonstrates the best overall accessibility, followed by the Zhanlu and Chengdong areas. The accessibility of the Lintun area in the south is the least favorable, warranting upgrading measures.
  • A certain level of mismatch is observed between the distribution area of high urban spatial accessibility and the waterfront space. Hence, there is a need to enhance the planning and intersection design in the riverfront area.
  • The connection of the riverfront space between the north and south banks appears weak, resulting in an evident disconnection in the riverbank’s area of high accessibility value.
After optimizing the layout of urban roads and riverfront spaces, it has been observed that the strategies aimed at enhancing the transportation network layout, strengthening the connectivity between both sides of the river, and enriching the functionalities of the riverfront space have led to significant improvements in the overall connectivity and accessibility of the transportation network. Consequently, there have been enhancements in global integration and choice value for both urban roads and riverfront spaces. Moreover, the distribution of areas with high accessibility values in the urban and riverfront spaces has become more balanced. The optimization strategy proposed in this study has been preliminarily validated and is expected to provide a modest reference for the subsequent optimization of waterfront spaces.
The accessibility algorithm adopted in this paper also has certain limitations and shortcomings: the measurement theory is mainly based on topological principles, which is a simplified treatment of the real road. However, the accessibility of urban space is also affected by various subjective and objective factors, such as public transportation interchange. The line angle analysis mentioned in this paper may have a connection that can be studied more deeply. In further study, it is expected that public transportation, population density, and other factors will be considered to optimize the existing accessibility measurement methods further, making the research results more accurate and comprehensive.

Author Contributions

Conceptualization, Y.L.; data curation, Y.L.; formal analysis, Y.L.; funding acquisition, Z.L.; investigation, Y.L.; methodology, Y.L.; project administration, Z.L.; resources, Z.L.; software, Y.L.; supervision, Z.L.; validation, Y.L.; visualization, Y.L.; writing—original draft, Y.L.; writing—review and editing, Y.L. All authors have read and agreed to the published version of the manuscript.
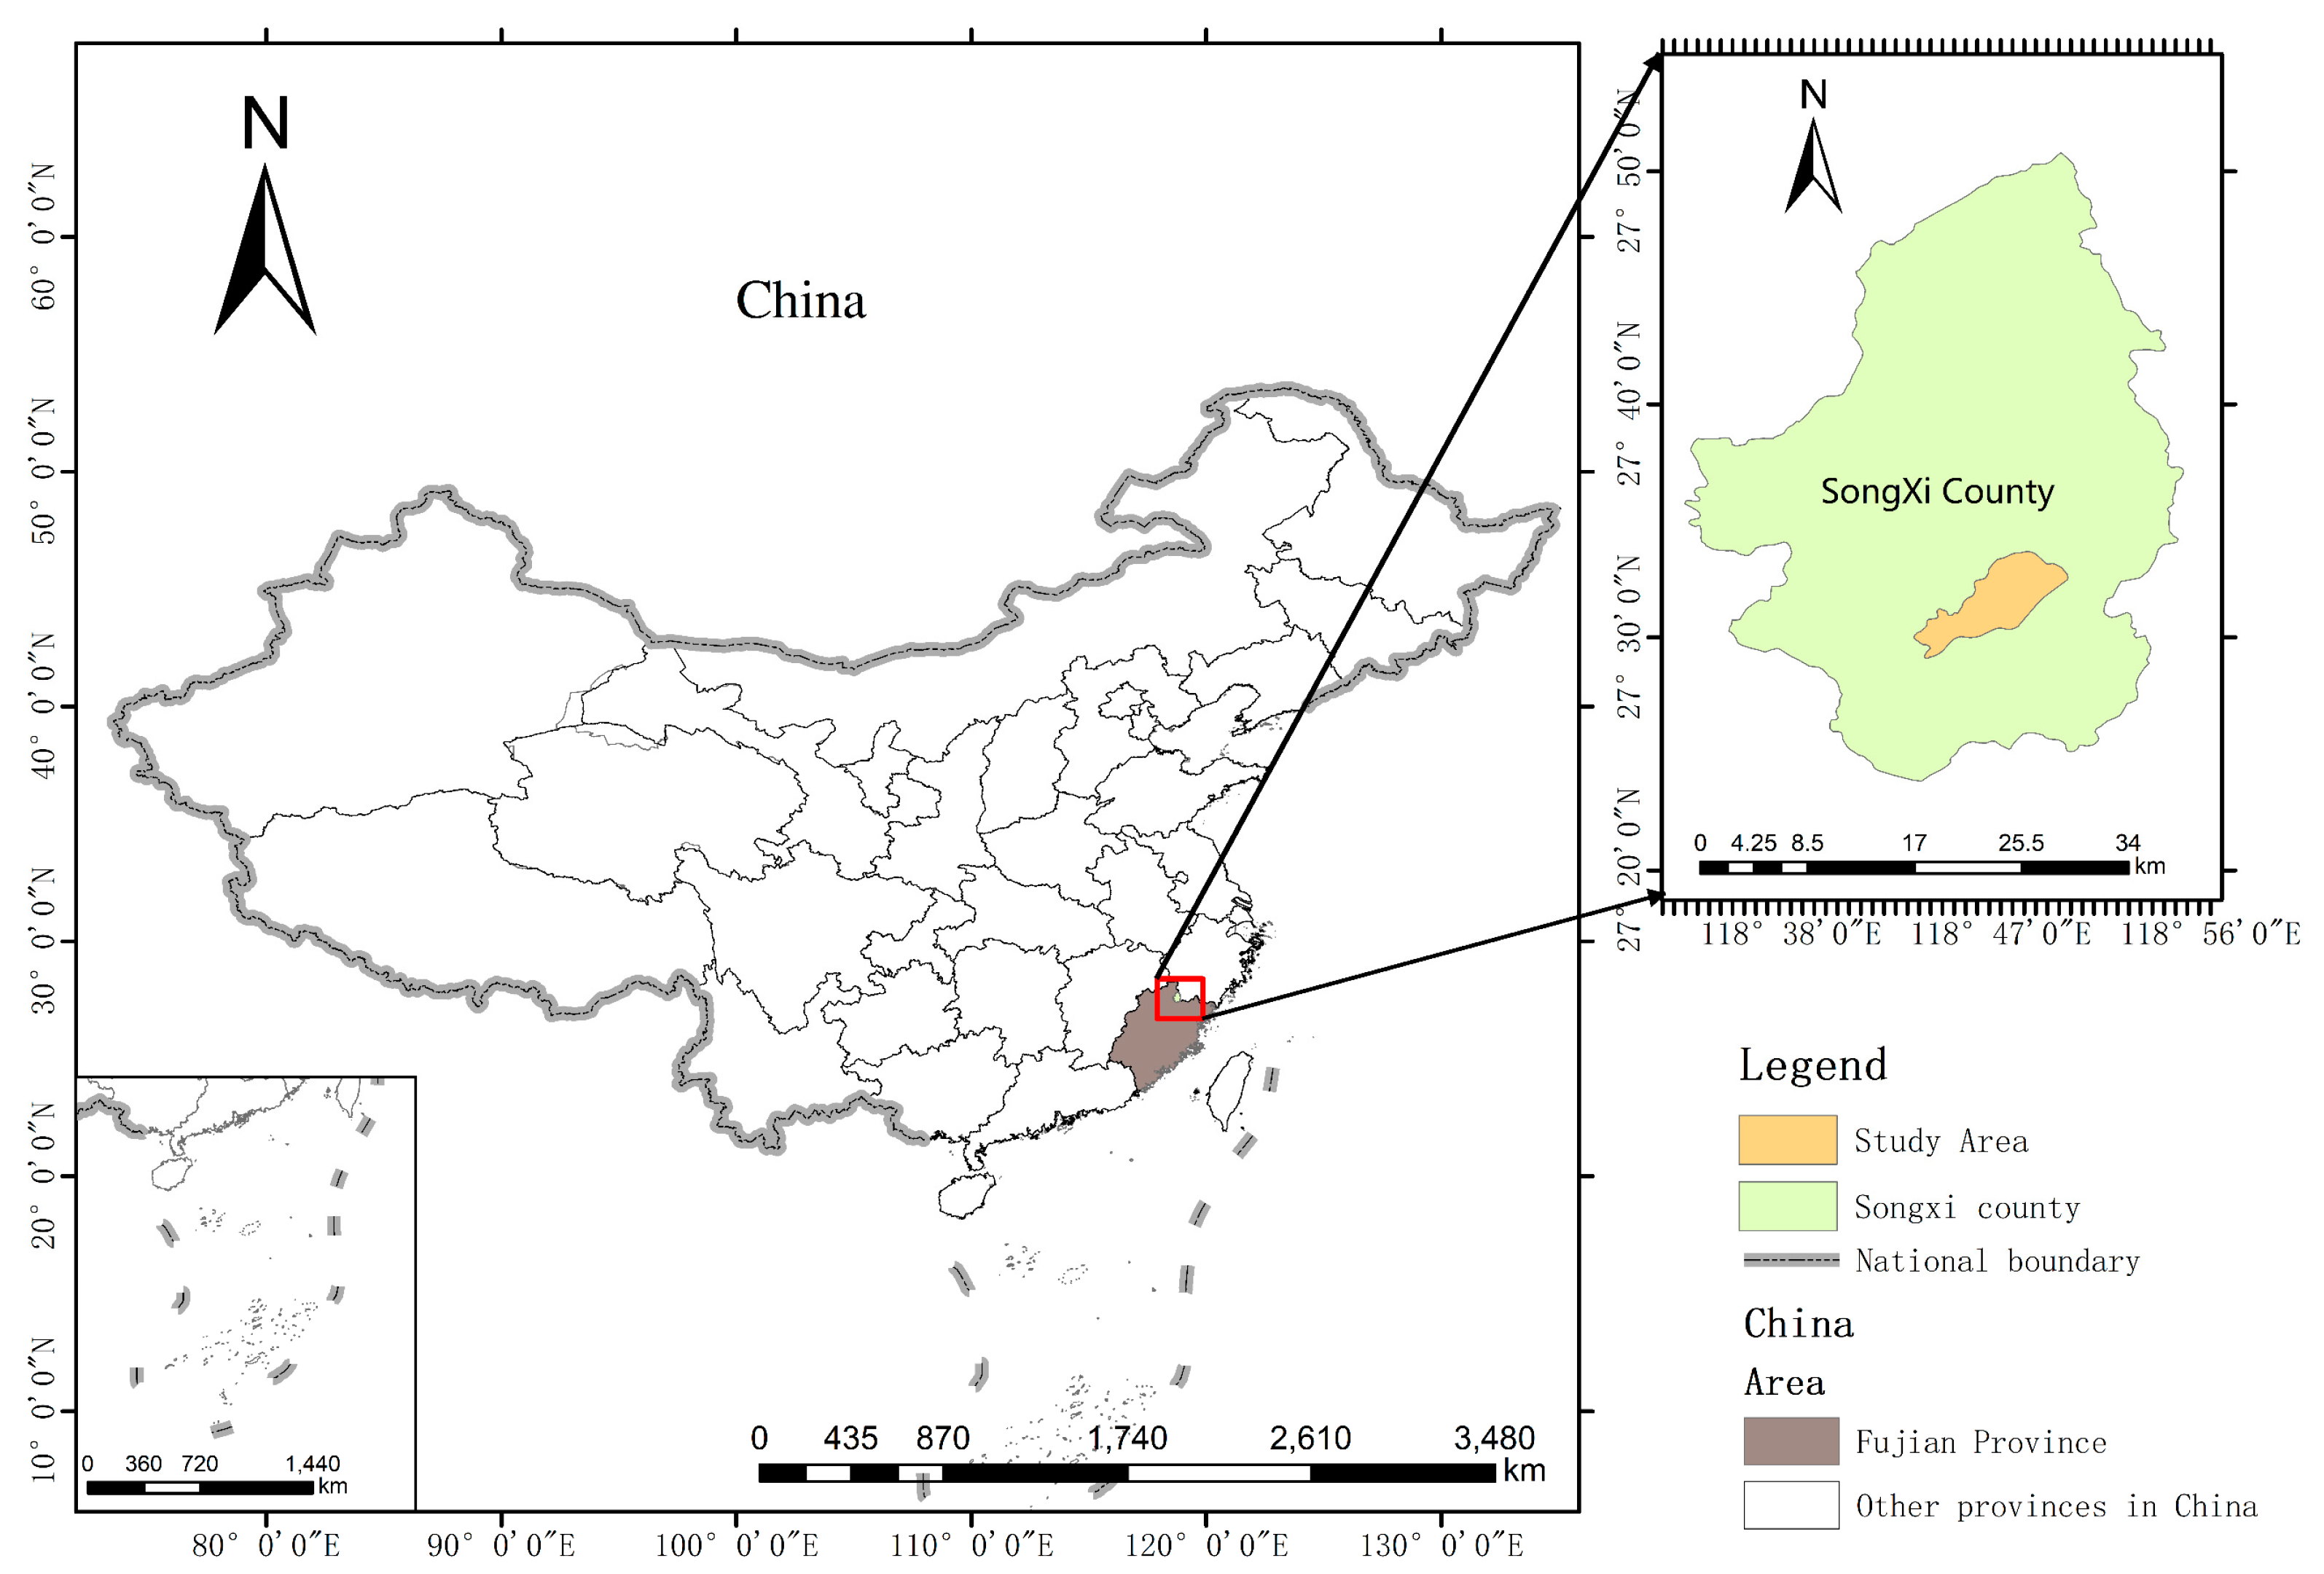
Funding

This project was supported by the Program of Humanities and Social Science Research of the Ministry of Education of China (grant no.20YJAZH063).

Institutional Review Board Statement

Not applicable.

Informed Consent Statement

Not applicable.

Data Availability Statement

The data presented in this study are available on request from the corresponding author.

Conflicts of Interest

The authors declare no conflict of interest.

References

  1. Che, Y.; Yang, K.; Chen, T.; Xu, Q. Assessing a Riverfront Rehabilitation Project Using the Comprehensive Index of Public Accessibility. Ecol. Eng. 2012, 40, 80–87. [Google Scholar] [CrossRef]
  2. Xue, S.; Zhang, Q.; Duan, J. Crossing and Coupling: A New Spatial Development Mode of Urban Waterfront—A Study on Lu’an Pi River Waterfront Urban Design. Mod. Urban Res. 2014, 1, 57–61. (In Chinese) [Google Scholar]
  3. Durán Vian, F.; Pons Izquierdo, J.J.; Serrano Martínez, M. River-City Recreational Interaction: A Classification of Urban Riverfront Parks and Walks. Urban For. Urban Green. 2021, 59, 127042. [Google Scholar] [CrossRef]
  4. Jin, G. Overview of Urban Waterfront Planning and Design in Japan. City Plan. Rev. 1994, 18, 45–49. (In Chinese) [Google Scholar]
  5. Attia, S.; Ibrahim, A.A.A.M. Accessible and Inclusive Public Space: The Regeneration of Waterfront in Informal Areas. Urban Res. Pract. 2018, 11, 314–337. [Google Scholar] [CrossRef]
  6. Hansen, W.G. How Accessibility Shapes Land Use. J. Am. Inst. Plan. 1959, 25, 73–76. [Google Scholar] [CrossRef]
  7. Pinna, F.; Garau, C.; Annunziata, A. A Literature Review on Urban Usability and Accessibility to Investigate the Related Criteria for Equality in the City. In Computational Science and Its Applications–ICCSA 2021; Gervasi, O., Murgante, B., Misra, S., Garau, C., Blečić, I., Taniar, D., Apduhan, B.O., Rocha, A.M.A.C., Tarantino, E., Torre, C.M., Eds.; Springer International Publishing: Cham, Switzerland, 2021; pp. 525–541. [Google Scholar]
  8. Talen, E.; Anselin, L. Assessing Spatial Equity: An Evaluation of Measures of Accessibility to Public Playgrounds. Env. Plan. A 1998, 30, 595–613. [Google Scholar] [CrossRef]
  9. Mrak, I.; Matan, C. Can You Access Culture? An Evaluation Model for the Accessibility of Cultural Locations. Advan. Civ. Archit. Eng. 2022, 24, 32–46. [Google Scholar] [CrossRef]
  10. Ekkel, E.D.; de Vries, S. Nearby Green Space and Human Health: Evaluating Accessibility Metrics. Landsc. Urban Plan. 2017, 157, 214–220. [Google Scholar] [CrossRef]
  11. Canale, A.; Campisi, T.; Tesoriere, G.; Sanfilippo, L.; Brignone, A. The Evaluation of Home-School Itineraries to Improve Accessibility of a University Campus Trough Sustainable Transport Modes. In Computational Science and Its Applications-ICCSA 2020, PT II.; Gervasi, O., Murgante, B., Misra, S., Garau, C., Blecic, I., Taniar, D., Apduhan, B.O., Rocha, A., Tarantino, E., Torre, C.M., et al., Eds.; Springer International Publishing Ag: Cham, Switzerland, 2020; Volume 12250, pp. 754–769. [Google Scholar]
  12. Nicholls, S. Measuring the Accessibility and Equity of Public Parks: A Case Study Using GIS. Manag. Leis. 2001, 6, 201–219. [Google Scholar] [CrossRef]
  13. Hermida, M.A.; Cabrera-Jara, N.; Osorio, P.; Cabrera, S. Methodology for the Assessment of Connectivity and Comfort of Urban Rivers. Cities 2019, 95, 102376. [Google Scholar] [CrossRef]
  14. May, R. “Connectivity” in Urban Rivers: Conflict and Convergence between Ecology and Design. Technol. Soc. 2006, 28, 477–488. [Google Scholar] [CrossRef]
  15. Shi, S.; Kondolf, G.M.; Li, D. Urban River Transformation and the Landscape Garden City Movement in China. Sustainability 2018, 10, 4103. [Google Scholar] [CrossRef]
  16. Xu, C.; Wang, J. Study on Accessibility Optimization of Urban Recreation Green Space. Chin. Landsc. Archit. 2020, 36, 128–133. (In Chinese) [Google Scholar] [CrossRef]
  17. Othman, A.; Al-Hagla, K.; Hasan, A.E. The Impact of Attributes of Waterfront Accessibility on Human Well-Being: Alexandria Governorate as a Case Study. Ain Shams Eng. J. 2021, 12, 1033–1047. [Google Scholar] [CrossRef]
  18. Akpinar, A. Factors Influencing the Use of Urban Greenways: A Case Study of Aydın, Turkey. Urban For. Urban Green. 2016, 16, 123–131. [Google Scholar] [CrossRef]
  19. Çetin, M. Using GIS Analysis to Assess Urban Green Space in Terms of Accessibility: Case Study in Kutahya. Int. J. Sustain. Dev. World Ecol. 2015, 22, 420–424. [Google Scholar] [CrossRef]
  20. Heo, S.; Nori-Sarma, A.; Kim, S.; Lee, J.-T.; Bell, M.L. Do Persons with Low Socioeconomic Status Have Less Access to Greenspace? Application of Accessibility Index to Urban Parks in Seoul, South Korea. Environ. Res. Lett. 2021, 16, 084027. [Google Scholar] [CrossRef]
  21. Stessens, P.; Khan, A.Z.; Huysmans, M.; Canters, F. Analysing Urban Green Space Accessibility and Quality: A GIS-Based Model as Spatial Decision Support for Urban Ecosystem Services in Brussels. Ecosyst. Serv. 2017, 28, 328–340. [Google Scholar] [CrossRef]
  22. Setola, N.; Marzi, L.; Torricelli, M.C. Accessibility Indicator for a Trails Network in a Nature Park as Part of the Environmental Assessment Framework. Environ. Impact Assess. Rev. 2018, 69, 1–15. [Google Scholar] [CrossRef]
  23. Ståhle, A.; Marcus, L.; Karlström, A. Place Syntax: Geographic Accessibility with Axial Lines in GIS; Techne Press: Amsterdam, The Netherlands, 2005; pp. 131–144. [Google Scholar]
  24. Ma, Y.; Ling, C.; Wu, J. Exploring the Spatial Distribution Characteristics of Emotions of Weibo Users in Wuhan Waterfront Based on Gender Differences Using Social Media Texts. ISPRS Int. J. Geo-Inf. 2020, 9, 465. [Google Scholar] [CrossRef]
  25. Zhang, X.; Sun, L.; Shao, Z.; Zhou, X. Accessibility Evaluation of Public Service Facilities in Villages and Towns Based on POI Data: A Case Study of Suining County, Xuzhou, China. J. Urban Plan. Dev. 2023, 149, 05023019. [Google Scholar] [CrossRef]
  26. You, X.; Fu, Y.; Liu, T. The Accessibility of Educational Public Service Facilities with Two-Step Mobile Search Taking Hetao District of Ganzhou City as an Example. Comput. Intell. Neurosci. 2022, 2022, e5646260. [Google Scholar] [CrossRef] [PubMed]
  27. Jadidi, M.; Jamshidiha, S.; Masroori, I.; Moslemi, P.; Mohammadi, A.; Pourahmadi, V. A Two-Step Vaccination Technique to Limit COVID-19 Spread Using Mobile Data. Sustain. Cities Soc. 2021, 70, 102886. [Google Scholar] [CrossRef]
  28. Alemdar, K.D.; Kaya, O.; Codur, M.Y.; Campisi, T.; Tesoriere, G. Accessibility of Vaccination Centers in COVID-19 Outbreak Control: A GIS-Based Multi-Criteria Decision Making Approach. ISPRS Int. J. Geo-Inf. 2021, 10, 708. [Google Scholar] [CrossRef]
  29. Cheng, S.; Zhai, Z.; Sun, W.; Wang, Y.; Yu, R.; Ge, X. Research on the Satisfaction of Beijing Waterfront Green Space Landscape Based on Social Media Data. Land 2022, 11, 1849. [Google Scholar] [CrossRef]
  30. Hillier, B.; Leaman, A.; Stansall, P.; Bedford, M. Space Syntax. Env. Plan. B Plan. Des. 1976, 3, 147–185. [Google Scholar] [CrossRef]
  31. Jiang, B.; Claramunt, C.; Klarqvist, B. Integration of Space Syntax into GIS for Modelling Urban Spaces. Int. J. Appl. Earth Obs. Geoinf. 2000, 2, 161–171. [Google Scholar] [CrossRef]
  32. Jiang, B.; Claramunt, C. Integration of Space Syntax into GIS: New Perspectives for Urban Morphology. Trans. GIS 2002, 6, 295–309. [Google Scholar] [CrossRef]
  33. Charalambous, N.; Mavridou, M. Space Syntax: Spatial Integration Accessibility and Angular Segment Analysis by Metric Distance (ASAMeD). Access. Instrum. Plan. Pract. Cost. Off. 2012, 57–62. [Google Scholar]
  34. Enström, R.; Netzell, O. Can Space Syntax Help Us in Understanding the Intraurban Office Rent Pattern? Accessibility and Rents in Downtown Stockholm. J. Real Estate Finan. Econ. 2008, 36, 289–305. [Google Scholar] [CrossRef]
  35. Era, R.T. Improving Pedestrian Accessibility to Public Space through Space Syntax Analysis. In Proceedings of the 8th International Space Syntax Symposium, Santiago, Chile, 3–6 January 2012; pp. 3–6. [Google Scholar]
  36. Huang, B.-X.; Chiou, S.-C.; Li, W.-Y. Accessibility and Street Network Characteristics of Urban Public Facility Spaces: Equity Research on Parks in Fuzhou City Based on GIS and Space Syntax Model. Sustainability 2020, 12, 3618. [Google Scholar] [CrossRef]
  37. Abdeldayem, W.S.; El-Khouly, T. Investigating the Urban Structure of Newly Planned Cities in Egypt: The Case Study of New Cairo City. In Architecture and Urbanism: A Smart Outlook; Kamel, S., Sabry, H., Hassan, G.F., Refat, M., Elshater, A., Elrahman, A.S.A., Hassan, D.K., Rashed, R., Eds.; Springer International Publishing: Cham, Switzerland, 2020; pp. 401–410. [Google Scholar]
  38. Zhang, Y.; Sun, Y.; Yao, C. The Application of Spatial Syntax in the Accessibility Study of Urban Parks—A Case Study of Wuhan. Chin. Landsc. Archit. 2019, 35, 92–96. (In Chinese) [Google Scholar] [CrossRef]
  39. Turner, A. From Axial to Road-Centre Lines: A New Representation for Space Syntax and a New Model of Route Choice for Transport Network Analysis. Env. Plan. B Plan. Des. 2007, 34, 539–555. [Google Scholar] [CrossRef]
  40. Turner, A. Angular Analysis. In Proceedings of the 3rd International Symposium on Space Syntax, Atlanta, GA, USA,, 7–11 May 2001; Volume 30, p. 30-11. [Google Scholar]
  41. Jiang, B.; Claramunt, C. Topological Analysis of Urban Street Networks. Env. Plan. B Plan. Des. 2004, 31, 151–162. [Google Scholar] [CrossRef]
  42. Li, X.; Lv, Z.; Zheng, Z.; Zhong, C.; Hijazi, I.H.; Cheng, S. Assessment of Lively Street Network Based on Geographic Information System and Space Syntax. Multimed. Tools Appl. 2017, 76, 17801–17819. [Google Scholar] [CrossRef]
  43. Hu, Y.; Han, Y. Identification of Urban Functional Areas Based on POI Data: A Case Study of the Guangzhou Economic and Technological Development Zone. Sustainability 2019, 11, 1385. [Google Scholar] [CrossRef]
  44. Songxi County Local Chronicles Compilation Committee. Songxi County Chronicle; (In Chinese). China Statistics Press: Beijing, China, 1994. [Google Scholar]
  45. Zaleckis, K.; Chmielewski, S.; Kamičaitytė, J.; Grazuleviciute-Vileniske, I.; Lipińska, H. Walkability Compass—A Space Syntax Solution for Comparative Studies. Sustainability 2022, 14, 2033. [Google Scholar] [CrossRef]
  46. Safizadeh, M.; Maghsoodi Tilaki, M.J.; Hedayati Marzbali, M.; Abdullah, A. Smart City and Spatial Configuration: Assessing Accessibility and Intelligibility to Increase Mobility in the George Town Heritage Site, Malaysia. Open House Int. 2023, 48, 521–541. [Google Scholar] [CrossRef]
Figure 1. Songxi County location map. Source: authors, using ArcGIS 10.2. Image source: Geospatial Data Cloud https://www.gscloud.cn/sources/ (accessed on 29 March 2023).
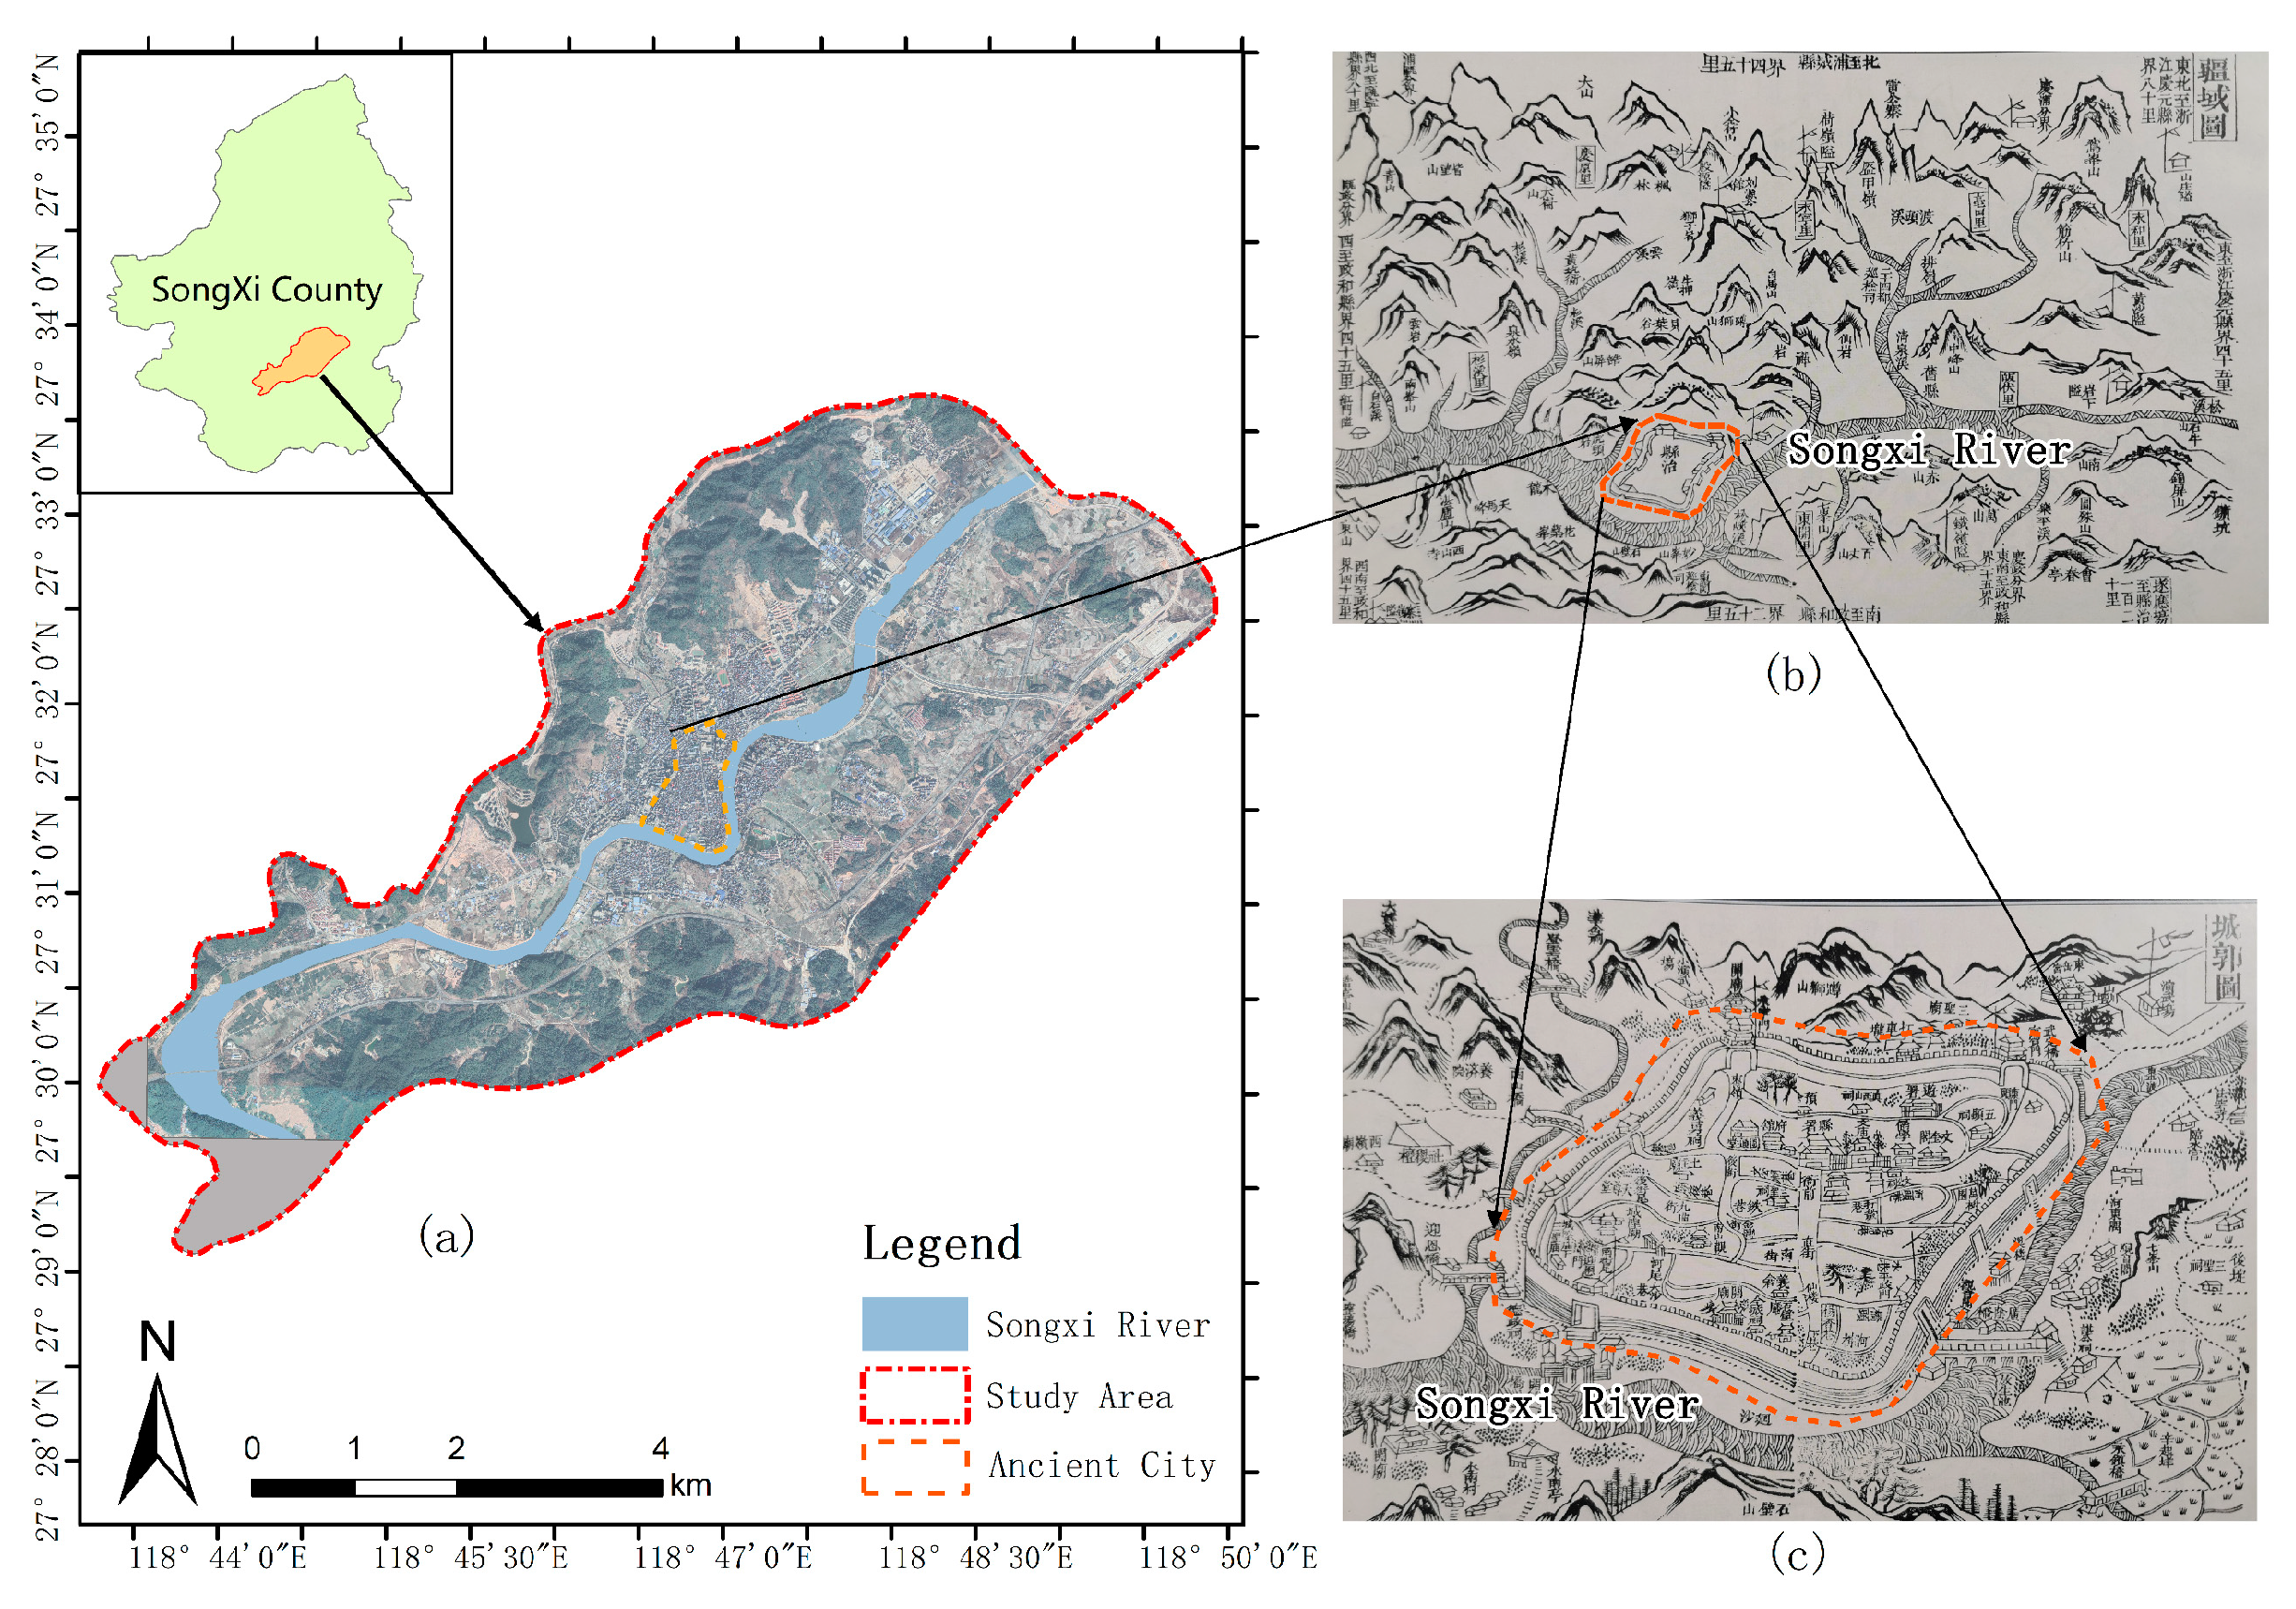
Sustainability 15 14929 g001
Figure 2. Schematic diagram of the relationship between ancient and modern cities and rivers in Songxi County. (a) Aerial map of the study area in 2022. (b) Map of Songxi County boundary from 1700. (c) Map of the ancient city of Songxi in 1700. Source: authors, using ArcGIS. Image source: this map is based on the 1994 “Songxi County Chronicle”.
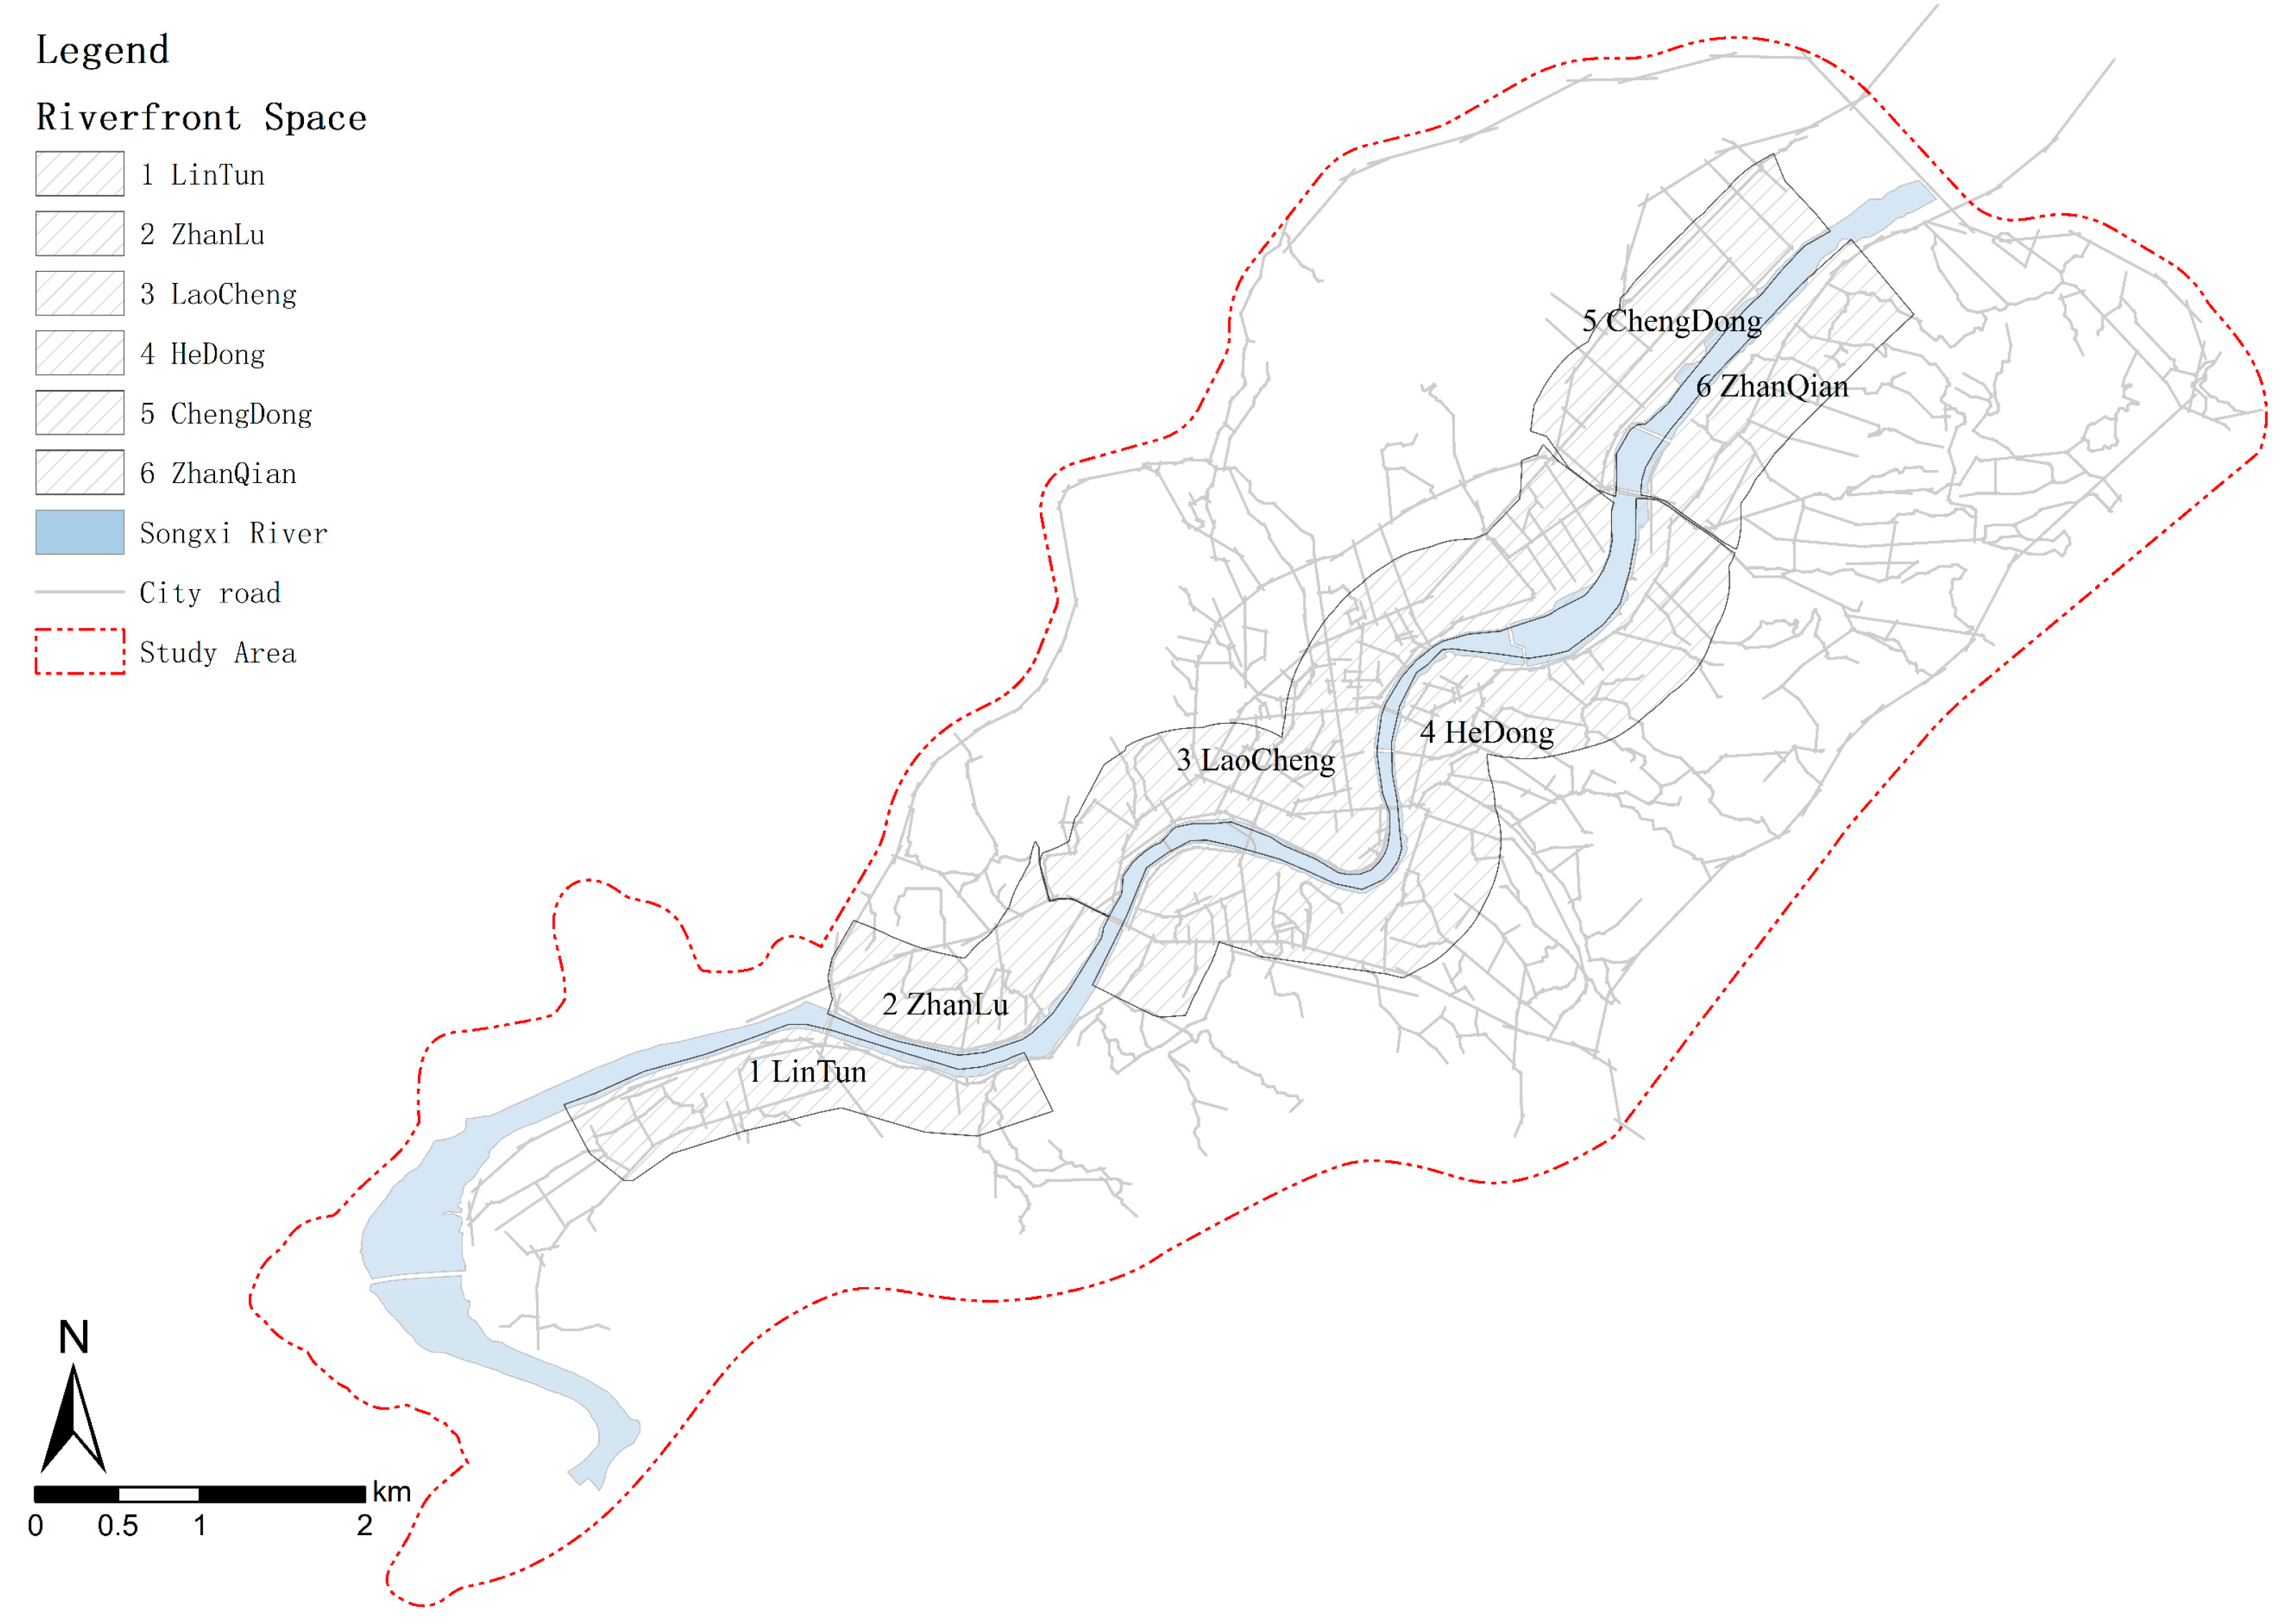
Sustainability 15 14929 g002
Figure 3. Songxi County riverfront section zoning schematic. Source: authors, using ArcGIS.
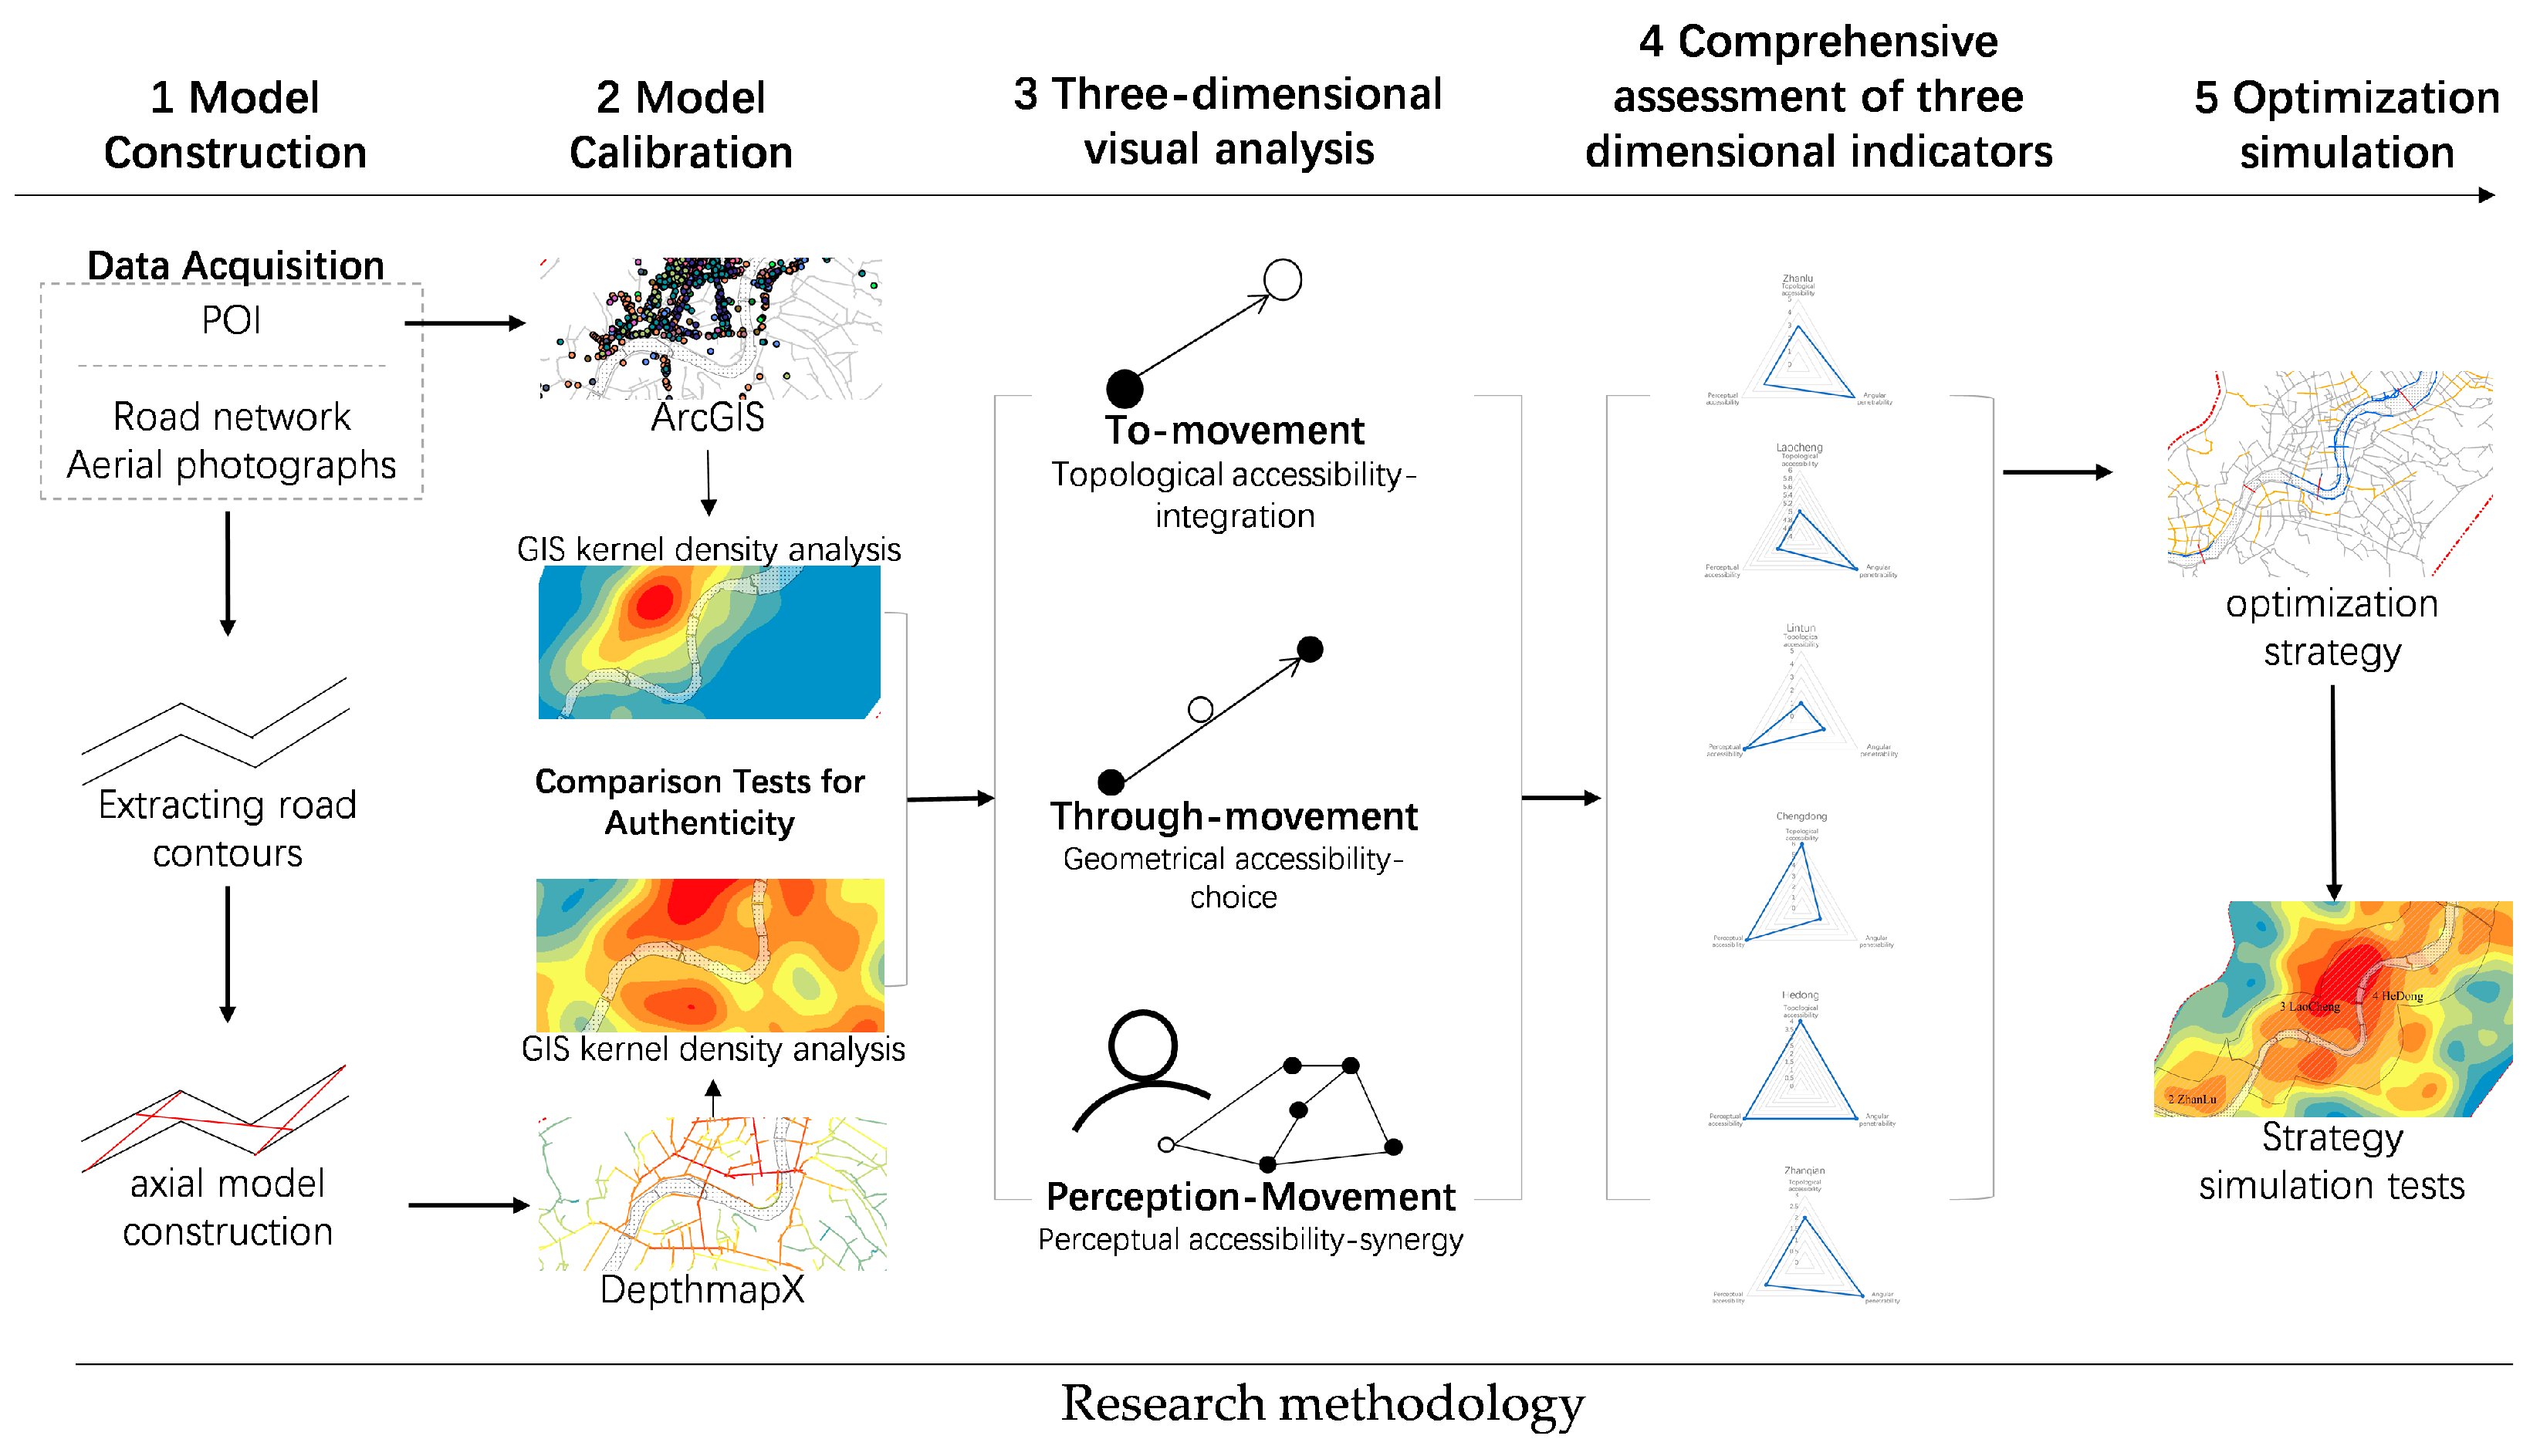
Sustainability 15 14929 g003
Figure 4. Methodological schematic of the study. The workflow of the research methodology includes 1 model construction, 2 model calibration, 3 three-dimensional visual analysis, 4 comprehensive assessment of three-dimensional indicators, and 5 optimization simulation. Source: authors, using ArcGIS 10.2, DepthmapX v0.8.0, and Excel.
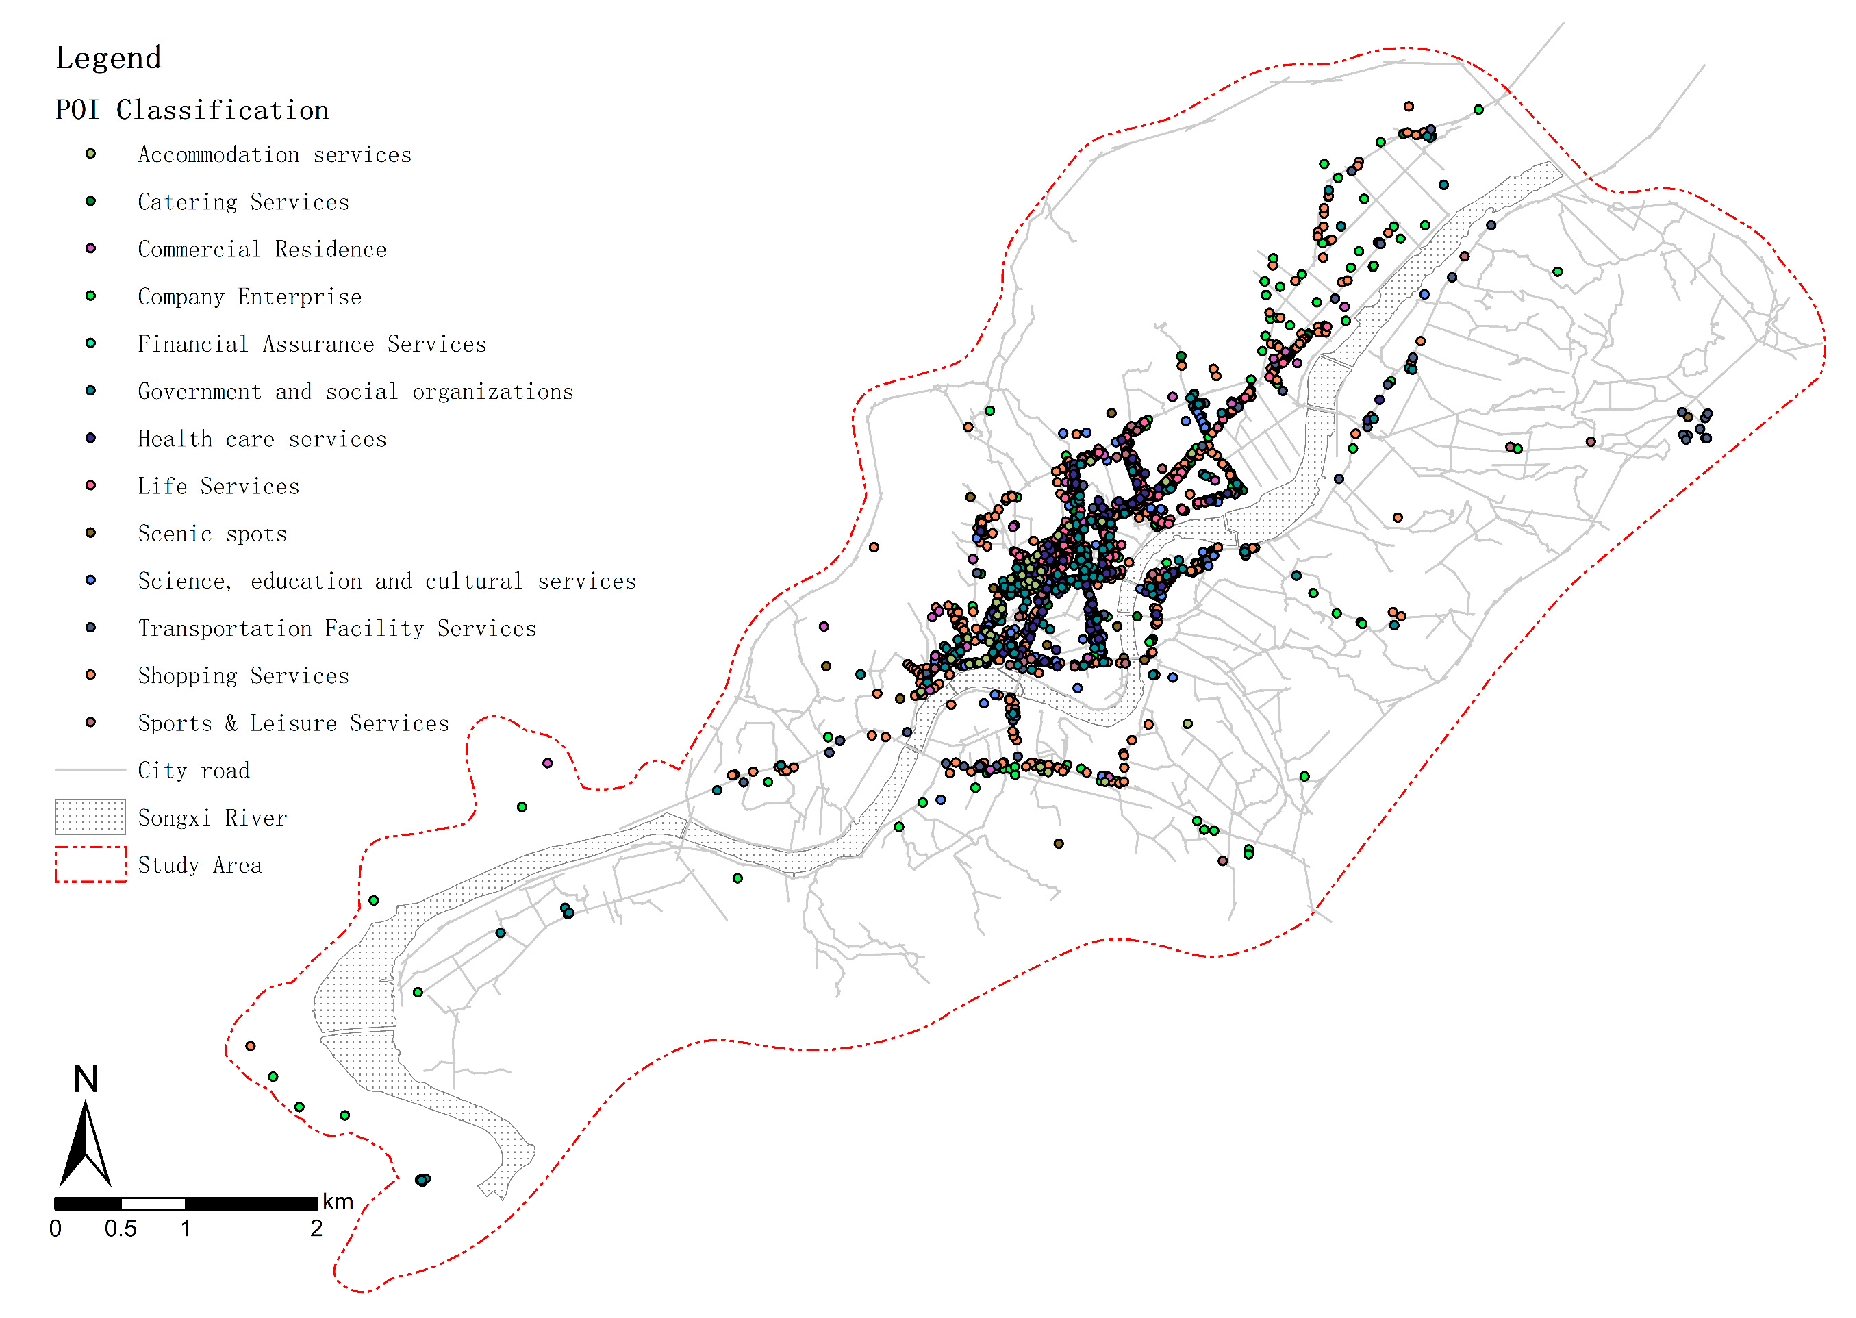
Sustainability 15 14929 g004
Figure 5. Urban POI distribution map. Source: authors, using ArcGIS 10.2 and Amap API.
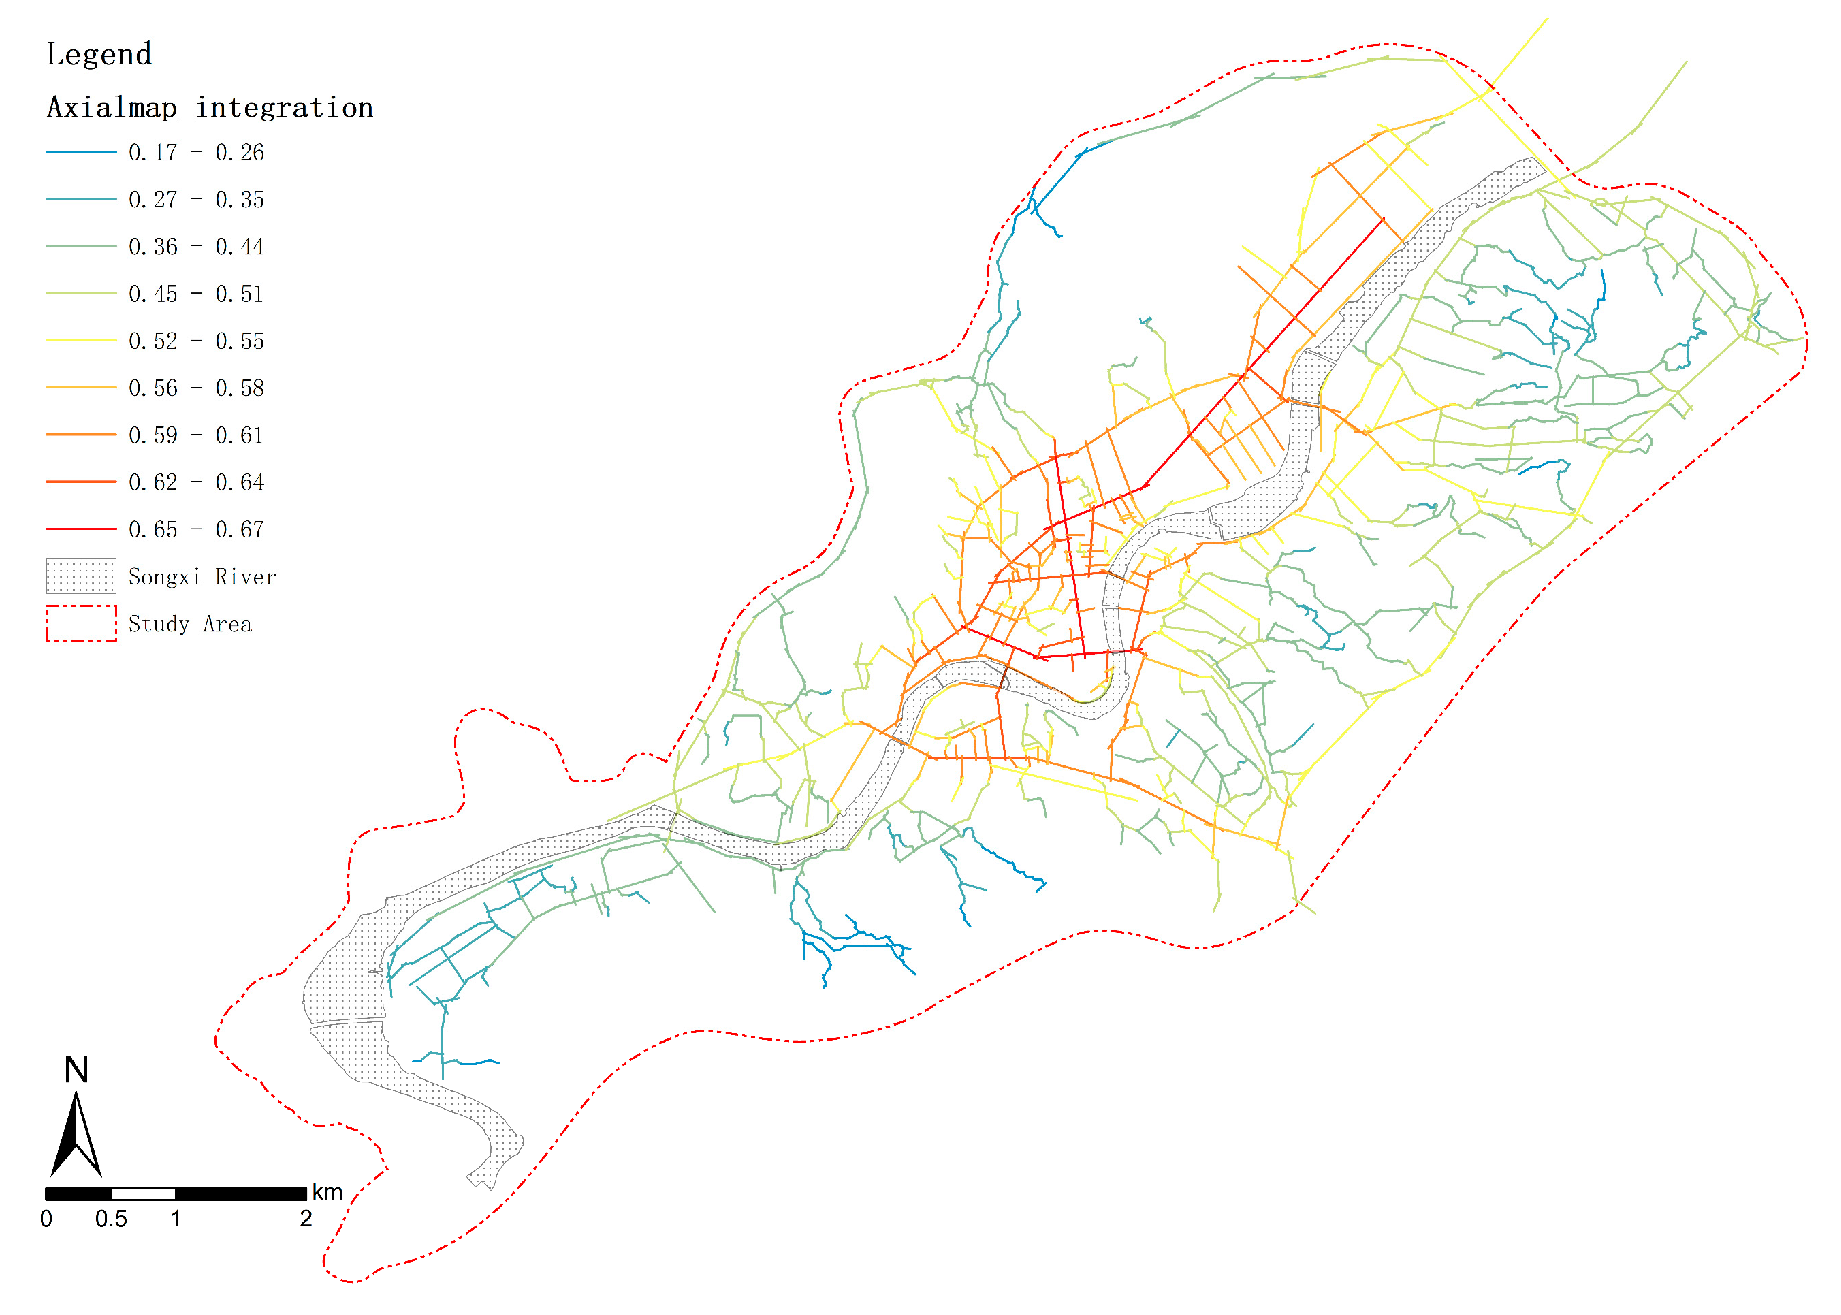
Sustainability 15 14929 g005
Figure 6. Schematic diagram of global integration. Source: authors, using ArcGIS 10.2 and DepthmapX v0.8.0.
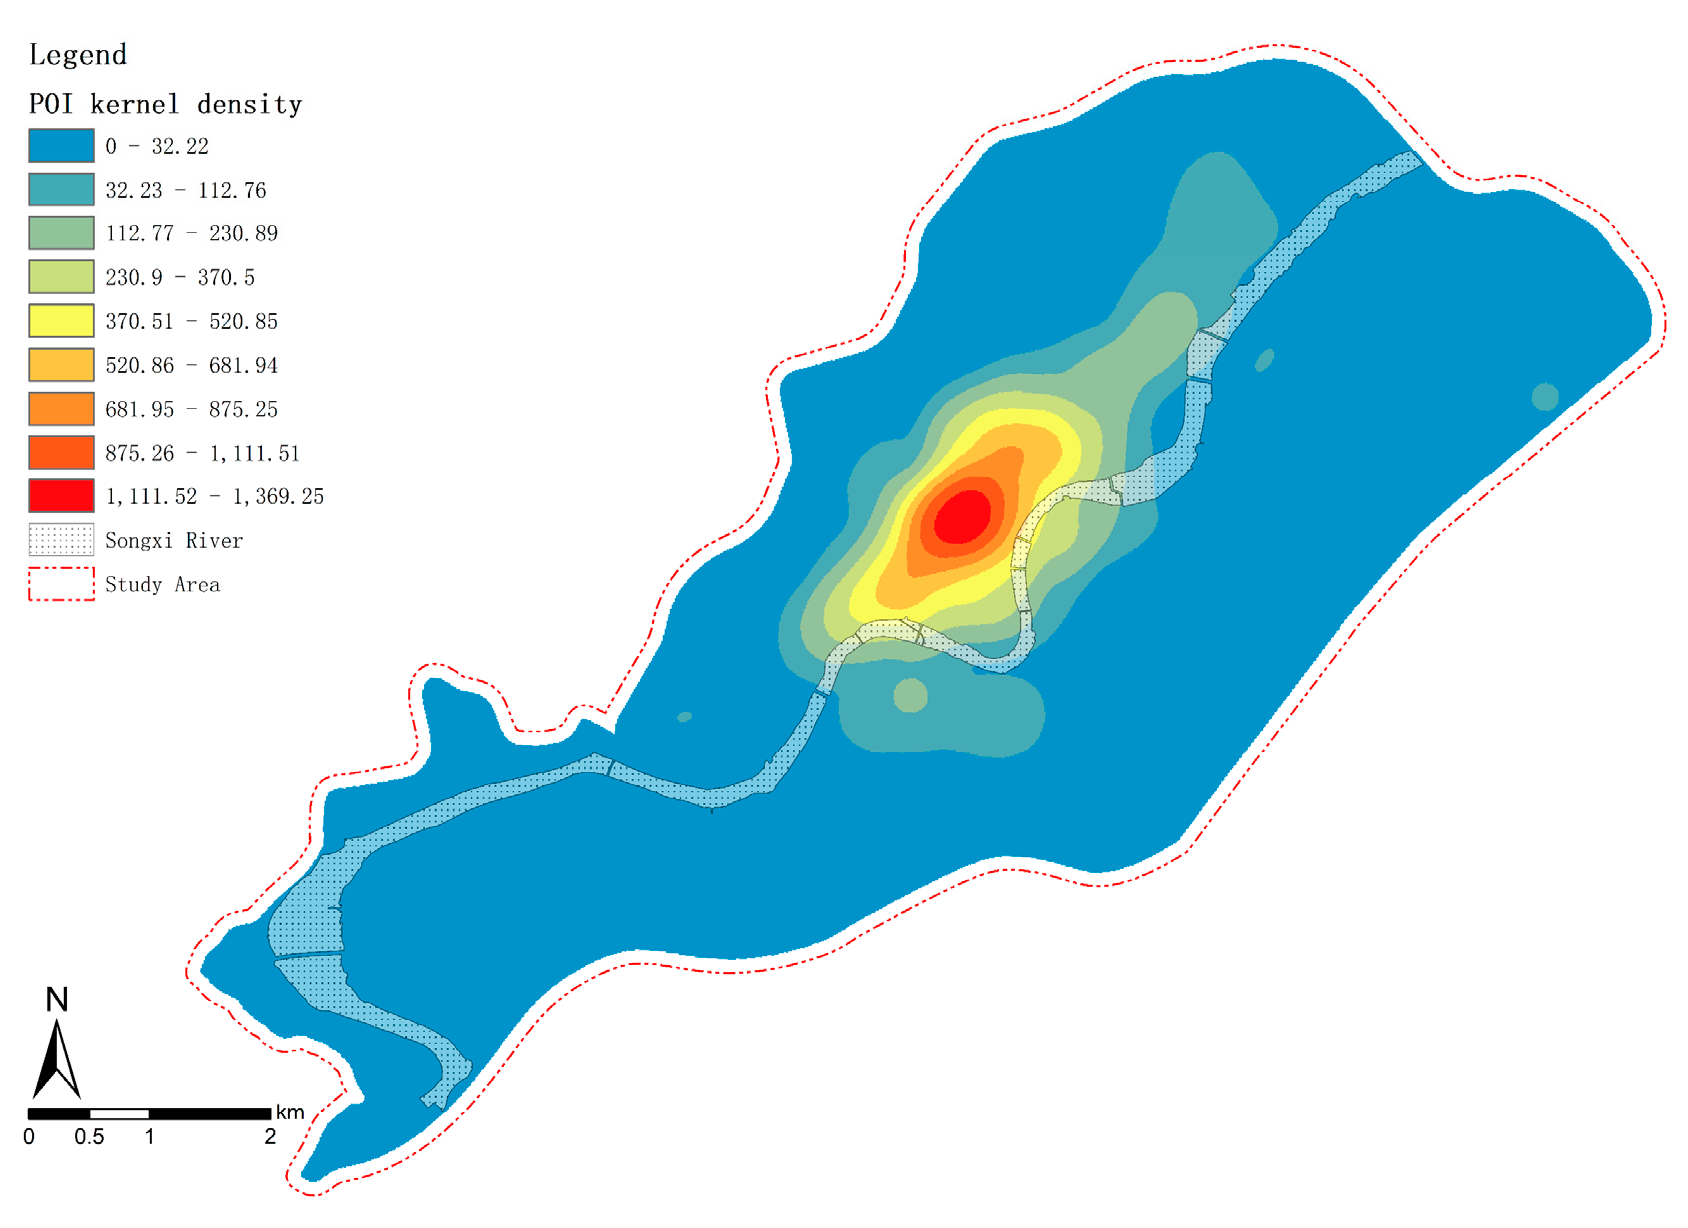
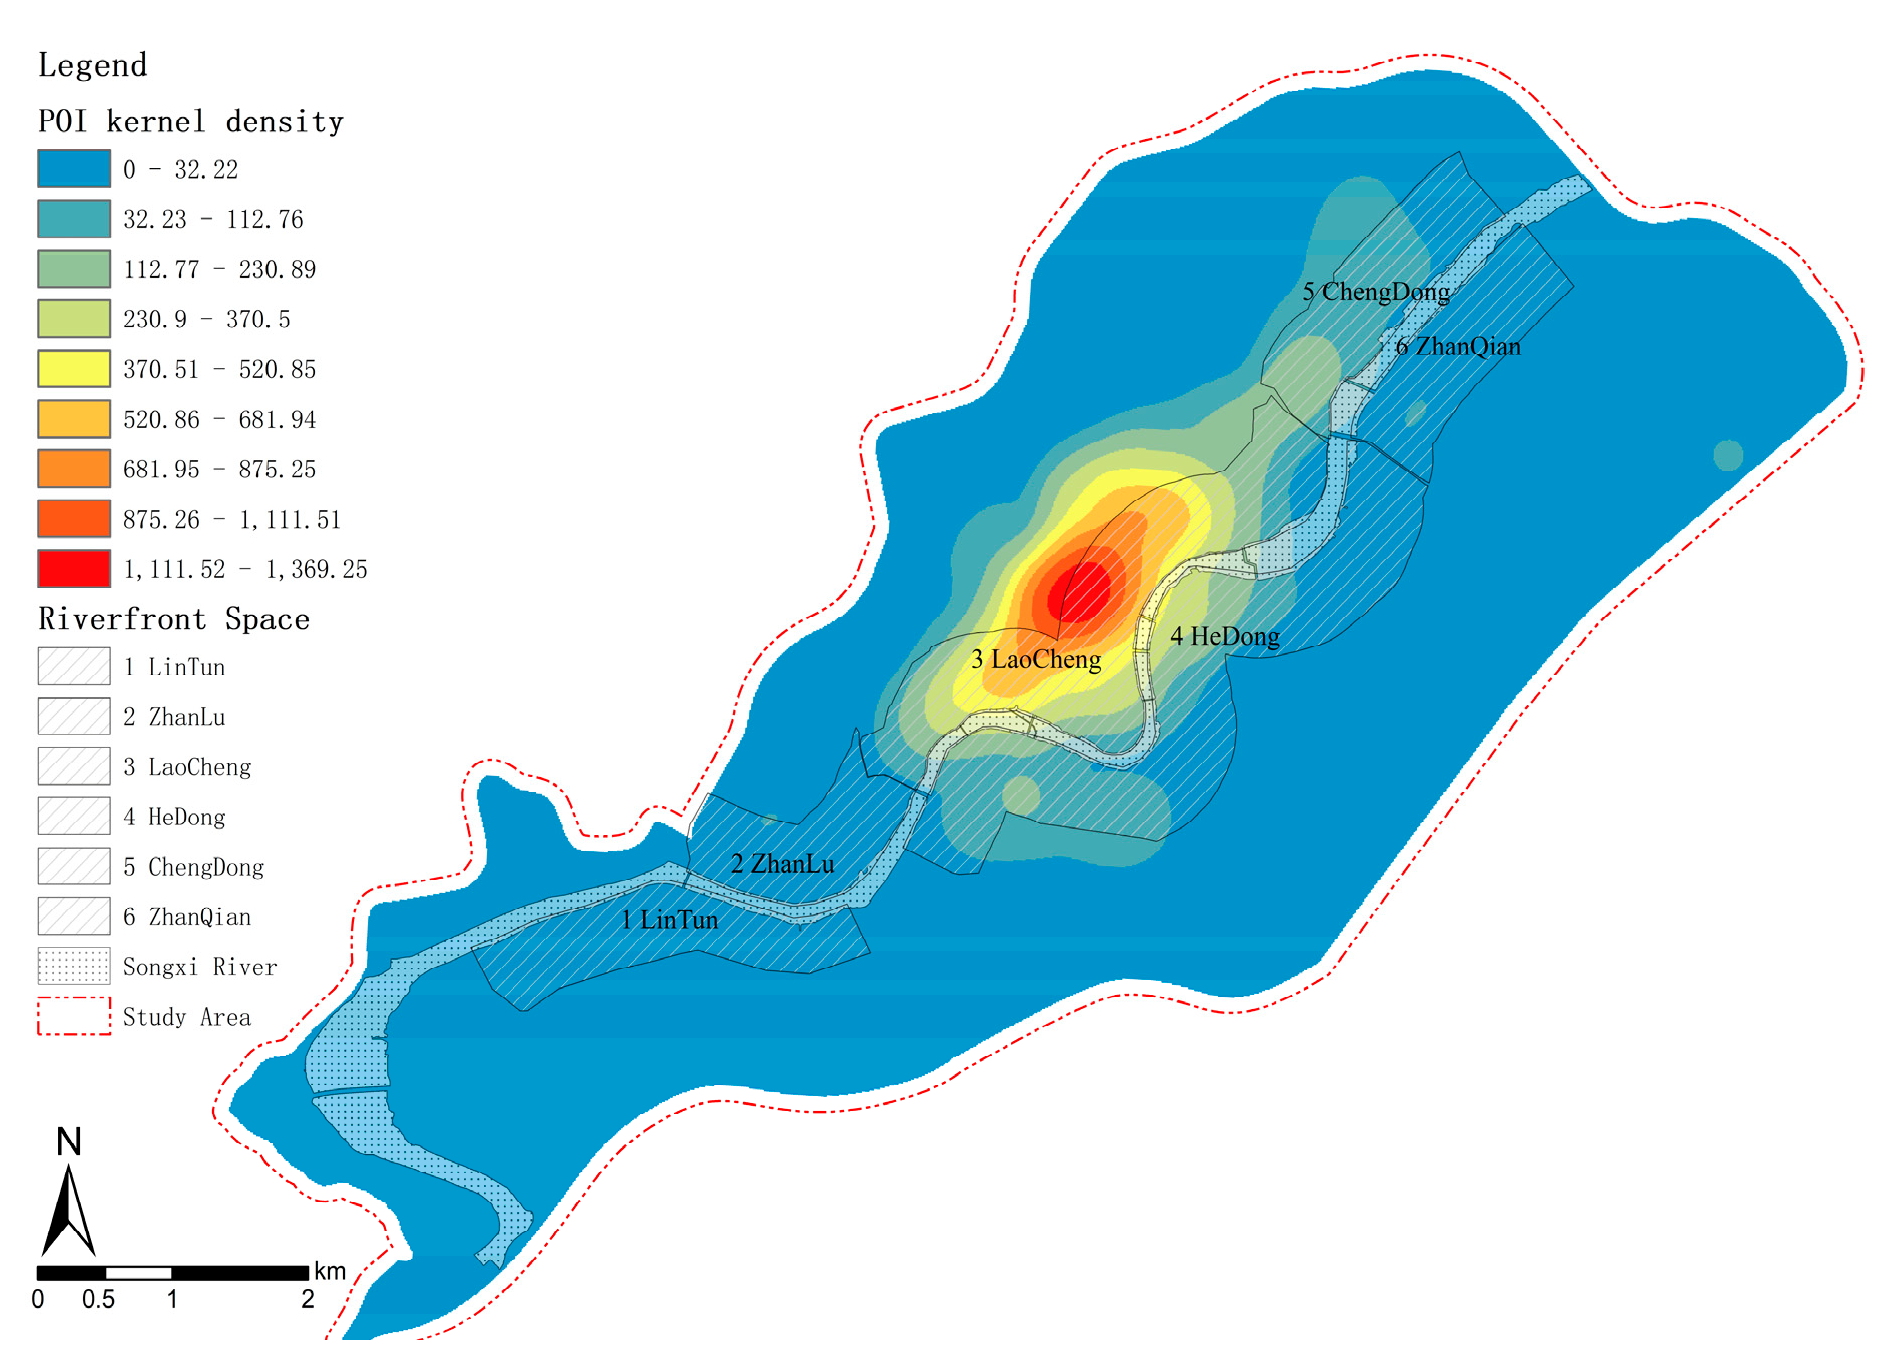
Sustainability 15 14929 g006
Figure 7. Urban POI kernel density analysis map. Source: authors, using ArcGIS 10.2 and Amap API.
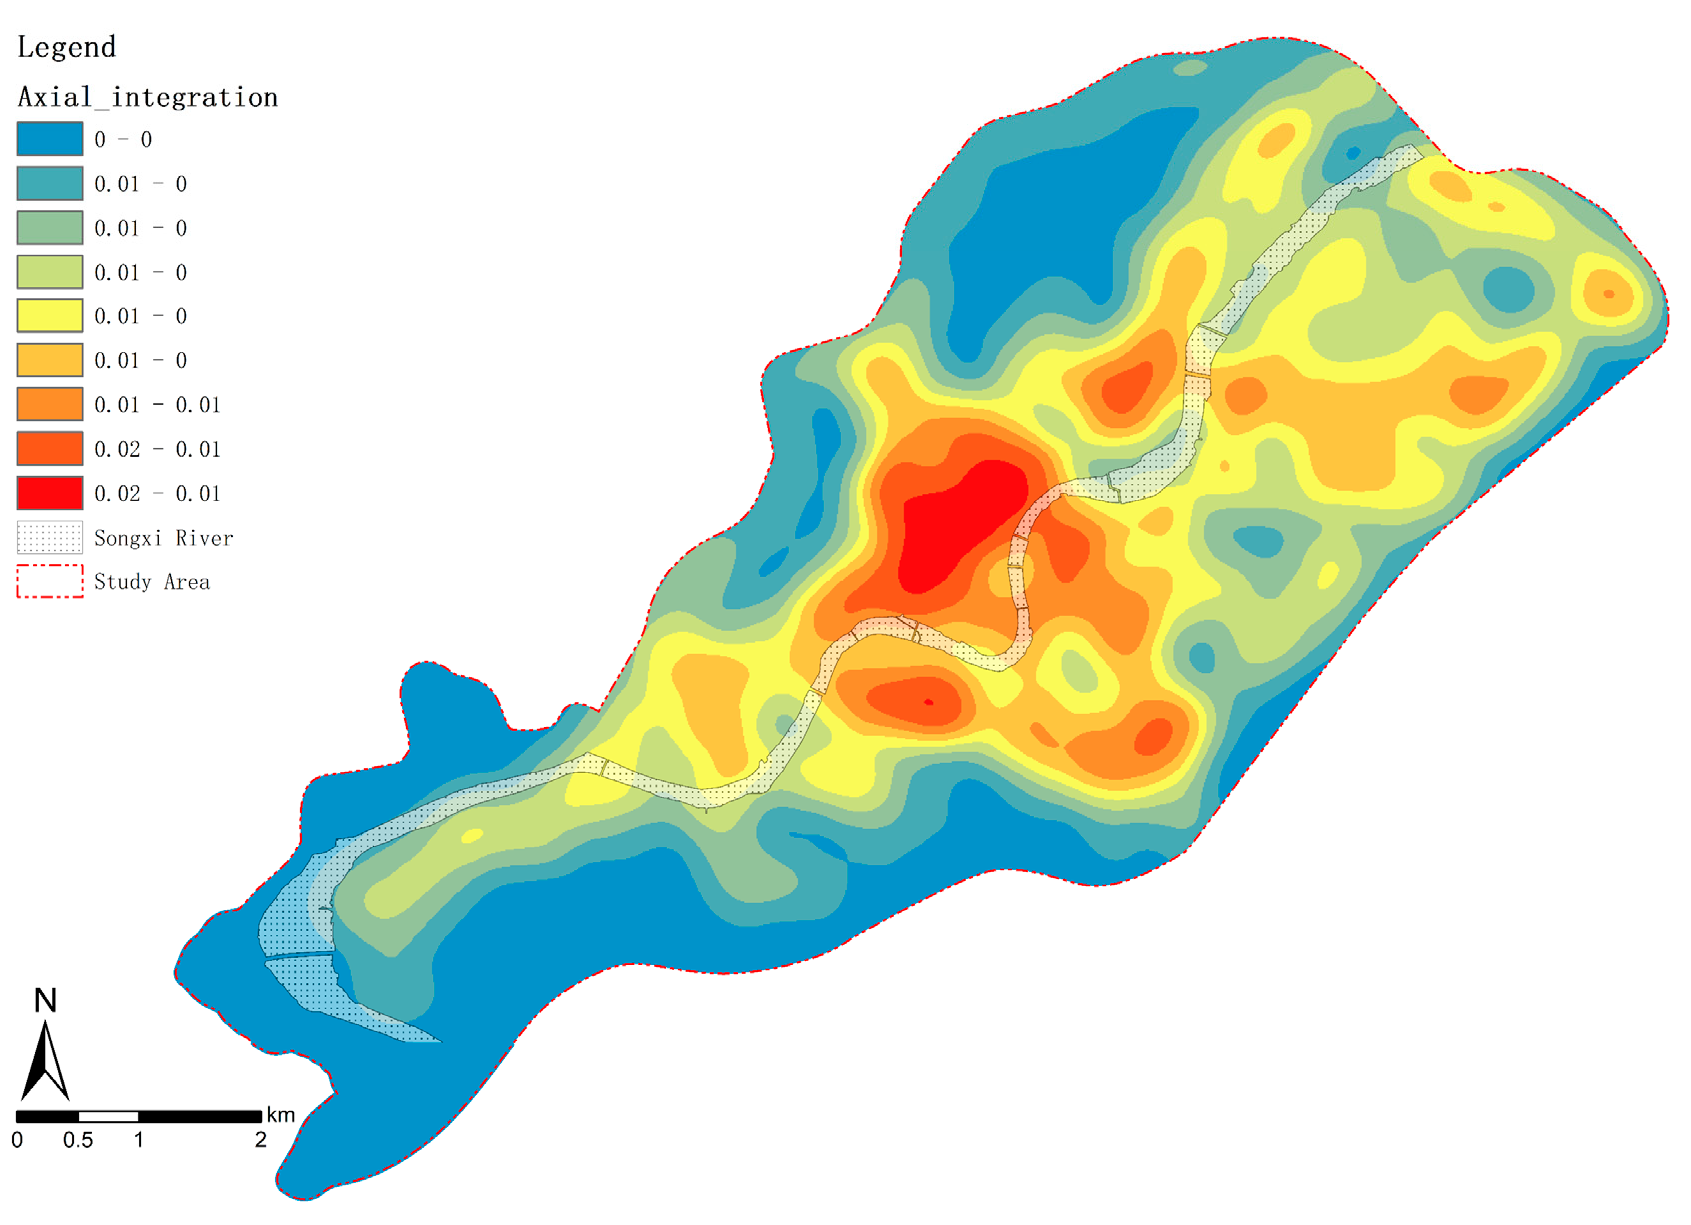
Sustainability 15 14929 g007
Figure 8. Global integration kernel density analysis map. Source: authors, using ArcGIS 10.2 and DepthmapX v0.8.0.
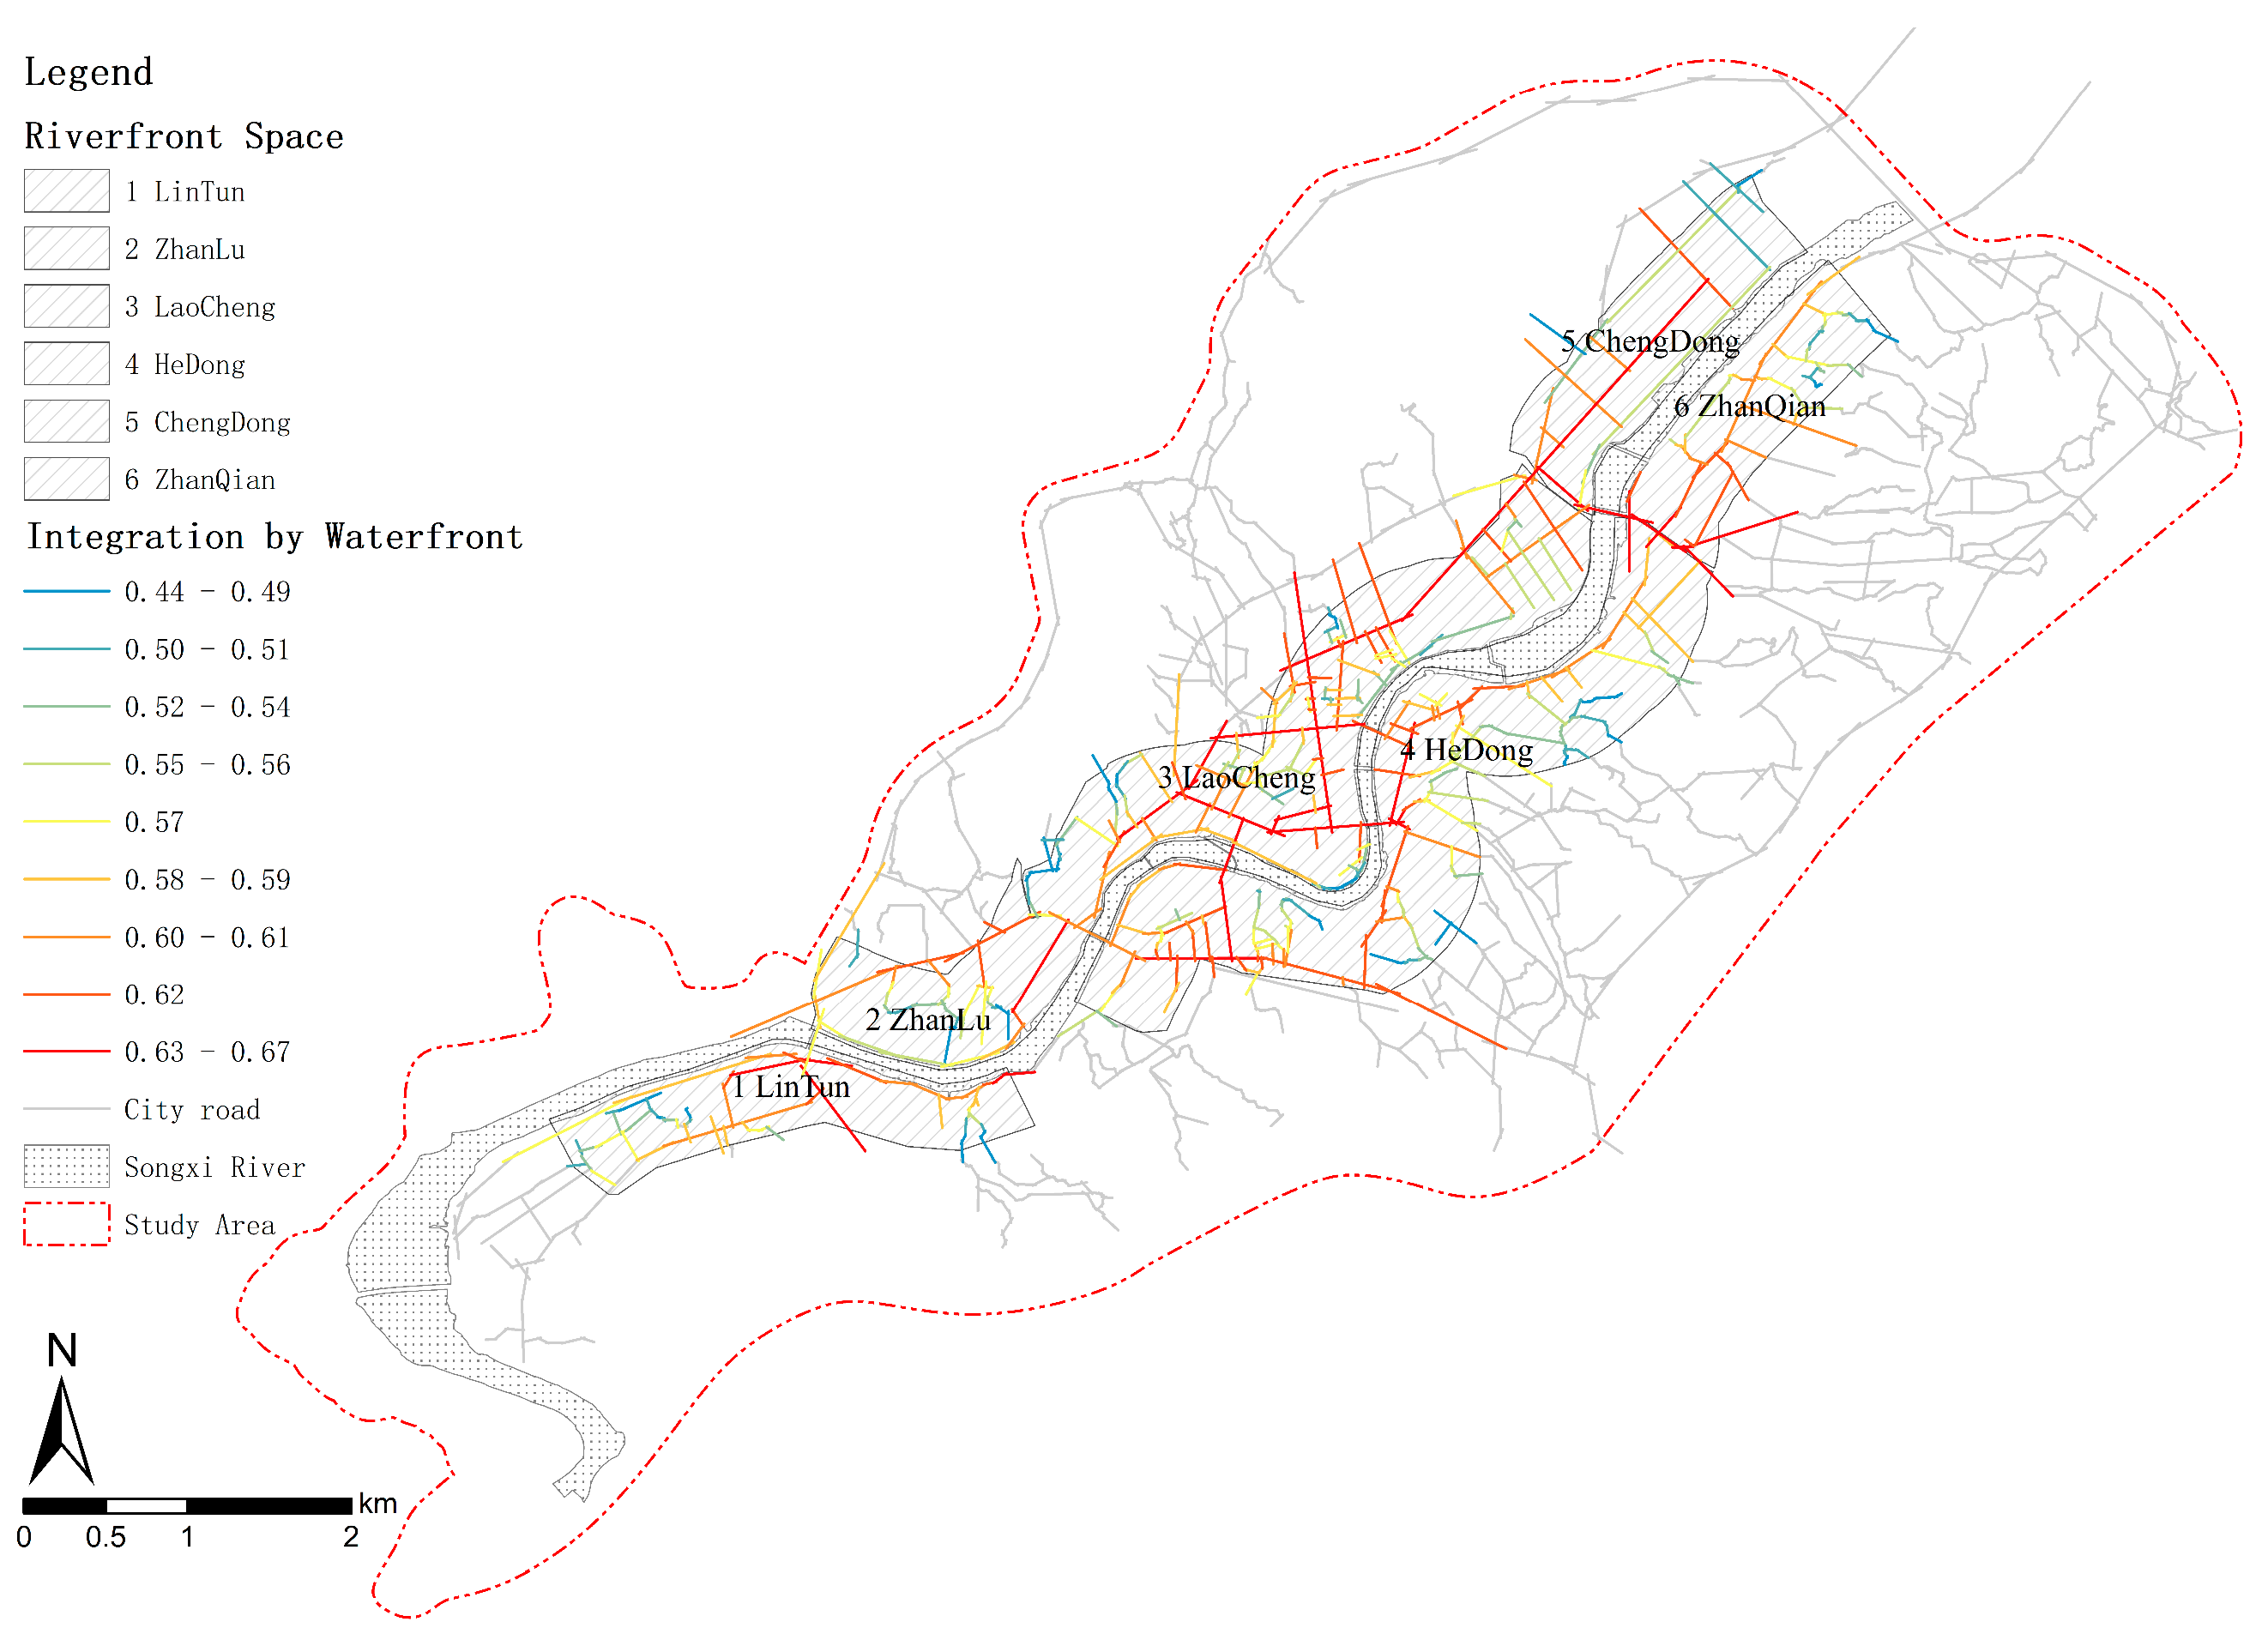
Sustainability 15 14929 g008
Figure 9. Urban integration value kernel density and waterfront overlay map. Source: authors, using ArcGIS 10.2 and DepthmapX v0.8.0.
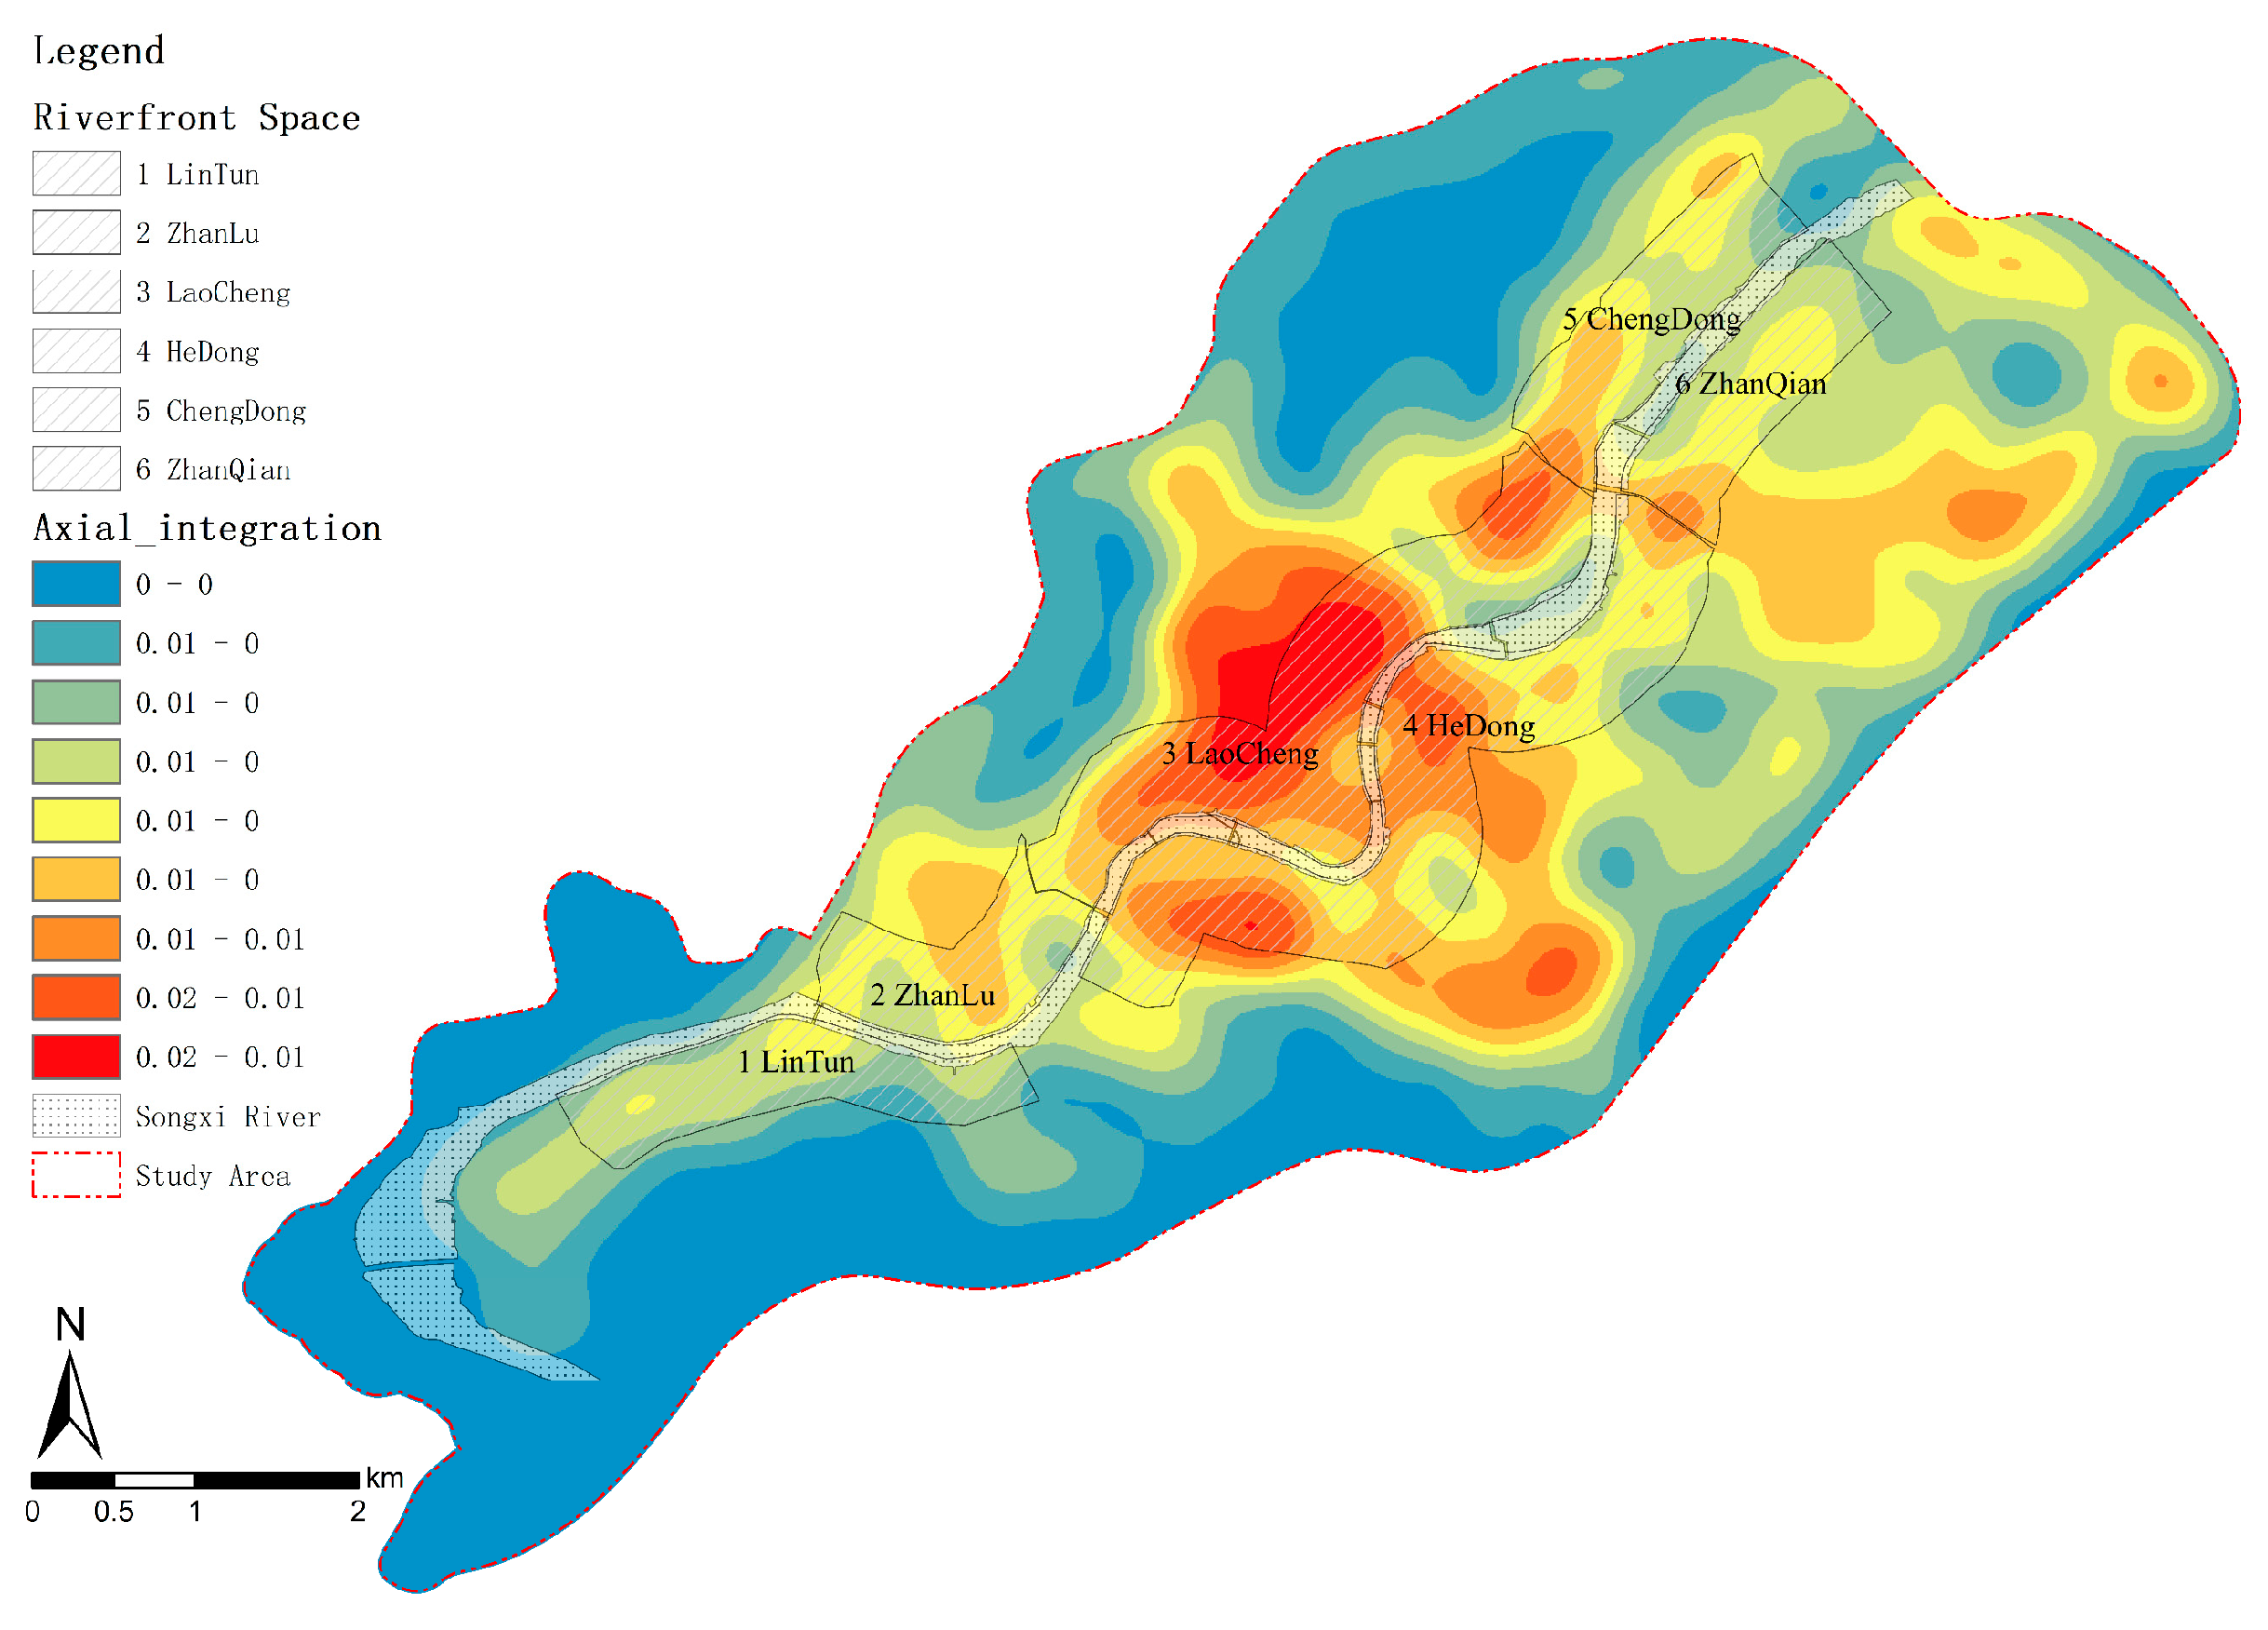
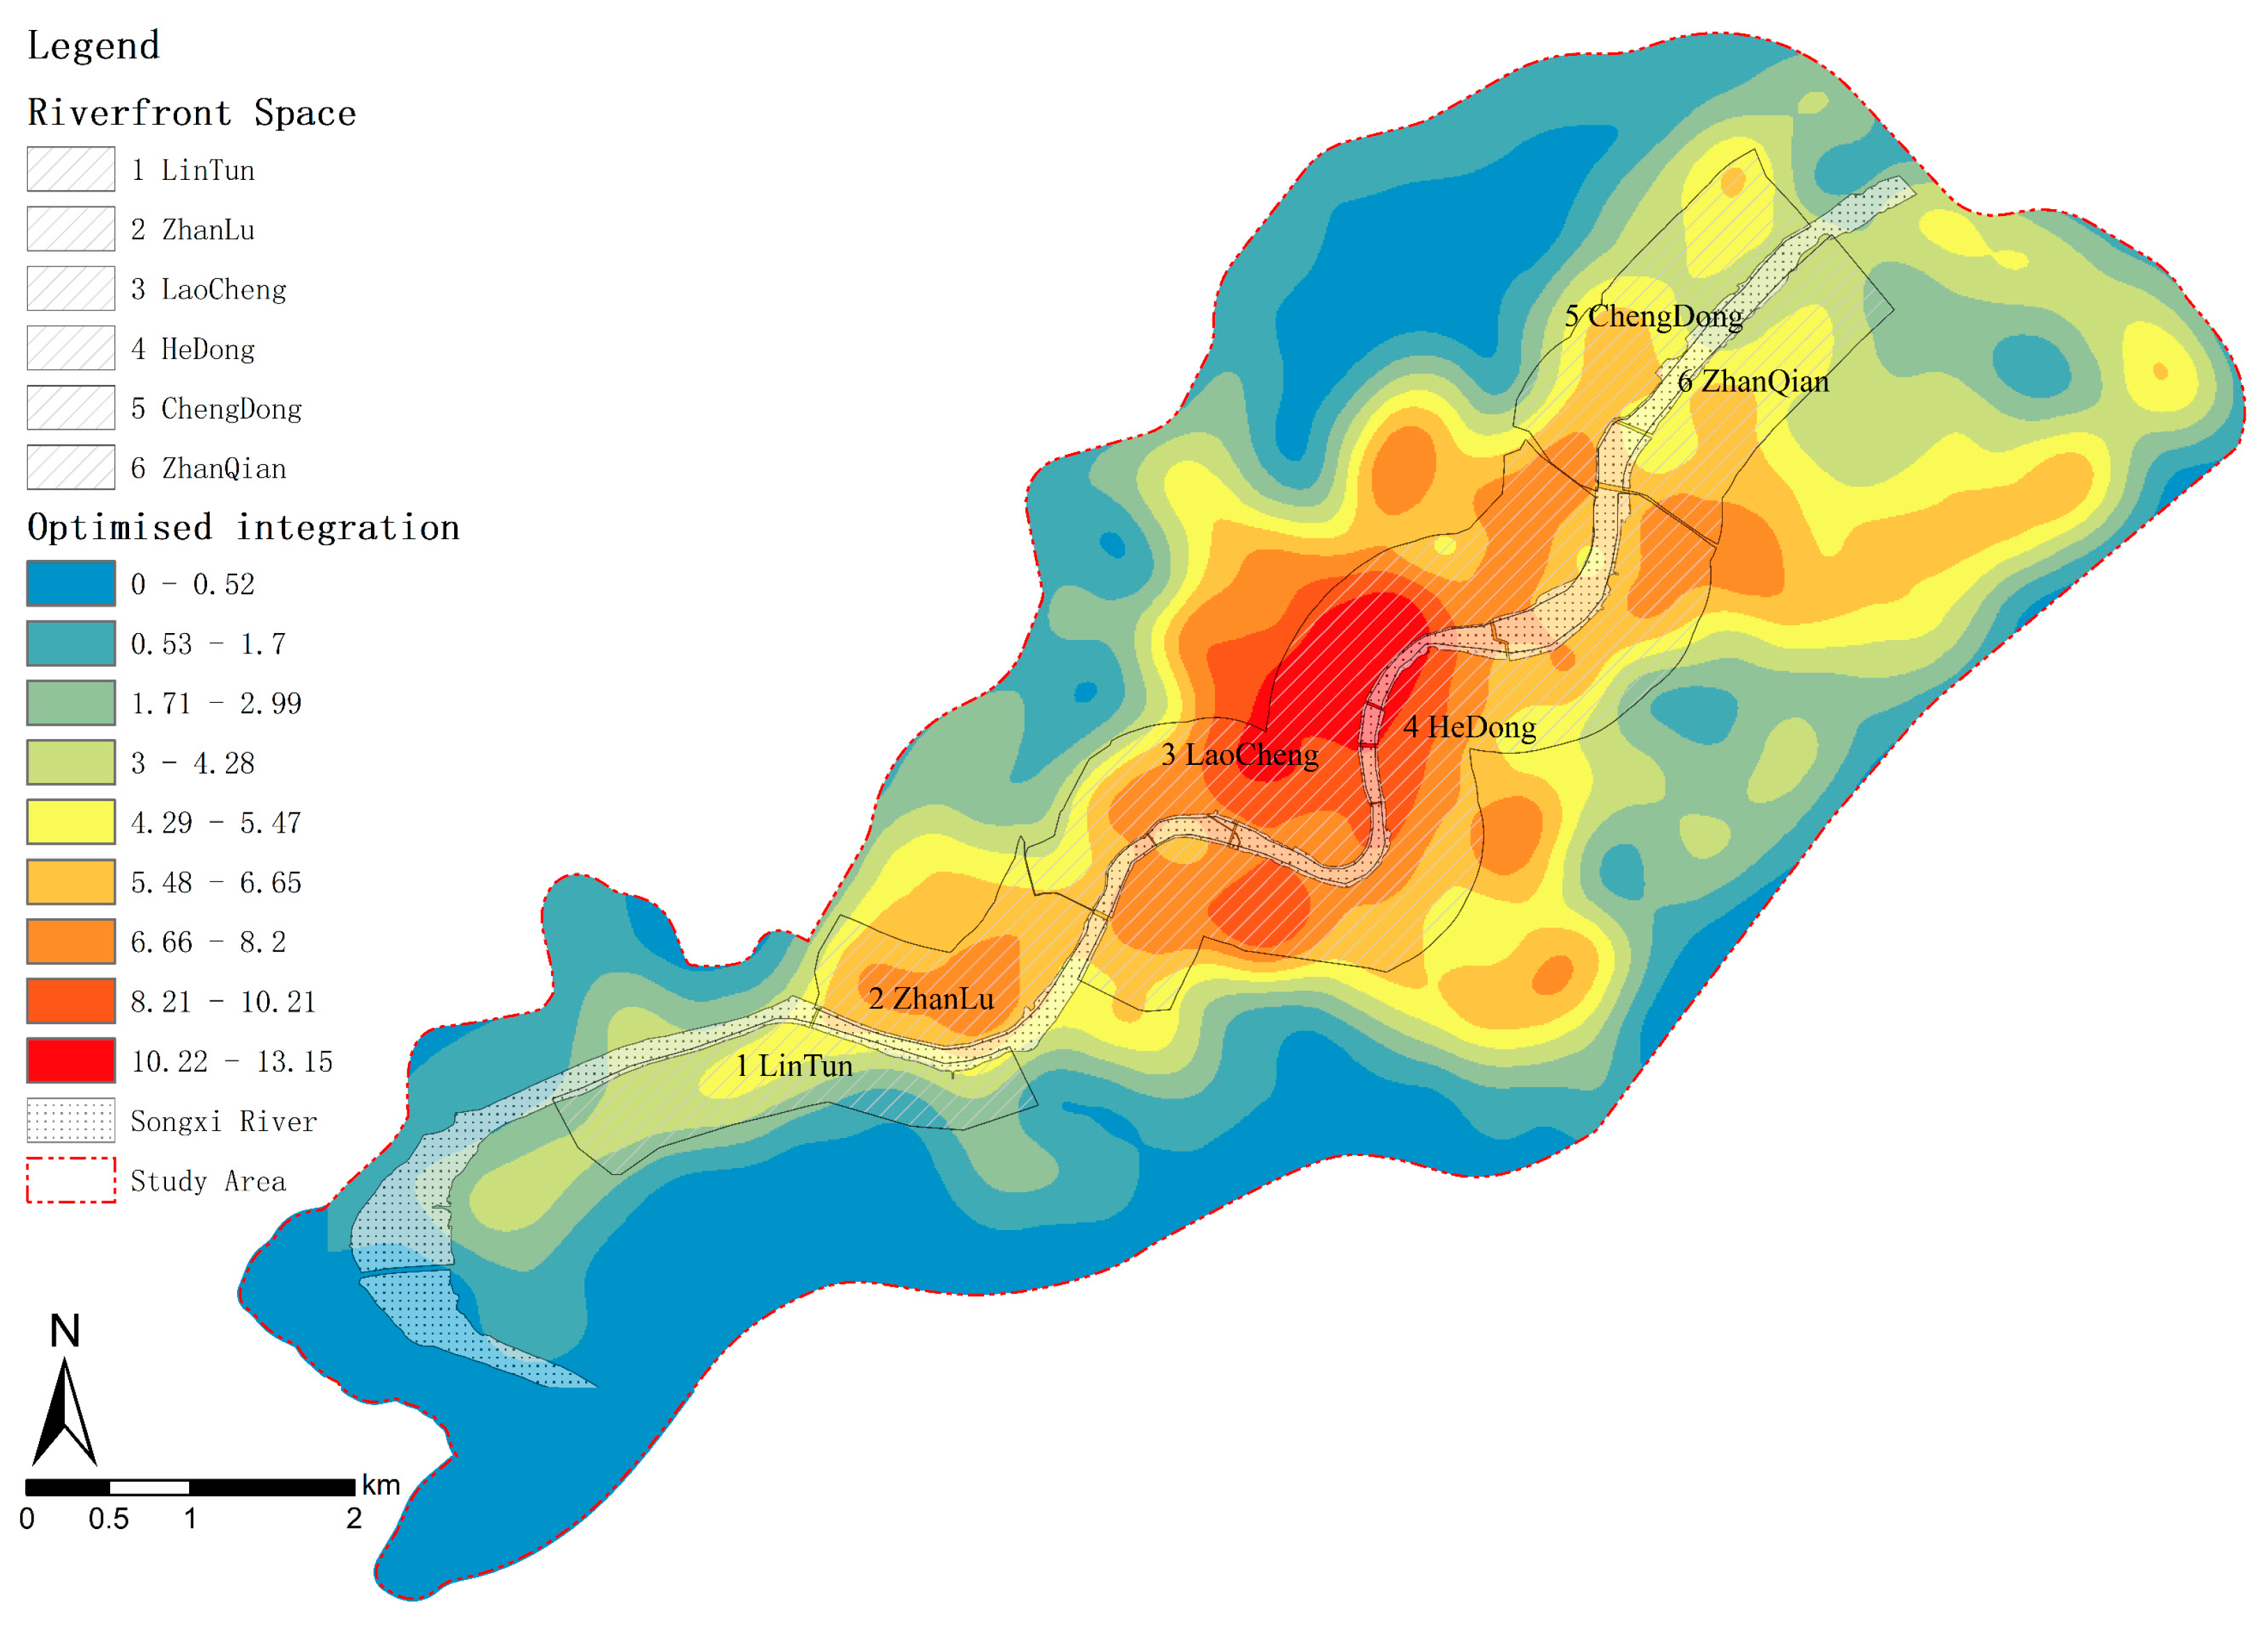
Sustainability 15 14929 g009
Figure 10. The integration value of various waterfront areas. Source: authors, using ArcGIS 10.2 and DepthmapX v0.8.0.
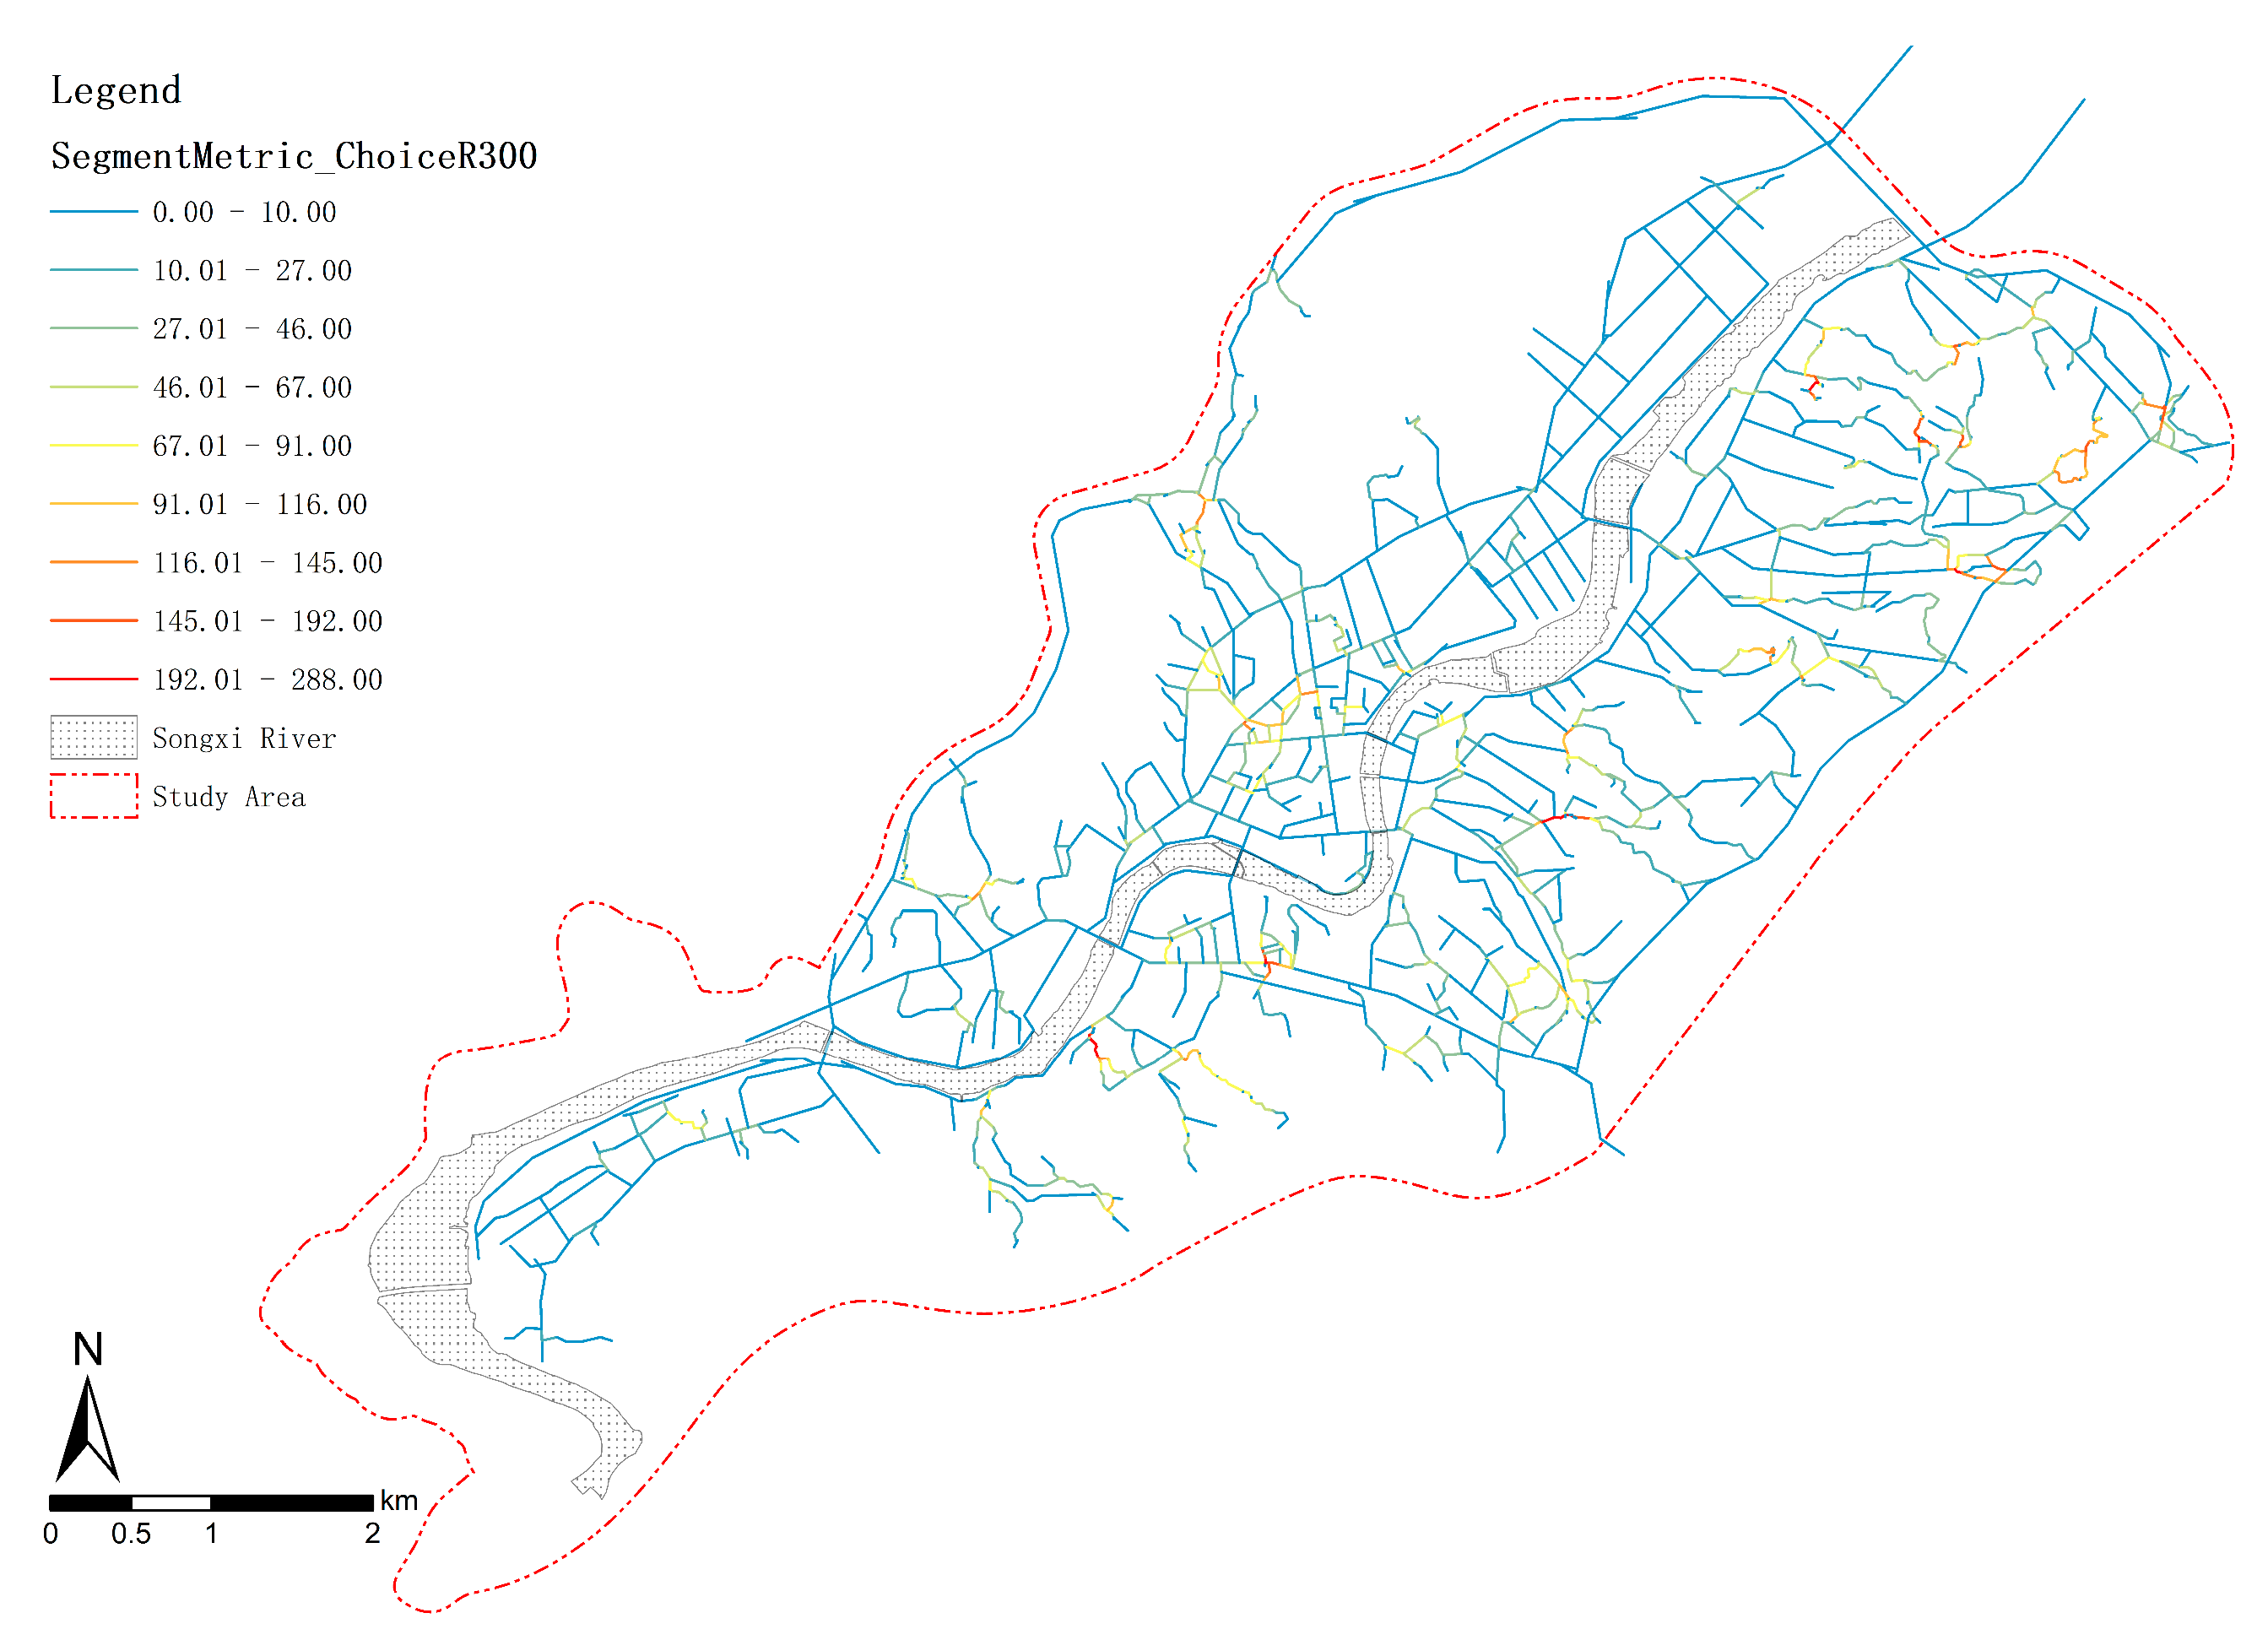
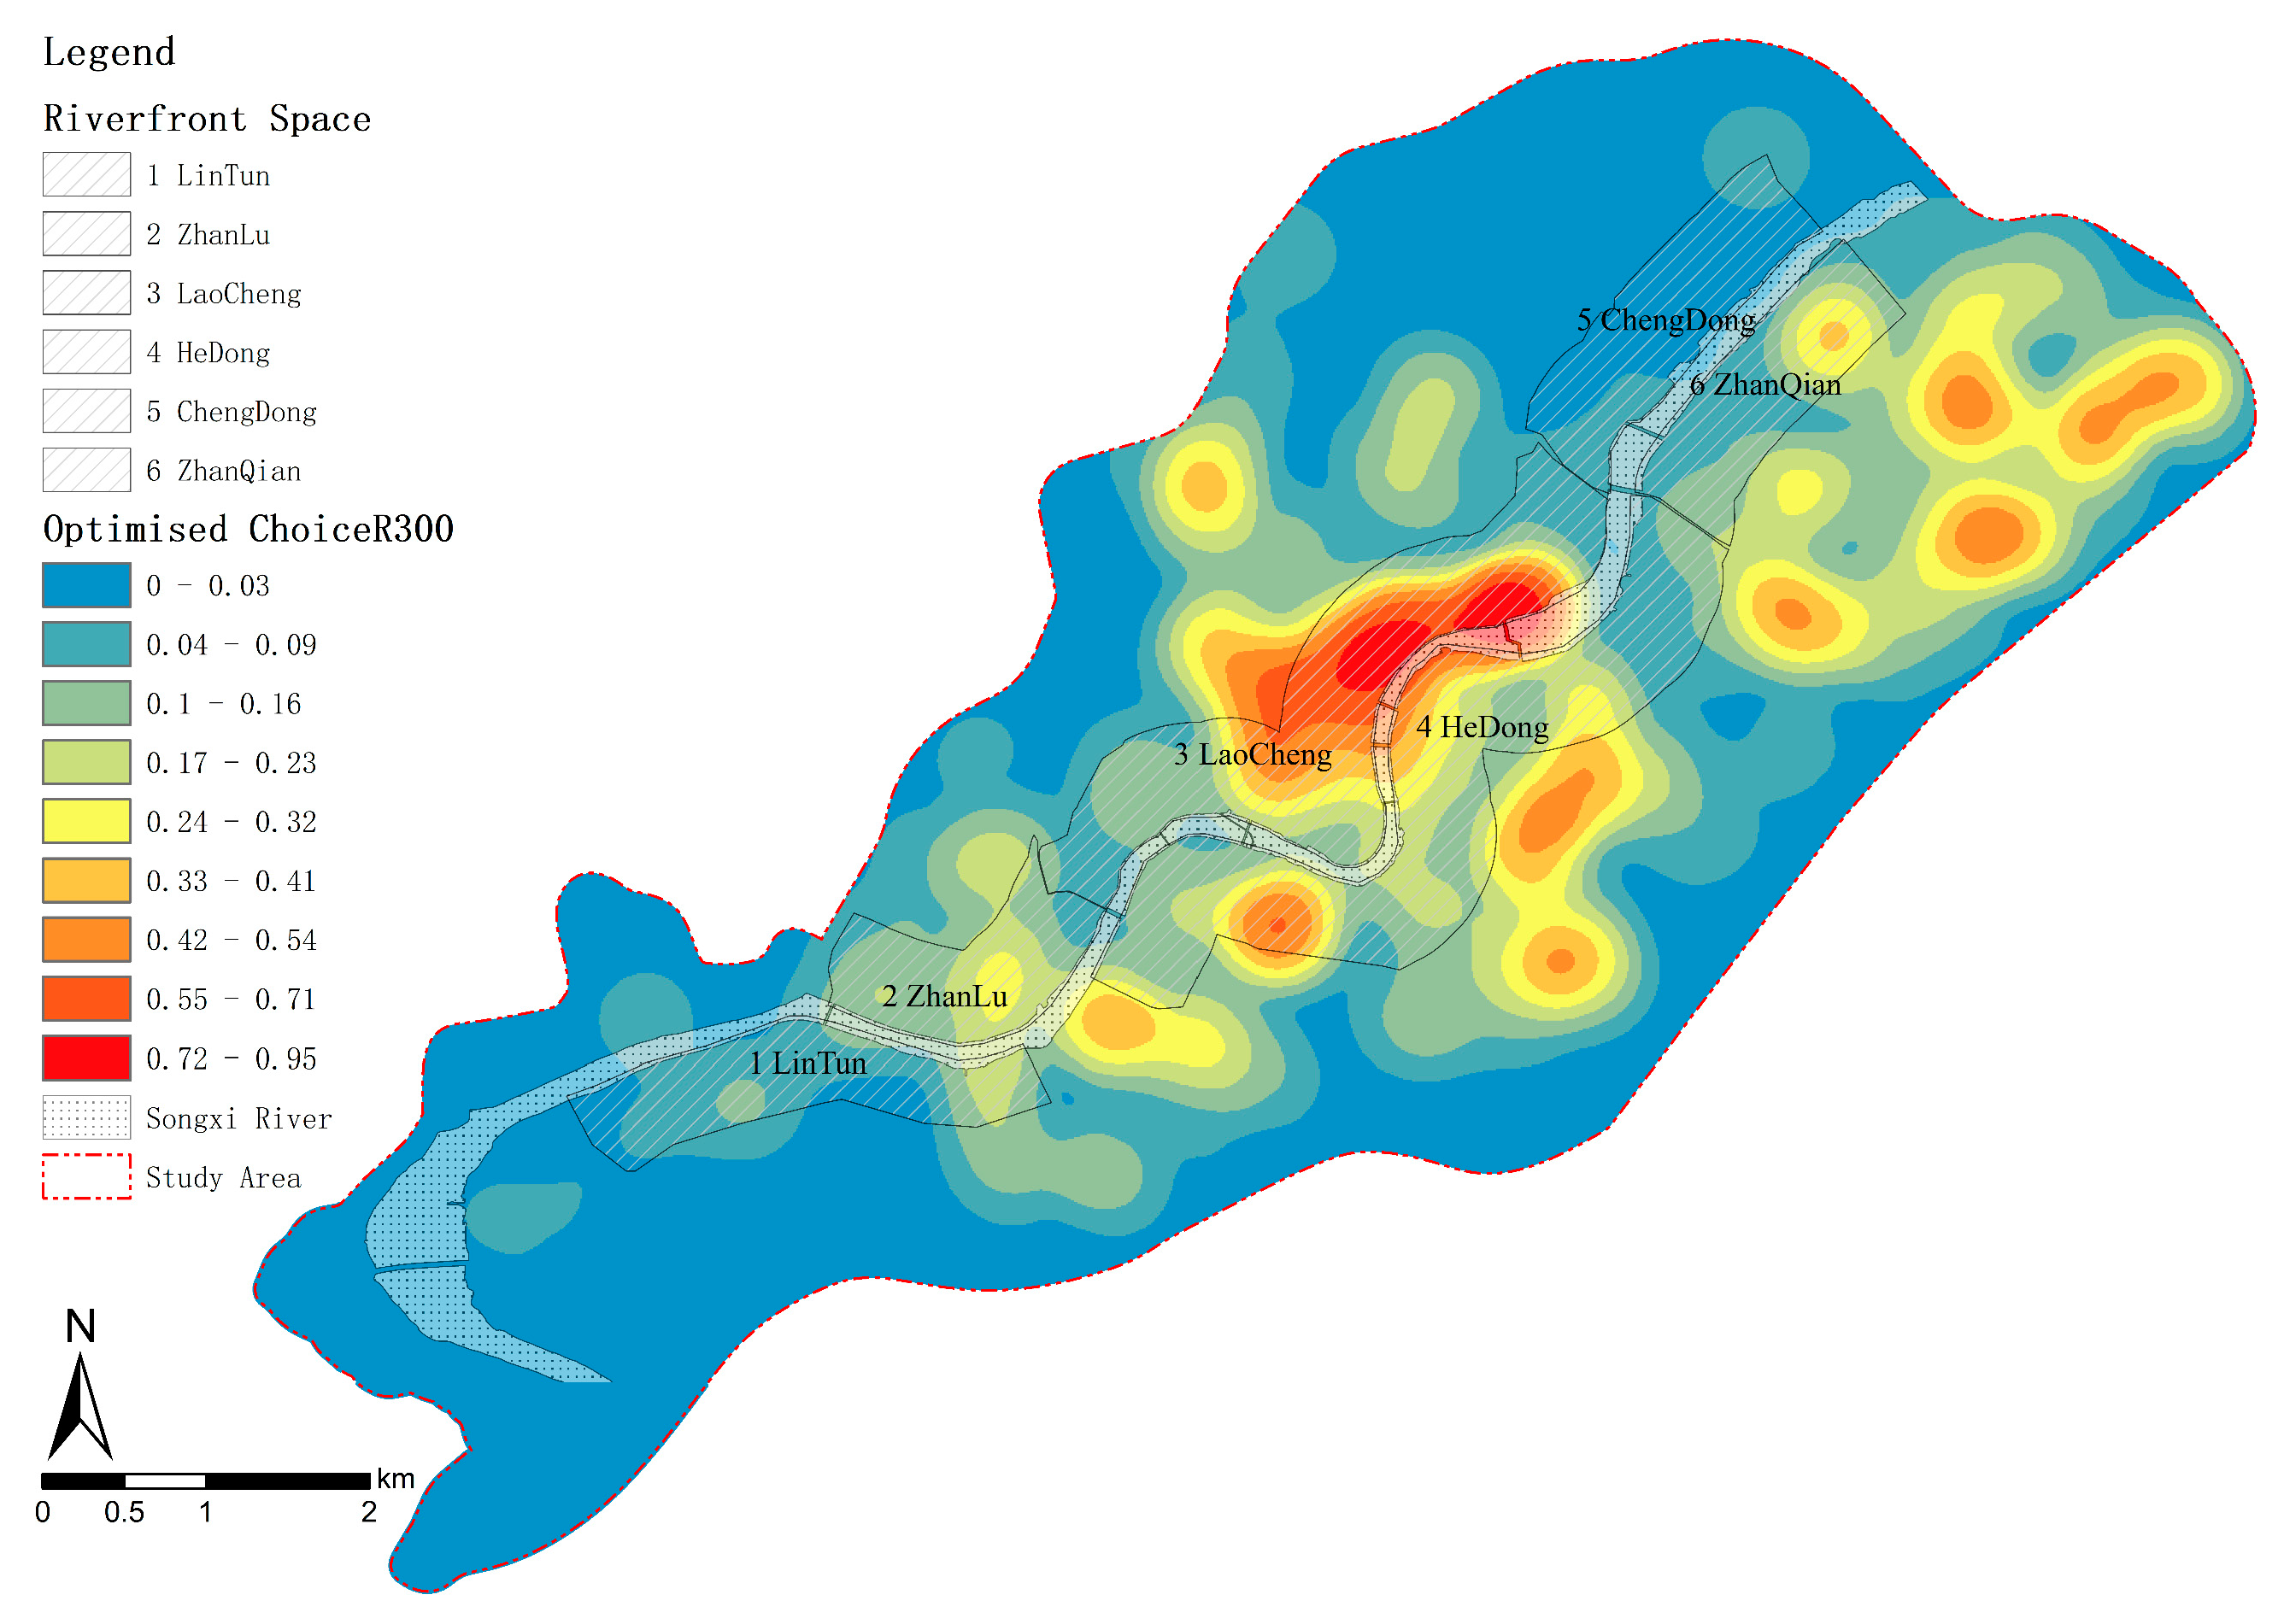
Sustainability 15 14929 g010
Figure 11. T1024 Choice R300 based on segment map. Source: authors, using ArcGIS 10.2 and DepthmapX v0.8.0.
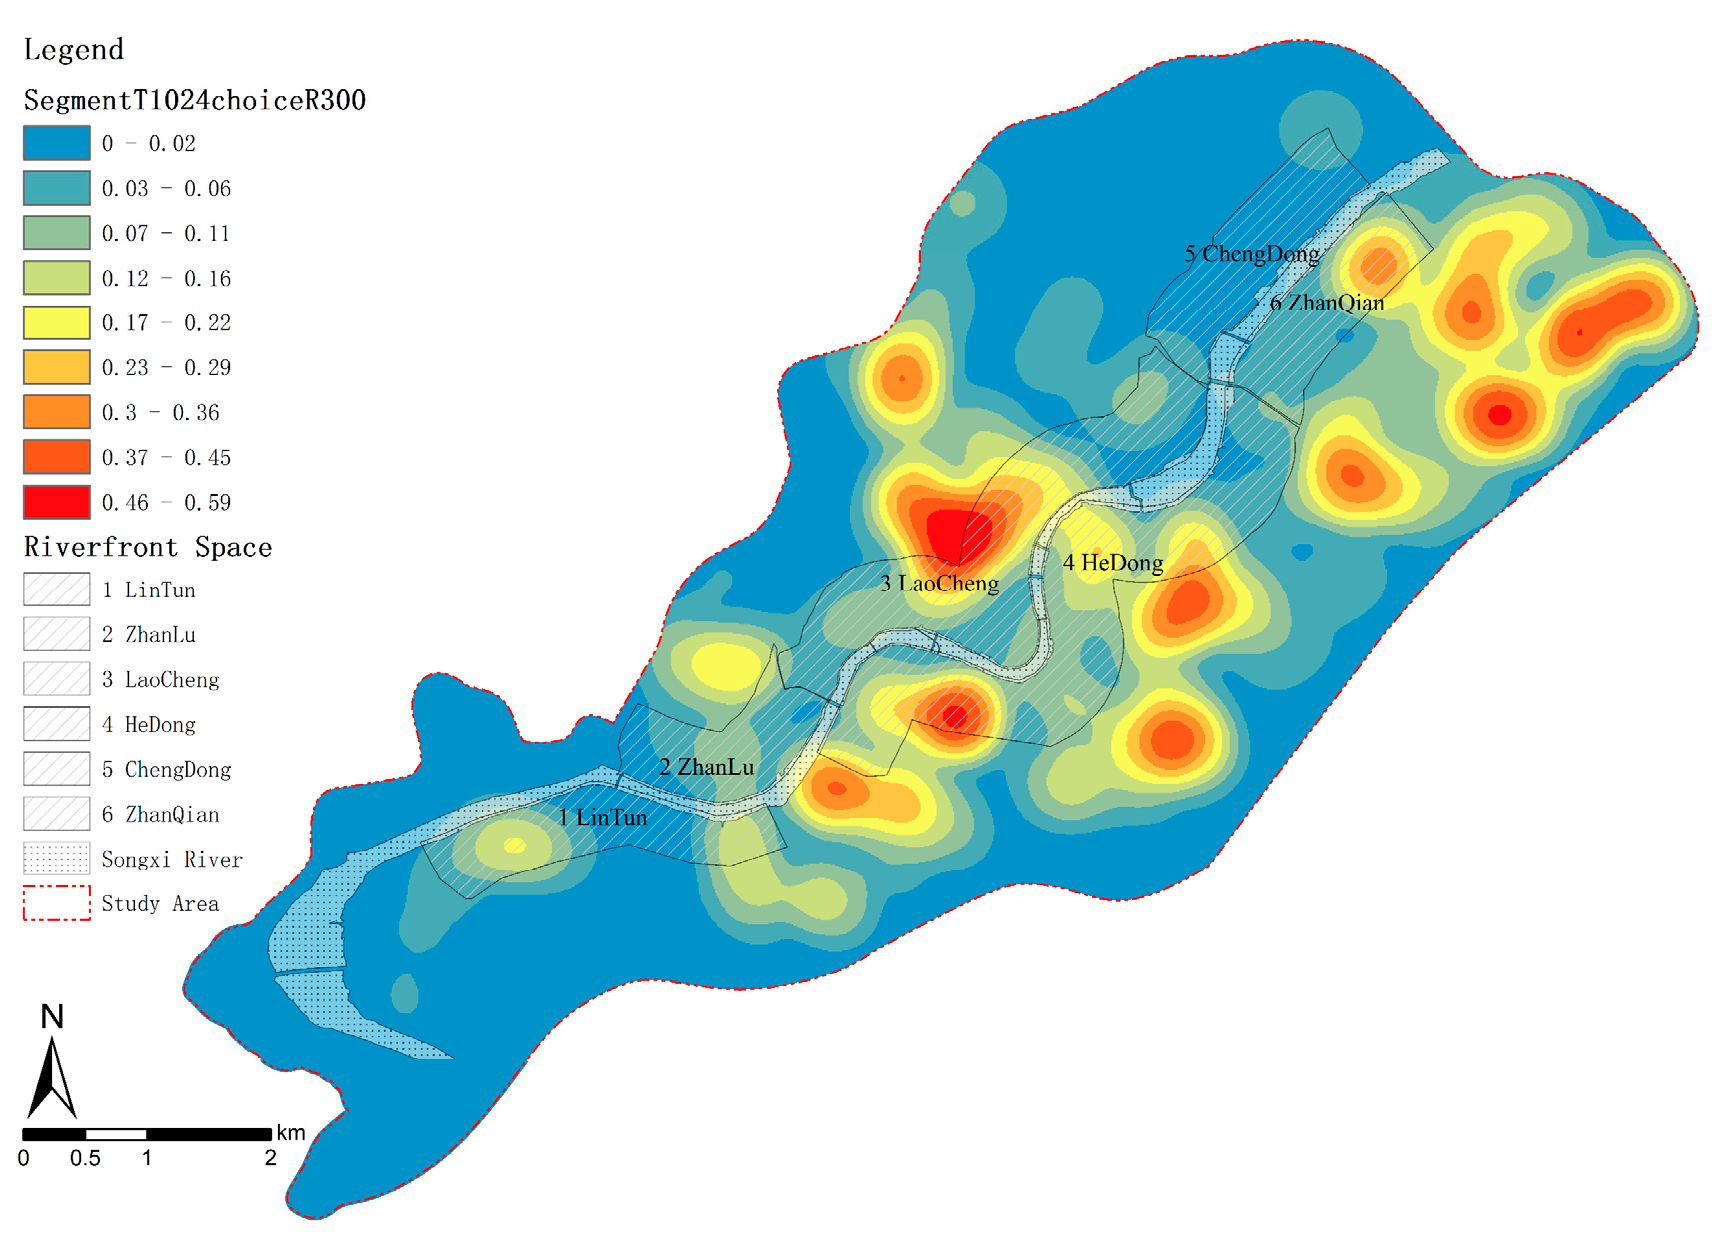
Sustainability 15 14929 g011
Figure 12. Kernel density analysis map of segment map T1024 Choice R300. Source: authors, using ArcGIS 10.2 and DepthmapX v0.8.0.
Sustainability 15 14929 g012
Figure 13. T1024 choice R3000 based on segment map. Source: authors, using ArcGIS 10.2 and DepthmapX v0.8.0.
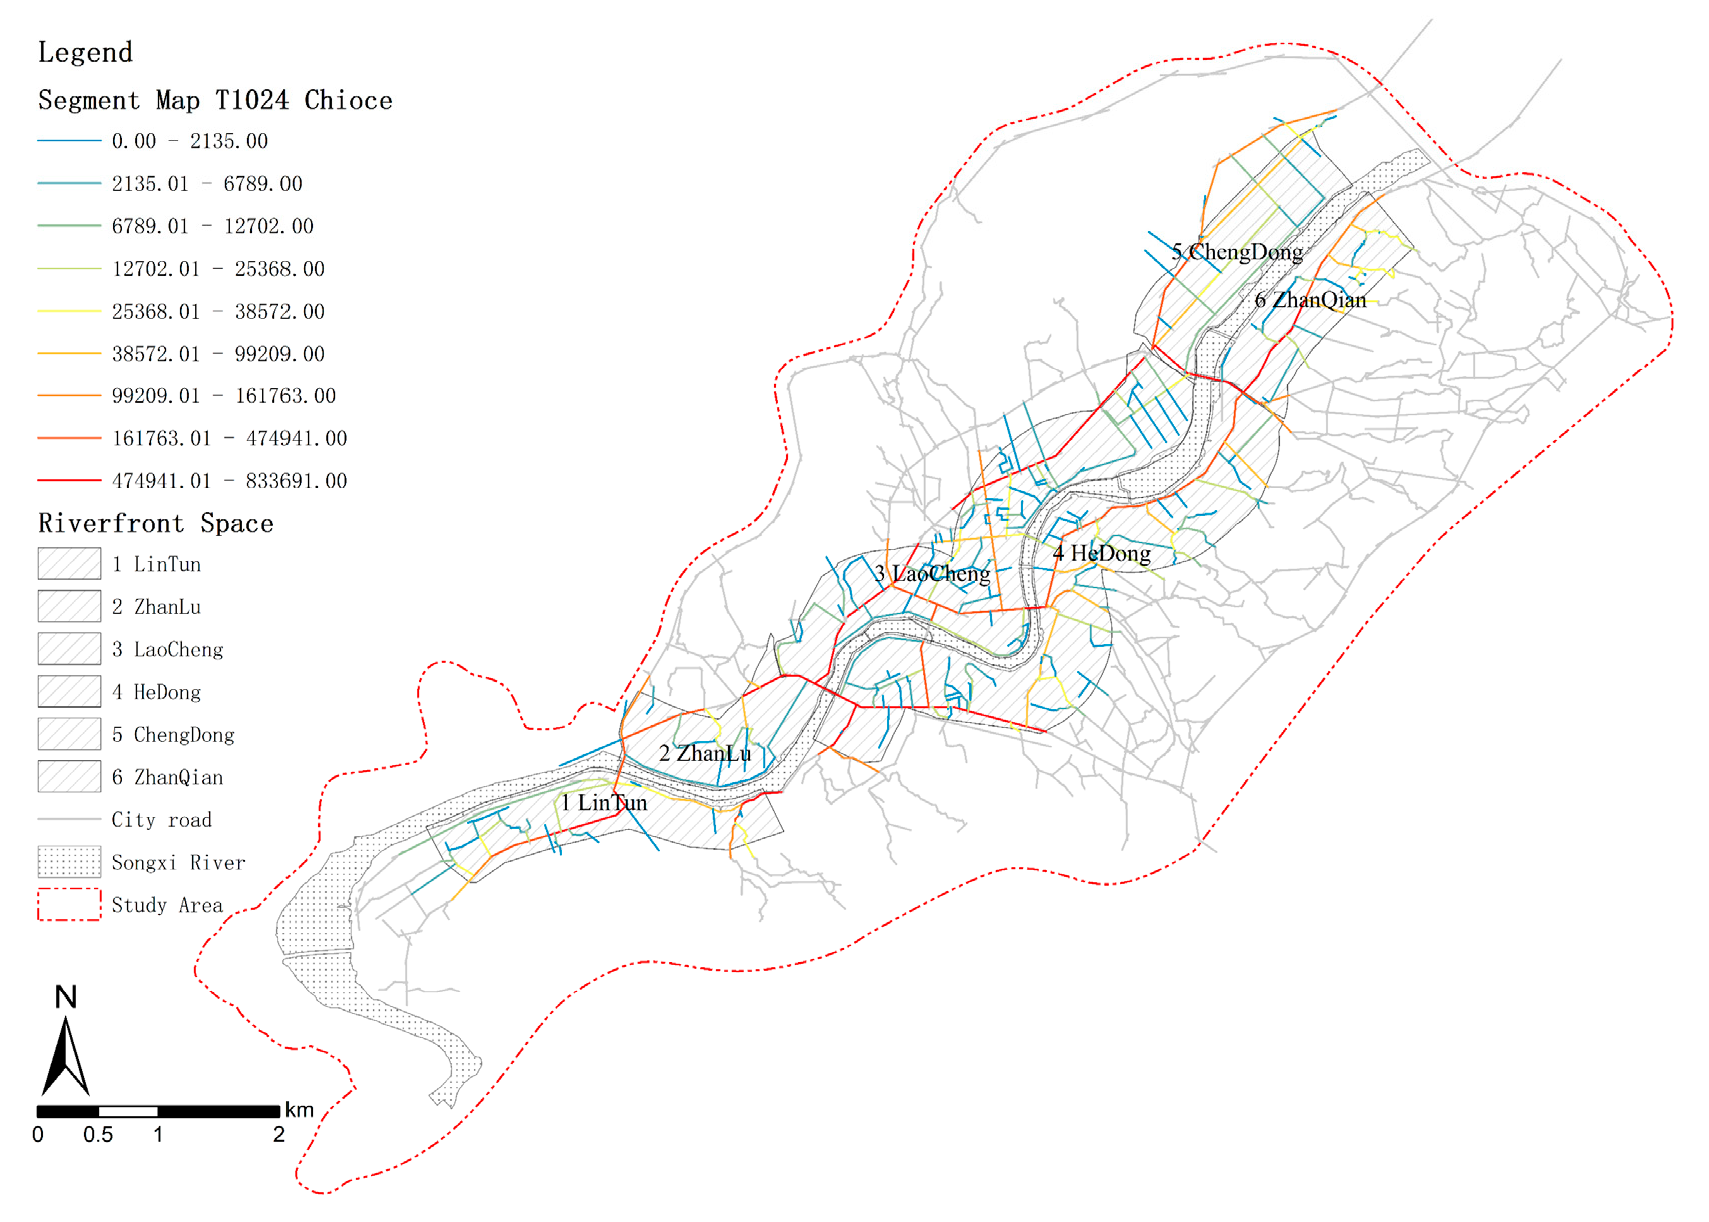
Sustainability 15 14929 g013
Figure 14. Segment map-based T1024 choice for riverfront district. Source: authors, using ArcGIS 10.2 and DepthmapX v0.8.0.
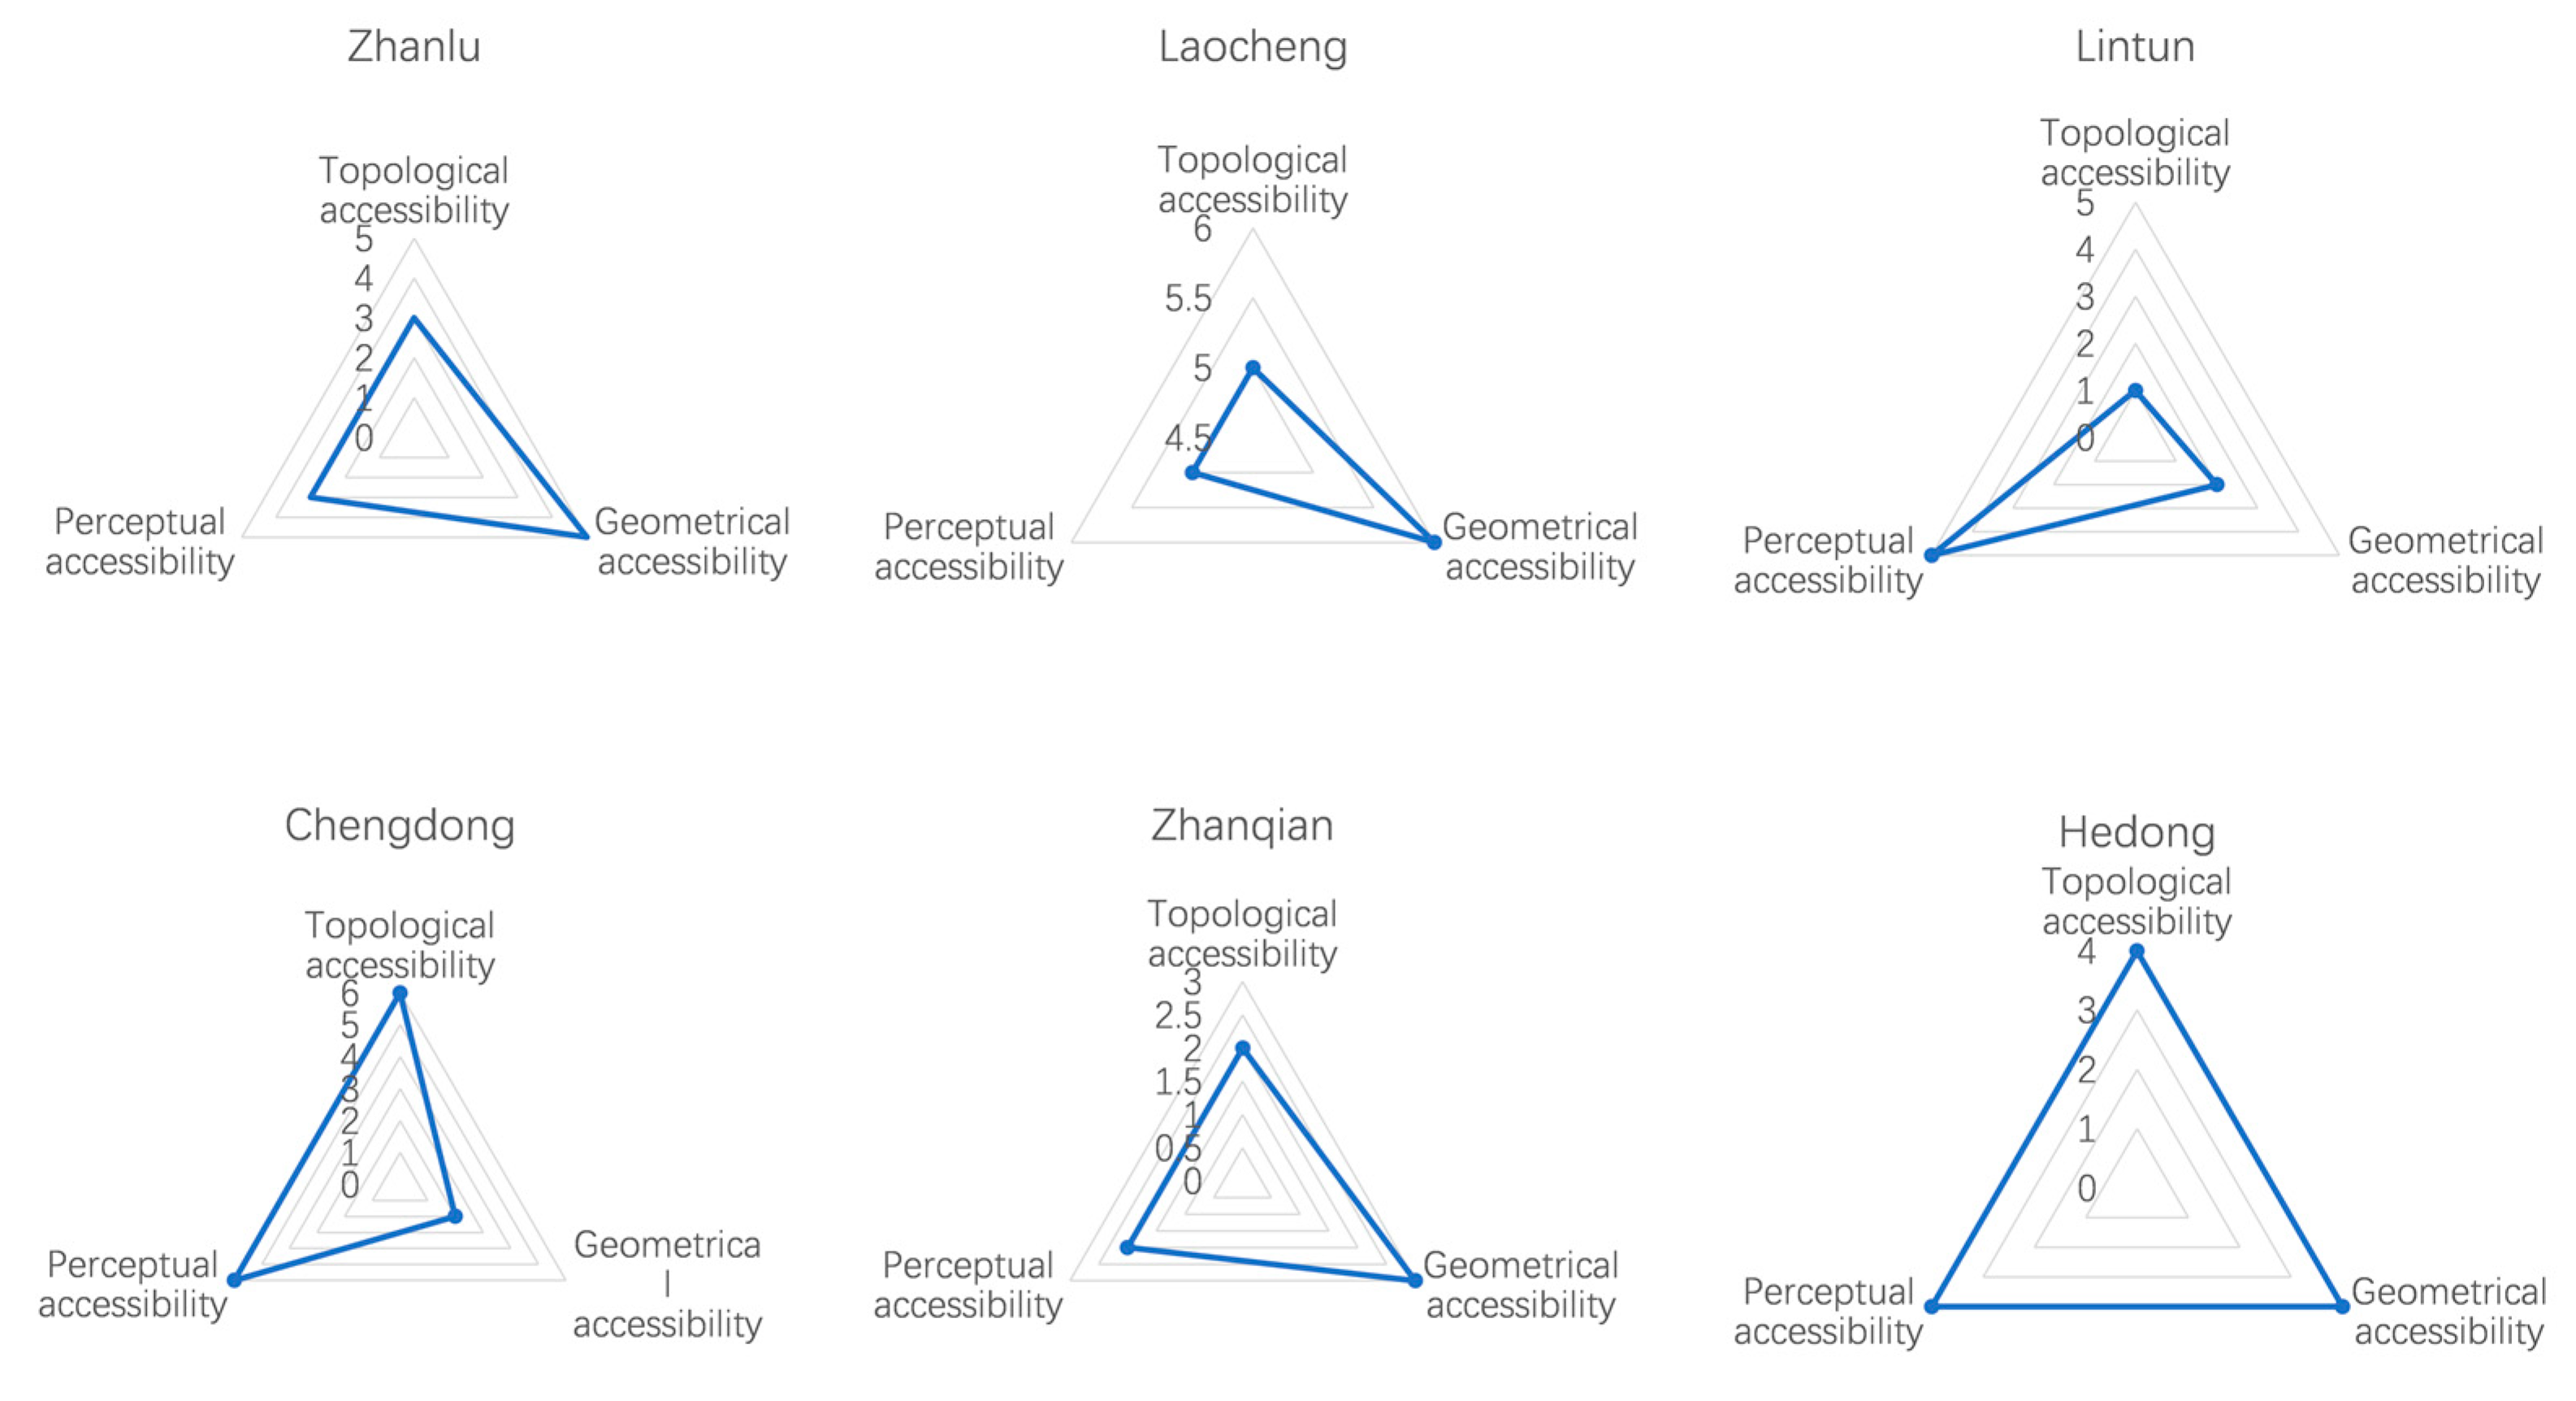
Sustainability 15 14929 g014
Figure 15. Comparison of accessibility indices for each riverfront zoning district in the case study. Source: authors, using Excel and ArcGIS 10.2.
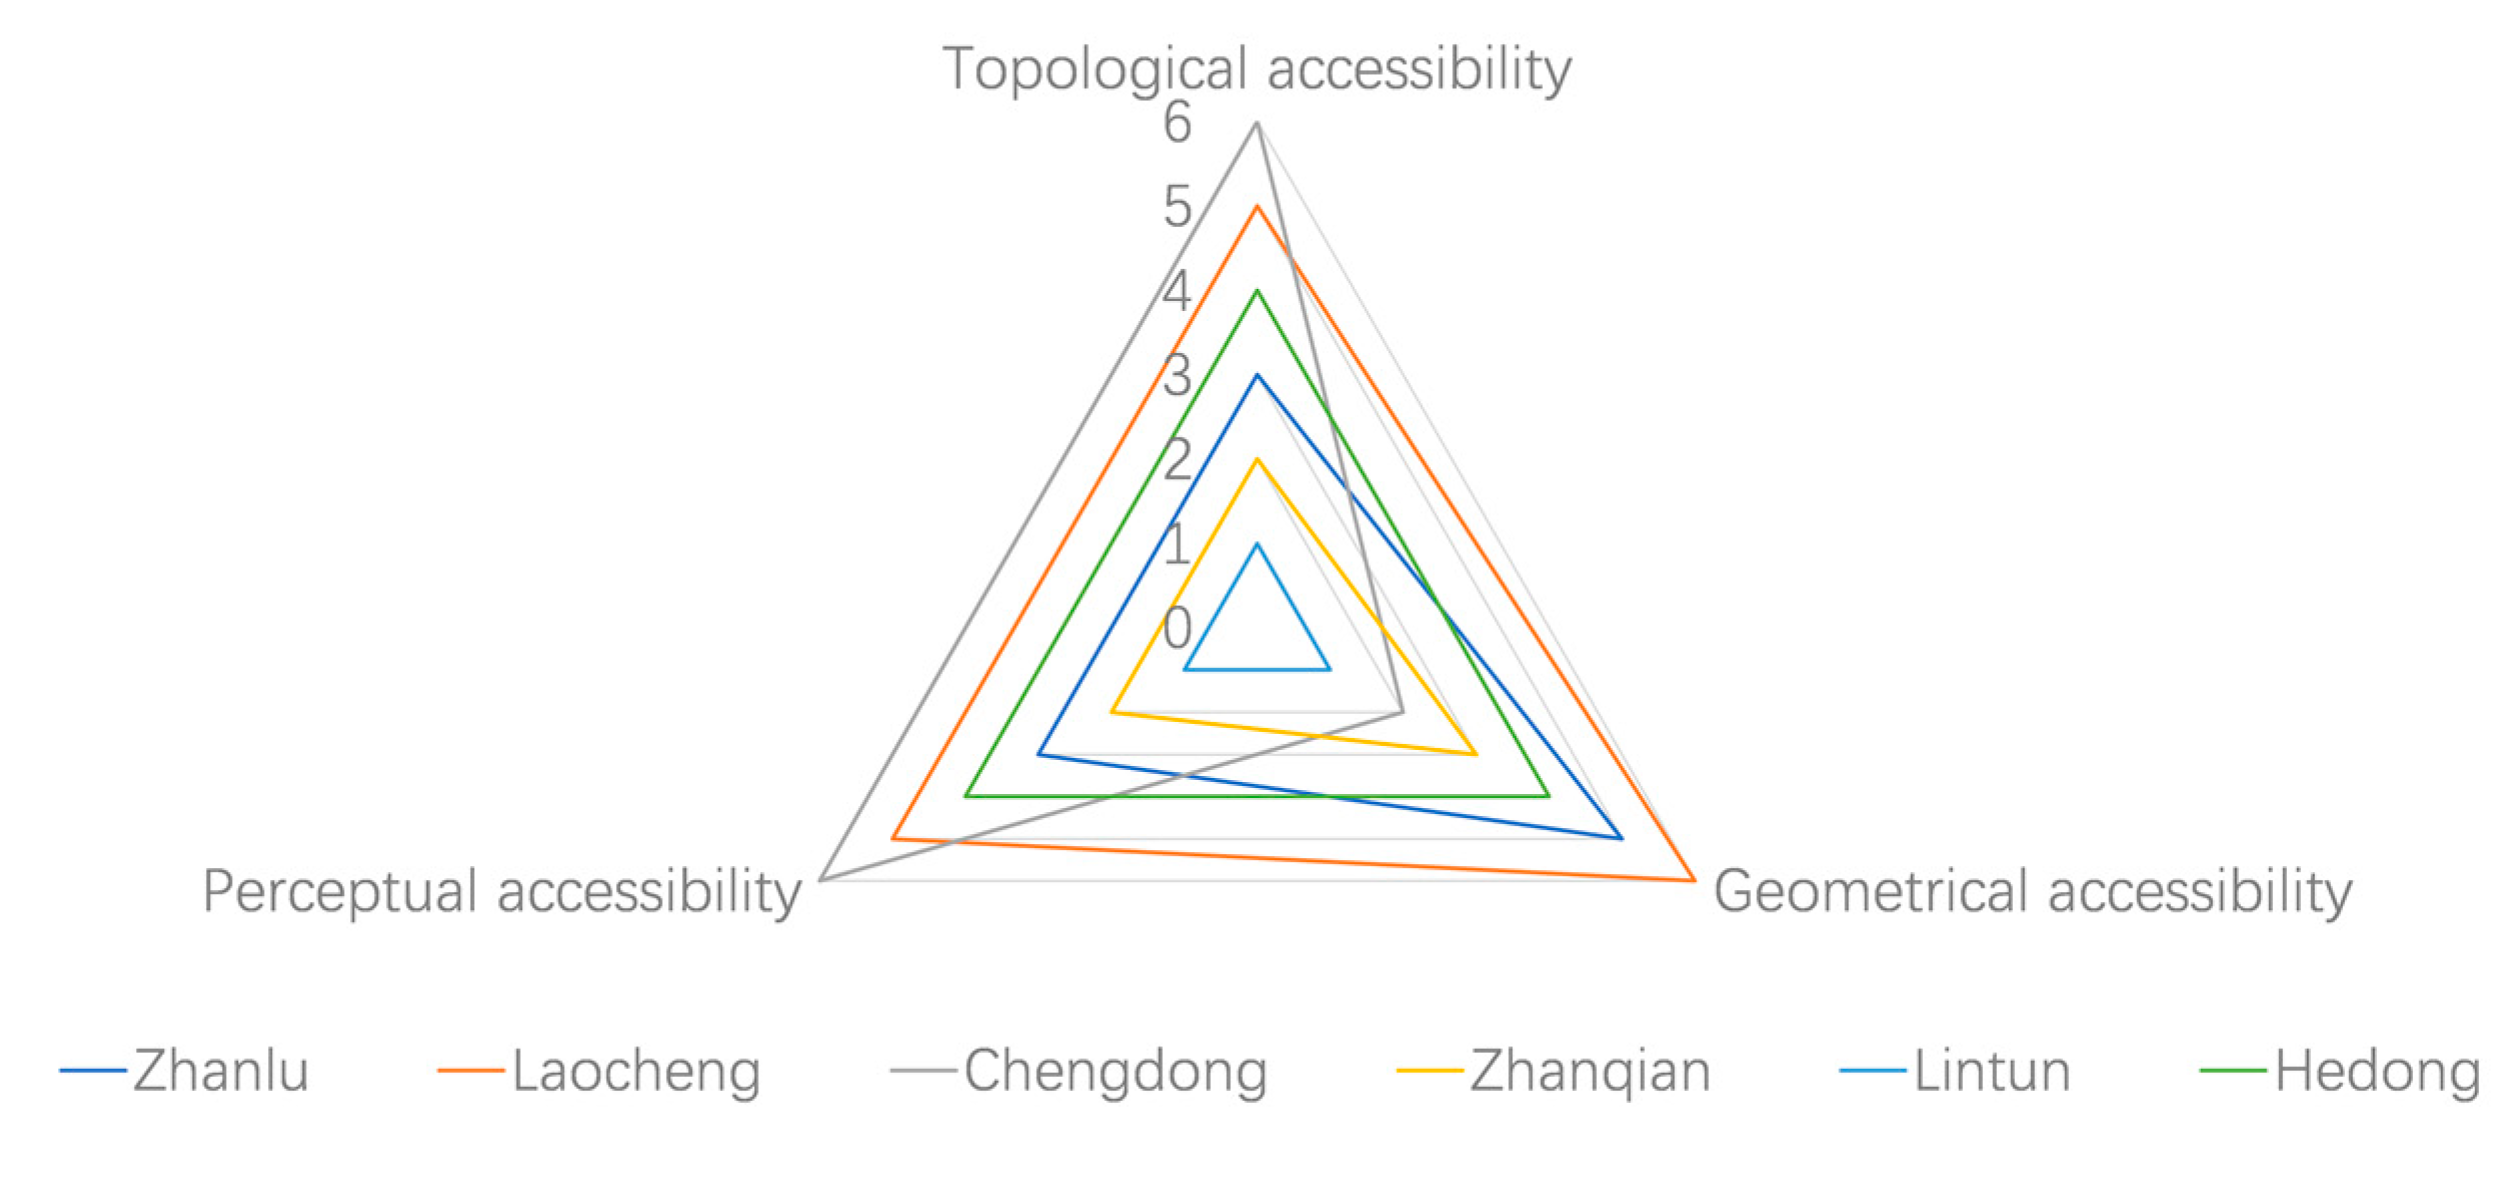
Sustainability 15 14929 g015
Figure 16. Comparison of accessibility indices for case study’s riverfront zoning districts. Source: authors, using Excel and ArcGIS 10.2.
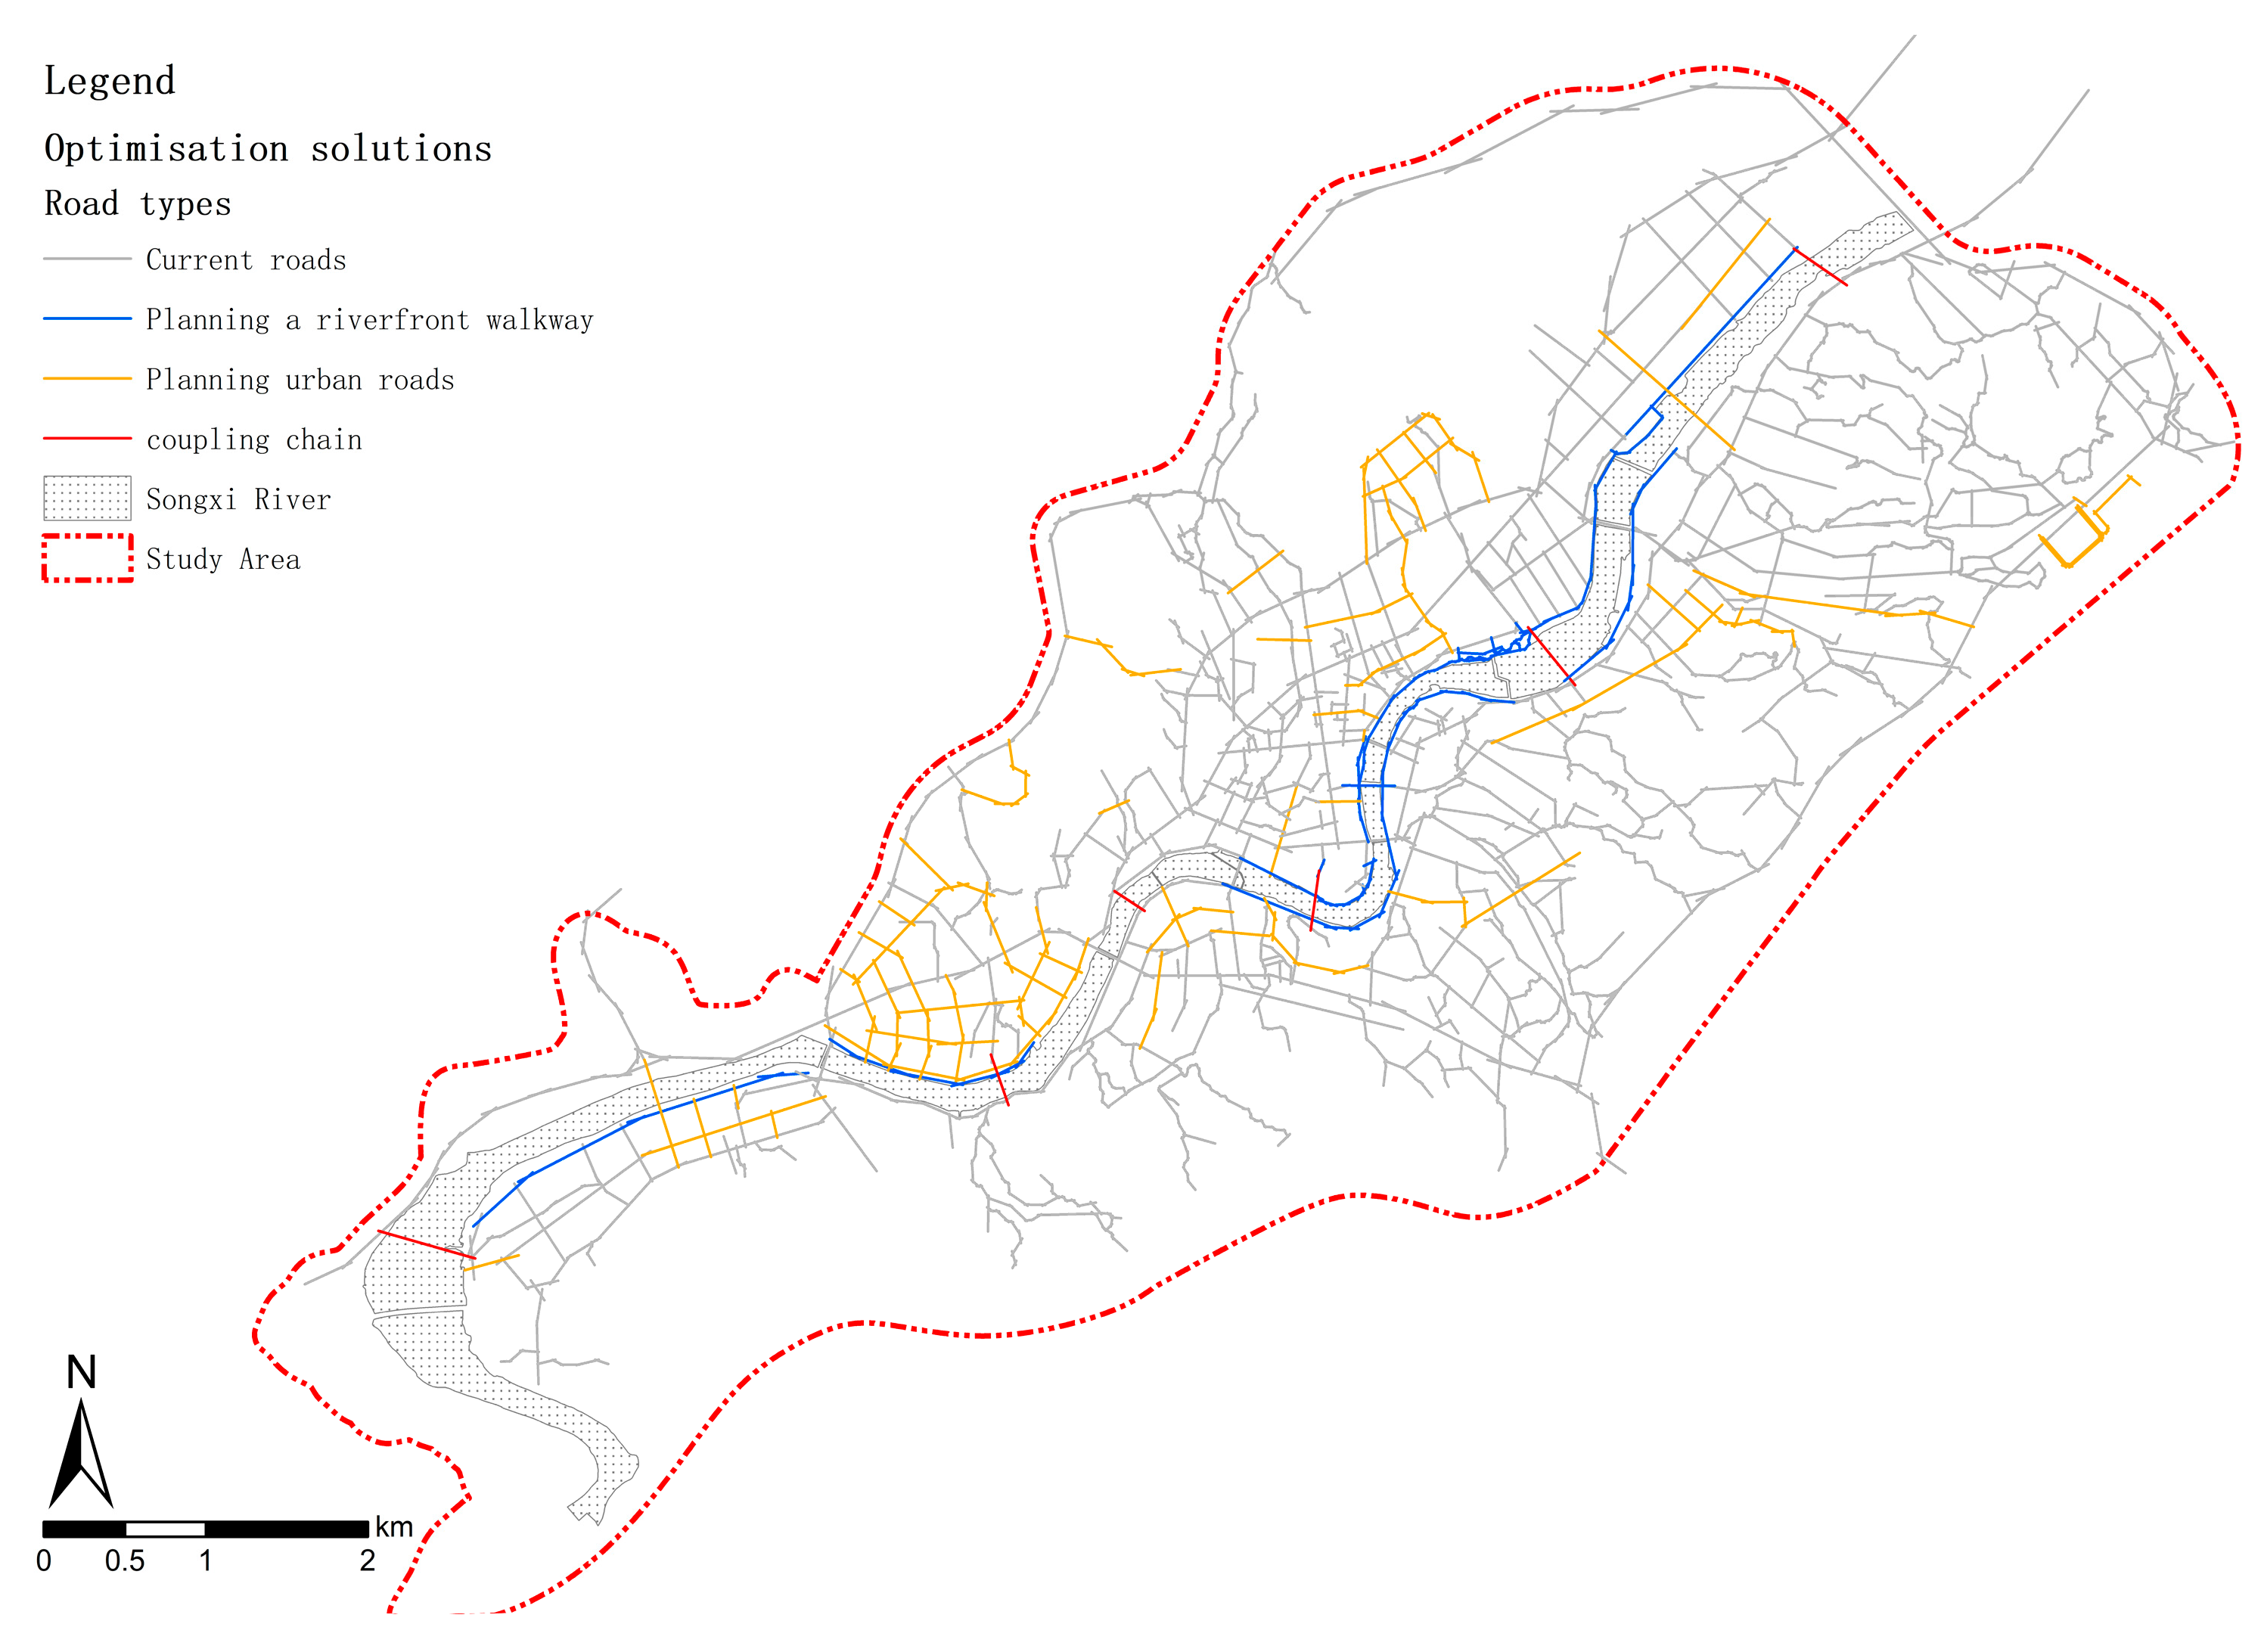
Sustainability 15 14929 g016
Figure 17. Optimization of the riverfront space. Source: authors, using ArcGIS 10.2.
Sustainability 15 14929 g017
Figure 18. Optimized integration kernel density analysis figure. Source: authors, using ArcGIS 10.2 and DepthmapX v0.8.0.
Sustainability 15 14929 g018
Figure 19. Optimized Choice 300 kernel density analysis figure. Source: authors, using ArcGIS 10.2 and DepthmapX v0.8.0.
Sustainability 15 14929 g019
Figure 20. Overlay of riverfront and POI kernel densities. Source: authors, using ArcGIS 10.2 and Amap API.
Sustainability 15 14929 g020
Table 1. Spatial syntactic segmentation models.
Segmentation ModelConnotation
axial analysisSpace is simplified to straight lines, and connections between straight lines represent connections between spaces.
segment analysisBased on the axial analysis method, specific scales are brought into the model analysis, which is usually used to analyze the pass-through volumes of streets with different travel radii.
convex spatial analysisThe study and expression of three-dimensional space using two-dimensional planar methods, commonly used in the study of architectural space.
visibility graph analysisDivide the space into numerous fine grids. When the grid division is subdivided into points, analyze the relationship between points.
Table 2. Research dimensions and quantitative indicators.
MethodsDimension of AnalysisQuantitative IndicatorsDescriptive Property
axial analysistopological accessibilityintegrationPotential for space to attract arrival traffic
segment analysisgeometrical accessibilitychoicePotential for space-traversed traffic
axial analysis; SPSSperceptual accessibilitysynergyThe extent to which local space is cognizant of global space
Table 3. POI data classification statistics.
POI TypesAmountPOI TypesAmount
Dining267Business Residential35
Scenic Spots43Living Services221
Corporate264Sports and Leisure51
Shopping1065Healthcare156
Traffic Facilities130Accommodation47
Science, Education, and Culture 130Government and Social Organizations524
Aggregate2667
Table 4. Statistics on the average value of global integration by waterfront districts.
WaterfrontChengdongLaochengHedongZhanluZhanqianLintun
Integration0.4893680.5787950.5649470.5113280.4546230.4339360.353949
Table 5. Choice value of riverfront subdivision.
LaochengZhanluHedongZhanqianChengdongLintun
Choice0.4893680.5787950.5649470.5113280.4339360.353949
Table 6. Synergy statistics for different R values.
R-ValueR3R5R7R9R11R15
synergy0.4180.6060.7210.7980.8530.926
Table 7. Riverfront subdivision synergy statistics.
Integration R3
Riverfront DistrictChengdongLaochengHedongZhanluZhanqianLintun
IntegrationPearson R0.690 **0.903 **0.879 **0.780 **0.761 **0.737 **0.449 **
Sig. (2-tailed)0.0000.0000.0000.0000.0000.0000.000
Case number N51019142172486663
** Correlation is significant at the 0.01 level (2-tailed).
Table 8. The average statistics of the global integration value of each waterfront area before and after optimization.
ChengdongLaochengHedongZhanluZhanqianLintun
status quo0.5787950.5649470.5113280.4546230.4339360.353949
optimized0.6477860.6214970.5878520.5152860.5508380.413063
Disclaimer/Publisher’s Note: The statements, opinions and data contained in all publications are solely those of the individual author(s) and contributor(s) and not of MDPI and/or the editor(s). MDPI and/or the editor(s) disclaim responsibility for any injury to people or property resulting from any ideas, methods, instructions or products referred to in the content.

