1. Introduction
Membrane distillation (MD) is a desalination technology that has grown in popularity in recent years for its saltwater desalination capabilities [
1,
2]. The key feature of MD is that it uses a membrane in order to separate fresh or desalinated water by distilling the vapor or permeate. MD has increasingly been recognized as a sustainable alternative for water purification and desalination, holding promise for addressing the global challenges of water scarcity and energy efficiency [
3]. Unlike conventional distillation methods that demand high energy inputs, MD operates at lower temperatures, thereby reducing energy consumption and environmental impact. Furthermore, MD’s modular design and scalability make it well-suited for decentralized water treatment systems, offering the potential for community-level sustainability. The technology can also be integrated with renewable energy sources such as solar and geothermal energy, further amplifying its eco-friendly credentials. As MD technology continues to evolve, the optimization of membrane characteristics—such as those investigated in this study—becomes a crucial factor in enhancing performance while minimizing resource utilization, thus contributing to the broader goals of water and energy sustainability [
4]. MD has several key advantages, one of which is its ability to handle solutions and waters that have a high concentration of salt or other impurities; this particular feature makes MD very popular among seawater desalination or wastewater treatment techniques [
5,
6,
7,
8]. MD is also considered to be one of the more energy-efficient techniques among other desalination methods, as it is not reliant on high pressure in order to operate and produce high-quality water [
9]. However, MD is not without its faults and limitations, as one of the main barriers of MD is in its fouling or scaling, which can greatly affect its efficiency in the long term. Comparatively, MD is also slower than its other counterparts, and it usually produces a lower flux rate than other separation processes [
10].
Generally, MD has several different types that each operate based on the mechanism in which the permeate is extracted. However, the most commonly used technique is direct contact membrane distillation (DCMD) [
10,
11]. DCMD has been considered a promising technology for the treatment of high-salinity impaired water. Compared to the conventional membrane-based pressure-driven separation processes such as nanofiltration and reverse osmosis, the driving force of DCMD is the difference of vapor pressure across a porous hydrophobic membrane, which makes the DCMD process tolerant of membrane fouling [
12]. For example, Hussain et al. [
13] reported a flat-sheet MD based on polytetrafluoroethylene (PTFE) and polypropylene (PP) for the treatment of PW from unconventional resources. They found that MD is effective at desalinating the brines with a salt concentration of up to 70,000 mg/L, and the permeate water flux is not sensitive to salt concentration. Singh and Sirkar [
14] demonstrate a series of DCMD desalination processes with a PP hollow fiber membrane module. It was reported that the DCMD is feasible for treating different types of produced water to obtain high-quality permeate water and 80% water recovery. Drioli et al. [
15] reported a laboratory-made PVDF hollow fiber membrane and a commercial PP membrane-based DCMD process to desalinate oilfield-produced water. They found that the DCMD process shows excellent rejections toward both total dissolved solids and dissolved carbon that are present in the produced water.
DCMD possesses several distinct superiorities over conventional desalination technologies, such as high salt rejection even for high-salinity water desalination, a low operating temperature, a small footprint requirement, inherent modularity, and scalability [
7]. DCMD is also particularly useful as an add-on or substitute for conventional desalination processes such as reverse osmosis systems. What is more, DCMD is highly competitive as an eco-friendly and financially viable approach for dealing with highly saline water, especially when sustainable alternative sources of renewable energy or waste heat are available, which cannot be effectively desalinated by pressure-driven desalination technologies and the electrodialysis [
16].
However, in contrast to the high expectations, the DCMD process, or its related hybrid systems for wastewater treatment, has still not been widely implemented to desalinate wastewater by the industry. Two major bottlenecks impede the commercial application and industrial feasibility of DCMD: relatively lower or unstable flux compared to the conventional RO process. The membrane wetting and fouling cause insufficient operating stability, resulting in flux and salt rejection reduction. Both of the two hurdles are correlated to the same component, which is the porous hydrophobic membrane used in DCMD. Therefore, the engineering and optimization of the membrane properties still own the research priority for maturing the DCMD process to become industrial-scale applicable [
17].
Hydrophobic/hydrophilic dual-layer (DL) membranes refer to the ability of a DL membrane to repel water from its outer layer (hydrophobic) and attract water from its inner layer (hydrophilic) [
12,
18]. A hydrophobic membrane is one that is not easily wetted by water and does not allow water to pass through easily. This is because the membrane is made up of materials that repel water, such as certain types of polymers or lipids [
19,
20]. Hydrophobic membranes are commonly used in filtration and separation processes where the membrane is used to separate water from other fluids or particles. On the other hand, a hydrophilic membrane is one that attracts water and allows it to pass through easily [
18,
19]. This is because the membrane is made up of materials that are attracted to water, such as certain types of polymers or ceramics. Hydrophilic membranes are commonly used in applications where the membrane needs to allow the passage of water, such as in water treatment or biomedical applications [
9,
18,
21]. It is also important to note that membranes can also be designed to be selectively permeable, allowing only certain types of molecules to pass through while blocking others. This is achieved through a variety of methods, such as pore size, charge, and chemical composition, and can be useful in applications such as drug delivery or sensing [
22].
Polytetrafluoroethylene (PTFE) is commonly classified as a hydrophobic material [
23,
24,
25]. This is due to its low surface energy and nonpolar molecular structure, which makes it difficult for water molecules to wet the surface and form hydrogen bonds [
26]. The hydrophobicity of PTFE can be further enhanced by modifying its surface through methods such as plasma treatment, chemical etching, or coating with hydrophobic materials. PTFE is a highly hydrophobic polymer, which means it repels water and does not absorb it. This is important in MD because the separation process relies on the ability of the membrane to prevent the mixture from permeating through the membrane and into the permeate side [
21,
23,
24,
27]. PTFE’s hydrophobic properties allow it to create a barrier that effectively prevents the contaminants from passing through the membrane and into the permeate side [
21,
24,
28,
29]. In addition to its hydrophobic properties, PTFE is also chemically inert, meaning it does not react with other chemicals in the mixture [
22,
30]. This is important because it ensures that the membrane will not be degraded over time by exposure to the mixture, and it also helps to prevent fouling of the membrane. Finally, PTFE has a low thermal conductivity, which makes it ideal for use in DCMD systems where high temperatures are used to drive the distillation process [
31,
32]. The low thermal conductivity of PTFE helps to reduce heat loss and maintain efficient operation of the system. Overall, PTFE is a highly effective polymer for use in DCMD systems due to its hydrophobic, chemically inert, and thermally stable properties. These properties make it an ideal material for creating a membrane that can effectively separate contaminants from a liquid mixture and provide long-term performance [
33].
However, pure PTFE membranes often suffer from low mechanical strength and poor processability [
34]. To overcome these limitations, PTFE is often combined with other polymers, such as polyethersulfone (PES), to create composite membranes with enhanced properties. PES is a hydrophilic polymer with good mechanical strength and processability, and it can provide additional pore structure to the composite membrane. In DCMD, a hydrophobic membrane is used to separate contaminants from a liquid mixture, and PES is an ideal material for this application due to its unique properties. PES is a hydrophilic polymer, meaning it attracts and absorbs water. This is important in DCMD because it allows for the transfer of water vapor from the feed side of the membrane to the permeate side. The hydrophilic nature of PES helps to facilitate the distillation process by allowing the water vapor to pass through the membrane and into the permeate side. In addition to its hydrophilic properties, PES is also chemically stable, meaning it does not react with other chemicals in the mixture [
32]. This is important because it ensures that the membrane will not be degraded over time by exposure to the mixture, and it also helps to prevent fouling of the membrane. PES also has high thermal stability, which makes it ideal for use in DCMD systems where high temperatures are used to drive the distillation process. The high thermal stability of PES helps to ensure that the membrane retains its structural integrity and performance even when exposed to high temperatures [
35]. PES is a highly effective polymer for use in DCMD systems due to its hydrophilic, chemically stable, and thermally stable properties. These properties make it an ideal material for creating an inner layer that can facilitate the distillation process and provide long-term performance in the system. The combination of PTFE and PES in a dual-layer membrane can offer several benefits [
33]. The hydrophilic PES layer can act as a support layer, providing mechanical strength and stability to the membrane, while the hydrophobic PTFE layer can act as a barrier layer, allowing for selective transport of vapors or gases in DCMD. Additionally, the combination of PTFE and PES can provide a wider range of pore sizes and distributions, allowing for more precise control of membrane properties and performance. Overall, the use of PES in combination with PTFE can lead to composite membranes with enhanced properties and improved performance in membrane distillation and other applications [
23,
24,
25]. There have been many MD research efforts to understand how membrane properties affect the overall desalination attributes, and they have generally focused on the development of improved membrane materials [
1,
5,
9,
16,
36,
37,
38,
39,
40,
41,
42]. However, few articles have reported on the effects of PTFE particle size on salt rejection, flux, and desalination attributes.
To summarize, MD has emerged as a promising technology for water purification and desalination [
1,
43,
44]. Hydrophobic membranes are typically used in MD to prevent the wetting of the membrane surface and maintain high permeate flux. Polymeric membranes, such as PTFE, have been widely used in MD due to their excellent chemical and thermal stability, as well as their hydrophobicity [
24,
45]. However, the performance of PTFE membranes in MD is strongly influenced by their particle size and concentration, which affect the membrane’s porosity and pore size distribution. Despite extensive research on PTFE membranes, there is still a research gap in understanding the effect of particle size and concentration on the development of hydrophobic/hydrophilic dual-layer membranes for MD.
This study aims to fill this research gap by investigating the effect of the particle size and concentration of PTFE on the performance of dual-layer membranes for direct contact DCMD. In selecting the appropriate methodology for membrane distillation, DCMD was chosen for several key advantages it presents. Primarily, DCMD offers simplicity in operation and does not necessitate the integration of an external condenser, streamlining the system’s setup. Furthermore, DCMD has demonstrated a comparably high salt rejection rate, which is paramount in membrane distillation processes. Other techniques were considered but ultimately deemed less suitable for this study. Vacuum membrane distillation (VMD), for instance, requires both a vacuum and an external condenser, adding complexity and potential points of failure to the process. Sweeping gas membrane distillation (SGMD) demands an internal gas source, introducing another layer of operational intricacy. Air gap membrane distillation (AGMD) was also examined; however, it was found to impose a significant resistance that detrimentally affects the permeate flux, resulting in lower flux values compared to those achievable with DCMD. Thus, given these considerations, DCMD was deemed the most appropriate method for the objectives of this research.
The novelty of this study lies in the systematic evaluation of the effect of PTFE particle size and concentration on the membrane’s performance using a combination of advanced analytical techniques. The objectives of this study are to optimize the particle size and concentration of PTFE to maximize DCMD performance and to provide insights into the design of high-performance dual-layer membranes for MD. The scope of this study is limited to the fabrication and characterization of PTFE-PES dual-layer membranes and the evaluation of their performance in DCMD.
The distinct innovation of this research is the focused and methodical exploration of PTFE particle size and concentration on membrane performance, leveraging a suite of advanced analytical methods. This study uniquely targets two primary objectives: Firstly, to fine-tune the particle size and concentration of PTFE to elevate DCMD performance to its pinnacle. And, secondly, to deliver critical insights for crafting superior dual-layer membranes tailored for membrane distillation (MD) applications.
Furthermore, it is pivotal to understand that the confines of this study encompass exclusively the synthesis and in-depth characterization of PTFE-PES dual-layer membranes and a rigorous assessment of their efficacy specifically within DCMD contexts.
2. Materials and Methods
2.1. Materials
The materials used for this experiment are polyethylene glycol (PEG), polyethersulfone (PES), polytetrafluoroethylene (PTFE), and N-methylpyrrolidone (NMP). The PEG, PES, and NMP are from Merck KGaA, Darmstadt, Germany. The PTFE is from Goodfellow, Huntingdon, UK. The water used is the Ultrapure water, from Vent Filter EMD, Millipore (Burlington, MA, USA). The coagulation water used was tap water. The synthetic seawater is composed of 8 g of pure salt (NaCl) per 1 L of water, which is 8000 ppm. This is the saline water solution that was used in the experimental process of DCMD. PTFE membranes have a high degree of salt resistance and can handle up to 75,000 ppm. For the experimental framework of this study, a foundational salt concentration of 8000 ppm was strategically employed. This decision was rooted in the intent to meticulously assess the rudimentary desalination potential of the membranes, isolated from the complexities introduced by higher salt concentrations. It is worth noting that several desalination plants are positioned in estuary regions, where salt concentrations often align more closely with brackish water levels, thus making the chosen concentration relevant to such scenarios. By establishing this baseline, the study ensured a controlled environment for discerning the effects of PTFE particle size and concentration on membrane efficacy. Following the identification of optimal parameters within this context, it is anticipated that subsequent research endeavors will progressively elevate the salt concentration, thereby examining the nuanced influences on DCMD performance attributes.
2.2. Membrane Preparation
To fabricate the membranes, PTFE and PES were put in an oven at 60 °C for 24 h. PEG and NMP do not need any pretreatment and are used directly in their base forms. To create the dope solution for the inner layer, NMP was used as a solvent to dissolve PEG, and once PEG was dissolved completely, PES was gradually added over the duration of 120 min in three batches. This entire process was performed using a magnetic stirrer and under 60 °C temperature for the dope. The proportion of the polymer and solvent for the inner layer dope is 80 wt% solvent (NMP), with 17 wt% PES and 3 wt% PEG across all membranes. However, for the outer layer, the solvent is a constant 82 wt% NMP, and the remaining 18 wt% is distributed between PES and PTFE. For the concentration experiment, the first membrane is the control membrane, which does not use any PTFE and is entirely PES (18 wt%). The second concentration uses 2 wt% PTFE and 16 wt% PES. This concentration is used for all experiments regarding particle sizes. This is because higher concentration would not dissipate using bigger particle sizes, and therefore a 2 wt% PTFE was used as a baseline. The other two concentrations use 4 wt% and 6 wt% for PTFE respectively, with 14 wt% and 12 wt% PES depending on the PTFE weight. The composition of the different membrane concentrations is illustrated in
Table 1.
Concentrations exceeding 6 wt% were not evaluated in this study due to the inability of PTFE particles to disperse effectively in the dope solution, as evidenced by the observed behavior at 8 wt% PTFE concentration in
Figure 1. The highest permissible concentration is 6 wt%, and this is only applicable for the 0.5 μm particle size. For particle sizes greater than 1 μm, dispersion becomes challenging at concentrations beyond 2 wt%. Additionally, there exists a reciprocal relationship between PTFE and PES concentrations; as the former increases, the latter must be reduced proportionally. At 6 wt% PTFE concentration, a threshold is reached, where insufficient PES concentration prevents effective bonding with PTFE, leading to suboptimal dispersion of particles.
Concerning particle sizes smaller than 0.5 μm, empirical findings indicate negligible differences in results for sizes below 1 μm. The rationale for not examining sizes below 0.5 μm stems from procurement challenges. During the research period, acquiring pure PTFE particles of sizes smaller than 0.5 μm was not feasible. Efforts to source these particles from multiple suppliers resulted in samples that were mixtures of 0.5 μm and 1 μm sizes. Consequently, 0.5 μm was established as the smallest testable particle size under controlled conditions.
For the outer layer, PTFE was gradually dispersed into NMP over a two-hour period and in three batches. To accomplish this process, a magnetic stirrer was used, under a 100 °C temperature in order to homogenously disperse the PTFE. Once this process had been completed, the temperature was reduced to 70 °C and PES was gradually added to the dope solution. Once PES was added, the magnetic stirrer continued to stir (250 rpm) for another 24 h until the dope solution had been completely ready. Proportions for the dope solution of the outer layer are listed in
Table 1. For the first experiment regarding particle size, the 2 wt% concentration was used; therefore, the outer layer dope solution consists of 2 wt% PTFE, 16 wt% PES, and 82 wt% NMP.
Before the spinning process was initiated, the dope solutions were ultrasonicated. This process lasted for 30 min, and it is a compulsory step as it ensures there are no bubbles trapped within the dope solutions. Once completed, the dope was then fed into the spinneret via a syringe pump motor for the outer layer, at the rate of 6 mL/min. In order for the phase inversion process to solidify the polymeric liquid, a 10 cm air gap was between the spinneret tip and the coagulant bath container. Once the membrane was formed and spun, it was then guided into a water container for the purpose of cutting and storage. They were stored within this container for a full day cycle (24 h) in order to ensure there were no residual solvents left. The temperature of this water in the container was room temperature (roughly 25 °C).
The spinning machine used a non-solvent-induced phase separation (NIPS) method in order to prepare the DLHF membrane. The spinning parameters are listed in
Table 2. The spinneret has three orifices, in which the dope solutions are filled into the coagulation tank. This tank is filled with water (tap), and drums within the tanks are used to collect the membrane. This process is illustrated in
Figure 2. The inner layer dope is inserted into the spinneret via an auto pump, while the outer layer pump uses a syringe pump. The bore fluid was inserted via the pump controller device.
2.3. Membrane Characteristics
There are several membrane characteristics that were under test for these prepared membranes. The first group of characterizations is the understanding of the surface morphology of the membrane. This was completed through the use of scanning electron microscopy (SEM), which takes the membrane under test and submerges it under liquid nitrogen in order to create a clean fracture. Once this fracture was formed, a clear cross-sectional view was obtained via SEM (SEM, Hitachi TM 3000, Tokyo, Japan). Once the images are obtained via this process, further enhancements were made through the use of image processing methods that highlight the topographical surface of the membranes and the roughness of the surface relative to the base membrane. Energy dispersive X-ray (EDX) (Oxford Silicon Drift Detector, Oxford, UK) analysis was also used in order to demonstrate the element distribution of the surface-modified PTFE-PES membrane under the observation of the SEM.
Another membrane characterization used was the measurement of the liquid entry pressure (LEP) via a dead-end cell. For the sake of consistency, the LEP experiment was conducted 10 consecutive times on a 9 × 10⁻⁴ m2 area of the membrane. Regarding the water contact angle (WCA) calculation, the measurements were performed using OCA 15EC from LMS Scientific Solution SDN (Selangor, Malaysia). This process was performed 10 times for the sake of angle consistency and in order to evaluate the hydrophobicity/hydrophobicity of the PES/PTFE composite membranes.
The membrane characteristics of porosity, tortuosity, and average pore size distribution were calculated using mercury intrusion porosimetry (MIP). As the name suggests, this was completed through the application of mercury through pressure via the porosimeter (Autopore V, Norcross, GA, USA) on the pores of the membrane. By measuring the volume that is filled by the mercury, the porosity, tortuosity, and pore size are calculated. To calculate the surface roughness of the PTFE-PES composite membrane, atomic force microscopy via the Park System XE-100 atomic microscope was used (Park System, Suwon, Republic of Korea). The area that was scanned for this characteristic was measured at 10 μm × 10 μm.
The nitrogen gas flux needs to be considered because it affects the performance of the membrane. The presence of nitrogen gas in the feed solution can cause a reduction in the driving force for mass transfer across the membrane, which can result in a lower permeate flux. Furthermore, the nitrogen gas can also accumulate at the interface between the hot and cold streams, which can cause an increase in the membrane surface temperature and decrease the temperature difference across the membrane, thereby reducing the driving force for mass transfer. This can result in a decline in the overall efficiency of the DCMD process. Therefore, it is important to consider the nitrogen gas flux in a DCMD scenario to optimize the performance of the membrane and ensure a high-quality permeate product.
Figure 3 depicts the process and equipment in which the nitrogen gas flux is measured. The membrane is suspended within the vacuumed cylinder, with one end closed off with epoxy and the other end covered in a foam connected to a tube. The nitrogen gas is released into the tank, which then enters through the membrane pores. The syringe pump pumps liquid and soap into the measuring glass. The time is then measured when the resulting bubbles appear due to the nitrogen gas and they reach the 5 mL marker.
Equation (1) is used for measuring the nitrogen gas flux. The variables in the formula are the following: V: the volume of gas collected over a certain time period (in liter); A: the total effective surface area of the membrane occurs (in meter squares); and T: the time taken to collect the vapor volume (in hours). The formula represents the amount of gas exchange per unit area per unit time, so the units of flux would be volume per unit area per unit time, e.g., L/(m
2·h).
2.4. Direct Contact Membrane Distillation Performance Test
In this study, the performance of the developed DCMD was evaluated in terms of flux and salt rejection. The desalination performance of the hydrophobic PES-PTFE DLHF was tested in a laboratory-scale DCMD setup with the brine recycling operation mode for 8 h. The overview of the DCMD setup is illustrated in
Figure 4. Four DLHFs with effective lengths of 20 cm were assembled in an acrylic membrane module (outer diameter: 1 cm; inner diameter: 0.8 cm) and potted with epoxy at both ends of the module. The flow rate of the water is 3 LPM for the hot feed and 1.5 LPM for the cold feed. These are highlighted using red color for hot feed and blue color for cold feed in the
Figure 4 illustration.
The membrane module was inserted into the MD setup, as depicted in
Figure 4. The feed tank contains hot water at around 70 °C (heater via a thermoregulator—Protech 830 (Tech-Lab, Balakong, Malaysia)), with a valve connected to the tank that controls its flow. The feed tank contains four liters of saline water, which is composed of 8 g of salt per liter of water, meaning 8000 ppm. The water from this feed tank was then pumped into the shell side of the membrane module. The cold water was chilled to 10 °C with S&A CW-500 chiller (Shanghai, China). The water from the distillate tank was pumped through the membrane module, creating condensation on the membrane, resulting in the water being desalinated at room temperature. A weight balance was used in order to weigh the results, i.e., the amount of water permeate, at every hour for 24 h.
The higher the value of salt rejection, the more effective a membrane is considered. The following Equation (2) led to the salt rejection (R) of the hollow fiber membrane:
where c1 and c2 are the salt concentration of permeate and feed solution, respectively.
The membrane flux was calculated by the following Equation (3):
where J is the mass flux of the membrane (kg/m
2·h), ΔW is the quantity of permeate water (kg), A is the effective membrane surface area (m
2), and Δt is the time of flux collection (h).
3. Results
The results of this study are divided into two main sections. The first section delves into performing a comparative analysis between different particle sizes of PTFE, while the second section does a comparative study on the concentrations used on the optimal particle size. The first set of results identifies the optimal particle size, which then enables the second part to use that particular size to measure the best concentration.
3.1. Effect of PTFE Particle Size (0.5 μm, 1 μm, 6–9 μm) on Membrane Characteristics
In this section, the contact angle, surface morphology, and DCMD characteristics of three different particle sizes are measured and compared. The results are as follows.
Figure 5 illustrates the results of the SEM from three different perspectives and magnifications. There is a cross-section, which is at ×300 magnification, a cross-sectional view of the surface at ×7000 magnification, and finally a surface view at ×500 magnification. Based on the results illustrated in
Figure 5a,d,g, the cross-section of the top illustrates that all the membranes have the hallmarks of a healthy membrane, and none of them have any fractures, faults, or deformities. This is important, since if the membranes have deformities, the other membrane characteristics would not be consistent. For the 1 μm, the cross-section is relatively more condensed, which means it has fewer macrovoids, while, on the other hand, the 6–9 μm has more macrovoids. These macrovoids are between the inner and outer layers, which is only visible in this form of cross-section. This is particularly more noticeable when zoomed in further at the surface with finger-like pores at the top. The cross-sections from
Figure 5a,d,g also illustrate that the morphology on the cross-section of the dual-layer hollow fiber is spun in a sandwich-like structure where finger-like voids formed from the bottom and the top surface of the membrane and separated by sponge-like structures at the middle of the membrane cross-section.
Finger-like structures are observed on the cross-sectional view in
Figure 5b,e,h. In the context of DCMD desalination, the pore size of the membrane can significantly impact its performance. Smaller pore sizes can also lead to increased resistance to flow, which in turn can reduce the permeability of the membrane and hinder the rate of water transport. SEM does not indicate the average pore size, and that is measured via MIP. Additional factors such as membrane thickness, mechanical strength, and chemical resistance play a major role in the overall performance of the membrane in a DCMD system and should be considered when evaluating its suitability for a specific application.
In the surface magnification illustrated in
Figure 5c,f,i, the SEM images of the surface show that the 0.5 μm particle size is rougher compared to the 6–9 μm and 1 μm particle sizes. The distribution and size of the PTFE particles play a crucial role in the performance of the membrane for DCMD. The distribution of PTFE particles at the 0.5 μm size makes the membrane surface more hydrophobic, which helps to prevent the mixing of the feed and permeate streams. This increased hydrophobicity leads to improved separation efficiency and overall performance of the DCMD process. In comparison, the membrane developed with a 6–9 μm particle size exhibits lower surface roughness, which would result in lower hydrophobicity. The 1 μm particle size may exhibit intermediate performance between the 6–9 μm and 0.5 μm particle sizes, based on the density of the distribution of the PTFE particles.
The results of the contact angle are measured and illustrated as bar charts in
Figure 6. The results denote that the smaller the particle, the higher the contact angle, which is the more desirable outcome. In this instance, the 0.5 μm has the best contact angle presented. However, the contact angle values are close to one another, with 0.5 μm having a smaller error rate, which denotes consistency across the ten measurements. Both particle sizes of 1 μm and 6–9 μm have a higher standard deviation, which indicates the error rate. The overall observation is that as the contact angle values decrease as the particle size increases.
This trend indicates that the membrane with the largest particle size (6–9 μm) is the least hydrophobic among the set and has the lowest contact angle value (75), while the membrane with the smallest particle size (0.5 μm) is the most hydrophobic and has the highest contact angle value (84). The difference in contact angle can be attributed to the difference in surface roughness and the resulting surface energy of the membranes. The results of the contact angle enhancement are in agreement with existing research on the usage of PTFE/PVDF, and the increase in contact angle due to the inclusion of different PTFE particle loading had a positive effect on the contact angle, as it slightly increased it when loading was higher. Generally, a better dispersion of the PTFE yielded a higher contact angle, which is evident in the current state of 0.5 μm having a better dispersion and hence a higher contact angle value. In the study, the contact angle increased from different loadings and concentrations, and the general size used was limited to under 1 μm with no specifications given regarding its variety. However, in this study the specific concentrations are under test and, therefore, they are comparatively indicative of the performance and the effect of PTFE on the particle size [
26].
In the context of DCMD, it is important to maintain a high contact angle to prevent pore wetting, which can lead to decreased efficiency. Thus, the membrane with the smallest particle size (0.5 μm) is likely to provide the best performance in terms of anti-wetting and high efficiency. Ultimately, the contact angle values of the three dual-layer hollow fiber membranes are directly related to the particle size of the PTFE used in the membrane fabrication, with smaller particle sizes resulting in higher hydrophobicity and higher contact angle values.
The values obtained from the MIP analysis (illustrated in
Figure 7a) provide important information about the pore structure and performance of the membranes in DCMD. A comparison of the results can help to better understand the implications of the different PTFE particle sizes used in the membranes. The porosity of 49.94% means that a large portion of the membrane surface is made up of pores, which can contribute to the overall permeation of gas and water. The tortuosity of 11.85 indicates that the path of the fluid in the pores is relatively complicated and tortuous, which can result in lower permeate flux and lower gas flux. For the 1 μm membrane, the average pore size of 140.62 nm is slightly larger than that of the 6–9 μm membrane, which can result in higher gas flux and a higher permeate flux. The porosity of 50.45% is higher than that of the 6–9 μm membrane, which can contribute to the overall permeation of gas and water. The tortuosity of 9.75 indicates that the fluid path is less tortuous than that of the 6–9 μm membrane, which can result in higher permeate flux and higher gas flux. For the 0.5 μm membrane, the average pore size of 157.4 nm is larger than that of the 6–9 μm and 1 μm membranes, which can result in even higher gas flux and permeate flux. The porosity of 52.38% is even higher than that of the 1 μm membrane, which can contribute to the overall permeation of gas and water. The tortuosity of 7.65 indicates that the fluid path is even less tortuous than that of the 1 μm membrane, which can result in even higher permeate flux and gas flux. The MIP analysis indicates that the 0.5 μm membrane has the largest pore size, highest porosity, and lowest tortuosity, which could contribute to higher mass transport across the membrane. The 6–9 μm membrane has the smallest pore size, lowest porosity, and longest fluid path, which can result in the lowest permeate flux and highest gas flux. The 1 μm membrane has intermediate values, which can result in intermediate permeate flux and gas flux. This is further illustrated in
Figure 7a, which indicates the logarithmic differential intrusion (LDI) versus the pore size. It can be seen that the average pore sizes concentrate the frequency of the pores that they occupy, providing further evidence of the conclusions made by the MIP results.
The TGA curve presented in
Figure 7b illustrates the weight (%) on the first y-axis and derivative weight (%/min) on the second y-axis, while the x-axis represents temperature in °C. Initially, the weight values showed a consistent range of 0–20% throughout the temperature ramp. Notably, a significant weight loss event occurred between 480 and 550 °C, where the weight (%) sharply spiked to around 96%. This pronounced increase suggested a substantial decomposition or degradation process specific to the PTFE-PES membrane in this temperature range. This finding is critical to understanding how thermal stability may affect the membrane’s performance during direct contact membrane distillation. Simultaneously, the derivative weight curve exhibited a gradual decline, with an initial value of eight at zero °C. However, at approximately 500 °C, the derivative weight sharply declined to around 2–2.2, indicating a considerable decrease in the rate of weight loss. This sudden change in the derivative weight curve suggested a potential alteration in the decomposition kinetics, possibly associated with a secondary decomposition process or stabilization of the decomposition reaction.
Moreover, as the temperature approached 630 °C, the weight (%) values gradually returned to nearly 0%, indicating completion or near completion of the decomposition process. This observation is relevant to assessing the membrane’s thermal stability and its suitability for direct contact membrane distillation, where operational temperatures can approach or exceed this range. The TGA analysis presented here provides crucial insights into the thermal behavior of the PTFE-PES dual-layer hollow fiber membrane. Understanding the temperature ranges where decomposition occurs, and the associated weight loss, is essential for optimizing membrane design and ensuring its reliable performance in direct contact membrane distillation applications. Further investigations into the chemical reactions and components responsible for the observed decomposition behavior will enhance the overall understanding of the membrane’s behavior under various operating conditions.
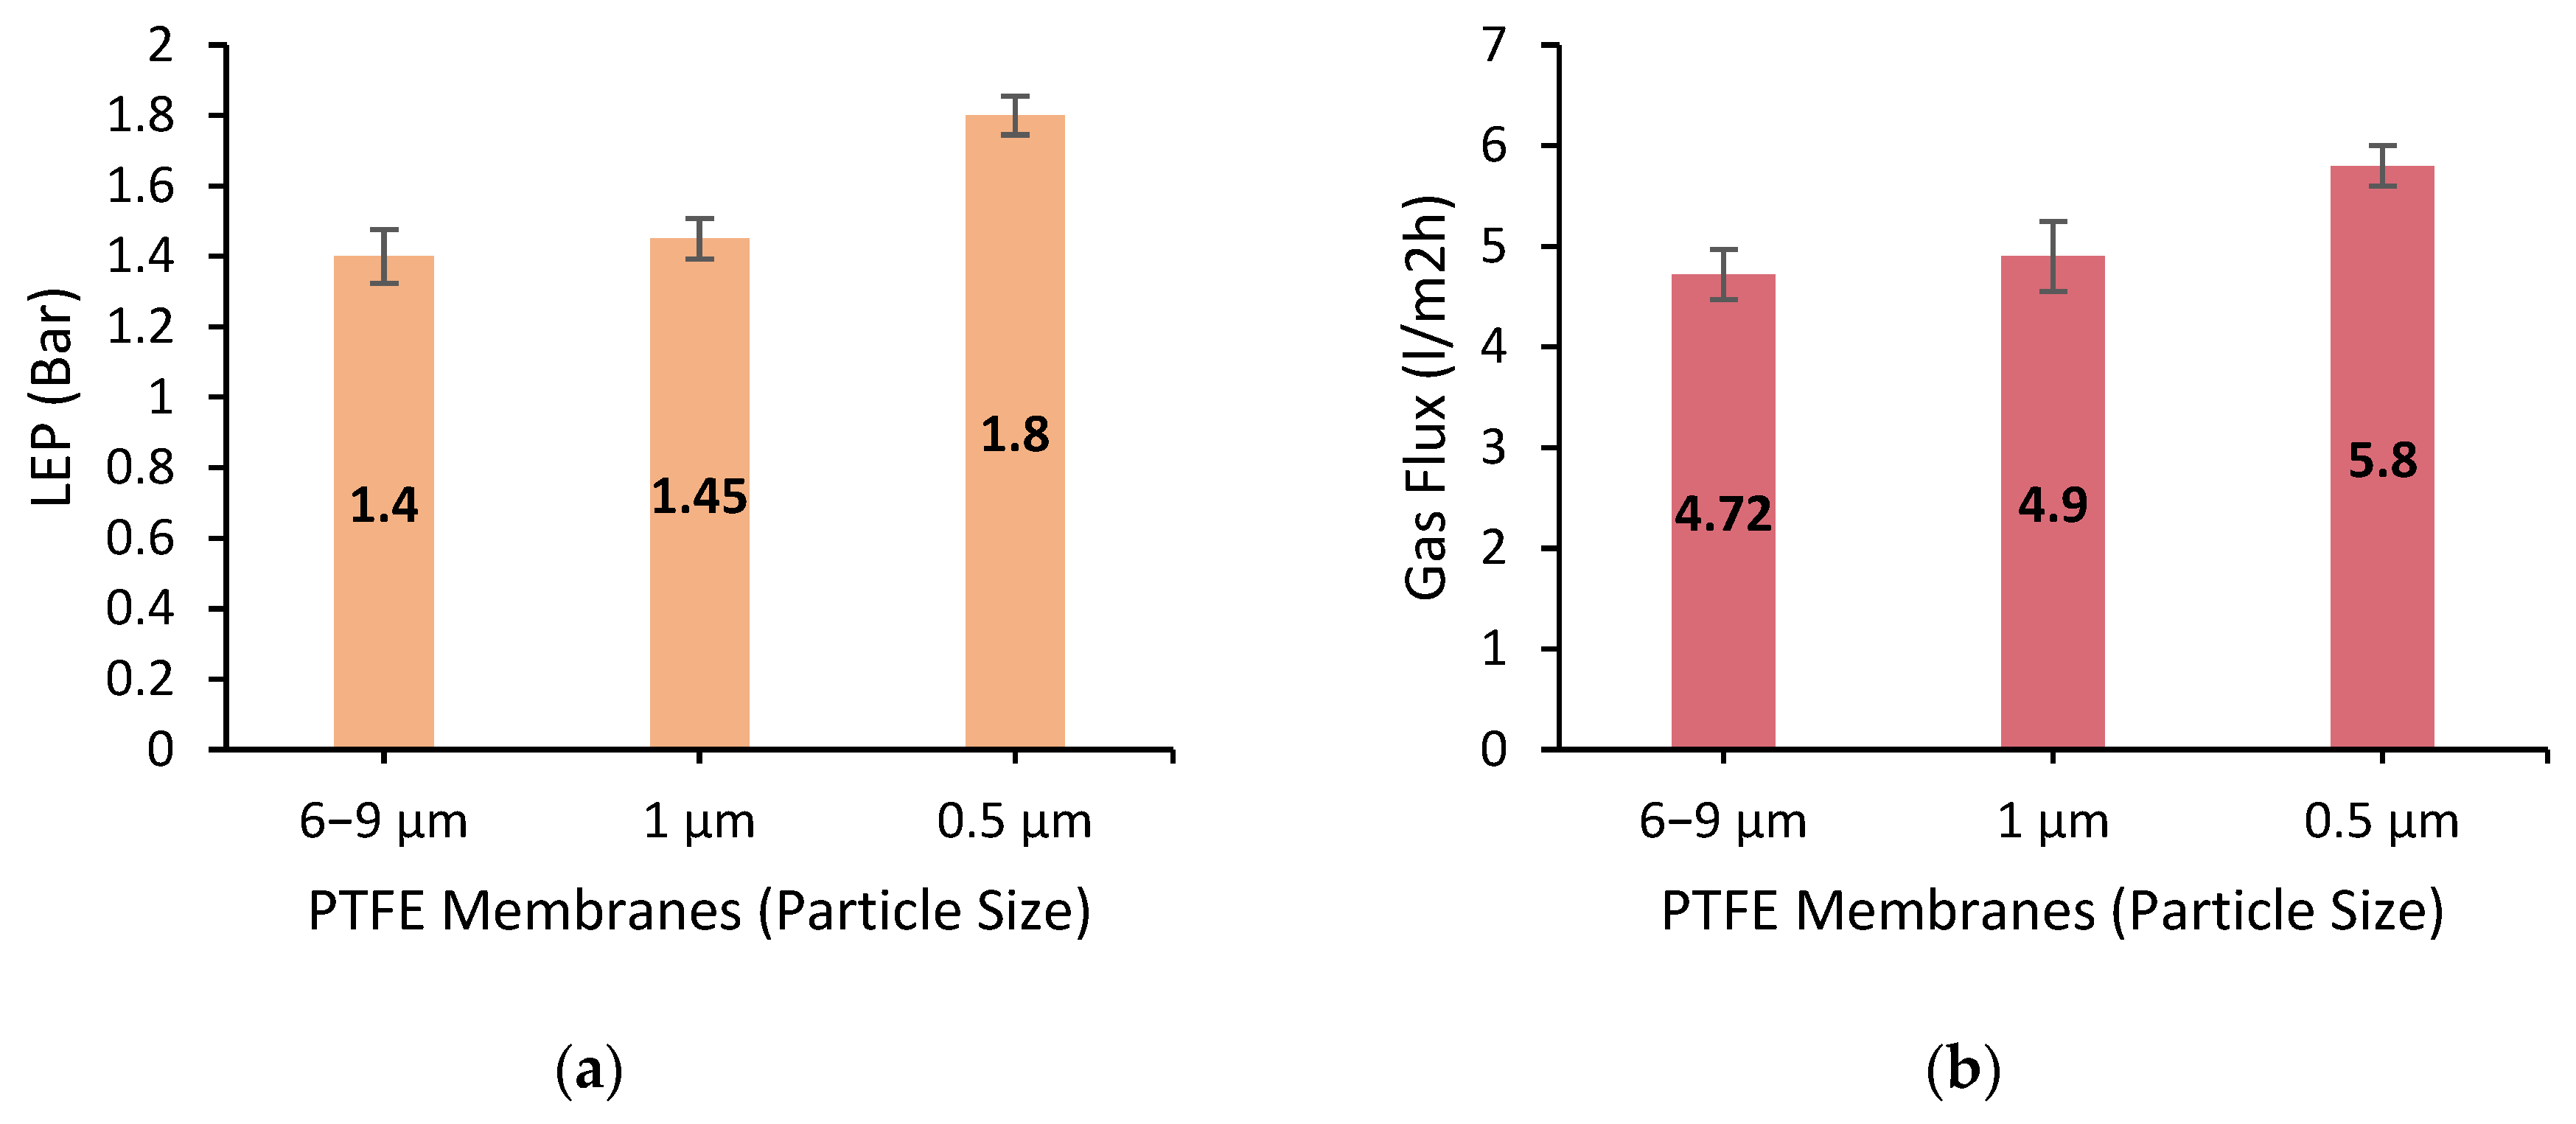
Figure 8a illustrates the value for their LEP; it can be seen that the LEP values for the three membranes are directly proportional to their contact angle values. The membrane with the lowest contact angle value (6–9 μm) has the lowest LEP value (1.4), while the membrane with the highest contact angle value (0.5 μm) has the highest LEP value (1.8). This relationship between the contact angle and LEP can be explained by the fact that the hydrophobicity of the membrane surface affects both the contact angle and the LEP. A hydrophobic membrane surface with a high contact angle will also have a high LEP, as it is more resistant to water permeation. Conversely, a hydrophobic membrane surface with a low contact angle will also have a low LEP, as it is more susceptible to water permeation. Similarly, the existing literature has indicated that the addition of PTFE membranes enhances the LEP by a considerable amount [
21,
45] and that the particle sizes of the applied nanoparticles would have a positive impact if they were to be smaller in diameter [
46].
It should be considered that in terms of DCMD, it is desirable to have a high LEP to prevent water permeation. Hence, the ideal membrane for DCMD should have a high contact angle and a high LEP. Using the information on the LEP values of the three DLHF membranes can be connected to the analysis of their contact angle values to gain a comprehensive understanding of their performance in DCMD. The membrane with the highest contact angle value and the highest LEP value (0.5 μm) is likely to provide the best performance in terms of salt rejection.
Figure 8b illustrates the value for the N
2 gas flux, which illustrates that the values increase as the particle size of the PTFE used in the membrane fabrication decreases. Based on the results from
Figure 8b, it can be concluded that the nitrogen gas flux increases as the particle size of the PTFE decreases. In a PTFE-PES dual-layer hollow fiber membrane, the interstitial spaces between the PTFE particles are occupied by the PES material, which can decrease the overall porosity of the membrane. However, based on our SEM observations, it was noted that higher PTFE particle sizes did not disperse uniformly and left many PES blocks in the membrane, which may have contributed to lower overall porosity. Only the smallest PTFE particle size (0.5 μm) was able to be dispersed in such a way that covered the entire membrane surface, leading to higher overall porosity. Despite the presence of PES, the combined effects of increased surface area, increased porosity, and reduced tortuosity due to smaller PTFE particles can still contribute to an increase in the nitrogen gas flux.
With increased surface area and porosity, there are more available pathways for nitrogen gas molecules to diffuse through the membrane, and with reduced tortuosity, the diffusion pathway is less obstructed, allowing gas molecules to travel more easily and quickly through the membrane. Therefore, the decrease in PTFE particle size to 0.5 μm in the PTFE-PES DLHF DCMD can lead to an increase in the nitrogen gas flux despite the presence of PES material, due to the combined effects of increased surface area, increased porosity, and reduced tortuosity. The highest nitrogen gas flux was achieved with the 0.5 μm particle size PTFE-PES membrane (5.8 × 10⁴ L/m2·h), which was higher than the results obtained from the 6–9 μm (4.72 × 10⁴ L/m2·h) and 1 μm (4.9 × 10⁴ L/m2·h) particle size membranes.
3.2. Effect of PTFE Particle Size (0.5 μm, 1 μm, 6–9 μm) on DCMD Performance
The initial observation across all experiments reveals a relatively high permeate flux at the onset of the 24 h period, irrespective of the PTFE particle size in the membrane. As time progresses, a universal decline in permeate flux is noted for all particle sizes under investigation illustrated in
Figure 9. Significantly, the permeate flux for the larger PTFE particle sizes of 6–9 μm demonstrates a more pronounced decrease over time compared to their smaller counterparts (0.5 μm and 1 μm). One plausible explanation for this behavior lies in the inherent dissipation characteristics of the PTFE particles. Larger particles, with a reduced surface area to volume ratio, may exhibit less effective dissipation into the membrane matrix. This limited exposure may result in a less stable interaction between the particles and the membrane, thereby contributing to a more significant decline in permeate flux as these larger particles potentially obstruct the membrane pores more substantially over time.
Moreover, the pore blockage hypothesis gains traction when considering the larger PTFE particles. The dimensions of these particles may be more comparable to the size of the membrane pores, thereby elevating the likelihood of pore blockage. This phenomenon would naturally culminate in a more rapid decline in permeate flux for membranes containing larger PTFE particles. Conversely, smaller particles, with dimensions significantly smaller than the membrane pores, might navigate through the pores more freely, thereby sustaining a relatively higher permeate flux over an extended period. Particle agglomeration could further complicate this scenario. Larger PTFE particles may have an inherent propensity to agglomerate, forming clusters that exacerbate pore blockage issues. This agglomeration could, in part, be responsible for the accelerated decline in the permeate flux observed with larger particles.
Membrane stability and integrity over time are additional factors warranting consideration. Larger PTFE particles may create less stable and integrated membrane structures, potentially leading to more pronounced changes in membrane properties over time, such as increased compaction or deformation. Such changes are likely to be manifested as a more rapid decline in the permeate flux. Finally, the hydrodynamic conditions within the system may interact differently with PTFE particles of varying sizes. For instance, larger particles might be dislodged more easily from the membrane surface under turbulent flow conditions, thereby contributing to the observed faster decline in the permeate flux for larger particle sizes.
In summary, the observed temporal decline in the permeate flux for higher PTFE particle sizes could potentially be attributed to a confluence of factors. These include less effective PTFE dissipation, increased propensity for pore blockage, particle agglomeration, and alterations in membrane integrity and stability over extended operational periods. While these interpretations are consistent with the observed data trends, they remain speculative to some extent and highlight the need for further targeted experimental investigations.
For membranes containing 0.5 μm PTFE particles, an exemplary initial salt rejection of 99.99% is observed in the first hour of operation. Over a 24 h testing period, this value modestly declines to 98.40%, yielding an impressive average salt rejection of 99.04%. This high and relatively stable salt rejection can be attributed to the small particle size, which likely contributes to a more uniform and tightly packed membrane structure. This structure, in turn, may more effectively obstruct the passage of salt ions, thereby maintaining high salt rejection.
In contrast, membranes with 1 μm PTFE particles start with a salt rejection of 99.20% in the first hour, which declines more significantly to 92.00% by the 24 h mark. The average salt rejection over 24 h for this particle size is recorded at 96.23%. The more pronounced decline, compared to the 0.5 μm particles, suggests that the slightly larger PTFE particles may lead to a less compact and uniform membrane structure, allowing for increased salt passage as time progresses. The most notable trend is observed in membranes containing 6–9 μm PTFE particles. These membranes start with a salt rejection of 99.0% in the first hour, which sharply decreases to 80.40% by the end of the 24 h period, with an average of 90.07%. This substantial decline could be indicative of larger PTFE particles creating more significant voids or channels within the membrane. These voids might facilitate the passage of salt ions through the membrane, especially as the operational time increases, possibly due to particle migration or agglomeration effects. Furthermore, the larger PTFE particles might also be more susceptible to changes in the hydrodynamic conditions of the system, potentially altering the membrane structure over time and thereby reducing its ability to reject salt effectively. The agglomeration of larger particles could further exacerbate this phenomenon, creating localized regions of lower selectivity within the membrane.
These observations accentuate the pivotal role that PTFE particle size plays in the temporal evolution of salt rejection performance in DCMD operations. Smaller PTFE particles appear to confer a more stable and high-performing membrane structure, adept at sustaining high salt rejection rates over extended periods. In contrast, larger PTFE particles are associated with a more pronounced decline in salt rejection, likely due to the creation of less uniform membrane structures and potential particle agglomeration effects. These findings underscore the importance of optimizing PTFE particle size as a key parameter in the design of high-performance membranes for DCMD applications.
Based on the results of the tests, it appears that the 0.5 μm particle size of PTFE provides the best performance in terms of permeate flux, salt rejection rate, nitrogen gas flux, LEP, and contact angle. This can be attributed to the roughness as indicated by the SEM images. The results of the MIP analysis further support this conclusion, as the 0.5 μm particle size was found to have the best average pore size, highest porosity, and lowest tortuosity and tortuosity factor. This combination of high porosity and low tortuosity and tortuosity factor indicates that the 0.5 μm particle size provides the most effective and efficient transport of water and other fluids through the membrane, which is critical in ensuring optimal performance in a DCMD system.
In summary, the results of the tests indicate that the 0.5 μm particle size of PTFE provides the best performance in terms of permeate flux, salt rejection rate, nitrogen gas flux, LEP, and contact angle. This is supported by the MIP analysis, which showed that 0.5 μm had the highest average pore size, highest porosity, and lowest tortuosity. These results suggest that the 0.5 μm particle size is the best choice for the outer layer of the DLHF DCMD PTFE-PES membrane.
3.3. Effect of PTFE Concentration (2 wt%, 4 wt%, and 6 wt%) on Membrane Characteristics
In this section, the ideal particle size (0.5 μm) was used under three different concentrations of 2 wt%, 4 wt%, and 6 wt%. In the same manner as the last section, the surface morphology, contact angle, and DCMD characteristics are measured and elaborated. However, other than the three aforementioned concentrations, a control level of 0 wt% PTFE was used. This membrane contained no PTFE, and it was used as a baseline control experiment.
The SEM results for the concentration are illustrated in three different magnifications in
Figure 10. A cross-sectional magnification at ×300 is first used to assess the overall composure of the DLHF membrane. The next magnification focuses on the cross-sectional view of the hollow fiber, at a ×7000 zoom. This would allow for a better view and understanding of the surface pores and their respective size and cohesion. Finally, a surface morphology is presented at ×500 from the surface, which would enable the cohesion and homogeneity of the membrane, to determine whether the PTFE is mixed properly or whether or not there are any cracks visible.
The cross-section in
Figure 10a,d,g,j indicates that the intensity of the pores increases as the PTFE concentration increases. The images also suggest that there is a slight difference in the structure and uniformity between the 4 wt% and 6 wt% concentrations, with the 6 wt% concentration showing better structure and uniformity. These findings can be attributed to the influence of PTFE concentration on the structure and properties of the PTFE-PES membrane. Higher concentrations of PTFE can result in an increased hydrophobicity of the membrane surface, leading to improved separation efficiency in the DCMD process. The difference between the 4 wt% and 6 wt% concentrations in terms of structure and uniformity of distribution suggests that there may be an optimal PTFE concentration that provides better hydrophobicity. Further studies could investigate the effect of PTFE concentration on the separation efficiency and stability of the PTFE-PES membrane in the DCMD process. Overall, the SEM images of the cross-section of the PTFE-PES membrane with varying PTFE concentrations indicate the importance of PTFE concentration in determining the performance and properties of the membrane. Based on the observations on the cross-section image in
Figure 10k, the 6 wt% has a more cohesive finger-like structure with wide structures when compared to the 0 wt%, while also having gaps within the sponge-like formation observed in
Figure 10j. So, comparatively, it seems that both would excel properly in the correct context. Overall, the SEM images of the cross-section of the PTFE-PES membrane with varying PTFE concentrations indicate the importance of the PTFE concentration in determining the performance and properties of the membrane. Further studies are needed to determine the optimal PTFE concentration for the best performance in the DCMD process. However, as it currently stands, the higher concentration of PTFE is more uniformly dispersed without any visible cracks and deformities.
If cracks and deformities were to be observed in the 6 wt%, then it would be taken out of consideration as a potential membrane, regardless of the results that it would demonstrate in the other characteristics. Since deformed membranes are not able to produce reliable results. The finding of increased PTFE dispersion (concentration) on the surface of the SEM are visible in
Figure 10c,f,i,l; as the PTFE concentration increases from 2 wt% to 6 wt%, there are several implications for the membrane’s performance and properties. (1) Hydrophobicity: The increased PTFE dispersion on the surface can enhance the hydrophobicity of the membrane, making it more resistant to water absorption and leading to improved separation efficiency in the DCMD process. (2) Surface area: The increased PTFE dispersion on the surface can result in a larger surface area for the membrane, which can enhance its ability to reject contaminants and improve its overall performance in the DCMD process. The increased PTFE dispersion on the surface can reduce the surface energy, making it less attractive for contaminants to adhere to the membrane surface, thereby improving its fouling resistance and overall performance in the DCMD process.
Ultimately, the increased PTFE dispersion on the surface of the SEM membrane as the PTFE concentration increases from 2 wt% to 6 wt% has significant implications for the performance and properties of the membrane in the DCMD process. The increased PTFE dispersion can result in improved hydrophobicity, surface area, mechanical strength, and fouling resistance, leading to improved separation efficiency and longevity of the membrane. These images clearly illustrate that the PTFE dispersion increases the surface roughness and becomes more intense as the concentration is increased. A higher degree of surface roughness is an indication of hydrophobicity. Similarly, to the previous processed images, the black regions are indicative of the flat (lower roughness) of the membrane surface, and the white crests indicate a higher degree of surface roughness on the membrane surface.
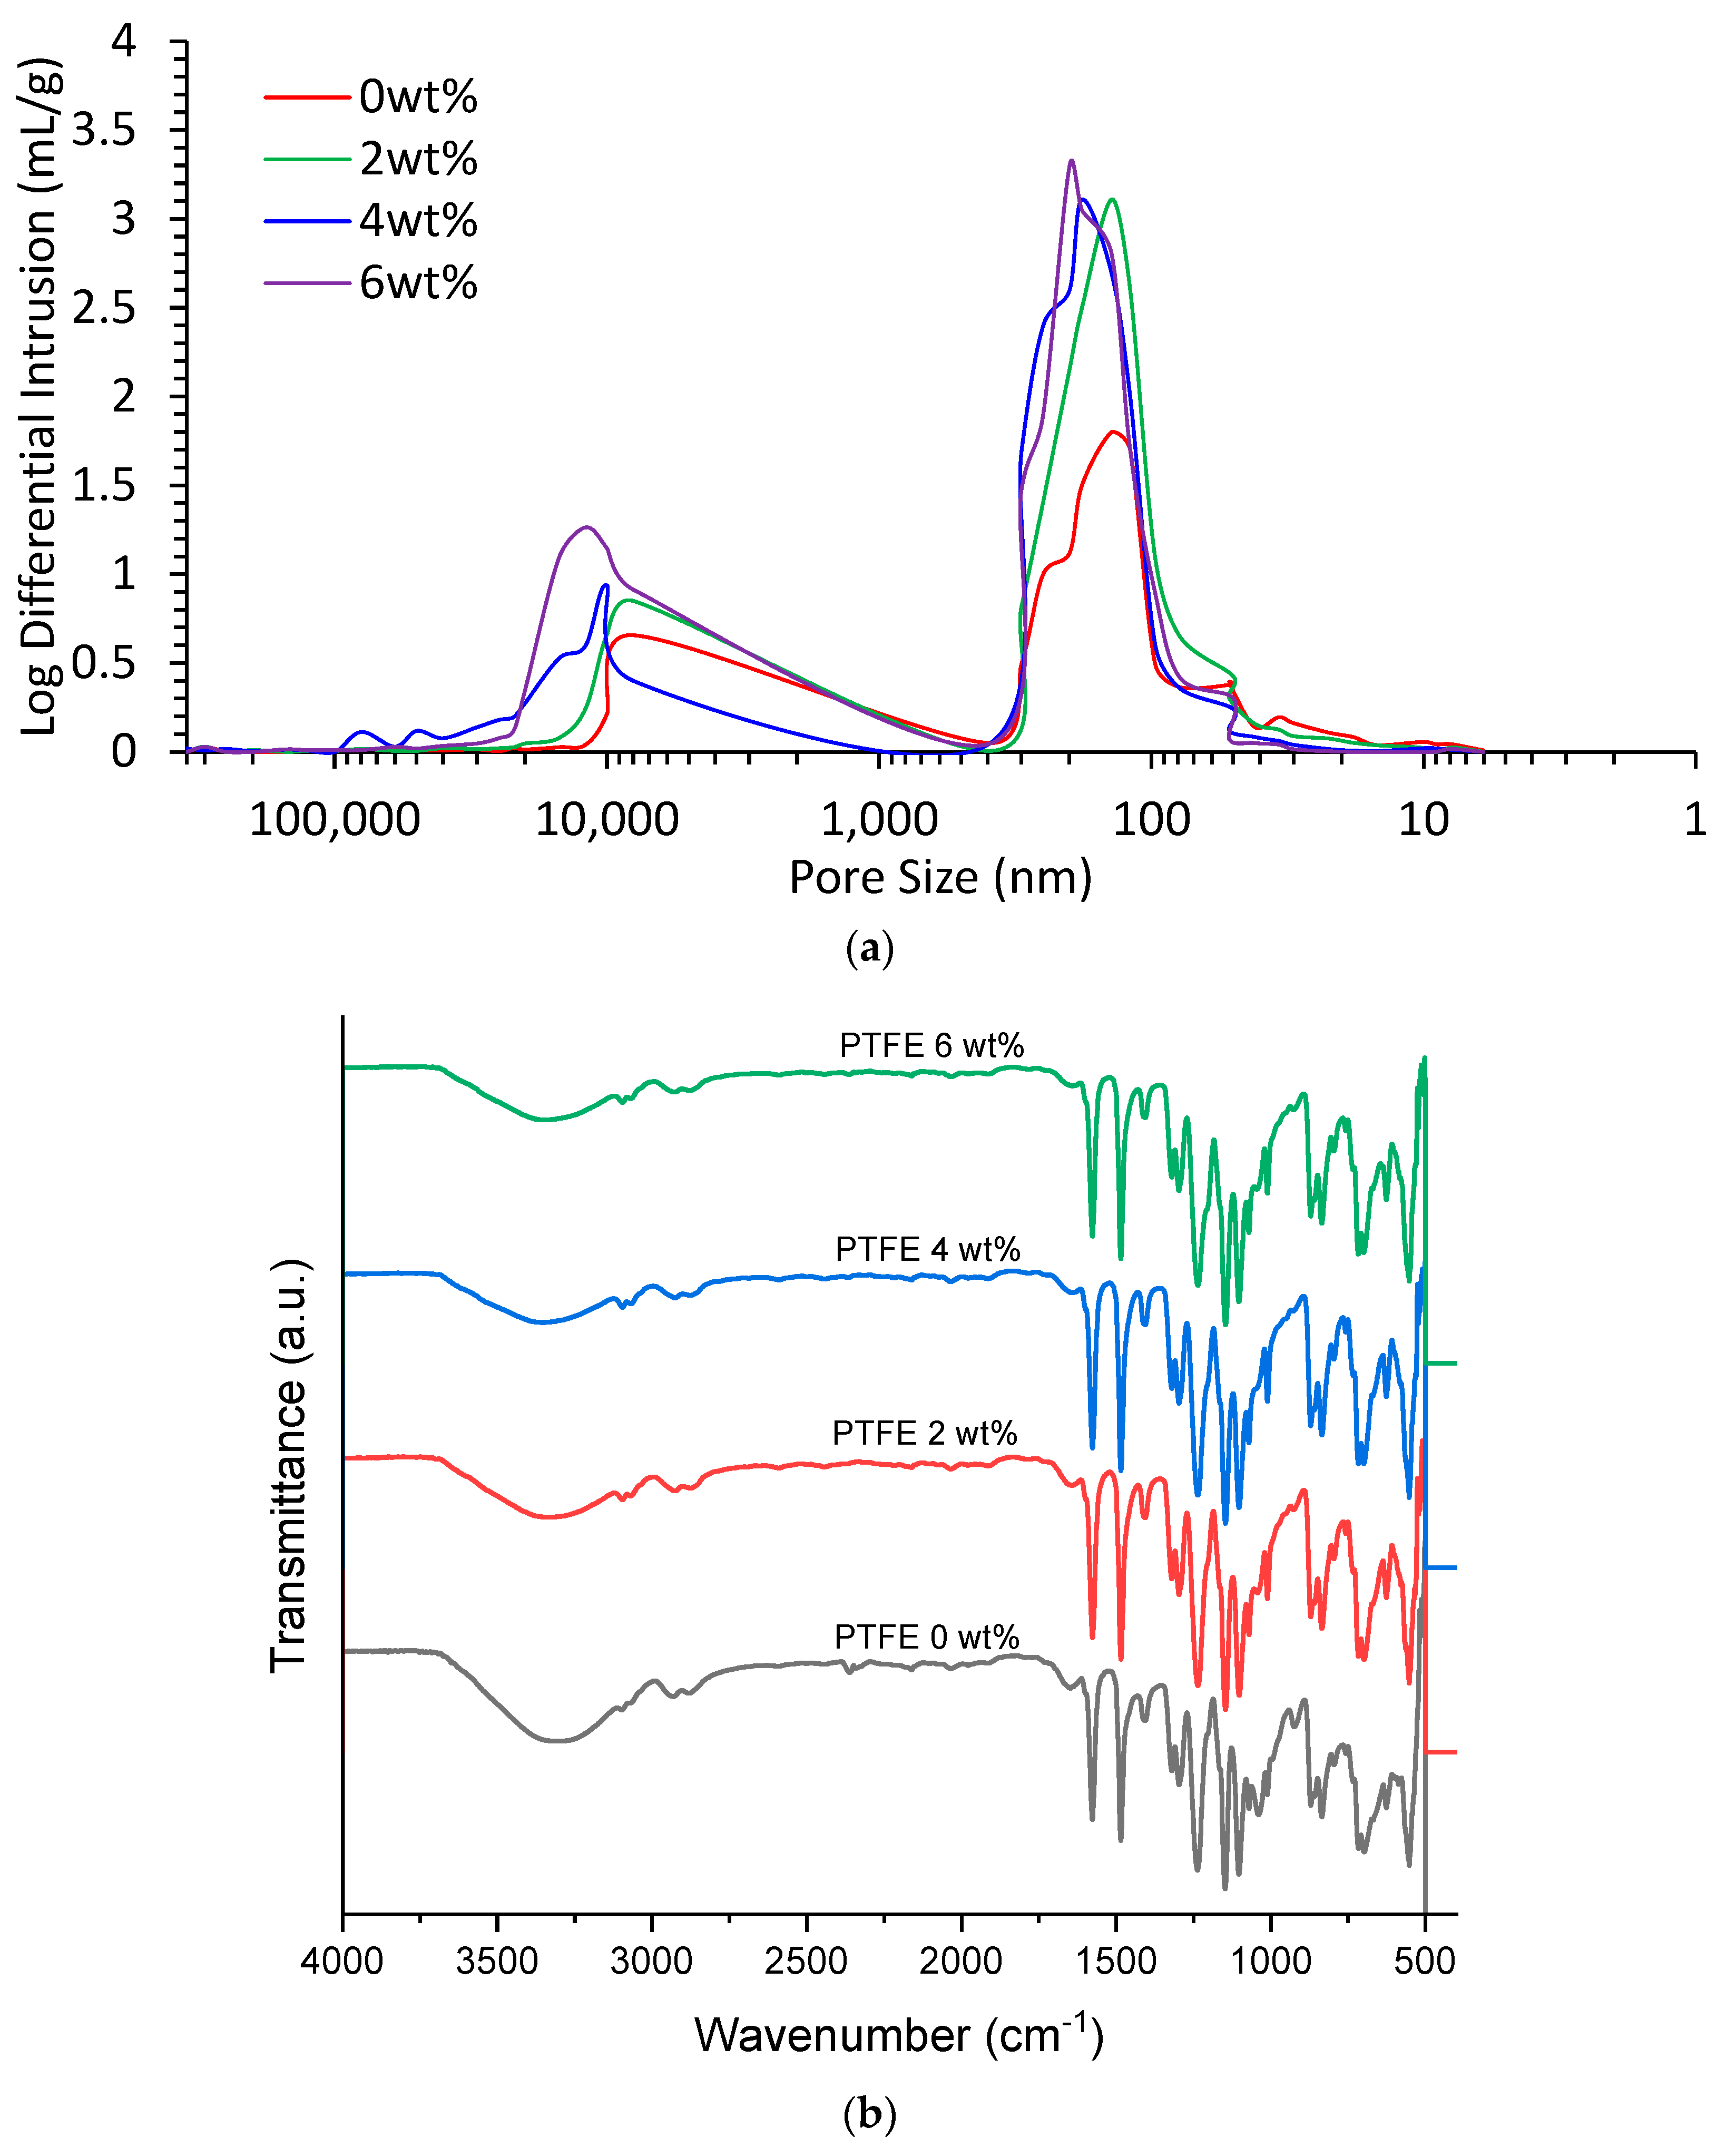
The MIP analysis for the concentrations is illustrated in
Figure 11a. Starting with the pore size, we can see that as the concentration of PTFE increases, the average pore size of the membrane also increases, going from 121.52 nm for 0 wt% PTFE to 224.41 nm for 6 wt% PTFE. This increase in pore size indicates that the pores are becoming larger and more interconnected, potentially leading to improved transport properties of the membrane. The porosity values indicate the proportion of the total volume of the membrane that is composed of void spaces, and we can see that the porosity of the membranes generally increases with increasing PTFE concentration, with a maximum of 66.14% porosity for 6 wt% PTFE. Higher porosity can lead to better transport properties, as it provides more channels for fluid to pass through the membrane.
The tortuosity values indicate the degree to which the fluid path through the membrane is convoluted, with higher tortuosity indicating a more winding and complicated path. We can see that the tortuosity of the membranes decreases with increasing PTFE concentration, with a minimum of 4.59 for 6 wt% PTFE. Lower tortuosity can result in improved transport properties, as it provides a straighter path for fluid to travel through the membrane. In conclusion, the values from the MIP analysis indicate that as the concentration of PTFE in the PES-PTFE dual-layer hollow fiber membranes increases, the average pore size, porosity, and tortuosity of the membranes all improve, potentially leading to improved transport properties for direct contact membrane distillation.
Figure 11a illustrates the logarithmic differential intrusion versus the pore size, which matches the average pore sizes from the MIP results.
The FTIR analysis illustrated in
Figure 11b shows the impact of the different PTFE concentrations (2 wt%, 4 wt%, and 6 wt%) in PES membranes that were investigated, with a PES-only membrane serving as a baseline for comparison. The focus was on understanding the changes in the FTIR spectra and identifying any shifts in characteristic peaks as the PTFE concentration varied. Across all four membranes, notable dips and rises were observed in the FTIR spectra within the wavenumber ranges of 500–1700 cm
−1. Specifically, the majority of rises occurred between 500 and 1000 cm
−1, while most of the dips were observed between 1000 and 1700 cm
−1. These variations in intensity suggest significant changes in the molecular vibrations and functional groups in the membrane structures due to the addition of PTFE.
Interestingly, a distinct “belly-like” dip was observed in the FTIR spectra between the wavenumber ranges of 2700–3700 cm−1 for all membranes. Notably, as the PTFE concentration increased, the size of this dip decreased. This trend implies that the interaction between PTFE and the other membrane constituents may be influencing the molecular vibrations in this specific range. The highest dip in this region was observed in the PES-only membrane (0 wt% PTFE), and the smallest dip was observed in the 6 wt% PTFE-containing membrane. Beyond the range of 3700 cm−1, the FTIR spectra displayed typical behavior for the membranes, suggesting that the overall molecular structure remained relatively unaffected by the variation in PTFE concentration. These findings indicate that the presence of PTFE at different concentrations induces significant changes in the FTIR spectra within the wavenumber ranges of 500–1700 cm−1, particularly affecting the intensity of peaks in the 2700–3700 cm−1 range. The observed trends in the belly-like dip size with increasing PTFE concentration provide valuable insights into the interactions and molecular dynamics of the PES-PTFE membranes.
This FTIR analysis sheds light on the molecular-level changes induced by varying PTFE concentrations in the PES membranes, and the results hold promise for tailoring membrane properties by adjusting PTFE content for specific applications such as direct contact membrane distillation. Further investigations and correlations with performance data will be essential to elucidate the impact of these molecular changes on the overall membrane performance.
Following the morphology, the contact angle analysis is illustrated in
Figure 12. The results of the contact angle test indicate that there is a direct relationship between the PTFE concentration in the membrane and the hydrophobicity of the surface. The higher the concentration of PTFE in the membrane, the more hydrophobic the surface becomes, as indicated by the increasing contact angle values from 0 wt% (74°) to 6 wt% (102°). This increase in hydrophobicity can have a significant impact on the performance of the membrane in DCMD, as a more hydrophobic surface can lead to a lower affinity for water and a lower probability of water droplets forming on the surface, resulting in improved separation performance. Overall, the results suggest that higher PTFE concentrations lead to improved performance in DCMD.
To further illustrate the distribution of the membrane materials, the EDX analysis is used to determine their validity.
Figure 13 illustrates the distribution of such elements on the 6 wt% PTFE concentration. Only one concertation was measured for the EDX analysis, the purpose behind this selection is mainly due to the limitations of the EDX analysis. The EDX technique can be limited in its ability to detect and accurately measure the elemental composition of a sample. Therefore, the 6 wt% is used as the sample that represents the overall membrane composition and structure. The goal is to observe whether the elements are dispersed properly, and in this instance, based on the observations made in
Figure 13, fluoride is present due to the existence of the PTFE in the membrane. PEG and PES are also primarily reactive with oxygen, and therefore the element of oxygen is observed throughout the entire membrane as it is present in both inner and outer layers.
The results of an EDX analysis on the DLHF DCMD PTFE-PES membrane indicate that the membrane is composed of two layers, with both oxygen and fluorine present in the membrane. The presence of oxygen in both the inner and outer layers of the membrane indicates that it is a component of the PES, which is a hydrophilic polymer that provides structural stability to the membrane. The presence of fluoride only in the outer layer suggests that it is a component of PTFE, which is a hydrophobic polymer that enhances the performance of the membrane in the DCMD process. The presence of PTFE in the outer layer provides a hydrophobic surface that enhances the separation efficiency of the membrane in the DCMD process. The combination of these two polymers in the DLHF DCMD PTFE-PES membrane provides a highly effective system for the separation of contaminants from liquids. The EDX analysis results of the DLHF DCMD PTFE-PES membrane provide important information about the composition and structure of the membrane. The presence of both PES and PTFE in the membrane ensures that it has the necessary properties to perform effectively in the DCMD process. The combination of these two polymers provides a membrane with a hydrophilic inner layer and a hydrophobic outer layer, which enhances its separation efficiency and prevents fouling.
The results of the AFM analysis (illustrated in
Figure 14) show a clear difference in the roughness of the membrane surface with and without PTFE. A higher roughness value can indicate an irregular surface, which can have several implications for the performance of the membrane in DCMD. In this case, the result indicates that the addition of 6 wt% PTFE leads to a significantly higher roughness value. This suggests that the addition of PTFE to the membrane surface leads to improved separation performance. Therefore, careful consideration of the trade-off between these two factors is important when choosing the optimal PTFE concentration for a particular application.
Similar to the EDX analysis, only the 6 wt% is used as the comparison to the baseline of 0 wt% to show the average roughness and how it has been increased via the application of the PTFE. Also, the topographical images from the SEM surface morphology illustrated that the 6 wt% had the rougher surface; however, its value (at the time) was unknown. With the aid of AFM, the roughness value and its enhancement are now more apparent.
The LEP of the PTFE-PES membrane illustrated in
Figure 15a, shows that there is an increase as the PTFE concentration increases from 0 wt% to 2 wt% and from 2 wt% to 4 wt%. The LEP reaches its maximum value of 2.46 Bar at 6 wt% concentration. However, there is a slight decrease in the LEP value when the PTFE concentration is at 4 wt%. This result indicates that there is a relationship between the PTFE concentration and the LEP value, where the LEP value increases with increasing PTFE concentration up to a certain point and then starts to slow down, meaning there are diminishing returns in regard to the improvement over the concentration. This suggests that the proper PTFE concentration needs to be carefully selected to balance the hydrophobicity and the mechanical stability of the membrane.
The nitrogen gas flux of the PTFE-PES membrane for DCMD with an increasing PTFE concentration shows a significant increase, as illustrated in
Figure 15b. The flux rate goes from 1.3 × 10
4 L/m
2·h (0 wt%) to 5.8 × 10
4 L/m
2·h (2 wt%), 87.76 × 10
4 L/m
2·h (4 wt%), and 11.56 × 10
4 L/m
2·h (6 wt%). This indicates that as the concentration of PTFE in the membrane increases, the ability of the membrane to allow the passage of gas (in this case nitrogen) also increases. The highest nitrogen gas flux rate was observed in the 6 wt% PTFE concentration. This suggests that PTFE has a positive impact on the permeability of gases through the membrane. However, it is important to consider the effect of increased PTFE concentration on the other performance parameters, such as the salt rejection and liquid entry pressure, to evaluate the overall performance of the membrane.
3.4. Effect of PTFE Concentration (2 wt%, 4 wt%, and 6 wt%) on DCMD Performance
The membrane performance of the different concentrations is calculated through permeate flux and salt rejection. The data illustrated in
Figure 16 show that the increasing PTFE concentration from 0 wt% to 6 wt% in the PTFE-PES DCMD membrane leads to an increase in both the water permeate flux and the salt rejection rate.
At 0 wt% PTFE concentration—the control condition—the initial salt rejection was observed to be 97.10%, decreasing to 83.30% by the 24 h mark, with an average of 90.01%. The permeate flux demonstrated a substantial decline, starting at 5.4 L/m2·h and ending at 2.5 L/m2·h, with an average of 4.38 L/m2·h over the 24 h period. Without PTFE, the membrane may lack sufficient hydrophobicity, which is essential to prevent wetting and maintain salt rejection. The absence of PTFE likely results in a membrane with larger, more irregular pore structures, leading to increased salt passage.
Introducing 2 wt% PTFE led to significant improvements. Salt rejection started at 99.99%, and remained elevated at 99.00% after 24 h, with an average of 99.04%. The permeate flux remained relatively constant, beginning at 10.1 L/m2·h, concluding at 8.4 L/m2·h, and averaging 8.95 L/m2·h over the 24 h period. At this concentration, PTFE likely begins to impart its inherent hydrophobicity to the membrane. This could enhance the membrane’s ability to repel water, thereby preserving high salt rejection rates. The PTFE particles may also start to influence the pore size and morphology of the membrane, potentially leading to smaller, more uniform pores, which are instrumental in maintaining the selective separation of salts.
At 4 wt% and 6 wt% PTFE concentrations, this trend of enhanced performance continued. The initial permeate fluxes were 11.8 L/m2·h and 12.5 L/m2·h, and the final permeate fluxes were 9.4 L/m2·h and 10.3 L/m2·h, with averages of 10.35 L/m2·h and 11.39 L/m2·h, respectively. The corresponding salt rejection values commenced at 99.99%, concluding at 99.40% and 99.60% after 24 h, with averages of 99.53% and 99.84%, respectively. At these concentrations, PTFE’s molecular structure, characterized by high molecular packing and low free volume, likely contributes to the formation of small, uniform pores in the membrane. These concentrations may represent a threshold where the PTFE forms a coherent, interlocking network within the membrane matrix, thereby maximizing both hydrophobicity and structural integrity.
In particular, the 6 wt% PTFE concentration appears to strike a balance, producing a robust water permeate flux and a superior salt rejection rate. This is indicative of an optimal hydrophobic-hydrophilic balance, achieved perhaps by the formation of a highly effective interlocking network of PTFE particles within the membrane. This structure likely creates a barrier that is selective against salt ions while maintaining a stable water flux. It suggests an optimal PTFE concentration where the hydrophobicity is maximized without compromising the permeability of the membrane.
3.5. Benchmarking with the Literature
The given data summarized in
Table 3 show the results of tests performed on a PTFE-PES membrane for DCMD. Four different PTFE concentrations (0 wt%, 2 wt%, 4 wt%, and 6 wt%) were tested. The results show changes in the liquid entry pressure (LEP), nitrogen gas flux, water permeate flux, salt rejection, and SEM, as the PTFE concentration increases. Based on the results, it can be concluded that increasing the PTFE concentration improves the performance of the membrane in terms of LEP, nitrogen gas flux, and salt rejection. The permeate flux also increases with increasing PTFE concentration, although the difference between 4 wt% and 6 wt% is not significant.
In DLHF membranes for DCMD applications, the membrane’s average thickness, derived from the incorporation of PTFE particles within a PES matrix, critically impacts performance metrics. The data reveal an interrelation where increased PTFE concentrations, especially with smaller particle sizes, correlate with membrane thickness variations. Specifically, higher PTFE concentrations and smaller particle sizes tend to produce thinner membranes, suggesting superior particle dispersion within the matrix. This thickness variability, described as ‘average’, may indicate fabrication inconsistencies or particle dispersion heterogeneity. Notably, membranes with greater thickness, influenced by higher PTFE concentrations, demonstrate enhanced salt rejection rates and flux, presumably due to associated structural and morphological changes such as increased porosity and reduced tortuosity. Thus, the integration of PTFE within the PES structure, evidenced by thickness variations, plays a consequential role in the membrane’s operational characteristics.
Table 4 illustrates a list of other existing membranes from the literature review that each used a variety of DCMD techniques. Comparatively, this work, alongside a PVDF hollow fiber incorporated with calcium carbonate, seems to have the highest value for the LEP, with also the second-best average pore size. However, it seems that the proposed technique has a relatively low contact angle. This is indicative that the proposed PTFE technique requires additional treatment or the inclusion of another material, such as a nanoparticle, in order to push the membrane toward superhydrophobic levels. A superhydrophobic level is denoted when the contact angle exceeds 158 degrees. However, it should be noted that the condition under which most of these membranes were conducted is not the same. For instance, the existing PTFE membranes that use polypropylene (PP) or polyethyleneterphthalate (PET) or high-density polyethylene (HDPE) as an incorporated material are tested under a higher feed temperature of 80°, which, based on the given research, has a positive effect on some of the membrane’s characteristics such as the LEP.
However, an interesting observation is that in the previous literature, using a flat sheet, it seems that a higher pore size resulted in a higher contact angle. Although each of the materials used was from a different manufacturer; therefore, a direct comparison cannot be made between the membranes. But it is clear that the membrane structure plays a critical role in the effectiveness of the membrane. Naturally, with the use of flat sheets, it seems that the geometrical design of the support layer of the membrane is also impactful on the membrane’s permeate flux. Across the different factors, it seems that on an overall note, the membranes with an average pore size lower than 0.5 μm had a better result in terms of performance. Ultimately, for a successful DCMD operation, a combination of the LEP, contact angle, pore size distribution and structure, and type of support material used are the main characteristics that affect performance. Therefore, it can be concluded that the proposed method was successful in its attempt; however, further studies are needed in order to enhance the hydrophobicity further, as it seems that in a PTFE-PES combination scenario, this is the maximum level that it can attain.
4. Conclusions
This research aimed at studying the effect of particle size and concentration of polytetrafluoroethylene (PTFE) on the development of hydrophobic/hydrophilic dual-layer membranes for direct contact membrane distillation, and it was a success. The results of the SEM, LEP, contact angle, permeate flux, nitrogen gas flux, and salt rejection rate analyses showed that the 0.5 μm particle size of PTFE had the highest nitrogen gas flux as well as the highest LEP. The contact angle was also the highest when compared to the other particles with the lowest degree of variation, which would indicate the stability of the results. Additionally, the permeate flux and salt rejection were substantially different. While the other membranes boast 6.1 kg·m2/h and 6.5 kg·m2/h permeate fluxes for 6–9 μm and 1 μm, respectively, the 0.5 μm had a permeate flux of 8.4 kg·m2/h. However, the most important value is that of the salt rejection, which changed dramatically. While the other two particle sizes hovered between 95% and 97% salt rejection, the 0.5 μm had an almost perfect salt rejection rate of 99.7%. This would indicate that the 0.5 μm was the optimal size for the membrane’s outer layer. This particle size provided the best performance in all of the membrane characteristics analyzed.
After using 0.5 μm as the baseline, the study went on to test different concentrations of PTFE, ranging from 0 wt% to 6 wt%. The results of the SEM, LEP, contact angle, MIP, permeate flux, nitrogen gas flux, and salt rejection analyses showed that the 6 wt% concentration of PTFE was the best. The SEM indicated the condition of the membranes and their surface. This was further validated through other values such as the LEP (2.46 Bar) and contact angle (102°), which was able to break through 100°. The values attributed to the MIP also reiterated the same message via the average pore size of 224.41 nm (highest among all other samples) and tortuosity of 4.59 (lowest among the measured samples).
The results of this study have important implications for the development of hydrophobic/hydrophilic dual-layer membranes for direct contact membrane distillation. The findings show that the particle size and concentration of PTFE play a crucial role in determining the performance of the membrane. By optimizing these parameters, the membranes can be designed to have improved performance, which could have significant implications for various applications, such as water purification and energy storage. The best DCMD performance was attributed to the flux (both permeate and nitrogen gas) as well as salt rejection. Several of the variables mentioned in this study were the ultimate factors that led to the change attributed to a higher salt rejection.
In conclusion, this study not only advances our understanding of membrane optimization in DCMD but also offers a pathway toward more sustainable and efficient water and energy management, thereby contributing to the global effort to address water scarcity and reduce energy consumption.


 ,
, 


