1. Introduction
The penetration of nonlinear loads, inverter-based generation and storage have brought much complexity to the conventional power grid model [
1]. The advancement of technology and the existence of aggregates, such as microgrids, have contributed to this complexity. The trends and regulations to reduce greenhouse gas (GHG) emissions by electrification of heating and transportation will increase demand on the electric power grid. Additionally, goals are set to achieve net-zero emission by 2050 [
2]. In this complicated formula, grid resiliency and reliability become harder to maintain from both engineering and economic aspects. The combination of outdated grid assets, severe weather events, and increasing power demand poses a threat to the reliability and resiliency of the utility grid [
3,
4].
In recent years, there has been much interest in microgrid development, where a group of localized sources and loads interconnect and interact either autonomously or synchronously with the power grid. Microgrids can provide energy independence for the loads that are primarily supplied by their local network. Reducing GHG emissions through electrification will increase the demand on the existing power grid. In turn, this increased demand will also make the grid even more unreliable than it currently is, especially as more renewable sources are integrated into the infrastructure. These factors provide an opportunity for carefully planned and developed microgrids to offset the increased demand and create a more reliable source. A paradigm shift in power systems planning and operation will emerge, but there should be proactive measures in place to deal with such a change [
5].
University campuses serve large populations and are vibrant and dynamic places and are vital to the life of their surrounding communities. A university campus’s power consumption model is, therefore, of significant importance. Gaining an understanding of consumption patterns on a campus is of interest and this may lead to insight into how to create change, considering the shift in power systems planning and operation. The desired insight can also help with addressing resilience in power distribution and outlining action items for the development of a probable campus microgrid including cleaner energy resources. A review and study of the energy consumption of a campus is a prerequisite to develop models to make the campus more energy sustainable, to develop designs for campus microgrids, and to improve energy monitoring systems. These types of studies have been performed for other universities [
6,
7,
8,
9]. High-quality reviews and studies of energy consumption have been completed for other campuses [
10,
11], but these campuses have different climates and urban settings.
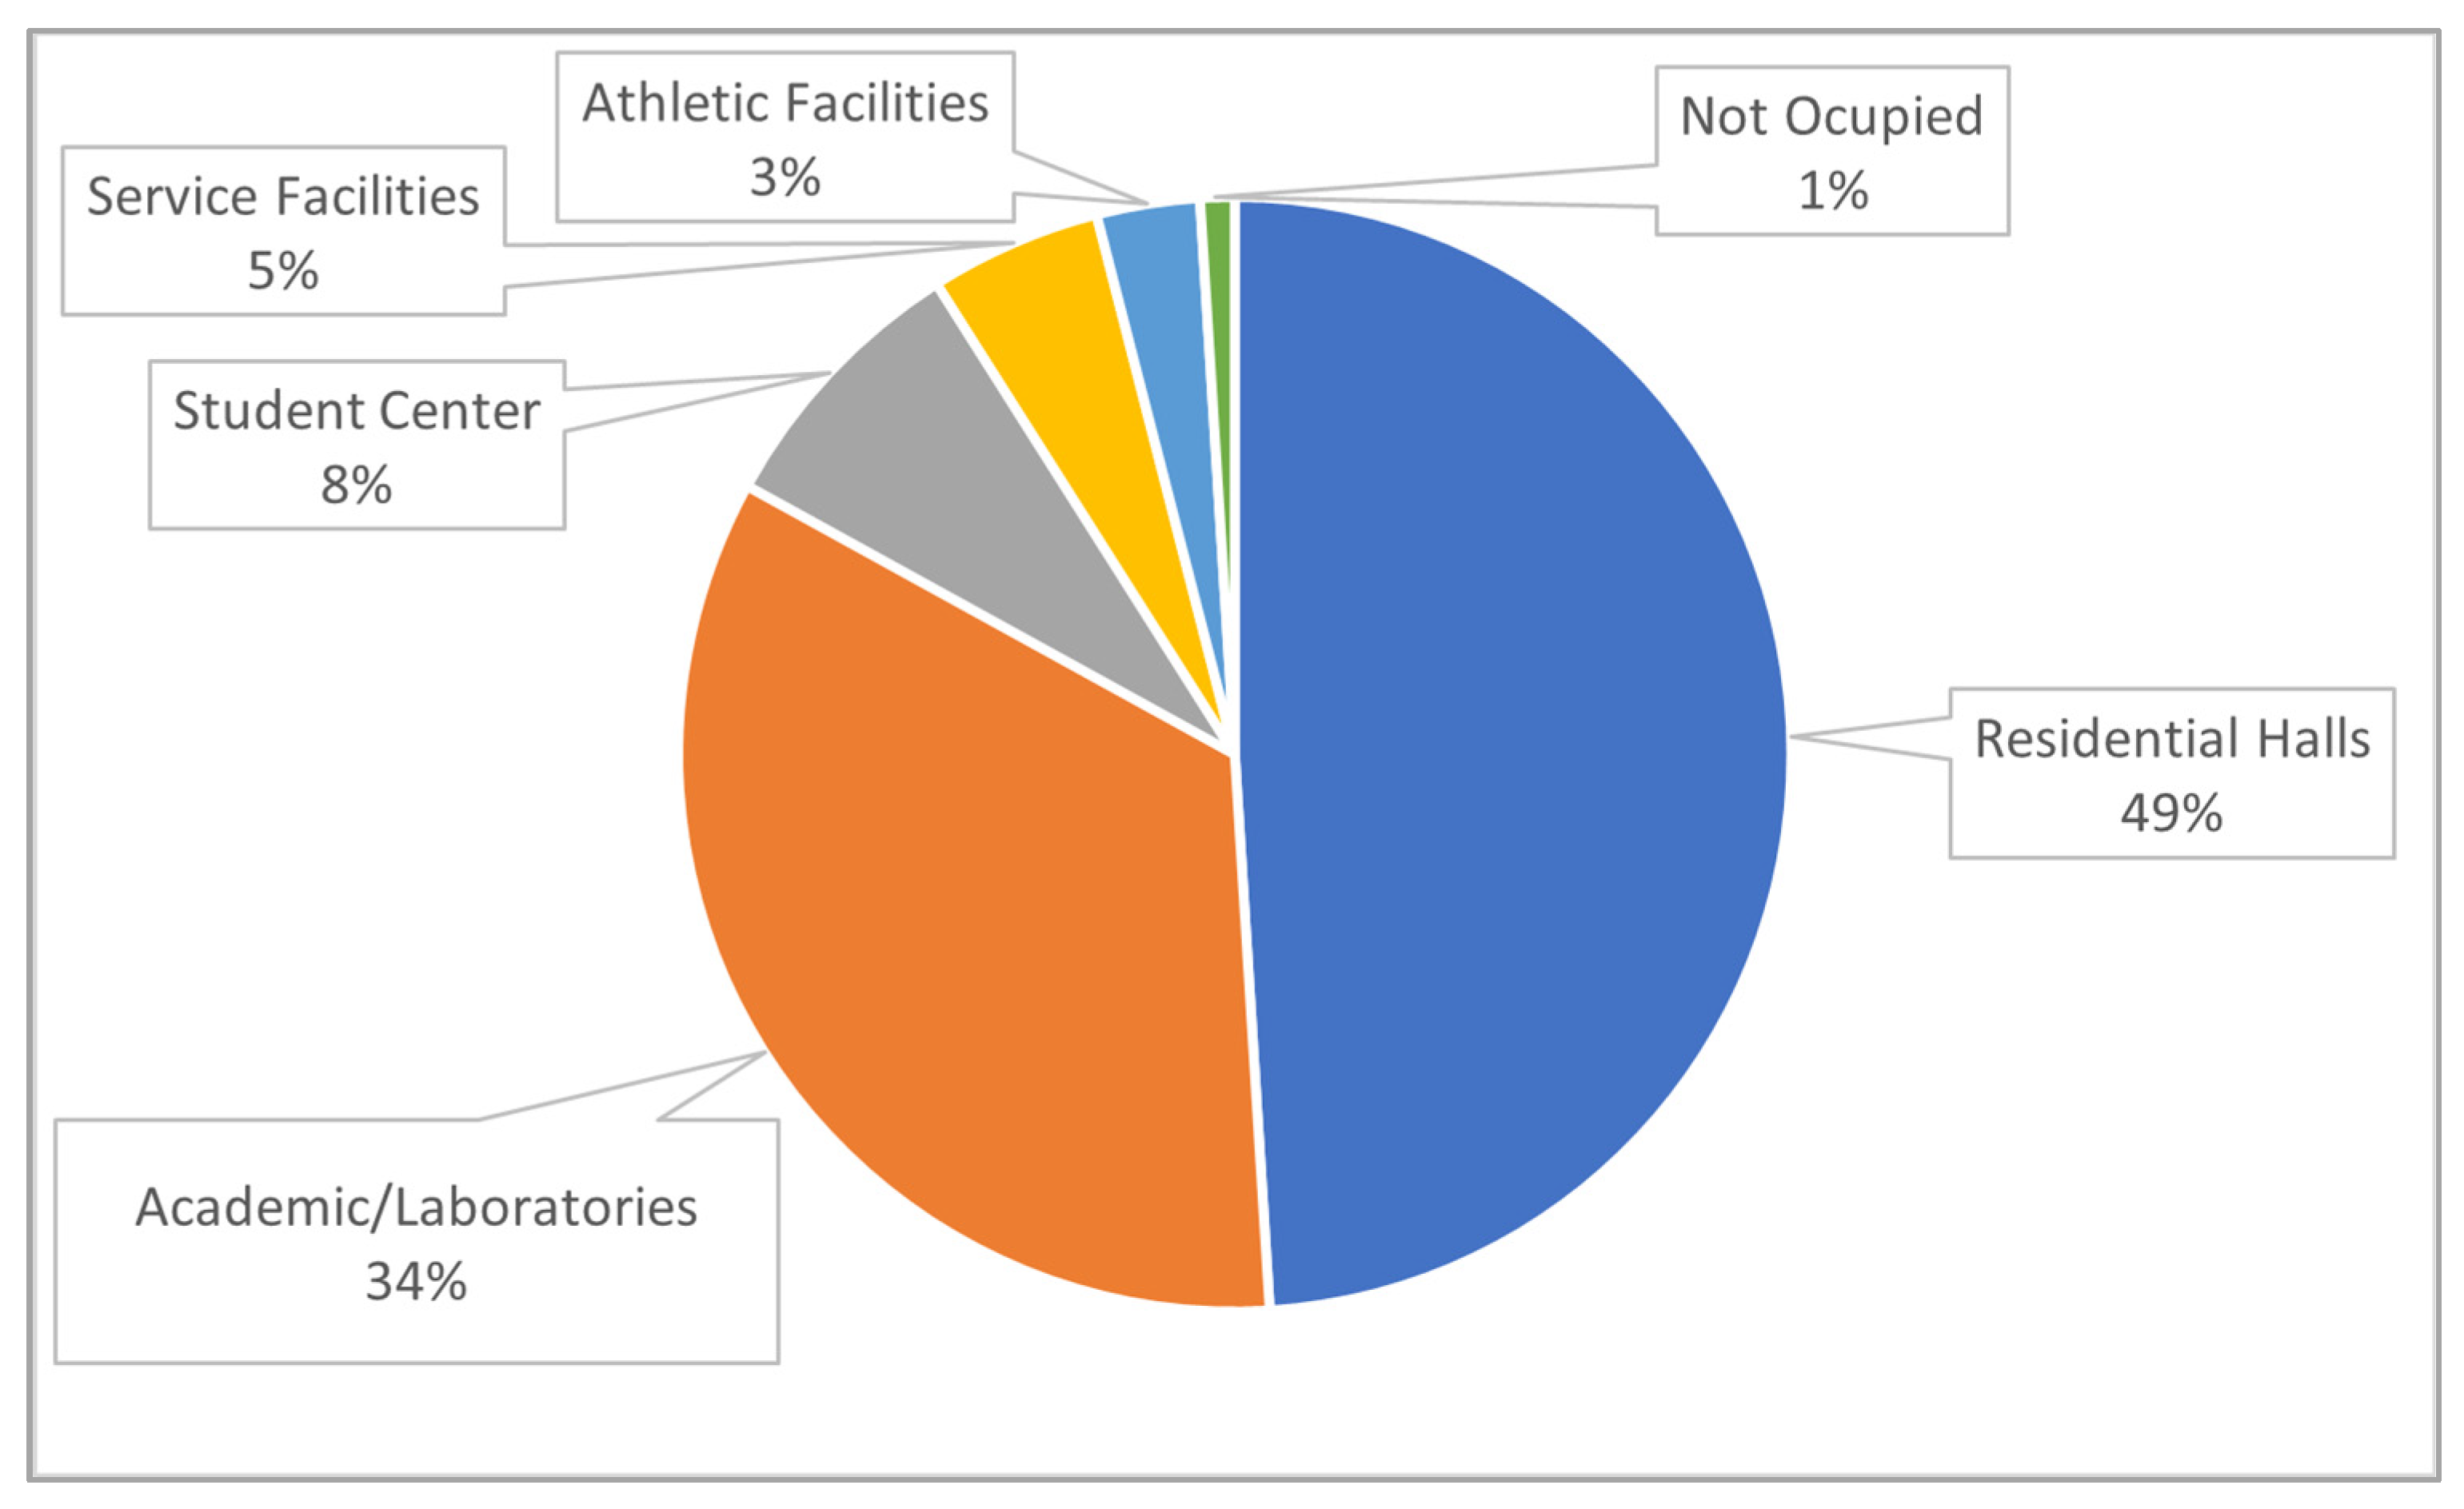
The Wentworth Institute of Technology is an urban campus in Boston, Massachusetts, USA. The campus has experienced over a century of historical changes, challenges, and improvements. It currently consists of 21 buildings utilized as administrative and academic offices, a library, classrooms, laboratories, service facilities, residential halls, and athletic/recreational activities. The categorization of Wentworth buildings based on their Gross Square Meters is shown in
Figure 1.
One aspect about the campus is that the buildings are a combination of old and new, or traditional and modern architecture. The electric-power-consumption characteristics of these buildings reflect their campus roles such as administrative, classrooms, or residentials. Wentworth buildings were constructed between 1899 (Collins Hall) and 2018 (Center for Engineering, Innovation and Science, CEIS). Some of the campus’s historical and well-known buildings such as Wentworth Hall, Dobbs Hall, Watson Hall, Williston Hall, Rubenstein Hall, and Willson Hall belong to the 1910 to 1927 era and the dawn of the 20th century, whereas buildings such as Beatty Hall and the Nelson Recreation Center reflect the construction around 1970. On the other side of the spectrum, there are two residential buildings as well as the CEIS building that are associated with the beginning of the 21st century. With this wide range spanning over a century for campus construction, the Wentworth buildings do have diversity in their patterns of energy consumption and efficiency.
Wentworth has committed to Leadership in Energy and Environmental Design (LEED) Silver Equivalent standards on all major construction projects since 2005. As of 2023, approximately 25% of the campus buildings (by floor area) satisfy the LEED criteria. In 2020, the Wentworth Institute of Technology participated in the inaugural EPA ENERGY STAR Higher Education Benchmarking Initiative (HEBI) to monitor campus energy and water performance in comparison with peer institutions, which may lead to actionable insights. “Metrics submitted by participants were analyzed to create peer groups based on participation distribution, industry interests, and trends in median energy and water use intensities” [
12].
Wentworth’s primary energy source for heating is currently natural gas with co-generation of electricity that supplies a sizable portion of the campus’s electrical load. Recently installed roof solar panels also contribute to the campus’s electrical supply, but still only make up ≤1% of the campus’s aggregated load. The remainder of the campus’s electrical load is supplied by the power grid. In addition to its primary sources, the campus has back-up diesel generators for critical power supply during outages [
13].
The purpose of this study has been to determine, characterize, and analyze patterns of energy consumption within the university campus. The consumption relations of interest include (a) across building use, (b) across daily cycles, (c) across weekly (workday, weekend) cycles, and (d) across the academic calendar. Conducting such studies on a specific campus, such as the Wentworth Institute of Technology, will provide insightful information to other universities and commercial campuses toward energy usage improvement and efficiency.
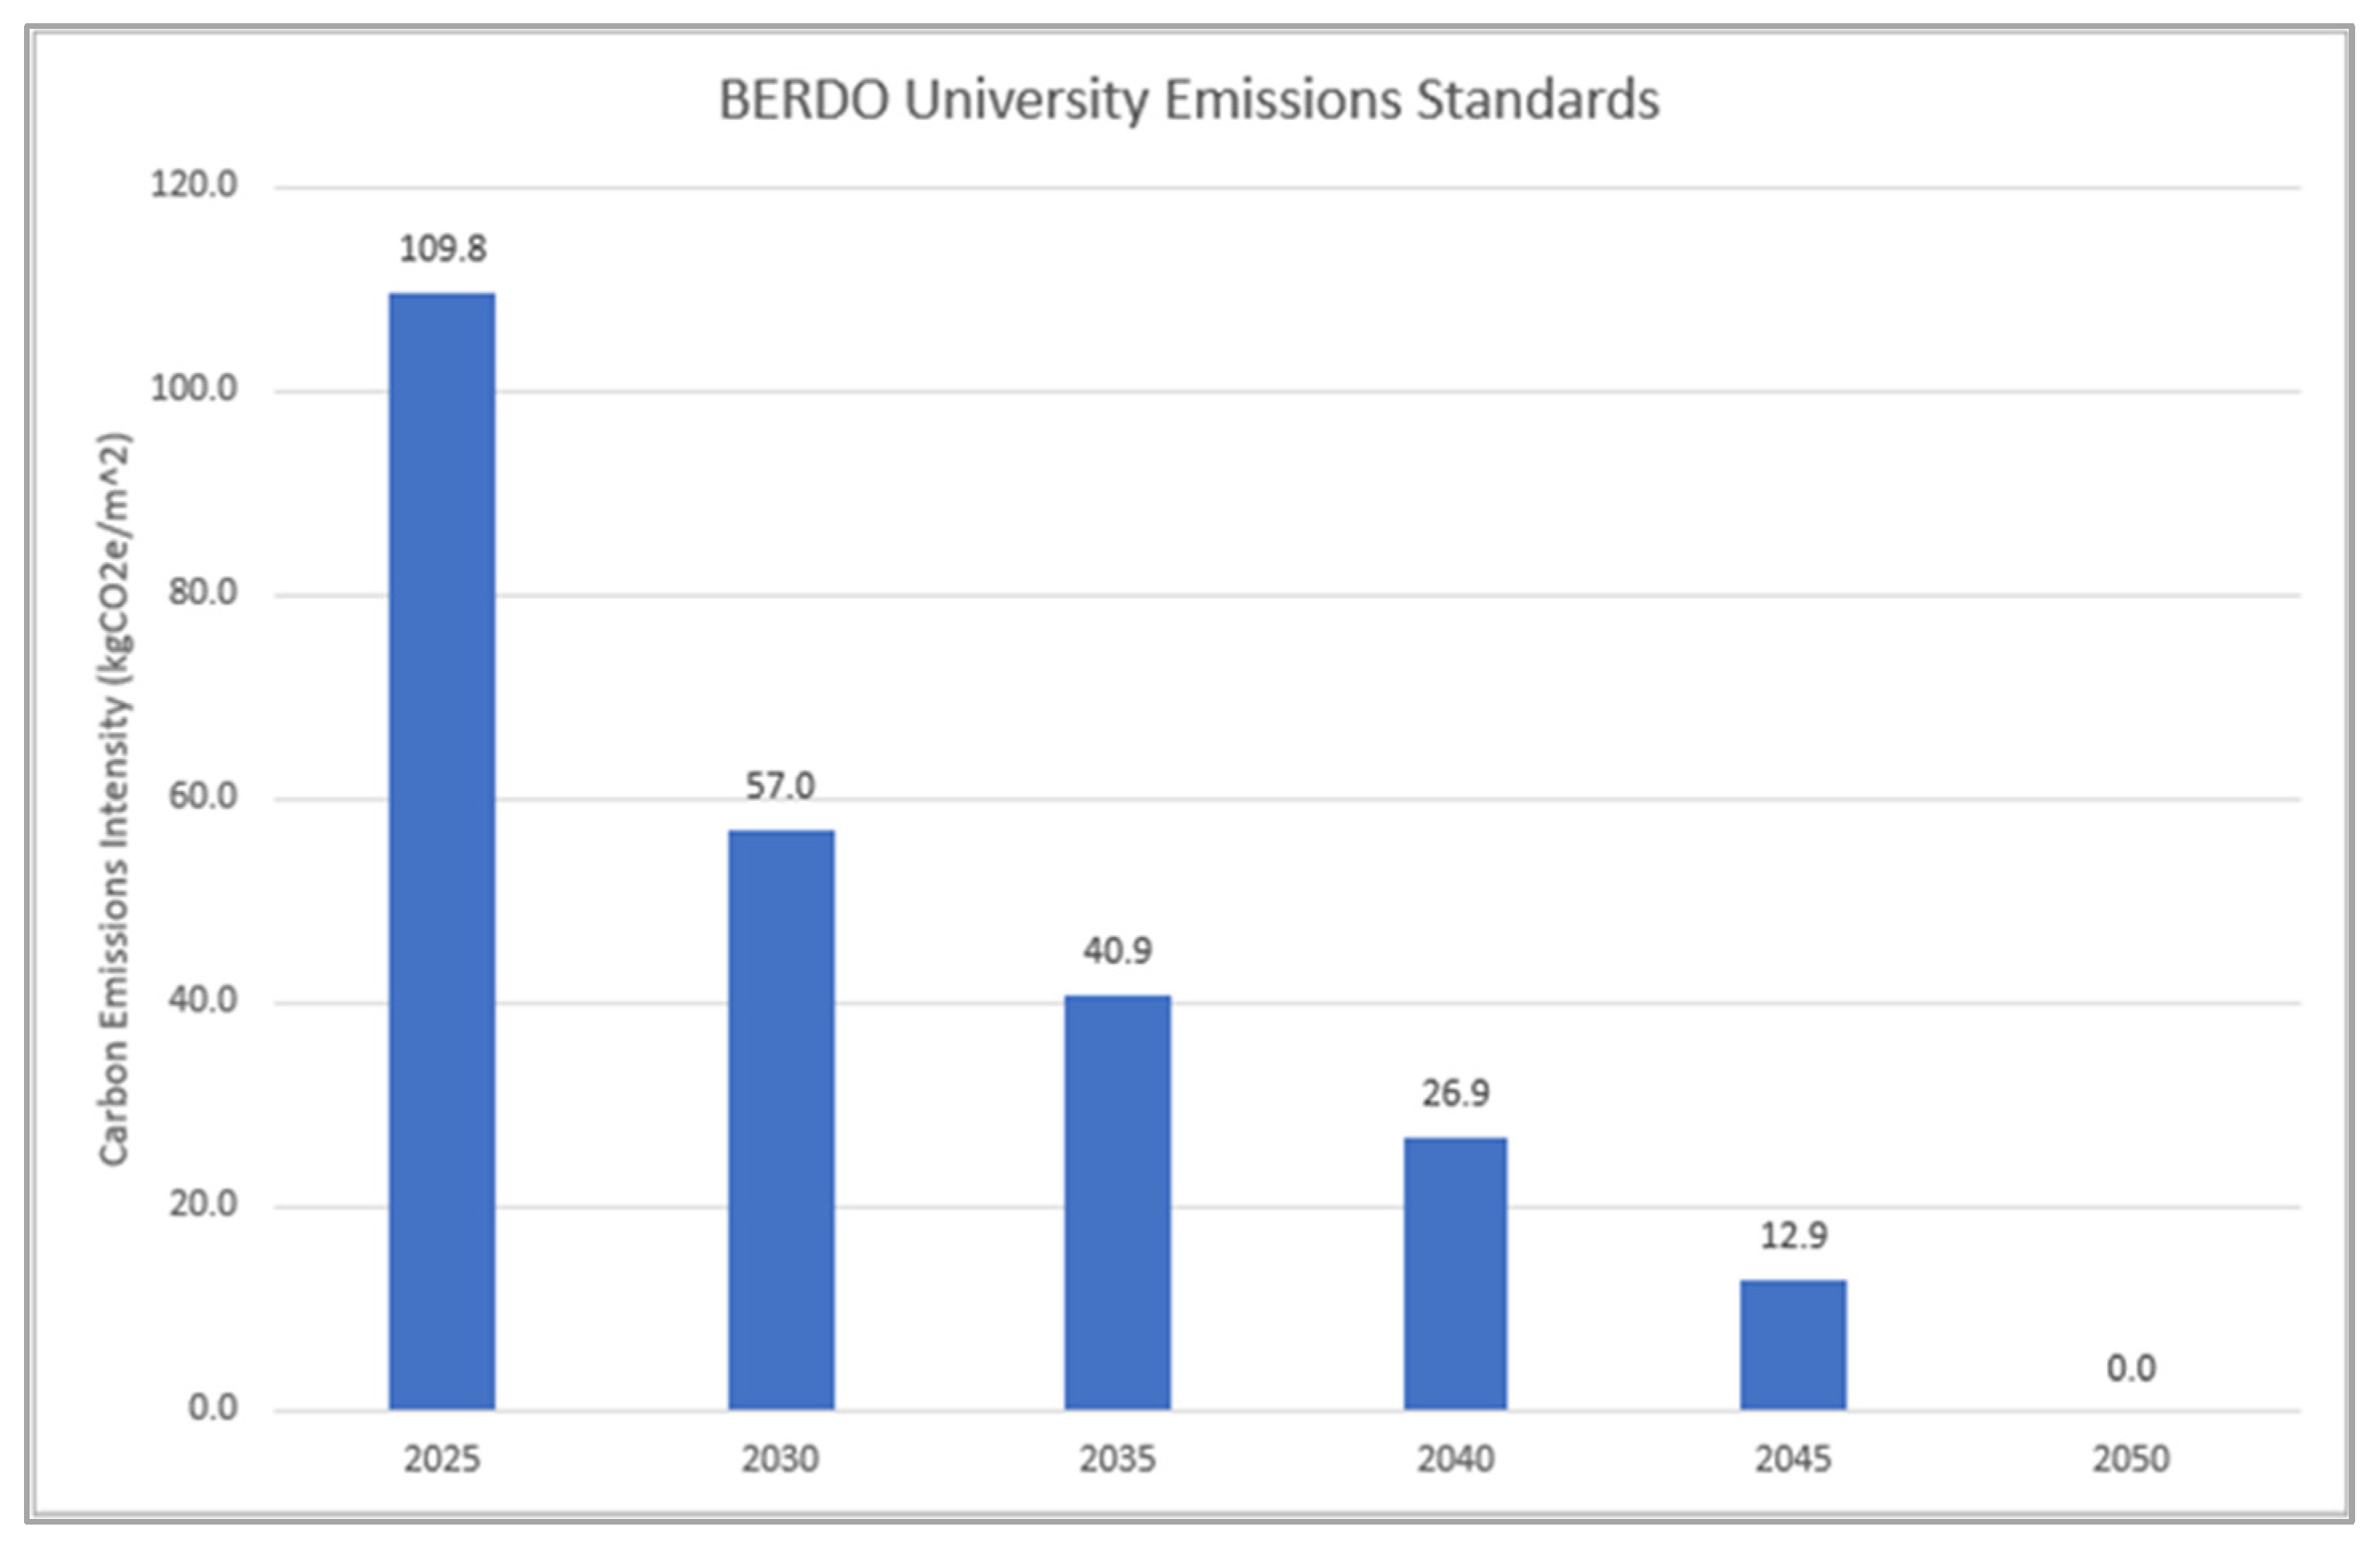
An understanding of the campus’s electrical supply and load could lead to future structural modifications, additional renewable energy generation, energy storage, and power system management toward a reduction in GHG emissions, net-zero targets, and the formation of a campus or community microgrid. The city of Boston’s carbon standard performance is shown in
Figure 2 and
Figure 3.
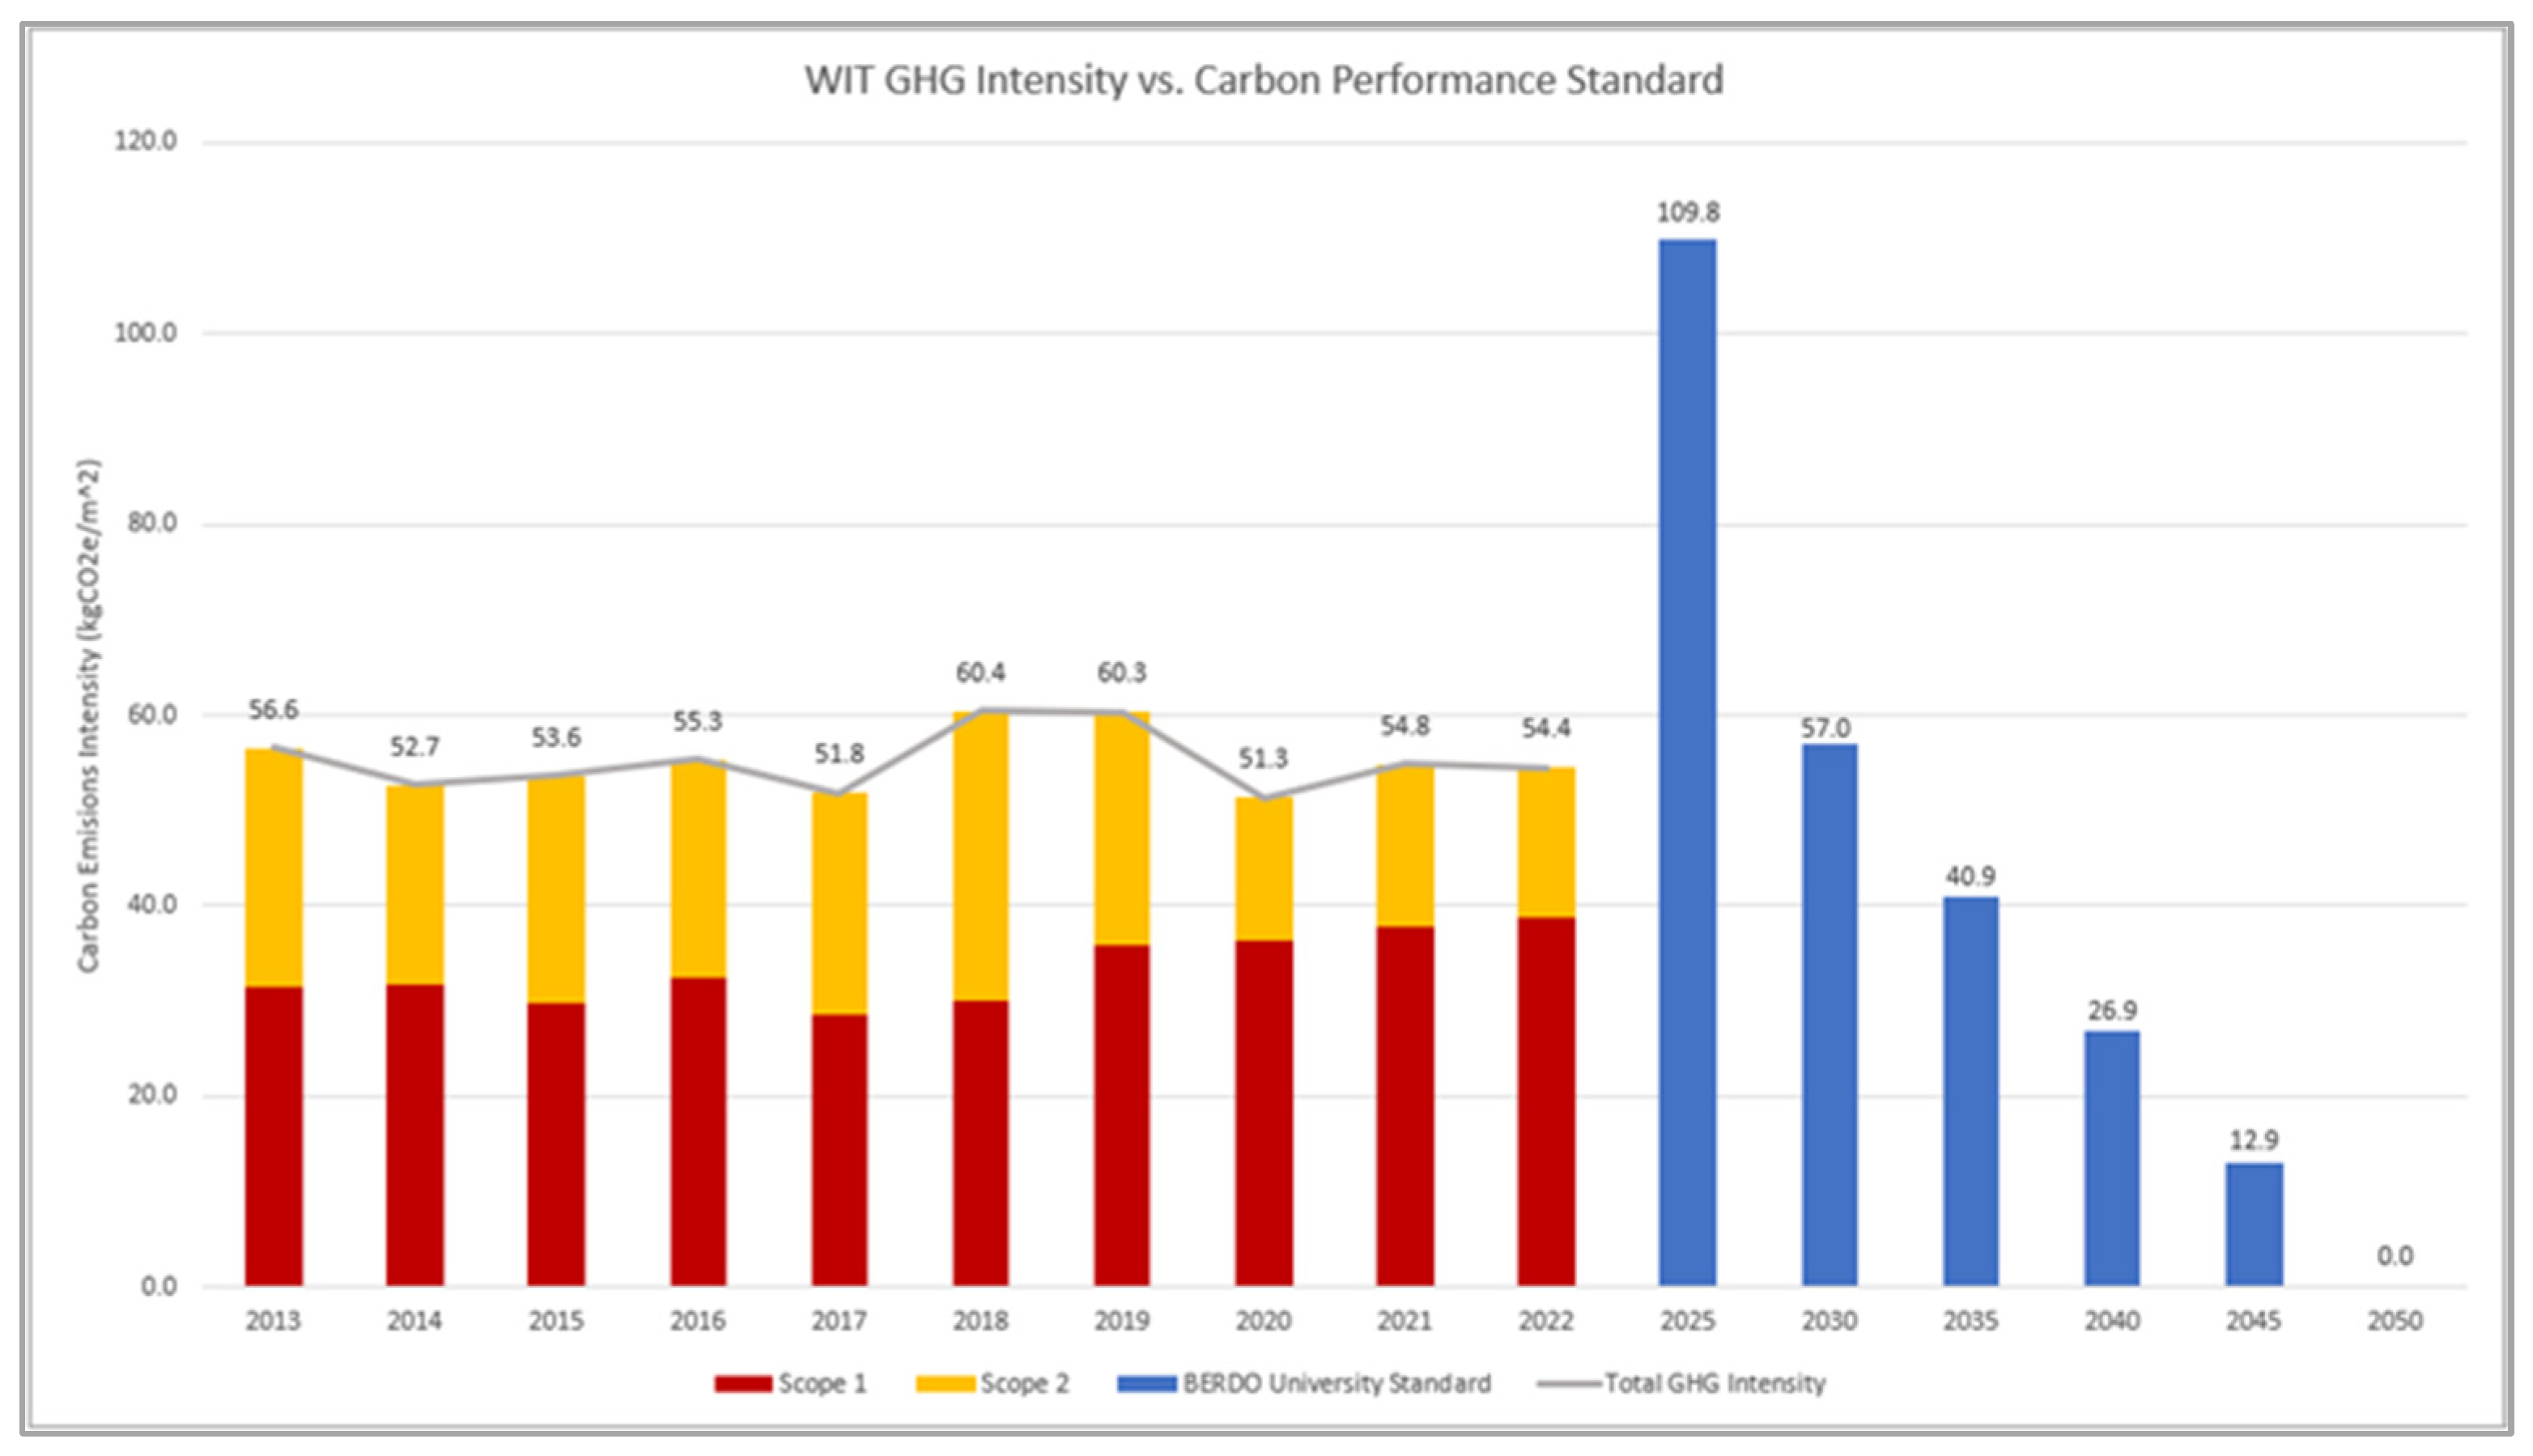
Additionally, Wentworth’s estimated carbon intensity per square foot is shown in
Figure 3. The university’s carbon dioxide equivalent per meter square (
) has stayed almost constant with small fluctuations from
calculated for the year 2013 to
calculated for the year 2020. Although the university’s performance indicator is far below the city of Boston’s guidelines of
for the year 2025, the university needs to improve to meet regulatory targets after 2030.
To become compliant with the city of Boston’s
threshold set for the year 2045, the university should decrease its carbon footprint almost exponentially [
14,
15]. Additionally, this exponential improvement trend should be established in the near future for it to become effective in the next two decades. Improving the university’s carbon performance with such a rapid trend seems to require much preparation and detailed analysis. Another factor to be considered in the university’s carbon performance is the university’s campus growth and its physical expansion. Square footage of Wentworth buildings has increased by
in the span of a decade, from 2009 to 2019. At the same time, the university’s total GHG emissions decreased by
by 2020 (see
Figure 4). This suggests a net unit improvement, but the final year was 2020 and this might have a distorted level of consumption due to the effects of the COVID-19 pandemic. Whether this
reduction will persist and lead to further reductions toward the GHG targets in the longer run requires more understanding and analysis of the campus-wide energy patterns. In the proceeding sections, an analysis of the campus’s energy consumption for the year 2019 is discussed. As the campus expands and more buildings are added, the significance of this study and its future work becomes more apparent.
2. Overview of Campus Power Consumption
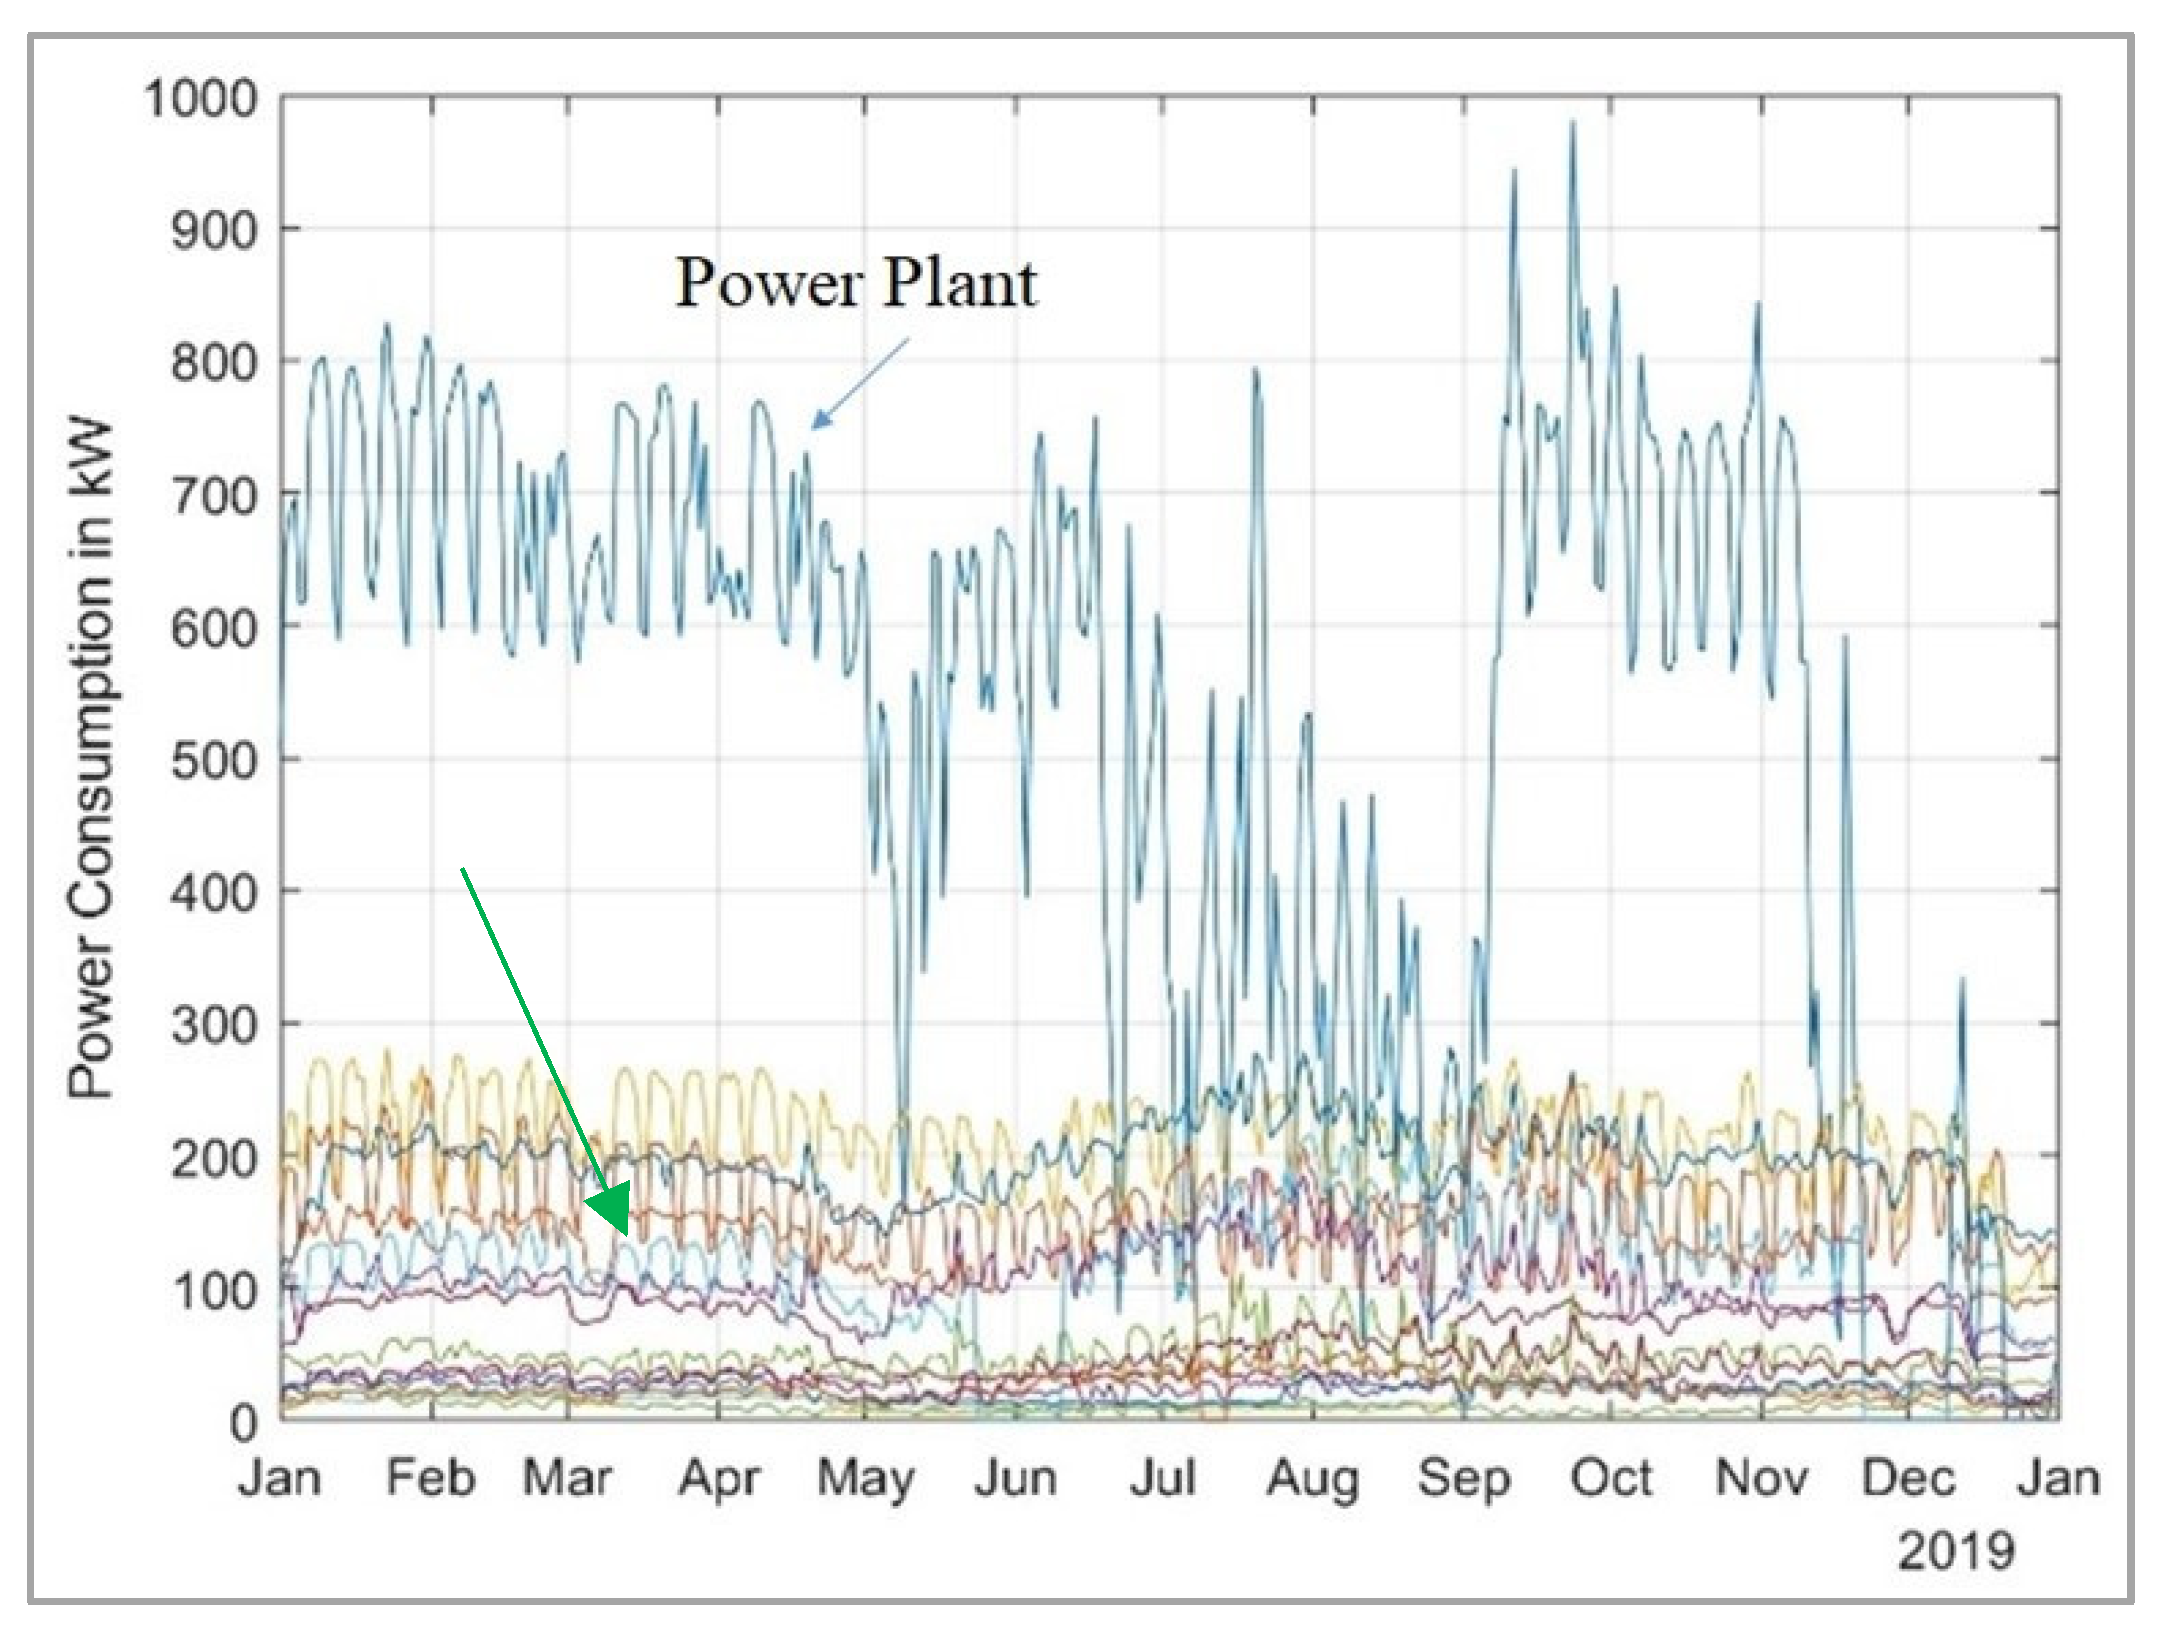
To study the power consumption pattern of the campus, the data obtained from the existing sixteen electrical meters for the year 2019 were explored. Campus buildings’ power consumption is primarily influenced by their functionality and usage type. For example, as shown in
Figure 5, the campus’s power plant has a large consumption as its primary function is to provide heating and cooling (chilled water) to the main campus buildings. After the power plant, the academic and residential buildings make up for the second largest portion of the campus’s power usage as they require lighting, heating, ventilation, and air conditioning (HVAC), or plug loads. The campus’s electrical power is supplied by the power grid and an on-campus Combined Heat and Power (CHP) generator. The functionality of the buildings can be categorized as:
Academic (classroom, lab, faculty office);
Residential (student dormitory);
Service centers (facility maintenance, gym, library, dining hall, student center, and athletic facilities).
This study used power consumption data documented in 2019, measured the temperature in Boston from 2019, and used building specifications provided by the facilities department. The power consumption data included the recorded values from sixteen electrical meters from different types of buildings—six meters were in academic buildings, six meters in residential buildings, and the remaining four meters were in service buildings, including the student center and the power plant. This power data consisted of:
Hourly power consumption from January to June 2019 for four academic buildings, four residential buildings, one service building, and the power plant.
Daily power consumption from January to December 2019 for all sixteen meters.
Hourly temperature readings for Boston, MA, from January to June 2019.
Building specifications including the size of the building in gross area in .
The Wentworth Academic Calendars for Spring 2019, Summer 2019, and Fall 2019 were also referenced to extract holidays and breaks when the campus was closed. MATLAB and Microsoft Excel were used to organize and visualize the data to identify power consumption patterns. All remaining figures in this paper used the data described above. For example,
Figure 5, which shows the power consumption of the sixteen campus meters and plots all readings from the January to December 2019 data as lines graphs. As another example, Figure 8, which shows average monthly power consumption, averages the daily power consumption values of all academic buildings for each month from January to December 2019 (the blue bars); the same procedure was conducted for the residential buildings (the red bars). Related discussion is presented in detail for each figure.
The category of building has the highest impact on their pattern of power utilization since the category determines the usage pattern based on student and staff activities in the building.. The data in
Figure 5 also show that the Spring (January to May) and Fall (September to mid-December) Semesters have more consistent power consumption at the power plant, with both semesters fluctuating around 700 kW consumption. The Summer Semester (May to August) has the most variation. This may be due to several buildings not being used, scheduled maintenance periods, and irregular summer activities. A further examination of the buildings that are not a part of the power plant will be discussed in
Section 3.
3. Academic and Residential Usage Patterns
Section 3 examines the aggregated power of the academic and residential buildings. This section highlights how human activity patterns in the academic and residential buildings determine the power demand for these buildings across the university.
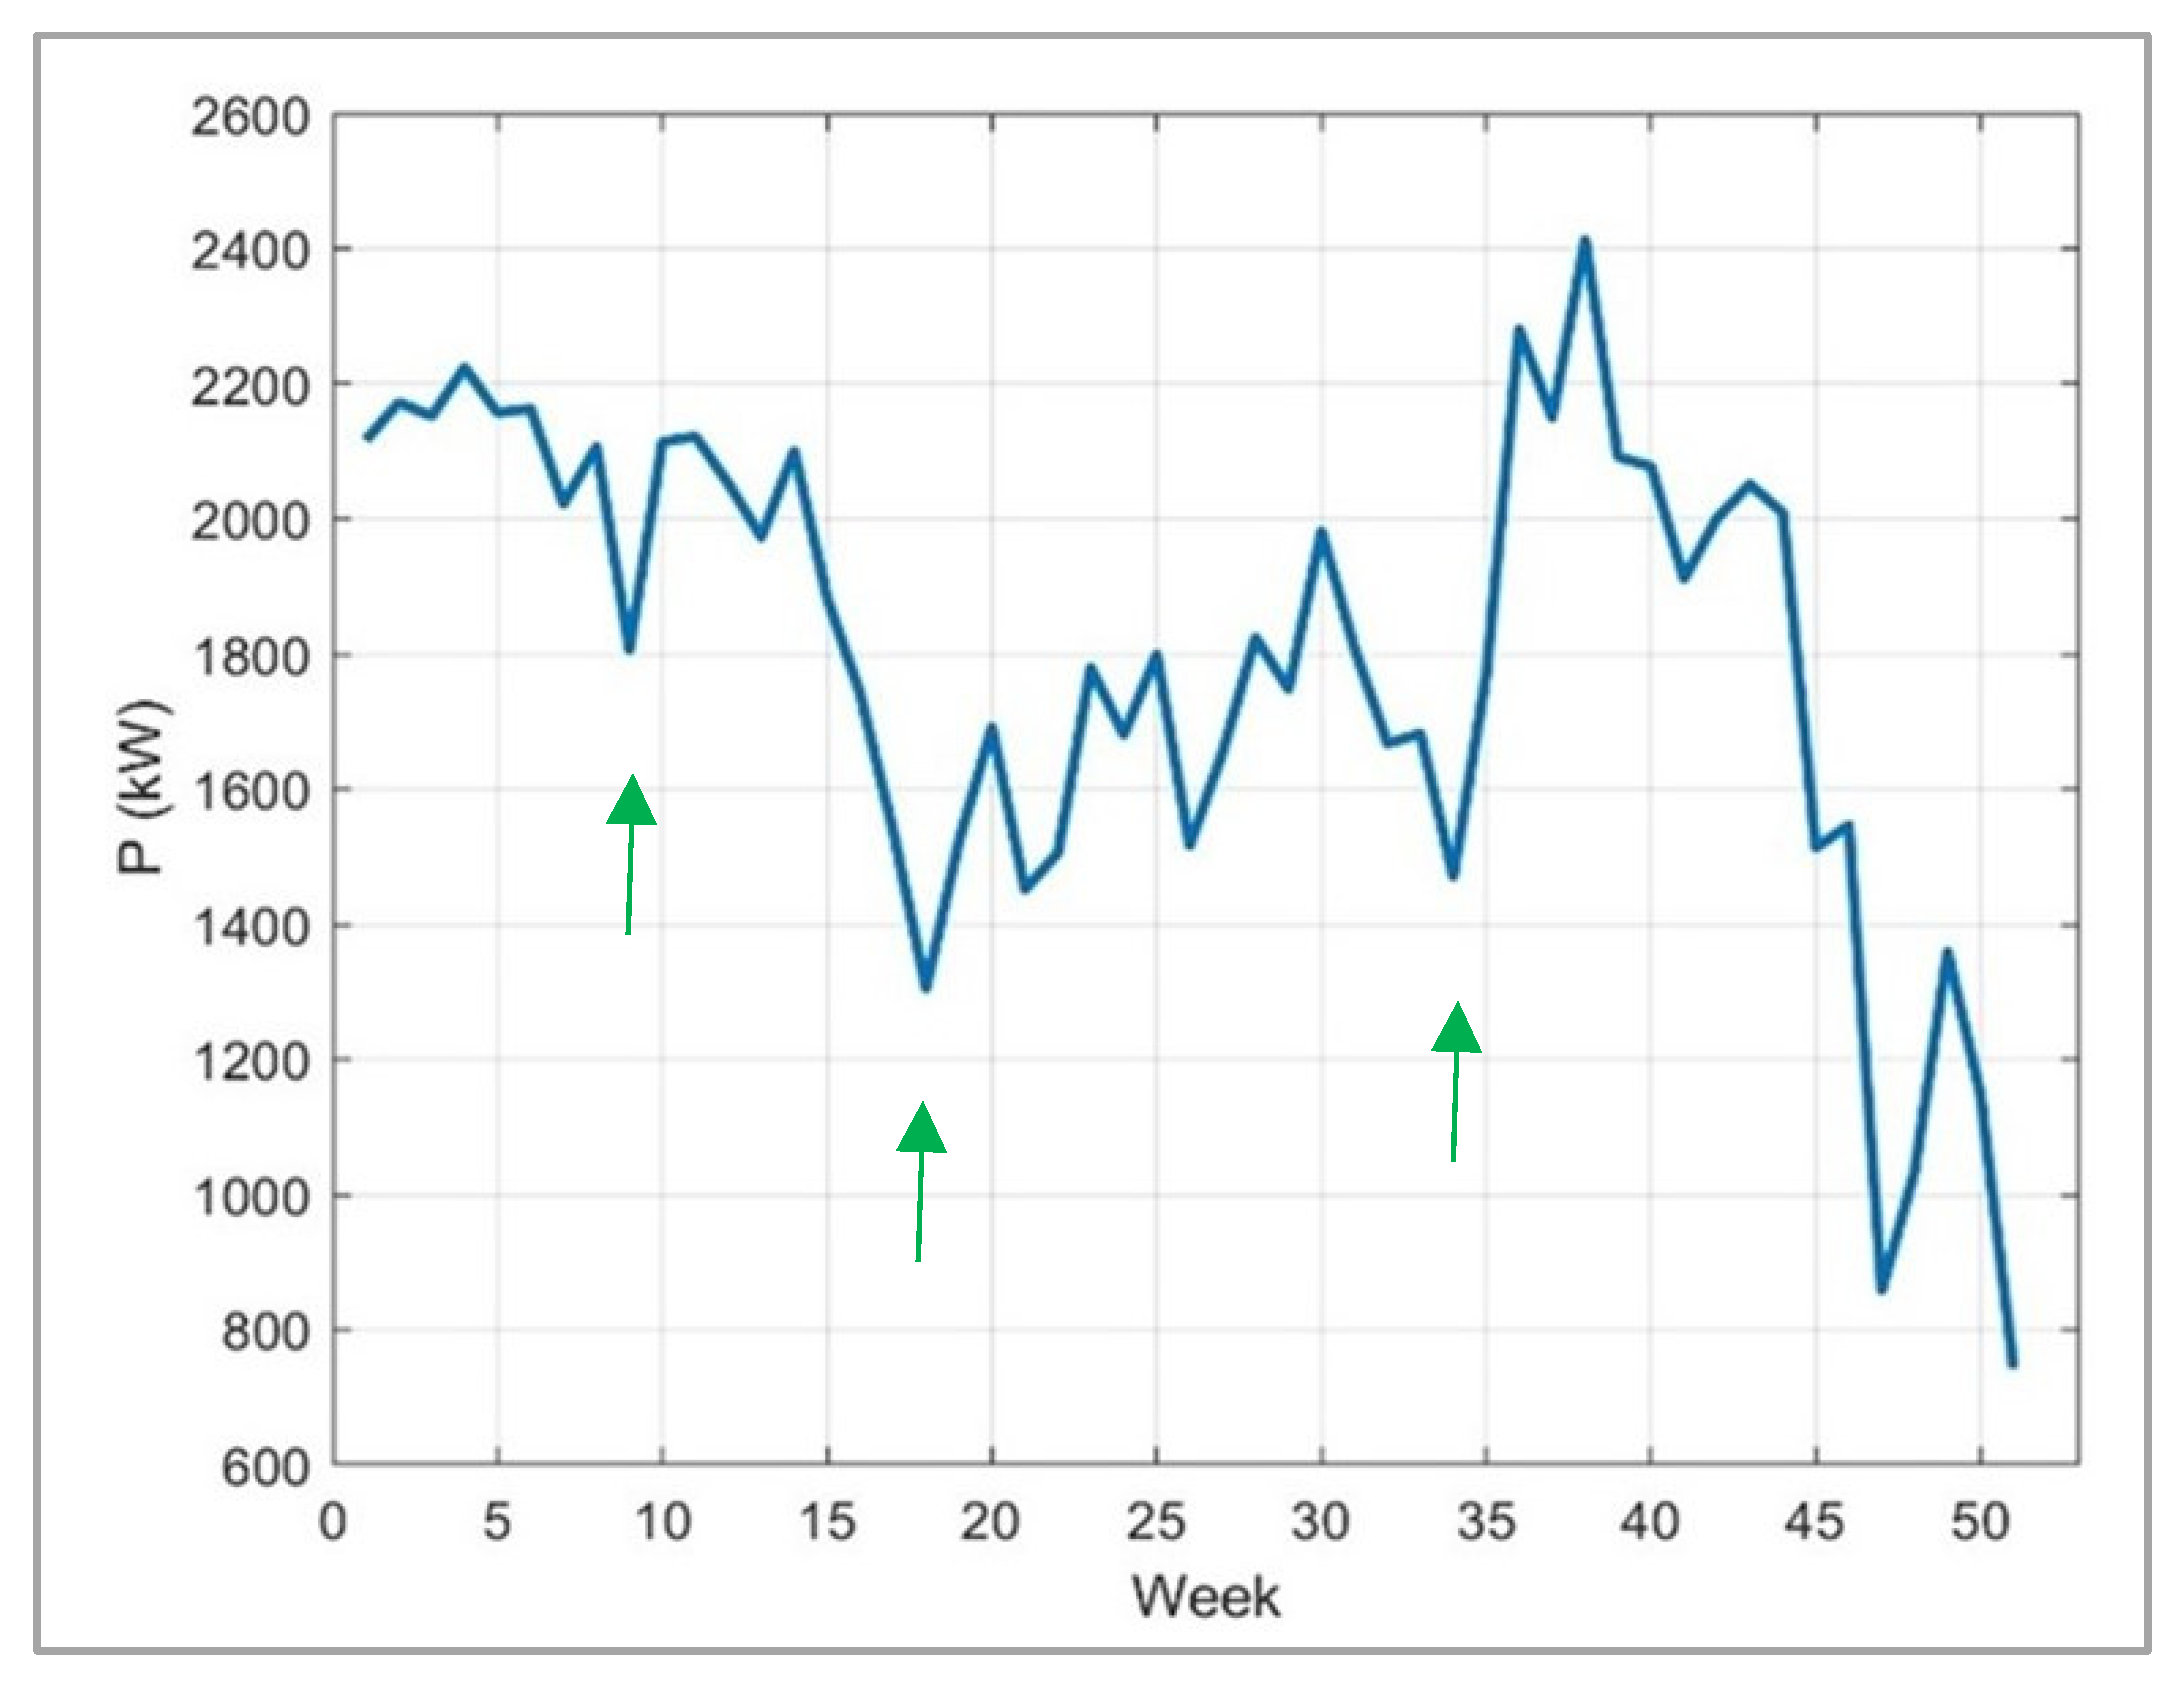
Figure 6 shows the power consumption of the Wentworth campus from January to December 2019. The data in
Figure 6 sum up the power consumption of the Wentworth power plant with all the academic buildings and residential buildings included in this study. The low valleys in
Figure 6 clearly identify Wentworth breaks between and during semesters, for example, week 9 corresponds to Spring Break, week 16 the break between Spring and Summer Semesters, and week 34 the break before Fall Semester begins.
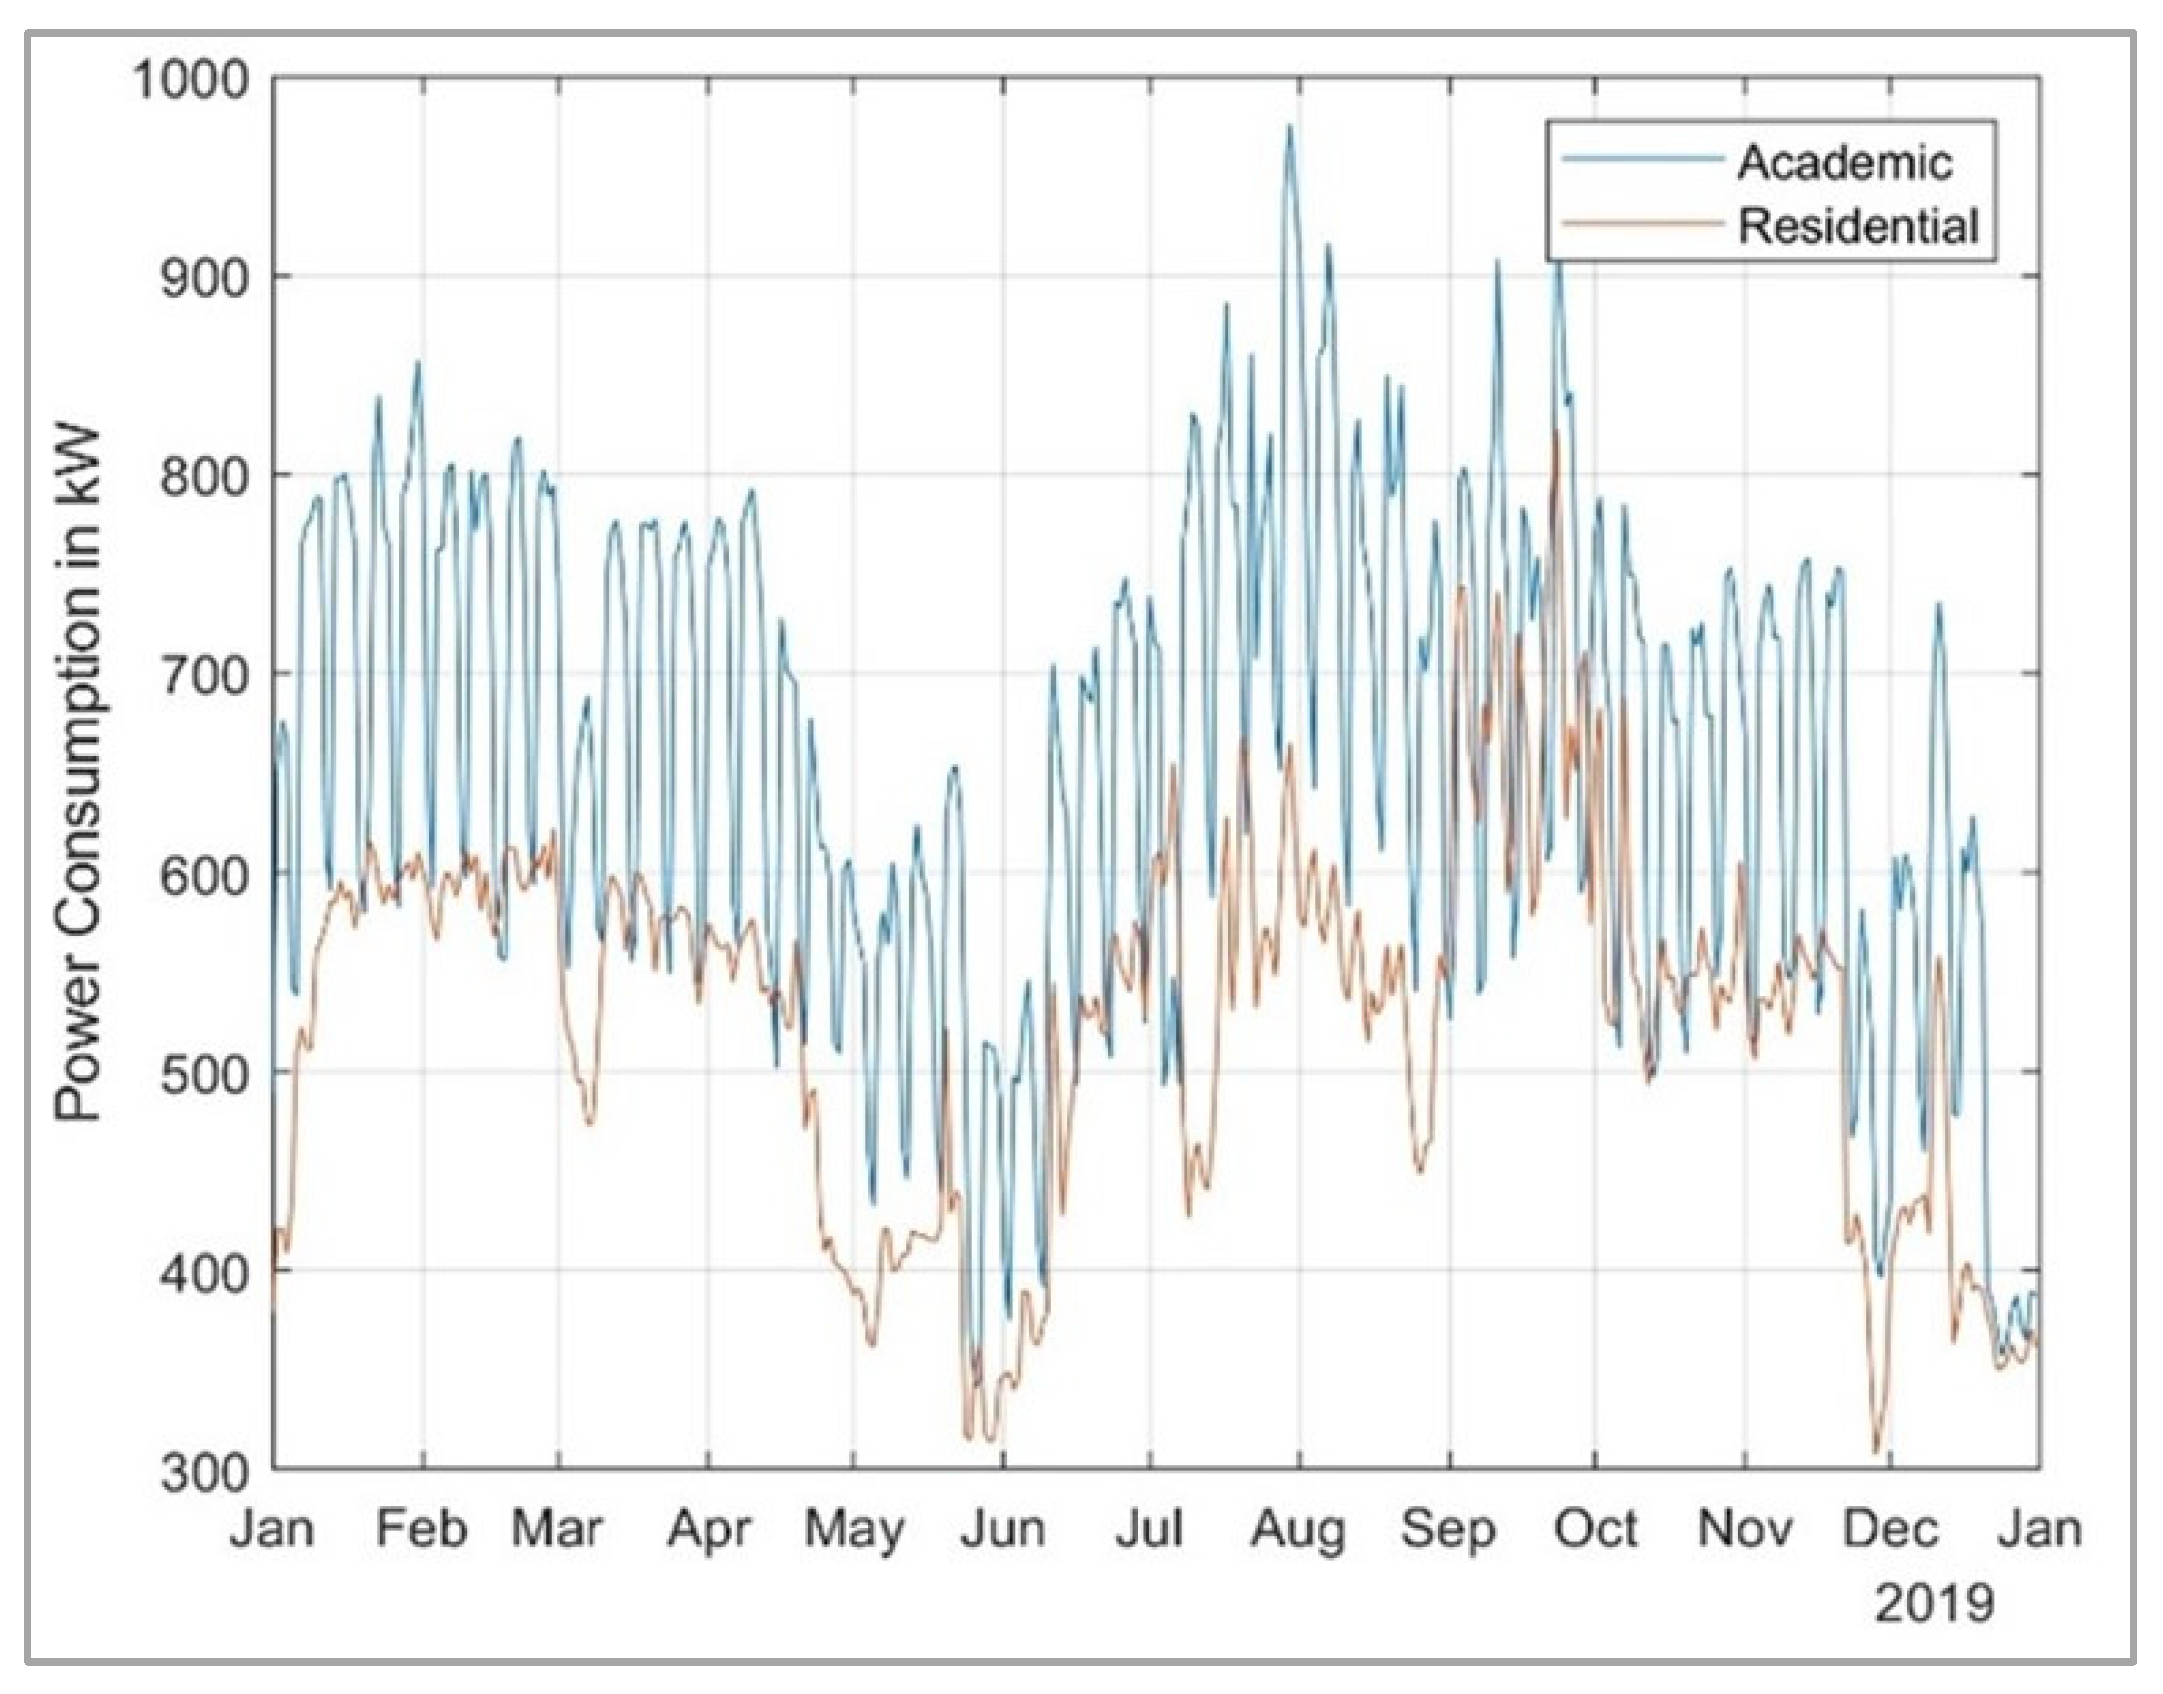
Figure 7 shows the aggregated power consumption of academic buildings and the aggregated power consumption of residential buildings in kW—the power plant meter readings are not included in this analysis. Both building types follow the same general pattern; however, the residential buildings generally consume less power on aggregate. Reasons why the academic buildings generally consume more power include (1) academic buildings are used by all members of Wentworth (all students, staff, and faculty) vs. only a subset of students and staff in the residence halls and (2) academic buildings are heavily utilized for many hours of the day and may include lab equipment use.
The weekday vs. weekend factor has a strong influence on academic buildings’ consumption. In
Figure 7, each month shows approximately four peaks and dips. The peaks are the weekday consumption data while the sharp narrower dips show weekend consumption. Academic buildings show a greater variance between the weekday peaks and the weekend dips against residential buildings since residential buildings are occupied more uniformly during the entire week. Anomalies, such as the drop in consumption during the first week of March and the beginning of May, correspond to breaks, in this case Spring Break and the break between semesters, respectively. These dips are also observable in
Figure 6.
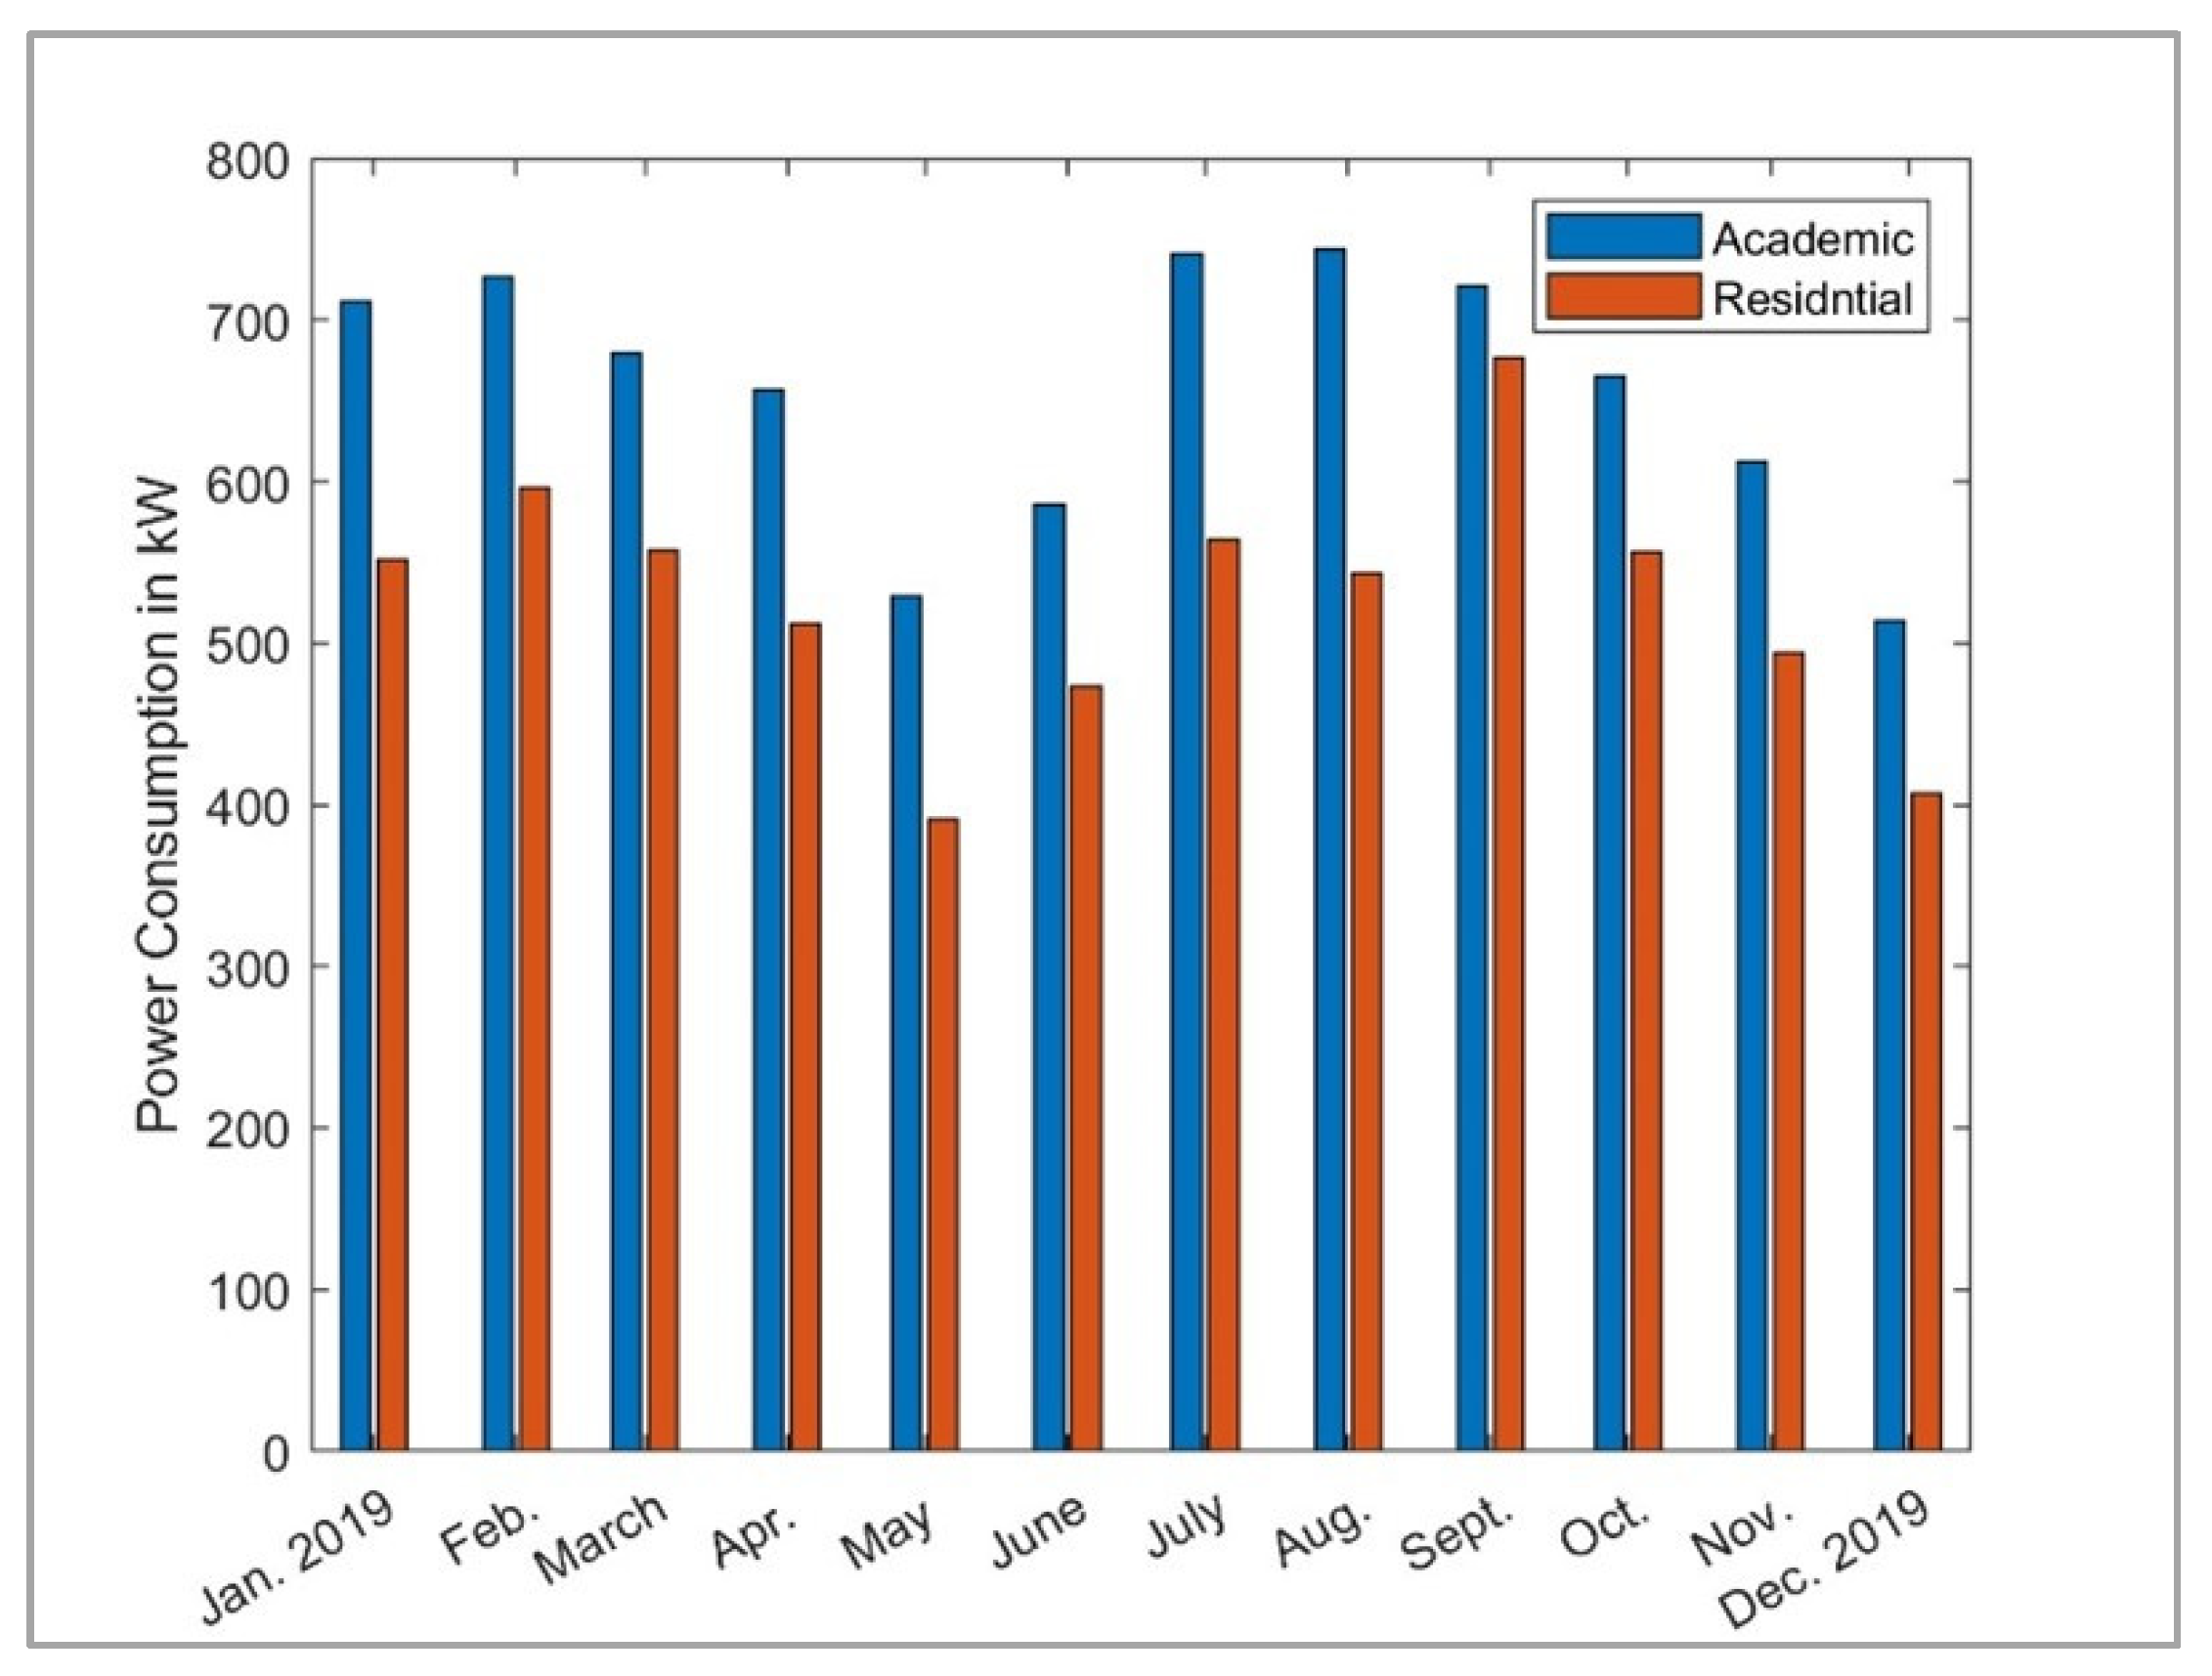
Figure 8 depicts the average power consumed each month in 2019 for all academic buildings and all residential buildings metered at Wentworth. The general shape of the bar chart mimics the trends shown in
Figure 7 showing the raw power consumption. The largest difference in average consumption between academic and residential buildings occurs during the Summer Semester (May to August), since all academic buildings are used for the entire year while some residential buildings are not used at all over the Summer Semester. Additionally, there are fewer resident students in the summer since the student body is primarily composed of Juniors and Seniors who are more likely to live off-campus. Residential buildings’ power consumption has a large spike in September as many more students move into residence halls for the Fall Semester.
Figure 8 also shows that the academic months have the largest power consumption during the hot summer months as much power is needed to adequately cool the academic buildings, especially July through September.
Figure 9 shows the average power consumed per hour, per day for academic and residential buildings for the months of January and June of 2019. The months of January and June were chosen as two extremes in temperature, i.e., a cold month vs. a hot month, respectively. Weekdays and weekends can be clearly identified on the maps for the academic buildings as lighter columns.
Figure 9a,b show a cycle of five days of heavier power consumption followed by two days of low power consumption. Academic buildings use most of their power between 8 am (hour 8) and 8 pm (hour 20) on weekdays corresponding with the 8 am to 5 pm course and lab schedule, followed by a few evening courses and extracurricular classes or activities. The first week in January is the lightest period on the heatmap (
Figure 9a) since classes began after the first week. January academic power peaked at approximately 280 kW while June peaked at 350 kW. Even though there are fewer students in June during the Summer Semester vs. January in the Spring Semester, the increase in power consumption is due to the cooling needs for the academic buildings.
Residential buildings (
Figure 9c,d) slowly increase their power consumption throughout the day peaking at 7 pm; at this time, most students are in their residential hall, the residence halls need to be lit, and students are likely using their laptops for entertainment or schoolwork. The distinction between weekdays and weekends is not as clear for residential buildings since these buildings are used in a more consistent daily pattern. Students have different schedules so there would be a possibility that some students would not be in a lecture or lab and would be in their residence halls throughout the entire day. In some cases, there is a darker spike on the weekends as observed in
Figure 9c,d, as this is when residence halls are typically at their fullest capacity.
As discussed, the heatmaps in
Figure 9 show the trends and peak usage hours for both academic and residential buildings, which are influenced by building utilization by students, staff, and faculty. The peak demand for residential buildings is just under 700 kW in June, while the corresponding peak for academic buildings for the same month of June is close to 280 kW. In
Figure 9, the power for residential buildings is shown as being higher than that of academic buildings in both sample months of January and June. The same is illustrated again in
Figure 10. This does not contradict the previous data. In the case of
Figure 9 and
Figure 10, hourly data was only available from January to June for four residential buildings and three academic buildings. Additionally, one of the academic buildings in the hourly dataset has been traditionally shown to consume little power throughout the period. Due to the limitations of the available hourly dataset, it appears that the residential buildings consume more power, but in fact, the academic buildings consume more power as shown in the previous analysis above (
Figure 5,
Figure 6,
Figure 7 and
Figure 8) when examining the full daily dataset with all metered academic and residential buildings from January to December 2019.
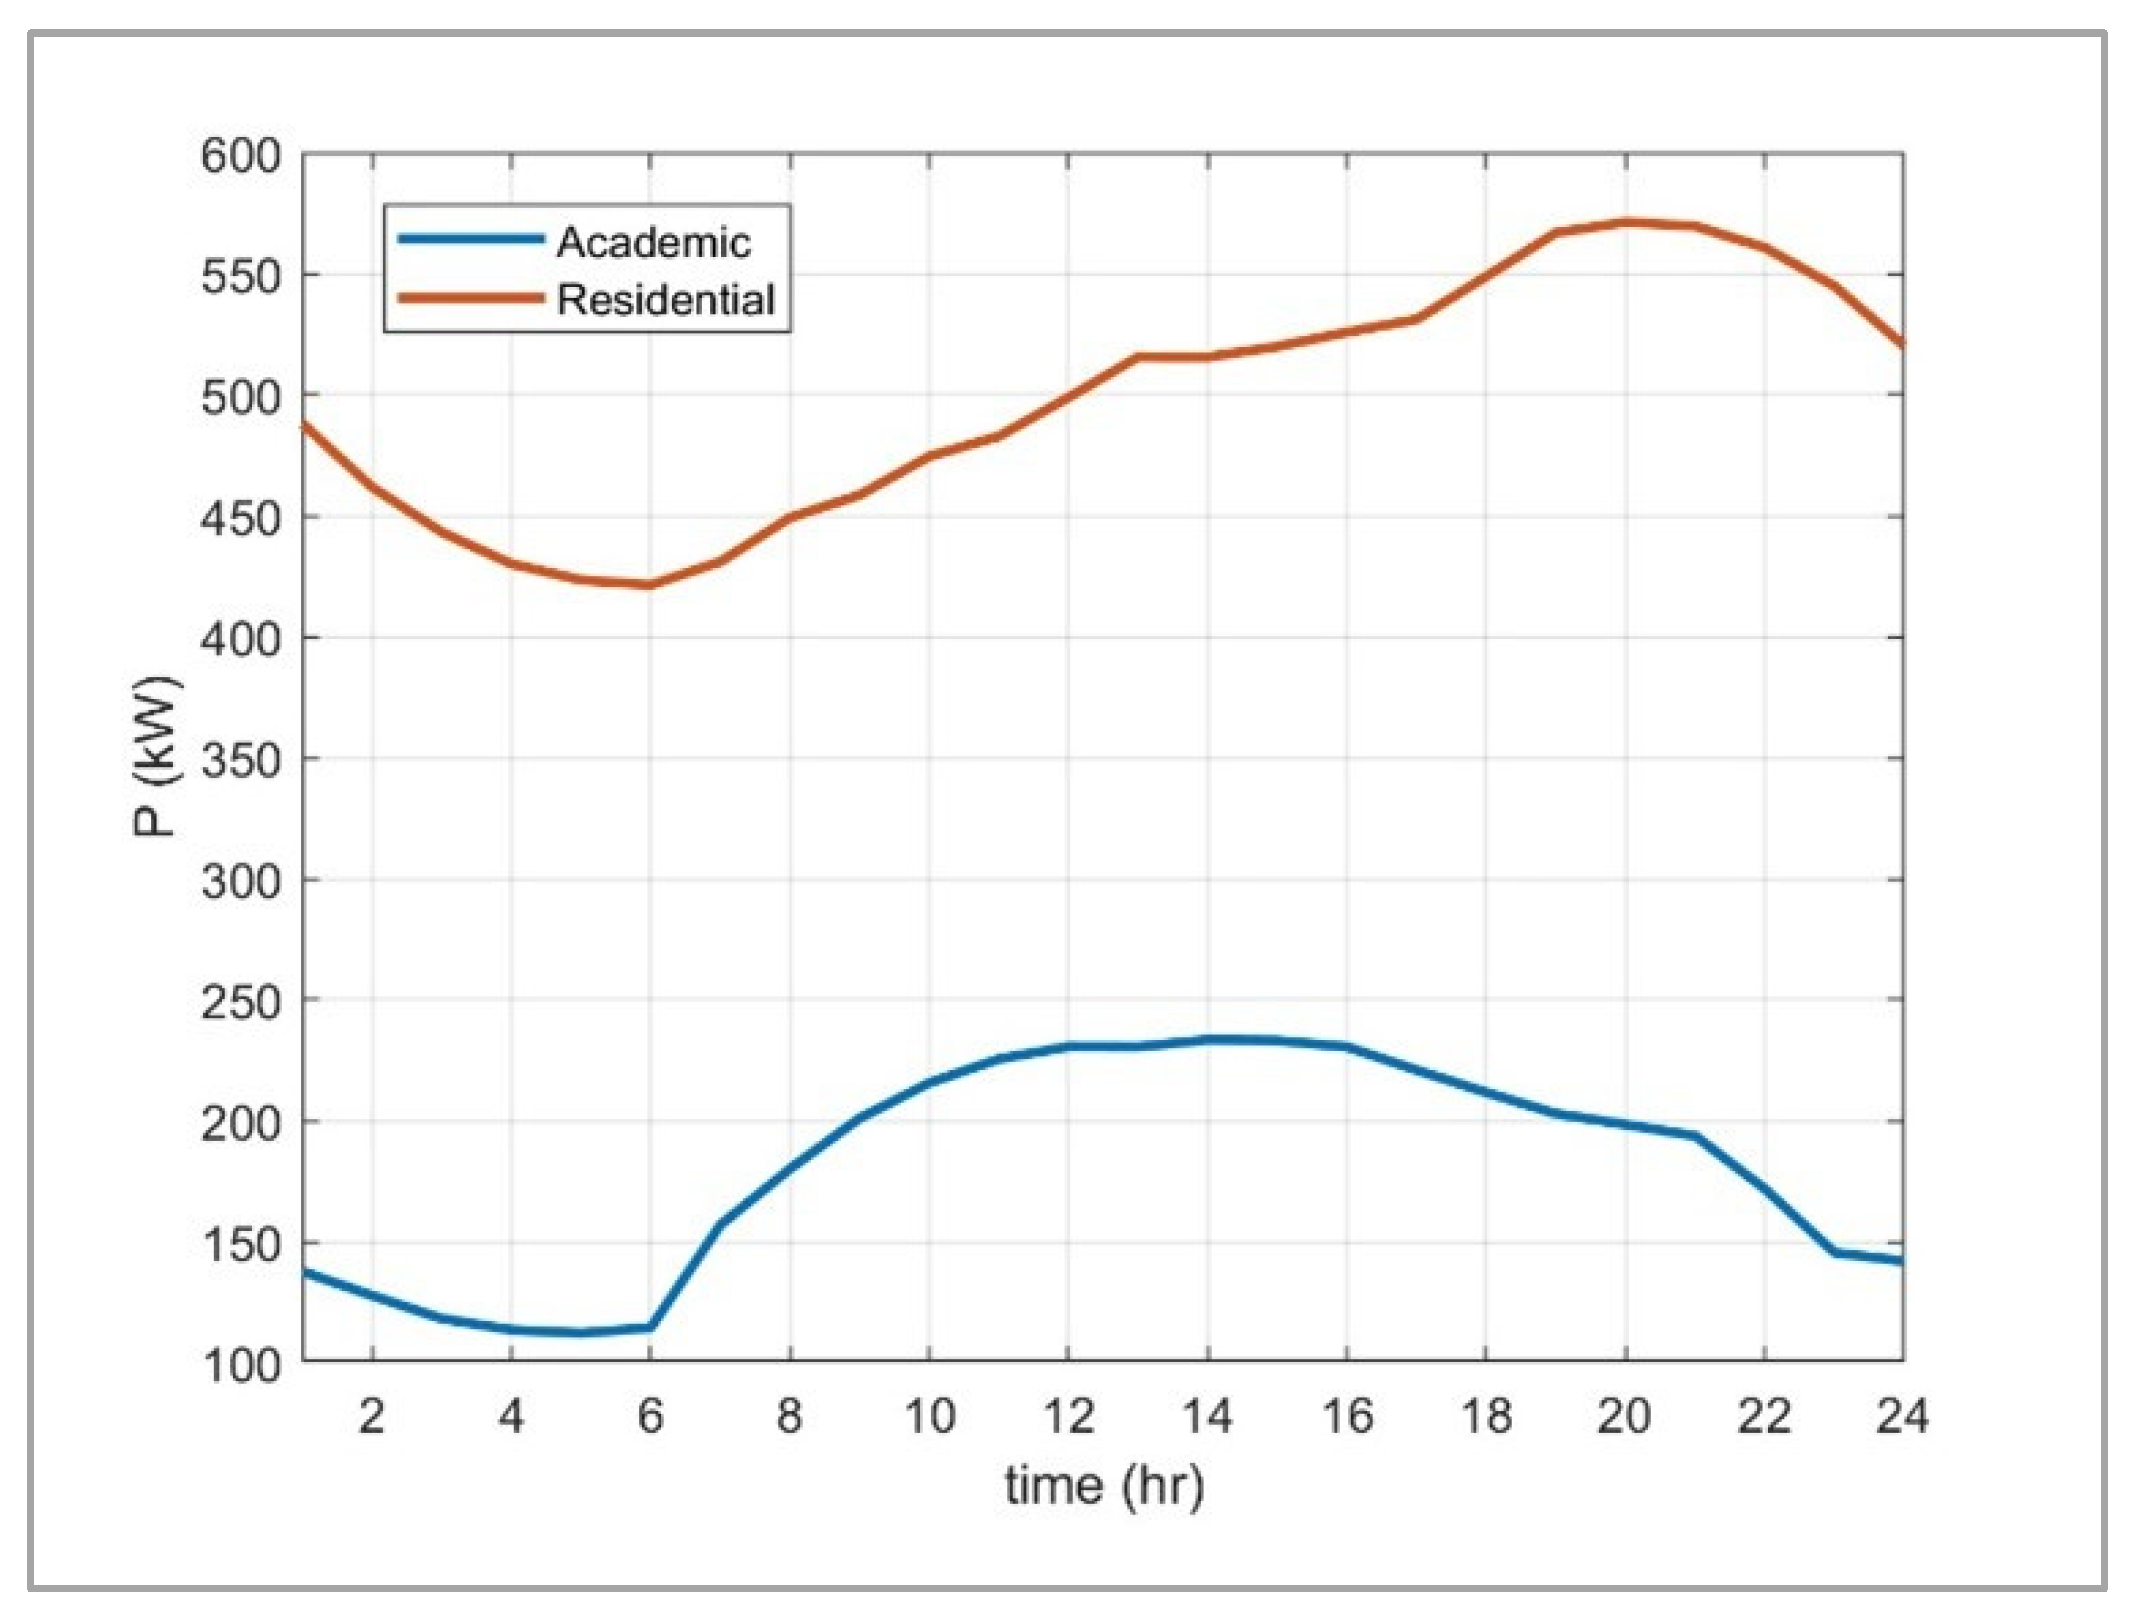
Figure 10 represents the hourly power consumption of four residential buildings and three academic buildings. For example, hour 2 is the average of the power consumed at 2 am every day in the January to June 2019 range for the academic and residential buildings. The power consumption of the four residential buildings is higher than the three academic buildings as shown, but it confirms the same trends as the heatmaps in
Figure 9. Residential buildings slowly ramp up power consumption with their peak occurring at 7 pm (hour 19) when most students are back in their residence halls. Academic buildings show the most consumption between Wentworth’s regular lecture/lab times from 8 am (hour 8) to 5 pm (hour 17) with extracurricular activities and dining on campus until approximately 10 pm (hour 22).
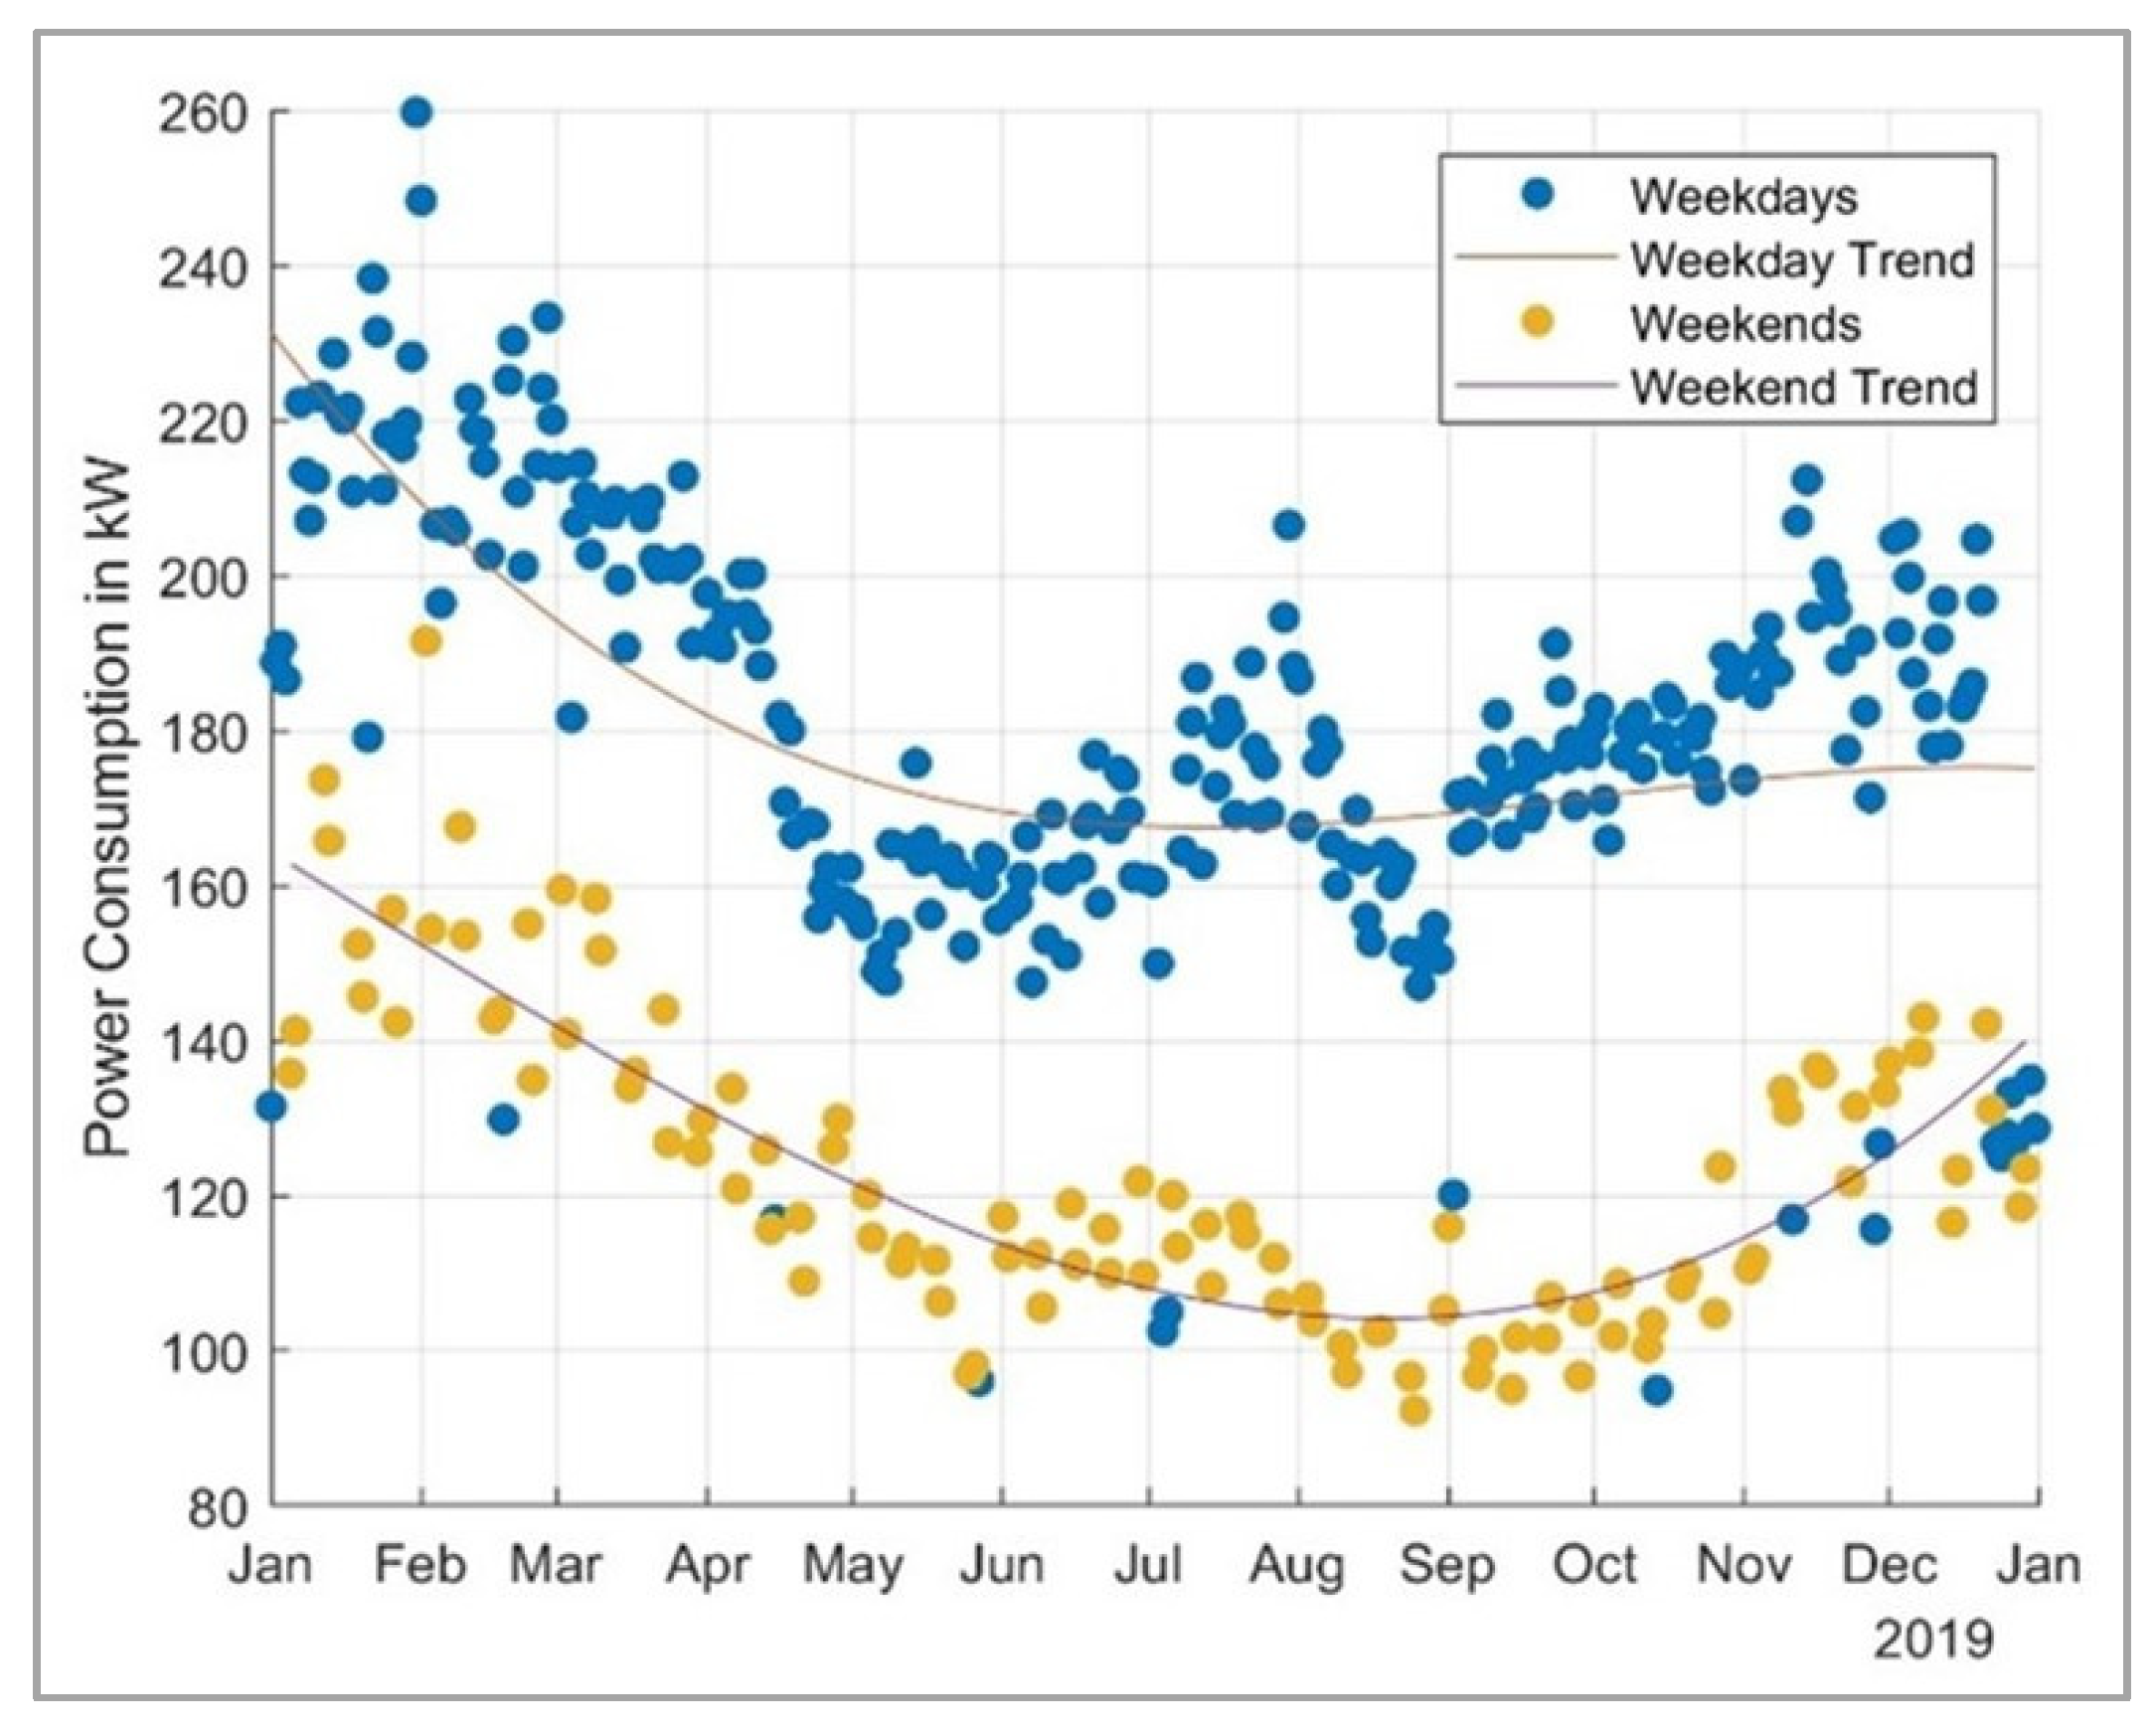
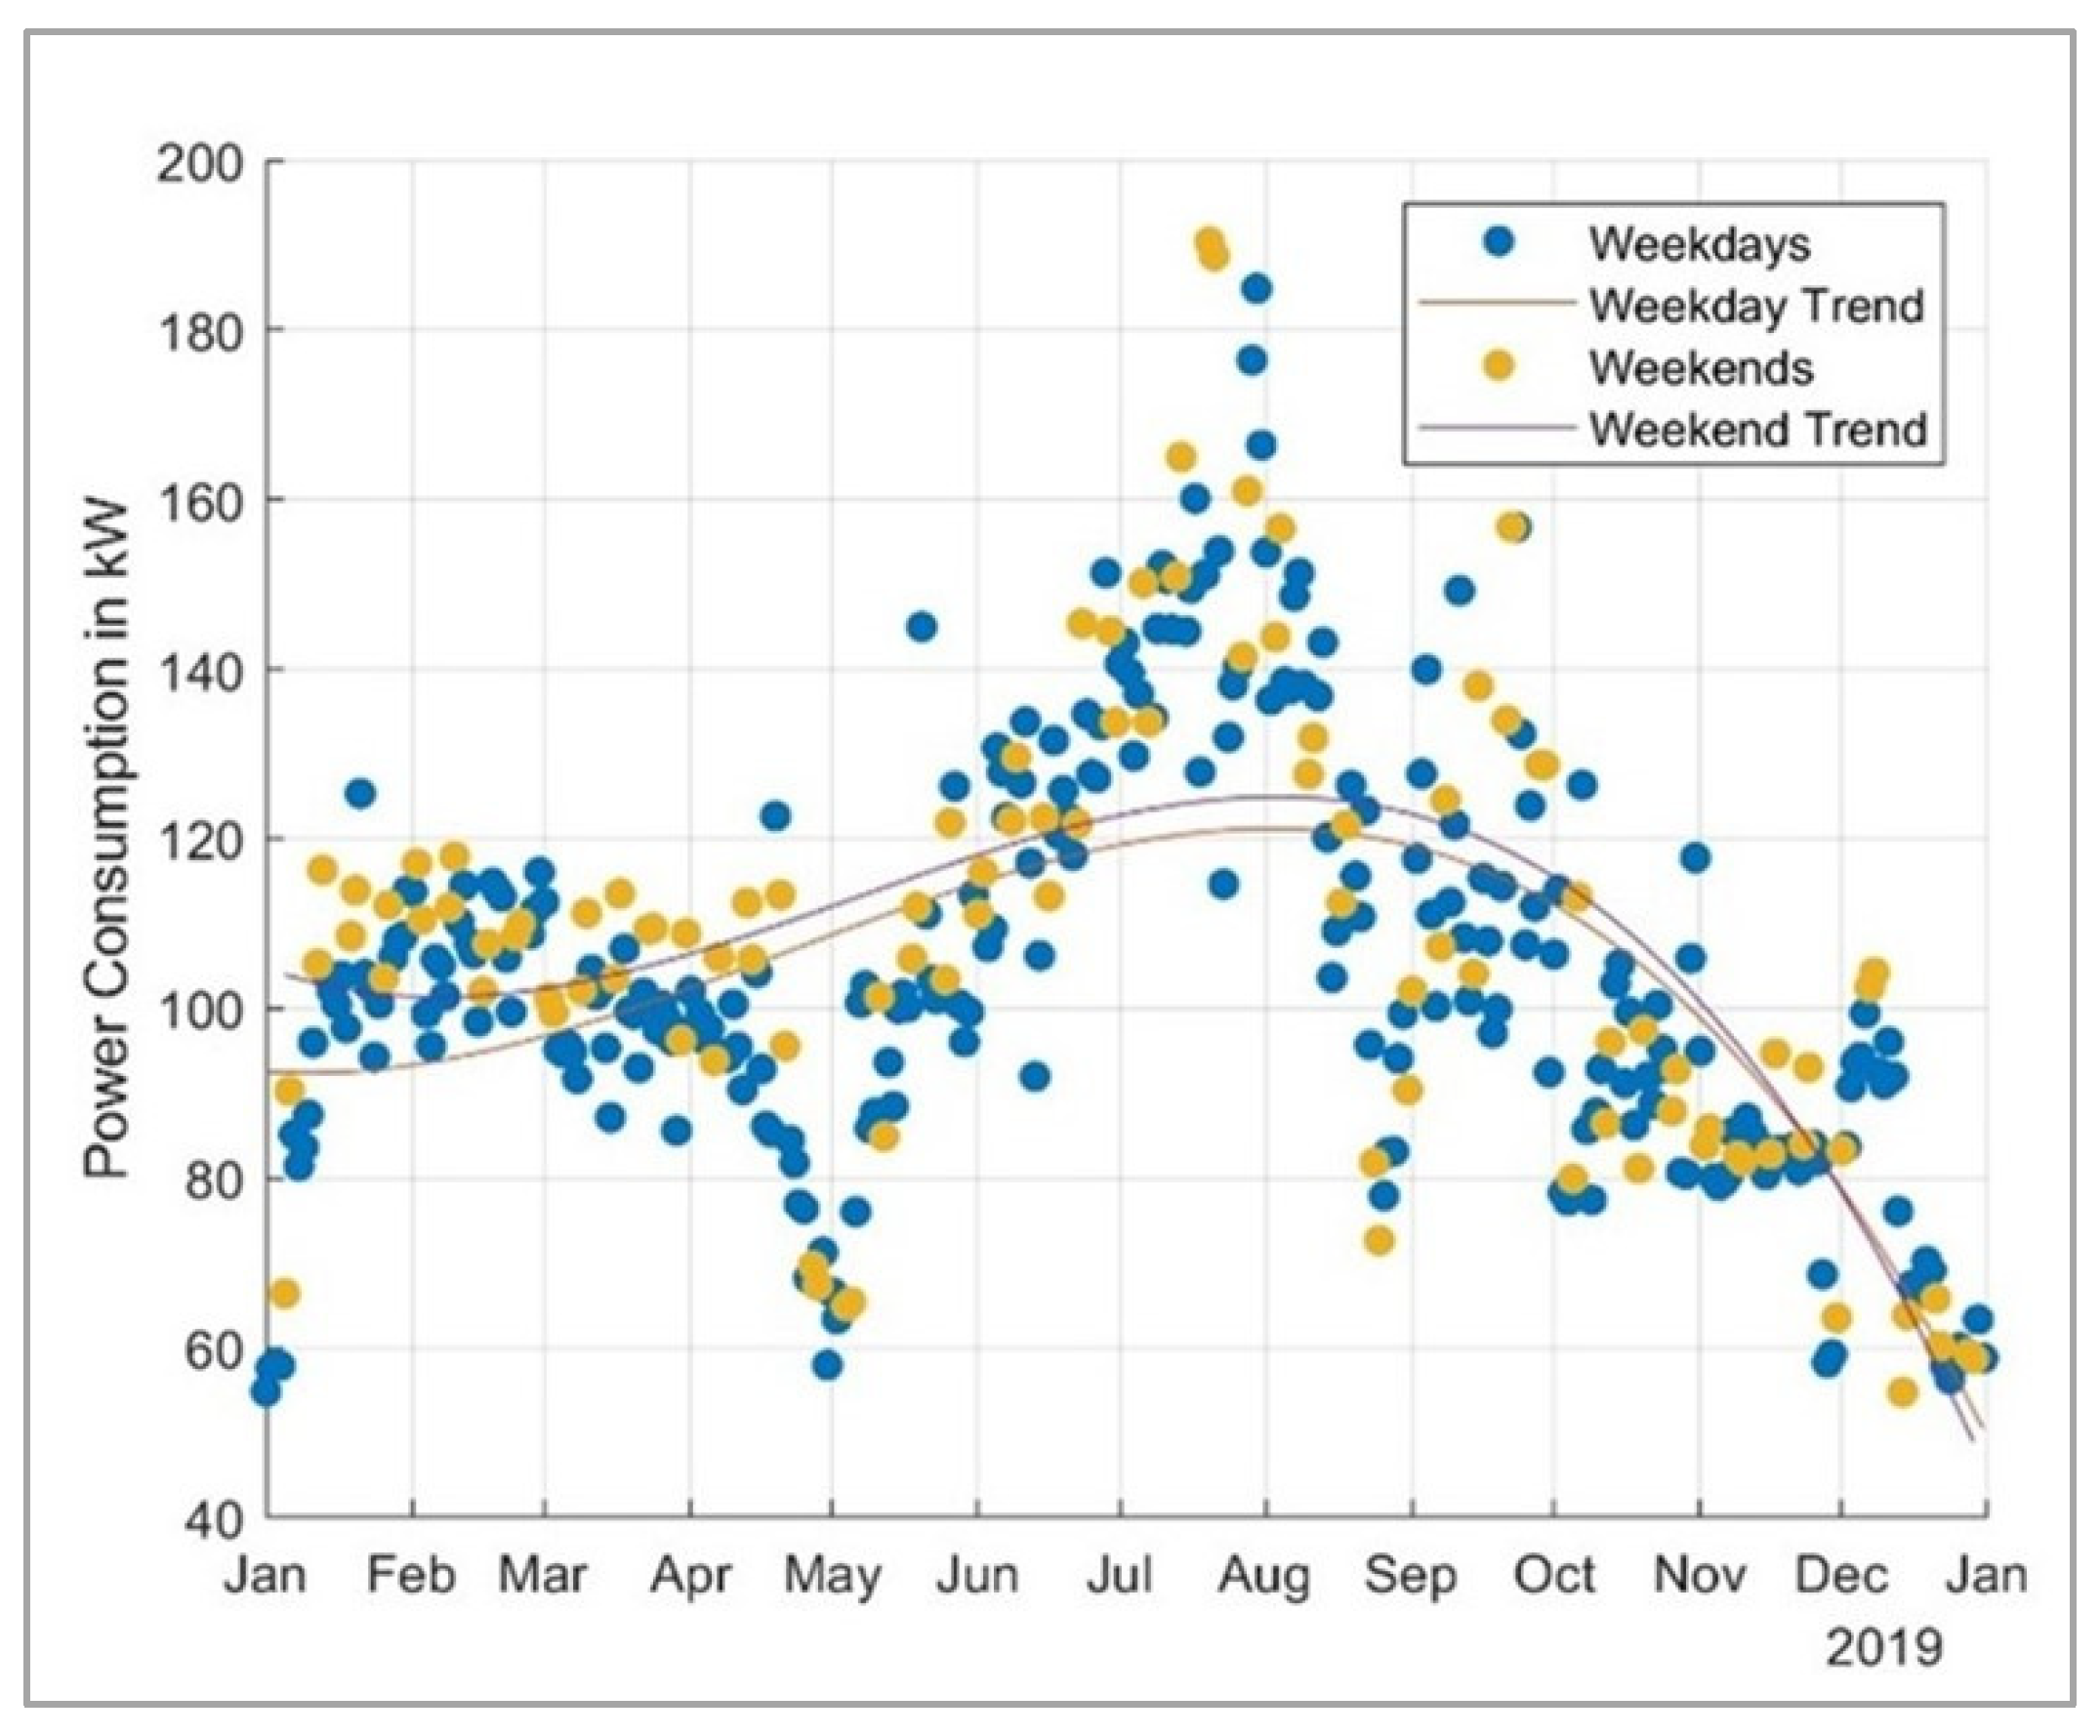
To explore further, two specific buildings were analyzed for weekday vs. weekend usage over the year 2019. The name of the selected academic building was Wentworth Hall, and the name of the residential building was 525 Huntington Ave. Wentworth Hall consists of classrooms on all floors and lab spaces on the ground floor. The Wentworth Hall classrooms and labs are most heavily occupied in the Spring Semester. The Summer Semester has the lowest use since Freshman and Sophomore students are not on campus then. The 525 Huntington Ave residence building was used in this analysis since it is one of the newer and LEED-certified buildings, which is also cooled via air conditioning; several of the older residence buildings do not have cooling. The 525 Huntington Ave building was also in use throughout the year of 2019 while a few of the other residential buildings were closed for the Summer Semesters due to low campus occupancy.
The power consumption pattern of the academic building, Wentworth Hall, is shown in
Figure 11. The pattern reinforces the data shown in the aggregated power data for academic buildings (
Figure 7) and the heatmap data for academic buildings (
Figure 9a,b). This suggests that there is a clear distinction between weekday and weekend power needs for academic buildings. Very few academic buildings are open or accessible during the weekends, and even then, the air conditioning and heating are typically not fully on, which would account for the clear separation between weekdays and weekends. The trendlines show that the gap in power consumption between the two types of days stays roughly the same, approximately 65 kW to 70 kW on average, even as the power consumption changes over the months and semesters. The outliers in weekday data shown in
Figure 11 correspond directly to holidays when the academic buildings would have been closed.
Similarly, the power consumption of the residential building, 525 Huntington Ave, is shown in
Figure 12. The pattern reinforces the data shown in
Figure 9c,d, showing that there is no clear distinction between weekday and weekend consumption in residential buildings. This is because the residence halls are occupied with students every day of the week; even on weekdays students are not in lectures or labs for the entire day and the students alternate between the academic buildings and their residence hall. Instead,
Figure 12 clearly shows the drop in power consumption between the semesters, i.e., in the beginning of May, end of August, and mid-December.
5. Concluding Remarks and Future Directions
Developing insight into the power consumption characteristics of a university campus will have long-term benefits in terms of increasing efficiency in energy usage and reducing operational costs. Universities will need to comply with the regulatory targets to reduce GHG emissions. In the race to achieve net-zero emission, the contribution of urban universities may become more critical. In this work, we have conducted an extensive study on the power consumption patterns of WIT during the year 2019, using actual campus data. We have examined patterns of the energy usage of different buildings on campus to ultimately look for efficient solutions that would reshape WIT to a more sustainable campus.
Unlike the suburban educational campuses that have more land, our urban institution has less land to allocate for structural improvements in power efficiency, local generation, and storage. Therefore, our in-depth study of power consumption patterns is essential to developing space-efficient power structures and to making focused suggestions. This study can also serve as a case study for other urban universities.
Below are a few of our observations based on the findings of the power consumption patterns presented throughout the paper. Academic buildings consume more power per floor area than residential buildings. They also have more predictable power consumption patterns (maximums and minimums) based on the time of day, days of the week, and the academic calendar. Since they consume the most power, improvements for academic buildings have potential in moving toward reducing peak demand on the power grid. Based on the presented campus power patterns, local generation of power could be adapted to the periods of high demand. Examples of peak periods in academic buildings are the daytime peak, workdays (vs. weekends), and winter months (January–March). On the other hand, a peak period occurs in residential buildings annually in August and September. To reduce the peak demand, energy could be stored during the non-peak periods.
Moreover, the power monitoring system can be improved by adding more meters with a network interface. Currently, the meters used in our study seem to have heterogeneous coverage areas, with some spanning multiple buildings. Perhaps a more granular system of metering would allow a more targeted data collection for the identification of areas to improve efficiency. Metering with a more assessable network interface would allow dynamic and timely monitoring, anomaly-detection, and decision-making. These improvements would contribute toward compliance with GHG emission guidelines.
The campus includes new and old buildings where the latter has lower energy efficiencies. The replacement or upgrade of certain buildings would increase power consumption efficiency. Suggestions for upgrading include (a) more efficient lighting with LED and proximity sensors for adaptive control, (b) adding renewable energy generation, such as solar and geothermal, (c) adding energy storage to improve the reliability of renewable sources, (d) improvements in insulation and reduction in air leakage, and (e) adaptive control of solar radiation on buildings to moderate heating and cooling.
A low-net energy campus is one that has sufficient resources to address its demand, reduce its dependency on the grid, and take aim at the regulatory targets. A simulation model, including campus buildings as loads, and the campus’s Distributed Energy Resource (DER), will be developed in intended future work to gain insightful information toward increasing power sustainability and to explore lowering the carbon emission on campus based on the guidelines presented in [
2]. The perception of becoming a campus microgrid by incorporating different energy resources can help WIT to investigate alternative ways to address its power demand more efficiently [
16,
17,
18,
19]. For the university to maintain the model of in-person learning, active hands-on labs, and establish its educational leadership in emerging areas of sustainable energy and buildings, an insightful model of WIT’s energy usage seems significant.
Increased generation of renewable energy plus the possibility of the addition of on- campus storage would not only support WIT’s compliance with the carbon reduction regulatory requirements but would also support broader goals for community engagement, such as the university’s initiatives for college access and regional engagement, innovation, and entrepreneurship [
20,
21]. These objectives will be well achieved, and the electrical power planning of the campus will be efficiently addressed when there is a clear understanding of the patterns of campus building and infrastructure energy usage. In this work, we have presented a sample of one year’s consumption by one campus; however, if this study is conducted for multiple years, it will generate deeper insights and more compelling motivation for future planning.


