Article

The Impact of Highway Infrastructure on Population Mobility: Evidence from a Sample of 800 Counties and Districts (2000–2019) in China

SILC Business School, Shanghai University, Shanghai 201899, China
*
Author to whom correspondence should be addressed.
Sustainability 2023, 15(20), 14834; https://doi.org/10.3390/su152014834
Submission received: 9 September 2023 / Revised: 6 October 2023 / Accepted: 9 October 2023 / Published: 13 October 2023

Abstract

:
Modern transport infrastructure plays an important role in shaping urban areas, yet the impact on population distribution and mobility remains uncertain. The aim of this study is to investigate the impacts of road infrastructure on population mobility through a sample of 800 counties and districts in China covering the period from 2000 to 2019 using panel fixed-effects regression models. We find that the improvement in highway infrastructure density can significantly increase the inflow of the population, which is robust to the different measures of the intensity of population mobility and highway infrastructure and to the estimation of 2SLS. This impact has regional and administrative hierarchy heterogeneity. We also investigate the moderating effects of distance from high-order centers, human capital, and digital economic development on the nexus of highway infrastructure and population migration. Our results reveal policy implications for road planning and new rural construction.

1. Introduction

Population mobility has been a hot topic in the study of development economics and transportation economics [1,2]. It is related to poverty alleviation [3,4], social inclusion [5,6], market integration [7], and resource allocation [6], as it enhances the connectivity of remote areas [8]. For developing countries, population mobility is an important source of urbanization [9]. Due to the uneven distribution of resources, people tend to flow from remote areas to high-order centers to enjoy better education, medical care, and other services [6]. In China, the hukou system established in 1958 is an internal passport system used to control internal migration [10]. In the early 1980s, labor migration was slowly relaxed to allow people temporarily in other places without registration. In this study, population mobility refers to the migration from a registered residence to other regions for at least six months.
Previous studies have found that various factors, such as climate change [11], public capital spending [12], high-speed rail [13], economic and social development [14], household registration systems [15], and social networks [16], affect population mobility. Modern transport infrastructure plays an important role in shaping urban areas [17], yet the impact on population distribution and mobility remains uncertain [18]. Transport infrastructure either centralizes or decentralizes population distribution by inducing population inflow or outflow. Existing studies on the role and mechanism of improved transport conditions with regard to population mobility focus on railway infrastructure construction and are mostly based on provincial- or prefecture-level city panel data [19].
Compared with railway infrastructure, highway infrastructure is more likely to connect remote areas into the arteries woven by railways and has a far-reaching impact on the regional economy and population mobility [20]. However, studies on the impact of highway infrastructure on population mobility are very limited. This study based on county- and district-level samples helps deepen our understanding of this issue.
Although China’s high-speed railway network construction has been advancing rapidly in recent years, it cannot cover all prefecture-level cities. Highway infrastructure provides access for many county towns and remote rural areas to large cities. With the large regional economic gap and liberalization of the household registration system, population mobility has become very common in China, which provides an ideal natural setting for us to explore the nexus between highway infrastructure and population mobility.
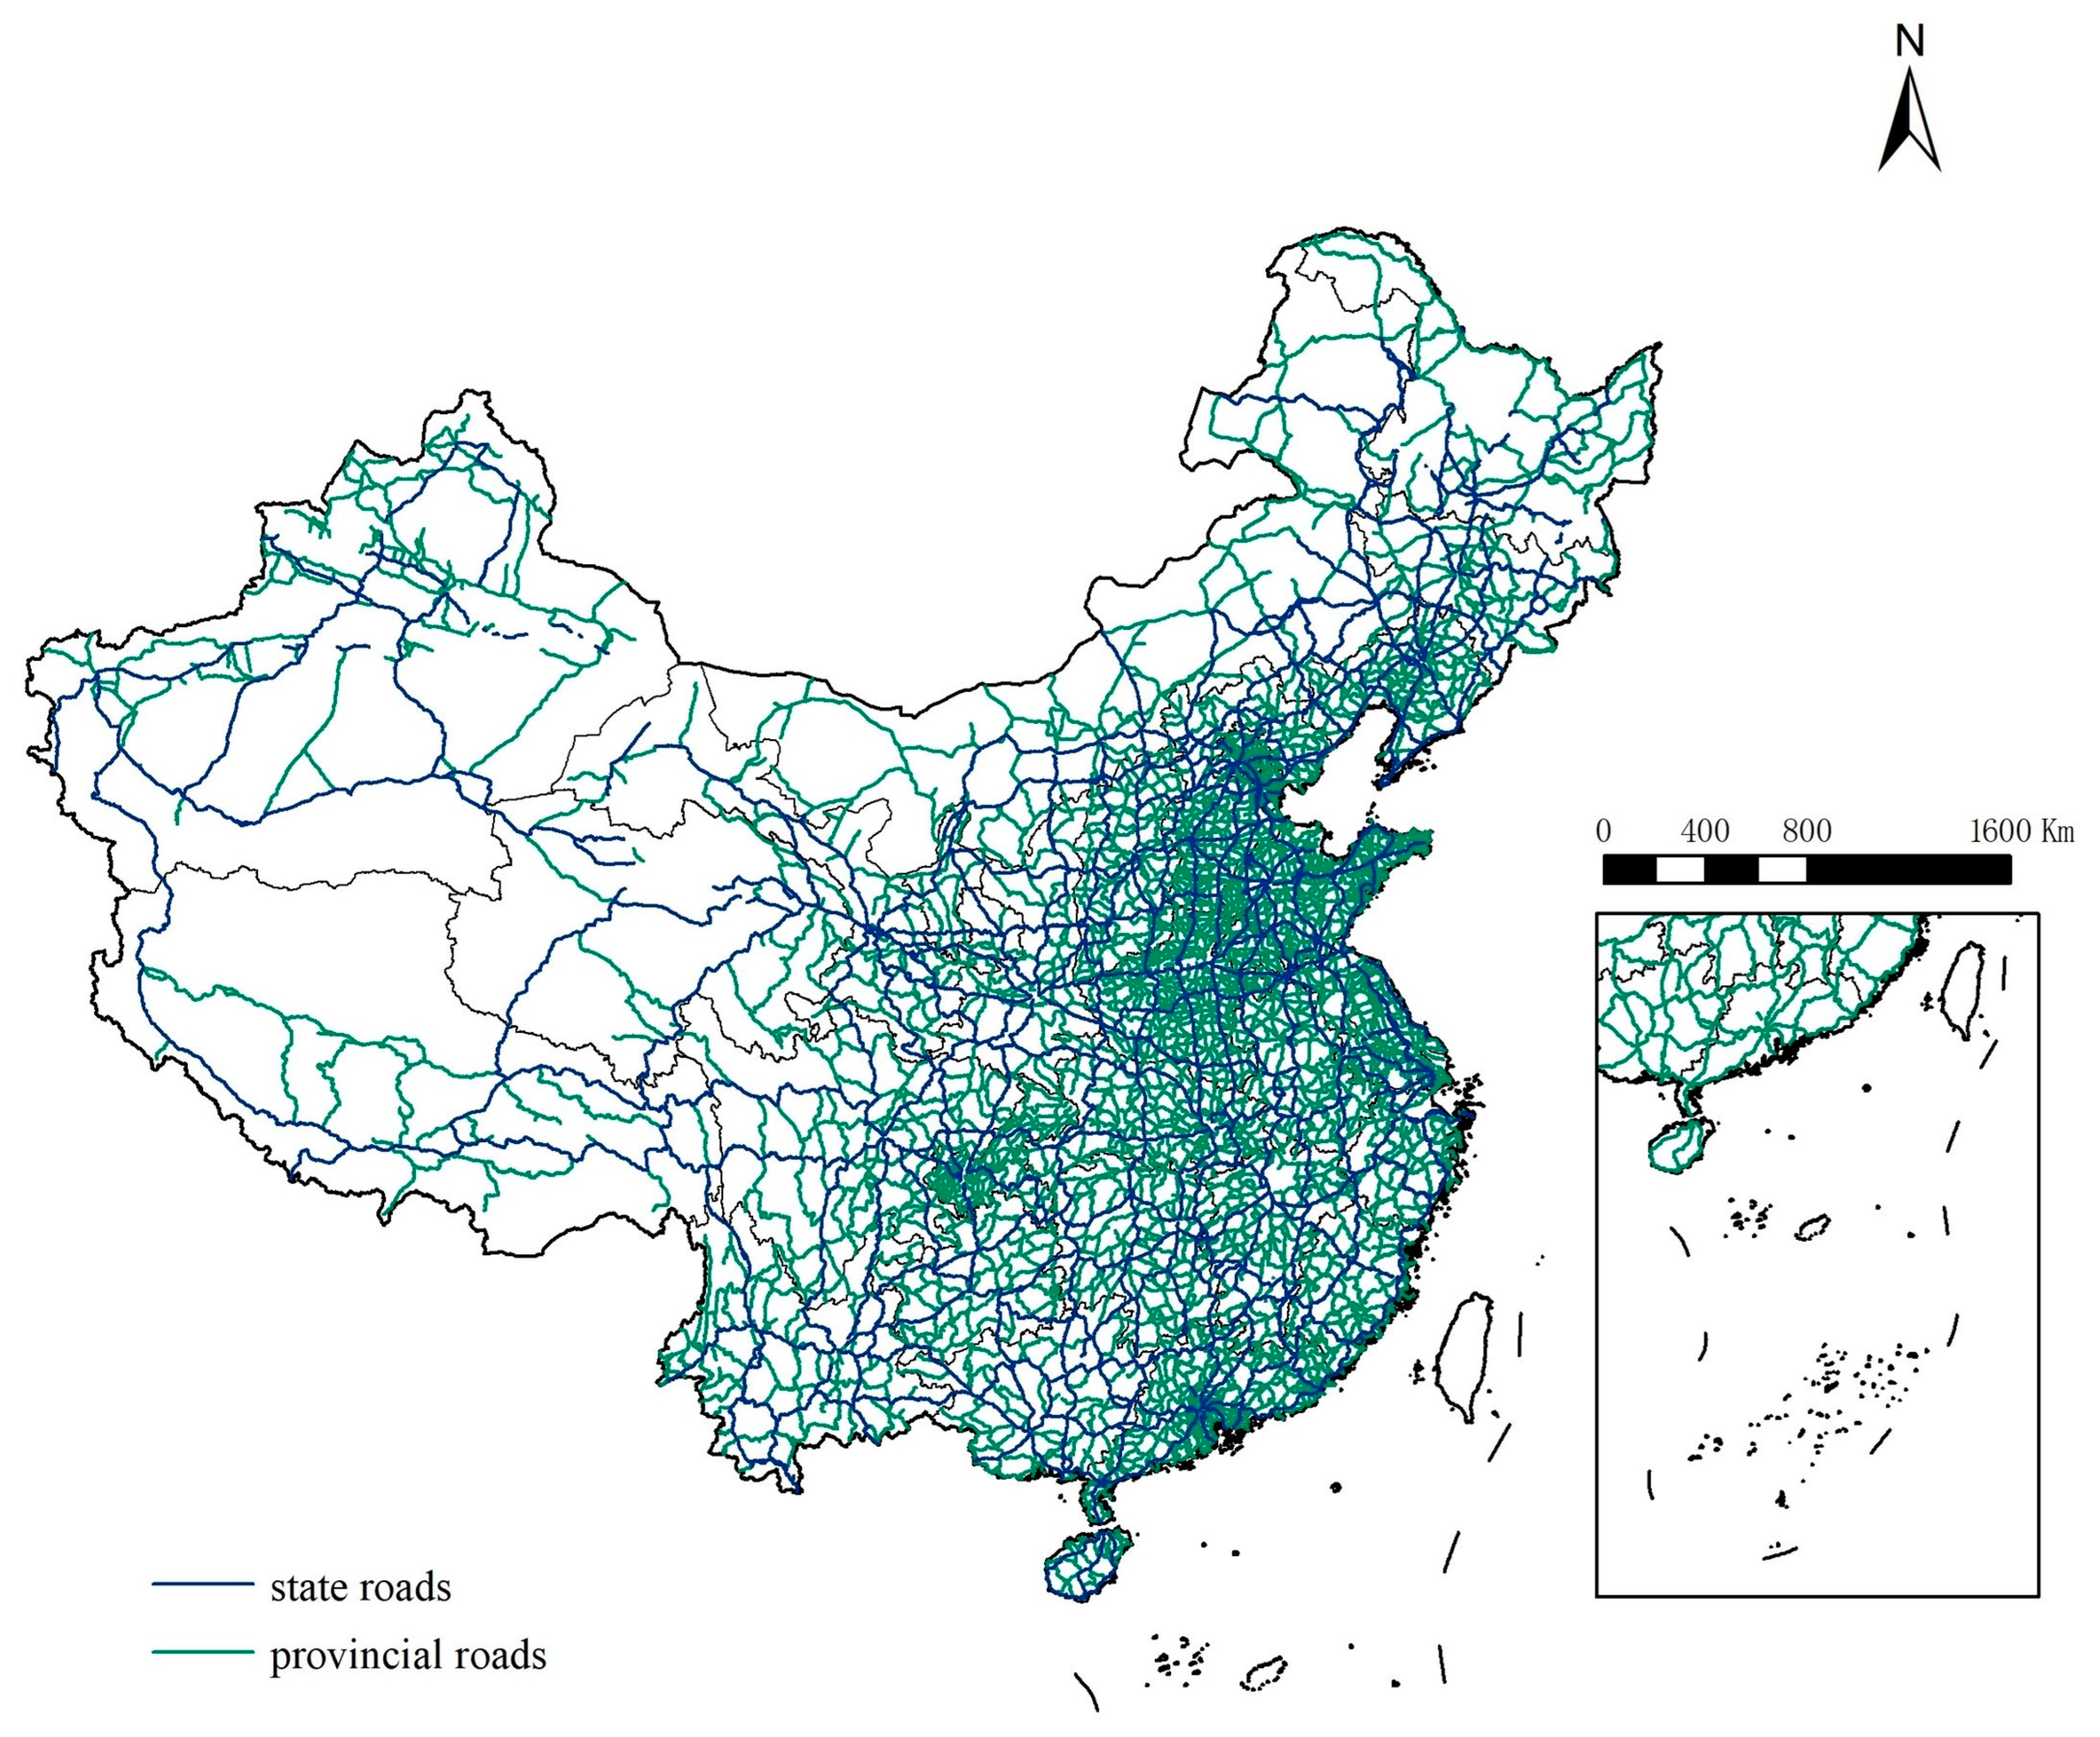
This study aims to fill the research gap and explore the effect of highway infrastructure on population mobility based on a sample of 800 counties and districts in China covering the period from 2000 to 2019. We contribute to the literature in the following ways. First, we study the impact of highways on population mobility at the county level. Previous studies have generally focused on the effect of railways on mobility [19,21] or on the urban level [13]. Highways are more like the ‘capillaries’ of county economies, and taking counties as the research sample is conducive to examining the role of infrastructure in population mobility from a more microscopic perspective. Second, our research contributes by exploring the moderating effect of spatial distance to large cities, human capital, and the digital economy on the nexus of highway infrastructure and mobility, which can enrich the research on infrastructure and mobility. Third, to address the issue of potential endogeneity, this paper considers that the distance between counties and historical post roads and modern highway density is highly correlated, but post roads were mostly used for military purposes, thus ensuring their weak impact on population movement. Therefore, this paper uses Ming dynasty post roads as an instrumental variable to mitigate the interference of the endogeneity problem.
The remainder of the article is organized as follows: Section 2 is the background of this study; Section 3 is the literature review and hypothesis development; Section 4 presents the data and methodology; Section 5 presents the baseline regression analysis, robustness tests, and heterogeneity analysis; Section 6 presents the moderating effect test; and, finally, Section 7 presents the conclusions and implications of this study.

2. Classical Facts

Since 2000, the implementation of the new rural construction strategy in China has significantly increased the scale of highway infrastructure. At the same time, population mobility became more frequent. This section provides classical facts on the expansion of China’s highway infrastructure and population mobility under the new rural construction strategy, laying a factual foundation for subsequent empirical research.

2.1. New Rural Construction Stategy and Expansion of Highway Infrastructure

In 2005, the Fifth Plenary Session of the 16th CPC Central Committee formally proposed the goal of building a new socialist countryside and made it a major historical task in the process of China’s modernization. The highway is one of the most important infrastructures in remote areas. It plays a critical role in connecting rural and urban areas and makes a significant contribution to the improvement of agricultural productivity and agricultural growth [22]. The new rural construction strategy has accelerated the expansion of China’s highway infrastructure. At the end of 2022, the national highway mileage reached 5.2807 million kilometers, an increase of 1.9355 million kilometers from the end of 2005. A map of the state and provincial highways in China is shown in Figure 1.

2.2. Trends and Patterns of Population Mobility in China

There is a significant interregional economic gap in China. With the advancement of household registration system reform, the migrant population has become an important driving force for China’s economic growth. According to the seventh national census, the size of the migrant population in China is 376 million, accounting for 41.6% of the urban population of 902 million, such that China has realized the transformation from ‘rural China’ to ‘migrating China’.
The percentages of population outflow, inflow–outflow balance, and inflow of counties and districts in the sample for each year are shown in Figure 2. It can be seen that the percentage of the counties and districts with population outflow increased year by year from 2017 to 2019, and all of them exceeded 50%, indicating that there has been an obvious trend of population concentration in recent years.

3. Literature Review and Hypotheses Development

The theory of new economic geography emphasizes that labor mobility, capital externalities, and transportation costs may jointly determine the integration of economic activities in spatial allocation and that population mobility is the result of the interaction of spatial centripetal and centrifugal forces [23]. Empirical studies have focused on the role of transportation infrastructure in population mobility and regional spatial structural changes but have not reached consistent conclusions. Among them, Chandra and Thompson [24] conducted a quantitative analysis using U.S. county-level interstate highway construction data to demonstrate that highways affect the spatial distribution of economic activities and increase the economic and labor concentration levels in counties along the highway. Herzog [25] pointed out that highways increase population and employment due to enhanced market access. Ma et al. [21] proxied the improvement in transportation conditions with an increase in train speed and found that transportation infrastructure significantly enhances the free movement and optimal allocation of labor.
However, it has also been found that better transportation infrastructure promotes local economic development by facilitating trade, reducing transaction costs, improving information flows, providing nonfarm employment opportunities, and increasing wage income [26], which encourages local nonfarm employment but discourages migration. For example, using household data from Sichuan Province in the mid-1990s, Zhao [27] found that paving roads in areas outside villages had a negative effect on population mobility. Qiao et al. [28] also argued that road expansion helped increase local nonfarm employment opportunities, thereby reducing the willingness to move. Gachassin [29] confirmed that road upgrades improve local living conditions and thus reduce migration in Kenya. In conclusion, the impact of highway infrastructure on population mobility has not been conclusively established [30,31]. Based on this, we propose the first hypothesis.
H1. 
The construction of highway infrastructure will promote the population mobility.
Distance is an important factor in the spatial choice of population migration from a geographic perspective. The ‘push–pull’ theory of population migration, the gravity model, and the Todaro model suggest that the distance between two locations is negatively related to the number of population movements and that long-distance migration implies higher migration costs and greater migration risks, as well as reduced available social resources, difficulty in accessing information, and increased psychological costs [32]. Based on interprovincial population mobility data from 1995 and 2010, Fan et al. [33] found that population mobility is more active between neighboring provinces and that there is a significant effect of geographical proximity. Shen [16] and Gao [34] also confirmed that interprovincial spatial distance is significantly negatively related to population mobility, and the longer the migration distance, the more significant the resistance to migration. Liu et al. [35] used data from the China Migrants Dynamic Survey to conclude that a 1% increase in rail distance to the domicile leads to a 0.23% decrease in the probability of migration. However, there is a difference in the degree of influence of the spatial distance factor on inbound and outbound migration places, with the degree of influence of distance on outmigration being significantly higher than that on immigration. Based on national sample census data, Liu and Gu [36] found that the road network has an increasing role in influencing population migration, especially short- and medium-distance migration behavior. Based on this, we propose the second hypothesis.
H2. 
The impact of highway infrastructure on population mobility is moderated by the distance of the region from large cities.
According to Sjaastad’s theory of labor migration, there is a correlation between human capital factors, such as individual skills and educational attainment, and behavioral decisions of population migration. The urban spatial equilibrium model developed by Davis and Dingel [37] suggests that large cities have a skill premium, and the more capable the people, the more benefits they gain through learning in large cities. Higher human capital accumulation can improve the cognitive ability and earning ability of the migrant population and improve the skill level through ‘learning by doing,’ which is conducive to improving the occupational status and income level of the migrant population [38].
Human capital factors play an important role in migration behavior decisions, and educational attainment is an important indicator of the human capital level. First, the level of education changes the psychological cost and the amount of information obtained by the migrant population [32], which affects their employability, access to job opportunities, and job benefits in the city. The higher the education level of the migrant population, the better their ability to adapt to urban life and the lower the psychological cost of migration, which, in turn, affects the probability of migration of the population. Second, institutional costs are also an important factor influencing the migration decision of the population; individuals in the mobile population with a higher education level are more likely to meet the requirements for settlement, and their willingness to migrate will increase. Some studies consider that rural mobile populations with higher education levels are more adaptable to urban life and have higher migration rates [39]. Based on this, we propose Hypothesis 3.
H3. 
The effect of highway infrastructure on population mobility is moderated by the level of education.
According to Ravenstein’s ‘law of migration’, the development of transportation and communication technology facilitates an increase in the migration rate [40]. Information asymmetry is an important inhibitor of migration. Dekker and Engbersen [41] found that migrating populations use internet-based social media to establish an information access platform, reduce information costs during migration, improve information-seeking efficiency, and maintain strong ties through social relationships in the place of migration for adequate emotional support. Wilson [42] empirically investigated the positive impact of information on employment migration decisions with the help of national news dissemination of the fracking boom, showing that the news significantly increase the specific migration flow from the initial place to the destination each year. Dettling [43] and Atasoy [44] examined the ability of information technology to significantly contribute to population mobility through employment growth. Digital technology, with its strong permeability and innovation, brings population and capital clustering by reducing the cost of the employment information search for workers and improving the efficiency of person–job matching [40]. Based on this, we propose Hypothesis 4.
H4. 
The impact of highway infrastructure on population mobility is moderated by the level of digitization.

4. Materials and Methods

4.1. Data

The sample covers 800 counties and districts in 15 provinces in China from 2000 to 2019. To ensure the consistency of the sample data and the statistical caliber, some counties having serious data deficiencies or involved in administrative adjustment are excluded. We obtain a total of 7666 valid observations.
We explore the impact of highway infrastructure on population mobility by relying on three datasets. One is derived from the China Security Market and Accounting Research (CSMAR) database, including transportation infrastructure, such as highway mileage data, at the county and district levels. The second dataset is from the Regional Statistical Yearbook. This dataset covers all county or district levels and statistical bulletins of local provinces and municipalities. The third is from the China Migrants Dynamic Survey (CMDS). It covers the education data of migrants in China during the period of 2011–2018.

4.2. Baseline Regression Model

To examine the impact of highway infrastructure on population mobility, we construct the following baseline regression model:
M i g r a t i o n c t = β H i g h w a y c t + θ X c t + γ c + λ t + ε c t
where c and t represent the region and year, respectively. The explained variable M i g r a t i o n c t is the population mobility rate of region c in year t, and the core explanatory variable H i g h w a y c t represents highway density. The coefficient β measures the marginal effect of highway infrastructure on population mobility. X c t is a vector of the control variables. γ c is a fixed effect of the region to control for unobservable geographical and climatic characteristics. λ t represents the year fixed effect, and ε c t is a random disturbance term. Following the previous literature ([45], this study controls for regional characteristics, such as economic development, wage level, industrial structure, per capita fiscal expenditure, and public service level).

4.3. Measurement of Variables

According to the definition of China’s National Bureau of Statistics, the resident population is defined as those living in an area for more than half a year, regardless of their hukou registration place, while the registered population is defined as those registered in a certain place with a hukou. Referring to Zhang et al. [46], the explained variable is proxied with population mobility intensity (Migration), which is defined as the ratio of the difference between the resident population and registered population to the resident population. If Migration is greater than 0, it represents a net inflow of the population. Otherwise, it represents a net outflow of the population. The core explanatory variable is highway density (Highway), which is defined by the ratio of the total highway miles to the total administrative area of the region.
We also control for the various factors that may potentially influence population mobility. Studies have shown that population migration is mainly affected by certain factors, such as the economy, employment, and life, and its original driving force comes from the pursuit of economic income and development opportunities [9,13]. Regions with a high level of economic development and reasonable industrial structure usually have more employment opportunities and higher wage levels, which attract population inflow. Therefore, we control for regional economic development, which is proxied by regional GDP per capita. We also control the local wage level and the industrial structure, which are measured by the average wage of urban employees and the ratio of the secondary industry output to the tertiary industry output.
As China’s population mobility has changed from a personal mobility model to a family mobility model [47], public services have become an important factor affecting the permanent migration of the population. Although there is household registration discrimination in public services in China, the population still tends to flow into cities with higher levels of education and medical services. The research shows that Tiebout’s ‘voting-by-foot’ mechanism of mobility for public services is also established in China [45]. Therefore, this paper takes the public service level represented by per capita fiscal expenditure and per capita medical and educational resources as control variables. The detailed meanings and descriptions are presented in Table 1. Each variable’s descriptive statistics are shown in Table 2.

5. Results

5.1. Baseline Regression Results

To evaluate the impact of highway infrastructure on population mobility, we estimate the baseline model Equation (1), and the results are presented in Table 3. Column (1) is the baseline regression result without control variables, and Columns (2)–(4) control for other time-varying economic variables. Considering that unobservable regional and year fixed characteristics, such as the economic status of different provinces and the difference in ‘bargaining power’ with the central government, can also have an impact on highway construction [48], we further control the cross-term of province and year fixed effects, and the result is shown in Column (4). The results in Table 3 show that the coefficients of highway density are all significantly positive at the statistical level of 1% in all of the regressions, indicating that the development of highway infrastructure has a facilitating effect on population mobility. Taking the estimated results in Column (4) as an example, a 1-unit increase in highway density increases the proportion of population mobility by 0.828%. Improvements in transportation infrastructure can promote population mobility by reducing travel time and increasing transportation efficiency.
For the control variables, we find that the coefficient of GDP is positive and significant at the statistical level of 5%, suggesting that regional economic development helps attract population inflows. The coefficients of industrial structure and wage level are also positive and significant. These findings provide evidence that the construction of highway infrastructure promotes the flow of population to economically developed areas, which is consistent with our expectations and previous studies’ findings [13]. The coefficients of PCEXP and PublicService are negative and statistically significant, which may result from the heterogeneity of the effect of different types of public fiscal expenditure on population migration or endogeneity issues [49].

5.2. Robustness Tests and Endogeneity

The fixed effect estimation has a strong exogeneity hypothesis; that is, the current value of the explanatory variable is completely independent of the past value of the dependent variable, which becomes a potential source of endogeneity [50]. Furthermore, the model in this study may fail to control all other factors that potentially affect population mobility. In addition, there may be a reverse causality between highway infrastructure and population mobility. Specifically, the construction of highways helps people travel and promotes the flow of population. Meanwhile, the willingness and demand for population mobility encourage the government to build more roads. Because our results may be subject to endogeneity issues, we use various approaches to check the robustness of the previously reported results.
First, we use the alternative measures of population mobility and highway infrastructure to re-regress the model. Specifically, the number of elementary school students and the level of housing prices in the county are taken to proxy the intensity of population mobility. The highway infrastructure is proxied with highway miles per capita.
According to the data from the sixth national census, the compulsory education of migrant children has been basically guaranteed, and only 2.94% of school-age children fail to receive compulsory education. Considering the trend of family migration, the number of primary school students will increase with the inflow of population in a city. Therefore, the number of primary school students can be used to approximately reflect the permanent population. According to China’s compulsory education system, children need to return to their place of origin for education after junior high school. Therefore, this paper does not use the number of middle school students as a proxy indicator of the resident population [9].
Higher housing prices mean better development prospects for the city, more job opportunities for individuals, and better public services and infrastructure [51]. Housing prices ‘capitalize’ some unobserved public services or urban characteristics [45], so high housing prices can attract talent inflows.
The regression results are shown in Table 4. Columns (1) and (2) are the results with the alternative measures of population mobility. The results show that the coefficients of highway density (Highway) are significantly positive at the 1% statistical level. Column (3) is based on the measurement of Highway with the highway miles per capita (PerHighway), and its coefficient is still significantly positive at the 1% statistical level. These results indicate that the results in the baseline regression are robust to different measures of the core variables.
Second, we perform a 2SLSregression with an instrumental variable to address the potential endogeneity problem. By referring to Zhu [52], the distance of the county from the Ming Dynasty post road is taken as the instrumental variable for highway infrastructure. We believe it is a valid instrumental variable based on the following inference. On the one hand, because the construction of historical post roads and modern highway construction adopt a similar site selection strategy (that is, selecting the appropriate topographical and geotechnical properties), the Ming Dynasty post road is closely related to modern highway planning. On the other hand, the Ming Dynasty post road was mostly used for military message transmission, which is less affected by the level of economic development and population aggregation, and, to a certain extent, it is not related to the residual term of the model. Therefore, it satisfies the conditions of an instrumental variable.
Considering that the historical instrumental variables are cross-sectional data, we multiply the distance of the county from the Ming Dynasty post road with the year dummy variable as the instrumental variable, and the second-stage result is listed in Column (4) of Table 4. It shows that the estimated coefficient of highway density is significantly positive, which is consistent with the results of the fixed-effects regressions. The magnitude of the coefficient of the core explanatory variables increases after mitigating the effects of endogeneity with the instrumental variables approach, and the downward bias of the estimated coefficients in OLS regressions may come from measurement error or the difference between the local average treatment and the average treatment effect [53]. To mitigate the estimation bias from endogeneity, the Ming Dynasty post roads variable is taken as the instrumental variable to conduct the 2SLS estimation.

5.3. Heterogeneity

To investigate the heterogeneous impact of highway infrastructure on population mobility, we conduct heterogeneity tests from the aspects of location, administrative level, ‘district,’ and ‘county’. First, the regression results by heterogeneous location are shown in Table 5. The estimated coefficients of the core explanatory variable Highway in Columns (1) and (2) are significantly positive at the 1% level, indicating that the construction of highways in the eastern and central regions can significantly promote population inflow. The magnitude of the coefficient of Highway is larger in the eastern region than in the central region, indicating that the marginal effect of highway infrastructure on population mobility is more pronounced in the eastern region. The estimated coefficient of Highway in the western region in Column (3) is significantly negative at the 1% level, indicating that highway infrastructure construction accelerates population outflow from the western counties, and this estimation result provides empirical evidence for the shift of China’s mobile population from the western region to the eastern and central regions. The population agglomeration effect generated by highway construction in the eastern and central regions dominates, while the increase in highway density in the western region promotes population outflow instead.
Next, we further examine the heterogeneous effect of highway infrastructure on population mobility at the administrative level. The regressions are conducted separately according to the counties’ and districts’ affiliations with municipalities and subprovincial cities (Subprovincial), provincial capital cities (Capital), and general prefecture-level cities (Prefecture). The results, shown in Columns (1) and (2) of Table 6, indicate that the coefficients of Highway in the Subprovincial and Capital groups are significantly positive at least at the 5% statistical level. Furthermore, the magnitude of the coefficient in the former regression is significantly larger than that in the latter, indicating that the marginal impact of highway construction on population inflow is greater in the counties or districts affiliated with municipality-level cities and subprovincial cities than in those affiliated with provincial capitals. We believe that cities higher in the administrative hierarchy have more public resources, and highway construction makes their agglomeration advantage more significant and thus more attractive to population inflow. The empirical results also mean that there is a polarization effect between regions, and the construction of highway infrastructure will further promote the agglomeration of labor in counties and districts affiliated with higher-order centers.
Columns (4) and (5) present the regression results of the ‘district’ and ‘county’ subsamples, indicating that highway density has a significantly negative effect on population mobility in the county, while it does not have a significant effect on population mobility in the district. We believe that this conclusion can be explained by two aspects. On the one hand, due to the relatively low level of infrastructure in counties, the construction of highway infrastructure tends to significantly improve the accessibility of the area and thus has a more pronounced effect on promoting the flow of labor. On the other hand, the economy in the county usually has a higher proportion of agriculture, which is less attractive to the mobile population, and the improvement in the level of transportation infrastructure creates conditions for population outflow.

6. Moderating Effect

6.1. Moderating Effect of Distance from High-Order Centers

Considering that the contribution of highway density to population mobility may be influenced by the distance of the county or district from the central city [54], we further test the moderating effect of the distance from high-order centers, and the regression model is set as follows:
M i g r a t i o n c t = β 1 H i g h w a y c t + β 2 H i g h w a y c t × D i s t a n c e c t + β 3 D i s t a n c e c t + θ X c t + γ c + λ t + ε c t
Distance from high-order centers (Distance) is defined as the straight-line distance between the geometric center point of the county or district and the geometric center point of the prefecture-level city to which it belongs (Distance1), the provincial capital city to which it belongs (Distance2), the nearest prefecture-level city (Distance3), and the nearest large city (Distance4). These variables are calculated using ArcGIS. The regression results are shown in Table 7.
The results in Table 7 show that the coefficients of the interaction terms of highway infrastructure and spatial distance are all significantly negative at the 1% level in Columns (1)–(3), indicating that spatial distance inhibits the promoting effect of highway density on population mobility. The coefficient of the interaction term is not significant in Column (4). This indicates that the highway network has a greater effect on short- and medium-distance population migration than on long-distance migration. For long-distance migration, the destinations are large cities, and airplanes or railways have become the more dominant transportation mode.

6.2. Moderating Effect of Human Capital

To explore the moderating effect of human capital, we add the interaction term of human capital and highway infrastructure to the model.
M i g r a t i o n c t = β 1 H i g h w a y c t + β 2 H i g h w a y c t × E d u c a t i o n c t + β 3 E d u c a t i o n c t + θ X c t + γ c + λ t + ε c t
Referring to Yang and Pan [55], we use the individual education level (Education) to reflect the human capital of the mobile population. The data are released by the CMDS, in which the highest education levels of ‘not in school’, ‘elementary school’, ‘junior high school’, ‘high school’, ‘university college’, ‘university undergraduate’, and ‘postgraduate’ are assigned to 0, 6, 9, 12, 15, 16, and 19, respectively, to measure the average years of education of the mobile population (Education_Ave). In addition, the education structure of the migrant population in each region is represented by the percentage of the population with junior high school education and below (Education_Low), the percentage of the population with high school and secondary school education (Education_Mid), and the percentage of the population with a bachelor’s degree and above (Education_Hig). These variables are proxies for the education level of the migrant population. Because there is a lag effect of the education level of the migrant population on the willingness to migrate, this study takes a first-order lag for the education level variable.
The regression results are shown in Table 8. The coefficient of Highway × Education_Ave in the results of Column (1) is positive and significant at the 5% statistical level, which indicates that the average education level of the migrating population has a positive moderating effect on the effect of highway density on population flow, and the higher the average education level of the migrating population is in the district and county, the stronger the effect of highway infrastructure on promoting population inflow. The negative coefficient of Highway × Education_Low, the cross-product of highway infrastructure and the proportion of the migrant population with low education in Column (2) of the regression results, indicates that if the education level of the migrant population in the district and county is lower, the construction of highway infrastructure will intensify the outflow of the population in the area, while Columns (3) and (4) of the regression results indicate that when a higher proportion of the migrant population in the district and county has obtained high school education or above, highway infrastructure construction will promote the inflow of population in the district. Comparing the results in Columns (3) and (4), the interaction term Highway × Education_Hig’s coefficient is statistically significant at the 1% level, indicating that if the proportion of the highly educated mobile population in the district and county is larger, then the construction of highway infrastructure can more significantly promote the inflow of population in the area, and the above empirical results confirm Hypothesis 3. Some studies report that people with higher educational attainment have a higher propensity to migrate [56]. The study further confirms that regions with more educated population agglomeration are usually more attractive to the mobile population, and highway infrastructure helps realize the attractiveness of the region and strengthen the agglomeration of human capital.

6.3. Moderating Effects of Digital Economy Development

This section examines the moderating effect of digital economic development driven by information technology on the nexus of highway infrastructure and population migration, and the regression model is set as follows:
M i g r a t i o n c t = β 1 H i g h w a y c t + β 2 H i g h w a y c t × D i g i t i z a t i o n c t + β 3 D i g i t i z a t i o n c t + θ X c t + γ c + λ t + ε c t
Here, the digitization level (Digitization) is proxied by the number of fixed telephone subscribers per 100 people, the number of broadband access subscribers per 100 people, and the number of cell phone subscribers per 100 people. The entropy value method is applied to calculate the digital economy index of each county and district to reflect the regional digital economy development level. The coefficient β 2 captures the moderating effect of digitalization on the influence of highway infrastructure on population mobility.
The regression results are presented in Table 9. Column (1) shows that the coefficient of the interaction term (Highway × Digitization) between highway density and the level of digital economic development is significantly positive at the 1% level, indicating that the level of regional digitization reinforces the role of highway density in promoting population mobility. Regression results (2)–(4) use the number of fixed telephone users, the number of broadband access users, and the number of cell phone users as proxies for the level of digital economy development, respectively. The coefficients of the cross-terms are significantly positive, indicating that the application of communication technology increases the marginal impact of highway infrastructure on population mobility due to its enhancement of the efficiency of information transfer and the reduction of information asymmetry between regions [40].

7. Conclusions and Implications

Based on panel data from 800 counties and districts in China from 2000 to 2019, we contribute to the literature by exploring the impact of highway infrastructure on population mobility with fixed-effects models and the 2SLS estimation method. Our results show that the improvement in highway infrastructure can significantly increase population mobility, which is robust to the different measures of population mobility intensity and highway infrastructure as well as to the estimation of 2SLS. This impact has heterogeneity across regions and levels of the administrative hierarchy. For the eastern and central regions, the improvement in highway density significantly promotes population inflow, while for the western regions, it leads to population outflow. We also explore the moderating effects of spatial distance to high-order centers, human capital, and digital economy development. Specifically, the spatial distance to high-order centers inhibits the promoting effect of highway density on population mobility. Meanwhile, regions with more educated population agglomeration are usually more attractive to the mobile population, and highway infrastructure helps realize the attractiveness of the region. In addition, the level of regional digitization reinforces the role of highway density in promoting population mobility. These findings have important implications and provide insights for the government to formulate policies to optimize the allocation of labor factors and build a unified national market. First, the government needs to realize that increasing the construction of highway infrastructure, unblocking the capillaries of the transportation network, and promoting the interconnection of urban and rural transportation infrastructure will significantly reduce the barriers to population mobility and improve the allocation efficiency of the labor force.
Second, investment in highway infrastructure needs to be tailored to local conditions to maximize the effect of optimizing the allocation of labor resources. Therefore, investment in transportation infrastructure should consider the regional infrastructure stock, location, and population structure, especially with the aims of strengthening investment in county highway infrastructure construction, revitalizing county labor resources, and optimizing the interregional allocation of labor.
Third, the endowment characteristics of a region, such as the distance from large cities, the education level of the mobile population, and the development level of the digital economy, also play an important and nonnegligible role in regulating the spatial allocation of the labor force through transportation infrastructure. Therefore, when investing in transportation infrastructure, the government should preferably choose regions with better endowment conditions. In addition, local governments can formulate supporting policies to strengthen the introduction of highly educated talent and vigorously develop the digital economy to enhance the optimal effect of transportation infrastructure on resource allocation through the synergy of multidimensional policies.
As with all studies, our work has several limitations, which provide directions for future research. First, due to data availability, the highway infrastructure in this study does not include rural roads, which are of great significance for population mobility in remote rural areas. An in-depth study of this topic using data including country roads is warranted. Second, as our study is conducted using county-level data from China, the conclusions mainly apply to countries like China with a dense population and a large area. Whether these findings apply to developed countries or small economies remains to be verified. In the future, studies using cross-country data are encouraged.

Author Contributions

Conceptualization, Z.J.; data curation, Y.H.; formal analysis, Z.J.; investigation, Y.H.; methodology, Z.J.; writing—original draft, Y.H.; writing—review and editing, Z.J. All authors have read and agreed to the published version of the manuscript.

Funding

The work is fully supported by the National Social Science Fund of China (No. 22BJY061).

Institutional Review Board Statement

Not applicable.

Informed Consent Statement

Not applicable.

Data Availability Statement

The data used in this research are available from the corresponding author upon request.

Conflicts of Interest

The authors declare no conflict of interest.

References

  1. Zenou, Y. Job search and mobility in developing countries. Theory and policy implications. J. Dev. Econ. 2008, 86, 336–355. [Google Scholar] [CrossRef]
  2. Luke, N.; Munshi, K. Women as agents of change: Female income and mobility in India. J. Dev. Econ. 2010, 94, 1–17. [Google Scholar] [CrossRef] [PubMed]
  3. Salehi-Isfahani, D.; Majbouri, M. Mobility and the dynamics of poverty in Iran: Evidence from the 1992–1995 panel survey. Q. Rev. Econ. Financ. 2013, 53, 257–267. [Google Scholar] [CrossRef]
  4. Zhao, P.; Yu, Z. Rural poverty and mobility in China: A national-level survey. J. Transp. Geogr. 2021, 93, 103083. [Google Scholar] [CrossRef]
  5. Kenyon, S.; Lyons, G.; Rafferty, J. Transport and social exclusion: Investigating the possibility of promoting inclusion through virtual mobility. J. Transp. Geogr. 2002, 10, 207–219. [Google Scholar] [CrossRef]
  6. Yu, Z.; Zhao, P. The factors in residents’ mobility in rural towns of China: Car ownership, road infrastructure and public transport services. J. Transp. Geogr. 2021, 91, 102950. [Google Scholar] [CrossRef]
  7. Schöb, R.; Wildasin, D.E. Economic integration and labor market institutions: Worker mobility, earnings risk, and contract structure. Reg. Sci. Urban Econ. 2007, 37, 141–164. [Google Scholar] [CrossRef]
  8. Nutley, S.D. Rural Transport: Time for Action? Geography 2000, 85, 85–87. [Google Scholar]
  9. Wang, Y.; Chen, X. Market Access, Migration and Spatial Differentiation. Econ. Rev. 2019, 1, 3–18+90. [Google Scholar]
  10. Jin, Z.; Zhang, J. Access to local citizenship and internal migration in a developing country: Evidence from a Hukou reform in China. J. Comp. Econ. 2023, 51, 181–215. [Google Scholar] [CrossRef]
  11. Gray, C.; Mueller, V. Drought and Population Mobility in Rural Ethiopia. World Dev. 2012, 40, 134–145. [Google Scholar] [CrossRef] [PubMed]
  12. Bassetto, M.; McGranahan, L. Mobility, population growth, and public capital spending in the United States. Rev. Econ. Dyn. 2021, 41, 255–277. [Google Scholar] [CrossRef]
  13. Wang, W.; Xie, J.; Zhang, L. Regional Intergenerational Mobility Preferences of Population Migration: Micro Evidence and Impact Mechanism. J. Manag. World 2019, 35, 89–103+135. [Google Scholar]
  14. Gu, H.; Liu, Z.; Shen, T. Spatial pattern and determinants of migrant workers’ interprovincial hukou transfer intention in China: Evidence from a National Migrant Population Dynamic Monitoring Survey in 2016. Popul. Space Place 2020, 26, e2250. [Google Scholar] [CrossRef]
  15. Matsiuk, N. Thrive, survive, or perish: The impact of regional autonomy on the demographic dynamics of Italian Alpine territories. J. Reg. Sci. 2022, 62, 1512–1558. [Google Scholar] [CrossRef]
  16. Shen, G. Study on the evolution and explanation of inter-provincial population flow network in China. China Popul. Resour. Environ. 2018, 28, 1–9. [Google Scholar]
  17. Pradhan, R.P.; Arvin, M.B.; Nair, M. Urbanization, transportation infrastructure, ICT, and economic growth: A temporal causal analysis. Cities 2021, 115, 103213. [Google Scholar] [CrossRef]
  18. Mo, J. Heterogeneous effects of urban transport infrastructure on population distribution: The role of educational access. Reg. Sci. Urban Econ. 2023, 101, 103902. [Google Scholar] [CrossRef]
  19. Deng, T.; Wang, D.; Yang, Y.; Yang, H. Shrinking cities in growing China: Did high speed rail further aggravate urban shrinkage? Cities 2019, 86, 210–219. [Google Scholar] [CrossRef]
  20. Jedwab, R.; Storeygard, A. The Average and Heterogeneous Effects of Transportation Investments: Evidence from Sub-Saharan Africa 1960–2010. J. Eur. Econ. Assoc. 2022, 20, 1–38. [Google Scholar] [CrossRef]
  21. Ma, W.; Wang, Y.; Liu, S. Transportation Infrastructure and Population Migration in China: An Analysis Based on Gravity Model. China Soft Sci. 2012, 3, 69–77. [Google Scholar]
  22. Antle, J.M. Human capital, infrastructure, and the productivity of Indian rice farmers. J. Dev. Econ. 1984, 14, 163–181. [Google Scholar] [CrossRef]
  23. Kemeny, T.; Storper, M. Superstar Cities and Left-Behind Places: Disruptive Innovation, Labor Demand, and Interregional Inequality, Working Paper. 2020. Available online: https://eprints.lse.ac.uk/103312/ (accessed on 25 March 2022).
  24. Chandra, A.; Thompson, E. Does public infrastructure affect economic activity?: Evidence from the rural interstate highway system. Reg. Sci. Urban Econ. 2000, 30, 457–490. [Google Scholar] [CrossRef]
  25. Herzog, I. National transportation networks, market access, and regional economic growth. J. Urban Econ. 2021, 122, 103316. [Google Scholar] [CrossRef]
  26. Persyn, D.; Barbero, J.; Díaz-Lanchas, J.; Lecca, P.; Mandras, G.; Salotti, S. The Ripple Effects of Large-Scale Transport Infrastructure Investment. J. Reg. Sci. 2023, 63, 755–792. [Google Scholar] [CrossRef]
  27. Zhao, Y. Leaving the Countryside: Rural-to-Urban Migration Decisions in China. Am. Econ. Rev. 1999, 89, 281–286. [Google Scholar] [CrossRef]
  28. Qiao, F.; Rozelle, S.; Huang, J.; Zhang, L.; Luo, R. Road Expansion and Off-Farm Work in Rural China. China Q. 2014, 218, 428–451. [Google Scholar] [CrossRef]
  29. Castaing Gachassin, M. Should I Stay or Should I Go? The Role of Roads in Migration Decisions. J. Afr. Econ. 2013, 22, 796–826. [Google Scholar] [CrossRef]
  30. Baum-Snow, N.; Henderson, J.V.; Turner, M.A.; Zhang, Q.; Brandt, L. Does investment in national highways help or hurt hinterland city growth? J. Urban Econ. Cities China 2020, 115, 103124. [Google Scholar] [CrossRef]
  31. Levkovich, O.; Rouwendal, J.; van Ommeren, J. The impact of highways on population redistribution: The role of land development restrictions. J. Econ. Geogr. 2020, 20, 783–808. [Google Scholar] [CrossRef]
  32. Thomas, M.J. Employment, Education, and Family: Revealing the Motives behind Internal Migration in Great Britain. Popul. Space Place 2019, 25, e2233. [Google Scholar] [CrossRef] [PubMed]
  33. Fan, X.; Liu, H.; Zhang, Z.; Zhang, J. The Spatio-Temporal Characteristics and Modeling Research of Inter-Provincial Migration in China. Sustainability 2018, 10, 618. [Google Scholar] [CrossRef]
  34. Gao, X. Trends in Inter-provincial Migration Distance in China. Popul. Res. 2018, 42, 25–34. [Google Scholar]
  35. Liu, T.; Zhuo, Y.; Wang, J. How multi-proximity affects destination choice in onward migration: A nested logit model. Acta Geogr. Sin. 2020, 75, 2716–2729. [Google Scholar]
  36. Liu, Z.; Gu, H. Evolution Characteristics of Spatial Concentration Patterns of Interprovincial Population Migration in China from 1985 to 2015. Appl. Spat. Anal. 2020, 13, 375–391. [Google Scholar] [CrossRef]
  37. Davis, D.R.; Dingel, J.I. The comparative advantage of cities. J. Int. Econ. 2020, 123, 103291. [Google Scholar] [CrossRef]
  38. Lyu, L.; Sun, F.; Huang, R. Innovation-based urbanization: Evidence from 270 cities at the prefecture level or above in China. J. Geogr. Sci. 2019, 29, 1283–1299. [Google Scholar] [CrossRef]
  39. Hendricks, L.; Schoellman, T. Human Capital and Development Accounting: New Evidence from Wage Gains at Migration. Q. J. Econ. 2018, 133, 665–700. [Google Scholar] [CrossRef]
  40. Lin, Y. E-Urbanism: E-Commerce, Migration, and the Transformation of Taobao Villages in Urban China. Cities 2019, 91, 202–212. [Google Scholar] [CrossRef]
  41. Dekker, R.; Engbersen, G. How social media transform migrant networks and facilitate migration. Glob. Netw. 2014, 14, 401–418. [Google Scholar] [CrossRef]
  42. Wilson, R. Moving to Jobs: The Role of Information in Migration Decisions. J. Labor Econ. 2021, 39, 1083–1128. [Google Scholar] [CrossRef]
  43. Dettling, L.J. Broadband in the Labor Market: The Impact of Residential High-Speed Internet on Married Women’s Labor Force Participation. ILR Rev. 2017, 70, 451–482. [Google Scholar] [CrossRef]
  44. Atasoy, H. The Effects of Broadband Internet Expansion on Labor Market Outcomes. ILR Rev. 2013, 66, 315–345. [Google Scholar] [CrossRef]
  45. Xia, Y.; Lu, M. The “Three Moves of Mencius” among Cities: An Empirical Study of the Influence of Public Services on Labor Flows. J. Manag. World 2015, 10, 78–90. [Google Scholar]
  46. Zhang, Y.; Liang, Q. Labor Mobility, Cross-regional Allocation of Human Capital, and Productivity of Firms. Stud. Labor Econ. 2022, 10, 55–86. [Google Scholar]
  47. Dustmann, C.; Fasani, F.; Meng, X.; Minale, L. Risk Attitudes and Household Migration Decisions. J. Hum. Resour. 2023, 58, 112–145. [Google Scholar] [CrossRef]
  48. Dong, X.; Liu, Y. Does Highway Promote Economy Development? Evidence from the China National Highway Construction during 2004–2013. Nankai Econ. Stud. 2018, 4, 3–20. [Google Scholar]
  49. Kleven, H.; Landais, C.; Muñoz, M.; Stantcheva, S. Taxation and Migration: Evidence and Policy Implications. J. Econ. Perspect. 2020, 34, 119–142. [Google Scholar] [CrossRef]
  50. Wintoki, M.B.; Linck, J.S.; Netter, J.M. Endogeneity and the dynamics of internal corporate governance. J. Financ. Econ. 2012, 105, 581–606. [Google Scholar] [CrossRef]
  51. Garriga, C.; Hedlund, A.; Tang, Y.; Wang, P. Rural-Urban Migration, Structural Transformation, and Housing Markets in China. Am. Econ. J. Macroecon. 2023, 15, 413–440. [Google Scholar] [CrossRef]
  52. Zhu, P. Does High-Speed Rail Stimulate Urban Land Growth? Experience from China. Transp. Res. Part D Transp. Environ. 2021, 98, 102974. [Google Scholar] [CrossRef]
  53. Heblich, S.; Trew, A.; Zylberberg, Y. East-Side Story: Historical Pollution and Persistent Neighborhood Sorting. J. Political Econ. 2021, 129, 1508–1552. [Google Scholar] [CrossRef]
  54. Ahlfeldt, G.M.; Feddersen, A. From Periphery to Core: Measuring Agglomeration Effects Using High-Speed Rail. J. Econ. Geogr. 2018, 18, 355–390. [Google Scholar] [CrossRef]
  55. Yang, Z.; Pan, Y. Are Cities Losing Their Vitality? Exploring Human Capital in Chinese Cities. Habitat Int. 2020, 96, 102104. [Google Scholar] [CrossRef]
  56. Haapanen, M.; Tervo, H. Migration of the Highly Educated: Evidence from Residence Spells of University Graduates. J. Reg. Sci. 2012, 52, 587–605. [Google Scholar] [CrossRef]
Figure 1. Map of state and provincial highways in China.
Sustainability 15 14834 g001
Figure 2. Trends and patterns of population mobility in China, 2000–2019. Data source: China Security Market and Accounting Research (CSMAR) database.
Sustainability 15 14834 g002
Table 1. Variables’ meaning and measurement.
TypeNameMeaningDefinition
Explained variableMigrationPopulation mobility intensity(Resident population − registered population)/resident population × 100
Explanatory variablesHighwayHighway infrastructure densityTotal highway miles in operation/total area of the region
Control variablesGDPEconomic developmentGDP per capita
WageIncomeThe average wage of urban employees
StructureIndustrial structureSecondary industry output value/tertiary industry output value
PCEXPFinancial expenditure per capitaGovernment fiscal expenditure/resident population
PublicServicePublic services(Number of hospital beds + number of general primary and secondary schools)/(resident population × 100)
Table 2. Descriptions of the variables.
VariableObservationsMeanVarianceMixMax
Migration10,713−1.3159.153−97.5973.22
Highway10,7130.6860.5820.002914.998
GDP10,71328,08133,2571530363,673
Structure10,7131.3930.8860.039910.09
PCEXP10,7134723587696.1773,525
Wage766623,93817,7941181392,752
PublicService10,70831.2317.520.822178.7
Table 3. Regression results of the baseline regression.
Variables(1)(2)(3)(4)
Highway1.678 ***1.693 ***0.930 ***0.828 ***
(2.57)(2.68)(3.19)(2.57)
GDP 5.644 ***1.1260.557 **
(3.04)(1.36)(2.06)
Structure 0.6960.6831.364 **
(0.61)(1.31)(2.54)
PCEXP −10.778 ***−17.279 ***−20.025 ***
(−4.76)(−23.76)(−25.68)
Wage 9.337 ***2.851 ***2.046 *
(3.79)(2.83)(1.93)
PublicService −15.526 ***−10.617 ***−10.756 ***
(−4.30)(−14.52)(−14.63)
Constant−1.161−7.910 ***44.214 ***78.623 ***
(−0.36)(−1.45)(9.58)(13.40)
Country FEYESYESYESYES
Year FEYES YESYES
Province × year FE YES
N10,713766676667659
Adj. R20.4630.1180.6060.626
Note: t-statistics are reported in parentheses. ***, **, and * indicate significance at 1%, 5%, and 10%, respectively. Robust standard errors clustered at the county level.
Table 4. Robustness test and 2SLS regression results.
Variables(1)(2)(3)(4)
PupilHousePriceMigration2SLS
Highway0.306 ***0.252 *** 1.605 ***
(11.24)(3.89) (0.602)
PerHighway 6.020 ***
(3.92)
Constant5.656 ***−0.333−13.128 ***5.449 **
(22.08)(−0.21)(−3.48)(2.758)
Country FEYESYESYESYES
Year FEYESYESYESYES
ControlYESYESYESYES
Cragg–Donald Wald F 55.55
N766629176667666
Adj. R20.5090.2790.0120.124
Note: t-statistics are reported in parentheses. *** and ** indicate significance at 1% and 5%, respectively. Robust standard errors clustered at the county level.
Table 5. Location heterogeneity.
Variables(1)(2)(3)
EastCenterWest
Highway1.632 ***1.414 ***−0.743 ***
(4.89)(5.23)(−2.92)
Constant−25.779 ***5.988 ***−22.038 ***
(−6.11)(2.65)(−5.67)
Country FEYESYESYES
Year FEYESYESYES
ControlYESYESYES
N26044923779
Adj. R20.3760.0580.050
Note: t-statistics are reported in parentheses. *** indicates significance at 1%. Robust standard errors clustered at the county level.
Table 6. Administrative hierarchy heterogeneity.
Variables(1)(2)(3)(4)(5)
SubprovincialCapitalPrefectureDistrictCounty
Highway2.069 **1.803 ***0.8860.200−1.468 ***
(2.53)(2.91)(1.23)(0.11)(−3.41)
Constant6.440 **4.43916.093 ***−79.276 ***4.906
(2.16)(1.57)(3.13)(−6.46)(−8.95)
Country FEYESYESYESYESYES
Year FEYESYESYESYESYES
ControlYESYESYESYESYES
N712672949123117355
Adj. R20.1340.1160.2860.2480.014
Note: t-statistics are reported in parentheses. *** and **, indicate significance at 1% and 5%, respectively. Robust standard errors clustered at the county level.
Table 7. The moderating effect of the spatial distance from high-order centers.
Variables(1)(2)(3)(4)
Highway4.970 ***5.714 ***3.494 ***3.678
(6.51)(5.09)(3.30)(1.34)
Highway × Distance1−2.827 ***
(−6.20)
Distance11.496 ***
(4.37)
Highway × Distance2 −2.534 ***
(−4.62)
Distance2 4.711 ***
(9.84)
Highway × Distance3 −1.643 ***
(−2.66)
Distance3 3.491 ***
(7.35)
Highway × Distance4 −1.538
(−1.25)
Distance4 1.380
(1.23)
Constant−26.252 ***−33.216 ***−29.900 ***−26.484 ***
(−9.23)(−11.58)(−10.53)(−3.34)
Country FEYESYESYESYES
Year FEYESYESYESYES
ControlYESYESYESYES
N7576766676667666
Adj. R20.1280.1360.1320.125
Note: t-statistics are reported in parentheses. *** indicates significance at 1%. Robust standard errors clustered at the county level.
Table 8. The moderating effect of human capital.
Variables(1)(2)(3)(4)
Highway2.575 ***2.480 ***2.335 ***2.715 ***
(3.02)(2.91)(2.72)(3.18)
Highway × Education_Ave1.450 **
(2.01)
Edu_Ave0.719
(1.37)
Highway × Education_Low −8.964 *
(−1.80)
Education_Low −2.919
(−0.80)
Highway × Education_Mid 12.841 *
(1.81)
Education_Mid 5.795
(1.27)
Highway × Education_Hig 4.053 ***
(6.30)
Education_Hig 2.198
(0.14)
Constant1.52110.6254.7083.549
(0.06)(0.42)(0.20)(0.14)
Country FEYESYESYESYES
Year FEYESYESYESYES
ControlYESYESYESYES
N414414415414
Adj. R20.1300.1390.1400.137
Note: t-statistics are reported in parentheses. ***, **, and * indicate significance at 1%, 5%, and 10%, respectively. Robust standard errors clustered at the county level.
Table 9. The moderating effect of digital economy development.
Variables(1)(2)(3)(4)
DigitizationDigitization_TelDigitization_NetDigitization_Mob
Highway1.104 **−0.5701.091 ***0.983 ***
(2.31)(−1.25)(3.06)(2.76)
Highway× Digitization0.576 ***
(2.89)
Digitization−2.357 ***
(−4.98)
Highway× Digitization_Tel 0.657 *
(1.75)
Digitization_Tel −1.379 ***
(−3.92)
Highway× Digitization_Net 0.645 ***
(3.01)
Digitization_Net −0.430 **
(−1.99)
Highway× Digitization_Mob 0.547 **
(2.04)
Digitization_Mob −0.767 **
(−2.54)
Constant−36.780 ***−17.925 ***−18.164 ***−15.499 ***
(−5.03)(−3.23)(−4.05)(−3.91)
Country FEYESYESYESYES
Year FEYESYESYESYES
ControlYESYESYESYES
N1509150914471509
Adj. R20.0680.0660.0410.061
Note: t-statistics are reported in parentheses. ***, ** and * indicate significance at 1%, 5%, and 10%, respectively. Robust standard errors clustered at the county level.
Disclaimer/Publisher’s Note: The statements, opinions and data contained in all publications are solely those of the individual author(s) and contributor(s) and not of MDPI and/or the editor(s). MDPI and/or the editor(s) disclaim responsibility for any injury to people or property resulting from any ideas, methods, instructions or products referred to in the content.

