


Wayside Railway Switch and Crossing Monitoring Using Isolation Forest Anomaly Scores

Abstract
:1. Introduction
2. Methods
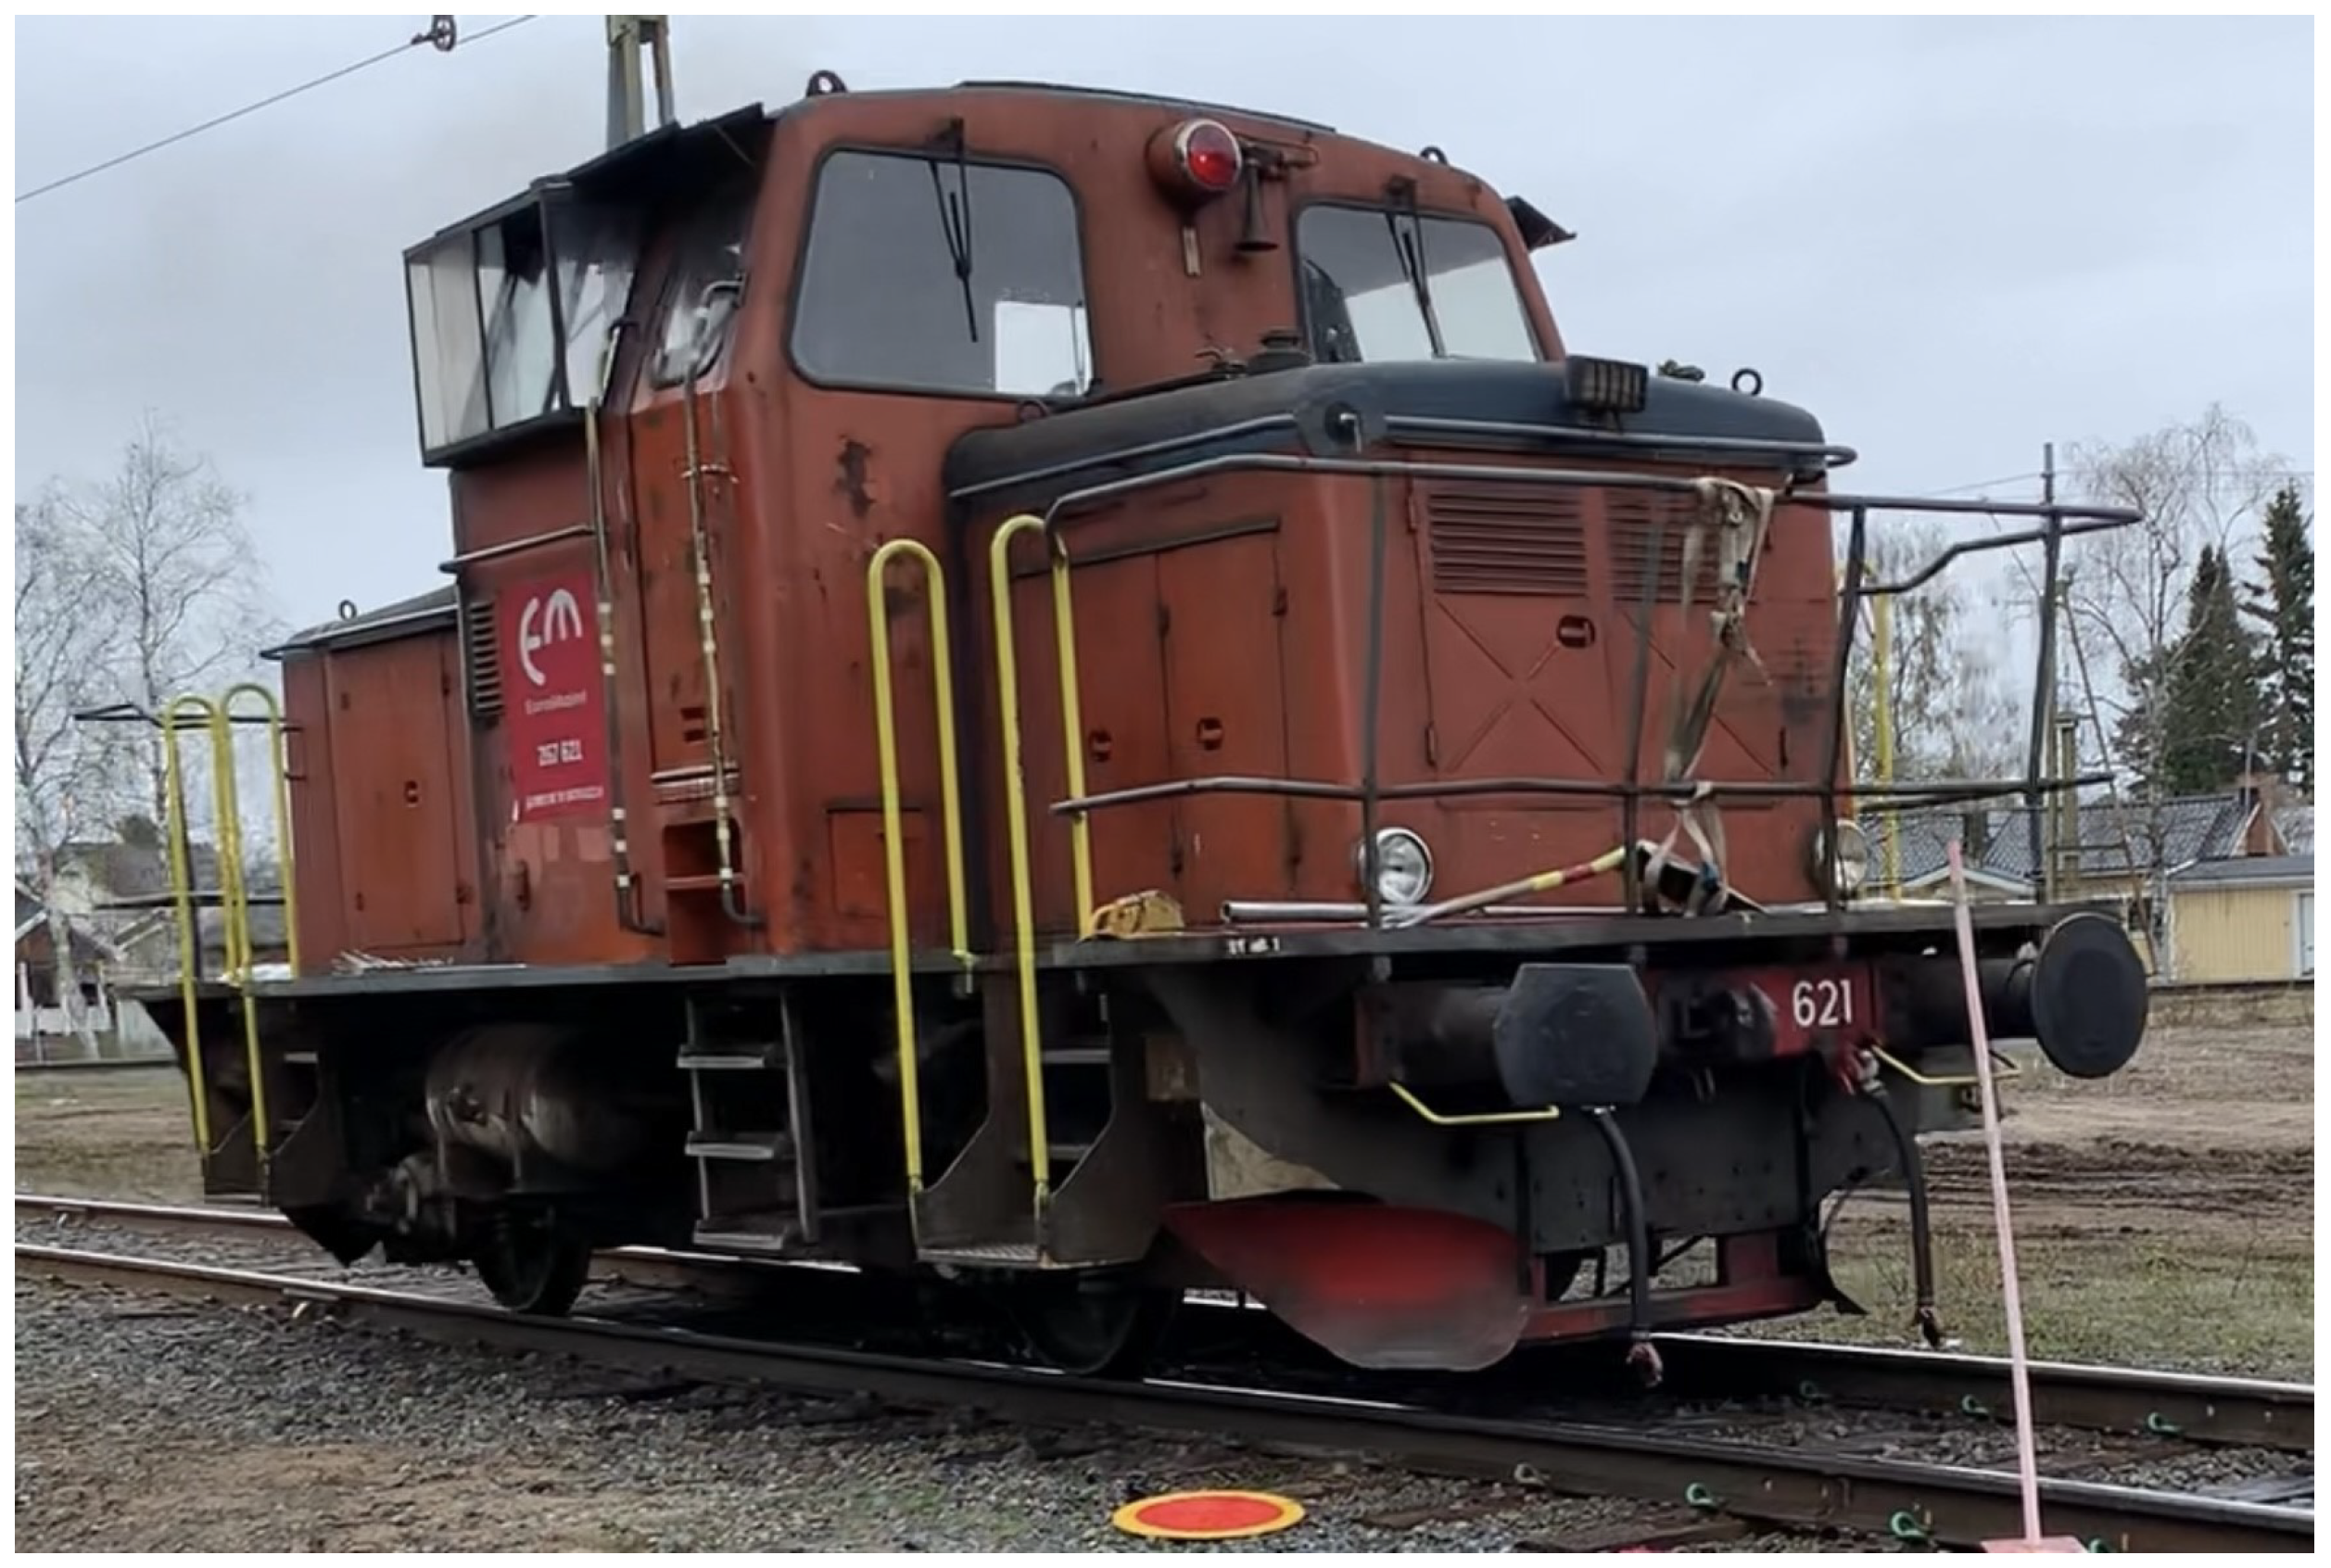
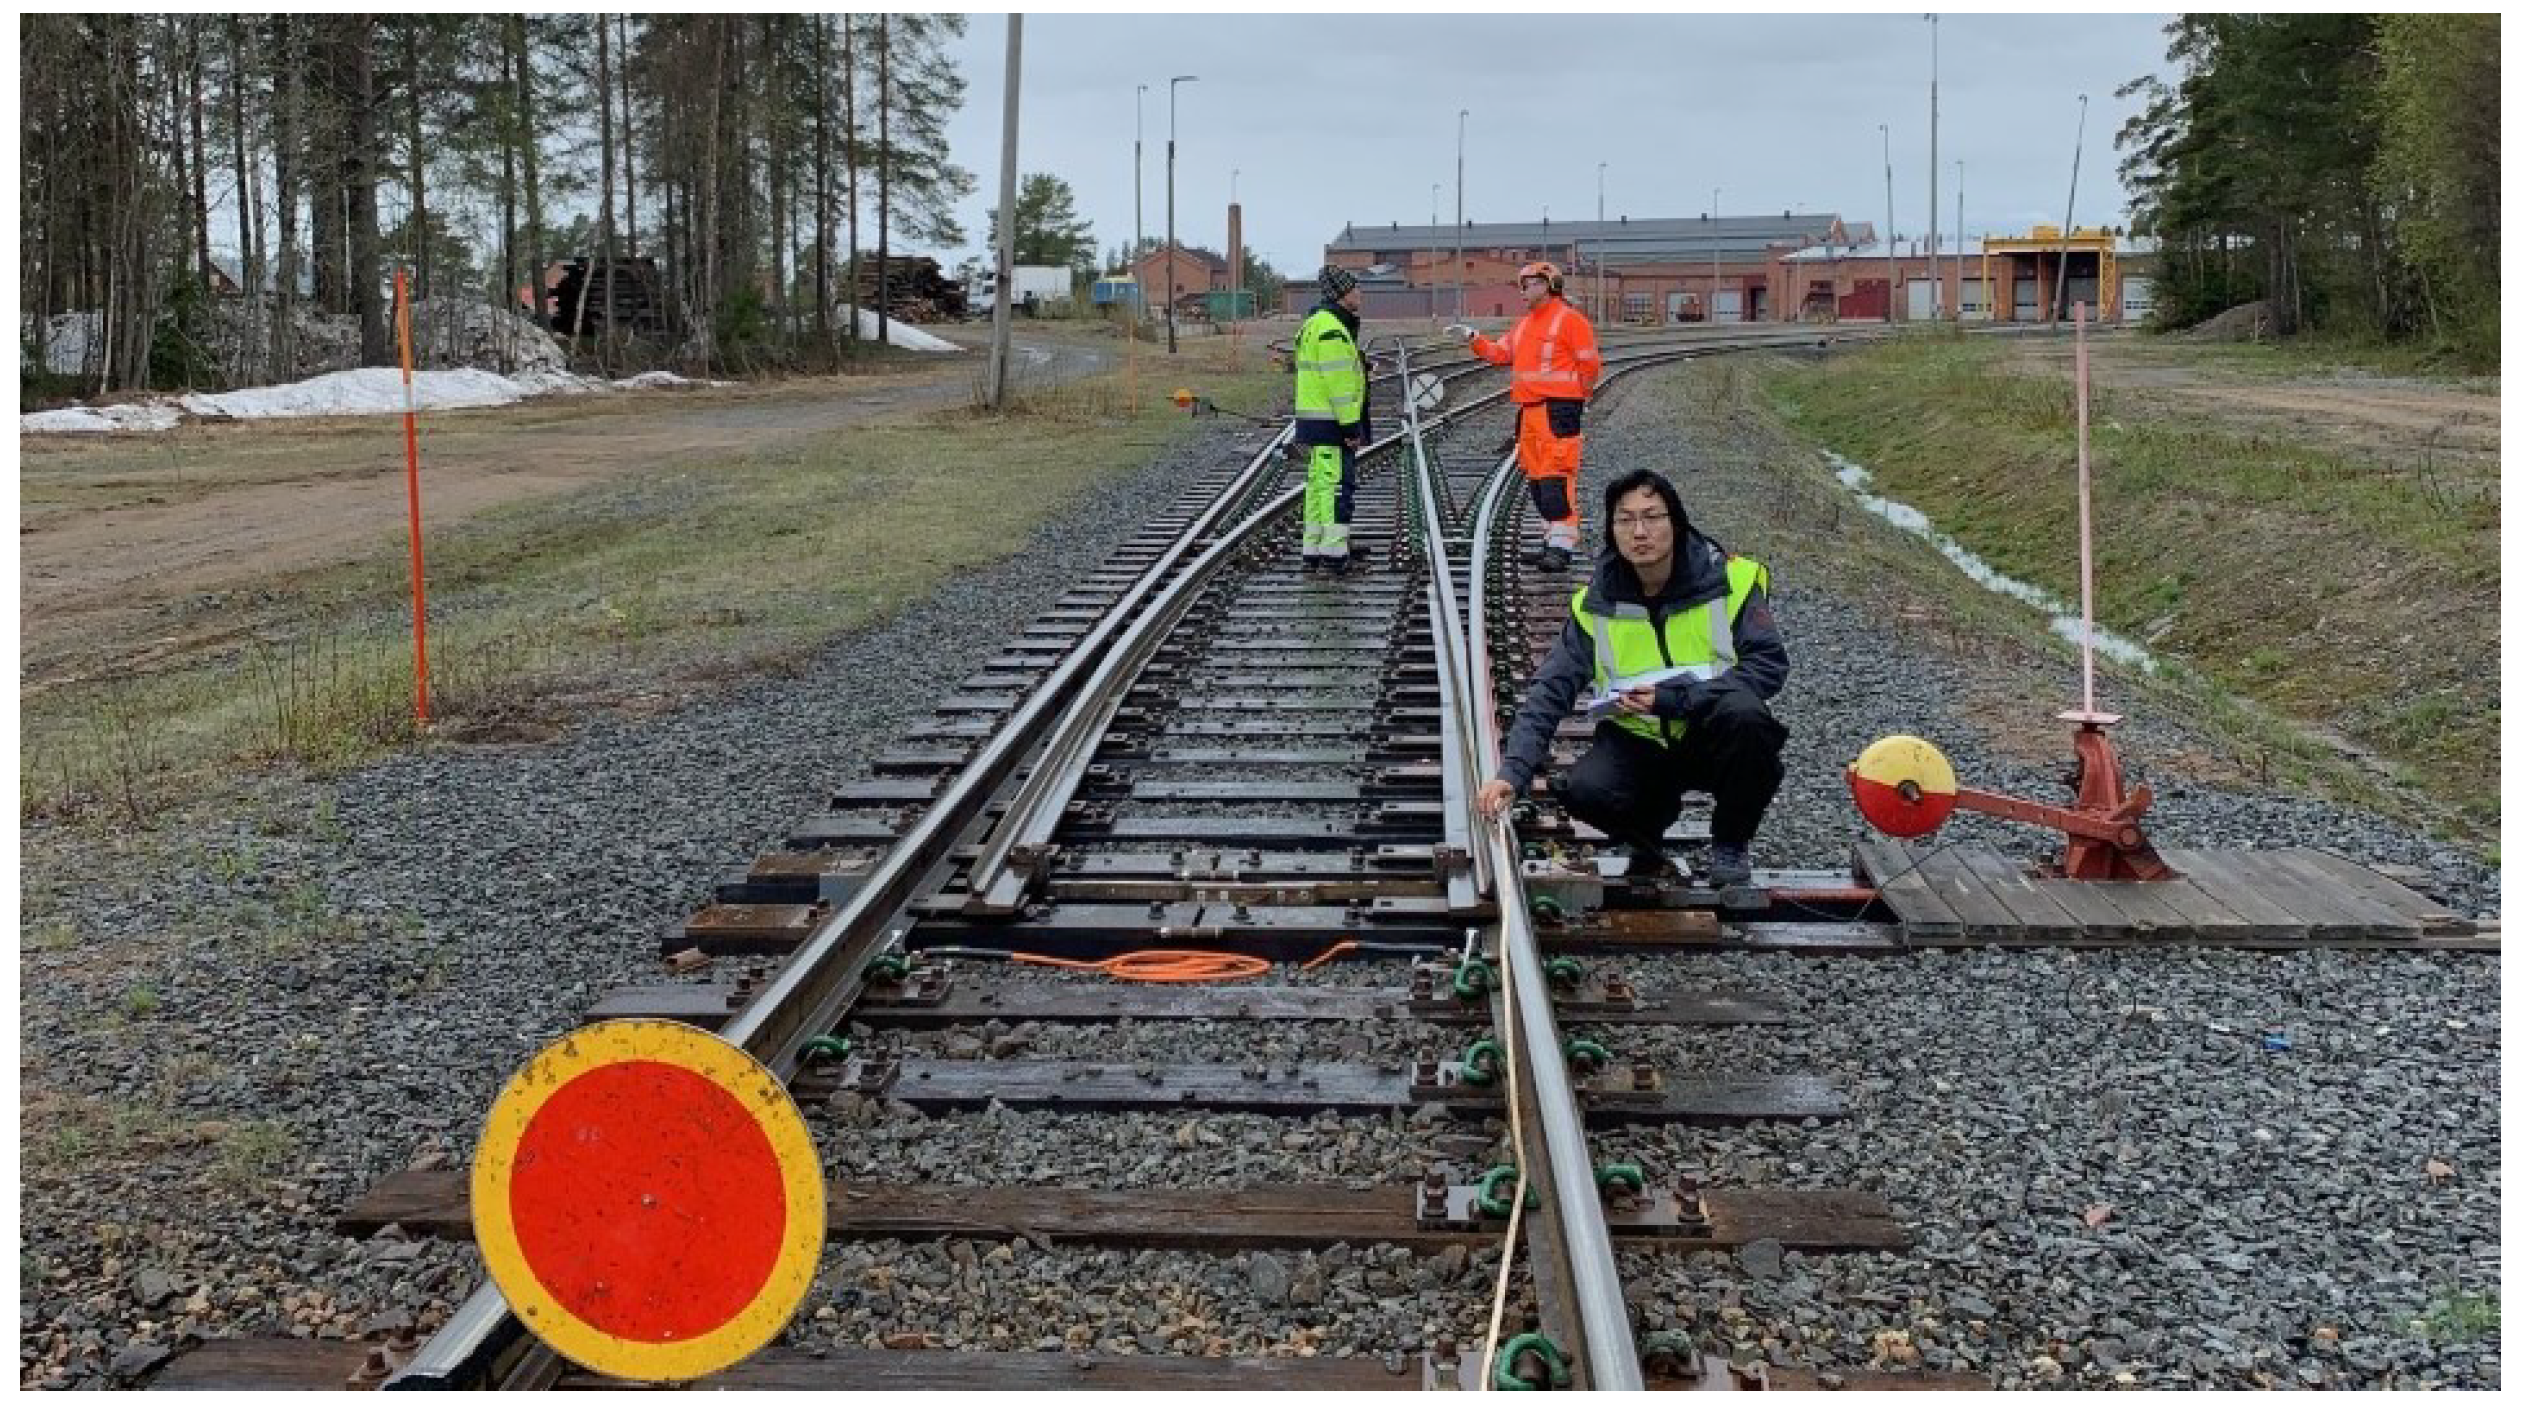
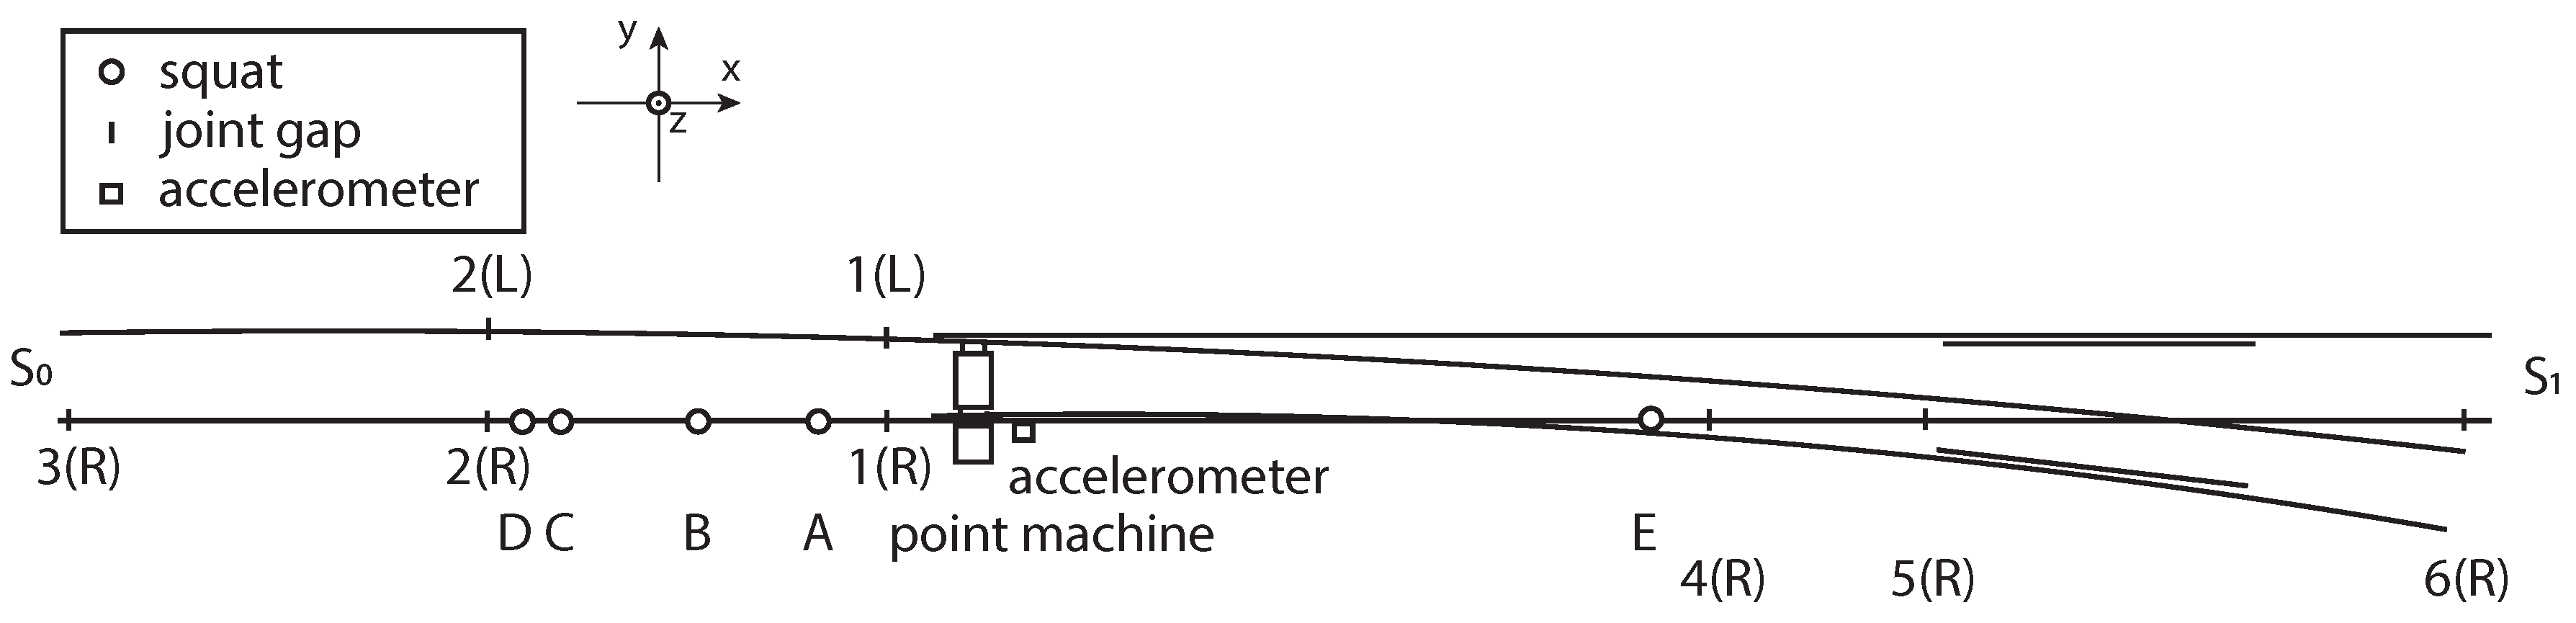
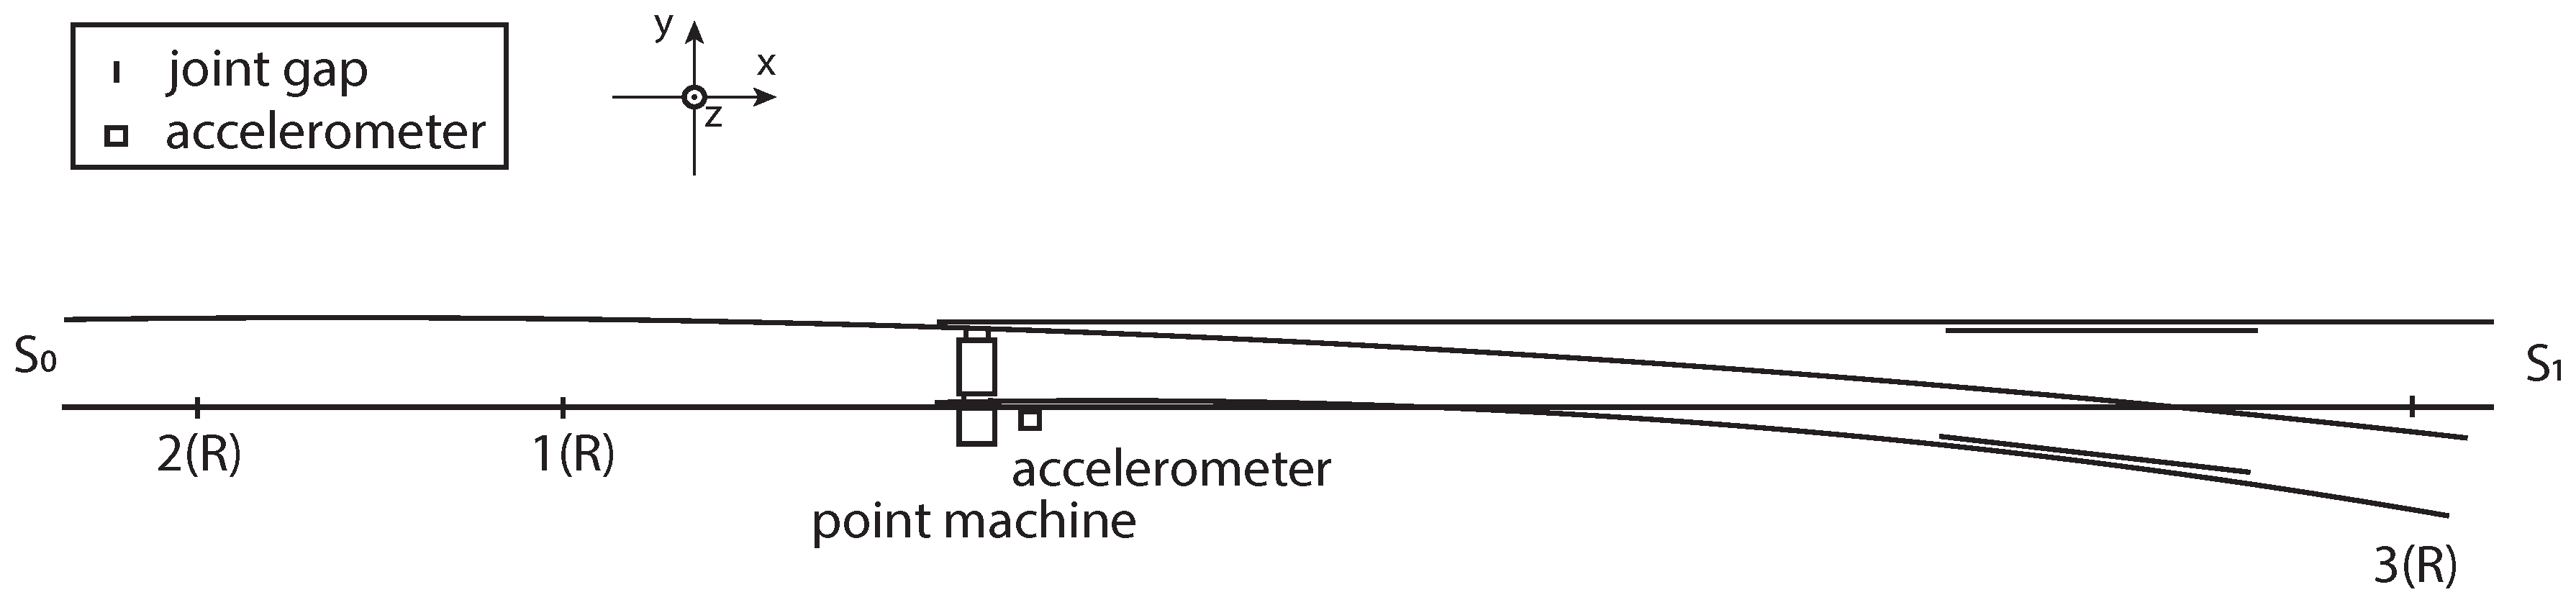
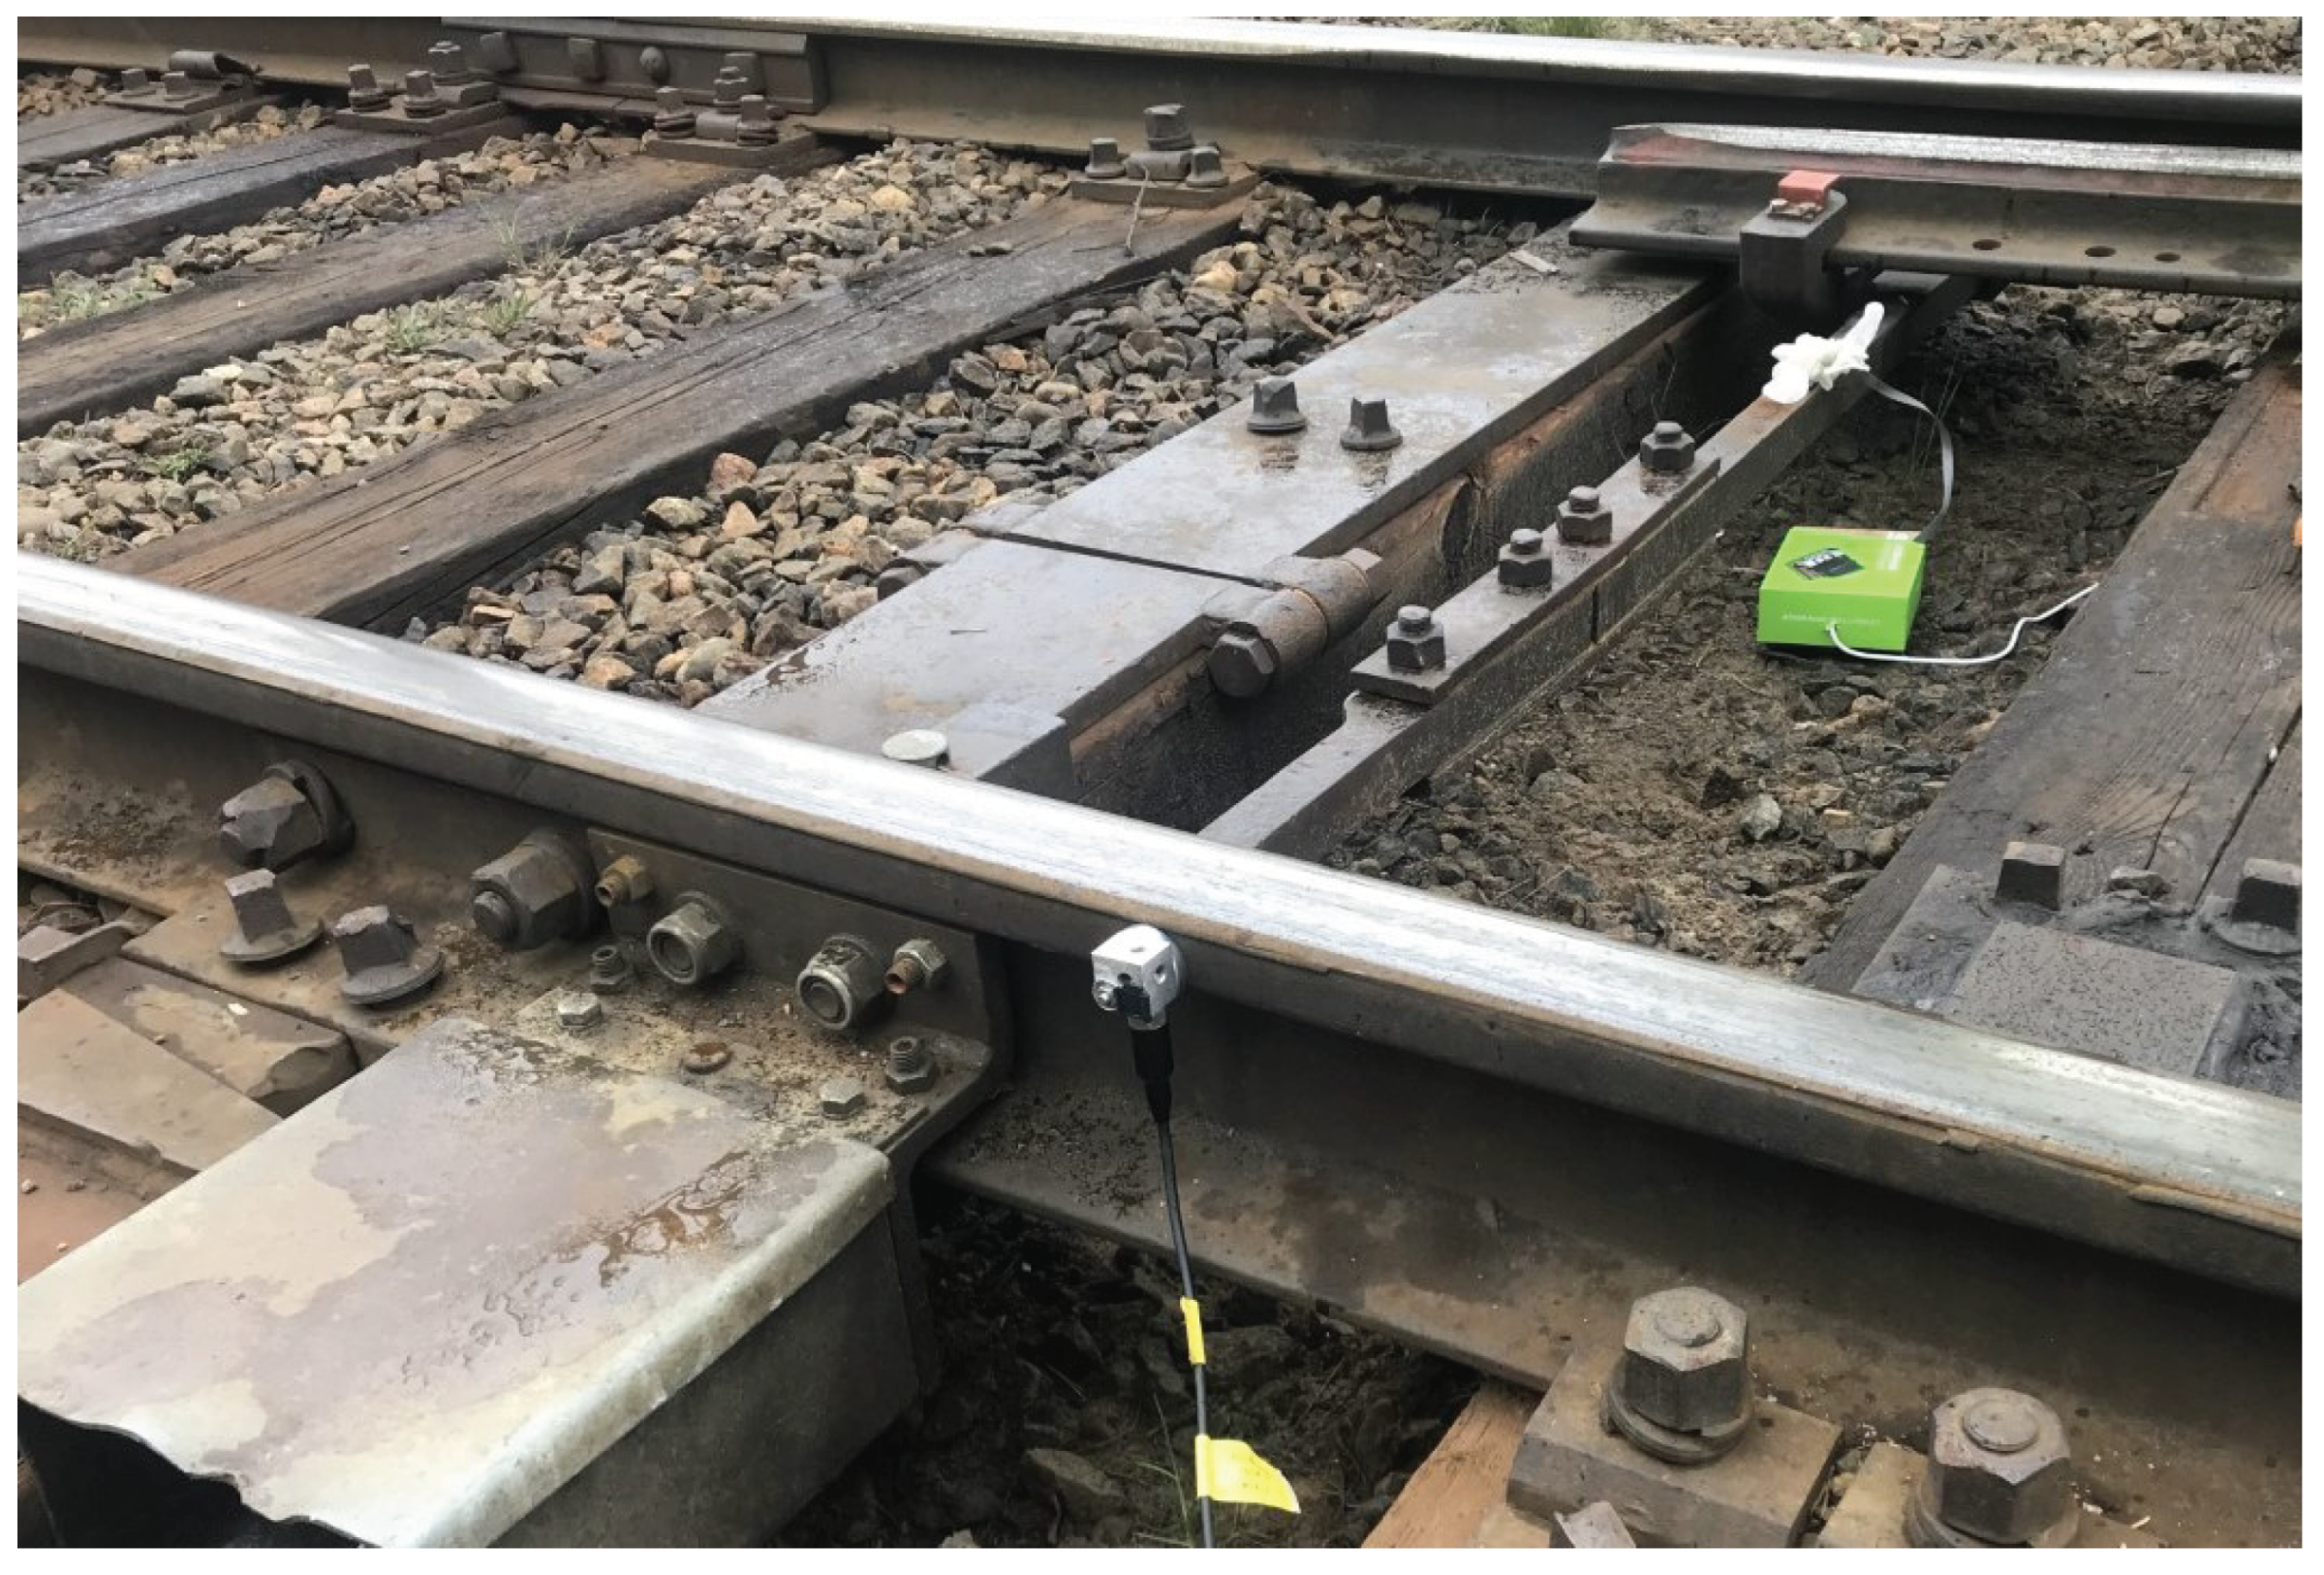
2.1. Test Setup
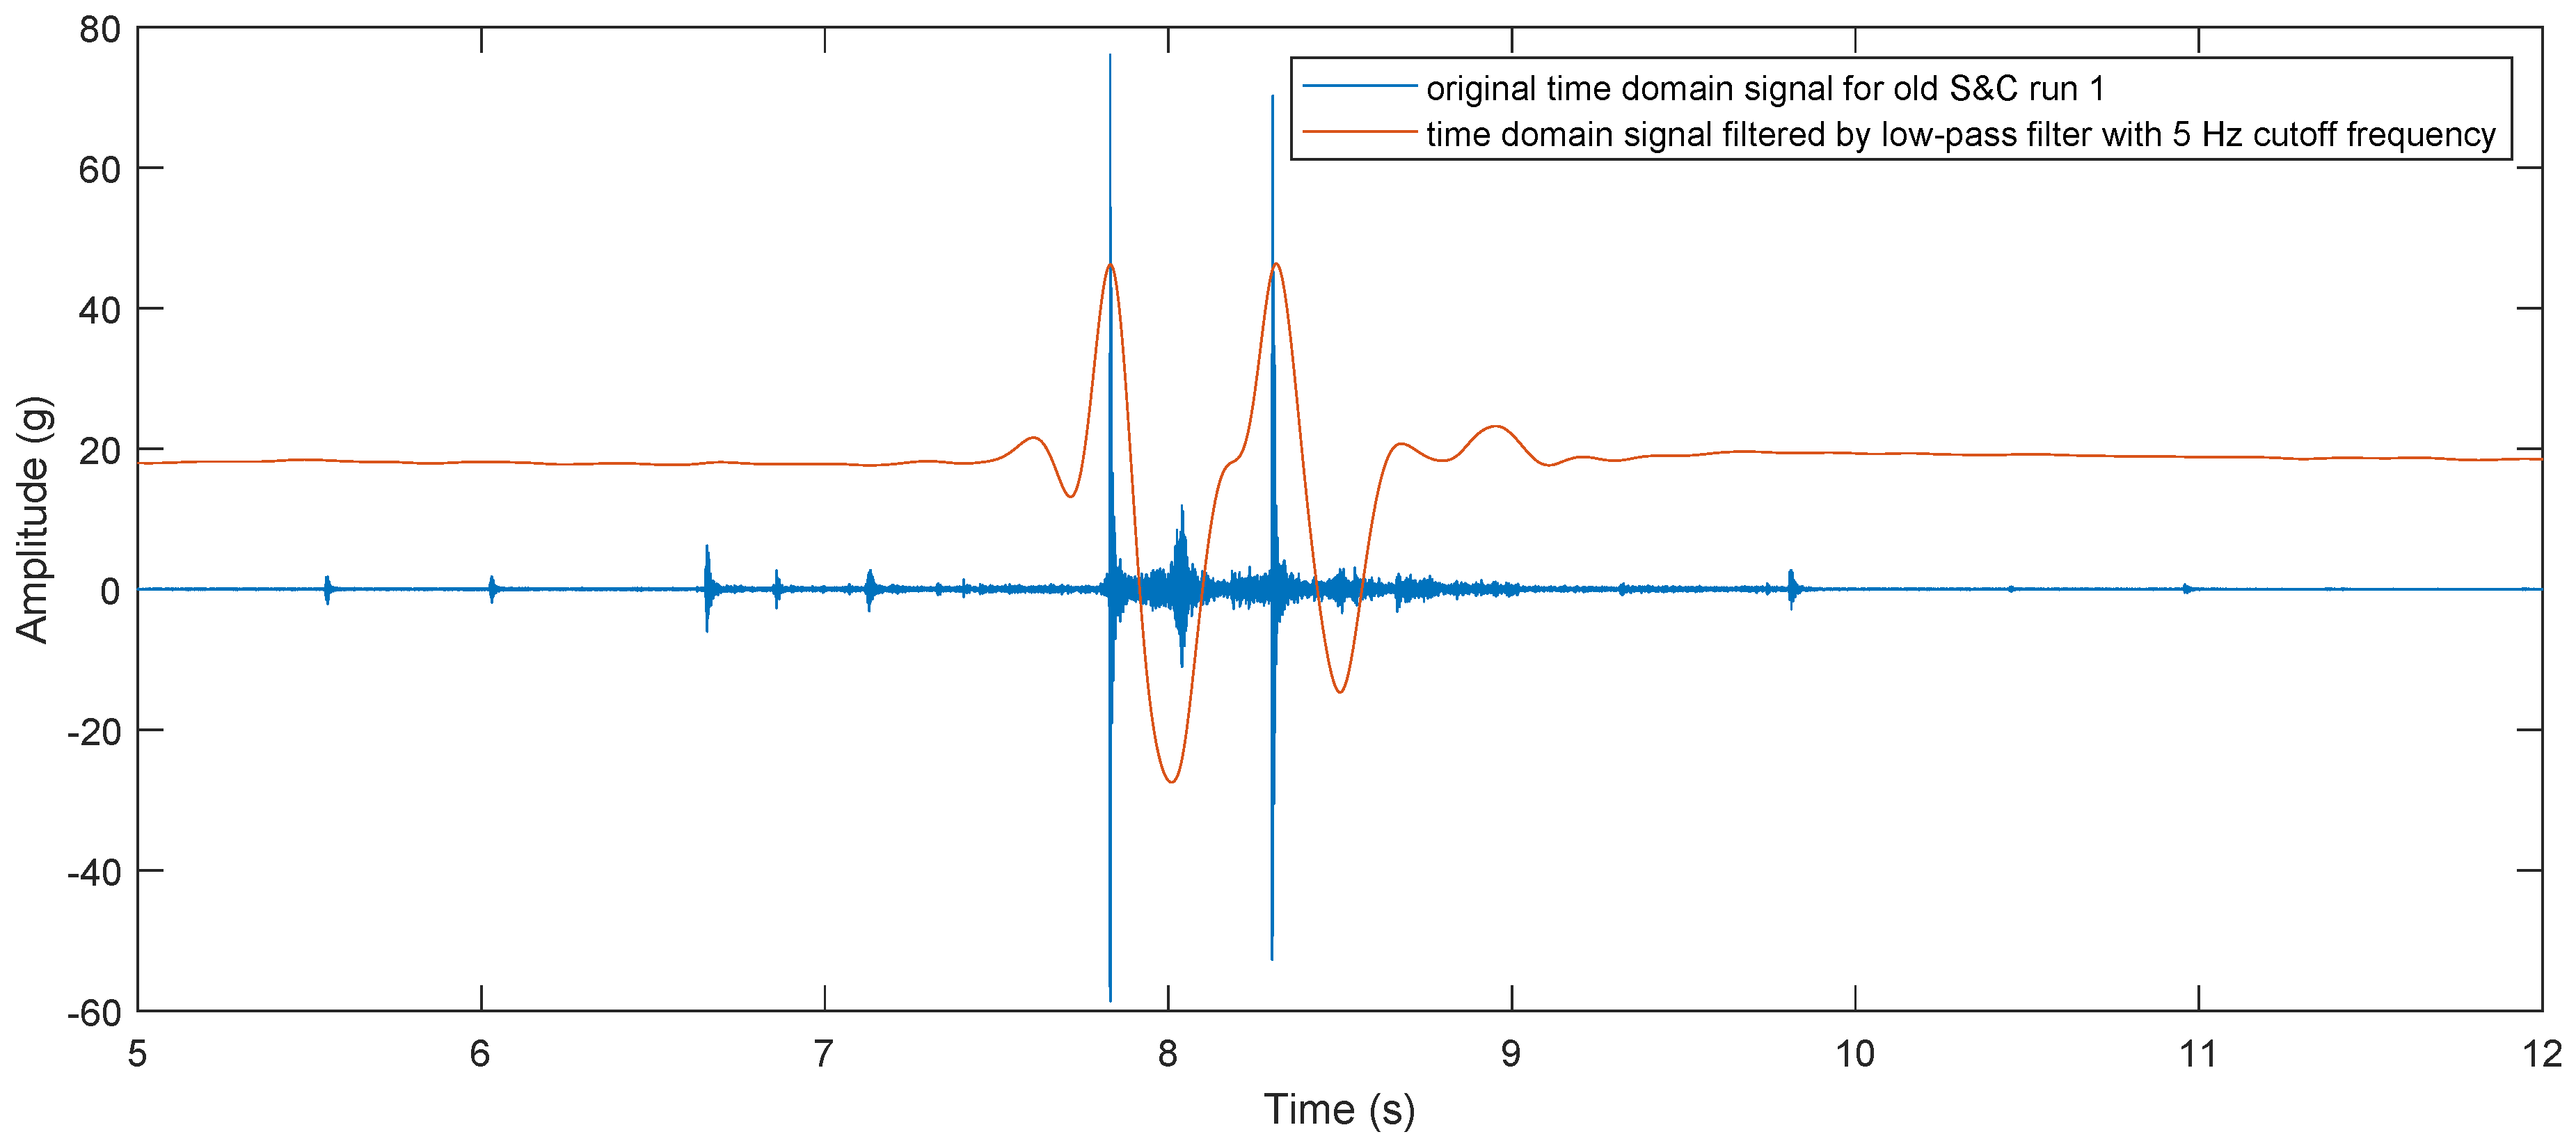
2.2. Signal Processing
2.3. Cutoff Frequency
2.4. Axle Pattern Detection and Speed Estimation
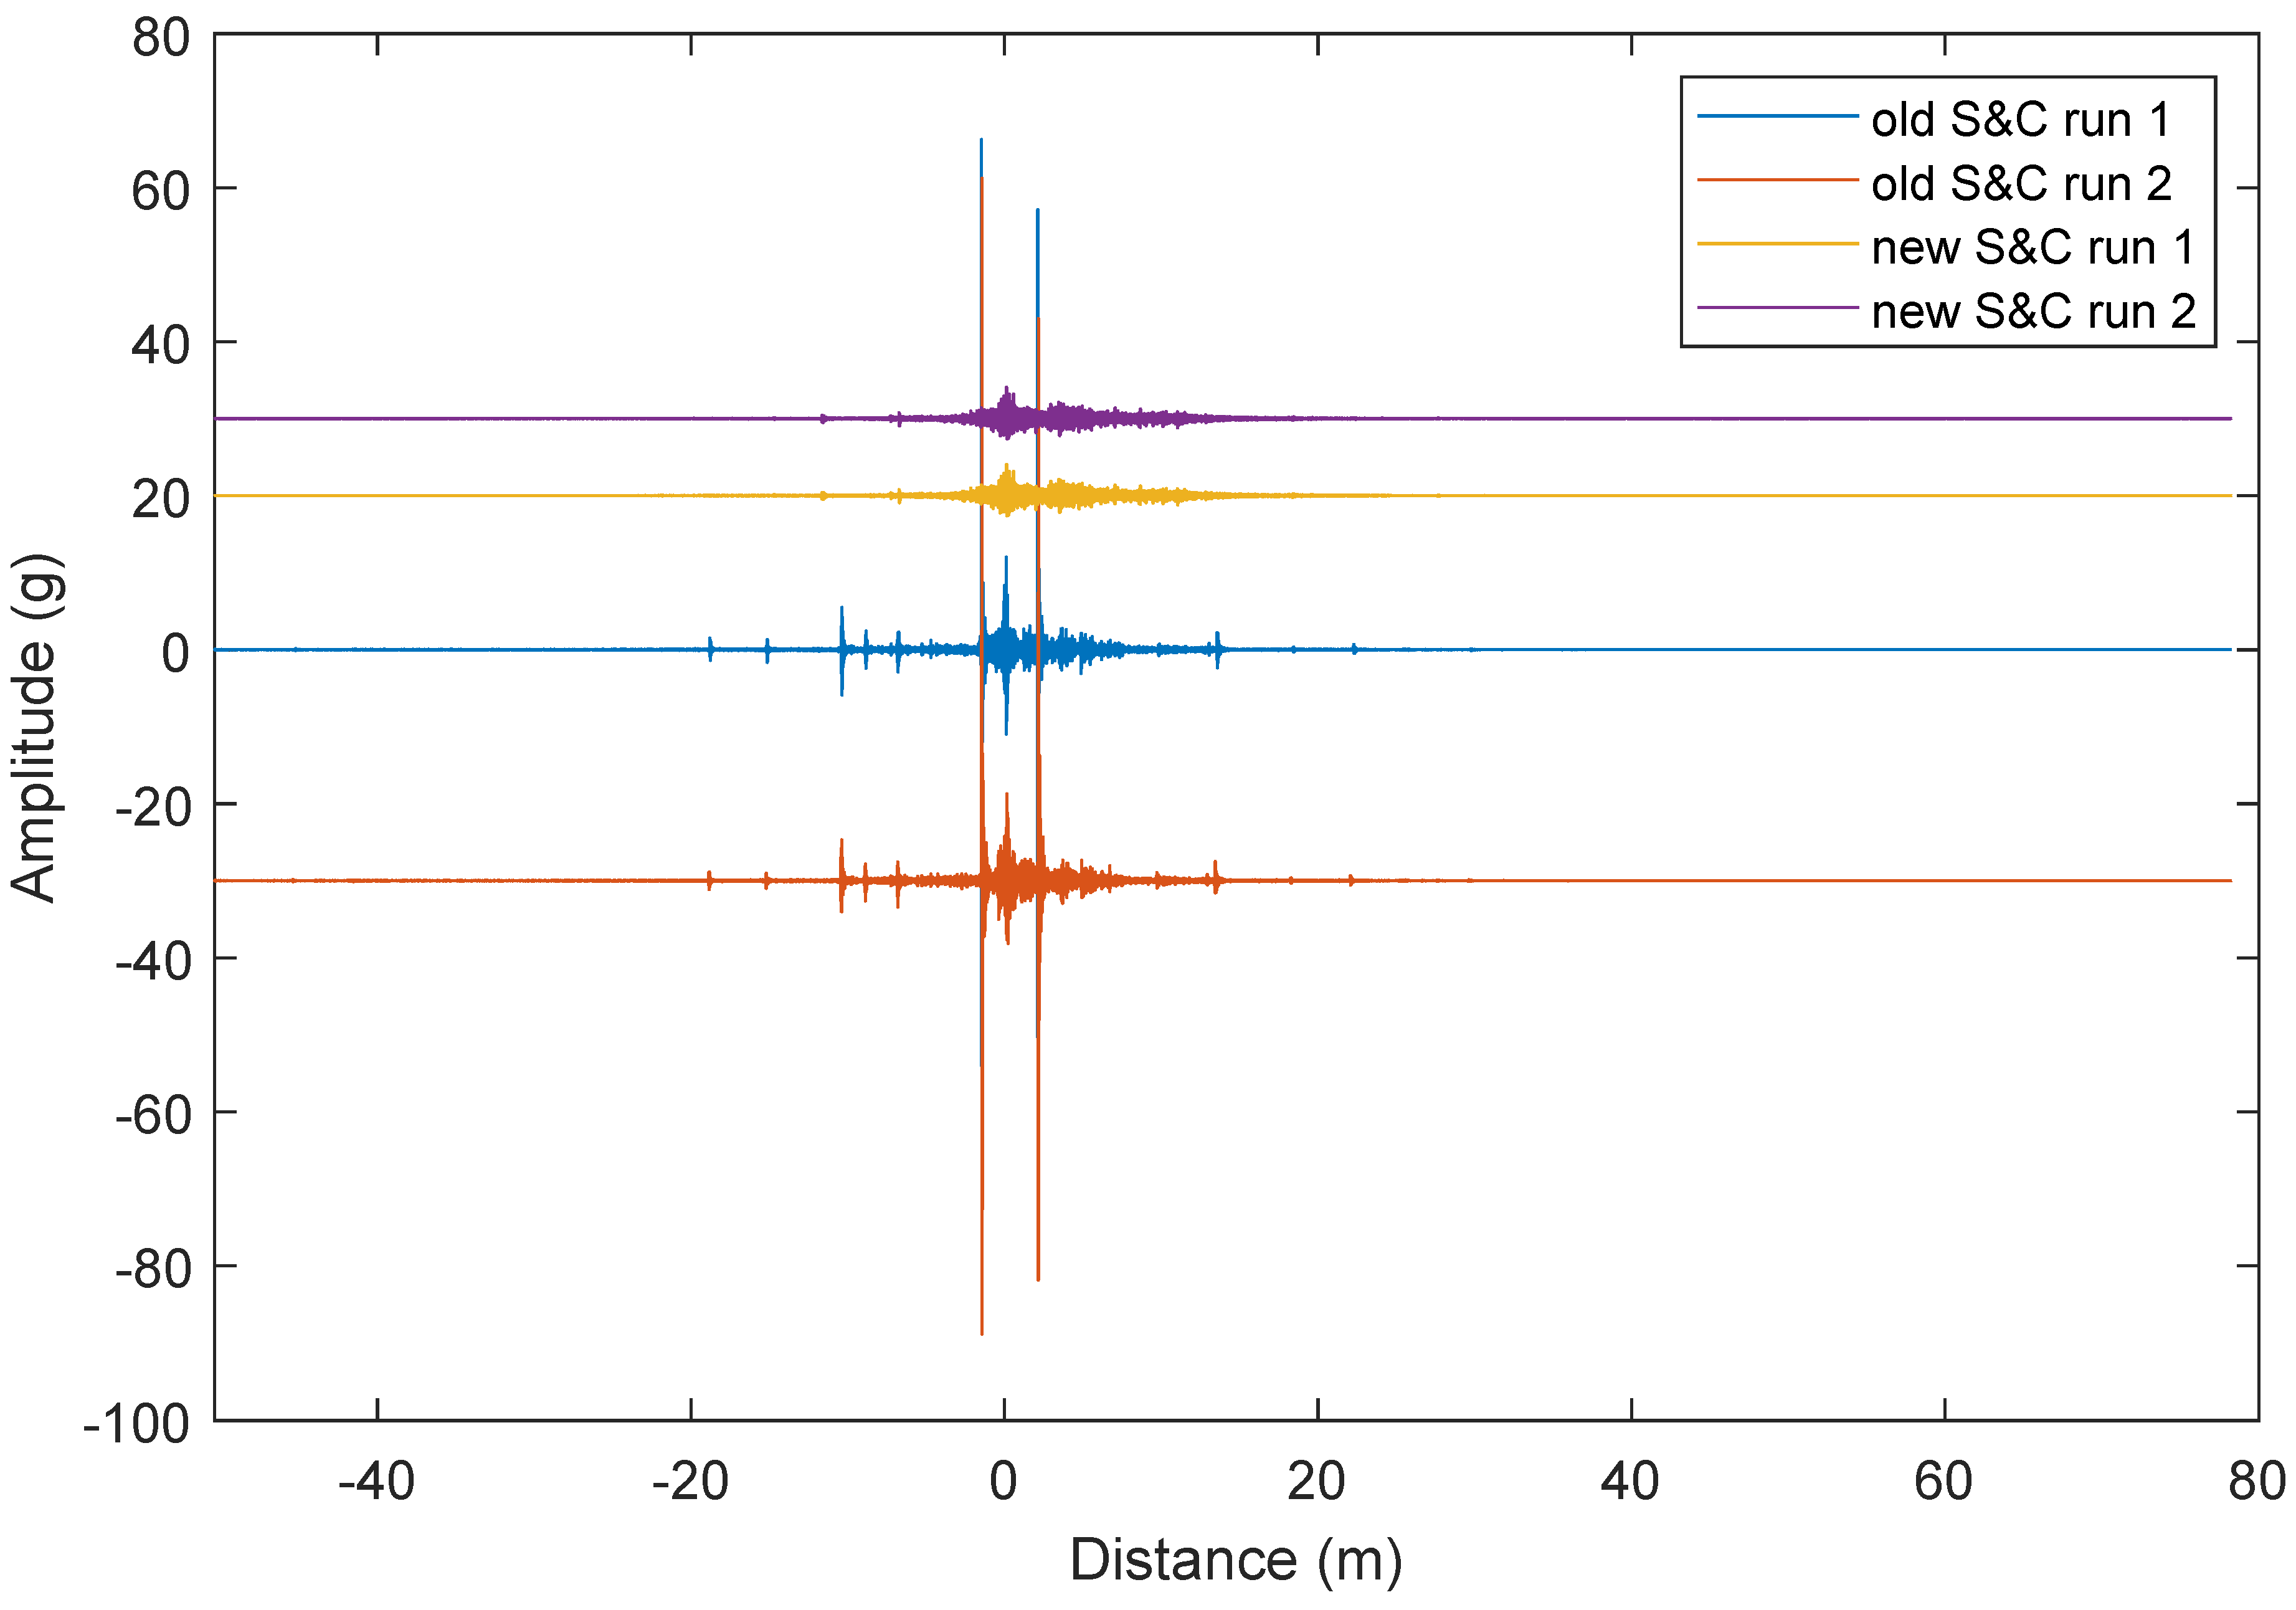
2.5. Time Domain to Spacial Domain Conversion and Synchronisation
2.6. Wavelet Denoising and SAWP
2.7. Anomaly Detection
3. Results and Discussions
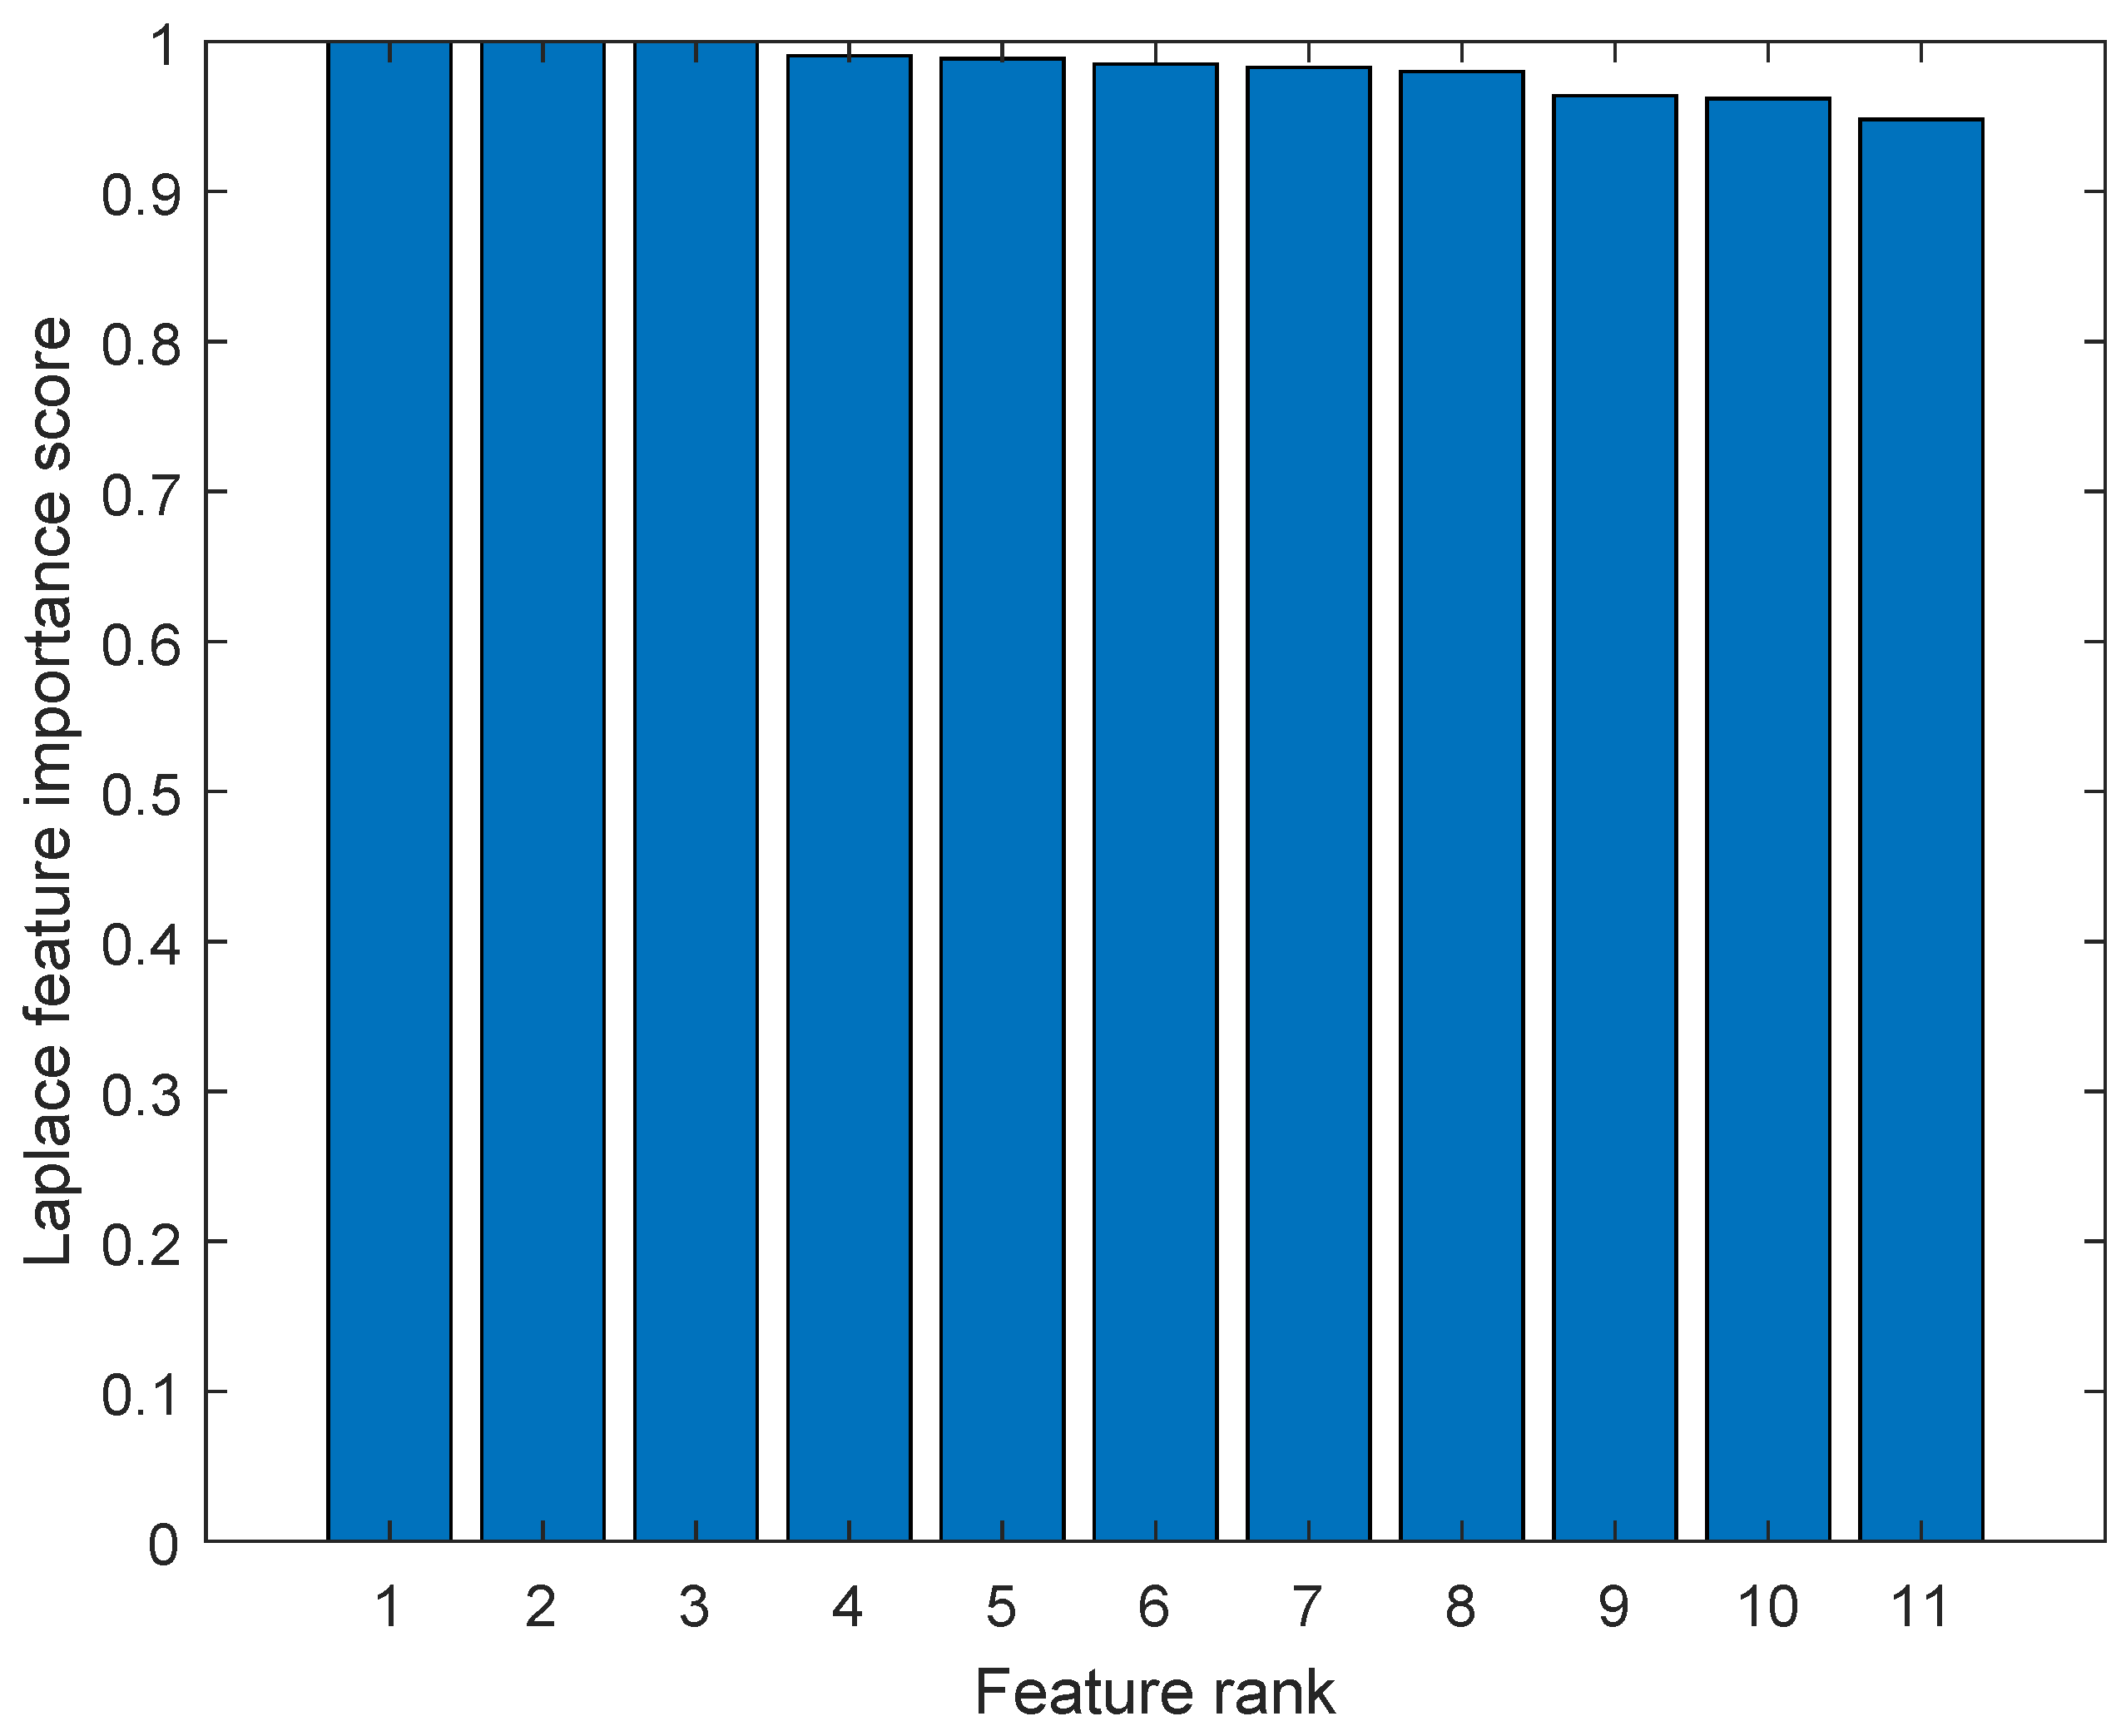
3.1. Feature Selection
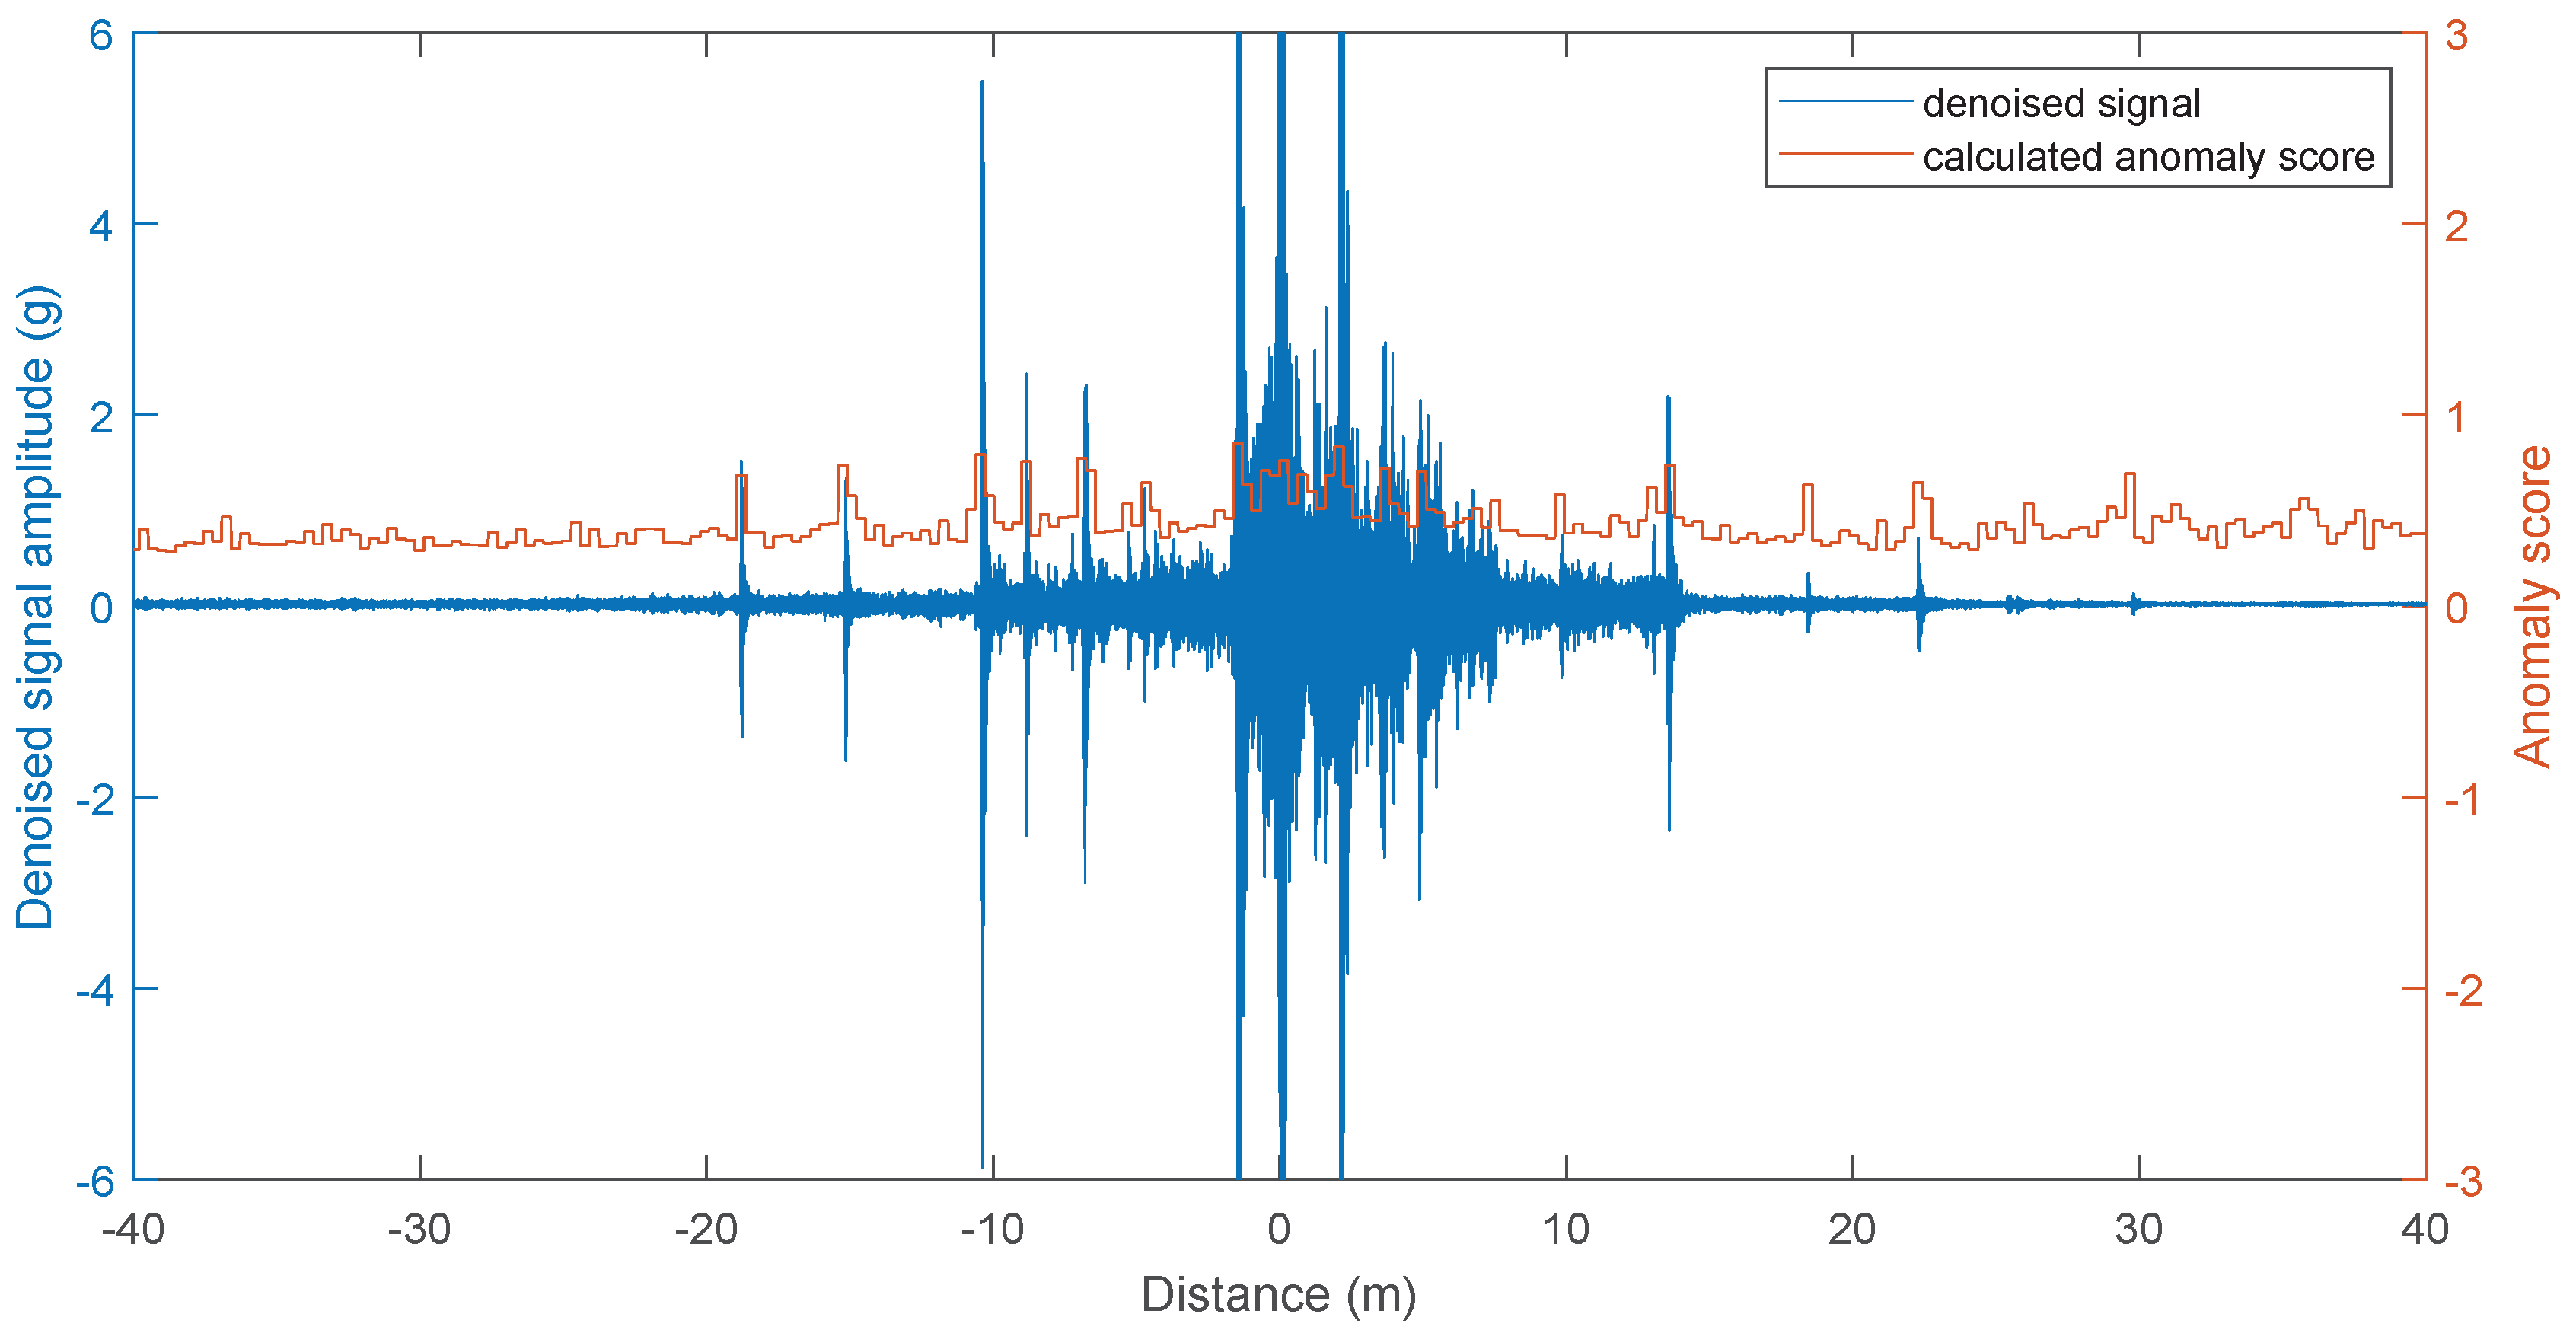
3.2. Anomaly Scores
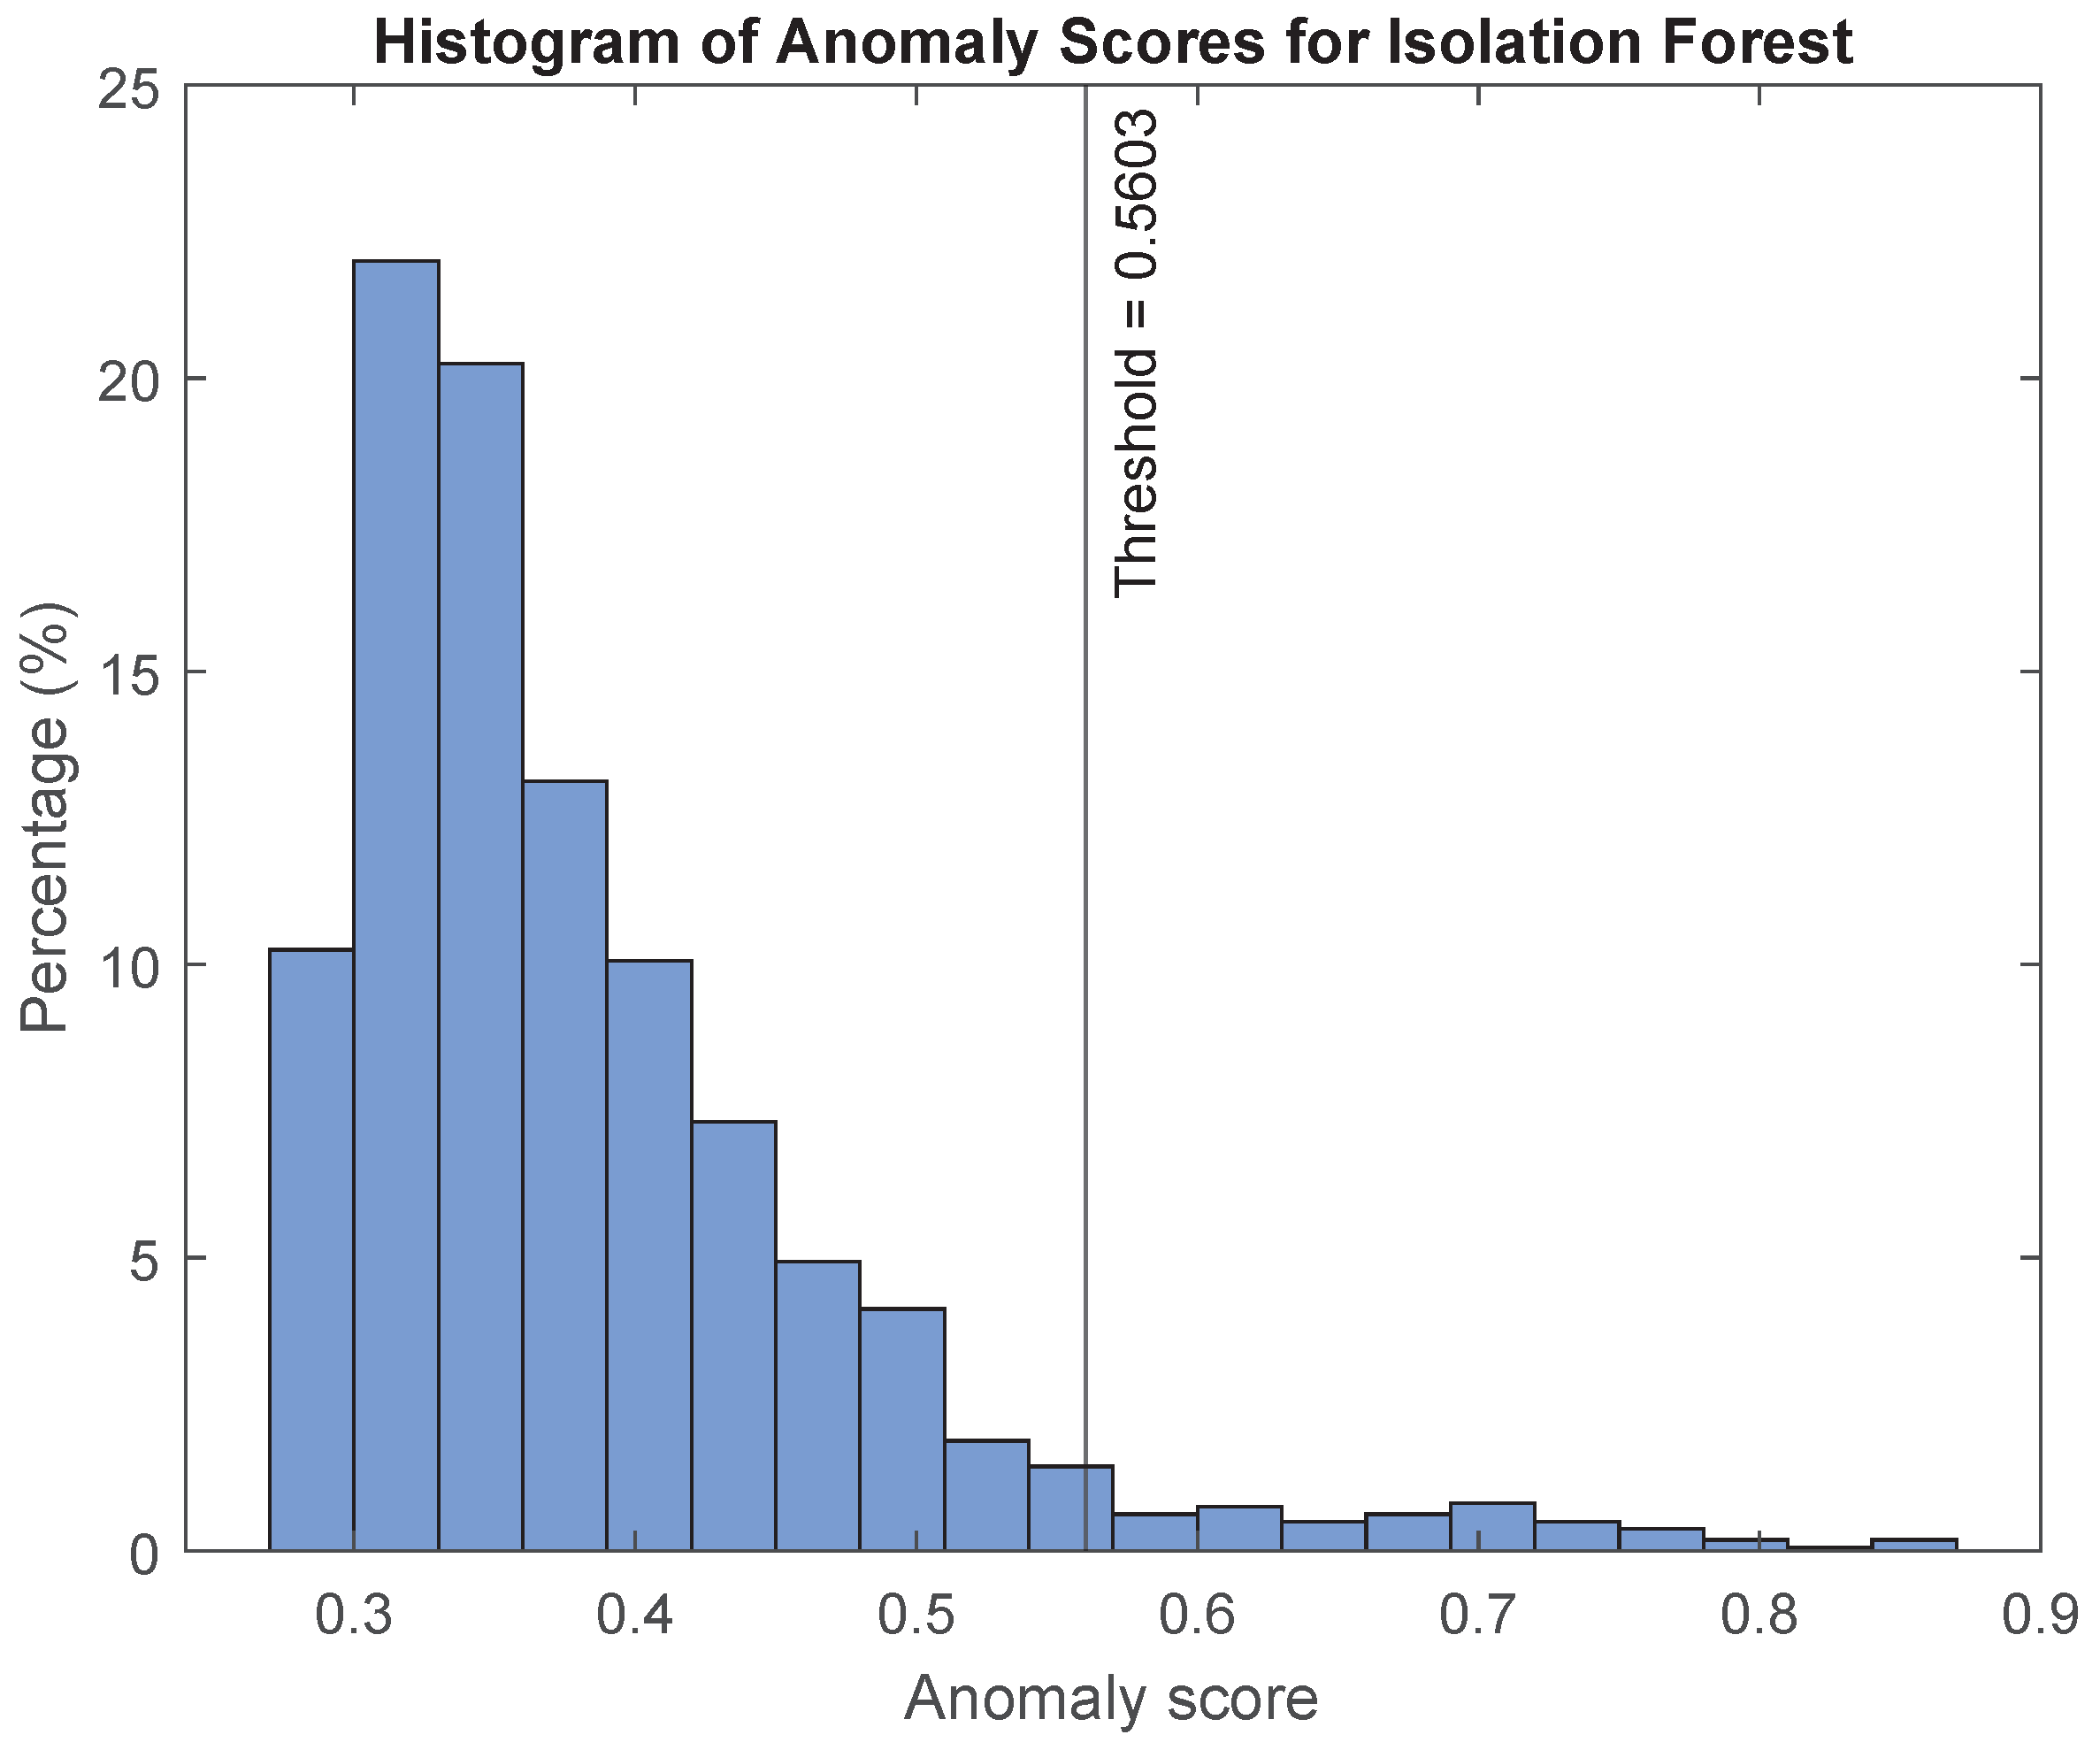
3.3. Threshold Selection
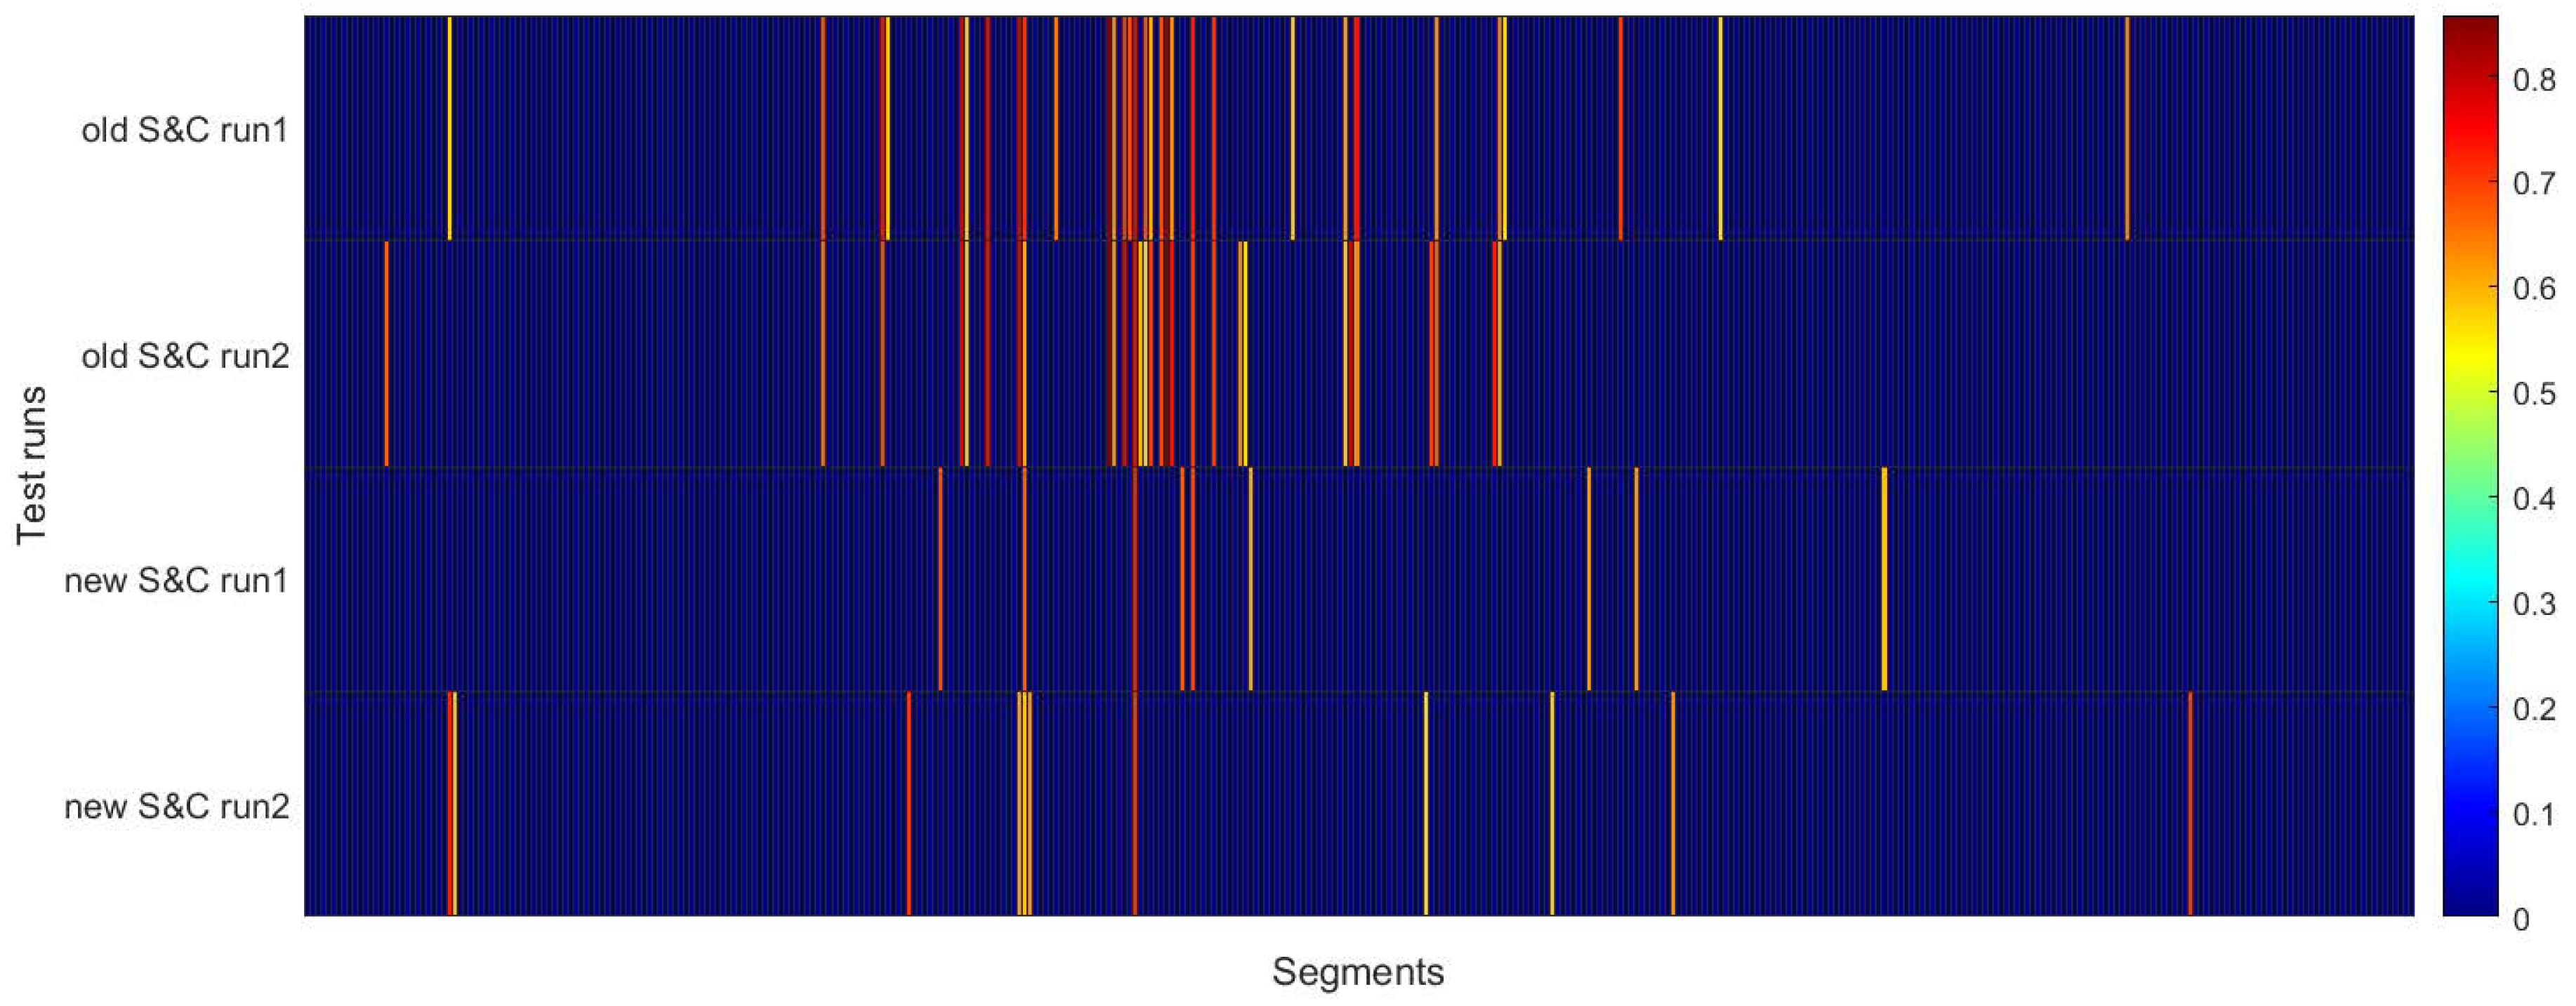
3.4. Anomaly Indicators for the S&C
4. Conclusions and Future Work
Author Contributions
Funding
Institutional Review Board Statement
Informed Consent Statement
Data Availability Statement
Acknowledgments
Conflicts of Interest
References
- Kassa, E.; Andersson, C.; Nielsen, J.C. Simulation of dynamic interaction between train and railway turnout. Veh. Syst. Dyn. 2006, 44, 247–258. [Google Scholar] [CrossRef]
- Hamadache, M.; Dutta, S.; Olaby, O.; Ambur, R.; Stewart, E.; Dixon, R. On the fault detection and diagnosis of railway switch and crossing systems: An overview. Appl. Sci. 2019, 9, 5129. [Google Scholar] [CrossRef]
- Mężyk, A. EU rail passenger transport: An important determinant of sustainable development. Cent. Eur. Rev. Econ. Financ. 2021, 33, 5–22. [Google Scholar] [CrossRef]
- Donaldson, D. Railroads of the Raj: Estimating the impact of transportation infrastructure. Am. Econ. Rev. 2018, 108, 899–934. [Google Scholar] [CrossRef]
- Trafikverket. Årsredovisning; Annual Report; Swedish Transport Administration: Stockholm, Sweden, 1995.
- Naybour, S. Modelling Safety Critical Systems with Ageing Components, with Application to Underground Railway Risk and Hazards. Ph.D. Thesis, University of Nottingham, Nottingham, UK, 2021. [Google Scholar]
- Guo, L.; Zhang, J.; Chen, Z.; Sun, L.; Ge, J.; Lü, K.L.; Dai, G.Y. Automatic detection for defects of railroad track surface. Appl. Mech. Mater. 2013, 278, 856–860. [Google Scholar] [CrossRef]
- Fu, S.; Jiang, Z. Research on image-based detection and recognition technologies for cracks on rail surface. In Proceedings of the 2019 International Conference on Robots & Intelligent System (ICRIS), Haikou, China, 15–16 June 2019; pp. 98–101. [Google Scholar]
- Liang, Z.; Zhang, H.; Liu, L.; He, Z.; Zheng, K. Defect detection of rail surface with deep convolutional neural networks. In Proceedings of the 2018 13th World Congress on Intelligent Control and Automation (WCICA), Changsha, China, 4–8 July 2018; pp. 1317–1322. [Google Scholar]
- Li, Q.; Zhong, Z.; Liang, Z.; Liang, Y. Rail inspection meets big data: Methods and trends. In Proceedings of the 2015 18th International Conference on Network-Based Information Systems, Taipei, Taiwan, 2–4 September 2015; pp. 302–308. [Google Scholar]
- Zhang, Y.; Gao, X.; Peng, C.; Wang, Z.; Li, X. Rail inspection research based on high speed phased array ultrasonic technology. In Proceedings of the 2016 IEEE Far East NDT New Technology & Application Forum (FENDT), Nanchang, China, 22–24 June 2016; pp. 181–184. [Google Scholar]
- Kaewunruen, S.; Ishida, M. In situ monitoring of rail squats in three dimensions using ultrasonic technique. Exp. Tech. 2016, 40, 1179–1185. [Google Scholar] [CrossRef]
- Alvarenga, T.A.; Carvalho, A.L.; Honorio, L.M.; Cerqueira, A.S.; Filho, L.M.; Nobrega, R.A. Detection and classification system for rail surface defects based on Eddy current. Sensors 2021, 21, 7937. [Google Scholar] [CrossRef]
- Kwon, S.G.; Lee, T.G.; Park, S.J.; Park, J.W.; Seo, J.M. Natural Rail Surface Defect Inspection and Analysis Using 16-Channel Eddy Current System. Appl. Sci. 2021, 11, 8107. [Google Scholar] [CrossRef]
- Li, Z.; Molodova, M.; Núñez, A.; Dollevoet, R. Improvements in axle box acceleration measurements for the detection of light squats in railway infrastructure. IEEE Trans. Ind. Electron. 2015, 62, 4385–4397. [Google Scholar] [CrossRef]
- Molodova, M.; Oregui, M.; Núñez, A.; Li, Z.; Dollevoet, R. Health condition monitoring of insulated joints based on axle box acceleration measurements. Eng. Struct. 2016, 123, 225–235. [Google Scholar] [CrossRef]
- Wei, X.; Yin, X.; Hu, Y.; He, Y.; Jia, L. Squats and corrugation detection of railway track based on time-frequency analysis by using bogie acceleration measurements. Veh. Syst. Dyn. 2020, 58, 1167–1188. [Google Scholar] [CrossRef]
- Chen, Z.; Wang, Q.; He, Q.; Yu, T.; Zhang, M.; Wang, P. CUFuse: Camera and ultrasound data fusion for rail defect detection. IEEE Trans. Intell. Transp. Syst. 2022, 23, 21971–21983. [Google Scholar] [CrossRef]
- AbdAlla, A.N.; Faraj, M.A.; Samsuri, F.; Rifai, D.; Ali, K.; Al-Douri, Y. Challenges in improving the performance of eddy current testing. Meas. Control 2019, 52, 46–64. [Google Scholar] [CrossRef]
- Zuo, Y.; Thiery, F.; Chandran, P.; Odelius, J.; Rantatalo, M. Squat Detection of Railway Switches and Crossings Using Wavelets and Isolation Forest. Sensors 2022, 22, 6357. [Google Scholar] [CrossRef] [PubMed]
- Grossoni, I.; Hughes, P.; Bezin, Y.; Bevan, A.; Jaiswal, J. Observed failures at railway turnouts: Failure analysis, possible causes and links to current and future research. Eng. Fail. Anal. 2021, 119, 104987. [Google Scholar] [CrossRef]
- Bojarczak, P. Visual algorithms for automatic detection of squat flaws in railway rails. Insight-Non Test. Cond. Monit. 2013, 55, 353–359. [Google Scholar] [CrossRef]
- Jamshidi, A.; Núñez, A.; Dollevoet, R.; Li, Z. Robust and predictive fuzzy key performance indicators for condition-based treatment of squats in railway infrastructures. J. Infrastruct. Syst. 2017, 23, 04017006. [Google Scholar] [CrossRef]
- Zhang, H.; Jin, X.; Wu, Q.J.; Wang, Y.; He, Z.; Yang, Y. Automatic visual detection system of railway surface defects with curvature filter and improved Gaussian mixture model. IEEE Trans. Instrum. Meas. 2018, 67, 1593–1608. [Google Scholar] [CrossRef]
- Lesiak, P.; Szumiata, T.; Wlazło, M. Laser scatterometry for detection of squat defects in railway rails. Arch. Transp. 2015, 33, 47–56. [Google Scholar] [CrossRef]
- De Becker, D.; Dobrzanski, J.; Justham, L.; Goh, Y. A laser scanner based approach for identifying rail surface squat defects. Proc. Inst. Mech. Eng. Part F J. Rail Rapid Transit 2021, 235, 763–773. [Google Scholar] [CrossRef]
- Peng, D.; Jones, R. Lock-in thermographic inspection of squats on rail steel head. Infrared Phys. Technol. 2013, 57, 89–95. [Google Scholar] [CrossRef]
- Peng, D.; Jones, R. Modelling of the lock-in thermography process through finite element method for estimating the rail squat defects. Eng. Fail. Anal. 2013, 28, 275–288. [Google Scholar] [CrossRef]
- Molodova, M.; Li, Z.; Núñez, A.; Dollevoet, R. Automatic detection of squats in railway infrastructure. IEEE Trans. Intell. Transp. Syst. 2014, 15, 1980–1990. [Google Scholar] [CrossRef]
- Molodova, M.; Li, Z.; Núñez, A.; Dollevoet, R. Parametric study of axle box acceleration at squats. Proc. Inst. Mech. Eng. Part F J. Rail Rapid Transit 2015, 229, 841–851. [Google Scholar] [CrossRef]
- Yin, X.; Wei, X.; Jia, L. Detection of railway track squats by using bogie acceleration measurement. In Proceedings of the 2015 34th Chinese Control Conference (CCC), Hangzhou, China, 28–30 July 2015; pp. 6297–6302. [Google Scholar]
- Zuo, Y.; Lundberg, J.; Najeh, T.; Rantatalo, M.; Odelius, J. Squat Detection of Railway Switches and Crossings Using Point Machine Vibration Measurements. Sensors 2023, 23, 3666. [Google Scholar] [CrossRef]
- Zuo, Y.; Lundberg, J.; Chandran, P.; Rantatalo, M. Squat Detection and Estimation for Railway Switches and Crossings Utilising Unsupervised Machine Learning. Appl. Sci. 2023, 13, 5376. [Google Scholar] [CrossRef]
- Chandola, V.; Banerjee, A.; Kumar, V. Anomaly detection: A survey. ACM Comput. Surv. (CSUR) 2009, 41, 1–58. [Google Scholar] [CrossRef]


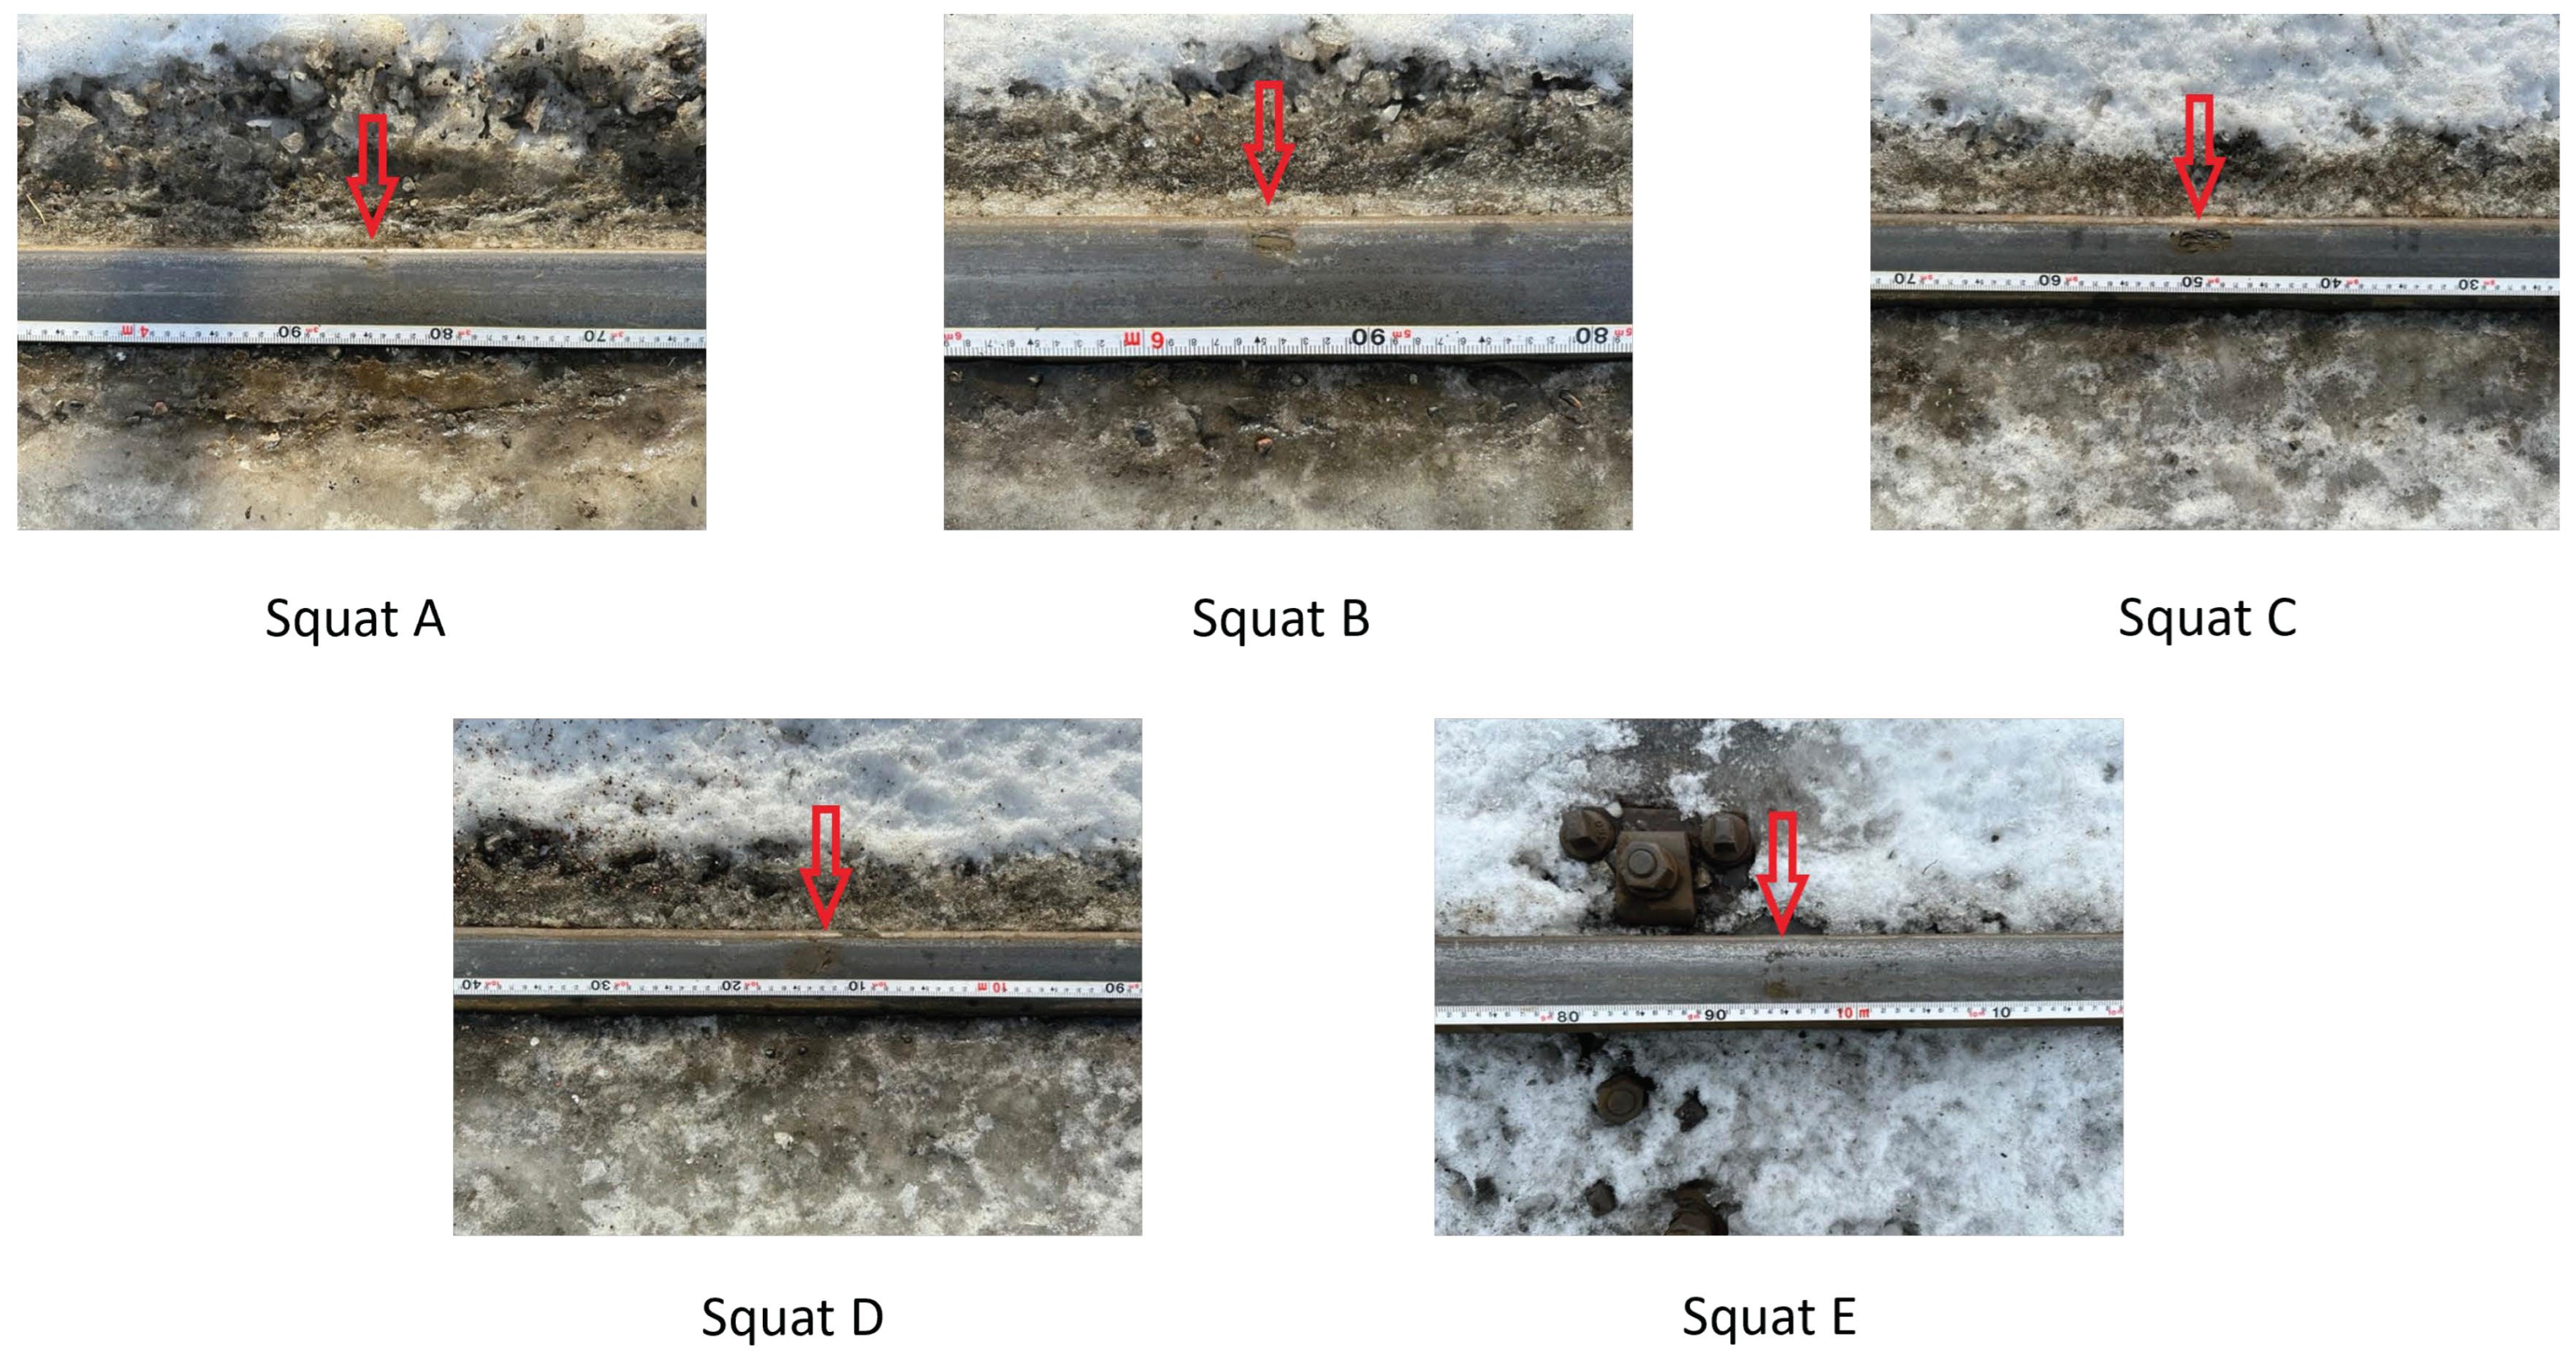
| Squat Name | Max Width (x-Direction) | Max Width (y-Direction) | Max Depth |
|---|---|---|---|
| (mm) | (mm) | (mm) | |
| A | 22 | 11 | 0.6 |
| B | 18 | 12 | 1.3 |
| C | 10 | 15 | 0.8 |
| D | 44 | 19 | 1.6 |
| E | 27 | 34 | 0.8 |
| Name | Range (Hz) | Sensitivity (mV/g) | Destruction Limit (g) | Resonant Frequency (kHz) |
|---|---|---|---|---|
| 608A11 | 0.5–10,000 | 10.2 | 50 | 22 |
| Feature Type | Features | Feature Number |
|---|---|---|
| time domain features | RMS | 1 |
| standard deviation | 2 | |
| shape factor | 3 | |
| kurtosis | 4 | |
| skewness | 5 | |
| peak to peak amplitude | 6 | |
| impulse factor | 7 | |
| crest factor | 8 | |
| clearance factor | 9 | |
| SAWP time series | number of peaks | 10 |
| total peak power | 11 |
| Test Run | Part | Accumulated Anomaly Score | Number of Anomalies |
|---|---|---|---|
| old S&C run 1 | 1 | 9.13 | 13 |
| 2 | 5.62 | 8 | |
| 3 | 5.03 | 8 | |
| old S&C run 2 | 1 | 7.09 | 10 |
| 2 | 6.29 | 9 | |
| 3 | 5.91 | 9 | |
| new S&C run 1 | 1 | 1.35 | 2 |
| 2 | 2.09 | 3 | |
| 3 | 1.85 | 3 | |
| new S&C run 2 | 1 | 2.53 | 4 |
| 2 | 0.71 | 1 | |
| 3 | 1.76 | 3 |
Disclaimer/Publisher’s Note: The statements, opinions and data contained in all publications are solely those of the individual author(s) and contributor(s) and not of MDPI and/or the editor(s). MDPI and/or the editor(s) disclaim responsibility for any injury to people or property resulting from any ideas, methods, instructions or products referred to in the content. |
© 2023 by the authors. Licensee MDPI, Basel, Switzerland. This article is an open access article distributed under the terms and conditions of the Creative Commons Attribution (CC BY) license (https://creativecommons.org/licenses/by/4.0/).
Share and Cite
Zuo, Y.; Chandran, P.; Odelius, J.; Rantatalo, M. Wayside Railway Switch and Crossing Monitoring Using Isolation Forest Anomaly Scores. Sustainability 2023, 15, 14836. https://doi.org/10.3390/su152014836
Zuo Y, Chandran P, Odelius J, Rantatalo M. Wayside Railway Switch and Crossing Monitoring Using Isolation Forest Anomaly Scores. Sustainability. 2023; 15(20):14836. https://doi.org/10.3390/su152014836
Chicago/Turabian StyleZuo, Yang, Praneeth Chandran, Johan Odelius, and Matti Rantatalo. 2023. "Wayside Railway Switch and Crossing Monitoring Using Isolation Forest Anomaly Scores" Sustainability 15, no. 20: 14836. https://doi.org/10.3390/su152014836
APA StyleZuo, Y., Chandran, P., Odelius, J., & Rantatalo, M. (2023). Wayside Railway Switch and Crossing Monitoring Using Isolation Forest Anomaly Scores. Sustainability, 15(20), 14836. https://doi.org/10.3390/su152014836