


Evaluating Traceability Technology Adoption in Food Supply Chain: A Game Theoretic Approach


 ,
,
Abstract
1. Introduction
2. Literature Review
2.1. Traceability Needs and Implantation in the Food Supply Chain
2.2. Game Theory Implementation in the Food Supply Chain
2.3. Research Gaps and Key Contributions
- Develop a multiplayer game to obtain a view of strategies that can be made by different stakeholders of the supply chain.
- Analyze the game model to understand the key factors that affect the decision of traceability adoption in the food chain.
3. Assumptions and Notations
- Government authorities can be considered key players in the food supply chain by imposing policies and laws, punishing risky players and providing subsidies for establishing traceable systems [29,31]. Government can monitor food loss by implementing traceability and modifying the policies to reduce food loss in post-harvest stages.
- Farmers are the players who grow the food and transport it to markets or industries. Due to the lack of resources, major food loss can take place at this stage. In addition, use of unwanted chemicals to protect the food may affect the quality of food.
- Around 10% of food is lost either in processing or storage at warehouses of processing enterprises. Such loss may be caused by factors such as lack of infrastructure, poor methods of processing/storage, and lack of technological advancement. Therefore, processing organizations are one of the major players in a food supply chain.
- Certification agencies are the players that audit and verify the whole process and provide documentation regarding food production. If they collude with other stakeholders for false certification, this may act as a threat to the whole supply chain.
- Adoption of traceability also depends upon consumers’ perception regarding traceable food products and their readiness to pay premium prices for traceable food [14] because consumers are the only source of revenue for a particular supply chain.
- : Revenue of authority from actively promoting traceability.
- : Revenue of authority from passively promoting traceability.
- : Cost to authority for actively promoting traceability.
- : Cost to authority for passively promoting traceability.
- : Revenue of farmers generated from sales of traceable food products.
- : Revenue of farmers generated from sales of non-traceable food products.
- : Cost to farmers for establishing a traceable system.
- : Cost to farmers for establishing a non-traceable system.
- : Cost to processing enterprises in purchasing traceable food products.
- : Cost to processing enterprises in purchasing non-traceable food products.
- : Cost to processing enterprises in developing a comprehensive traceable system.
- : Cost to processing enterprises in developing a non-traceable system.
- : Certification fees for processing enterprises when developing a traceable system.
- : Revenue of processing enterprises generated from the sale of traceable labeled food products.
- : Revenue of processing enterprises generated from the sale of non-traceable labeled food products.
- : Revenue of certification agencies generated from certification fees paid by processing enterprises.
- : Revenue of certification agencies generated from collusion with processing enterprises for issuing the false certification.
- : Damage compensation imposed on certification agencies for issuing falsely labeled food products as traceable.
- : Cost to certification agencies for finding new clients when it works independently and refuses to issue false certification. Cost of losing a client and finding a new one might be more than the cost involved in collusion ().
- : Cost to a consumer in purchasing traceable labeled food products
- : Cost to a consumer in purchasing non-traceable labeled food products.
- : Revenue of consumers in purchasing traceable labeled food products in terms of monetary value.
- : Revenue of consumers in purchasing traceable labeled food products in terms of monetary value.
- : Damage compensation imposed on authorities when the food product is falsely labeled as a traceable product and authorities promote it passively.
- : Damage compensation imposed on farmers when a product is falsely labeled as traceable and farmers do not develop a traceable system.
- : Cost to processing enterprise in colluding with certification agency.
- : Damage compensation imposed on the processing organization when the food product is falsely labeled as a traceable food product.
- : Cost to processing enterprise for switching certification agency when certification agency does not collude in issuing a false certificate.
- : Damage compensation imposed on the certification agency when the food product is falsely labeled as a traceable food product.
- : Damage compensation provided to consumers if a product is falsely labeled as traceable.
4. Mathematical Model and Practical Application
5. Analysis of Mathematical Model
- An increase in value of , and represents high chances of authorities promoting the food traceability system actively.
- An increase in value of and represents low chances of authorities going for active promotion of traceability system.
- Increase in the values of , , represent high chances for farmers to develop a food traceability system.
- Increase in values of , represent low chances for farmers to develop a food traceability system.
- Increases in values of represent high chances of processing organizations purchasing traceable food from farmers and establishing a food traceability system at enterprises.
- Increases in values of represent low chances of processing organizations purchasing traceable food from farmers and establishing a food traceability system at enterprises.
- Increased value of represents a high chance that the certification agency will work independently.
- Increased value of represents low chances that the certification agency will work independently.
- Increases in values of represent a high chance that consumers will purchase traceable labeled food products.
- Increases in values of represent low chances that consumers will purchase traceable labeled food products.
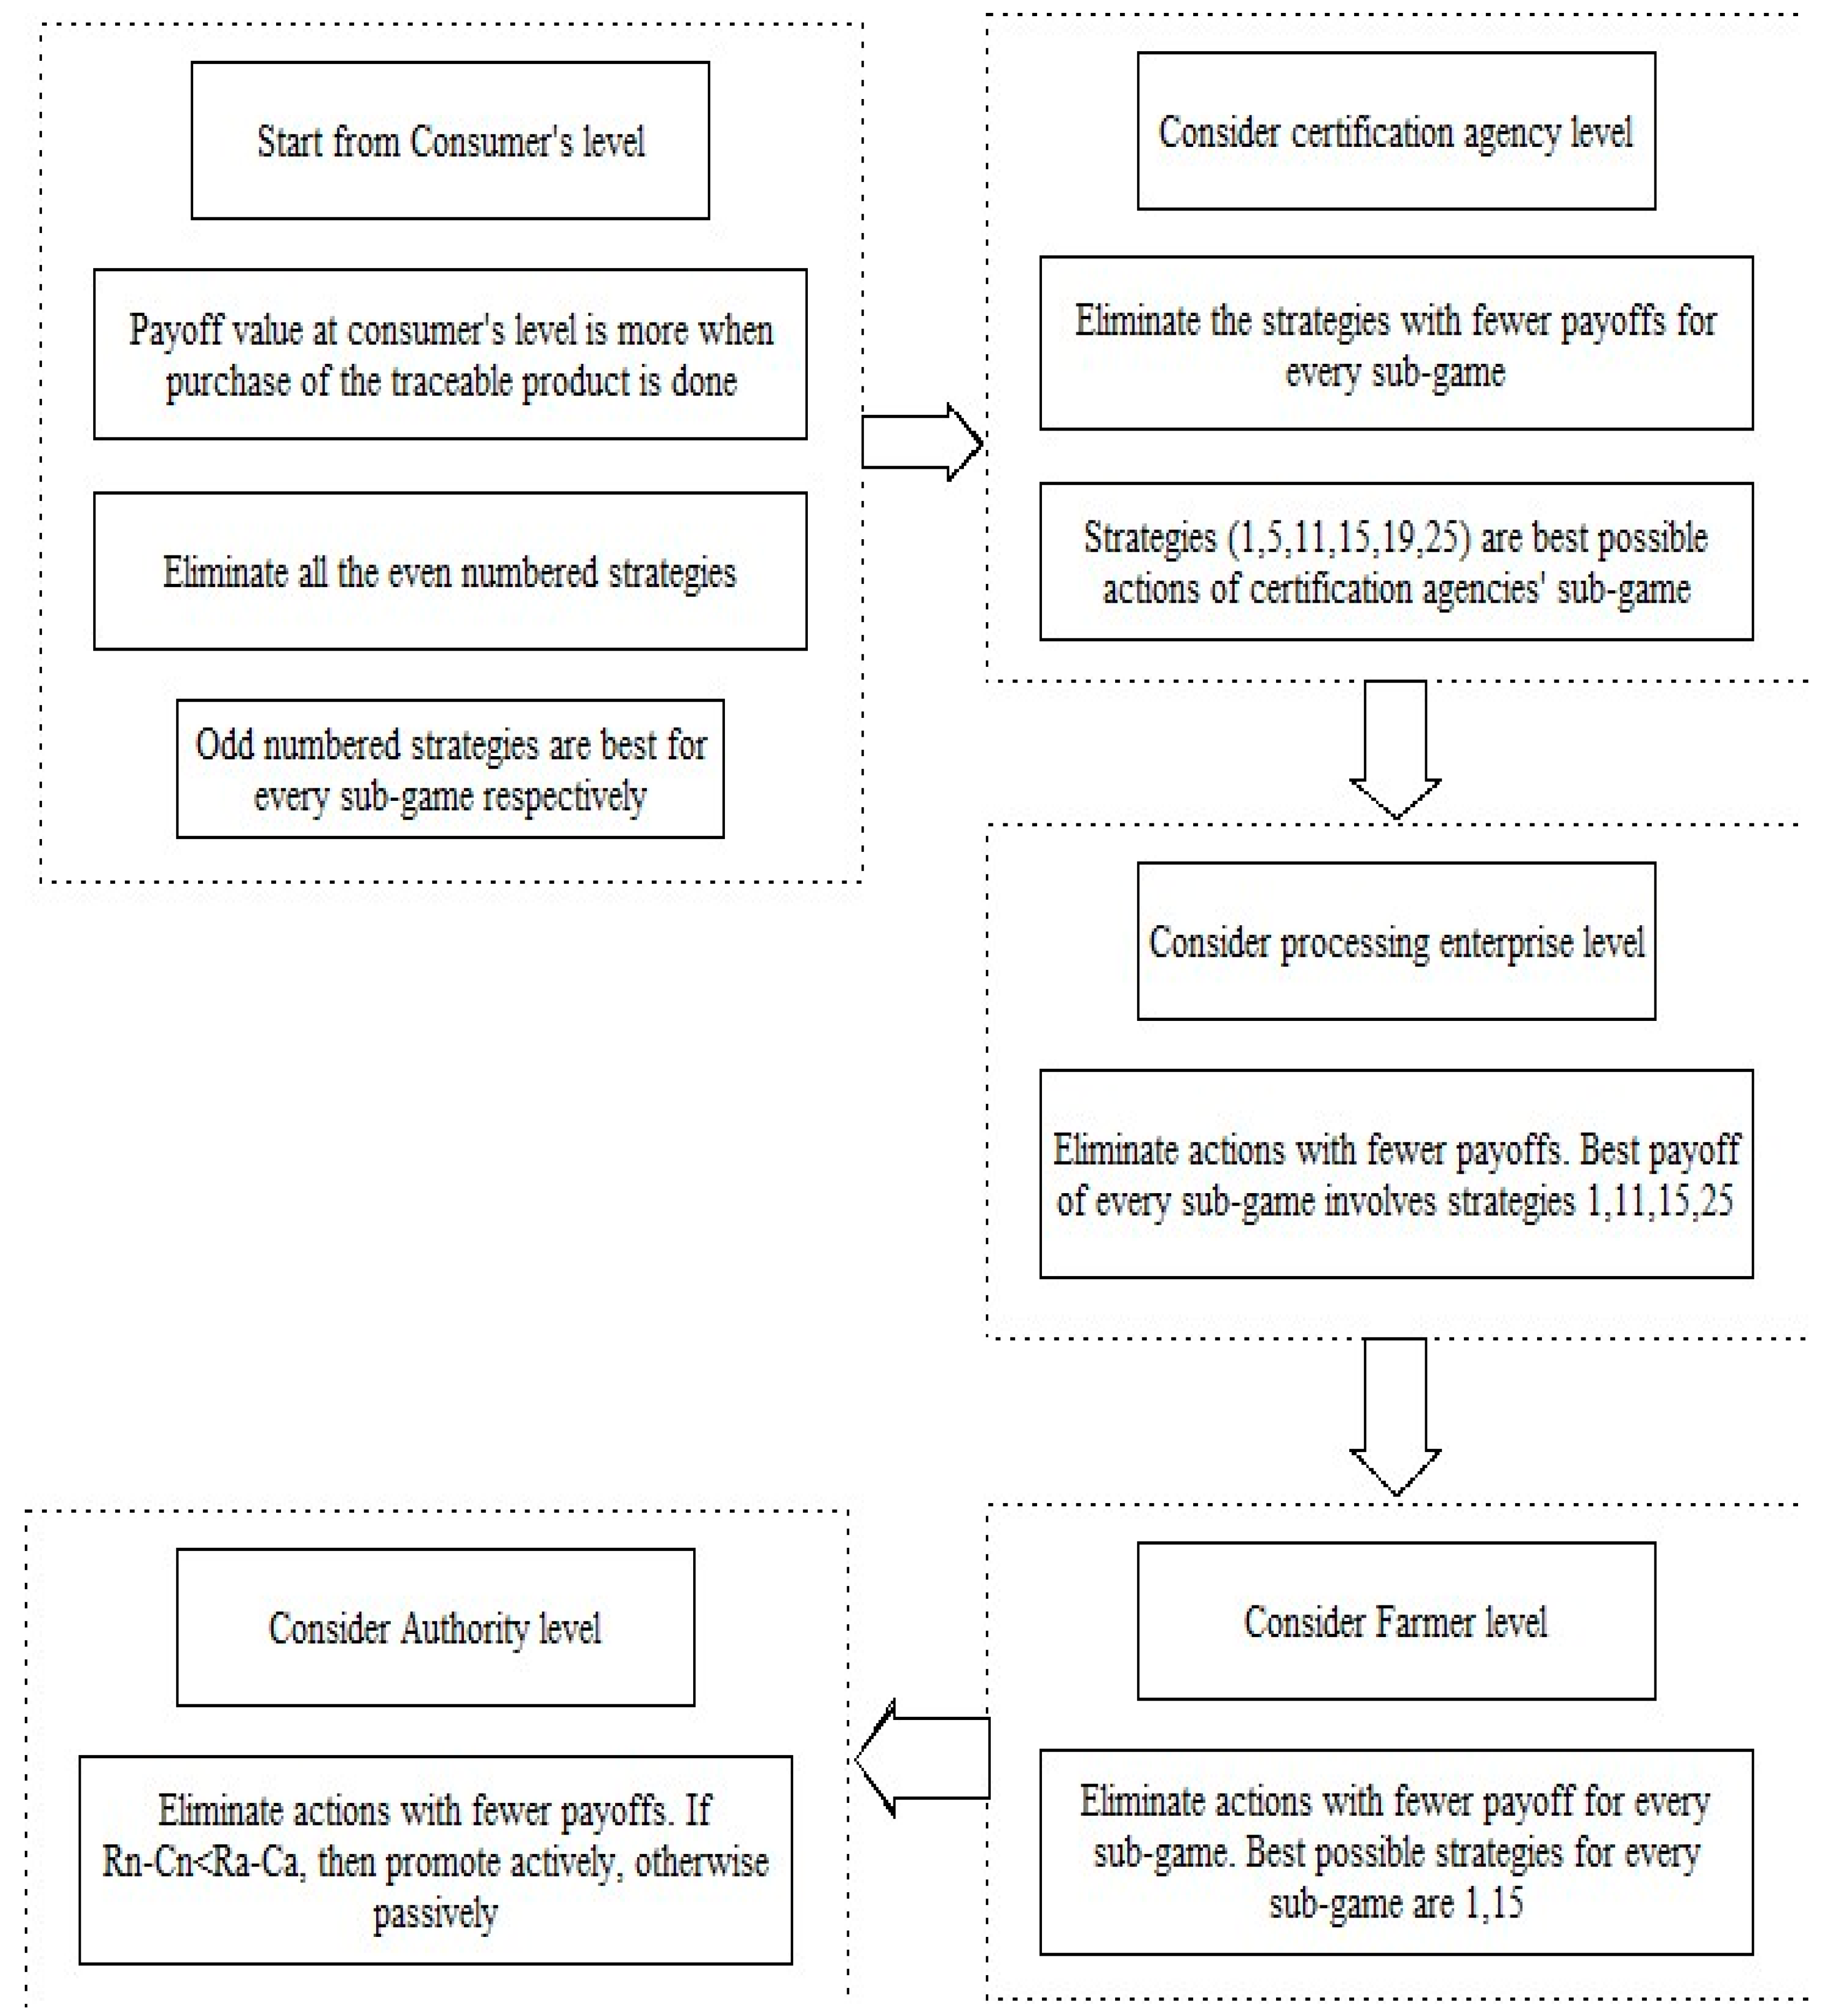
Numerical Example
6. Research Implication
7. Conclusions
Author Contributions
Funding
Data Availability Statement
Conflicts of Interest
References
- System Initiative on Shaping the Future of Food. 2019. Available online: www.weforum.org (accessed on 26 June 2021).
- Mogale, D.G.; Ghadge, A.; Kumar, S.K.; Tiwari, M.K. Modelling supply chain network for procurement of food grains in India. Int. J. Prod. Res. 2019, 58, 6493–6512. [Google Scholar] [CrossRef]
- Boro Seminar, K. Food Chain Transparency for Food Loss and Waste Surveillance. J. Dev. Sustain. Agric. 2016, 11, 17–22. [Google Scholar]
- Maiyar, L.M.; Thakkar, J.J. Robust optimisation of sustainable food grain transportation with uncertain supply and intentional disruptions. Int. J. Prod. Res. 2019, 58, 5651–5675. [Google Scholar] [CrossRef]
- Balaji, M.; Arshinder, K. Modeling the causes of food wastage in Indian perishable food supply chain. Resour. Conserv. Recycl. 2016, 114, 153–167. [Google Scholar] [CrossRef]
- Dnyaneshwar, M.; Sri, K.; Manoj, T. Green food supply chain design considering risk and post-harvest losses: A case study. Ann. Oper. Res. 2020, 295, 257–284. [Google Scholar] [CrossRef]
- Dandage, K.; Badia-Melis, R.; Ruiz-García, L. Indian perspective in food traceability: A review. Food Control 2017, 71, 217–227. [Google Scholar] [CrossRef]
- Technological Interventions in Indian Food Systems and the Future of Food Security Embassy of Denmark New Delhi Embassy of Denmark New Delhi. 2022. Available online: www.DragonFish.design (accessed on 2 September 2022).
- Sindwani, A.; Kumar, A.; Gautam, C.; Purohit, G.; Tanwar, P. Prediction and Monitoring of stored food grains health using IoT Enable Nodes. In Proceedings of the 2020 IEEE International Conference on Computing, Power and Communication Technologies, GUCON 2020, Greater Noida, India, 2–4 October 2020; pp. 516–522. [Google Scholar] [CrossRef]
- Giagnocavo, C.; Bienvenido, F.; Ming, L.; Yurong, Z.; Sanchez-Molina, J.A.; Xinting, Y. Agricultural cooperatives and the role of organisational models in new intelligent traceability systems and big data analysis. Int. J. Agric. Biol. Eng. 2017, 10, 115–125. [Google Scholar] [CrossRef]
- Padmaja, C.; Swathi, N.; Anuradha, P.; Prashanth, B. Sustainable development in agriculture using internet of things—A Review. In Proceedings of the IOP Conference Series: Materials Science and Engineering, Warangal, India, 9–10 October 2020; Volume 981. [Google Scholar] [CrossRef]
- Asian, S.; Hafezalkotob, A.; John, J.J. Sharing economy in organic food supply chains: A pathway to sustainable development. Int. J. Prod. Econ. 2019, 218, 322–338. [Google Scholar] [CrossRef]
- Gardas, B.B.; Raut, R.D.; Narkhede, B. Modeling causal factors of post-harvesting losses in vegetable and fruit supply chain: An Indian perspective. Renew. Sustain. Energy Rev. 2017, 80, 1355–1371. [Google Scholar] [CrossRef]
- Galimberti, A.; Cena, H.; Campone, L.; Ferri, E.; Dell’Agli, M.; Sangiovanni, E.; Belingheri, M.; Riva, M.A.; Casiraghi, M.; Labra, M. Rethinking Urban and Food Policies to Improve Citizens Safety After COVID-19 Pandemic. Front. Nutr. 2020, 7, 569542. [Google Scholar] [CrossRef]
- Basu, K. The Economics of Foodgrain Management in India; Ministry of Finance, Government of India: New Delhi, India, 2010. [Google Scholar]
- Gokarn, S.; Kuthambalayan, T.S. Analysis of challenges inhibiting the reduction of waste in food supply chain. J. Clean. Prod. 2017, 168, 595–604. [Google Scholar] [CrossRef]
- Chauhan, O.P.; Shanmugasundaram, M.; Chellaiah, R.; Kizhekkedath, J. Application of Information Technology in Supply Chain Management of Fruits and Vegetables—A Brief Overview Characterisation of Toxoplasma Gondii from Humans and Animals in India View Project Characterisation of Plant Foods View project Mahesh Shanmugasundaram Defence Research and Development Organisation Rajendran Chellaiah Defence Research and Development Organisation Application of Information and Technology in Supply Chain Management of Fruits and Vegetables—A Brief Overview. 2020. Available online: www.ijisrt.com (accessed on 27 August 2021).
- Curto, J.P.; Gaspar, P.D. Traceability in food supply chains: Review and SME focused analysis—Part 1. AIMS Agric. Food 2021, 6, 679–707. [Google Scholar] [CrossRef]
- Pappa, I.C.; Iliopoulos, C.; Massouras, T. What determines the acceptance and use of electronic traceability systems in agri-food supply chains? J. Rural. Stud. 2018, 58, 123–135. [Google Scholar] [CrossRef]
- Rowan, N.J.; Galanakis, C.M. Unlocking challenges and opportunities presented by COVID-19 pandemic for cross-cutting disruption in agri-food and green deal innovations: Quo Vadis? Sci. Total Environ. 2020, 748, 141362. [Google Scholar] [CrossRef]
- Sharma, R.; Hurburgh, C.; Mosher, G.A. Developing guidance templates and terminology to support multiple traceability objectives in the grain supply chain. Cereal Chem. 2020, 98, 52–69. [Google Scholar] [CrossRef]
- Xiao, X.; He, Q.; Fu, Z.; Xu, M.; Zhang, X. Applying CS and WSN methods for improving efficiency of frozen and chilled aquatic products monitoring system in cold chain logistics. Food Control 2015, 60, 656–666. [Google Scholar] [CrossRef]
- Li, H.; Zhang, B.; Zhang, L.; Xue, Y.; He, M.; Ren, C. A food traceability framework for dairy and other low-margin products. IBM J. Res. Dev. 2016, 60, 10:1–10:8. [Google Scholar] [CrossRef]
- Astill, J.; Dara, R.A.; Campbell, M.; Farber, J.M.; Fraser, E.D.; Sharif, S.; Yada, R.Y. Transparency in food supply chains: A review of enabling technology solutions. Trends Food Sci. Technol. 2019, 91, 240–247. [Google Scholar] [CrossRef]
- Galvez, J.F.; Mejuto, J.C.; Simal-Gandara, J. Future challenges on the use of blockchain for food traceability analysis. TrAC-Trends Anal. Chem. 2018, 107, 222–232. [Google Scholar] [CrossRef]
- Kamble, S.S.; Gunasekaran, A.; Sharma, R. Modeling the blockchain enabled traceability in agriculture supply chain. Int. J. Inf. Manag. 2019, 52, 101967. [Google Scholar] [CrossRef]
- Iftekhar, A.; Cui, X. Blockchain-based traceability system that ensures food safety measures to protect consumer safety and COVID-19 free supply chains. Foods 2021, 10, 1289. [Google Scholar] [CrossRef] [PubMed]
- Vasnani, N.N.; Chua, F.L.S.; Ocampo, L.A.; Pacio, L.B.M. Game theory in supply chain management: Current trends and applications. Int. J. Appl. Decis. Sci. 2019, 12, 56–97. [Google Scholar] [CrossRef]
- Chavoshlou, A.S.; Khamseh, A.A.; Naderi, B. An optimization model of three-player payoff based on fuzzy game theory in green supply chain. Comput. Ind. Eng. 2018, 128, 782–794. [Google Scholar] [CrossRef]
- Asrol, M.; Marimin, M.; Machfud, M.; Yani, M.; Taira, E. Supply Chain Fair Profit Allocation Based on Risk and Value Added for Sugarcane Agro-industry. Oper. Supply Chain. Manag. 2020, 13, 150–165. [Google Scholar] [CrossRef]
- Song, C.; Zhuang, J. Modeling a Government-Manufacturer-Farmer game for food supply chain risk management. Food Control 2017, 78, 443–455. [Google Scholar] [CrossRef]
- Li, Y.; Mao, M.; Wang, K. The Decision-making of Constructing Traceability System for Fresh Agricultural Products. In CLEM 2010: Logistics For Sustained Economic Development: Infrastructure, Information, Integration; American Society of Civil Engineers: Reston, VA, USA, 2010; pp. 726–733. [Google Scholar]
- Tang, S. An evolutionary game model of the establishment of tracebility system in food supply chain. Appl. Mech. Mater. 2013, 423–426, 2190–2195. [Google Scholar] [CrossRef]
- Debnath, A.; Bandyopadhyay, A.; Roy, J.; Kar, S. Game theory based multi criteria decision making problem under uncertainty: A case study on Indian tea industry. J. Bus. Econ. Manag. 2018, 19, 154–175. [Google Scholar] [CrossRef]
- Wang, M.-C.; Yang, C.-Y. Analyzing organic tea certification and traceability system within the Taiwanese tea industry. J. Sci. Food Agric. 2014, 95, 1252–1259. [Google Scholar] [CrossRef]
- Wang, M.-C.; Yang, C.-Y. Analysing the traceability system in herbal product industry by game theory. Agric. Econ. 2019, 65, 74–81. [Google Scholar] [CrossRef]
- Reddy, P.; Kurnia, S.; Tortorella, G.L. Digital Food Supply Chain Traceability Framework. Proceedings 2022, 82, 9. [Google Scholar] [CrossRef]
- Zhou, X.; Pullman, M.; Xu, Z. The impact of food supply chain traceability on sustainability performance. Oper. Manag. Res. 2021, 15, 93–115. [Google Scholar] [CrossRef]


| Strategic Combination | Node 1 (Authority’s) Action | Node 2 (Farmer’s) Action | Node 3 (Processing Organization’s) Action | Node 4 (Certification Agency’s) Action | Node 5 (Consumer’s) Action |
|---|---|---|---|---|---|
| 1 | Actively promoted traceability system in food chain | Farmer developed a comprehensive traceability system | Processing organization purchased traceable food from farmers and established a traceability system | Certification agency issued traceable labeled certificate | Consumer purchased “Traceable Labeled Food Product” |
| 2 | Consumer did not purchase “Traceable Labeled Food Product” | ||||
| 3 | Farmer did not Develop a comprehensive traceability system | Processing organization did not purchase traceable food from farmers, but establish a traceability system at enterprise | Certification agency colluded with other stakeholders and issued false certificate | Purchased “Traceable Labeled Food Product” | |
| 4 | Did not purchase “Traceable Labeled Food Product” | ||||
| 5 | Certification agency refused to issue falsely labeled traceable food product | Purchased “Traceable Labeled Food Product” | |||
| 6 | Did not purchase “Traceable Labeled Food Product” | ||||
| 7 | Switched current certification agency when certification agency refused to collude with processing organization for falsely labeled food product as traceable | Purchased “Traceable Labeled Food Product” | |||
| 8 | Did not purchase “Traceable Labeled Food Product” | ||||
| 9 | Processing organization neither purchased traceable food from farmers, nor establish a traceability system at enterprise | Certification agency colluded with other stakeholders and issued false certificate | Purchased “Traceable Labeled Food Product” | ||
| 10 | Did not purchase “Traceable Labeled Food Product” | ||||
| 11 | Certification agency refused to issue falsely labeled traceable food product | Purchased “Traceable Labeled Food Product” | |||
| 12 | Did not purchase “Traceable Labeled Food Product” | ||||
| 13 | Switched current certification agency when certification agency refused to collude with processing organization for falsely label food product as traceable | Purchased “Traceable Labeled Food Product” | |||
| 14 | Did not purchase “Traceable Labeled Food Product” | ||||
| 15 | Passively promoted traceability system in food chain | Farmer developed a comprehensive traceability system | Purchased traceable food from farmers and also established a traceability system | Certification agency issued traceable labeled certificate | Purchased “Traceable Labeled Food Product” |
| 16 | Did not purchase “Traceable Labeled Food Product” | ||||
| 17 | Farmer did not develop a comprehensive traceability system | Processing organization did not purchase traceable food from farmers, but established a traceability system at enterprise | Certification agency colluded with other stakeholders and issued false certificate | Purchased “Traceable Labeled Food Product” | |
| 18 | Did not purchase “Traceable Labeled Food Product” | ||||
| 19 | Certification agency refused to issue falsely labeled traceable food product | Purchased “Traceable Labeled Food Product” | |||
| 20 | Did not purchase “Traceable Labeled Food Product” | ||||
| 21 | Switched current certification agency when certification agency refused to collude with processing organization for falsely label food product as traceable | Purchased “Traceable Labeled Food Product” | |||
| 22 | Did not purchase “Traceable Labeled Food Product” | ||||
| 23 | Processing organization neither purchased traceable food from farmers, nor established a traceability system at enterprise | Certification agency colluded with other stakeholders and issued false certificate | Purchased “Traceable Labeled Food Product” | ||
| 24 | Did not purchase “Traceable Labeled Food Product” | ||||
| 25 | Certification agency refused to issue falsely labeled traceable food product | Purchased “Traceable Labeled Food Product” | |||
| 26 | Did not purchase “Traceable Labeled Food Product” | ||||
| 27 | Switched current certification agency when certification agency refused to collude with processing organization for falsely label food product as traceable | Purchased “Traceable Labeled Food Product” | |||
| 28 | Did not purchase “Traceable Labeled Food Product” |
| Strategic Combination | Authority | Farmers | Processing Enterprises | Certification Agencies | Consumers |
|---|---|---|---|---|---|
| 1 | |||||
| 2 | 0 | ||||
| 3 | |||||
| 4 | 0 | ||||
| 5 | |||||
| 6 | 0 | ||||
| 7 | |||||
| 8 | 0 | ||||
| 9 | |||||
| 10 | 0 | ||||
| 11 | |||||
| 12 | 0 | ||||
| 13 | |||||
| 14 | 0 | ||||
| 15 | |||||
| 16 | 0 | ||||
| 17 | |||||
| 18 | 0 | ||||
| 19 | |||||
| 20 | 0 | ||||
| 21 | |||||
| 22 | 0 | ||||
| 23 | |||||
| 24 | 0 | ||||
| 25 | |||||
| 26 | 0 | ||||
| 27 | |||||
| 28 | 0 |
| Decision Point | Strategy | Conditions |
|---|---|---|
| (5) If a consumer buys traceable food products | Purchase | (a) The certification agency is not working independently: |
| (b) The certification agency is working independently: (for not developing a traceability system) (for developing a traceability system) | ||
| (4) What is the strategy adopted by certification agency? | Issue the certification | (for not developing a traceability system) |
| Do not issue the certification | (for not developing a traceability system) | |
| (3) If processing enterprises develop comprehensive traceability system? | Do not develop | (a) Certification agency is not working independently (b) Certification agency is working independently |
| Develop | (a) Certification agency is not working independently (b) Certification agency is working independently | |
| (2) If farmers adopts traceability practices? | Do not develop | (a) Certification agency is not working independently (b) Certification agency is working independently |
| Develop | (a) Certification agency is not working independently (b) Certification agency is working independently | |
| (1) If authority actively promotes traceability system? | Actively | (a) Certification agency is not working independently (b) Certification agency is working independently |
| Passively | (a) Certification agency is not working independently (b) Certification agency is working independently |
| Decision Node | Parameter | Numerical Value |
|---|---|---|
| Authority | 100 | |
| 90 | ||
| 80 | ||
| 70 | ||
| 10 | ||
| Farmers | 50 | |
| 40 | ||
| 30 | ||
| 20 | ||
| 10 | ||
| Processing Enterprises | 30 | |
| 20 | ||
| 150 | ||
| 140 | ||
| 15 | ||
| 10 | ||
| 10 | ||
| 5 | ||
| Certification Agency | 10 | |
| 5 | ||
| Consumer | 170 | |
| 160 | ||
| 10 |
| Strategic Combination | Authority | Farmers | Processing Enterprises | Certification Agency | Consumers |
|---|---|---|---|---|---|
| 1 | 20 | 20 | 55 | 15 | 20 |
| 2 | −80 | −30 | −95 | 15 | 0 |
| 3 | 10 | 10 | 45 | 15 | 20 |
| 4 | −80 | −20 | −105 | 25 | 0 |
| 5 | 10 | 10 | 55 | 15 | 20 |
| 6 | −80 | −20 | −85 | 15 | 0 |
| 7 | 10 | 10 | 40 | 10 | 20 |
| 8 | −80 | −20 | −110 | 10 | 0 |
| 9 | 10 | 10 | 55 | 15 | 20 |
| 10 | −80 | −20 | −95 | 25 | 0 |
| 11 | 10 | 10 | 65 | 15 | 20 |
| 12 | −80 | −20 | −75 | 15 | 0 |
| 13 | 10 | 10 | 50 | 10 | 20 |
| 14 | −80 | −20 | −100 | 10 | 0 |
| 15 | 20 | 20 | 55 | 15 | 20 |
| 16 | −70 | −30 | −95 | 15 | 0 |
| 17 | 10 | 10 | 35 | 15 | 20 |
| 18 | −70 | −20 | −105 | 25 | 0 |
| 19 | 10 | 10 | 55 | 15 | 20 |
| 20 | −70 | −20 | −85 | 15 | 0 |
| 21 | 10 | 10 | 40 | 10 | 20 |
| 22 | −70 | −20 | −110 | 10 | 0 |
| 23 | 10 | 10 | 55 | 15 | 20 |
| 24 | −70 | −20 | −95 | 25 | 0 |
| 25 | 10 | 10 | 65 | 15 | 20 |
| 26 | −70 | −20 | −75 | 15 | 0 |
| 27 | 10 | 10 | 50 | 10 | 20 |
| 28 | −70 | −20 | −100 | 10 | 0 |
Disclaimer/Publisher’s Note: The statements, opinions and data contained in all publications are solely those of the individual author(s) and contributor(s) and not of MDPI and/or the editor(s). MDPI and/or the editor(s) disclaim responsibility for any injury to people or property resulting from any ideas, methods, instructions or products referred to in the content. |
© 2023 by the authors. Licensee MDPI, Basel, Switzerland. This article is an open access article distributed under the terms and conditions of the Creative Commons Attribution (CC BY) license (https://creativecommons.org/licenses/by/4.0/).
Share and Cite
Gupta, N.; Soni, G.; Mittal, S.; Mukherjee, I.; Ramtiyal, B.; Kumar, D. Evaluating Traceability Technology Adoption in Food Supply Chain: A Game Theoretic Approach. Sustainability 2023, 15, 898. https://doi.org/10.3390/su15020898
Gupta N, Soni G, Mittal S, Mukherjee I, Ramtiyal B, Kumar D. Evaluating Traceability Technology Adoption in Food Supply Chain: A Game Theoretic Approach. Sustainability. 2023; 15(2):898. https://doi.org/10.3390/su15020898
Chicago/Turabian StyleGupta, Nainsi, Gunjan Soni, Sameer Mittal, Indrajit Mukherjee, Bharti Ramtiyal, and Devesh Kumar. 2023. "Evaluating Traceability Technology Adoption in Food Supply Chain: A Game Theoretic Approach" Sustainability 15, no. 2: 898. https://doi.org/10.3390/su15020898
APA StyleGupta, N., Soni, G., Mittal, S., Mukherjee, I., Ramtiyal, B., & Kumar, D. (2023). Evaluating Traceability Technology Adoption in Food Supply Chain: A Game Theoretic Approach. Sustainability, 15(2), 898. https://doi.org/10.3390/su15020898