Article

Experiment on Sediment Ammonia Nitrogen Release of Chaohu Lake in Varying Hydrodynamic Disturbance

1
State Key Laboratory of Water Resources and Hydropower Engineering Science, Wuhan University, Wuhan 430072, China
2
College of Hydraulic Science and Engineering, Yangzhou University, Yangzhou 225000, China
*
Authors to whom correspondence should be addressed.
Sustainability 2023, 15(2), 1581; https://doi.org/10.3390/su15021581
Submission received: 18 November 2022 / Revised: 8 January 2023 / Accepted: 10 January 2023 / Published: 13 January 2023

Abstract

:
Shallow water has low depth, and hydrodynamic conditions may change with the effect of wind and waves, resulting in sediment suspension and pollutant release. To investigate the influence of sediment incipient motion on ammonia nitrogen (NH3-N) release in shallow lakes under hydrodynamic disturbance, we monitored ammonia nitrogen concentration in the overlying water of sediments in Chaohu Lake under static, weak, and strong disturbance conditions and analyzed the ammonia nitrogen release rate based on the these concentrations. In static condition, the sediment particles on the surface moved individually (individual movement), and the ammonia nitrogen release rate was 9.59 mg/m2/day. When the disturbance was weak and a small proportion of sediment particles started to move (small movement), the ammonia nitrogen release rate increased to 34.21 mg/m2/day. When the disturbance was further strengthened, and most of the sediment particles moved (general movement), the ammonia nitrogen release rate was 77.04 mg/m2/day. Distribution showed that the release rate varied the most in the western area followed by the eastern area, and the central area had the lowest release rate. The daily release of ammonia nitrogen in Chaohu Lake ranged from 8742.3 kg to 61,008.59 kg. In this experiment, we combined sediment movement and pollutant release, which provides a new reference for the study of pollutant release in shallow lakes and for ammonia nitrogen management in other shallow lakes.

Graphical Abstract

1. Introduction

In recent years, water pollution in lakes has become increasingly serious. Nutrients such as nitrogen and phosphorus in the environment are key factors causing eutrophication and cyanobacteria outbreaks. To accurately understand the environmental impact on lake ecosystems, it is necessary to study the distribution and release mechanism of nutrients in the bottom mud. Shallow lakes are often affected by wind and waves, resulting in changes in the hydrodynamic conditions of the deposit surface, which lead to a large amount of sediment resuspension and the release of nutrients. The sediment incipient motion in the deposit changes from static to motion with increase in water flow intensity. Stronger hydrodynamic action leads to a greater degree of sediment incipient motion. Hydrodynamic disturbance is an important reason for sediment resuspension and pollutant release [1,2]. For example, in some flooded areas, sediment can be transported frequently. Vericat et al. (2010) [3] found that flood events favor sediment transport because of their capacity to deliver sufficient kinetic energy to mobilize surface soils and entrain the sediments. Leon et al. (2017) [4] studied the distribution characteristics of organic matter in the Mar Menor Lagoon and found that flash flood events influenced organic contaminant transport, especially in coastal areas. In their study, they found that flash floods significantly increased the concentration of ‘P, P-DDE’ (C14H8Cl4, a chlorophenylethylene and also a persistent organic pollutant) in the central and southern regions.
There has been considerable experimental research on the mechanism of sediment resuspension. You et al. (2007) [5] designed a hydrodynamic experiment using a propeller and obtained curves of resuspension and spinning speed, but there are some mechanism differences between the experiment device and a real lake, causing unavoidable mistakes. Li et al. (2020) [6] studied the effect of turbulence on the suspension of sediment surfaces through indoor observation experiments. In the process of sediment resuspension in lake areas, wave shear stress played a leading role, and the threshold of shear stress was 0.08 N/m2. Salim et al. (2020) [7] studied the mechanism of sediment resuspension in the nearshore region and found that sediment resuspension is mainly affected by turbulence, and Reynolds stress plays a key role in sediment incipient motion of the surface. Zheng et al. (2013) [8] found that silt resuspension caused by wind and waves should consider not only silt incipient motion caused by shear stress but also sediment particle liquefaction caused by sheer force of the wave and its resulting damage; however, sediments tend to show complex movements and mechanisms under wave motion, and further research on wave movement and resuspension needs to be done.
Lake deposition results in the storage of a large amounts of nitrogenous nutrients [9] that transform between deposition and the water by nitrification and denitrification in the aquatic ecosystem [10,11]. Moreover, resuspension caused by disturbance intensifies this process. However, sediment incipient motion has great randomness which can cause difficulty in defining the sediment initiation momentum. Dou (2001) [12] divided sediment initiation into three states: ‘individual movement’, ‘small movement’, and ‘general movement’, based on the number of suspended particles. In ‘individual movement’, the moving percentage of the sediment particles was less than 2.1%. In ‘small movement’, the moving percentage was 2.1~15.9%, and in ‘general movement’ was more than 15.9%. Li et al. (2004) [13] simulated the sediment incipient motion in Taihu Lake by an annular flume, calculated the corresponding starting shear stress, and measured the release of total nitrogen (TN) and total phosphorus (TP) according to the three starting modes. This provided a reference for the study of pollutant release under hydrodynamic conditions. Martin et al. (1992) [14] presumed that the balance condition determines the release of nutrients in sediment resuspension, which has little relationship with the increment of resuspension and resuspended time. Fan et al. (2004) [15] conducted an indoor static simulation of the release of ammonium nitrogen in Taihu Lake at different temperatures, finding that temperature influenced the release of ammonium nitrogen, and the release rate was promoted with the increase in water temperature. The whole exchange rate of ammonium nitrogen in Taihu Lake is about 113.9~187.0 mg/(m2d); however, the study only considered the influence of temperature on the amount of nitrogen released, ignoring the release of nitrogen caused by disturbance, which has limitations. In an experiment on ammonia nitrogen release and adsorption in reservoir deposits, Zhu et al. (2022) [16] found that an increase in flow disturbance intensity can promote the diffusion of NH3-N in the deposit to water, but the ammonia nitrogen release rate needs further study. For the purpose of investigating the effects of environmental factors on nitrogen release, Yuan et al. (2020) [17] conducted an indoor simulation with sediment from Poyang Lake. They controlled two factors in the experiment: temperature and disturbance, and found that temperature promoted the release of total nitrogen and ammonia nitrogen, with maximum release rate at 40 °C. The disturbance accelerated nitrogen release at an early stage of the experiment. Nitrogen release is a short-term process, and it gradually reaches a balance of release and adsorption.
Bottom mud is rich in nutrients, which is one of the main reasons for the eutrophication of shallow lakes [18]. There has been a lot of research of shallow lake ammonia nitrogen release, but seldomly do these studies associate sediment incipient movement with the release of ammonia nitrogen. Our study will connects hydrodynamic change, sediment incipient motion, and ammonia nitrogen release by experiments to explore the relationship between sediment incipient motion and pollutant release flux under changing hydrodynamic disturbance. We used an in situ culture experiment that provides an actual situation in which we observed the release process of ammonia nitrogen. We considered three experimental groups: static, weak disturbance, and strong disturbance, corresponding to three starting states of ‘individual movement’, ‘small movement’, and ‘general movement’. Additionally, we measured the release of ammonia nitrogen in overlying water and investigated the ammonia nitrogen release in shallow lakes under hydrodynamic disturbance. Thus, we analyzed the spatial and temporal characteristics of ammonia nitrogen release.

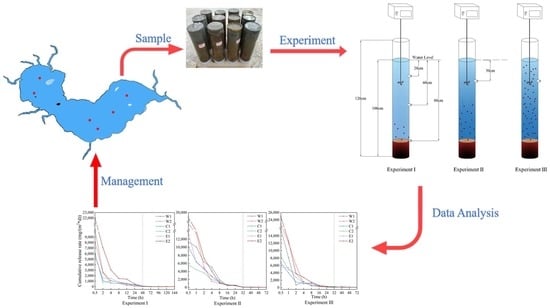
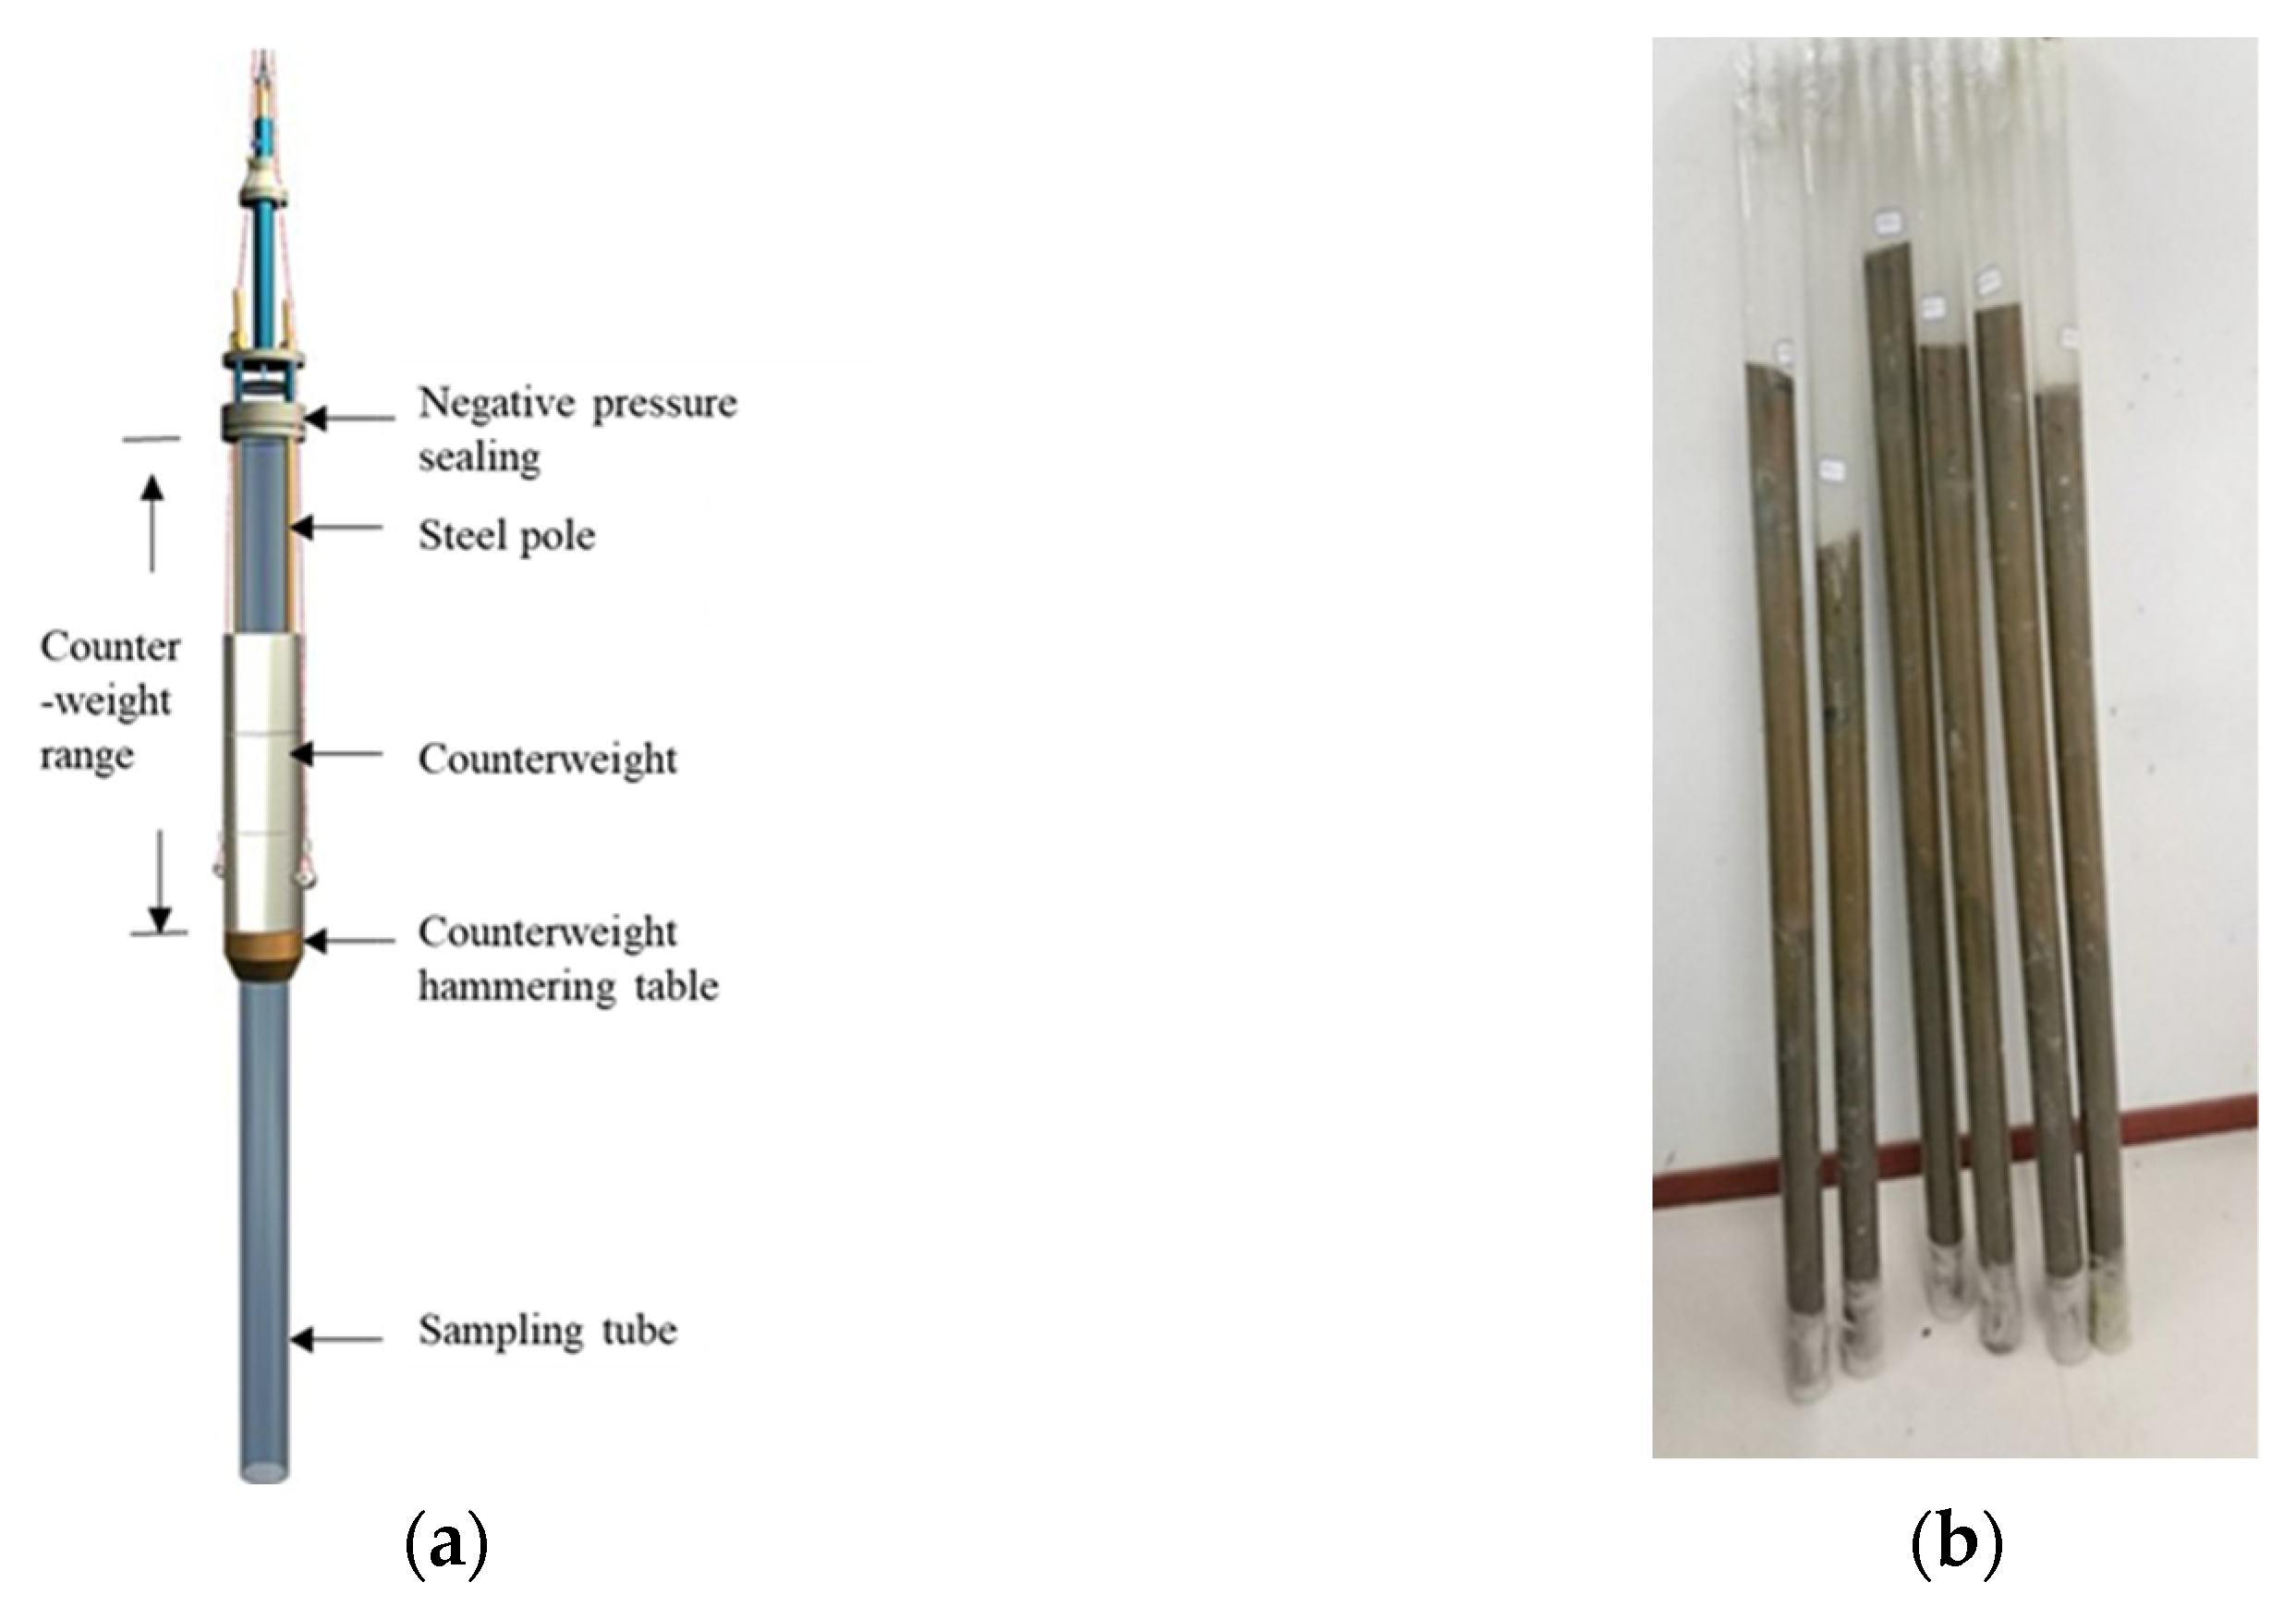
2. Experimental Design

The experiment was conducted in the School of Water Resource and Hydropower Engineering in Wuhan University, and the deposit was collected from Chaohu Lake (Figure 1). Chaohu Lake, located in central Anhui Province, is a typical shallow lake with an average depth of 2.89 m, an area of 780 km2, and an annual average water temperature of 16.9 °C. The average flow velocity of Chaohu lake is 0.02 m/s~0.07 m/s, and the maximum flow velocity is 0.62 m/s. Chaohu Lake has a lot of nearby urban development, mainly Heifei City, Chaohu City and Lujiang County. There are many tributaries flowing into Chaohu Lake, and more than four of them come from Hefei City. In recent years, the government has begun to establish a green landscape near Chaohu Lake.
After searching the China Meteorological Administration, we obtained wind speed data of Chaohu Feixi Station from March to May of 2000 to 2017. The maximum wind speed and direction for Chaohu Lake is shown in Figure 2. In spring, the wind direction measured at Chaohu Station is mainly in the east and northeast directions, and the maximum wind speed is mainly concentrated at 4–8 m/s. In the past few years, with the development of urbanization in the Chaohu Lake basin, the water body of Chaohu Lake has had a serious eutrophic state, and cyanobacterial blooms have occurred frequently. The average TN concentration (2.18 mg/L) in Chaohu Lake from 1987 to 2020 exceeded the national standard for Class V, and the TP concentration (0.16 mg/L) was in the national standard for class III [19,20]. This mainly comes from pollutants stored in the sediment and the inflow of tributaries [21]. The eutrophication degree of the Chaohu Lake water body is always at a high level, meeting the growth requirements of cyanobacterial blooms [22].
We divided Chaohu Lake into three parts according to geographical distribution: eastern, central, and western. We collected from two points in the west, two in the middle, and two in the east of the lake. The specific distribution of sampling points is shown in Figure 1.
A Core-60 sampler (Figure 3a) and supporting equipment produced by UWITEC (Austria) were used in this sampling, and the sampling was conducted in the middle of April 2018. Due to the large difference in sediment depth at different sampling points in Chaohu Lake, we used a 160 cm sampling tube in the collection process. Figure 3b shows the sampling results. We used an extraction with potassium chloride solution-spectrophotometric method to measure the ammonia nitrogen of the sediment (0–20 cm); the results are shown in Table 1. The ammonia nitrogen content of Chaohu bottom mud (surface of 0–20 cm) is 67 mg/kg (67 mg of NH3-N per kilogram of bottom mud) on average. The western part has the highest content at 91 mg/kg, the eastern area has 56.9 mg/kg, and the central area has the lowest at 45 mg/kg. We also calculated average sediment thickness and tested the vertical median particle size for the three lake regions shown in Table 1 and Figure 4. According to Figure 4, the median sediment particle size showed a trend of increasing median particle size with depth, and the grain size change in the lower sediment was more severe than that in the upper sediment. This may be mainly related to the stable hydrodynamic conditions in Chaohu Lake because the stable hydrodynamic conditions are favorable for the deposition of fine sediment. It can be seen that the particle size of the three sediment samples in the surface layer (less than 20 cm) is small. The mean median particle size of W, C, and E was 6.76, 11.83, and 7.03 μm.
After collection, we used siphons to obtain the overlying water for later use. To keep the sediment in its original state, we used a special cutter to cut 20 cm from the sampling tube vertically together with the sediment sample. Then, we put the columnar sample upright into an acrylic tube and closed the bottom of the sample tube. The inner diameter of the acrylic tube was 7.0 cm (slightly larger than the sampler of 6.8 cm), and it had a height of 120 cm.
The experiment device is shown in Figure 5.
At the tube wall, we punched some holes to obtain water samples at different depths, placed the 0–20 cm cylindrical sediment sample vertically at the bottom of the acrylic tube, and slowly added the pre-configured water to the 100 cm scale line. The pre-configured water was a mixture of distilled water and NH4Cl, and the concentrations of ammonia nitrogen (NH3-N) in the pre-configured water were based on the overlying water siphoned during sediment sampling (shown in Table 2). Before the experiment, we used a heating device to adjust the temperature of the pre-configured water, and we kept the temperature of the water at 20 °C, which was the average temperature of the whole original sample point. Additionally, the indoor temperature was kept at 20 °C with an air conditioner as well. The initial pH in the water body was 7.3 on average.
This experiment was done according to the experimental design of Li et al. (2004) [13], dividing the sediment starting state into three states: ‘individual movement’, ‘small movement’, and ‘general movement’, and monitoring the amount of pollutant released under the three starting modes. The starting state was mainly judged by the amount of sediment resuspension: (1) in individual movement, the sediment particles had almost no movement; (2) in small movement, the sediment particles started to move in small numbers, and the water body started to become turbid; (3) in general movement, the sediment particles were completely suspended, and the water body was almost completely turbid. We did three experiments, Ⅰ, Ⅱ, and Ⅲ, according to three starting modes, and used an integrated electric mixer with an adjustable speed to simulate different water flow disturbance intensities. The experimental measuring cylinder was fixed in alignment, and the propeller was slowly extended into the measuring cylinder and fixed underwater at a depth of 30 cm; the stirrer in experiment Ⅰ was in a static mode. For experiments Ⅱ and Ⅲ, the agitator was started slowly while observing the state of the sediment, determining the threshold according to the starting state, and the speed was slowly increased. The speed range of the agitator was 0–2000 r/min, and the control accuracy was ±1 r/min. The state was controlled by the speed of the propeller, which is shown in Table 3.
In experiment Ⅰ, the agitator was in a static state, so we mixed 0.1 L at water levels of 20, 60, and 80 cm to get 0.3 L samples at 0.5, 2, 4, 8, 12, 24 48 h, 72, 96, 120, and 144 h. For experiments Ⅱ and Ⅲ, we obtained 0.3 L water samples at the water level point of 30 cm underwater at 0.5, 1, 2, 4, 8, 16, 24, 32, 48, and 72 h. We detected the ammonia nitrogen concentration of the water at each time point. The ammonia nitrogen concentration was measured using Nessler’s reagent spectrophotometry. Additionally, the temperature, pH, and DO were measured at the same time. After obtaining the results, we used the formula below to calculate the release of ammonia nitrogen, which represents the pollution potential [23]. The formula was used from the internal calculation method of nitrogen and phosphorus in lake sediments to calculate the cumulative ammonia nitrogen release rate in the entire water body [24,25,26]. The calculation formula is as follows:
R = ( C i V C i - 1 V + C i V s ) S T
R , release rate, mg/(m2*d);
C i , ammonia nitrogen concentration at current time, mg/L;
C i - 1 , ammonia nitrogen concentration at previous time, mg/L;
V , the total volume of water, 4.34 L;
V s , the volume of each taken, 0.3 L
S , deposit area, 0.00134 m2;
T , experiment time, d.

3. Results

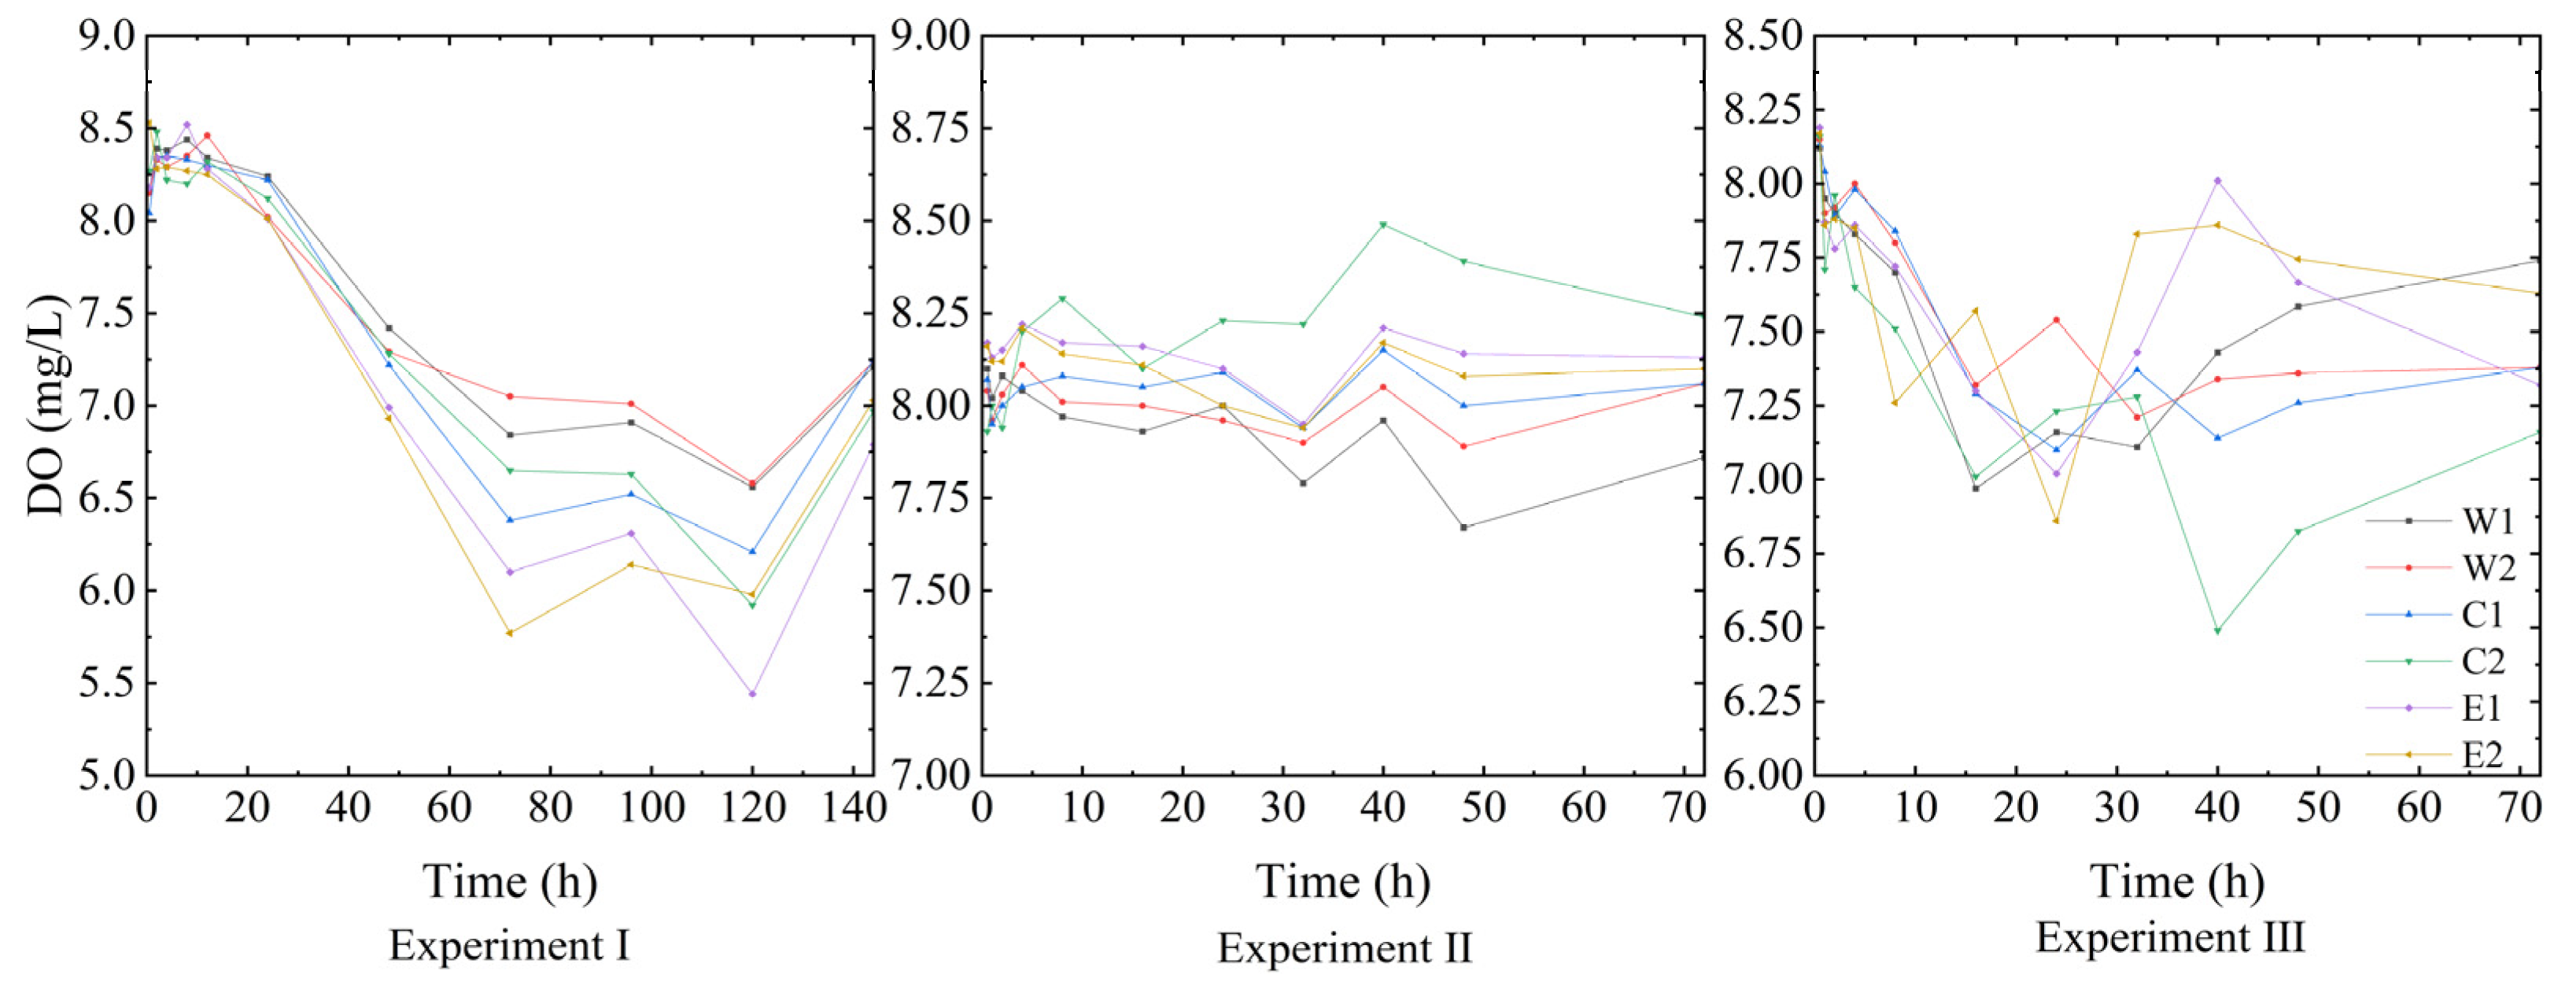
3.1. Ammonia Nitrogen Concentration in the Overlying Water

During the experiment, we found that there was almost no change in the temperature of the water, which stayed at around 20 °C (±1 °C). The pH was the same, staying at 7.3~7.4 during the experiment, so we focused on the change of ammonia nitrogen. As shown in Figure 6, the ammonia nitrogen content in water bodies at six points in the lake area had a tendency to rise rapidly and then decline slowly during the experiment. In the end, the ammonia nitrogen concentration became stable, which meant the exchange of ammonia nitrogen between lake sediment and the overlying water had reached an equilibrium state. Experiment Ⅰ had no disturbance, the sediment particles on the surface were suspended in trace, and the ammonia nitrogen (NH3-N) diffused into the water body. The ammonia nitrogen concentration in the water increased to a certain extent, reaching a peak at around 24 h before slowly decreasing. After 60 h, the concentration of ammonia nitrogen has almost no change, so the exchange of nutrition in the water body had reached an equilibrium. However, in experiments Ⅱ and Ⅲ, due to the increasing hydrodynamic effect of the water body, the sediment particles gradually became loose. Under shear stress, the sediment particles began to rise into the overlying water in large quantities and fully exchange with the overlying water. The ammonia nitrogen pollutants adsorbed on the particle surface directly entered the water body. The higher the agitation intensity, the greater the resuspension amount, the more fully the sediment and water mixed, and the faster the ammonia nitrogen concentration changed during a 0~48 h period. In experiment Ⅱ, the concentration of ammonia nitrogen always fluctuated in a high state in the first 24 h, began to decline gradually after 24 h, and reached an equilibrium at about 40 h. However, compared with experiment Ⅱ, the variation in ammonia nitrogen concentration in experiment Ⅲ was more disorderly and fluctuated more seriously, but it still showed a gradual downward trend and tended to be stable at around 48 h. The concentration of ammonia nitrogen in the overlying water remained unchanged after stabilization, indicating that the concentration of ammonia nitrogen in the water reached saturation under the disturbance intensity, and the release amount and adsorption amount between the sediment and the water reached a balance.

3.2. Cumulative Release Rate

Calculating the cumulative release rate of ammonia nitrogen, we obtained the results in Figure 7. The cumulative release rate of ammonia nitrogen was extremely unstable at the initial stage of agitation, and then gradually decreased. There was a similar trend in other shallow lakes [27]. Experiment Ⅰ tended to be stable at about 48 h, and experiments Ⅱ and Ⅲ tended to be stable at around 32 h. At the beginning of agitation, the sediment suspended rapidly, and the ammonia nitrogen which was adsorbed on the sediment or contained between the gap of the particles was diffused or released quickly into the water body, resulting in the dramatic release of ammonia nitrogen. At 0.5 h, the cumulative release rate rose to 104 mg/(m2d), but it fell rapidly in the following hours. As the agitation continued, the adsorption and release in the water gradually began to reach an equilibrium, and resulted in an extreme value after stabilization, which was the cumulative release rate after equilibrium. In these three experiments, the cumulative release rate of ammonia nitrogen within 2–4 h decreased at a very high rate, which would rapidly drop from tens of thousands to about thousands. After 4–24 h, the cumulative release rate began to decline slowly, presenting an exponential distribution as a whole.

4. Analysis

4.1. Hydrodynamic Influence on Ammonia Nitrogen Release

The calculated ammonia nitrogen concentrations at each point under the release equilibrium state are shown in Table 4. In experiment I, the average concentration of ammonia nitrogen was 0.23 mg/L, in experiment Ⅱ it was 0.26 mg/L, and in experiment Ⅲ it was 0.34 mg/L. Comparing the concentration of ammonia nitrogen in the different groups, the increases were 10.38% and 32.06%. The largest amplitude point was E1, and its increases were 38.6% and 77.6%, which indicates that this point was more sensitive to disturbance. Under the changing hydrodynamic disturbance, it was easy to resuspend and release a large amount of ammonia nitrogen pollutants into the overlying water. The results show that when the turbulence increases, the ammonia nitrogen concentration after balance was increased. As the stirrer speeded up, the flow disturbance was enhanced, which increased the amount of resuspended sediment and the ammonia nitrogen exchange between the sediment and overlying water was more frequent. On the one hand, a large amount of ammonia nitrogen nutrients attached to particles were dissolved into the overlying water under water flushing [28,29]. Disturbance presumably enabled ammonia nitrogen concentrations to reach a new equilibrium state. We also recorded the variation of DO (dissolved oxygen) during the experiment shown in Figure 8, and found that the DO content in the water body showed a slight decrease. In experiment I, the propeller was static, the DO declined from 8.22 mg/L to 7.08 mg/L on average, proving ammonia nitrogen release led to the decrease of DO in water. In experiments II and III, the decline in DO was less than in experiment I, but the release rate was much more than in experiment I. This is because the constant agitation increased the oxygen in the water.
Table 5 and Figure 9 show the average release rate after the release equilibrium. The figure shows that the cumulative release rate of ammonia nitrogen increased significantly with the increase in disturbance. In the static condition, the release rate was 7.69 mg/m2/d, which is close to the experimental results of Yang et al (2021) [30]. With the strengthening of hydrodynamic action, the release rate of ammonia nitrogen into the water body increased accordingly. The rapid release of ammonia nitrogen in sediment eventually leads to a larger equilibrium concentration of ammonia nitrogen, which requires a higher equilibrium concentration of ammonia nitrogen in overlying water to maintain the balance between rapid adsorption and release. Therefore, during the change in hydrodynamic disturbance, the cumulative release rate of ammonia nitrogen also showed multiple changes: from static to weak disturbance increased by 7.3 times, and from weak to strong disturbance increased by 2.33 times. E1 had the largest change range among these points, with an increase of 16.5 times from static to weak disturbance and three times from weak to strong disturbance. Under static and weak disturbance conditions, the median of the cumulative release rate was close to the minimum value and the lower quartile, and the probability of massive release was low except that the release amount at some points was too large. In the three experimental results, the wave peak of probability density gradually moved from the lower part of the boxplot to the upper part, indicating that the greater the hydrodynamic disturbance, the more influential the release of ammonia nitrogen from the sediment to the overlying water. The stronger the disturbance, the greater the release probability. On the other hand, the standard deviation of the accumulated release rate calculated in the three groups of experiments was 6.47, 12.68, and 22.61. With the increase in disturbance intensity, the fluctuation degree of the release rate was greater. Before reaching the equilibrium of release and adsorption, the release rate appeared negative at some points, which indicated that ammonia nitrogen in water was adsorbed to sediment particles, and the adsorption rate of ammonia nitrogen exceeded its release rate. The ammonia nitrogen in water is unstable, and the stronger disturbance is more likely to lead to the instability of ammonia nitrogen in the exchange process between water and deposits.
The exchange mode of ammonia nitrogen in overlying water is different under changing hydrodynamic disturbance. In static conditions, the structure of the sediment–water interface showed nearly no change, and the exchange of ammonia nitrogen was mainly based on molecular diffusion and convective diffusion. Its diffusion flux can be calculated using a one-dimensional pore water diffusion model [31]. In experiment II, under weak disturbance, the turbulent intensity of the water body became larger, the sediment particles were suspended into the water body, and the sediment bed became slightly damaged. In this condition, the nutrient exchange between the sediment and the water body was accompanied by diffusion and release-adsorption. With the continuous increase in flow intensity, under strong disturbance (experiment III), the flow state of the sediment bed surface was in chaos. The bed surface structure was obviously destroyed, and the suspension in the overlying water tended to be saturated. The pollutant exchange rate between the sediment and water was obviously increased, and the exchange mode became release and adsorption, instead of diffusion. Therefore, in the three groups of experiments, the increase in ammonia nitrogen concentration from static to weak disturbance was 10.38%, while from weak disturbance to strong disturbance the increase in ammonia nitrogen concentration reached 32.06%. The difference in growth was mainly because of their exchange mode. Adsorption and release between sediment particles and water is an important means of mass migration and transformation of nutrients in water. When the migration mode changes from diffusion to adsorption and release, the increased range of equilibrium concentration of ammonia nitrogen also increases.

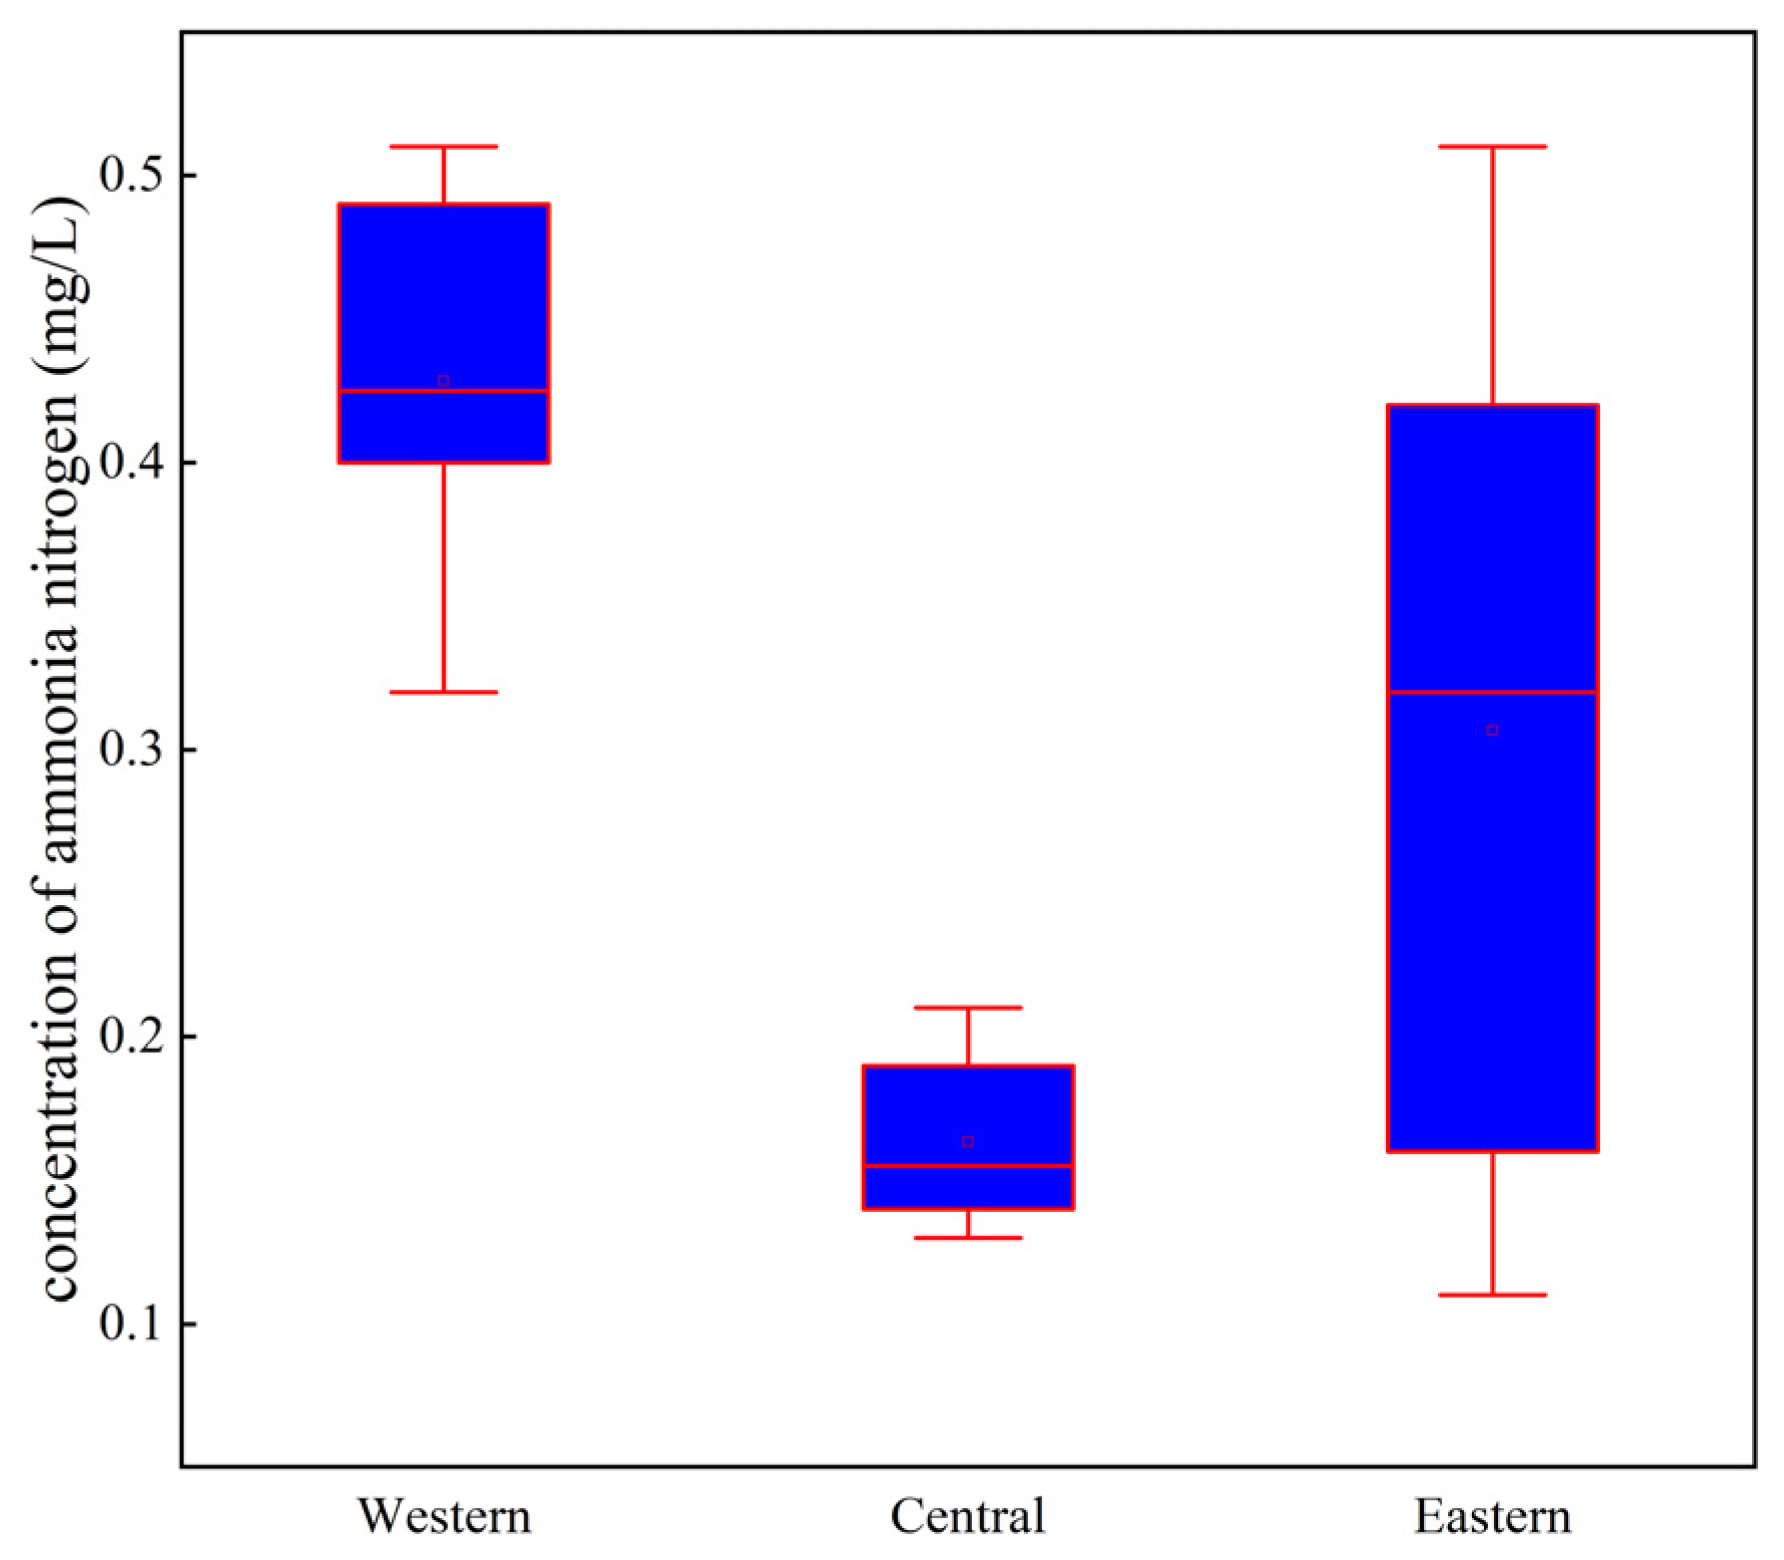
4.2. Distribution of Ammonia Nitrogen Concentration and Release Rate

The concentration of ammonia nitrogen at each point of the lake was maintained at 0.1 mg/L~1.0 mg/L in the three groups of experiments, indicating that the concentration of ammonia nitrogen pollutants was maintained in this range during the exchange between the water body of Chaohu Lake and its substrate, and this parameter (concentration) reached the standard of Class Ⅲ–IV water.
Figure 10 compares the concentrations between each point. Under the static condition, the average concentration of ammonia nitrogen in the whole lake was 0.23 mg/L, 0.38 mg/L in the western part of the lake, 0.14 mg/L in the central part of the lake, and 0.235 mg/L in the eastern part of the lake. Similarly, we calculated the equilibrium concentrations under weak and strong disturbances, and he ammonia nitrogen concentrations in the water column under the equilibrium state showed a distribution of western > eastern > central. Further, it was observed that the ammonia nitrogen concentrations at two points in the western part of Chaohu Lake and at the eastern point of the lake were significantly higher than the remaining three points. Multi-year water sample monitoring data have been recorded, and the eutrophication indexes in Chaohu Lake presented a distribution characteristic of high in the west and low in the east [32,33], and the pollution was more serious at the entrance of the lake. Comparing the cumulative release rate of each lake area, this also showed that the west area of the lake had a generally higher, while the east area of the lake had a lower release rate under static conditions, but it changed greatly after being disturbed. This is because the west of Chaohu Lake has the Baishitian River, Hangbu River, Pai River, Jiangkou River, Shiwuli River, and Nanfei River tributaries’ inflow into the confluence, of which the Pai River, Shiwuli River, and Nanfei River flow through Hefei, while the east of the lake has the Zhegao River and Moon Bay Wetland Park inflow into the lake, so the degree of pollution is serious. It can be seen that the tributaries leading into the confluence have a certain impact on the pollution of the lake. Economically developed areas often produce serious pollution in transiting rivers, and the western part of Chaohu Lake still showed a greater degree of pollution after several dredging and cleaning projects.

4.3. Calculation and Assessment of Lake Release Flux

Table 6 shows results from the calculations of releases of ammonia nitrogen the release from the lake area of Chaohu Lake based on the cumulative release rate at equilibrium. The release flux was obtained by taking the average value of the release rate in the lake area and multiplying it by the corresponding area.
The daily ammonia nitrogen release in the lake area of Chaohu Lake ranged from 8742.3 kg to 61,008.59 kg. Compared with the results in Taihu Lake of 9830.2 kg/d~48,112.3 kg/d calculated by Fan et al. (2004) [15], the results conform to the actual situation. Under the static condition, the daily release of ammonia nitrogen from the bottom sediment of Chaohu Lake was 8742.3 kg, of which the western lake takes up the largest part, 5545.67 kg, which is 63.4% of the total. Under weak disturbance, the daily release of ammonia nitrogen was 29,240.69 kg, an increase of 2.3 times compared with the former, and the release amounts in the three parts were relatively close. Under strong disturbance, due to the large amount of resuspension, ammonia nitrogen pollutants are fully exchanged with the overlying water, and the release amount reached 61,008.59 kg/d, which was 2.1 times higher than that under weak disturbance. The release amount was the highest in the east area of the lake, accounting for 47% of the whole lake. It can be seen that under static conditions, the release of ammonia nitrogen was mainly determined by the pollution of the overlying water, but under disturbance, the change of hydrodynamic disturbance played a key role in the ammonia nitrogen release.

5. Conclusions

We applied disturbance using an artificial method to simulate the natural condition of the hydrodynamic changes in shallow lakes. As a result, we found that disturbance can exert a significant effect on the release of ammonia nitrogen, causing its concentration to increase rapidly at first before gradually reaching equilibrium. The cumulative release rate and ammonia nitrogen concentration increased as the disturbance intensity increased. The results showed that the distribution of ammonia nitrogen concentration and cumulative release rate was western > eastern > central, which is mainly related to the high degree of pollution in the western region affected by branch inflow and sink. Under static conditions, the ammonia nitrogen release was mainly through molecular diffusion, and the amount of release was affected by the ammonia nitrogen content in the sediment. However, under disturbance conditions, the change in hydrodynamic disturbance had more influence on ammonia nitrogen release. Lastly, the stronger the disturbance, the greater the release amount.

Author Contributions

This research was conducted at Wuhan University with strong support from the Chaohu Lake administration in Hefei. We were provided guidance and help for the collection of sediments in our experiment. Conceptualization: S.X. and W.L.; Investigate: S.Z.; Formal analysis: S.X.; Data Curation: S.X.; writing—original draft preparation: S.X.; Visualization: S.X.; writing—Review & Editing: J.L., W.L. and L.C. Project administration: J.L., W.L.; Funding acquisition: J.L., W.L. All authors have read and agreed to the published version of the manuscript.

Funding

This study is supported by the National Natural Science Foundation of China (Grant No. 52109099; Funder: Wenguang Luo) and the National Natural Science Foundation of China (Grant No. 52079094; Funder: Yao Yue).

Data Availability Statement

All data generated or analyzed during this study are included in this manuscript. The data that support the findings of this study are available on request from the corresponding author. The data are not publicly available due to privacy or ethical restrictions.

Conflicts of Interest

The authors declare that they have no known competing financial interest or personal relationships that could have appeared to influence the work reported in this manuscript.

References

  1. Abdul, J.; Li, Y.; Du, W.; Wang, J.; Gao, X.; Wang, W.; Acharya, K. Wind-induced flow velocity effects on nutrient concentrations at eastern bay of Lake Taihu, China. Environ. Sci. Pollut. Res. 2017, 24, 17900–17911. [Google Scholar]
  2. Graham, N.D.; Bouffard, D.; Loizeau, J.L. The influence of bottom boundary layer hydrodynamics on sediment focusing in a contaminated bay. Environ. Sci. Pollut. Res. 2016, 23, 25412–25426. [Google Scholar] [CrossRef]
  3. Vericat, D.; Batalla, R.J. Sediment transport from continuous monitoring in a perennial Mediterranean stream. Catena 2010, 82, 77–86. [Google Scholar] [CrossRef]
  4. Leon, V.M.; Moreno-González, R.; García, V.; Campillo, J.A. Impact of flash flood events on the distribution of organic pollutants insurface sediments from a Mediterranean coastal lagoon (Mar Menor, SE Spain). Environ. Sci. Pollut. Res. 2017, 24, 4284–4300. [Google Scholar] [CrossRef] [PubMed]
  5. You, B.; Wang, T.; Fan, C.; Zhu, L.; Zhong, J.; Li, B.; Yin, H.; Hu, C. Quantitative simulative method if sediment resuspension in lake Taihu. J. Lake Sci. 2007, 5, 611–617. [Google Scholar]
  6. Tang, X.; Wang, J.; Jiang, Q.; Gan, Y.; Li, Y. Turbulence characteristic and its effect on suspension mechanisms of surface sediment in Taihu Lake. Yangtze River 2020, 51, 62–66, 200. [Google Scholar]
  7. Salim, S.; Pattiaratchi, C. Sediment resuspension due to near-bed turbulent coherent structures in the nearshore. Cont. Shelf Res. 2020, 194, 104048. [Google Scholar] [CrossRef]
  8. Zheng, J.; Jia, Y.; Liu, X.; Yin, P.; Shan, H. A review of the wave-induced sediment resuspension. Mar. Geol. Quat. Geol. 2013, 33, 173–183. [Google Scholar] [CrossRef]
  9. Zaaboub, N.; Ounis, A.; Helali, M.A.; Béjaoui, B.; Lillebø, A.I.; Silva, E.F.; Aleya, L. Phosphorus speciation in sediments and assessment of nutrient exchange at the water-sediment interface in a Mediterranean lagoon: Implications for management and restoration. Ecol. Eng. 2014, 73, 115–125. [Google Scholar] [CrossRef]
  10. Yang, L.; Cai, Q.; Qin, B.; Zhen, X. Characteristics of nitrogen between sediment-water interface in Meiliang bay, Taihu lake. J. Lake Sci. 1998, 10, 41–47. [Google Scholar]
  11. Zhang, W.; Xin, J.; Liu, D.; Lang, C.; Shan, B. Temporal and spatial variation of nitrogen and phosphorus and eutrophication assessment for a typical arid river—Fuyang river in northern China. J. Environ. Sci. 2017, 55, 41–48. [Google Scholar] [CrossRef]
  12. Dou, G. On the threshold velocity of sediment. In Proceedings of the 2001 Annual Conference of Chinese Hydraulic Society, Beijing, China, 16–21 September 2001; pp. 321–327. [Google Scholar]
  13. Li, Y.; Feng, Y.; Lv, J.; Zhang, G.; Ding, L.; Peng, J.; Wang, C.; Fan, L. On the relation between the release rate of TN, TP from sediment and water velocity. J. Lake Sci. 2004, 8, 318–324. [Google Scholar]
  14. Martin, S.; Peter, k.; Erik, J. Phosphorus release from resuspended sediment in the shallow and wind-exposed Lake Arres, Denmark. Hydrobiologia 1992, 228, 91–99. [Google Scholar]
  15. Fan, C.; Zhang, L.; Qin, B.; Hu, W.; Gao, G.; Wang, J. Migration mechanism of biogenic elements and their quantification on the sediment-water interface of lake Taihu: I. spatial variation of the ammonium release rates and its source and sink fluxes. J. Lake Sci. 2004, 1, 10–20. [Google Scholar]
  16. Zhu, Y.; Gao, P.; Zhao, Y.; Wang, F.; Huang, X.; Li, H. Ammonia nitrogen release from surface sediment of a reservoir in East China. J. Shanghai Univ. Nat. Sci. Ed. 2022, 28, 49–56. [Google Scholar]
  17. Yuan, Y.; He, P.; Liu, N.; Li, Y.; Chen, C. Effects of temperature and disturbance on nitrogen release from sediment of Poyang lake. J. East China Univ. Technol. Nat. Sci. 2020, 43, 495–500. [Google Scholar]
  18. Chen, J.; Xu, H.; Zhan, X.; Zhu, G.; Qin, B.; Zhang, Y. Mechanisms and research methods of phosphorus migration and transformation across sediment-water interface. J. Lake Sci. 2019, 31, 907–918. [Google Scholar]
  19. Yuan, J.; Cao, Z.; Ma, J.; Shen, M.; Qi, T.; Duan, H. Remote sensed analysis of spatial and temporal variation in phenology of algal blooms in lake Chaohu since1980s. J. Lake Sci. 2022, 2023, 35. [Google Scholar]
  20. Zhang, M.; Shi, X.; Yang, Z.; Chen, K. The variation of water quality from 2012 to 2018 in lake Chaohu and the mitigating strategy on cyanobacterial blooms. J. Lake Sci. 2020, 32, 11–20. [Google Scholar]
  21. Wang, Y.; Liu, Z.; Liu, W.; Xu, N.; Jin, X. Distribution and correlation characteristics between pollutants in sediment in Chaohu lake, China. Acta Sci. Nat. Univ. Pekin. 2003, 39, 501–506. [Google Scholar]
  22. Meng, Y.; Zhang, M.; Yang, Z.; Shi, X.; Yu, Y.; Shi, L. Seasonal shifts in the morphological traits of bloom-forming cyanobacteria in lake Chaohu, China. Diversity 2022, 14, 435. [Google Scholar] [CrossRef]
  23. Azim, M.; Wahab, M.; Verdegem, M.; van Dam, A.; van Rooij, J.; Beveridge, M. The effects of artificial substrates on freshwater pond productivity and water quality and the implications for periphyton-based aquaculture. Aquat. Living Res. 2002, 15, 231–241. [Google Scholar] [CrossRef]
  24. Precht, E.; Huettel, M. Rapid wave-driven advective pore water exchange in a permeable coastal sediment. J. Sea Res. 2004, 51, 93–107. [Google Scholar] [CrossRef]
  25. You, B.; Zhong, J.; Fan, C.; Wang, T.; Zhang, L.; Ding, S. Effects of hydrodynamics processes on phosphorus fluxes from sediment in large, shallow Taihu lake. J. Environ. Sci. 2007, 19, 1055–1060. [Google Scholar] [CrossRef] [PubMed]
  26. Chen, S.; Yang, G.; Lu, J.; Wang, L. Water quality in simulated eutrophic shallow lakes in the presence of periphyton under different flow conditions. Environ. Sci. Pollut. Res. 2018, 25, 4584–4595. [Google Scholar] [CrossRef]
  27. Chen, M.; Ding, S.; Chen, X.; Sun, Q.; Fan, X.; Lin, J.; Ren, M.; Yang, L.; Zhang, C. Mechanisms driving phosphorus release during algal blooms based on hourly changes in iron and phosphorus concentrations in sediments. Water Res. 2018, 133, 154–163. [Google Scholar] [CrossRef]
  28. Zhang, X.; Cao, J.; Li, Q.; Wang, N.; Li, Y.C. Characteristics and effects of inorganic nitrogen in East water-source and inflow rivers of Chaohu lake. J. Anhui Agric. 2012, 40, 7846–7849. [Google Scholar]
  29. Liu, D.; Zhong, J.; Zheng, X.; Fan, C.; Yu, J.; Zhong, W. N2O fluxes and rates of nitrification and denitrification at the sediment–Water interface in Taihu lake, China. Water 2018, 10, 911. [Google Scholar] [CrossRef] [Green Version]
  30. Yang, P.; Yang, C.; Ma, X.; Yin, H. Sediment pollution characteristics and dredging in the Nanfei River Estuary, Chaohu lake. Environ. Sci. 2021, 42, 712–722. [Google Scholar]
  31. Zhu, Y.; Jin, X.; Tang, W.; Meng, X.; Shan, B. Comprehensive analysis of nitrogen distributions and ammonia nitrogen release fluxes in the sediments of Baiyangdian lake, China. Environ. Sci. 2019, 76, 319–328. [Google Scholar] [CrossRef]
  32. Zhang, M.; Kong, F. The process, spatial and temporal distributions and mitigation strategies of the eutrophication of lake Chaohu (1984–2013). J. Lake Sci. 2015, 27, 791–798. [Google Scholar]
  33. Sun, L. Preliminary analysis on environmental quality of sediment in Chaohu lake from 2015 to 2019. Anhui Agric. Sci. Bull. 2021, 27, 158–160. [Google Scholar]
Figure 1. Geography of Chaohu Lake and sampling points.
Sustainability 15 01581 g001
Figure 2. 2000–2017 March–May maximum wind rose plot.
Sustainability 15 01581 g002
Figure 3. Tools and sampling results in sediment sampling: (a) Core-60 sampler; (b) sampling results.
Sustainability 15 01581 g003
Figure 4. Vertical distribution of particle size in the sample.
Sustainability 15 01581 g004
Figure 5. Hydraulic disturbance experiment.
Sustainability 15 01581 g005
Figure 6. Ammonia nitrogen concentration in each sample during the monitoring period.
Sustainability 15 01581 g006
Figure 7. Release rate of ammonia nitrogen in each sample during the monitoring period.
Sustainability 15 01581 g007
Figure 8. Variation of DO in the experiment during the monitoring period.
Sustainability 15 01581 g008
Figure 9. Cumulative release rate of ammonia nitrogen after equilibrium.
Sustainability 15 01581 g009
Figure 10. Comparison of ammonia nitrogen concentration in different parts.
Sustainability 15 01581 g010
Table 1. Sediment thickness of the three areas of Chaohu Lake.
LocationWCE
Sediment thickness (cm)
NH3-N in sediment (0–20 cm) (mg/kg)
125
91
76
45
105
56.9
Table 2. Initial concentration of ammonia nitrogen in overlying water.
Sample PointW1W2C1C2E1E2
Ammonia nitrogen
concentration (mg/L)
0.3030.3620.1200.1130.1080.348
Table 3. Controlling the condition of the experiment.
ConditionExperiment IExperiment IIExperiment III
Start stateIndividual movementSmall movementGeneral movement
Speed (r/min)0500–700>1500
Table 4. The equilibrium concentration of ammonia nitrogen release.
Serial NumberDistrictExperiment-IExperiment-IIExperiment-III
mg/Lmg/Lmg/L
1WesternW10.32 0.40 0.49
2W20.44 0.41 0.51
3CenterC10.13 0.16 0.21
4C20.15 0.14 0.19
5EasternE10.11 0.16 0.28
6E20.36 0.42 0.51
Average0.23 0.26 0.34
Table 5. The average cumulative release rate of ammonia nitrogen after equilibrium.
Serial NumberDistrictExperiment-IExperiment-IIExperiment-III
(mg/m2/d)(mg/m2/d)(mg/m2/d)
1WesternW17.69 54.87 89.84
2W221.38 35.67 98.07
3CenterC15.66 32.58 59.55
4C211.02 16.11 43.81
5EasternE11.94 31.83 93.93
6E23.30 49.72 107.38
Average9.54 34.21 77.04
Table 6. Results of calculation of ammonia nitrogen release in Chaohu Lake.
DistrictArea
(km2)
Experiment IExperiment IIExperiment III
kg/dkg/dkg/d
Western190.79 5545.67 10,469.02 17,141.04
Central293.802449.77 7152.42 15,184.13
Eastern284.96746.86 11,619.26 28,683.42
All769.558742.30 29,240.69 61,008.59
Disclaimer/Publisher’s Note: The statements, opinions and data contained in all publications are solely those of the individual author(s) and contributor(s) and not of MDPI and/or the editor(s). MDPI and/or the editor(s) disclaim responsibility for any injury to people or property resulting from any ideas, methods, instructions or products referred to in the content.

