Article

Effects of Double-Diffusive Convection on Calculation Time and Accuracy Results of a Salt Gradient Solar Pond: Numerical Investigation and Experimental Validation

1
Department of Physics, Faculty of Sciences and Techniques of Tangier, Abdelmalek Essaâdi University, Tangier 90000, Morocco
2
Department of Industrial Engineering and Mathematical Sciences, Università Politecnica Delle Marche, 60121 Ancona, Italy
*
Author to whom correspondence should be addressed.
Sustainability 2023, 15(2), 1479; https://doi.org/10.3390/su15021479
Submission received: 14 December 2022 / Revised: 28 December 2022 / Accepted: 10 January 2023 / Published: 12 January 2023

Abstract

:
The main aim of this study is to investigate numerically and experimentally the effects of double-diffusive convection on calculation time and accuracy results of a Salt Gradient Solar Pond (SGSP). To this end, two-numerical models are developed based on the Fortran programming language. The first one is based on energy balance neglecting the development of double-diffusive convection, while the second is two-dimensional and is based on Navier-Stokes, heat, and mass transfer equations considering the development of double-diffusive convection. The heat losses via the upper part, bottom, and vertical walls, as well as the internal heating of saltwater, are considered. In order to validate and compare both numerical models, a laboratory-scale SGSP is designed, built, and tested indoors for 82 h. Results indicate that the two numerical models developed can predict the SGSP thermal behavior with good accuracy. Furthermore, the average relative error between experimental and numerical results is around 9.39% for Upper Convective Zone (UCZ) and 2.92% for Lower Convective Zone (LCZ) based on the first model. This error reduces to about 5.98% for UCZ and 3.74% for LCZ by using the second model. Consequently, the neglect of double-diffusive convection in the SGSP modeling tends to overestimate the thermal energy stored in the storage zone by about 4.3%. Based on the calculation time analysis, results show that the second model returns a calculation time hundreds of times larger than the first one and, accordingly, an increase in computational cost.

1. Introduction

Nowadays, the global climate is changing, with increasing risks to the economy and human health, such as air and water quality. These changes are the result of human activities based on the use of fossil fuels. In this sense, renewable energies such as hydroelectric, solar, and wind energies are the most effective tools to stave off the worst effects of this climate change. Nevertheless, the intermittency of these renewable energy sources leads to the use of energy storage systems [1].
In this context, Solar Ponds (SPs) are among the efficient systems for collecting and storing solar energy over a long time period [2]. These systems are generally divided into two main categories: convective and non-convective. The convective solar ponds usually consist of a homogenous liquid layer with a transparent cover over the pond surface to reduce heat loss [3]. The non-convective solar ponds are generally made up of three saltwater layers to suppress heat loss through convection currents developing in the liquid body [4]. Among several types of non-convective ponds, Salt Gradient Solar Ponds (SGSPs) are the most common and widely used.
Generally, a Salt Gradient Solar Pond consists of three overlapping zones [5]. Starting from the bottom, the Lower Convective Zone (LCZ) is the storage zone and a homogenous saturated saltwater solution. The salt solubility in water depends on the temperature, with a direct proportionality. At a temperature of 80 °C, the maximum solubility of NaCl salt in water is around 26% [6]. In this zone, the phenomenon of heat storage occurs when the temperature of the solution increases (sensible heat storage). This occurs as the incident solar radiation hits the pond bottom, usually black, with a high absorbance coefficient. Moving upward, the second zone is the Non-Convective Zone (NCZ) which works as a transparent thermal insulator. In this zone, the salt concentration gradient increases with depth from the UCZNCZ interface to the NCZLCZ interface. The last zone is the Upper Convective Zone (UCZ) which generally consists generally of pure water. This zone protects the ones below from external environmental perturbations such as wind, rain, etc. Energy extraction for industrial processes [3], water desalination [7,8,9,10], or generating electric power [11,12,13,14,15] is the ultimate goal of SGSP construction. This heat extraction is usually based on two different methods. The first one, called the direct method, consists of pumping out the brine from the LCZ, passing it through an external heat exchanger, and re-injecting it at the SGSP bottom. The second one, named the indirect method, consists of placing a heat exchanger inside the LCZ through which a heat transfer fluid, such as water, passes. Based on the study by Leblanc et al. [16], the first method is more efficient but may cause turbulence in the LCZ due to the dynamic effect of the brine re-injection.
The concept of an SGSP was first demonstrated in 1902 by Von Kalecsinsky [17]. He noticed that the temperature of the natural lake Medve in Transylvania (42°44′ N, 28°45′ E) reached 70 °C at 1.32 m depth [2]. Then, several researchers reported the same for other lakes, such as Hot Lake in Washington [18], Lake Mahega in western Uganda [19], and Lake Vanda in Antarctica [20]. These lakes have been characterized by a high concentration of salt at the bottom, which is low at the surface, forming a vertical variation of the salt concentration [21]. This attenuates the natural convection and therefore stores thermal energy in the lower part of the lake [22]. Since the appearance of the SGSPs, several numerical models have been developed, and a large number of experimental studies have been carried out.
For experimental studies, Assari et al. [23] tested the effect of the geometric shapes (circular and rectangular) on the temperature and efficiency variations of SGSPs. Results presented for SGSPs, subjected to 11 months of weather conditions in Bafq (31°360 N, 55°240 E) in Iran, show that the temperature of a circular SGSP is higher than that of a square one. The storage efficiencies for the NCZ and LCZ of the circular SGSP are about 17.25% and 25.8%, respectively. For the square SGSP, they are for the same areas, equal to 17.39% and 23.65%. This difference results from the shading effect, which is lower for the circular SGSP, where the lateral surface is lower than that of the rectangular SGSP. Berkani et al. [24] tested experimentally the effect of three different salts, namely NaCl, CaCl2, and Na2CO3, on the thermal behavior of an SGSP under meteorological conditions of Annaba, Algeria. Results show that the temperature of the SGSP containing the CaCl2 solution is higher than that of the other ponds. However, the high cost of this salt limits its use in SGSPs. As well, as the basis for experimental studies, Assari et al. [25] proposed adding a porous medium to the SGSP bottom to improve its thermal performance. Silva et al. [26] used floating disks on the SGSP surface to minimize the evaporative loss. Alcaraz et al. [27] integrated four solar collectors with an SGSP to improve its efficiency. Assari et al. [28], Ines et al. [29], Beik et al. [30], and Colarossi et al. [31] proposed to add a phase change material in the SGSPs, aiming to improve the storage capacity of the system [32].
Regarding the numerical models developed, we can quote that of Kurt et al. [33] to predict the SGSP thermal performance. This model is based on the mass and energy balances of SGSP zones. Moreover, Mansour et al. [34] carried out a one-dimensional numerical study to analyze the thermal stability of an SGSP for six days (20–26 June 1993) in Tunisia. This study is based on the energy and mass balances of the SGSP. Results emphasize that the absorption of solar radiation by the brine water and the heat losses at the SGSP surface influence its stability over time. Based on another numerical study, Date et al. [35] conducted a comparison between the heat extraction from the LCZ only by combining the heat extraction from the LCZ and the NCZ. In this study, the temperature of the upper zone is assumed to be equal to that of the ambient air, and the NCZ is subdivided into sub-layers while the LCZ is assimilated to a homogeneous zone. Results demonstrate that if the quantity of heat extracted from the LCZ is greater than that of the NCZ, the temperature of the storage zone gradually decreases over time. Therefore, the flow rate of the heat transfer fluid circulating in the NCZ exchanger must be greater than or equal to that of the LCZ. Another one-dimensional numerical model has been developed by Sayer et al. [36]. These authors developed equations based on SGSP mass balance to evaluate the temporal variation of the LCZ and UCZ salt concentrations for inclined and vertical walls of the pond. In addition, Amigo et al. [37] used a one-dimensional numerical model to predict the temporal evolution of the temperature of an SGSP and the surrounding soil. This model is based on the energy balance of the zones where salt diffusion was negligible. Khalilian et al. [38] showed that the shading effect on the SGSP temperature depends on various parameters such as geographic, equatorial, and horizontal coordinates, as well as the geometric shape of the pond.
However, in all the studies cited above, double-diffusive convection in the two convective zones of the SGSPs (LCZ and UCZ) has been neglected. Suárez et al. [39] were the first to analyze in 2010, based on a two-dimensional numerical model, double-diffusive convection effects on the SGSP thermal performance and its stability. This model is based on Navier-Stokes, energy, and mass equations. The developed mathematical model was solved numerically with the Fluent software using the finite volumes method for discretization and the SIMPLE algorithm for pressure-velocity coupling. The developed numerical model was validated in a stepwise fashion since the experimental data are limited. The authors [39] have shown that the temperature of the LCZ is overestimated if double-diffusive convection is neglected. Therefore, the efficiency of the SGSP can be overestimated. Later, a numerical study on hydrodynamics and heat and mass transfer in a rectangular SGSP highlighted the significant effects of the Rayleigh number on SGSP thermal performance [40]. This study is based on the two-dimensional Navier-Stokes, heat, and mass transfer equations in which the quantity of the solar energy absorbed by the different layers is considered constant and equal to an average value during the study period. Subsequently, Rghif et al. [41,42,43,44] numerically studied Soret and Dufour effects on double-diffusive convection in an SGSP. The numerical model developed is based on Navier-Stokes, heat, and mass transfer equations and on the SIMPLE algorithm. Authors showed that the Dufour effect disrupts the SGSP working mechanism in which the heat and mass transfer increases from the lower to the upper convective zones, unlike the Soret effect [34]. For this reason, they suggested adding phase change material in the LCZ [42]. Recently, Rghif et al. [45] proposed a new two-dimensional numerical model that is able to describe and predict the heat and mass transfer in the salt gradient solar pond accurately by considering the double-diffusive convection development and by appropriate treatment of the boundary conditions.
It appears from the literature survey that the numerical models developed are generally two main categories. The first ones are one-dimensional or two-dimensional numerical models based on heat and mass balances of each SGSP zones in which the development of natural convection in the UCZ and LCZ is neglected. Second are two-dimensional numerical models based on Navier-Stokes, heat, and mass transfer equations in which the development of double-diffusive convection is considered. However, no study has been conducted to compare the two main categories of numerical models and to recommend the best one in terms of accurate results and time calculation. In this context, this study proposes, for the first time in studies of the SGSP, to investigate numerically, by using two different models, and experimentally the effects of double-diffusive convection on calculation time and accuracy results in an SGSP. For this proposal, two numerical models are developed and compared. The first numerical model is based on the energy balance of each SGSP zone with neglecting double-diffusive convection, while the second is based on Navier-Stokes, heat, and mass transfer equations considering double-diffusive convection. The obtained results are compared, for both models, to the calculation time required, an ever more important parameter related to the energy and environmental impact of numerical simulations. Moreover, a laboratory-scale SGSP has been designed and built in order to compare numerical and experimental results. The paper is organized as follows: Section 2 describes the experimental setup. In Section 3, both numerical models are presented. In Section 4, results are widely discussed, and in Section 5, conclusions and further research are listed.

2. Experimental Setup

2.1. Description of the Salt Gradient Solar Pond

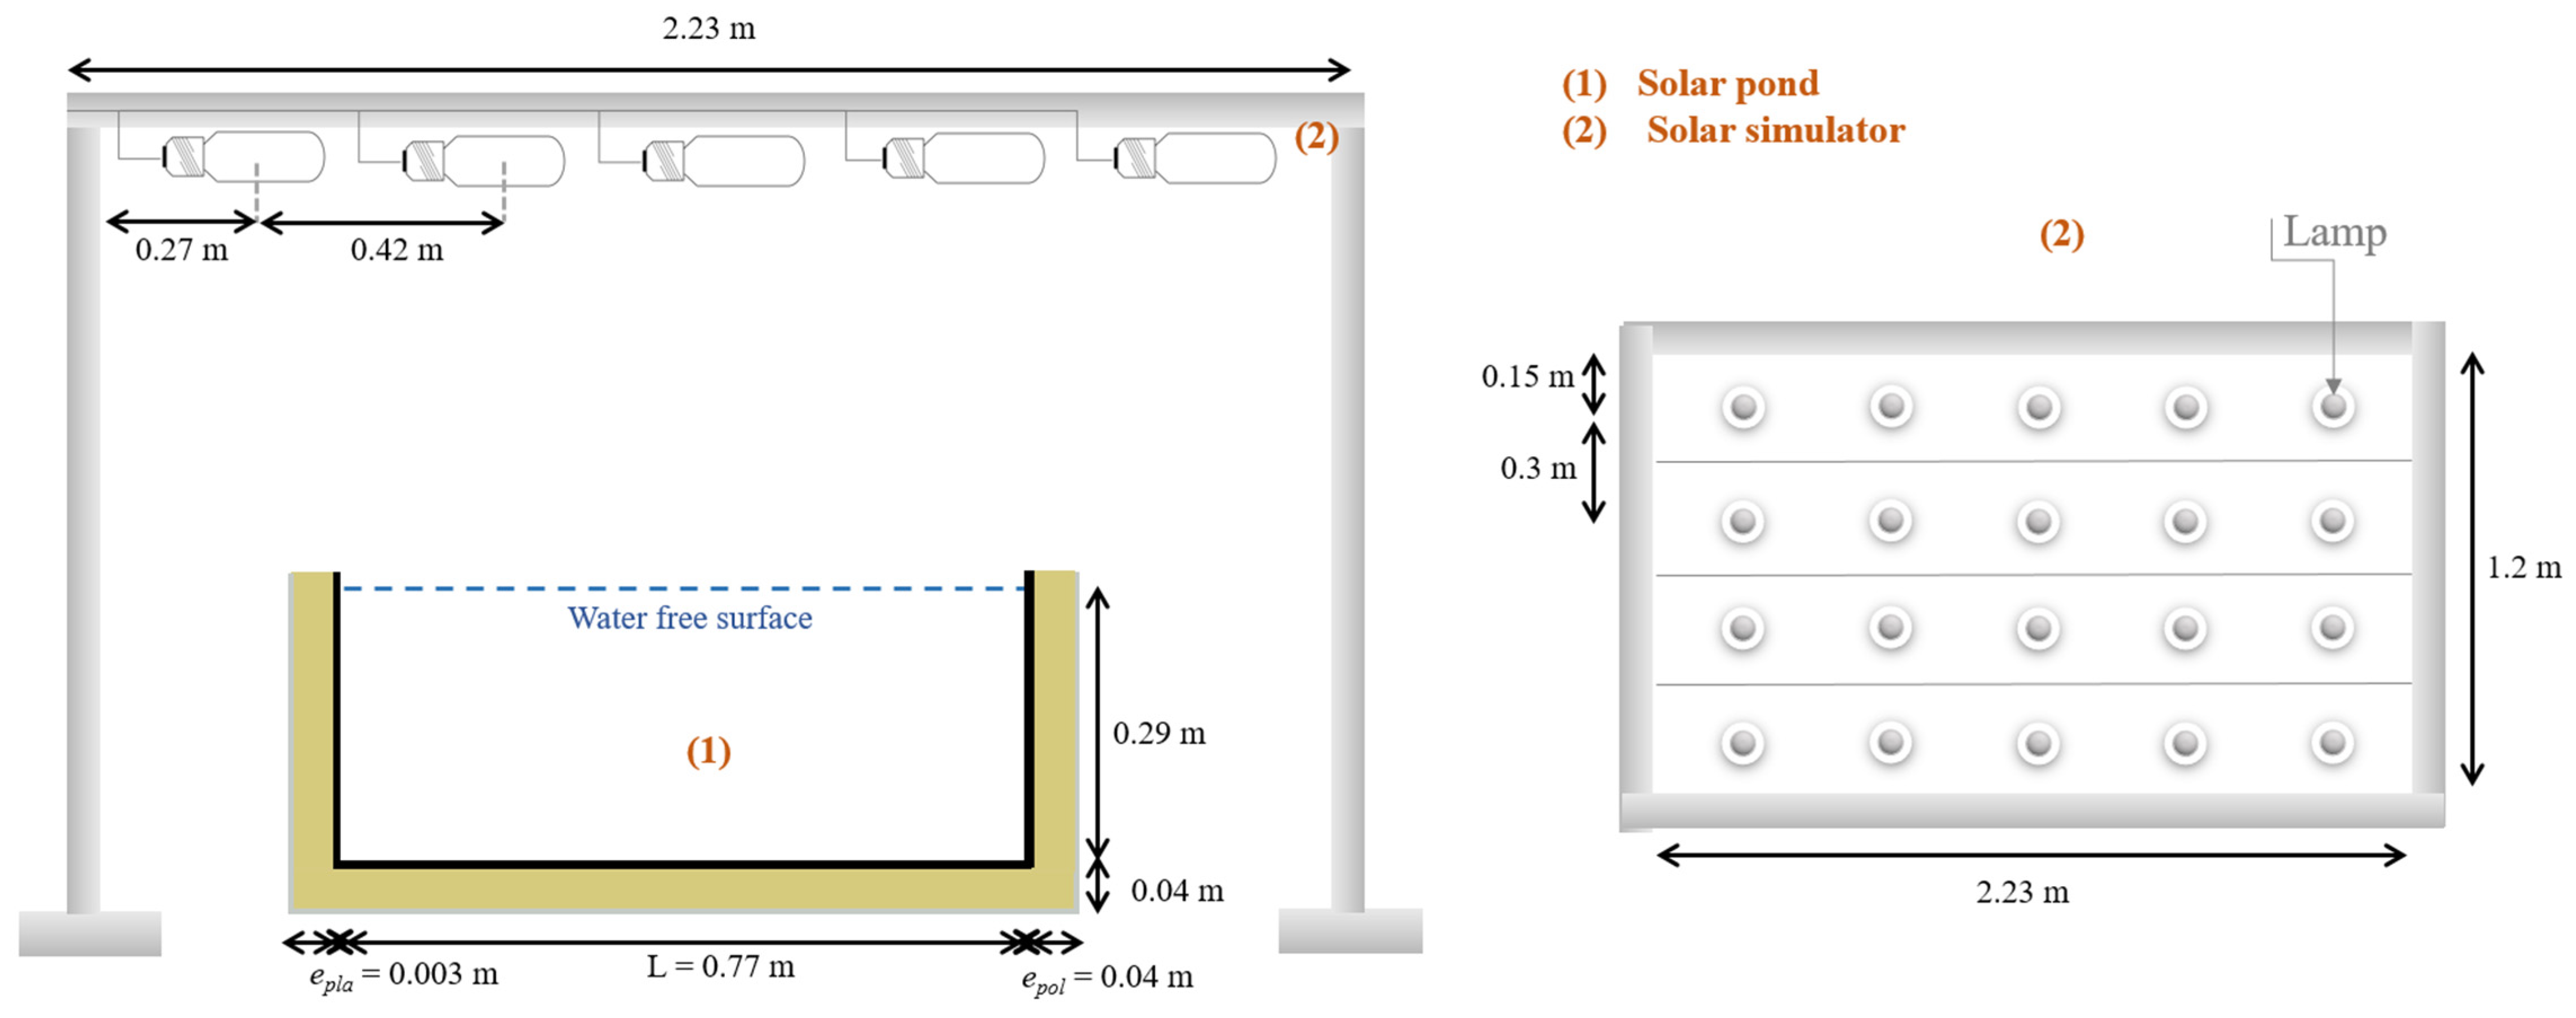
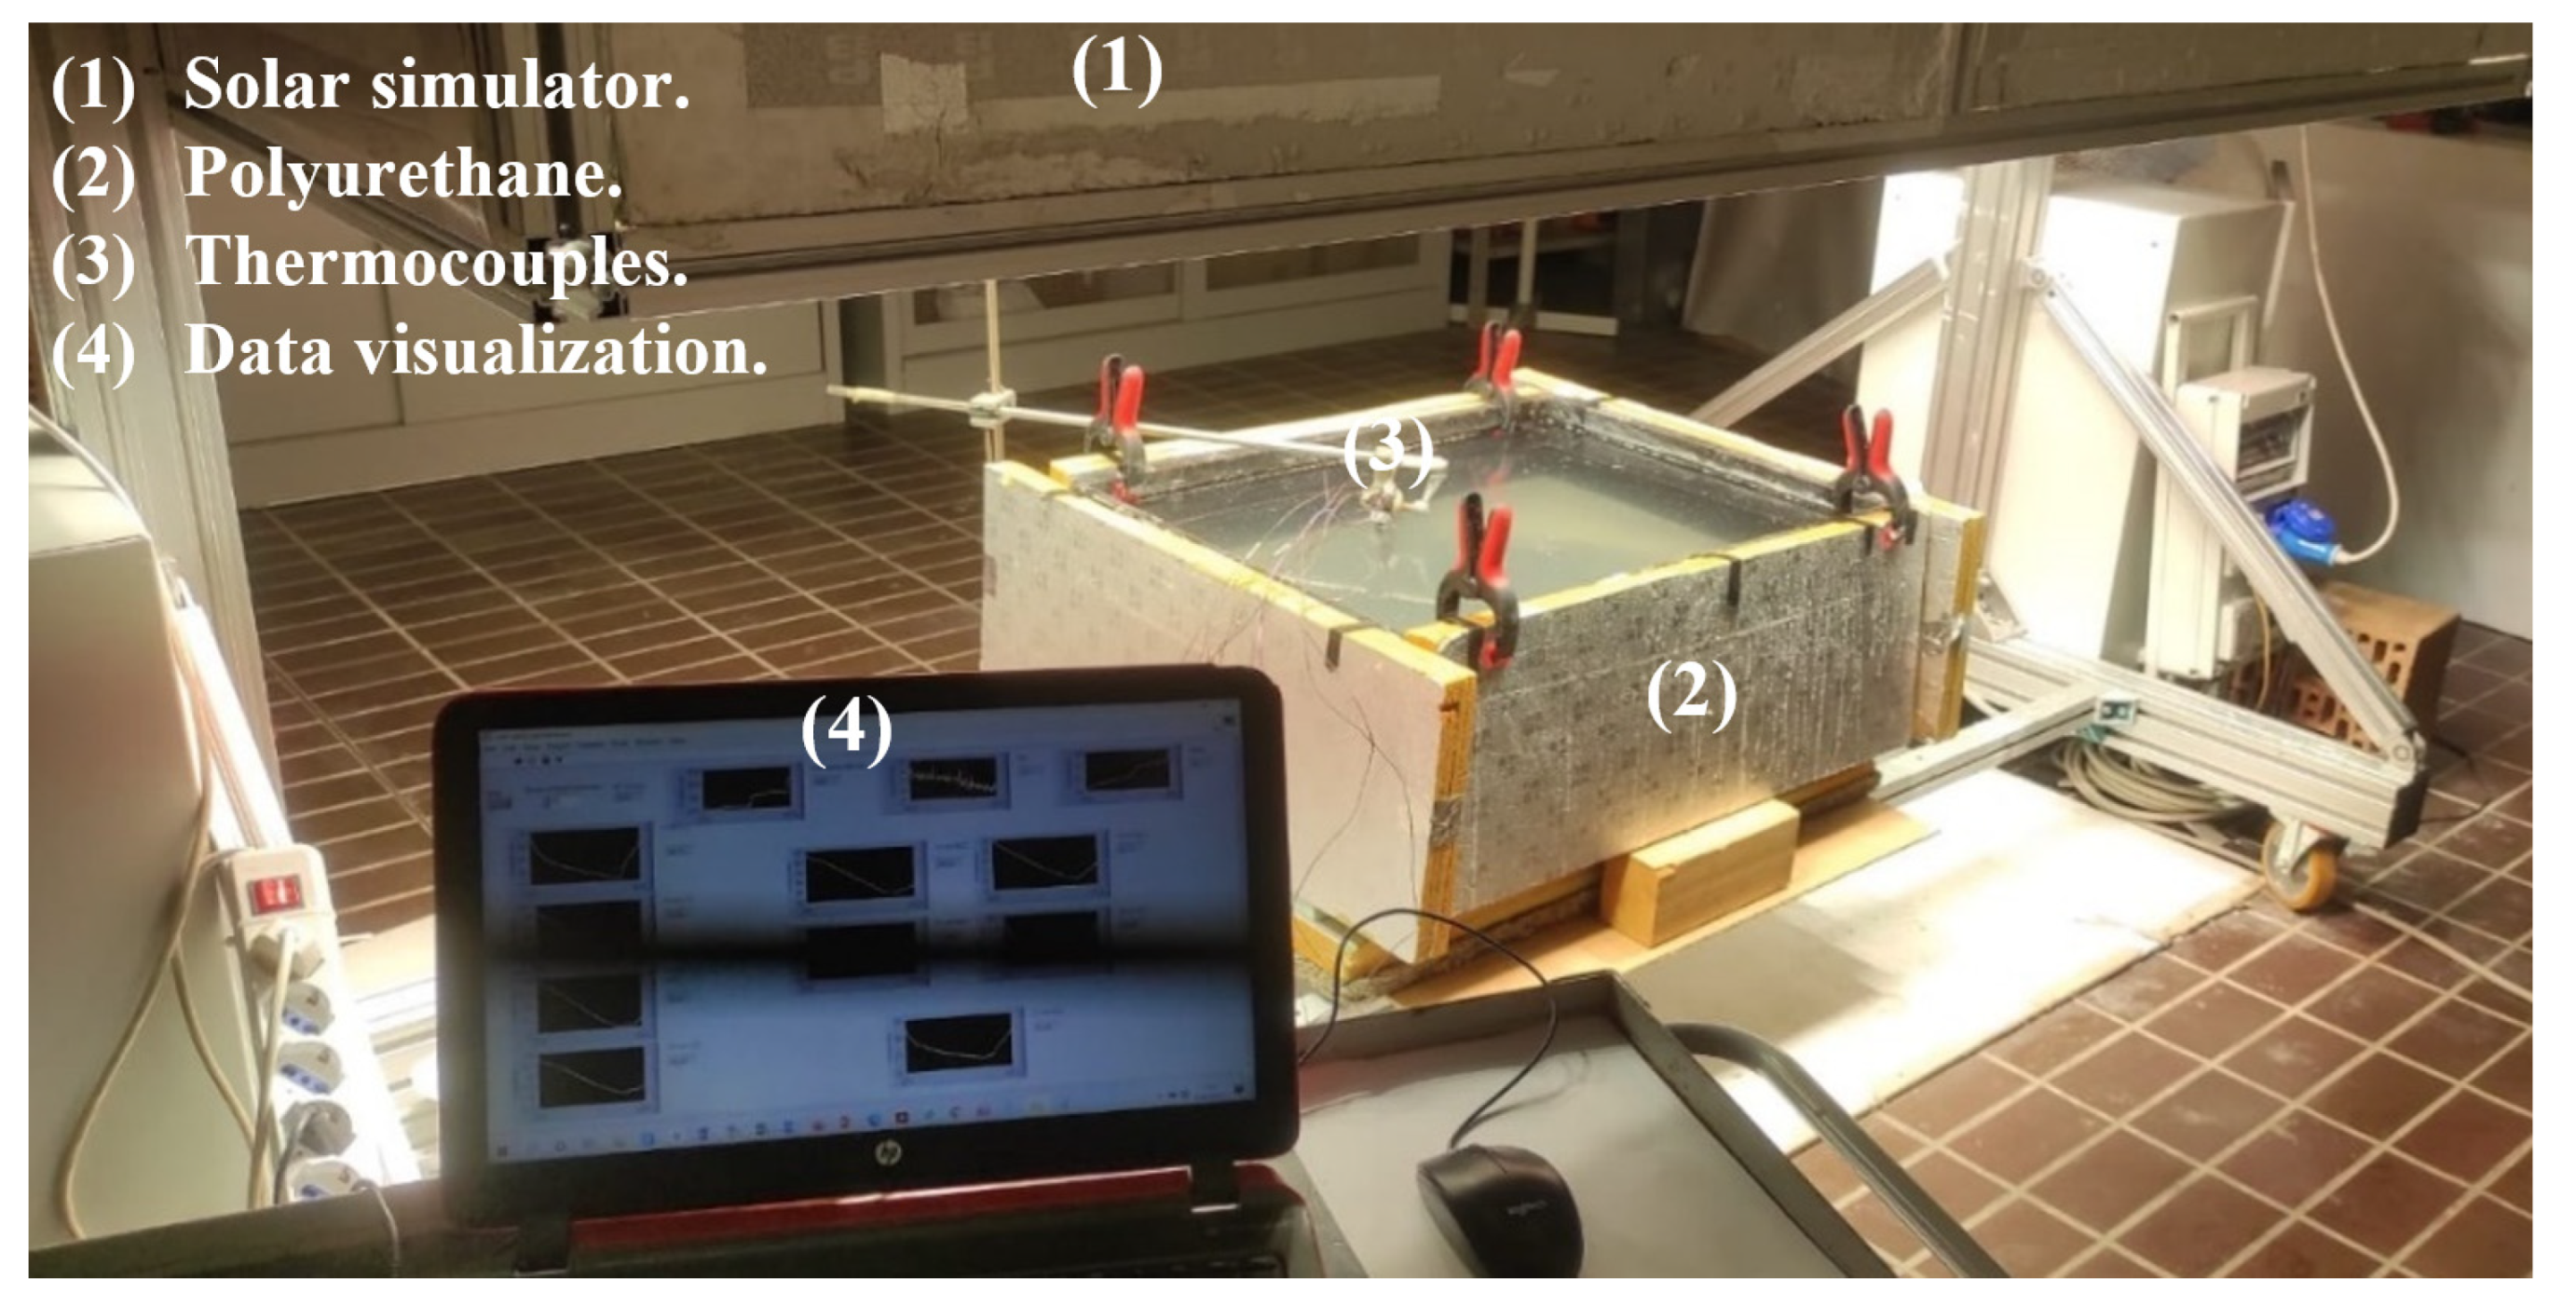
The pond built in this study consists of a parallelepiped box of black polymeric material (epla = 0.003 m and λpla = 0.4 W/m K). The external dimensions of the box are 0.305 m in height, 0.80 m in width, and 0.60 m in length, and the internal ones are 0.77 m in width (L) and 0.57 m in length (l). The internal base has a total area of about 0.43 m2. The bottom and vertical walls are blackened and thermally insulated by the polyurethane of thickness epol = 0.04 m and thermal conductivity of λpol = 0.12 W/m K (Figure 1).
The solar simulator presented in previous work [46] was used in this study to simulate solar radiation (Figure 2). It consisted of 20 metal halide lamps (each had a nominal power of 360 W) arranged in four rows of five lamps each. The aluminum structure on which the lamps were mounted was equipped with a vertical guide allowing adjustment to the distance between the target area and the lamps. This allowed the progressive increase and decrease in artificial solar radiation during the experimental period. It should be noted that the spectra of the artificial radiation emitted by these lamps were close to that of the sunlight [46]. Moreover, the arrangement of the lamps ensured uniform irradiation over a target area of around 2 m × 1 m [46].
The vertical stratification of the salt water was obtained following Zangrando’s method [47], which mainly consisted of three different phases. In the first one, the pond was filled with a saturated solution of water and salt up to a height equal to the LCZ and half of the NCZ. The second phase consisted of diluting with pure water the layer above the LCZ to create the NCZ layer. This was realized by a series of horizontal water injections (by means of a diffuser) starting from the LCZUCZ interface and up to the NCZUCZ one. The third phase consisted of the addition of pure water above the NCZ to create the UCZ layer. In this work, the first filling reached a height of 0.195 m (equal to the LCZ and half of the NCZ) with the saturated solution (equal to 26%). Then, fresh water was added through a diffuser that was initially placed at the LCZNCZ interface. As a result, the level of the saltwater in the pond increased by 0.005 m, and then the diffuser was raised by 0.01 m. The step was repeated until the free surface level reached the NCZUCZ interface. Finally, fresh water was added to fill the UCZ.

2.2. Measurements System

In order to measure the temperature of the salt water, nine T-type thermocouples (−200–400 °C measurement range, 48.2 µV/°C sensitivity, and ±1.0 °C accuracy) were used. These thermocouples were placed vertically at the center of the pond section (Figure 1) at different heights: four in the LCZ (z = 0 m, 0.06 m, 0.11 m, and 0.12 m), four in the NCZ (z = 0.15 m, 0.18 m, 0.21 m, and 0.24 m), and the last one in the UCZ (z = 0.27 m). It should be noted that these thermocouples were connected to a data logger (the NI-9214 for thermocouples input), which was plugged into LabVIEW software for data visualization.
In addition, the pyranometer (DPA/ESR 154) with a range of 0 to 2000 W/m2, a sensitivity of 10.88 µV/W m−2, and a linearity of 0.75%) was used to record the global solar radiation.
Moreover, the relative humidity and the air temperature were measured using the Omega HX93BD placed above the pond-free surface. Note that the temperature measurement range was from −30–75 °C with an accuracy of ±0.6 °C, while the relative humidity range was from 0–100% with an accuracy of ±2.5.
Table 1 summarizes all the instrumentations used in this work.
Figure 3 presents the final configuration of the experimental setup.

2.3. Experimental Protocol

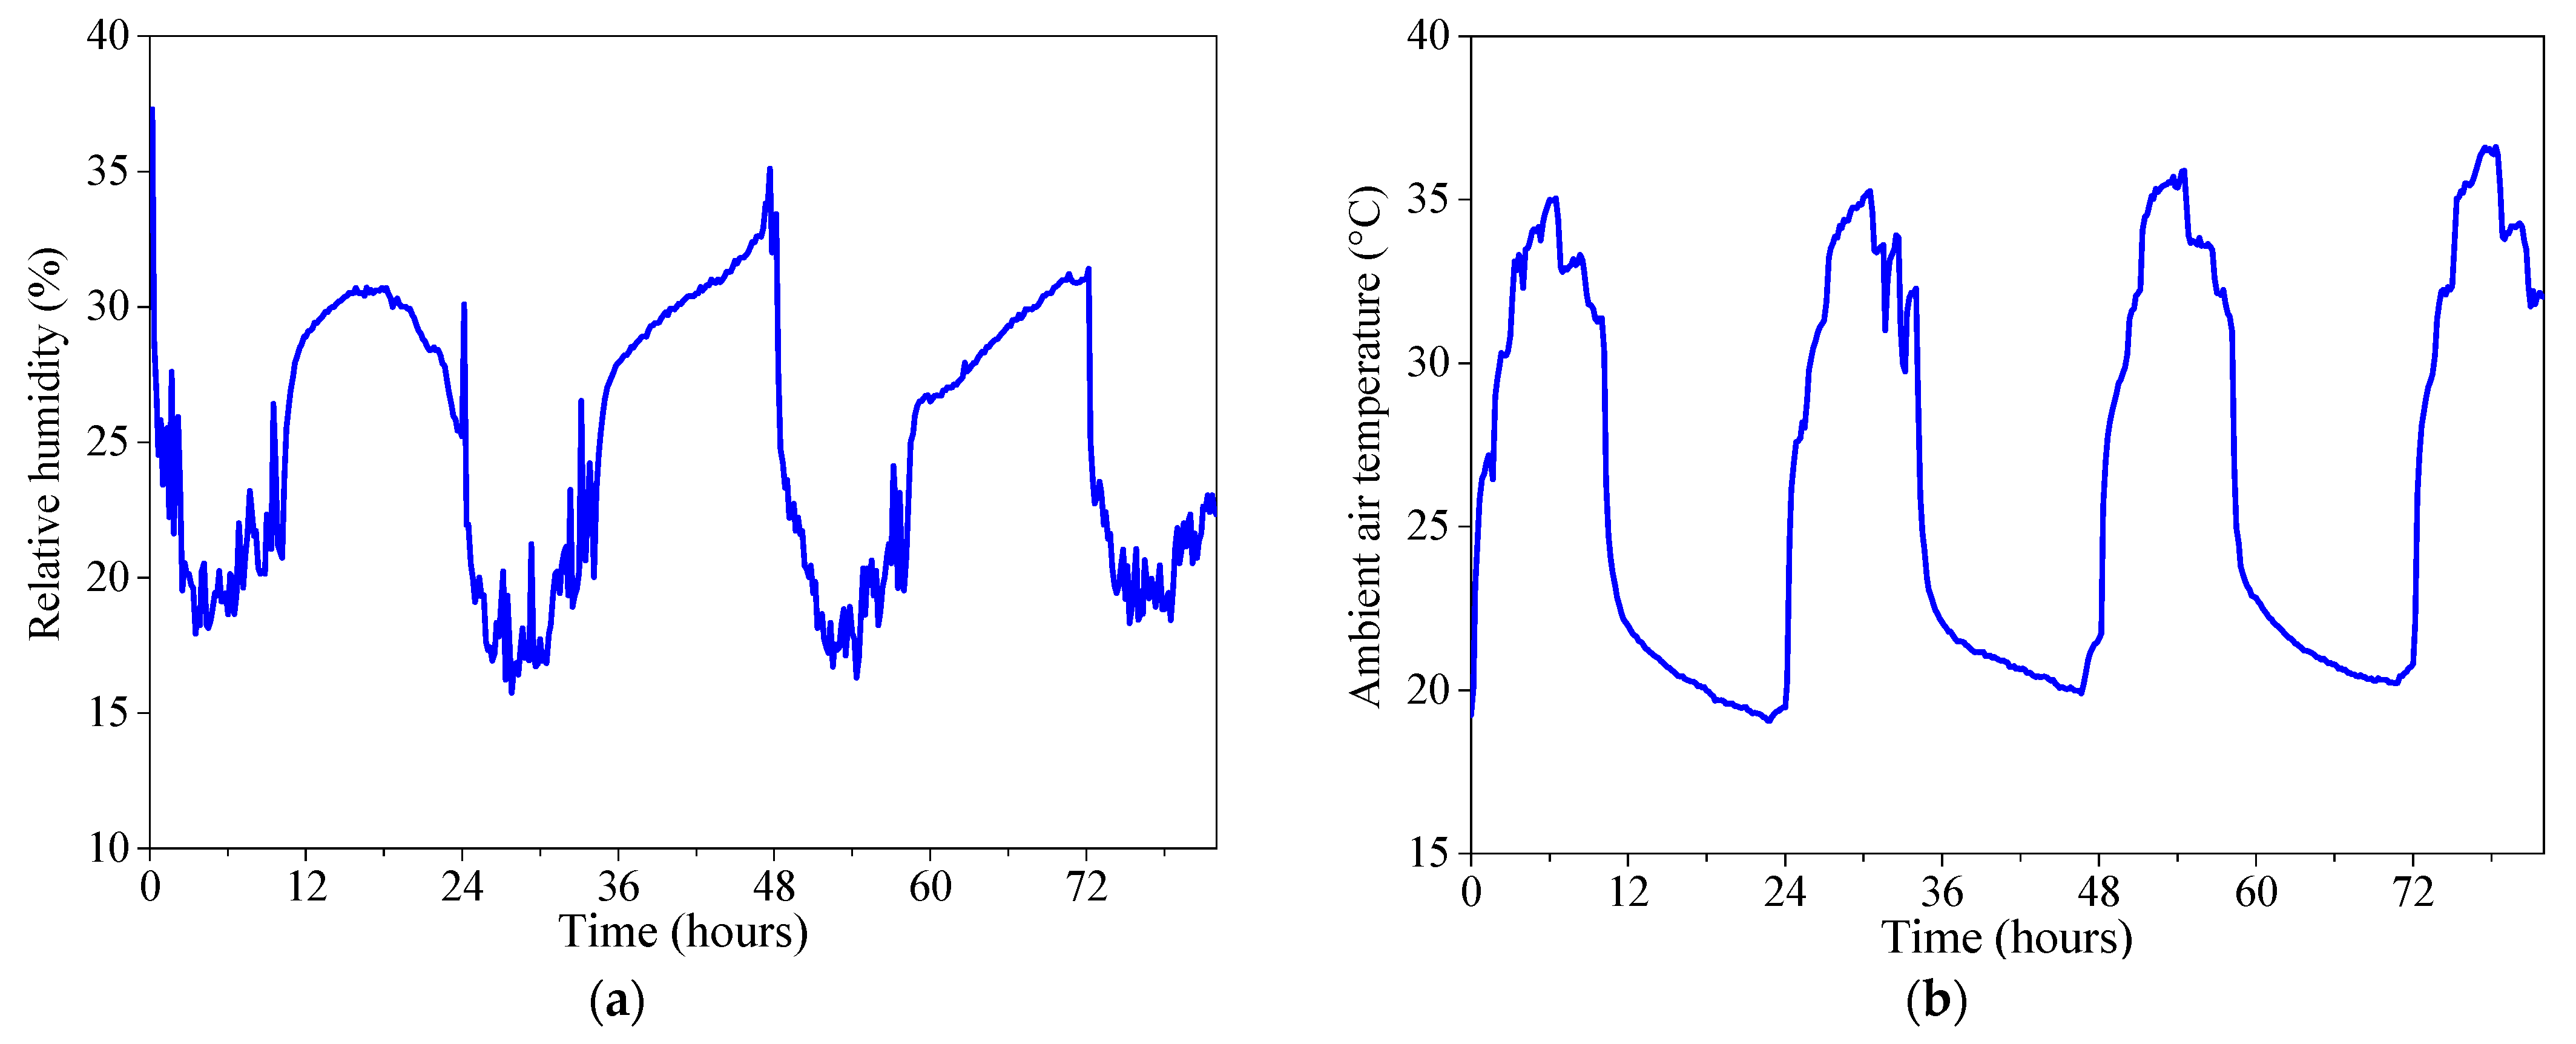
Experimental tests were performed within the laboratory of the “Department of Industrial Engineering and Mathematical Sciences” of the Università Politecnica delle Marche in Ancona (Italy). During the experimental investigation (from 1 February 2022 at 8:21 a.m. to 4 February 2022 at 6:21 p.m.), the system was monitored with a time step of one minute. Moreover, the variation of the artificial solar radiation (I) emitted by the solar simulator during the experimental period is illustrated in Figure 4. The profile approximates the solar radiation present in Ancona (Italy) during a typical sunny day in June.
In addition, the relative humidity (RH) and air temperature (Tair) measurements are plotted in Figure 5.

3. Numerical Models

3.1. Physical Model

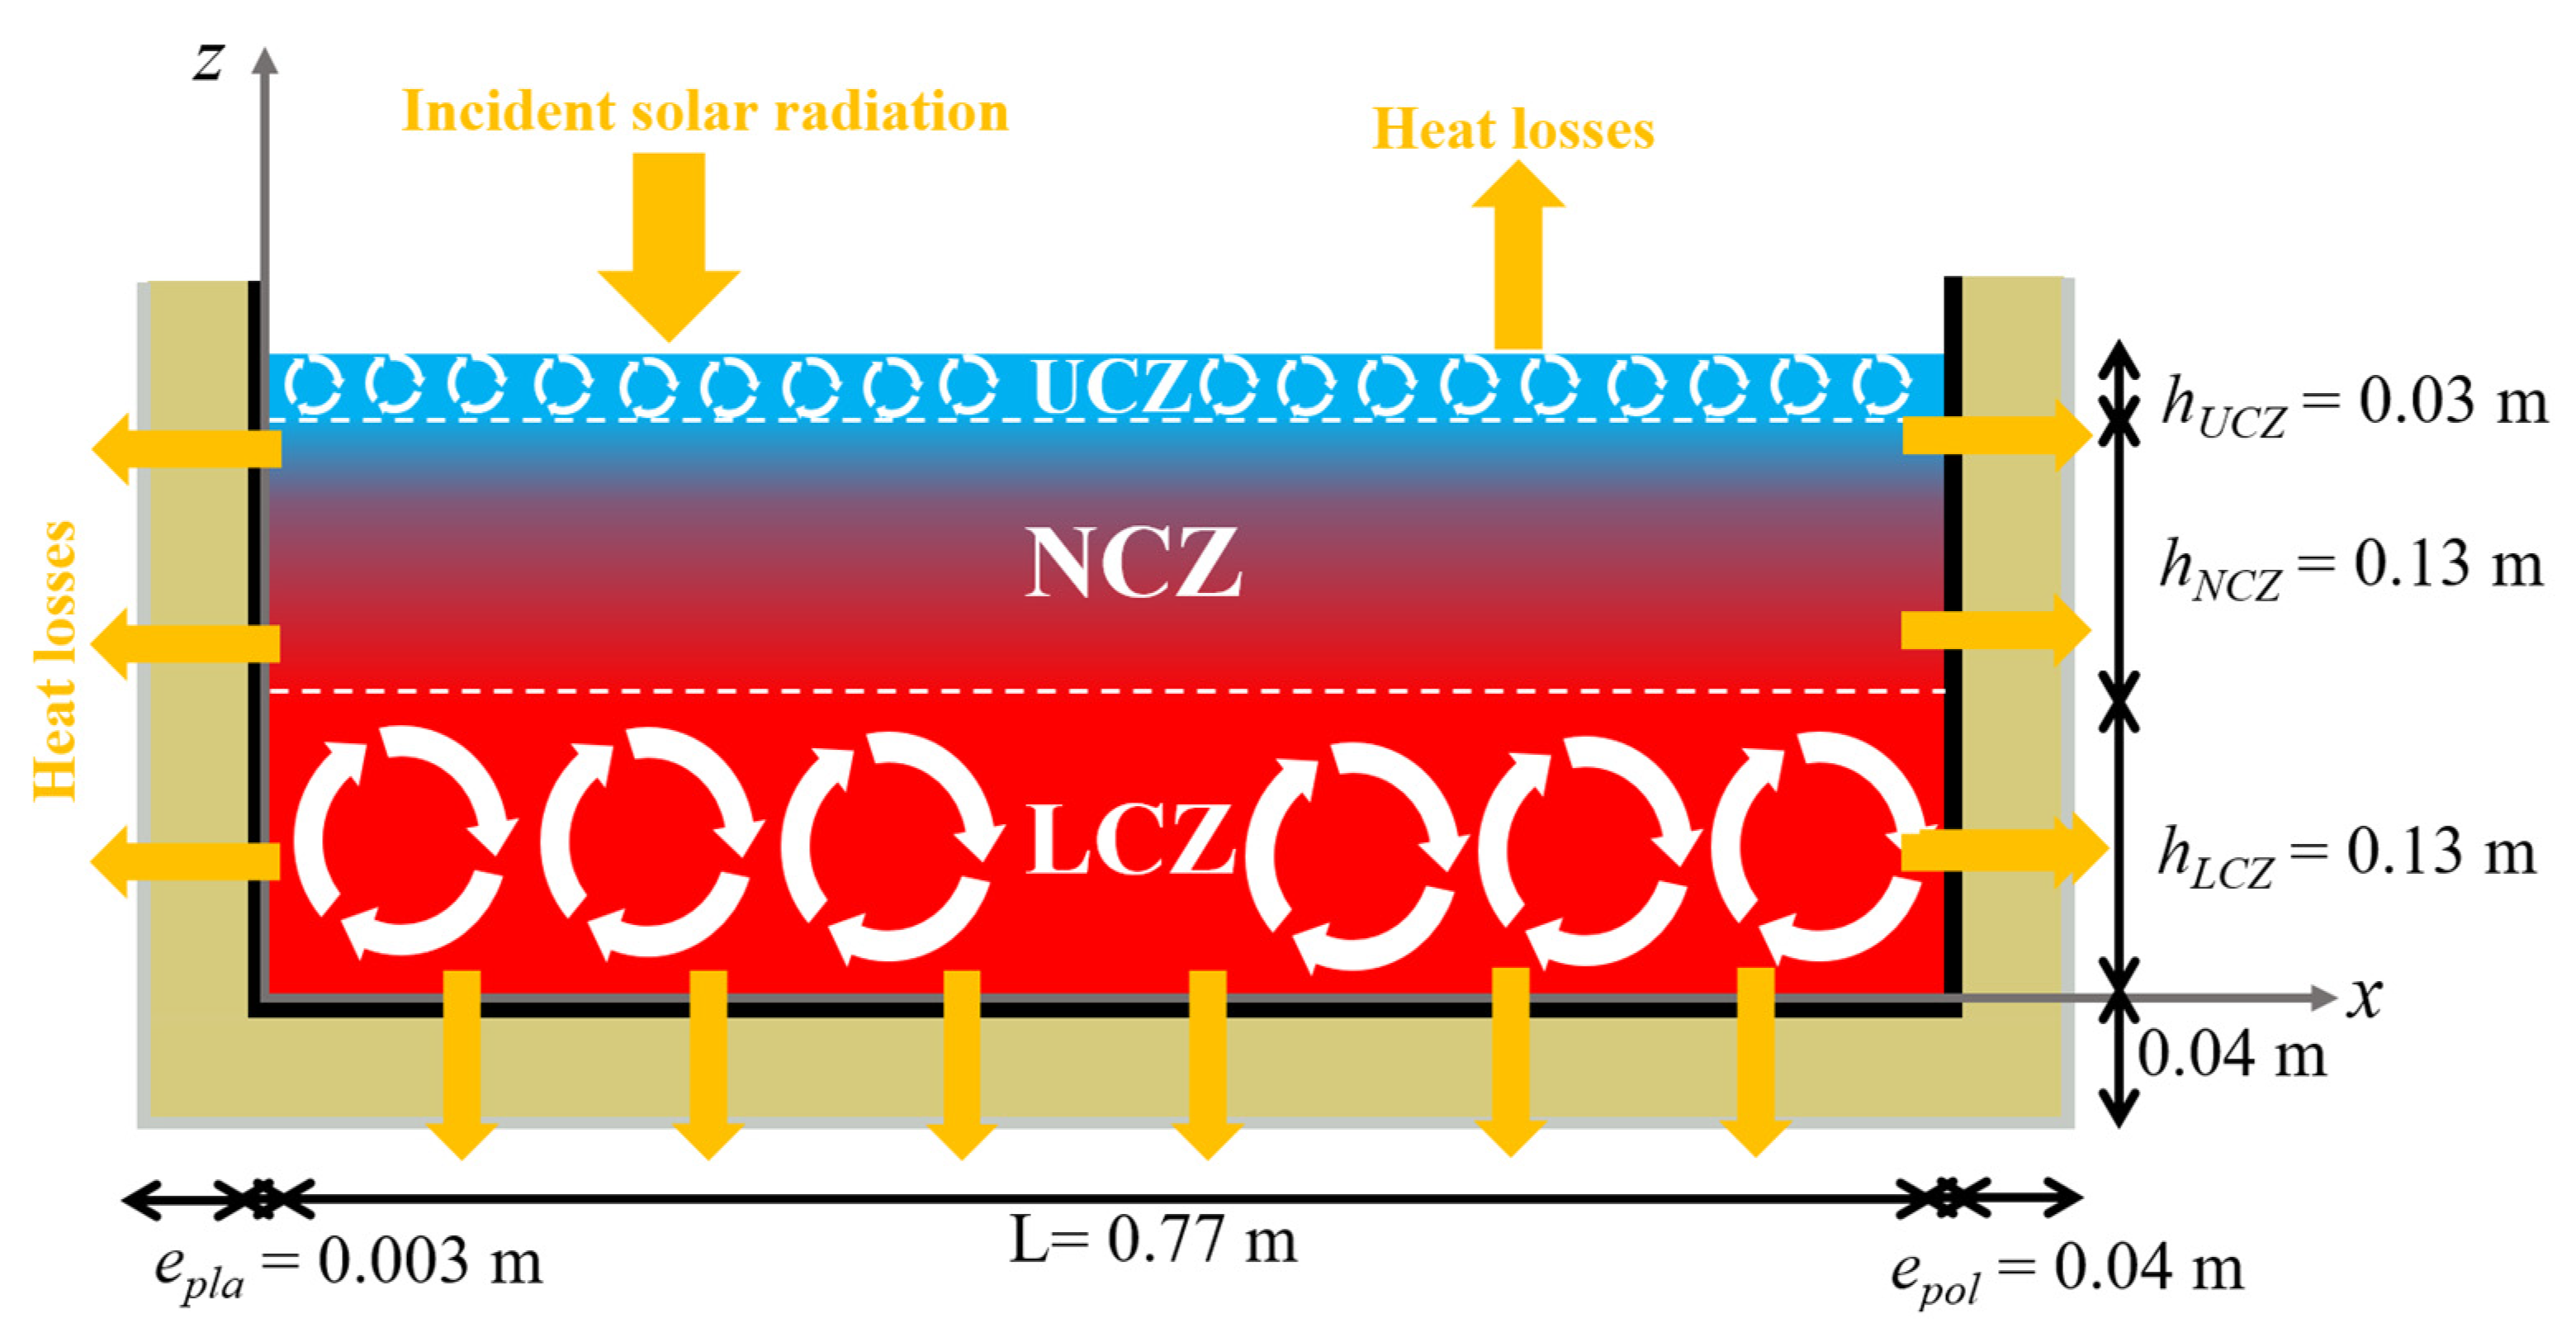
As mentioned in the experimental section, the physical model proposed in this study consists of a parallelepiped SGSP. The typical saline stratification of this pond was composed, depending on the salt concentration variation, of three horizontal zones: LCZ of 0.13 m thickness (hLCZ), NCZ of 0.13 m thickness (hNCZ), and UCZ of 0.03 m thickness (hUCZ) (Figure 6). The upper part of the SGSP was open, while the bottom and vertical walls were thermally insulated by polyurethane (epol = 0.04 m). The portion of the artificial solar radiation reaching the free surface was loosed via the surface, bottom, and vertical walls, and the rest was absorbed by the saltwater layers.

3.2. Absorption of Solar Radiation Model

The thermal performance of SGSPs largely depends on the quantity of solar radiation reaching the LCZ. This quantity is related to the solar radiation intensity and also to the optical properties of the salt water and the quantity of suspended dirt [48]. Bryant and Colbeck [49] proposed the following logarithmic formula to express the solar radiation quantity (φz) reaching a height z of salt water.
φ z = ( 1 a ) I θ h ( z )
h ( z ) = 0.36 0.08 ln ( z )
where I is the quantity of solar radiation reaching the free surface of the SGSP, θ′ is a coefficient that represents the solar radiation reduction in the salt water (θ’ = 0.85 [45]), and a is the incident radiation portion reflecting the atmosphere (a = 0.08 [45]).

3.3. Heat Losses through Free Surface, Bottom, and Vertical Walls of the SGSP

3.3.1. Heat Losses through Free Surface

The upper part of the pond was opened and subjected to heat transfer (φtt) by evaporation (φevp), radiation (φrd), and convection (φcov) as expressed by the balance below:
φ t t = φ e v p + φ r d + φ cov
Evaporative heat loss (φevp) is given by Amigo et al. [37] as follows:
φ e v p = ( φ f r e e 2 + φ f o r c e d 2 ) 1 / 2
φ f r e e = { 2.7 × 10 2 ( T w , v T a , v ) 1 / 3 ( e w e a ) if T w , v T a , v 0 if T w , v T a , v
φ f o r c e d = 3.1 × 10 2 U 2 ( e w e a )
where ea is the vapor pressure in the ambient air, ew is the saturated vapor pressure on the water-free surface, Tw,v is the virtual temperature on the saltwater-free surface, and Ta,v is the virtual temperature of the ambient air. They are calculated, as a function of the temperature of the upper part of the salt water (Tw) and the air temperature (Tair), by Expressions (7)–(10) [37].
e a = 2.1718 × 10 10 R H exp ( 4157 T a i r 33.91 )
e w = 2.1718 × 10 10 exp ( 4157 T w 33.91 )
T w , v = T w 1 0.378 e w P a t m
T a , v = T a i r 1 0.378 e a P a t m
Moreover, U2 of Equation (6) represents the speed of the wind measured above the pond-free surface (at 2 m). It is calculated using equations below [50,51]:
U z = U * K ln ( z z 0 )
U * = U K ln ( 10 z 0 )
where U is the wind speed, z0 is the roughness length (equal to 0.001 m for water [51]), and K is the Von Karman constant that is equal to 0.4 [51].
Radiative heat loss (φrd) is expressed as the difference between the heat flux density emitted from the saltwater surface to the atmosphere (φw) and the heat flux density from the atmosphere to the saltwater surface (φair), as expressed below [37]:
φ r d = φ w φ a i r
φ w = ε w σ T w 4
φ a i r = ε a i r σ T a i r 4
where σ is the constant of Stefan-Boltzmann (σ = 5.67037 × 10⁻⁸ W/m2 K4), εW is the emissivity of water (εw = 0.972), and εair is the emissivity of ambient air. This last one is computed from Raphael’s Formula (16) [37].
ε a i r = 0.87 2.693 exp ( 2.693 × 10 5 e a )
Convective heat loss (φcnv) is governed by Equation (17) [37].
φ cov = 1.5701 U 2 ( T w T a i r )

3.3.2. Heat Losses through Bottom and Vertical Walls

The bottom and vertical walls of the pond were made of polymeric material (epla = 0.003 m and λpla = 0.4 W/m K) and thermally insulated with polyurethane (epol = 0.04 m and λpol = 0.12 W/m K). Therefore, the heat losses through the SGSP bottom and walls (φloss) were by conduction as expressed in Equation (18). It is important to note that the heat losses by radiation and convection via bottom and vertical walls are neglected because the external face of the pond was covered with a very thin aluminum sheet (it is reflective) and had the same temperature as the ambient air.
φ l o s s = T w i n T a i r e p l a λ p l a + e p o l λ p o l
where TWin is the temperature of the inner wall face.

3.4. First Numerical Model: Double-Diffusive Convection Is Neglected

3.4.1. Mathematical Model

The first numerical model developed in this study is based on the pond zones’ energy balance. This model depends on the following assumptions:
  • The double-diffusive convection in LCZ and UCZ is neglected;
  • The temperature is uniform in the UCZ and LCZ;
  • The heat transfer in the NCZ takes place vertically along the height z;
  • The thermo-physical proprieties of the salt water are independent of the temperature and salt concentration variation and calculated at a reference salinity (Srf = 10%), a reference salt concentration (Crf = 100 kg/m3) and at a reference temperature (Trf = 40 °C) using the following correlations [52]:
    C p = 4180 4.396 S r f + 0.0048 S r f 2
    λ = 0.5553 8.13 × 10 5 C r f + 8 × 10 4 ( T r f 20 )
    ρ r f = 998 + 0.65 C r f 0.4 ( T r f 20 )
Based on the above assumptions and on the energy balance of the pond zones, the mathematical model can be written as follows:
  • In the upper zone (UCZ), the thermal energy losses from the upper part by three different modes (φtt) are calculated using Equations (17), (13), and (4). In addition, the conduction heat transfer is conducted via the bottom of this zone and the upper part of the non-convective zone (φNCZ/UCZ) and through the sidewalls (φloss). These quantities are obtained using Equations (22) and (18), respectively. Moreover, the quantity of thermal energy absorbed by the UCZ (φsolar,UCZ) is calculated by Formula (23), in which h(z = hUCZ). This last one is obtained from Equation (2).
φ N C Z / U C Z = λ T N C Z T U C Z Δ z
φ s o l a r , U C Z = ( 1 a ) I θ ( 1 h ( z = h U C Z ) )
Therefore, the heat balance of the upper zone can be written as follows:
ρ r f C p h U C Z T U C Z τ = φ s o l a r , U C Z + φ N C Z / U C Z φ t t φ l o s s
  • In the insulating zone (NCZ), the thermal energy losses by conduction via the vertical walls (φloss) are calculated by Equation (18). In addition, this zone is subdivided into sub-zones of a thickness Δz. Therefore, the heat transfer by conduction is conducted between a sub-zone j and the sub-zone above j−1 (φNCZ j/j−1) and the same between the sub-zone j and the sub-zone below j+1 (φNCZ j+1/j), as expressed Equations (25) and (26), respectively. Moreover, the quantity of thermal energy absorbed by each sub-zone (φsolar,NCZ j) is calculated by Formula (27), in which h(z) is obtained from Equation (2).
φ N C Z j / j 1 = λ T j T j 1 Δ z
φ N C Z j + 1 / j = λ T j + 1 T j Δ z
φ s o l a r , N C Z j = ( 1 a ) I θ ( h ( z = h U C Z + ( j 1 ) Δ z ) h ( z = h U C Z + j Δ z ) )
Therefore, the heat balance of the insulating zone can be written as follows:
ρ r f C p Δ z T N C Z j τ = φ s o l a r , N C Z j φ N C Z j / j 1 + φ N C Z j + 1 / j φ l o s s
  • In the storage zone (LCZ), the thermal energy losses by conduction via bottom and vertical walls (φloss) are calculated by Equation (18). Moreover, the conduction heat transfer is conducted via the upper part of this zone and the lower part of the non-convective zone (φLCZ/NCZ), as expressed in Equation (29). In addition, the quantity of thermal energy absorbed by the LCZ (φsolar,LCZ) is expressed by formula (30) in which h(z) is obtained from Equation (2).
φ L C Z / N C Z = λ T L C Z T N C Z Δ z
φ s o l a r , L C Z = ( 1 a ) I θ h ( z = h U C Z + h N C Z )
Therefore, the heat balance of the storage zone can be written as follows:
ρ r f C p h L C Z T L C Z τ = φ s o l a r , L C Z φ L C Z / N C Z φ l o s s

3.4.2. Numerical Method

In order to solve the above governing Equations, the implicit finite difference method is used. The system of algebraic Equations obtained is solved using the Gauss method. Then, a numerical code is written in Fortran programming language.

3.5. Second Numerical Model: Double-Diffusive Convection Is Considered

3.5.1. Mathematical Model

The second model developed in this study is based on Navier-Stokes, heat, and mass transfer equations in which the development of double-diffusive convection in both UCZ and LCZ is considered. Before writing the mathematical model, the following assumptions, which do not modify the mechanism work of the SGSP, are adopted:
  • The mixture of water and salt is incompressible and Newtonian fluid;
  • The heat and mass transfer are bi-dimensional;
  • The flow in the two convective zones is laminar;
  • The temperature at the external face of the pond’s vertical walls is the same as the ambient air;
  • The Boussinesq approximation is adopted;
  • The thermo-physical properties of the saltwater are independent on the temperature and salt concentration variation (calculated using Equations (19)–(21).
Thus, continuity, momentum, heat, and mass transfer Equations can be expressed in the Cartesian referential (Oxz) as follows:
M ( u x + v z ) = 0
M ( u τ + u u x + v u z ) = M ( 1 ρ r e f P x + ν ( 2 u x 2 + 2 u z 2 ) )
M ( v τ + u v x + v v z ) = M ( 1 ρ r e f P y + ν ( 2 v x 2 + 2 v z 2 ) + [ β T ( T T r e f ) + β C ( C C r e f ) ] g )
T τ + M ( u T x + v T z ) = λ ρ r f C P ( 2 T x 2 + 2 T z 2 ) + S ρ r f C P
C τ + M ( u C x + v C z ) = D ( 2 C x 2 + 2 C z 2 )
where u and v represent the velocity components along the x and z directions, respectively; T P and C indicate the temperature, the pressure, and the salt concentration, respectively; βT is the thermal expansion coefficient (βT = 3.84 × 10⁻⁴ °C−1 [53]) and βC is the solutal expansion coefficient (βC = 6.62 × 10⁻⁴ m3/kg [53]); D is the mass diffusion coefficient (D = 2.73 × 10⁻⁹ m2/s [53]), and ν is the kinetic viscosity ( ν = 8 × 10⁻⁷ m2/s [53]). Furthermore, M is a coefficient equal to 1 for the two convective zones and equal to 0 for the non-convective zone.
The heat source term of Equation (35) represents the quantity of thermal energy absorbed by a given saltwater layer situated between z and z + Δz as expressed in Equation (37).
S = d φ z d z
where φz is calculated using Equation (1).

3.5.2. Initial and Boundary Conditions

As the initial condition (τ = 0 s), the saltwater is supposed to be in rest condition (u = v = 0 m/s). The LCZ temperature and salt concentration are homogeneous and equal to around 32 °C and 260 kg/m3, respectively. The UCZ is formed by freshwater at a temperature of about 21 °C. In the NCZ, both the temperature and salt concentration decrease linearly from the NCZ-LCZ interface to the NCZUCZ interface.
As boundary conditions, non-slip conditions are imposed on the bottom and vertical walls. These last ones are impermeable. In addition, the heat losses occur via vertical bottom walls as well as the upper part of the pond. The boundary conditions are given in Table 2.

3.5.3. Numerical Method

In order to discretize the governing equations, the implicit finite volume method (developed by Patankar [54]) is applied. The coupled velocity-pressure is solved by Semi-Implicit Method for Pressure-Linked Equations (SIMPLE algorithm). The center scheme is used to approximate the convective and diffusive terms in the flow equations. The system of algebraic equations is solved using the Gauss method. In the findings, the acceleration of the numerical model developed in Fortran is improved by employing under-relaxation factors. These last ones are equal to 0.5 for the momentum equation and 0.8 for heat and mass transfer equations [54]. It should be noted that the calculation is iterative and is stopped once the following convergence criterion is satisfied.
| Φ t + Δ t Φ t Φ t + Δ t | 10 8 where Φ = ( u , v , T , C )

4. Results and Discussion

Results are analyzed as a vertical gradient of the SGSP temperature, the average temperature in the two convective zones, and energy stored in the SGSP during 82 h (from 1 February 2022 at 8:21 a.m. to 4 February 2022 at 6:21 p.m.), as well as the calculation time. Both numerical results are compared to those obtained experimentally. It should be noted that the laboratory conditions illustrated in Figure 4 and Figure 5 are the input of both numerical models developed. In addition, the calculations using the second model are conducted based on a mesh grid of 39 × 29. This last one remains sufficient to ensure a mesh grid and independent results. Moreover, in all plots presented below, “Without_cnv” indicates the first model in which the double-diffusive convection in the SGSP is neglected, and “With_cnv” indicates the second model in which the double-diffusive convection in the SGSP is considered.

4.1. Vertical Variation of the Salt-Water Temperature

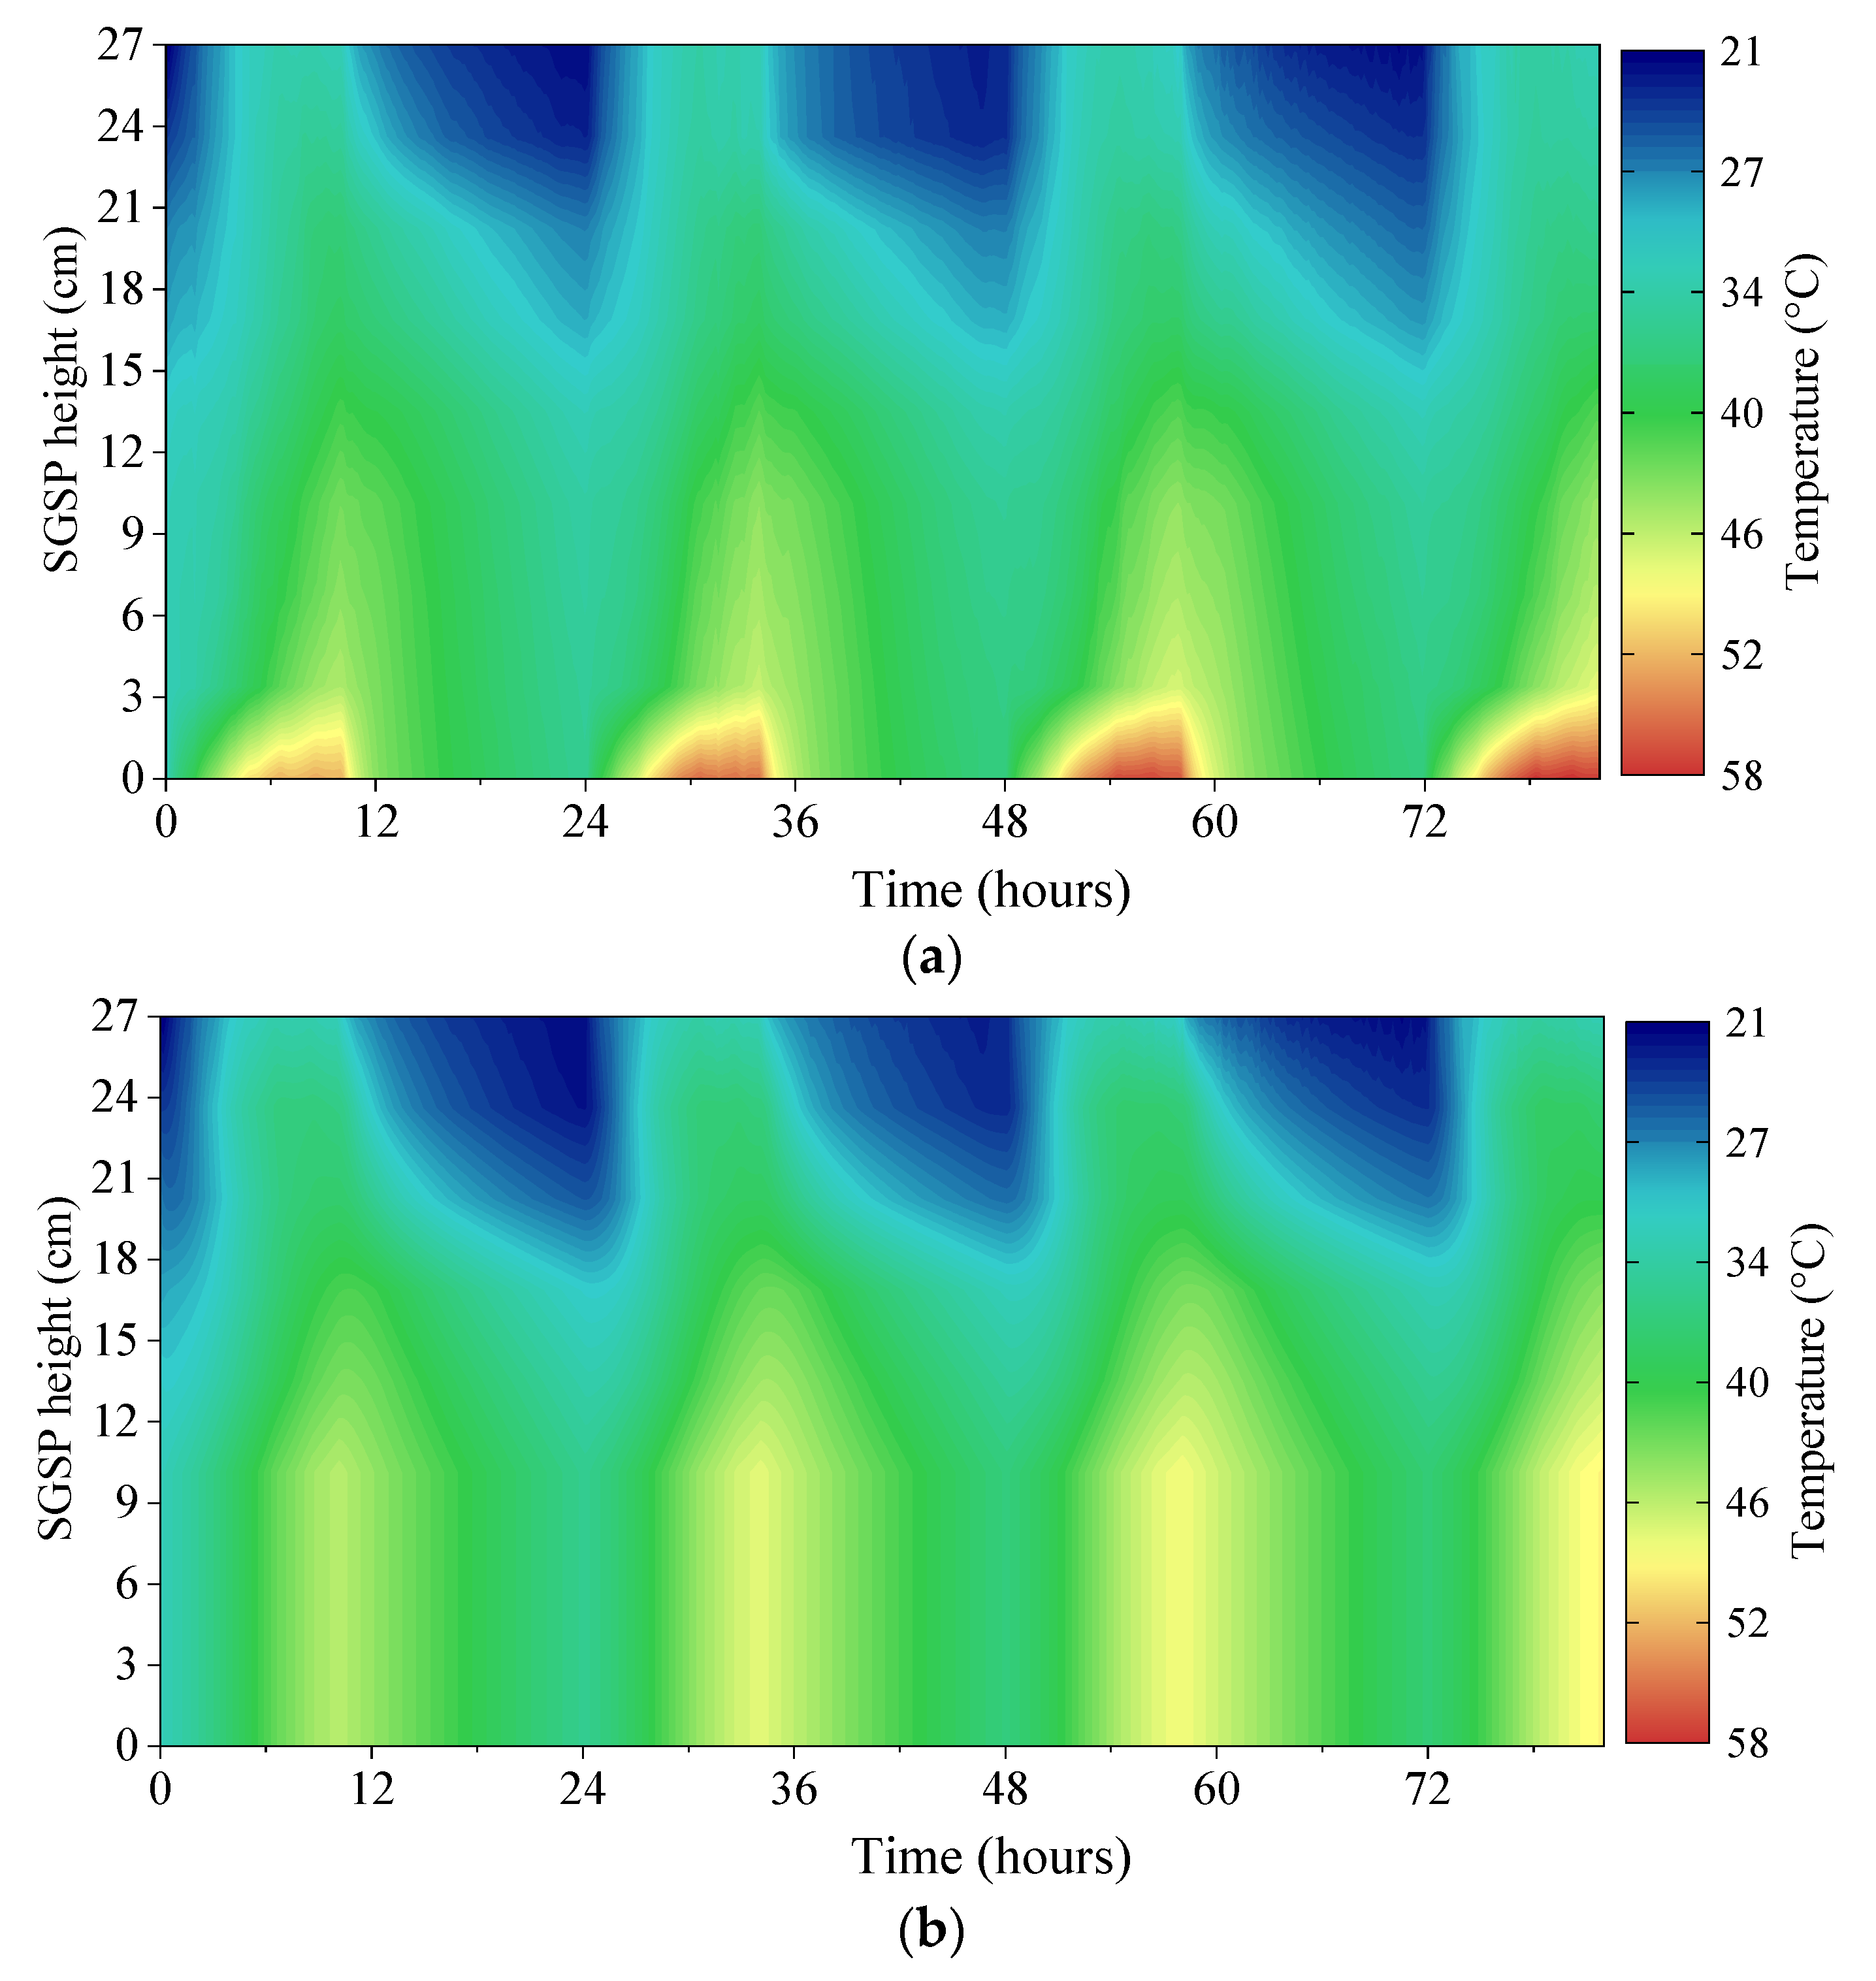
Figure 7 illustrates the vertical variation of the saltwater temperature during the 82 h, obtained experimentally (Figure 7a) and numerically by the first model (Figure 7b) and the second model (Figure 7c). It appears that the temperature varies between 21 °C and 56 °C. Both numerical model results show a good match with the experimental ones, except for the first centimeters at the bottom of the pond. This is due to the influence of the black bottom, which results in higher temperatures for the experimental compared to both numerical results. As regards the comparison between the results obtained by the first and the second models, the latter shows a vertical gradient of temperature in the LCZ, while in the first model, the temperature of the same zone is almost homogeneous. This is clearly visible in Figure 7b,c, and the difference is due to the effects of the double-diffusive convection, which tends to return higher temperatures at the bottom and lower in the nearby NCZ.
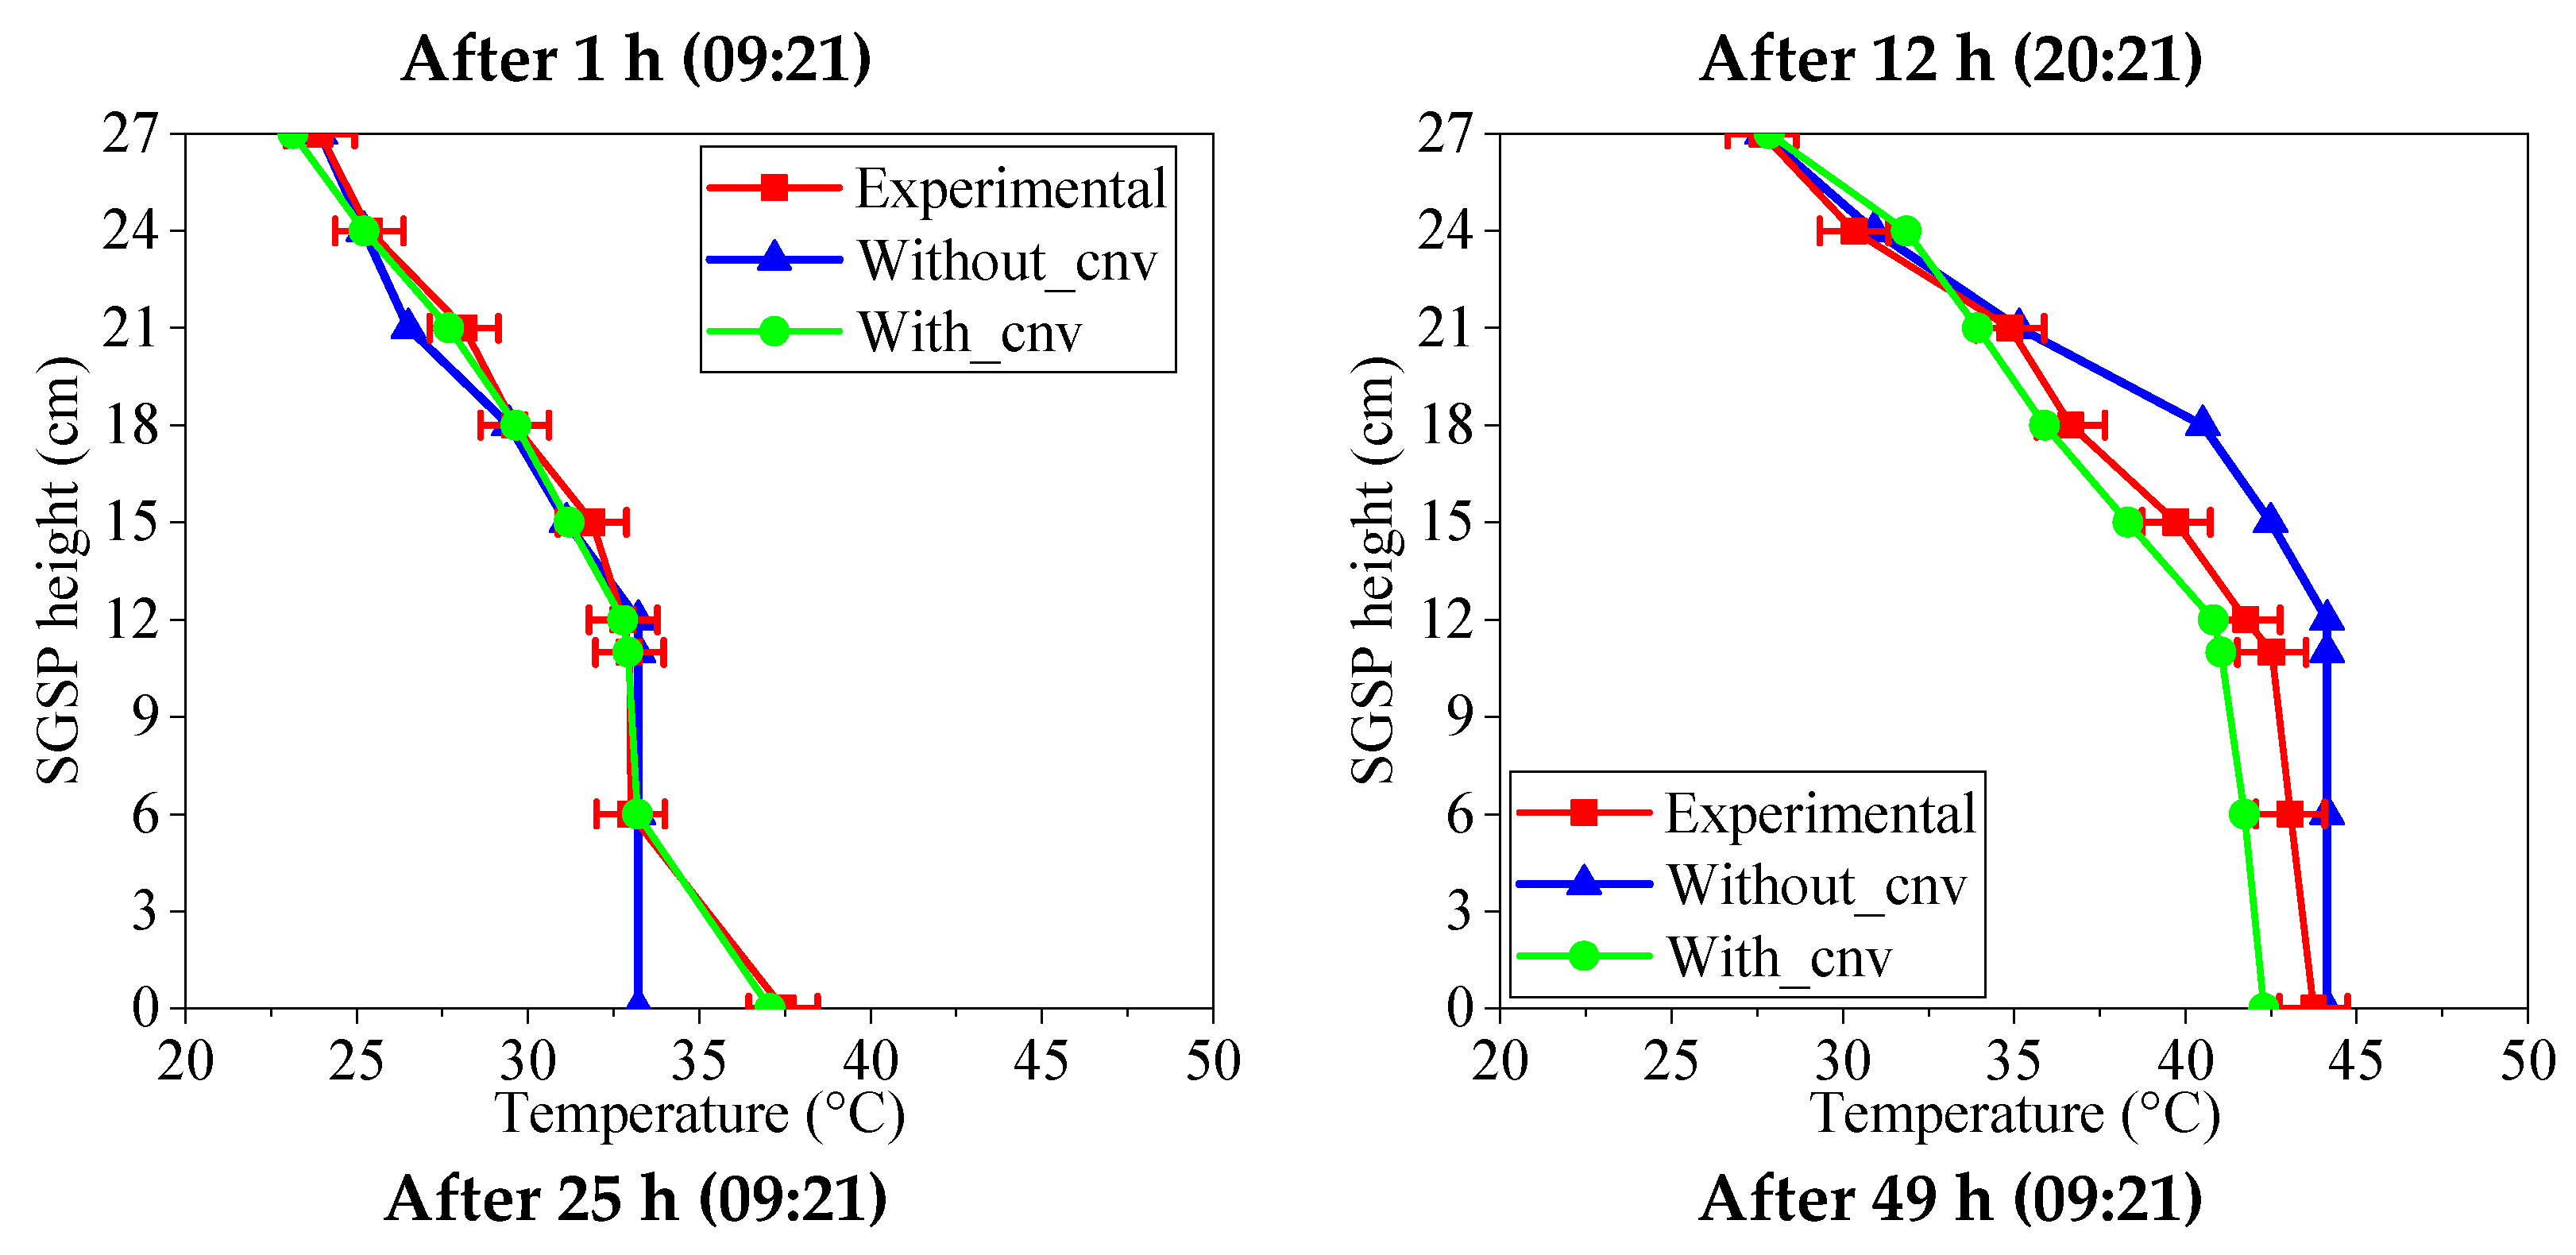
For further clarification, the vertical variation of the SGSP temperature, for experimental and numerical results, at specific instants (after 1 h, 12 h, 25 h, 49 h, 73 h, and 82 h) are depicted in Figure 8. As mentioned above, the initial temperature considered varies vertically (equal to 21 °C in the UCZ, 32 °C in the LCZ, and varies linearly in the NCZ). As a result, a vertical variation of the temperature is obtained after 1 h with an increase of about 1 °C in the LCZ and about 2 °C in the UCZ, compared to the initial state. This temperature increases during time, whatever the case considered, to reach values of about 32 °C in the UCZ and 57 °C experimentally, 49 °C based on the first model, and 47 °C based on the second model in the LCZ. In addition, the LCZ temperature obtained using the numerical model without the double-diffusive convection is nearly homogeneous, unlike those obtained experimentally and by the second model. This result can be justified by the fact that only conduction heat transfer is considered in the second model, which does not represent reality (based on experimental results). Moreover, it can be seen from Figure 8 that the experimental and second numerical SGSP bottom temperatures are both higher. These temperature differences in the LCZ (about 10 °C) are mainly due to the blackened bottom of the pond, which is characterized by a high absorption coefficient.

4.2. Temporal Variation of the Average UCZ and LCZ Temperatures

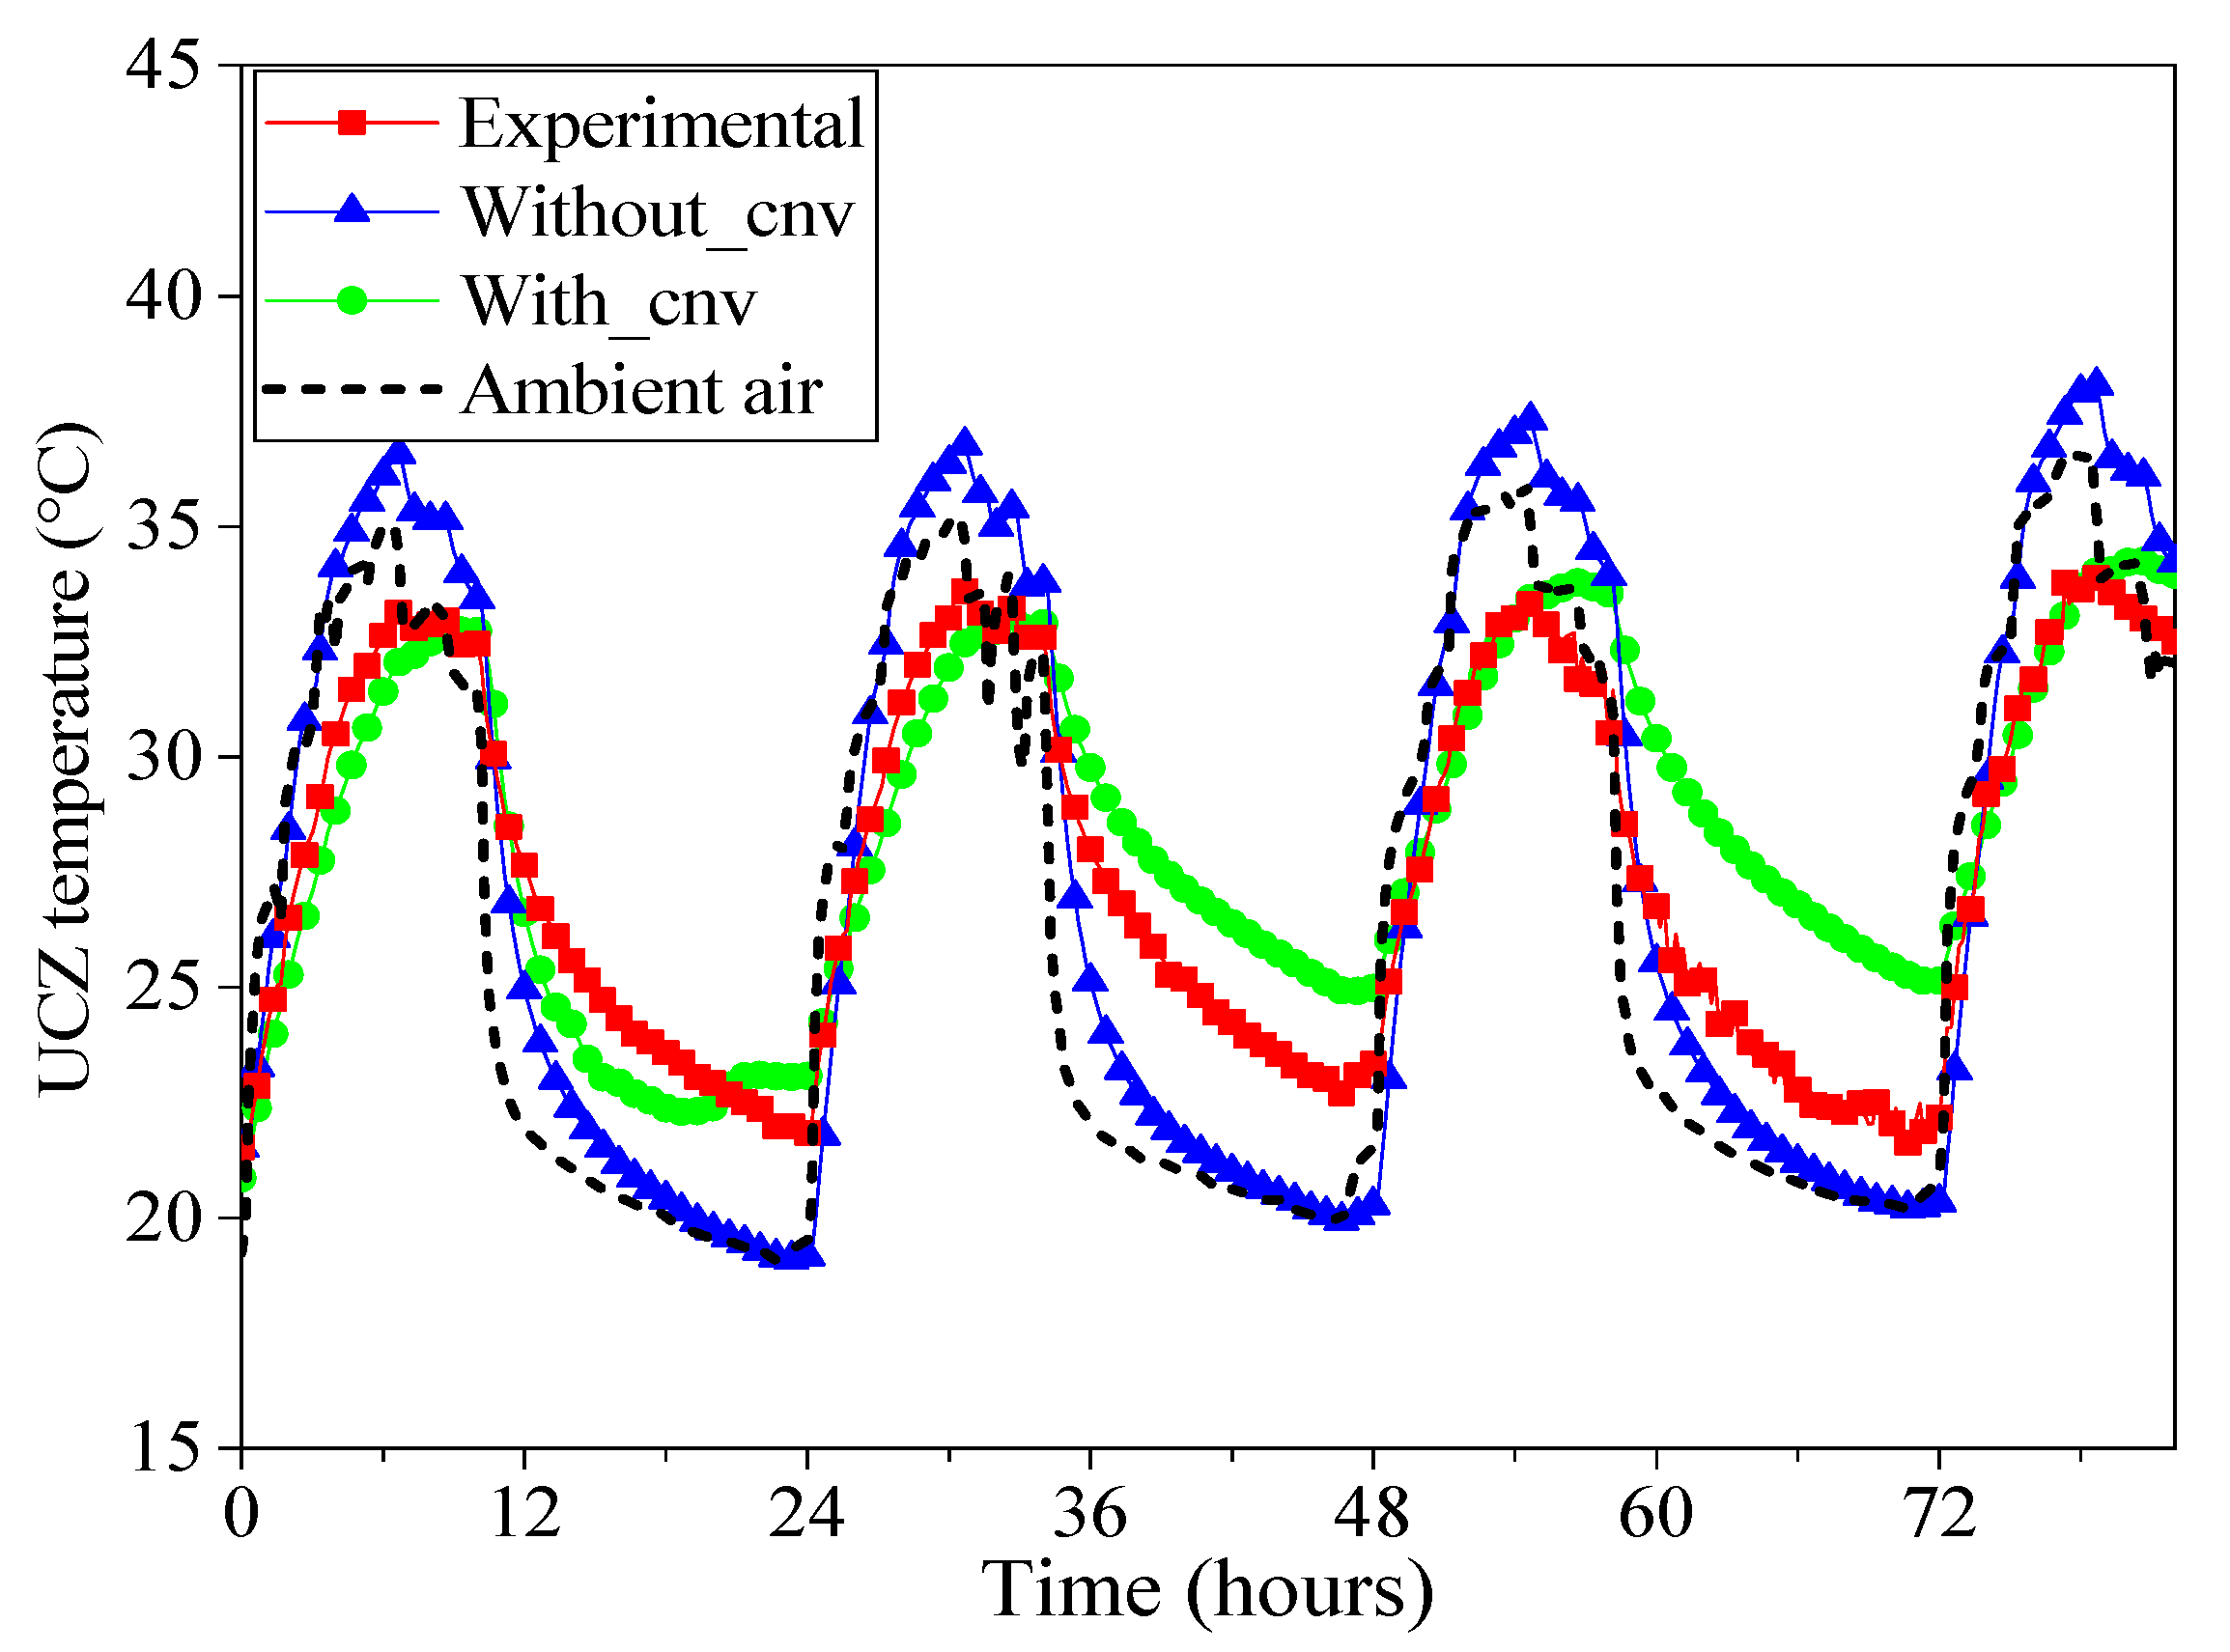
The temporal variation of the average UCZ temperature, as well as that of the ambient air, is shown in Figure 9. It is clear that the variation of the UCZ temperature is sinusoidal according to that of the ambient air. This is due to heat transfer between the upper convective zone and the ambient air. Furthermore, the numerical results obtained by the model considering the double-diffusive convection (With_cnv) show the best agreement with those obtained experimentally, as the day peaks of temperature are almost the same (the maximum difference between numerical and experimental is about 1.69 °C recorded at τ = 4 h). In comparison, at night, the numerical temperature returns higher (the maximum difference between numerical and experimental is about 4.2 °C registered at τ = 66 h). This difference can be justified by the fact that the experimental temperature represents the ambient interface air and the upper part of the UCZ since the thermocouple was placed at z = 0.27 m. On the contrary, the temperature obtained by the first model without double-diffusive convection (Without_cnv) moves in a wider range, between 19 °C at night and around 37 °C at the day peak. In this case, the maximum differences, compared to experimental results, are 4.74 °C and 3.7 °C, obtained at τ= 77 h and τ = 38 h, respectively. Overall, for the 82 h analyzed, the relative error between numerical and experimental results is around 5.98% for the case in which the double-diffusive convection is considered, while it is about 9.39% for the case in which it is neglected.
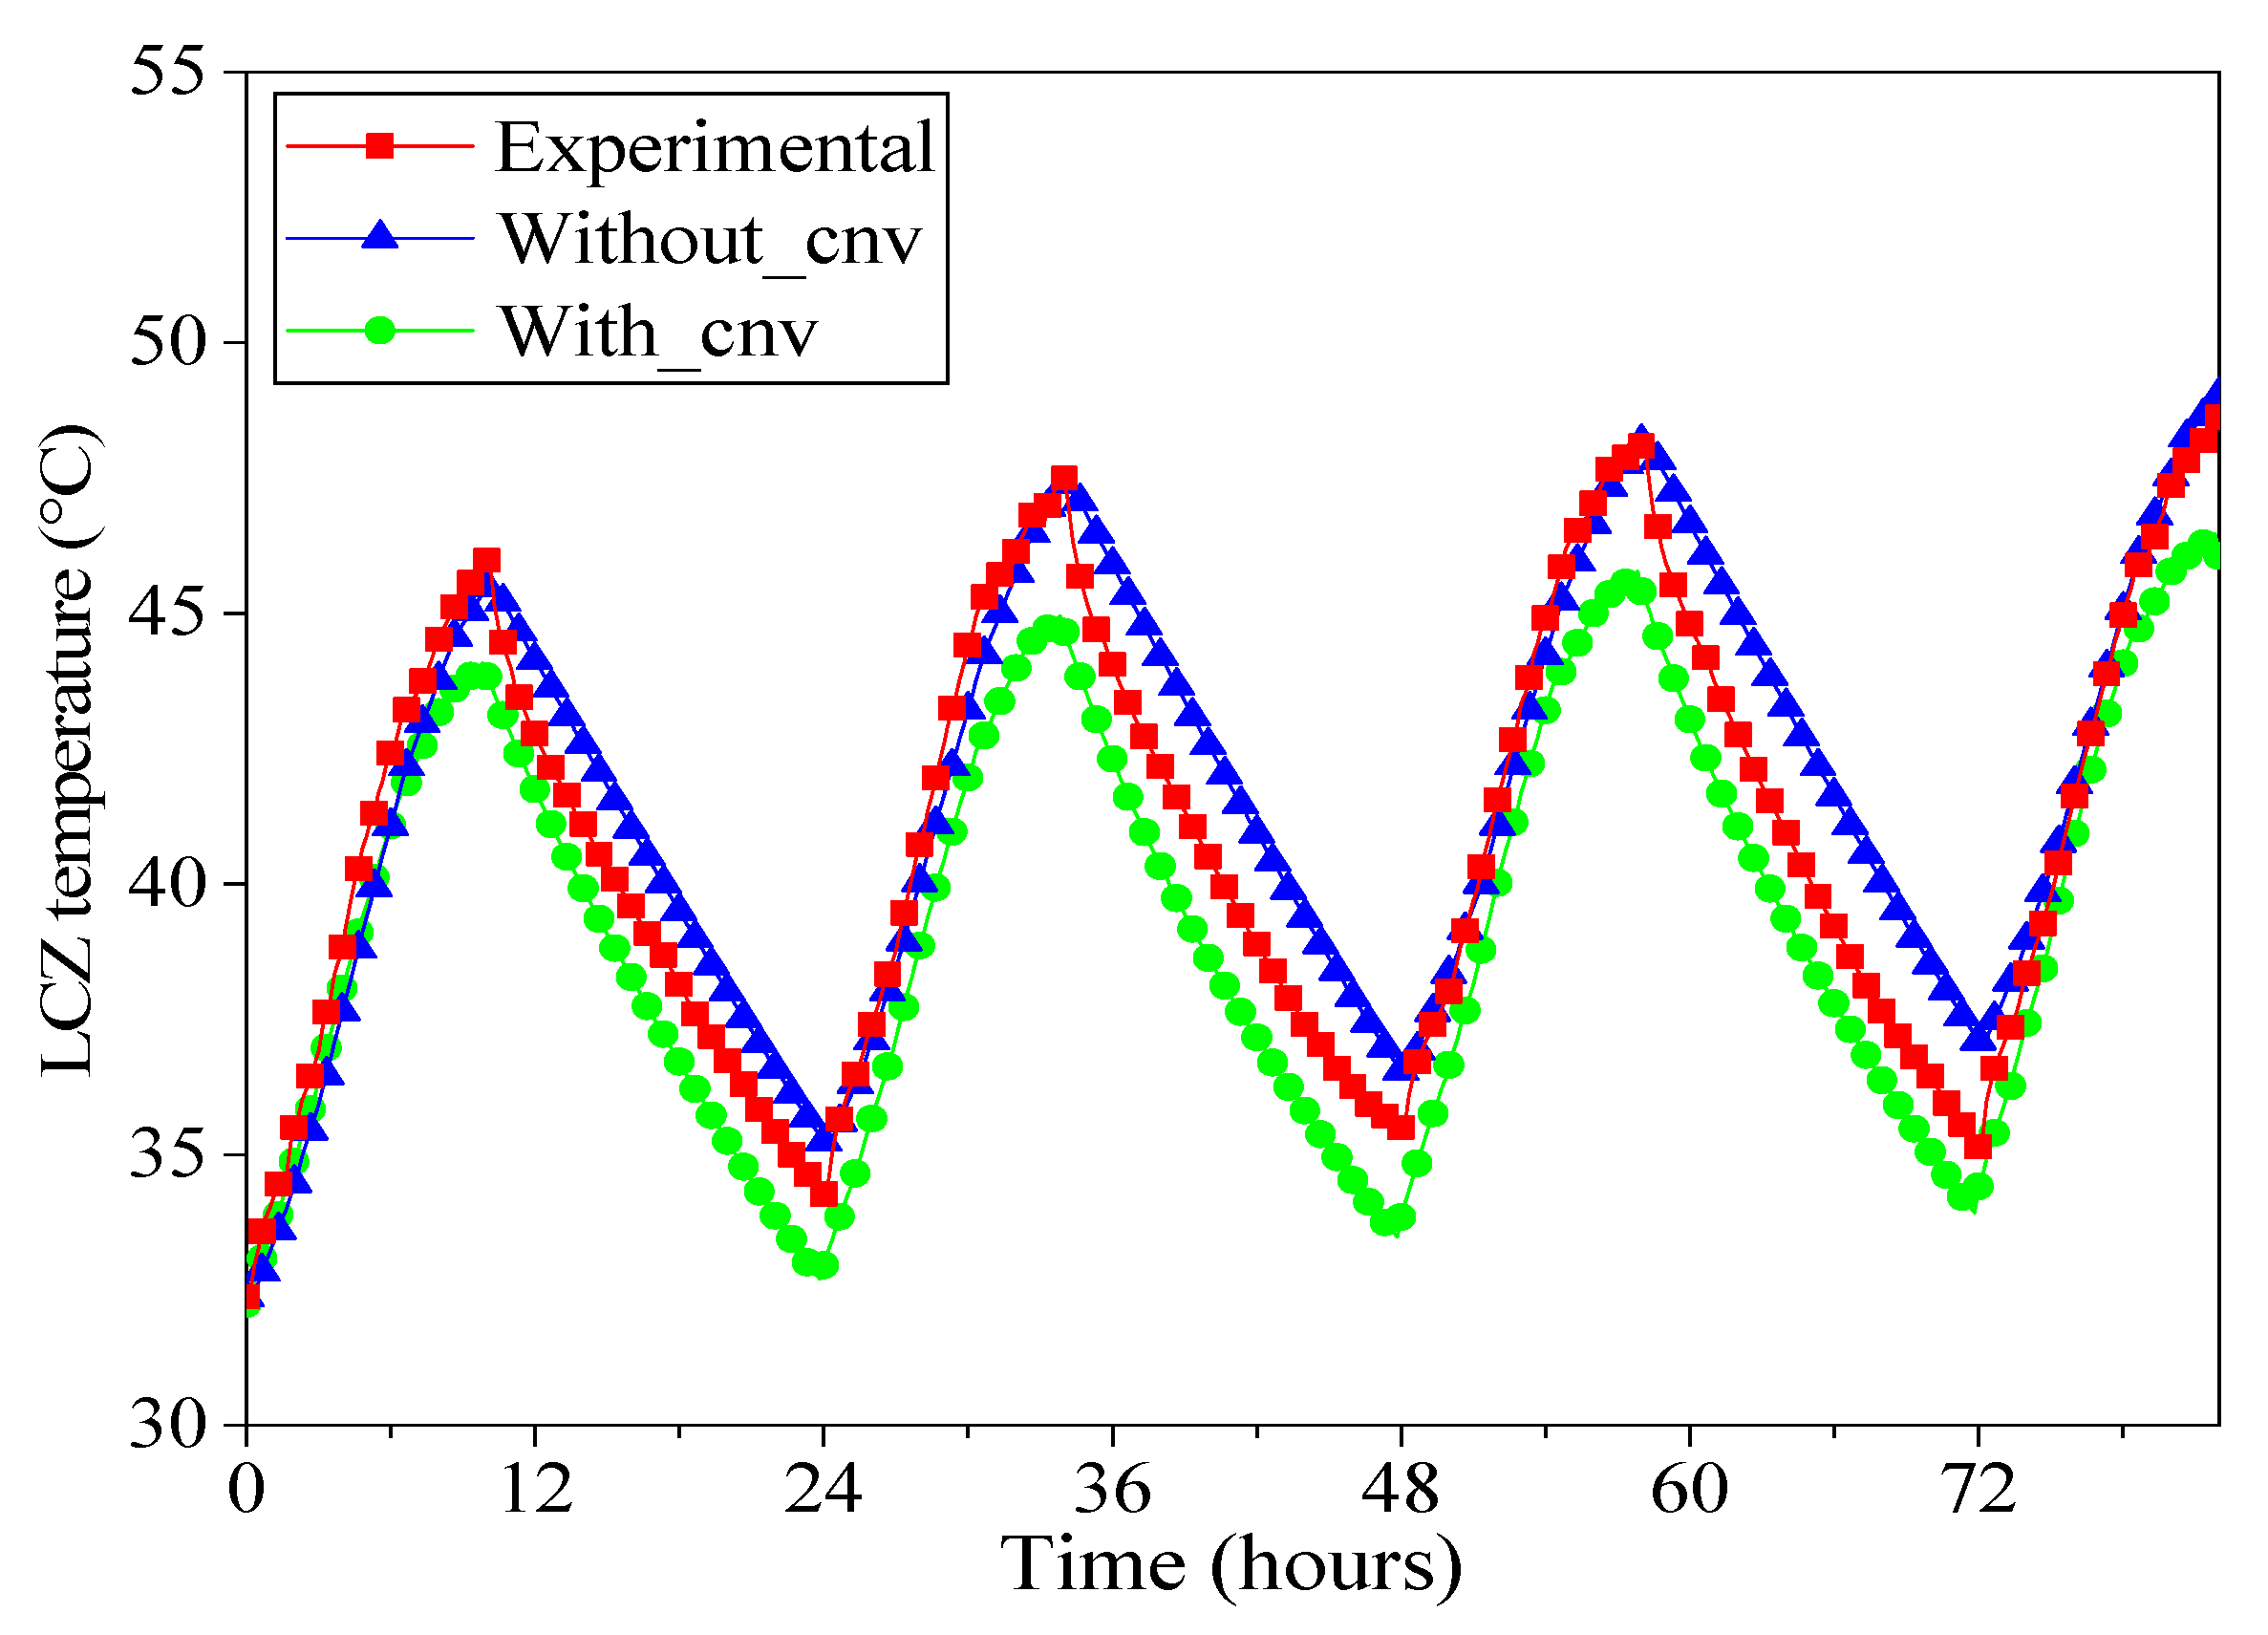
Figure 10 shows the temporal evolution of the average temperature in the LCZ. It appears that the LCZ temperature increases over time during the daytime period as the heat supplied by the solar radiation increases. Moreover, this temperature decreases during the night due to the absence of solar radiation. Furthermore, during the daytime, the numerical results obtained by the model without double-diffusive convection (Without_cnv) return the best agreement with the experimental ones. In fact, the slope of the increasing diurnal temperatures and the day peaks are almost the same. At night, instead, the experimental temperature is lower than the numerical one. Overall, the relative error is 2.92%. As regards the second numerical model (With_cnv), the relative error is 3.74%, even if this method shows a better match at night. The higher error is mainly due to the lower temperature peaks reached during the days; on average, 3 °C lower than experimental ones. Table 3 summarizes the results obtained.

4.3. Temporal Variation of Thermal Energy Stored in the SGSP

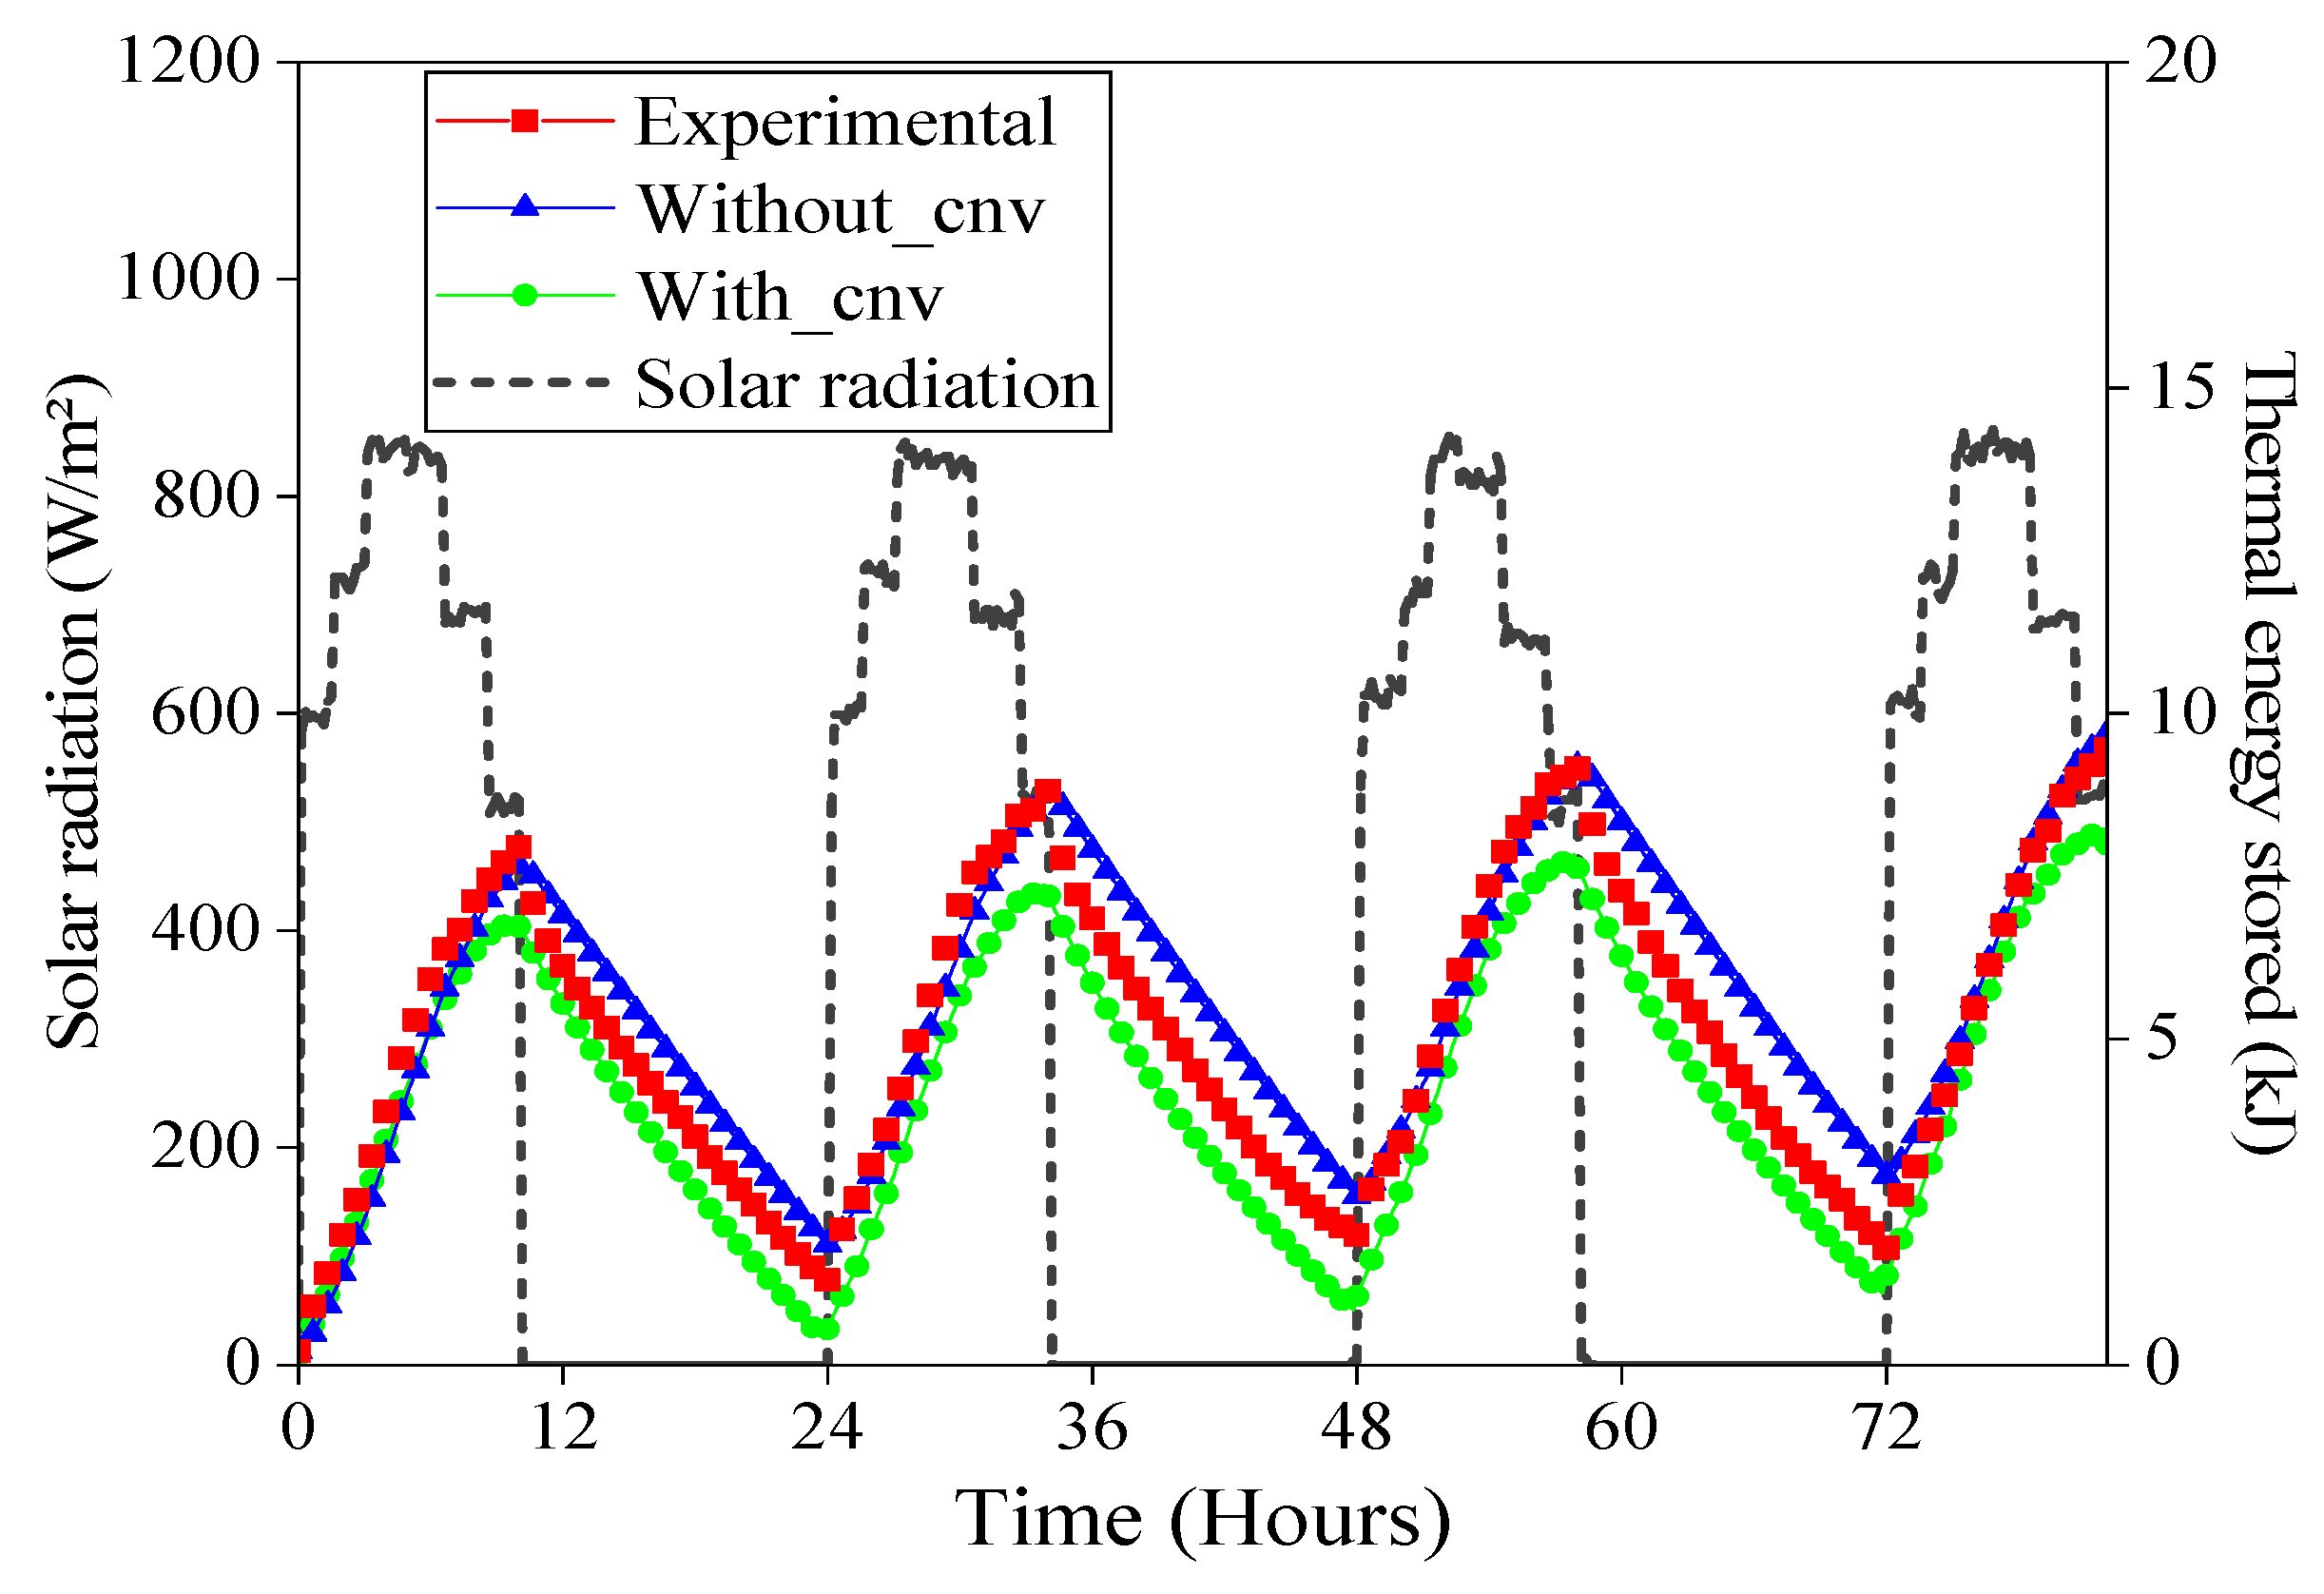
Figure 11 depicts the temporal variations of the thermal energy stored E (calculated by Expression (39)) and the artificial solar radiation during the 82 h. It appears that the thermal energy stored is directly proportional to the LCZ temperature because the SGSP is based on sensible heat storage. In that case, the quantity of energy stored increases in the presence of solar radiation while decreasing at night. Accordingly, the results obtained by the first numerical model (Without_cnv) show the best agreement with experimental data during the daytime, while at night, the numerical results tend to overestimate the energy stored. The model with double-diffusive convection (With_cnv) underestimates the quantity of energy stored, especially at night and at the day peak temperature. After 82 h, the first and the second numerical model return a quantity of energy stored in the LCZ, compared to experimental results, 4.3% higher and 15.4% lower, respectively.
E = ρ r f C P ( T T i ) d x d z

4.4. Temporal Variation of the Calculation Time

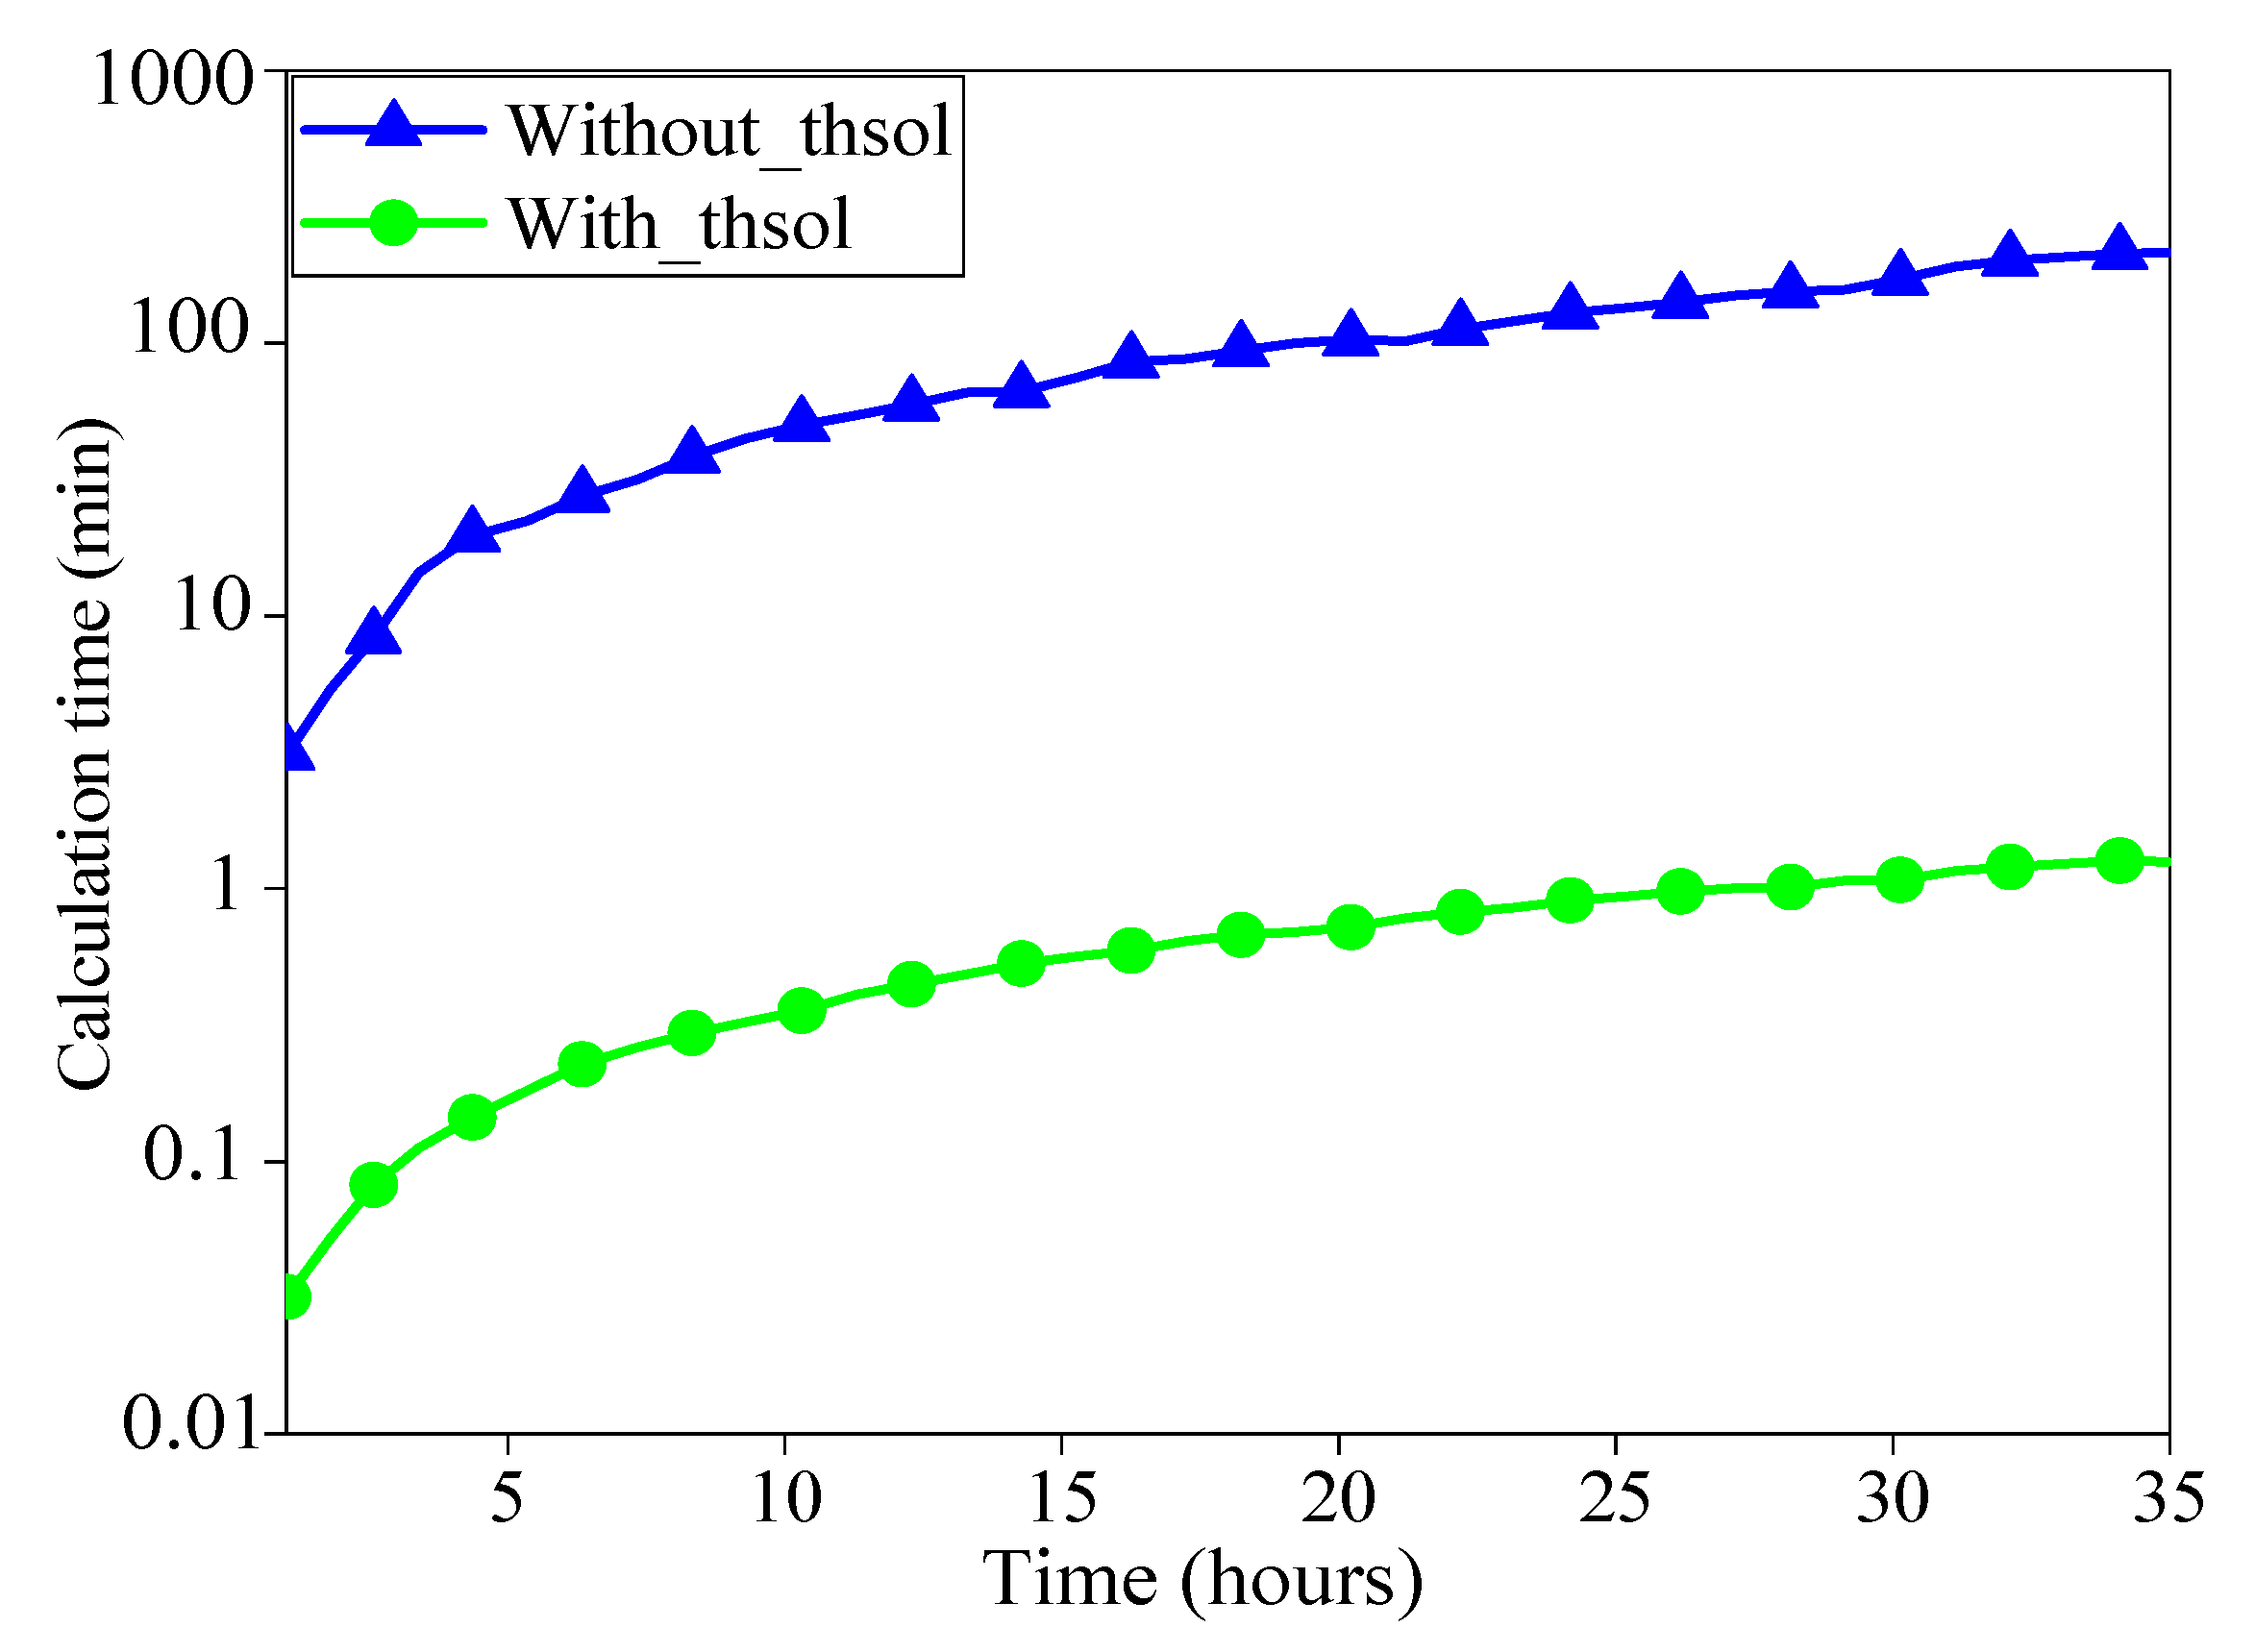
The temporal variation of the calculation time analysis is fundamental to evaluating the relation between accuracy, calculation time, and cost. It is well known that the latter aspect cannot be neglected as it is related to the energetic and environmental impact of numerical simulations. Figure 12 shows the temporal variation of the calculation time. The difference between the two proposed models is clearly visible. The first model (Without_cnv) requires about 1.26 min of an analysis of 35 h, while around 207 min are required for the second model (With_cnv). The difference exponentially grows over time due to the greater complexity of modeling the convective effects. Accordingly, the second model can be preferred in short-term simulations and when a higher accuracy is required to investigate the temperature of a specific point over time. The first model, on the contrary, can be more suitable to evaluate the global performance of an SGSP over a longer period of time.

5. Conclusions

This paper presents experimental and numerical investigations of the effects of double-diffusive convection on calculation time and accuracy results in a Salt Gradient Solar Pond (SGSP). To this end, two numerical models are developed in the Fortran programing language. The first one is based on the heat balance of SGSP zones in which the development of the double-diffusive convection in both upper and storage zones is neglected. The second one considering the double-diffusive convection is based on Navier-Stokes, heat, and mass transfer equations. To compare numerical and experimental results, a laboratory-scale SGSP has been designed, built, and tested indoors under a solar simulator for 82 h. It consists of a parallelepiped box with a length of 0.60 m, a width of 0.8 m, and a height of 0.3 m. The use of a solar simulator allows for setting and maintaining constant in steps the solar radiation intensity throughout the test to simulate a typical sunny day under Italian climatic conditions. The main conclusions, based on numerical and experimental comparisons of the temperature and the thermal energy stored, are listed below:
  • Both numerical models can predict with a good grade of accuracy the thermal behavior of an SGSP (the maximum relative error is less than 10%);
  • Due to the absorption of solar radiation, the SGSP temperature varies between 21 °C and 56 °C during the 82 h;
  • In the upper zone (UCZ), the average relative error between experimental and numerical results is around 5.98% by using the second model (double-diffusive convection is considered) and increases to about 9.39% by using the first model (double-diffusive convection is neglected);
  • In the storage zone (LCZ), the average relative error is about 2.92% for the second model and around 3.74% for the first model;
  • The negligence of the double-diffusive convection in the SGSP modeling tends to overestimate the thermal energy stored in the storage zone by about 4.3% after 82 h;
  • The calculation time analysis shows that the difference between the two models increases exponentially with the duration of the analysis. The model with double-diffusive convection returns a calculation time hundreds of times larger (207 min while 1 min for the simpler model, after 35 h of analysis);
  • The double-diffusive convection developed in the SGSP should be considered in the SGSP modeling (using the second model) in order to avoid overestimation of the numerical results. However, the time calculation required represents the major inconvenience of using such a model.
As a future direction, comparing numerical results (obtained by the two models developed) and experimental results (obtained under real meteorological conditions) for a long time will be investigated.

Author Contributions

Y.R.: Conceptualization, methodology, software, writing-original draft. D.C.: Conceptualization, validation, Writing-review and editing, P.P.: Wring-review and editing, visualization, supervision. All authors have read and agreed to the published version of the manuscript.

Funding

This research received no external funding.

Acknowledgments

The authors thank the National Center for Scientific and Technical Research of Morocco (CNRST) for supporting this work through access to the HPC-MARWAN calculation service.

Conflicts of Interest

The authors declare no conflict of interest.

References

  1. Brahim, A.N.; Rghif, Y.; Bahraoui, F. Numerical investigation of solar energy storage by a salt gradient solar pond in several Moroccan cities. E3S Web Conf. 2022, 336, 00020. [Google Scholar] [CrossRef]
  2. El-Sebaii, A.A.; Ramadan, M.R.I.; Aboul-Enein, S.; Khallaf, A.M. History of the solar ponds: A review study. Renew. Sustain. Energy Rev. 2011, 15, 3319–3325. [Google Scholar] [CrossRef]
  3. Ranjan, K.R.; Kaushik, S.C. Thermodynamic and economic feasibility of solar ponds for various thermal applications: A comprehensive review. Renew. Sustain. Energy Rev. 2014, 32, 123–139. [Google Scholar] [CrossRef]
  4. Velmurugan, V.; Srithar, K. Prospects and scopes of solar pond: A detailed review. Renew. Sustain. Energy Rev. 2008, 12, 2253–2263. [Google Scholar] [CrossRef]
  5. Rghif, Y.; Zeghmati, B.; Bahraoui, F. Soret and Dufour effects on thermal storage and storage efficiency of a salt gradient solar pond. IEEE Xplore 2020, 5, 1–6. [Google Scholar] [CrossRef]
  6. Nielsen, C.E. Salinity-Gradient Solar Ponds BT—Advances in Solar Energy: An Annual Review of Research and Development; Böer, K.W., Ed.; Springer: Boston, MA, USA, 1988; pp. 445–498. [Google Scholar]
  7. Szacsvay, T.; Hofer-Noser, P.; Posnansky, M. Technical and economic aspects of small-scale solar-pond-powered seawater desalination systems. Desalination 1999, 122, 185–193. [Google Scholar] [CrossRef]
  8. Nakoa, K.; Rahaoui, K.; Date, A.; Akbarzadeh, A. An experimental review on coupling of solar pond with membrane distillation. Sol. Energy 2015, 119, 319–331. [Google Scholar] [CrossRef]
  9. Suárez, F.; Ruskowitz, J.A.; Tyler, S.W.; Childress, A.E. Renewable water: Direct contact membrane distillation coupled with solar ponds. Appl. Energy 2015, 158, 532–539. [Google Scholar] [CrossRef] [Green Version]
  10. Manzoor, K.; Khan, S.J.; Jamal, Y.; Shahzad, M.A. Heat extraction and brine management from salinity gradient solar pond and membrane distillation. Chem. Eng. Res. Des. 2017, 118, 226–237. [Google Scholar] [CrossRef]
  11. Akbarzadeh, A.; Johnson, P.; Singh, R. Examining potential benefits of combining a chimney with a salinity gradient solar pond for production of power in salt affected areas. Sol. Energy 2009, 83, 1345–1359. [Google Scholar] [CrossRef]
  12. Tundee, S.; Srihajong, N.; Charmongkolpradit, S. Electric power generation from solar pond using combination of thermosyphon and thermoelectric modules. Energy Procedia 2014, 48, 453–463. [Google Scholar] [CrossRef] [Green Version]
  13. Ziapour, B.M.; Saadat, M.; Palideh, V.; Afzal, S. Power generation enhancement in a salinity-gradient solar pond power plant using thermoelectric generator. Energy Convers. Manag. 2017, 136, 283–293. [Google Scholar] [CrossRef]
  14. Ding, L.C.; Akbarzadeh, A.; Tan, L. A review of power generation with thermoelectric system and its alternative with solar ponds. Renew. Sustain. Energy Rev. 2018, 81, 799–812. [Google Scholar] [CrossRef]
  15. Rghif, Y.; Zeghmati, B.; Bahraoui, F. Modeling of a salt gradient solar pond under Moroccan climate taking into account double-diffusive convection. Mater. Today Proc. 2020, 30, 883–888. [Google Scholar] [CrossRef]
  16. Leblanc, J.; Akbarzadeh, A.; Andrews, J.; Lu, H.; Golding, P. Heat extraction methods from salinity-gradient solar ponds and introduction of a novel system of heat extraction for improved efficiency. Sol. Energy 2011, 85, 3103–3142. [Google Scholar] [CrossRef]
  17. Chiba, Y. Etude de L’utilisation d’un Bassin D’eau Comme Capteur Solaire. Tunisia. 2005. Available online: https://www.scribd.com/document/495150738/etude-de-l-utilisation-d-n-bassin-d-eau-comme-capteur-solaire (accessed on 13 December 2022).
  18. Anderson, G.C. Some Limnological Features of a Shallow Saline Meromictic Lake. Limnol. Oceanogr. 1958, 3, 259–270. [Google Scholar] [CrossRef]
  19. Melack, J.M.; Kilham, P. Lake Mahega: A meso- trophic, sulphato-chloride lake in western Uganda. African J. Trop. Hydrobiol. Fish. 1972. Available online: http://library1.nida.ac.th/termpaper6/sd/2554/19755.pdf (accessed on 27 April 2022).
  20. Wilson, A.T.; Wellman, H.W. Lake Vanda: An antarctic lake. Nature 1962, 196, 1048–1050. [Google Scholar] [CrossRef]
  21. Kaushika, N.D. Solar ponds: A review. Energy Convers. Manag. 1984, 24, 353–376. [Google Scholar] [CrossRef]
  22. Hull, J.R. Physics of the solar pond. Solar Energy 1979, 8, 45–56. [Google Scholar]
  23. Assari, M.R.; Tabrizi, H.B.; Nejad, A.K.; Parvar, M. Experimental investigation of heat absorption of different solar pond shapes covered with glazing plastic. Sol. Energy 2015, 122, 569–578. [Google Scholar] [CrossRef]
  24. Berkani, M.; Sissaoui, H.; Abdelli, A.; Kermiche, M.; Barker-Read, G. Comparison of three solar ponds with different salts through bi-dimensional modeling. Sol. Energy 2015, 116, 56–68. [Google Scholar] [CrossRef]
  25. Assari, M.R.; Tabrizi, H.B.; Parvar, M.; Nejad, A.K.; Beik, A.J.G. Experiment and optimization of mixed medium effect on small-scale salt gradient solar pond. Sol. Energy 2017, 151, 102–109. [Google Scholar] [CrossRef]
  26. Silva, C.; González, D.; Suárez, F. An experimental and numerical study of evaporation reduction in a salt-gradient solar pond using floating discs. Sol. Energy 2017, 142, 204–214. [Google Scholar] [CrossRef]
  27. Alcaraz, A.; Montalà, M.; Valderrama, C.; Cortina, J.L.; Akbarzadeh, A.; Farran, A. Increasing the storage capacity of a solar pond by using solar thermal collectors: Heat extraction and heat supply processes using in-pond heat exchangers. Sol. Energy 2018, 171, 112–121. [Google Scholar] [CrossRef] [Green Version]
  28. Assari, M.R.; Tabrizi, H.B.; Beik, A.J.G. Experimental studies on the effect of using phase change material in salinity-gradient solar pond. Sol. Energy 2015, 122, 204–214. [Google Scholar] [CrossRef]
  29. Ines, M.; Paolo, P.; Roberto, F.; Mohamed, S. Experimental studies on the effect of using phase change material in a salinity-gradient solar pond under a solar simulator. Sol. Energy 2019, 186, 335–346. [Google Scholar] [CrossRef]
  30. Beik, J.A.G.; Assari, M.R.; Tabrizi, H.B. Transient modeling for the prediction of the temperature distribution with phase change material in a salt-gradient solar pond and comparison with experimental data. J. Energy Storage 2019, 26, 101011. [Google Scholar] [CrossRef]
  31. Colarossi, D.; Principi, P. Experimental investigation and optical visualization of a salt gradient solar pond integrated with PCM. Sol. Energy Mater. Sol. Cells 2022, 234, 111425. [Google Scholar] [CrossRef]
  32. Colarossi, D.; Pezzuto, M.; Principi, P. Effect of PCM melting temperature on solar ponds performance: Design and experimental investigation. Sol. Energy 2022, 242, 225–233. [Google Scholar] [CrossRef]
  33. Kurt, H.; Halici, F.; Binark, A.K. Solar pond conception—Experimental and theoretical studies. Energy Convers. Manag. 2000, 41, 939–951. [Google Scholar] [CrossRef]
  34. Mansour, R.B.; Nguyen, C.T.; Galanis, N. Numerical study of transient heat and mass transfer and stability in a salt-gradient solar pond. Int. J. Therm. Sci. 2004, 43, 779–790. [Google Scholar] [CrossRef]
  35. Date, A.; Yaakob, Y.; Date, A.; Krishnapillai, S. Heat extraction from Non-Convective and Lower Convective Zones of the solar pond : A transient study. Sol. Energy 2013, 97, 517–528. [Google Scholar] [CrossRef]
  36. Sayer, A.H.; Al-Hussaini, H.; Campbell, A.N. An analytical estimation of salt concentration in the upper and lower convective zones of a salinity gradient solar pond with either a pond with vertical walls or trapezoidal cross section. Sol. Energy 2017, 158, 207–217. [Google Scholar] [CrossRef]
  37. Amigo, J.; Meza, F.; Suárez, F. A transient model for temperature prediction in a salt-gradient solar pond and the ground beneath it. Energy 2017, 132, 257–268. [Google Scholar] [CrossRef]
  38. Khalilian, M. Experimental and numerical investigations of the thermal behavior of small solar ponds with wall shading effect. Sol. Energy 2018, 159, 55–65. [Google Scholar] [CrossRef]
  39. Suárez, F.; Tyler, S.W.; Childress, A.E. A fully coupled, transient double-diffusive convective model for salt-gradient solar ponds. Int. J. Heat Mass Transf. 2010, 53, 1718–1730. [Google Scholar] [CrossRef]
  40. Boudhiaf, R.; Baccar, M. Transient hydrodynamic, heat and mass transfer in a salinity gradient solar pond: A numerical study. Energy Convers. Manag. 2014, 79, 568–580. [Google Scholar] [CrossRef]
  41. Rghif, Y.; Zeghmati, B.; Bahraoui, F. Soret and Dufour effects on thermosolutal convection developed in a salt gradient solar pond. Int. J. Therm. Sci. 2021, 161, 106760. [Google Scholar] [CrossRef]
  42. Rghif, Y.; Zeghmati, B.; Bahraoui, F. Modeling the influences of a phase change material and the Dufour effect on thermal performance of a salt gradient solar pond. Int. J. Therm. Sci. 2021, 166, 106979. [Google Scholar] [CrossRef]
  43. Rghif, Y.; Zeghmati, B.; Bahraoui, F. Numerical Analysis of the Influence of Buoyancy Ratio and Dufour Parameter on Thermosolutal Convection in a Square Salt Gradient Solar Pond. Fluid Dyn. Mater. Process. 2022, 18, 1319–1329. [Google Scholar] [CrossRef]
  44. Rghif, Y.; Zeghmati, B.; Bahraoui, F. Numerical study of Soret and Dufour coefficients on heat and mass transfer in a salt gradient solar pond. AIP Conf. Proc. 2021, 2345, 020003. [Google Scholar] [CrossRef]
  45. Rghif, Y.; Bahraoui, F.; Zeghmati, B. Experimental and numerical investigations of heat and mass transfer in a salt gradient solar pond under a solar simulator. Sol. Energy 2022, 236, 841–859. [Google Scholar] [CrossRef]
  46. Colarossi, D.; Tagliolini, E.; Principi, P.; Fioretti, R. Design and validation of an adjustable large-scale solar simulator. Appl. Sci. 2021, 11, 1964. [Google Scholar] [CrossRef]
  47. Zangrando, F. A simple method to establish salt gradient solar ponds. Sol. Energy 1980, 25, 467–470. [Google Scholar] [CrossRef]
  48. Wang, Y.F.; Akbarzadeh, A. A Parametric Study on Solar Ponds. Sol. Energy 1983, 30, 555–562. [Google Scholar] [CrossRef]
  49. Bryantt, H.C.; Colbeck, I.A.N. A solar pond for London? Sol. Energy 1977, 19, 321–322. [Google Scholar] [CrossRef]
  50. Atkinson, J.F.; Harleman, D.R.F. A wind-mixed layer model for solar ponds. Sol. Energy 1983, 31, 243–259. [Google Scholar] [CrossRef]
  51. Garratt, J.R. The atmospheric boundary layer. Earth-Sci. Rev. 1994, 37, 89–134. [Google Scholar] [CrossRef]
  52. Jaefarzadeh, M.R. Thermal behavior of a small salinity-gradient solar pond with wall shading effect. Sol. Energy 2004, 77, 281–290. [Google Scholar] [CrossRef]
  53. El Mansouri, A.; Hasnaoui, M.; Amahmid, A.; Bennacer, R. Transient modeling of a salt gradient solar pond using a hybrid Finite-Volume and Cascaded Lattice-Boltzmann method: Thermal characteristics and stability analysis. Energy Convers. Manag. 2018, 158, 416–429. [Google Scholar] [CrossRef]
  54. Patankar, S.V. Numerical Heat Transfer and Fluid Flow; CRC Press: Boca Raton, FL, USA, 1980. [Google Scholar]
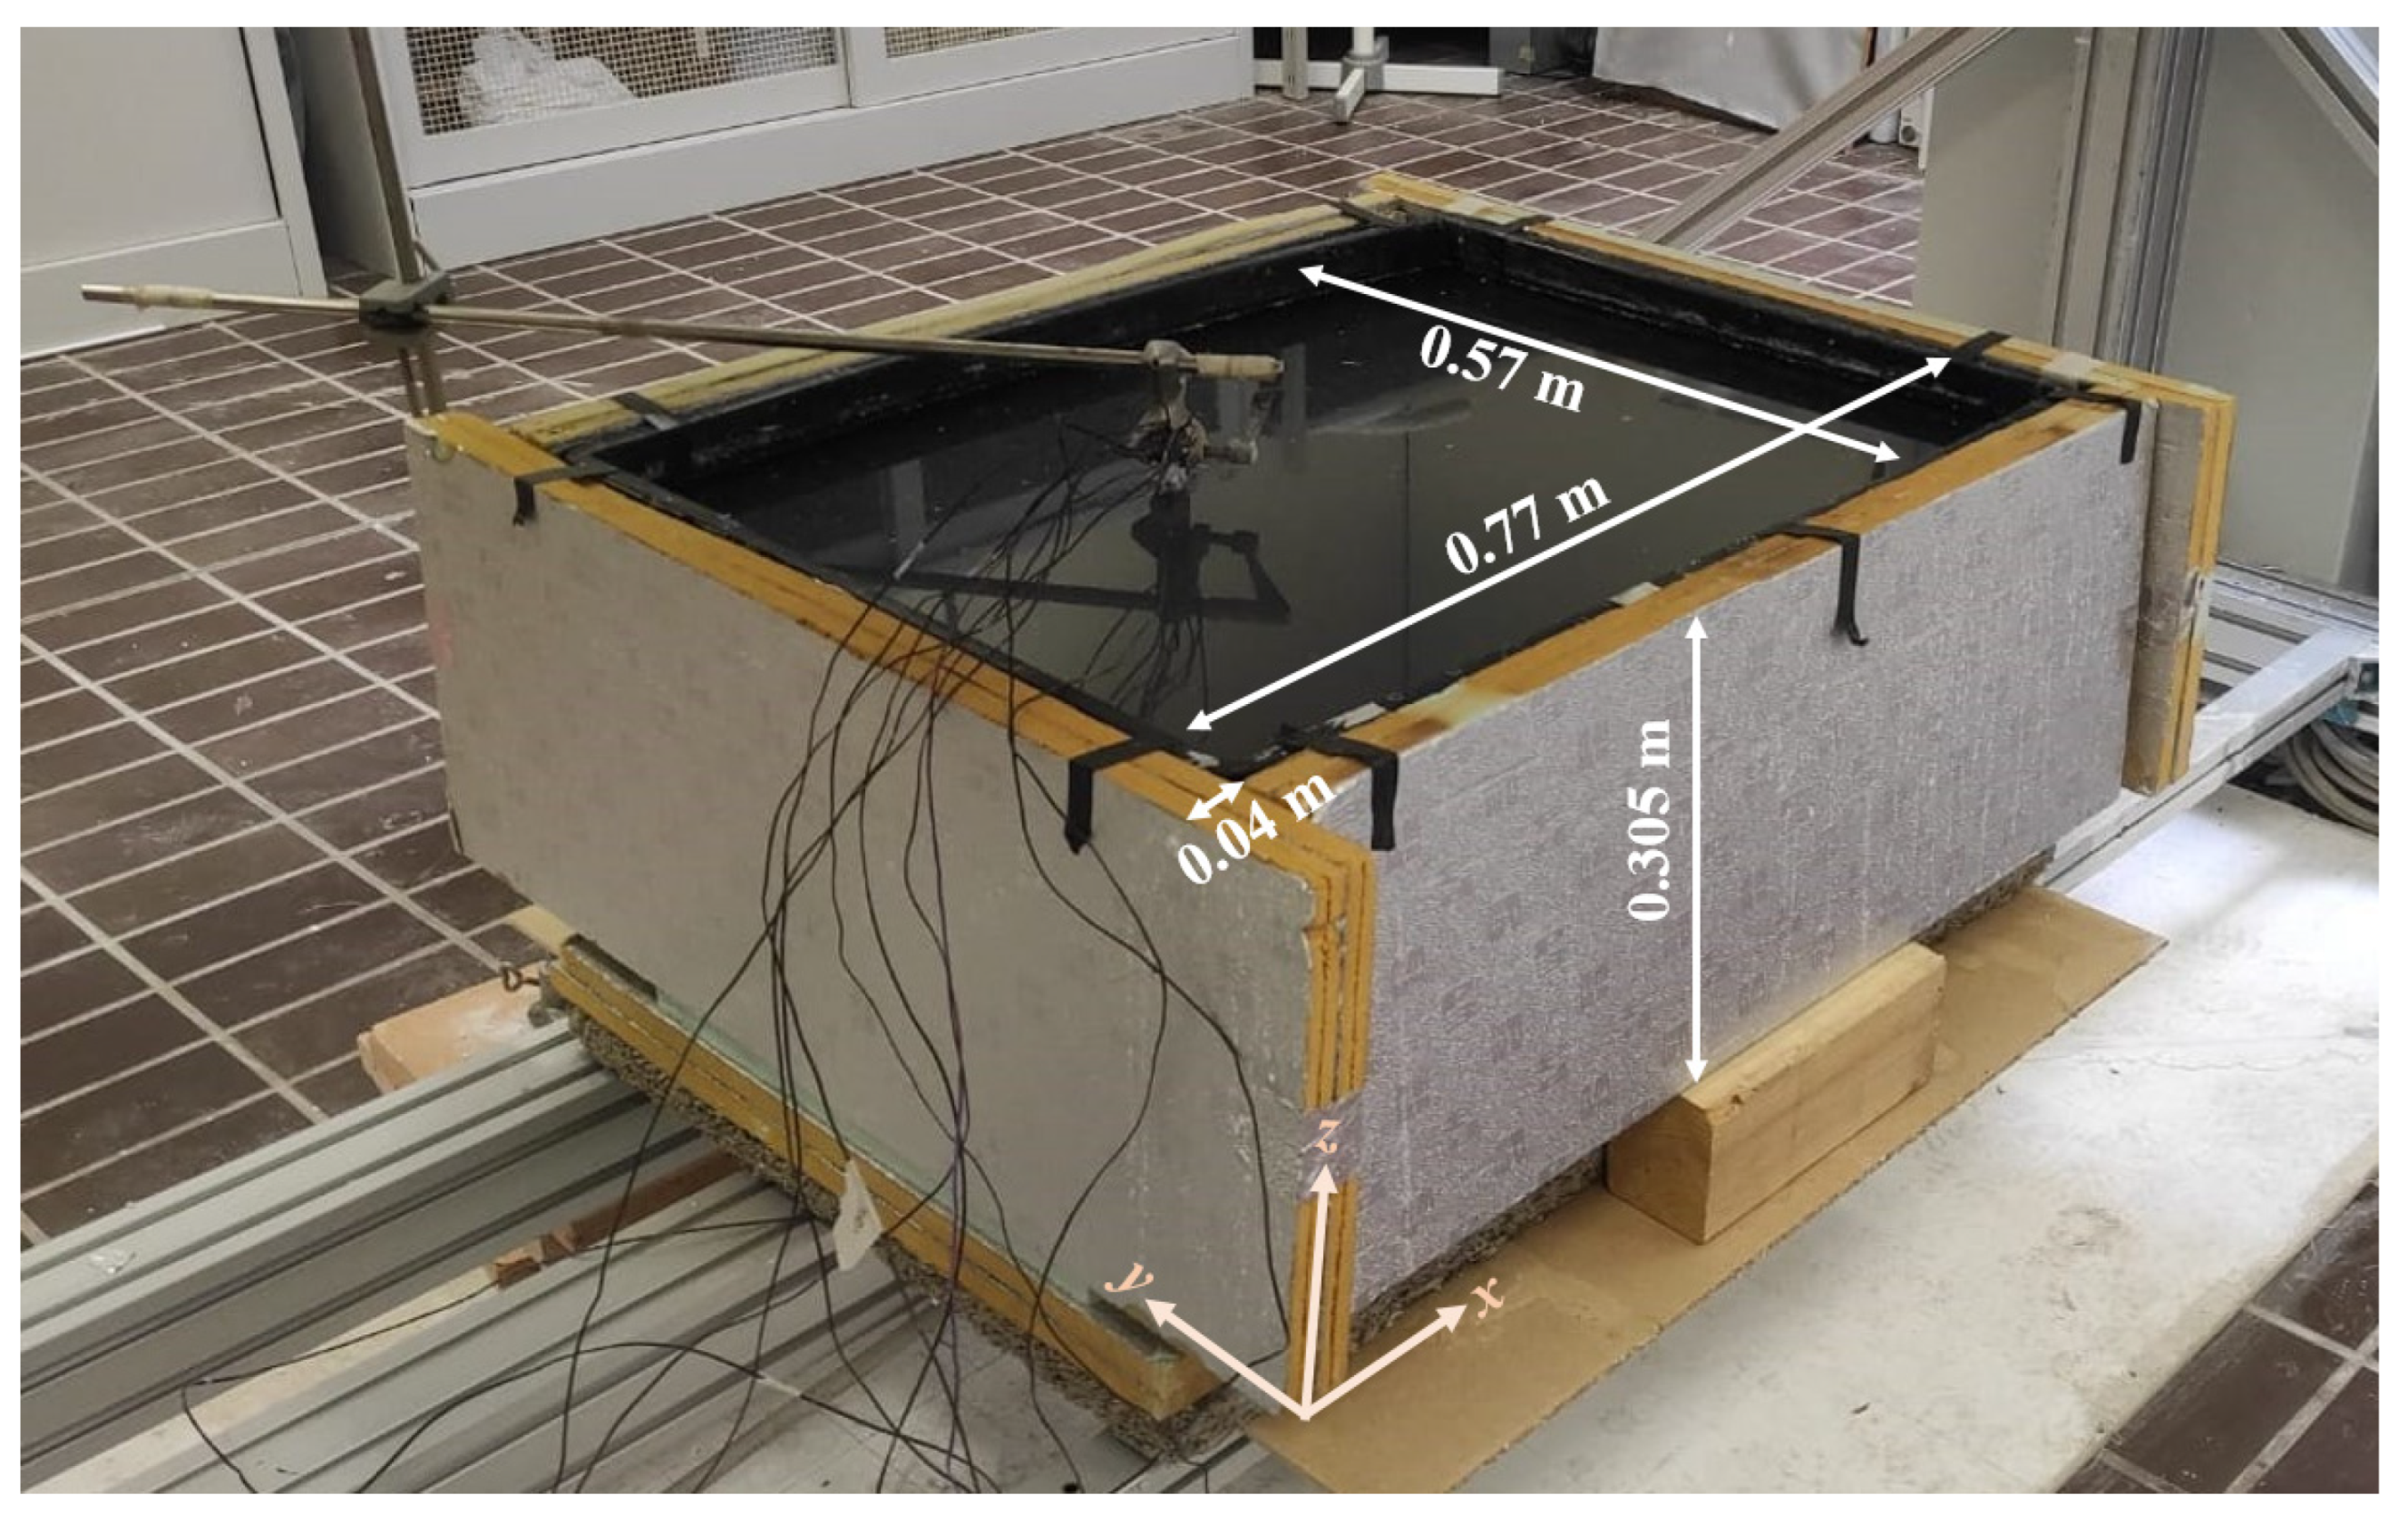
Figure 1. Dimensions of the solar pond.
Sustainability 15 01479 g001
Figure 2. Schematic view of the experimental pond under the solar simulator.
Sustainability 15 01479 g002
Figure 3. Final configuration of the experimental set-up.
Sustainability 15 01479 g003
Figure 4. Variation of the artificial solar radiation during the experimental period.
Sustainability 15 01479 g004
Figure 5. Variation of (a) relative humidity and (b) air temperature during the experimental period.
Sustainability 15 01479 g005
Figure 6. Physical model of the SGSP proposed.
Sustainability 15 01479 g006
Figure 7. Vertical variation of the SGSP temperature during 82 h obtained (a) experimentally and numerically by (b) the first model and (c) the second model.
Sustainability 15 01479 g007aSustainability 15 01479 g007b
Figure 8. Vertical variation of the SGSP temperature at specific instants.
Sustainability 15 01479 g008aSustainability 15 01479 g008b
Figure 9. Temporal variation of the average UCZ temperature.
Sustainability 15 01479 g009
Figure 10. Temporal variation of the average LCZ temperature.
Sustainability 15 01479 g010
Figure 11. Temporal variation of thermal energy stored and artificial solar radiation.
Sustainability 15 01479 g011
Figure 12. Temporal variation of calculation time.
Sustainability 15 01479 g012
Table 1. Measurement instrumentations.
Model NumberPropertyAccuracy
T-type thermocouplesTemperature±1.0 °C
DPA/ESR 154 pyranometerSolar radiation<5%
Omega HX93BDTemperature±0.6 °C
Omega HX93BDRelative humidity ±2.5%
Table 2. Boundary conditions of the proposed model.
Boundary LocationsVelocityTemperatureSalt Concentration
z = 0 and 0 < x < L 0 m/s λ T z | z = 0 = φ l o s s C z | z = 0 = 0
z = H and 0 < x < L 0 m/s λ T z | z = H = φ t t C z | z = H = 0
x = 0 and 0 < z < H 0 m/s λ T x | x = 0 = φ l o s s C x | x = 0 = 0
x = L and 0 < z < H 0 m/s λ T x | x = L = φ l o s s C x | x = L = 0
Table 3. Results of comparison between experimental and numerical.
LCZ TemperatureUCZ Temperature
Maximum
(°C)
Minimum
(°C)
Average Relative Error (%)Maximum
(°C)
Minimum
(°C)
Average
Relative Error (%)
Experimental48.6232.36-34.0121.24-
With_cnv46.4732.243.7434.2920.855.98
Without_cnv49.1232.282.9238.0619.049.39
Disclaimer/Publisher’s Note: The statements, opinions and data contained in all publications are solely those of the individual author(s) and contributor(s) and not of MDPI and/or the editor(s). MDPI and/or the editor(s) disclaim responsibility for any injury to people or property resulting from any ideas, methods, instructions or products referred to in the content.