Article

Influence of Vetiver Root Morphology on Soil–Water Characteristics of Plant-Covered Slope Soil in South Central China

1
School of Civil Engineering, Central South University of Forestry and Technology, Changsha 410000, China
2
China Construction Third Bureau Group Co., Ltd., Wuhan 430000, China
*
Author to whom correspondence should be addressed.
Sustainability 2023, 15(2), 1365; https://doi.org/10.3390/su15021365
Submission received: 1 December 2022 / Revised: 31 December 2022 / Accepted: 9 January 2023 / Published: 11 January 2023

Abstract

:
The soil–water characteristic curve is an important tool to evaluate the water-holding capacity of unsaturated soil. Plant roots can affect the matric suction of soil and the water-holding capacity and permeability of the soil. Therefore, the morphological characteristics of plant roots will lead to the difference in soil–water characteristics between soil slope and plant-covered slope. This study aims to investigate the effect of Vetiver root morphology on soil–water characteristic curves of plant-covered slope soil. The hydrological effect of the root distribution on the root–soil system was also discussed. The results showed that: (1) The root surface area index (RAI) and root volume ratio (Rv) of each soil section of the vetiver root system varied with depth in accordance with the Gaussian function distribution; (2) In the process of natural drying, the matric suction generated within the root system is significantly higher than that generated by evaporation of bare soil in the same soil layer. The ability of vegetation soil to enhance soil matrix suction increases with the increase of soil root surface area index; and (3) The α and n values of the SWCC model decreased with the increase of Rv (root volume ratio of soil), while the air entry value increased. Under the same water content, the matric suction corresponding to vegetation soil is significantly greater than bare soil. In addition, the soil–water characteristic curve can be effectively predicted by combining the Rv of vegetated soils.

1. Introduction

Rigid protection measures are frequently used in engineering to prevent and control the instability of the side slope [1]. With the gradual weathering of the soil and the aging of the concrete, the protection capacity of the side slope is greatly reduced, causing a series of hazards such as landslides [2]. In addition, the traditional protective measures are not conducive to environmental protection. With the strengthening of ecological awareness, plant-based ecological slope protection technology is widely adopted in engineering [3]. This technology mainly relies on the joint action of plant stems and roots to enhance the shear strength and water-holding capacity of the soil, thus improving the safety and stability of the slope [4,5]. However, the hydraulic properties of the root–soil system are inadequately studied because of the relatively complex and uncertain morphological distribution of plant roots.
In the experiment, Vetiver was selected as the slope protection plant, as shown in Figure 1. Vetiver is a perennial herb with a fast growth rate and a well-developed and tough root system. It has the characteristics of high adaptability to the environment with resistance to salinity, drought, and infertility [6]. In North America, vegetation slope protection mainly focuses on erosion control related to road construction. In Malaysia, Thailand and other Southeast Asian countries, vetiver is used to strengthen the stability of ditches and highway subgrade slope protection because of its well-developed root system, deep roots, and greater root tensile strength than ordinary plants [7]. In recent years, ecological slope protection projects have also begun to get a lot of applications in China, and achieved good slope protection effect and vegetation restoration effect [8,9].
With the in-depth research on the mechanism of plant slope protection in recent years, the plant root system has exhibited good mechanical and hydrological effects on slope protection. Cheng et al. [10] conducted a pull-out test on the root system of the vetiver plant, and found that the tensile strength of the root system is positively related to the root diameter. Because of the reinforcement of the root system, the shear strength of the shallow soil on the slope is increased by about 35–100% compared with the plain soil. Xiao et al. [11] comprehensively considered root length and root diameter of the vetiver plant, further improved the original formula for calculating root tensile strength, and obtained the relevant calculation model parameters for vetiver plant roots. Deljouei’s research [12] shows that the main factor affecting the change in fine root tension is the DBH of tree species and sampling trees, In the follow-up study of Deljouei [13] it was found that the increase in RAR in different species also had an impact on the enhancement of root reinforcement. In addition, after considering the effect of DBH the elevation significantly affected the root reinforcement of C. betulus.
In recent years, there are still many controversies about the contribution of plant roots to soil fixation hydraulic effect. The previous study shows that 90% of road collapses are caused by rainwater, suggesting that rainwater is the primary cause of side slope instability [14]. The water absorption of plant roots has an enhanced effect on slope stability. Under continuous precipitation, the maximum runoff coefficient for the plant-protected slopes is 36.96% higher than for the slopes without plant protection [15]. By investigating Setaria viridis and Artemisia, scholars have found that plants with cut leave still provide good soil consolidation under rainfall conditions [16]. Yao [17] showed that the soil–water content was the highest in the middle part of the slope. The soil at the foot of the slope should have the highest water content affected by runoff. However, the development of plant roots results in more water absorption and transpiration, leading to less water content at the foot than at the middle part of the slope. The permeability coefficient of soils with plant cover is greater than bare soils [18]. When there are more roots in the soil the rainfall infiltration in the soil is higher. At sufficient rainfall, the rainwater infiltration paths of root-rich soils differ significantly from those of bare soils, with the root system directing the lateral preferential flow of water [19]. Ng et al. [8,20] studied the interactions between the atmosphere, vegetation, and soil. The influence pattern of different plant root morphological characteristics on the stability of shallow slopes was obtained by studying the relationship between characteristic parameters, including leaf area, root area index (RAI), vegetation biomass, root volume ratio, and root cross-sectional area ratio of plants and soil suction.
The soil–water characteristic curve of unsaturated soils is influenced by many factors, such as soil structure, compaction, dry density, initial porosity ratio, and stress history [21]. Li [22] believed that the mineral composition and pore structure of the soil are the most critical factors influencing the soil–water characteristic curve. If the main mineral components of the soil are all hydrophilic minerals, the soil usually has more suction and less dehumidification. The characteristic curve of the soil is also flatter, but the residual moisture is higher. Sun [23] found that different pore distribution curves of soils can cause significant differences in soil–water characteristic curves. Hou [24] compared the pore structure of original loess in different soil layers and their soil–water characteristic curves. The results showed that under the same matrix suction, different soil layers have different volumetric water contents due to the differences in pore characteristics. Cai [25] showed that the influence of pore structure on the soil–water characteristic curve was significant, and the soil–water characteristic curves of compact and loose soils showed the trends of “double-drop” and “single-drop”, respectively. Yao et al. [26,27] discovered that the soil–water characteristic curve of the soil varied significantly in the range of matric suction from 0 to 200 kPa after the application of vertical stress. This result suggested that the compaction and stress state of the soil are closely related to the water-holding capacity.
In order to understand the influence of the root system on the water-holding capacity of the soil, the characteristic parameters of the root morphology of the Vetiver were measured by in situ full excavation method. Moreover, the variation in water content and matric suction of soils with different root contents in the natural environment were measured by the tensiometer method. Combined with the relevant theory of unsaturated soil mechanics, the effect of Vetiver root morphology on the soil–water characteristic curve model of side slope soils was investigated.

2. Materials and Methods

2.1. Materials

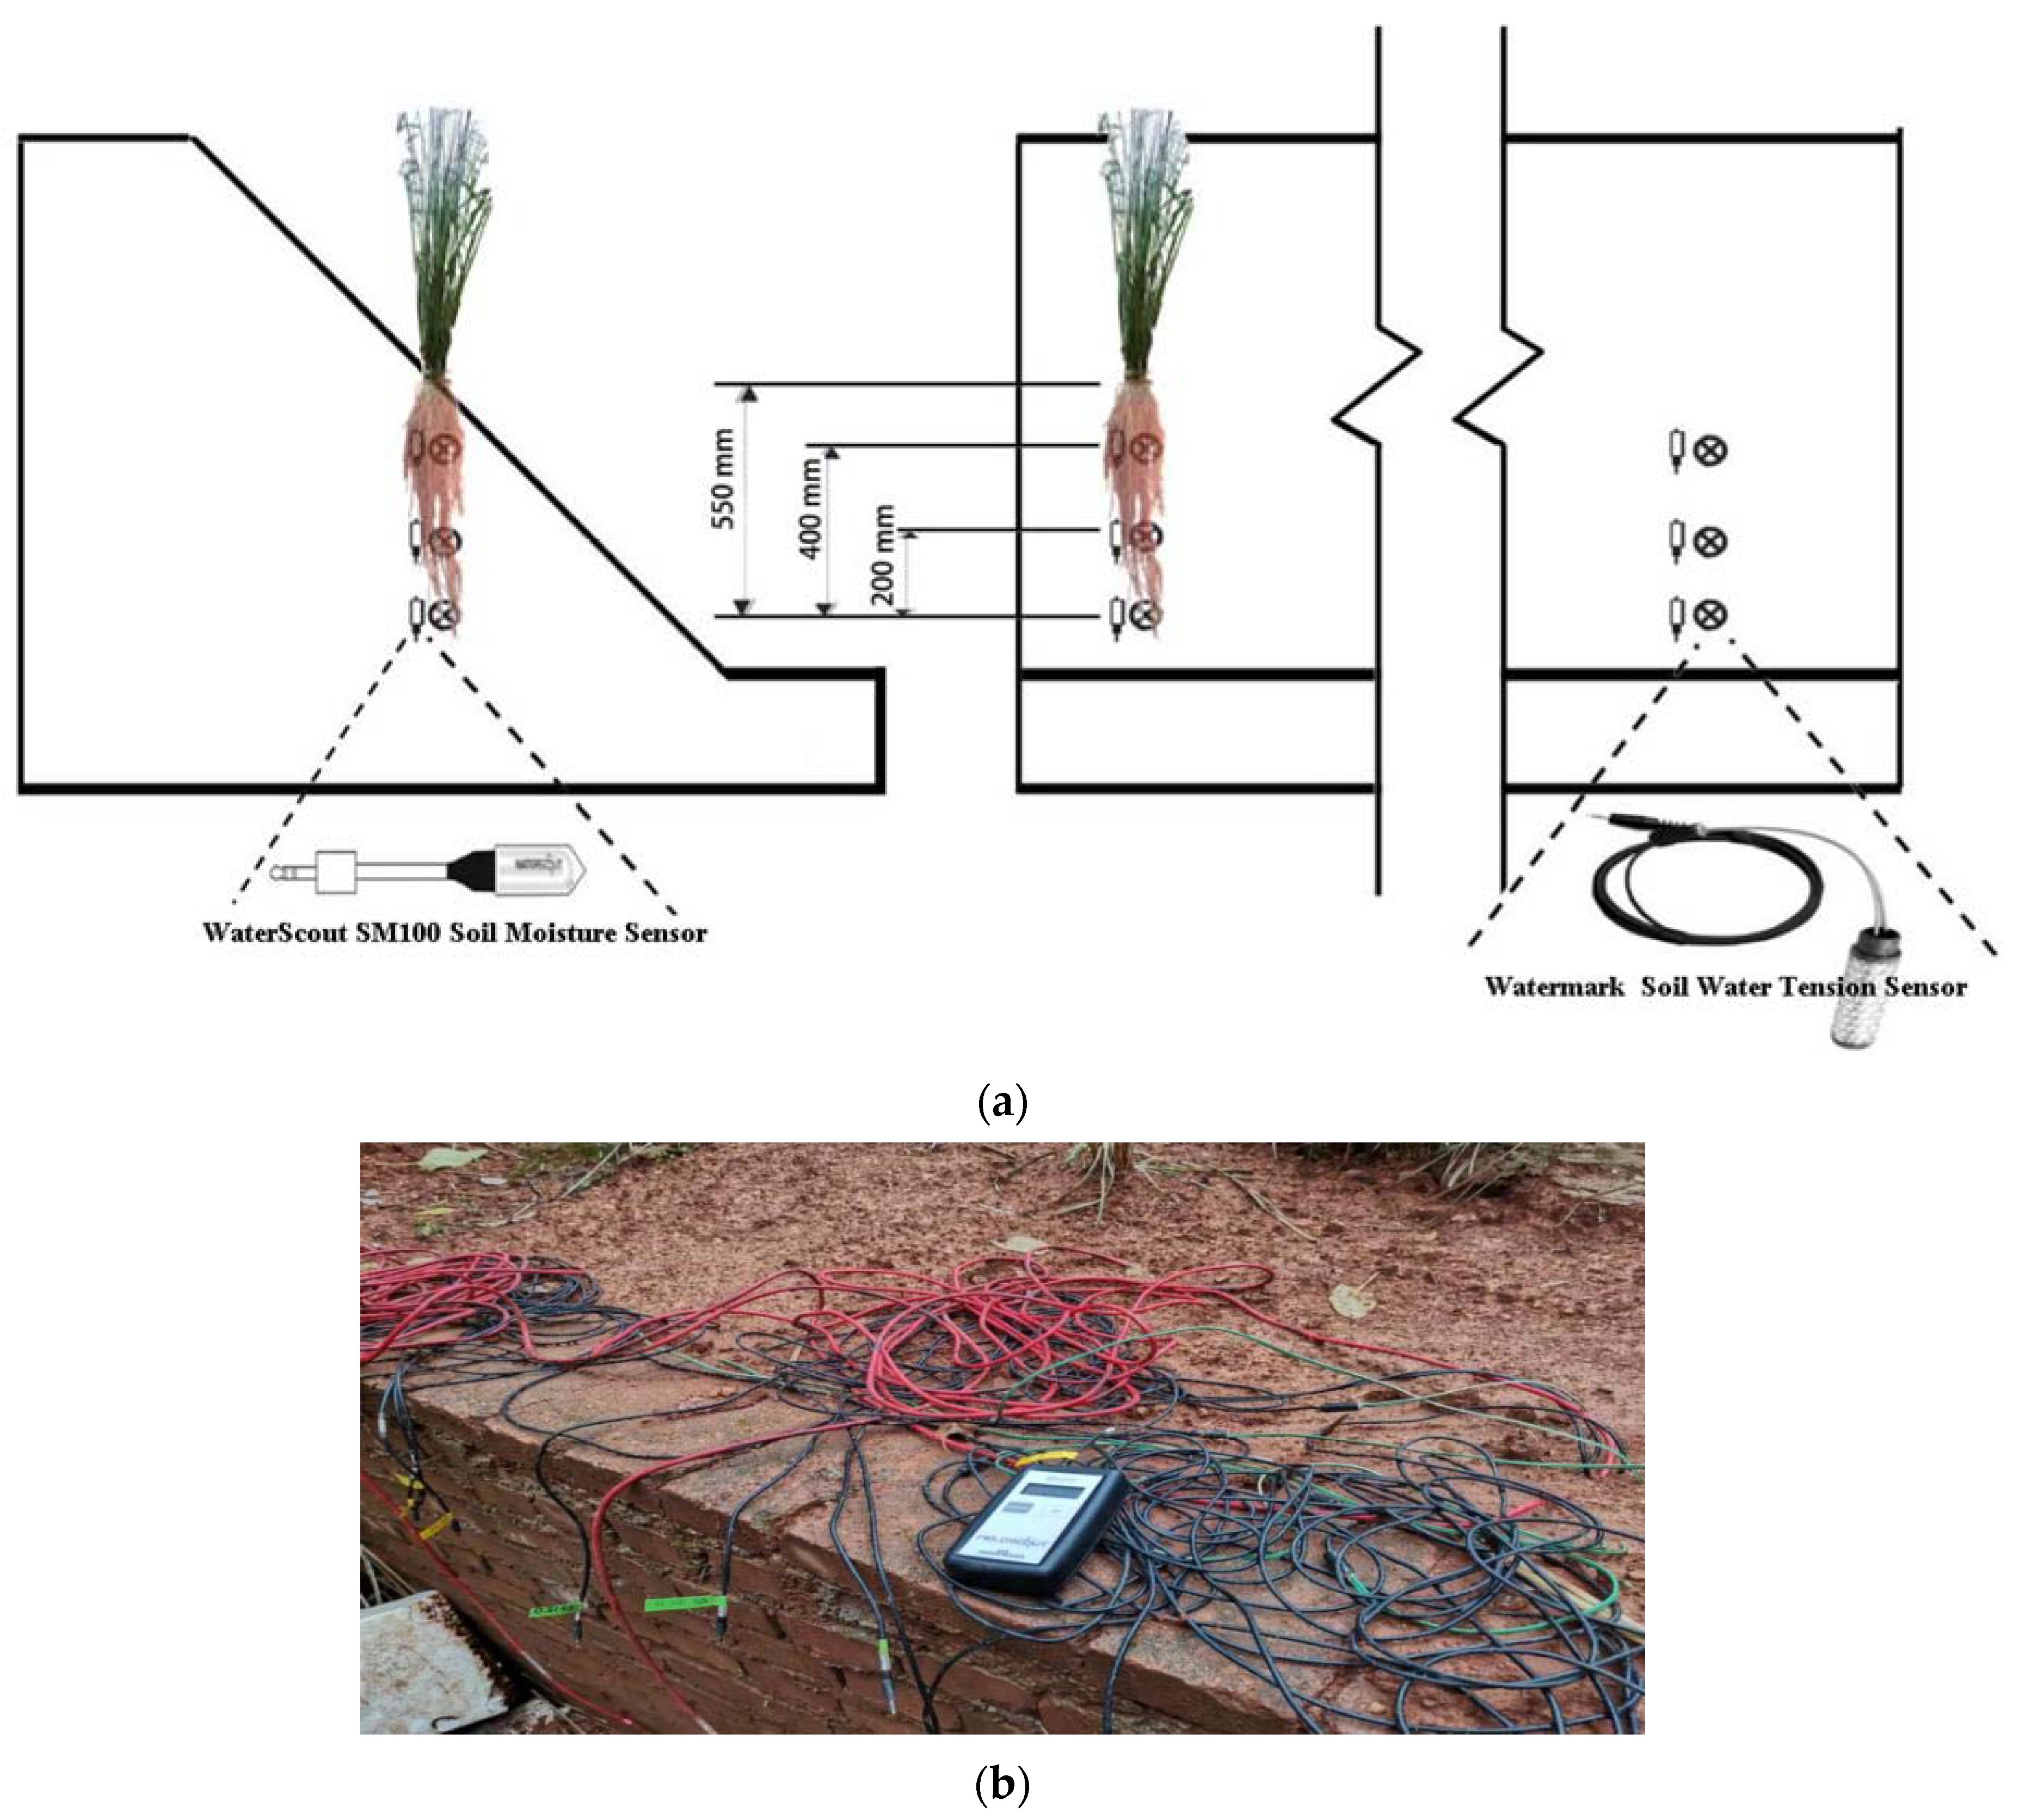
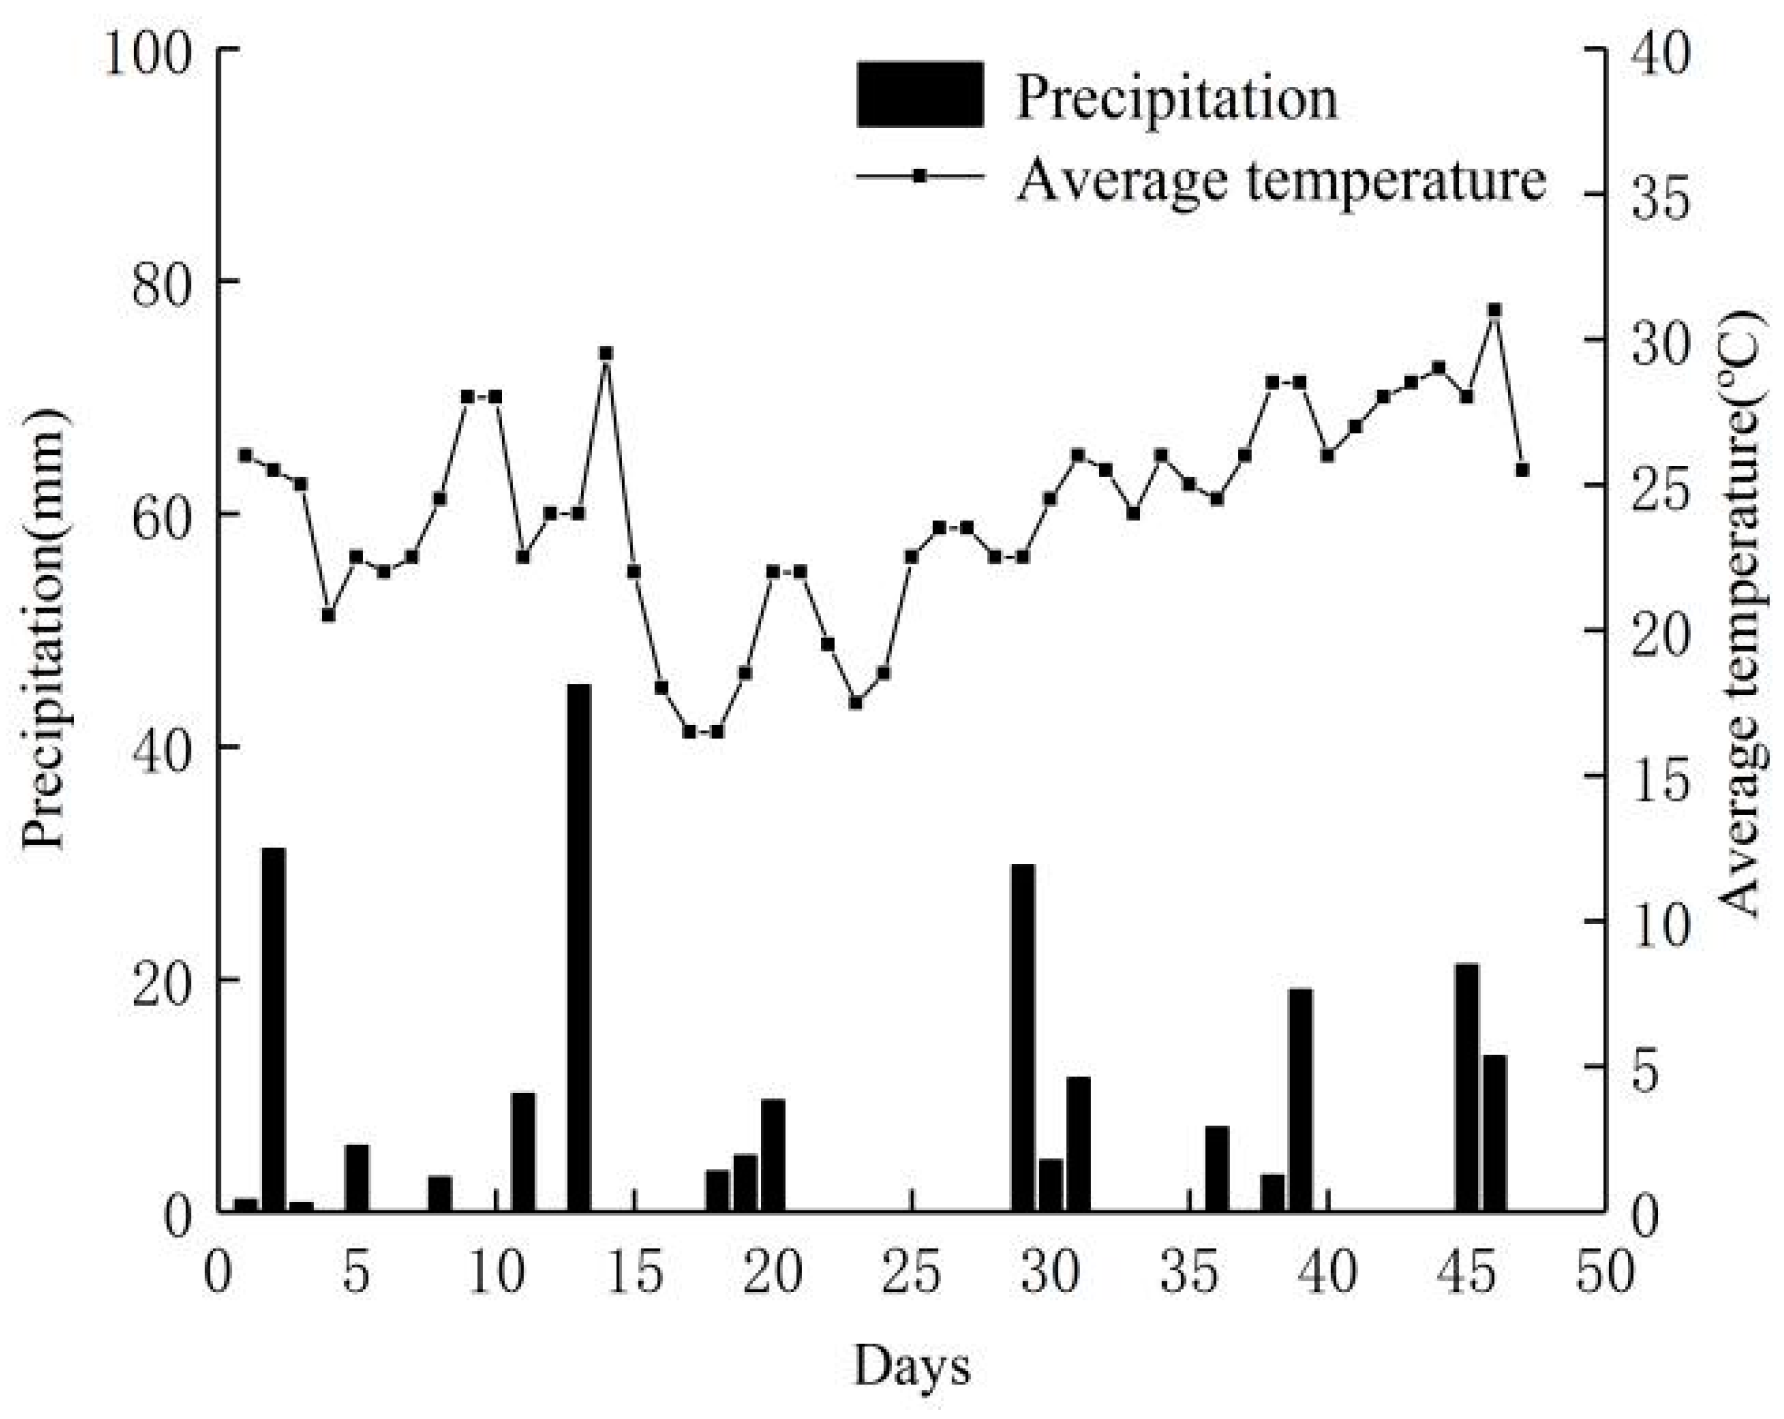
2.1.1. Experimental Site

The test site was located at Central South University of Forestry and Technology in Changsha, Hunan Province, China (28°8′ N, 112°59′ E, 90 m a.s.l.). It belongs to the subtropical monsoon climate. During the project construction, the excavated cutting or manually filled embankment slopes are mostly barren earth rock slopes. The test site was filled with barren, strongly weathered red sandy soil. During the filling process, in order to keep the soil uniformity, void ratio and other parameters consistent, the method of layered filling and compaction was adopted. After standing for a period of time, the soil was gradually compacted under its own weight, and then with the same method, so as to finally complete the filling in the test slope. The physical and mechanical properties of the red soil on the test side slope are shown in Table 1. The particle size distribution curve is shown in Figure 2. The size of the test side slope is 20 m × 2 m × 2 m. The slopes were divided into two areas: one with Vetiver planted slopes; the other with bare soil slopes as the control group. The environmental conditions such as rainfall, temperature and light, were kept consistent for all slopes.
The test started on 15 February 2021, when the seeds of Vetiver were sown. After planting the vetiver grass, in order to ensure the water demand for its early development and growth the vetiver grass should be watered manually at regular intervals in the first two weeks after planting until it can grow and reproduce normally. Then, according to climate conditions or test needs, decide whether to supplement water to plants to ensure that vetiver will not stop growing due to excessive water shortage, and observe and record the growth of vetiver in the test site every day.

2.1.2. Monitoring System and Period

The monitoring system consisted of two types of sensors (Figure 3a) and a data collection system (Figure 3b). In order to measure the volumetric soil moisture content of each measurement point, WaterScout SM100 with a range of 0%~saturation was adopted, and its precision is 0.1% of the range. To measure matric suction Watermark Soil Moisture Sensors were used. The measuring range of this type of tensiometer is 0–200 kPa. In order to ensure that the sensor is effective, it should be saturated before installation and the sensor should be preconditioned by repeated drying and wetting cycles (soaking for 30 min, and then drying for several hours). Then use a small shovel to drill and take soil at the slope site and dig a hole slightly larger than the size of the sensor to prevent wear of the sensor film. Fill the hole with water and carefully push the sensor down into the hole. When the sensor is completely pushed into the hole, backfill and tamp the hole in time to eliminate the hole cavitation of tensiometer.
During the test, soil moisture sensors and tensiometers pre-buried in the specimen soil were used to determine the change in volumetric soil moisture content and the matric suction in each soil layer under the natural environment. The specific location of the instrument and the measurement method are shown in Figure 3a, respectively. Each measurement point was located in the vertical direction of the planting location, and soil moisture sensors and tensiometers were pre-built at the measurement points. According to the previous research [28] on the root system of vetiver by the research group and in order to make the test results have better discrimination, the first measurement point was located at a depth of 150 mm, the second at a depth of 350 mm, and the third at a depth of 550 mm; the measurement point of bare slope is the same as above (Figure 3a). The monitoring of the volumetric soil moisture content and the matric suction began on 7 July 2021, when the root system of the tested vetiver grows for about six months. Within 47 days during the test data were recorded every 24 h at each measurement point using a data collection system. After 47 days of monitoring, the monitored vetiver was sampled and analyzed to describe the effect of plant root morphological characteristics on the soil matric suction.
During the test it was rainy season in Hunan Province. The total precipitation was 225.46 mm, and the temperature was within the range of 16~32 °C. The specific weather temperature and precipitation in the test site are shown in Figure 4.

2.2. Methods

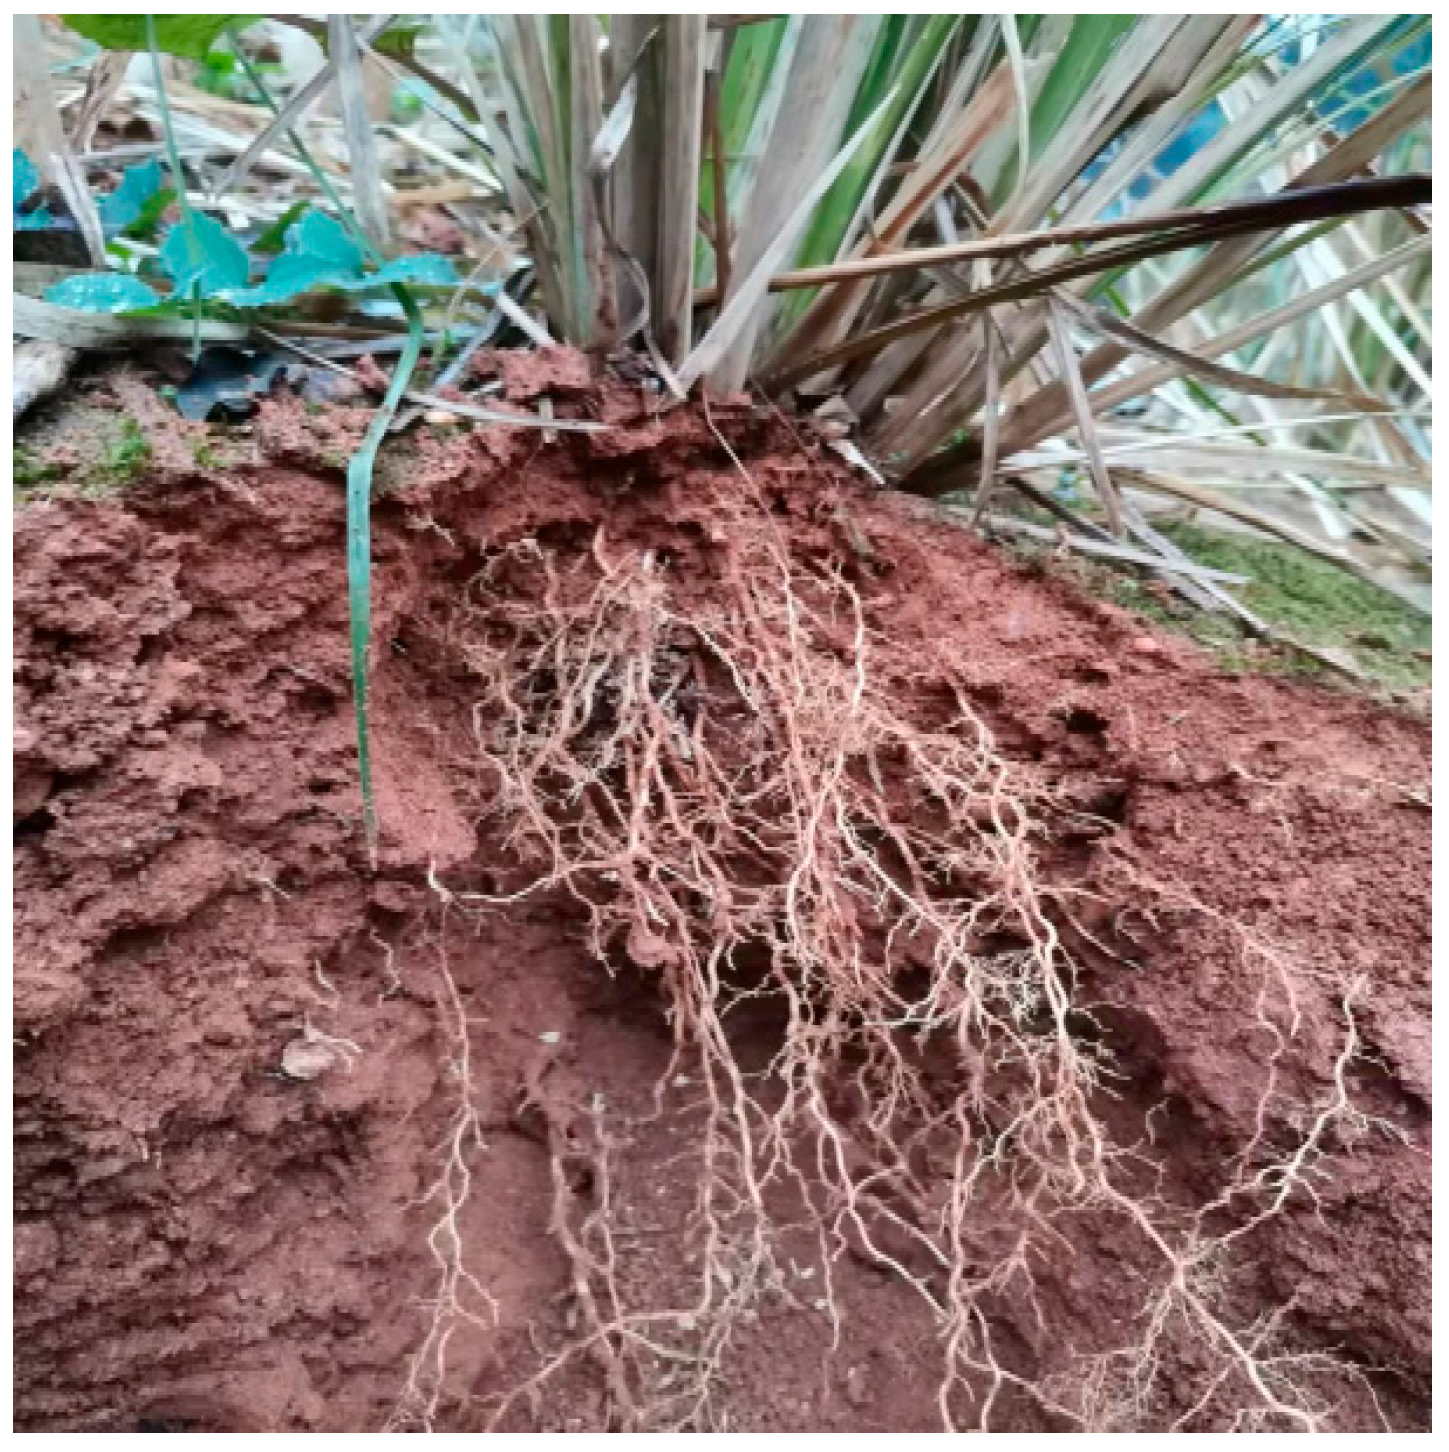
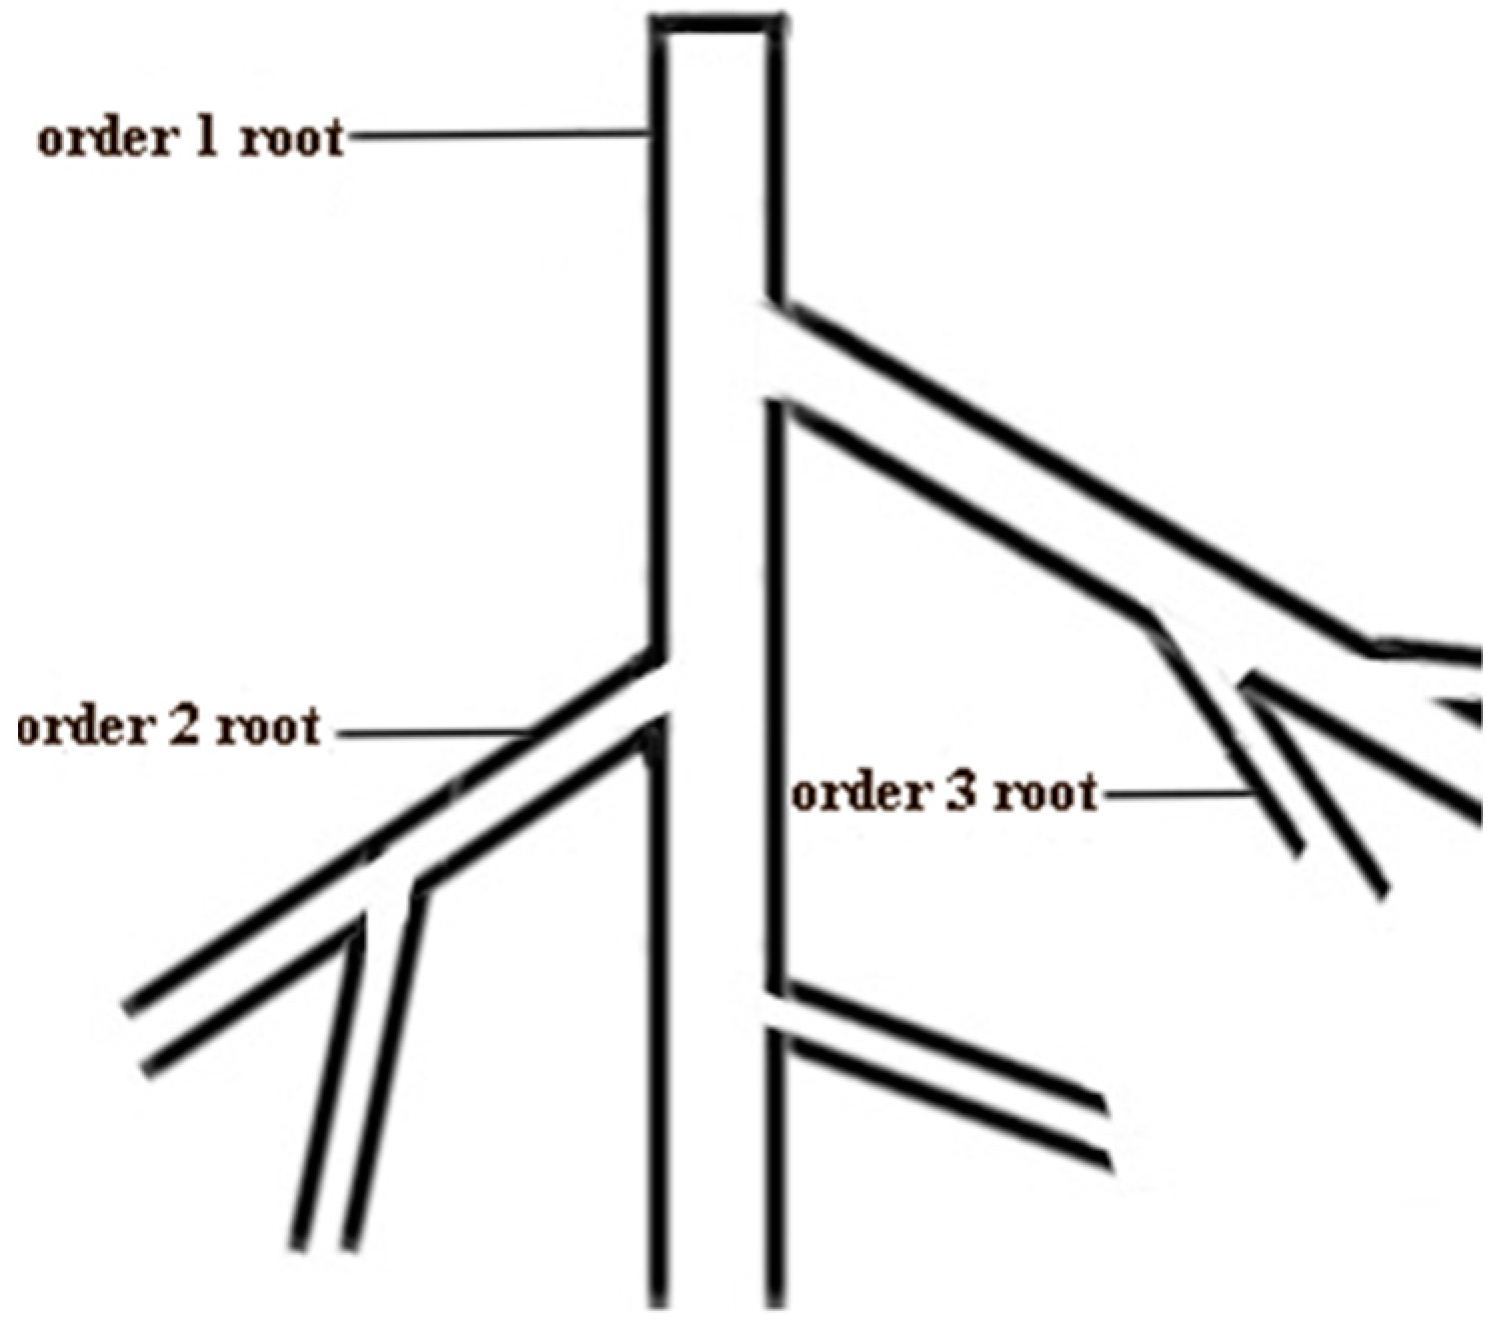
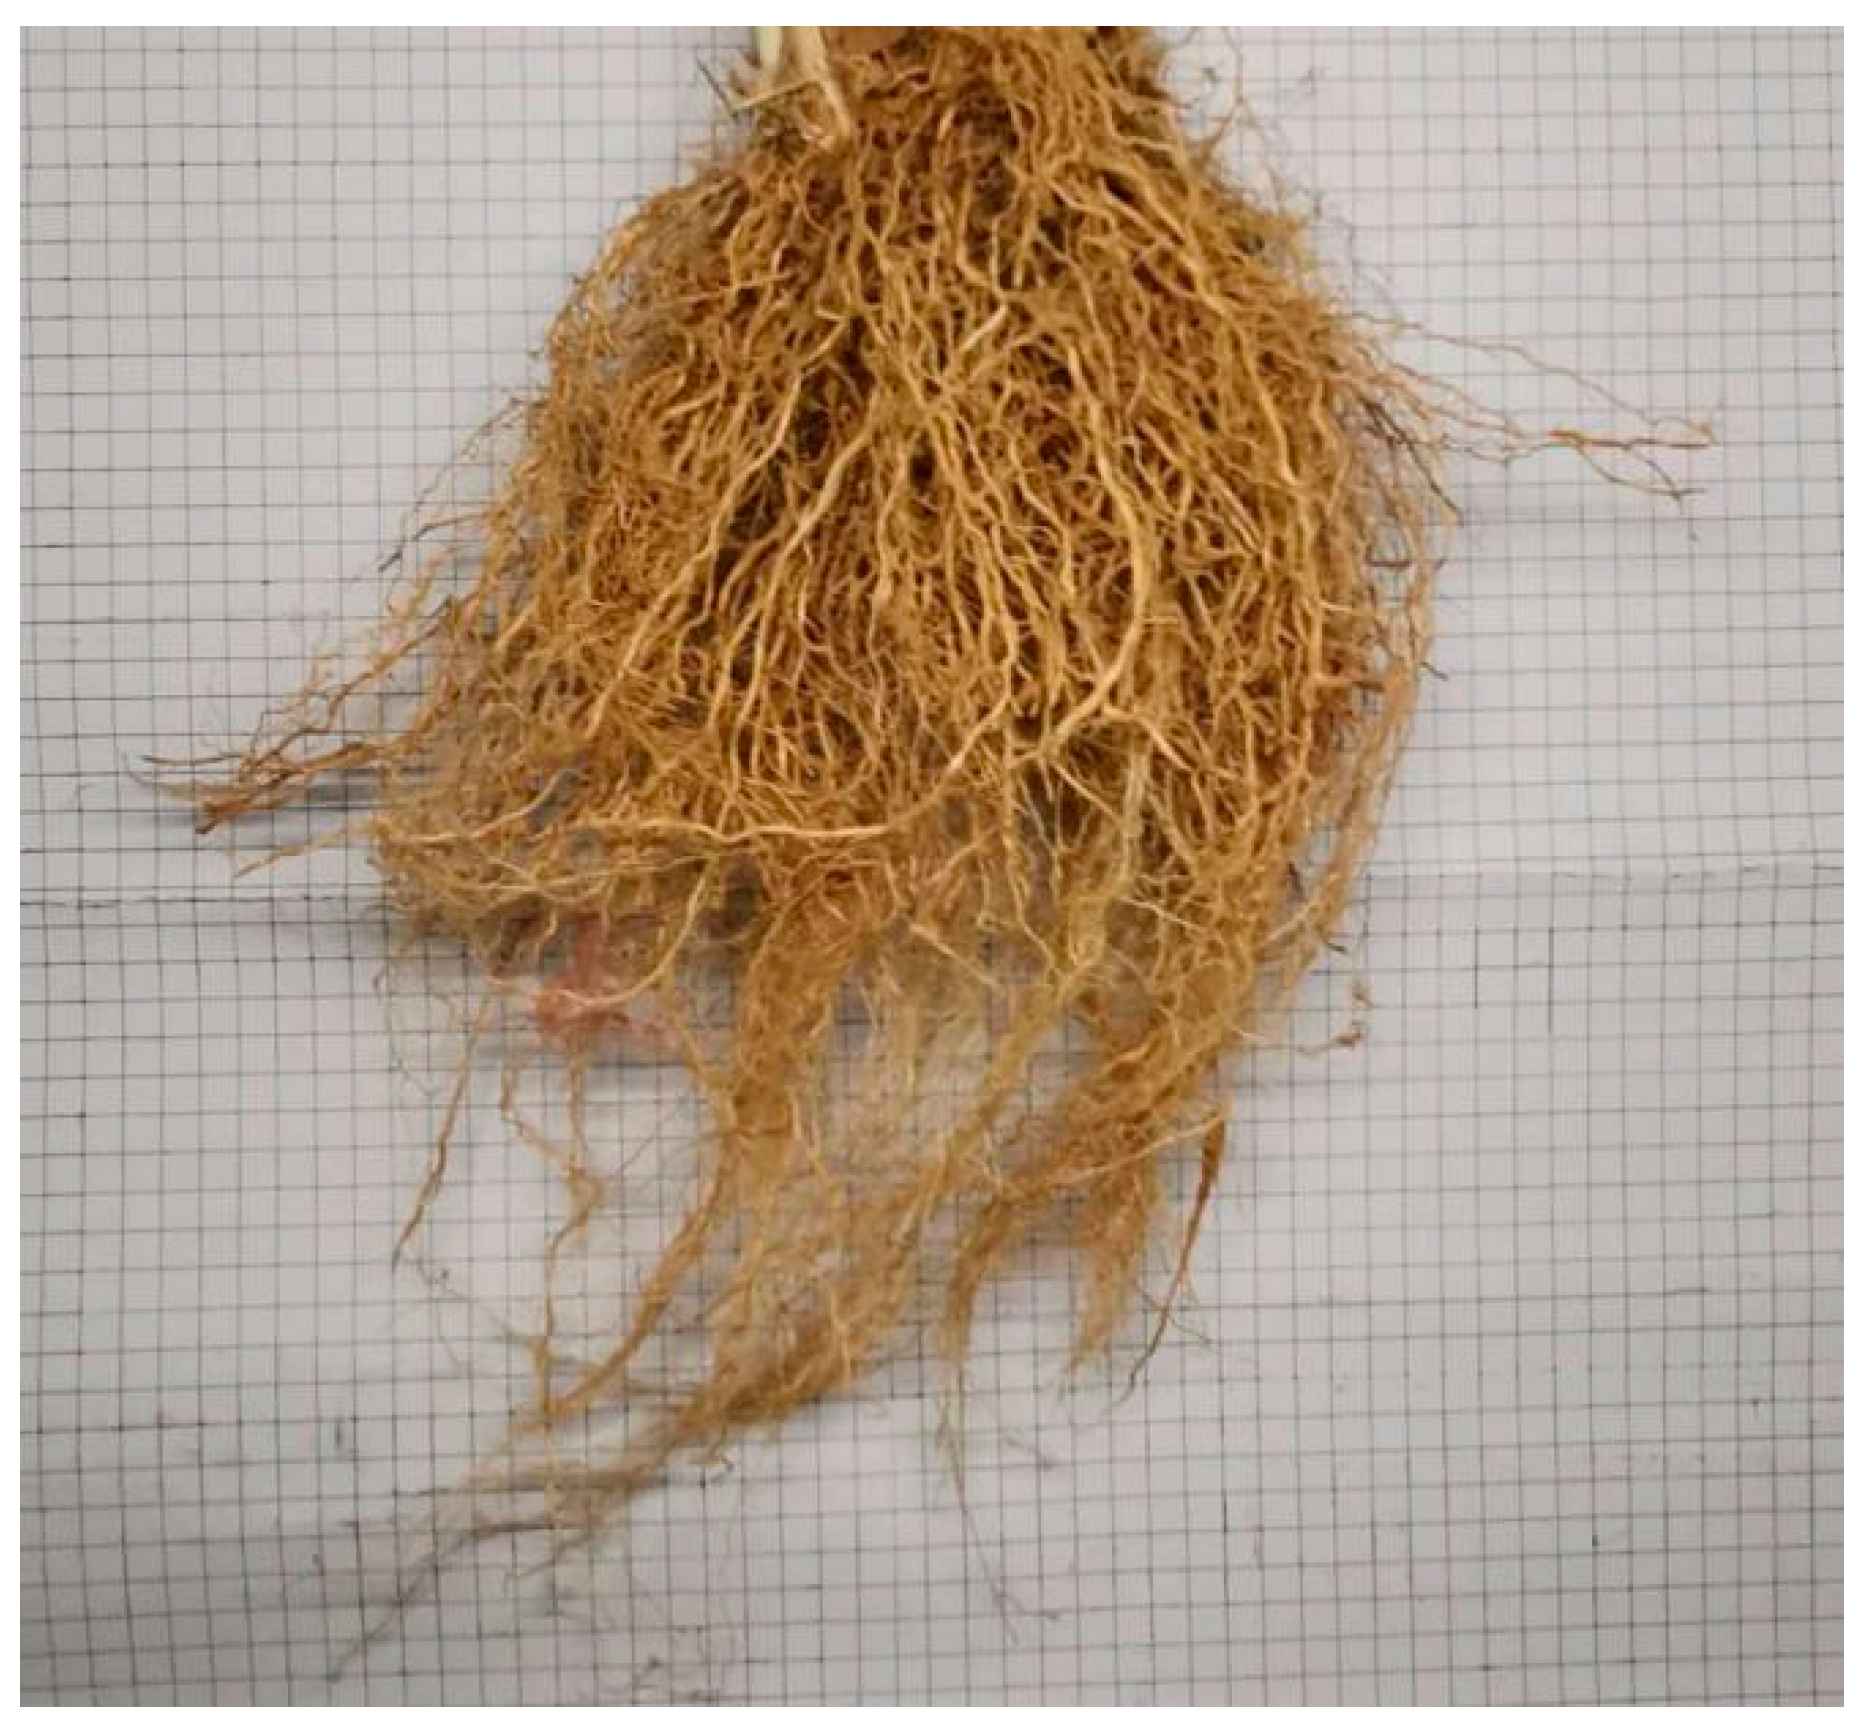
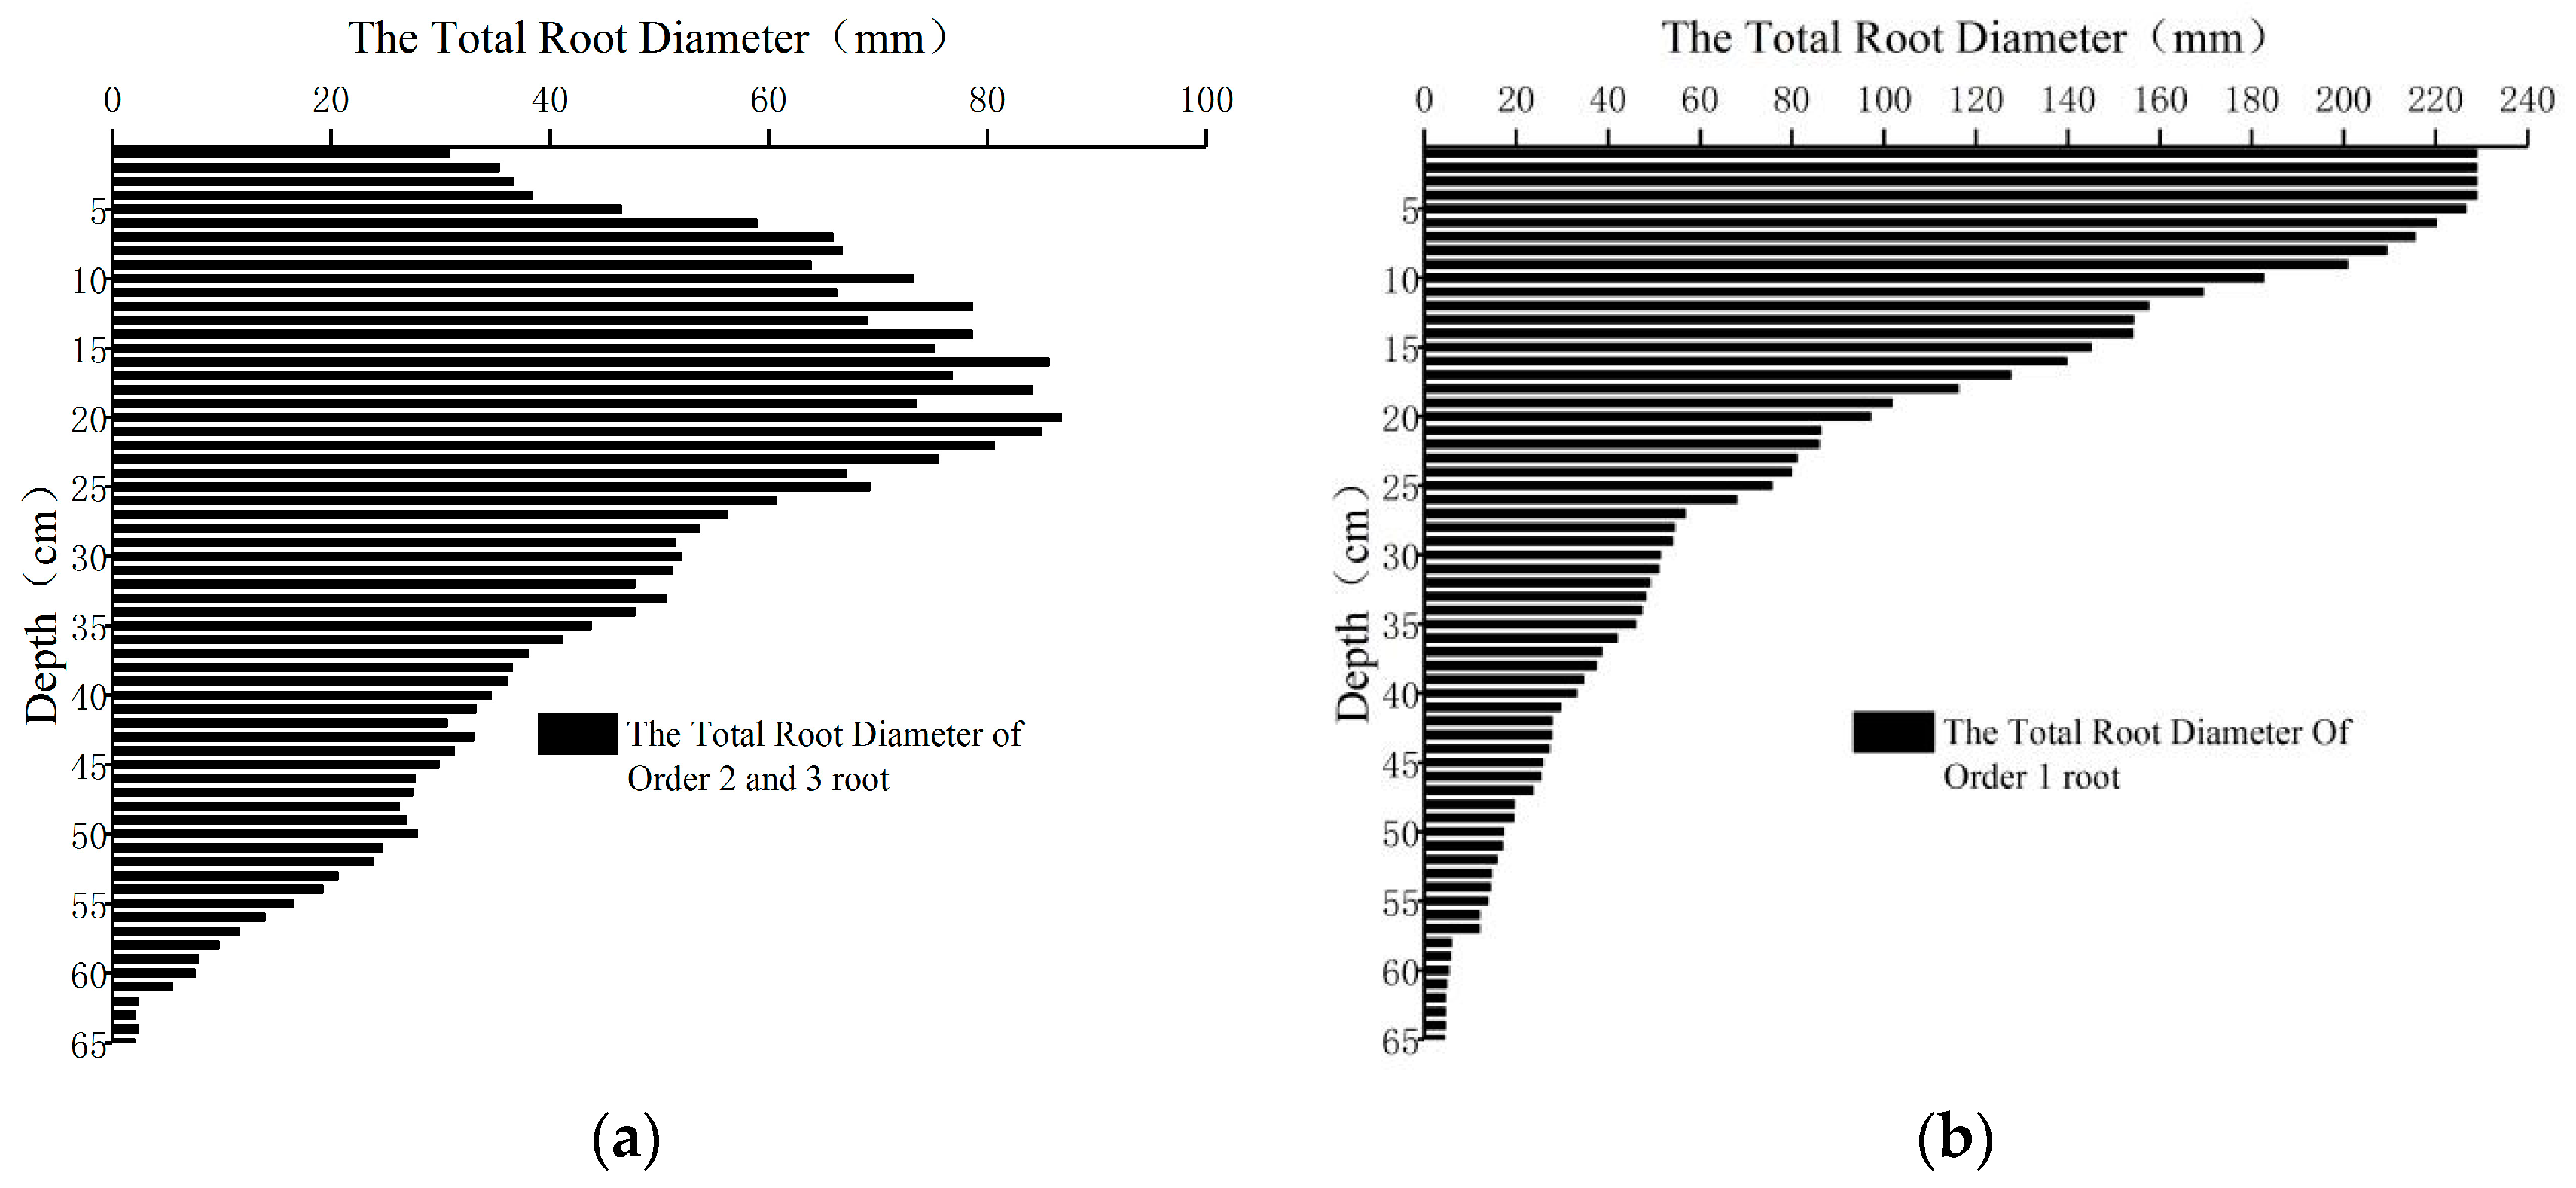
2.2.1. Vetiver Root Morphological Characteristics

In order to quantitatively describe the effect of plant root morphological characteristics on the soil matric suction, the roots of the experimental Vetiver with a growth period of six months were collected. The main parameters measured in this experiment included the number of roots, root diameter, and root length. With the root branching order as the ordering standard [29], the root ordering method was used to classify the coarse and fine roots. The classification of this method is based on structure. For example, the root system located at the extreme end without branches is defined as the order 3 root, while the parent root of the order 3 root is defined as the order 2 root. Based on the planar structure of the Vetiver root system (Figure 5), it can be classified into three root orders. The root tips of Vetiver are mostly order 2 and order 3 roots, which are the main water-absorbing areas of the root system. The root trichomes of order 1 roots are relatively few and have a weak water absorption capacity.
Plant roots are in direct contact with the soil and are the main organ to absorb water and other nutrients. Due to the different distributions of roots in different soil sections, the soil suction is also significantly affected by the root distribution. The RAI is defined as the ratio of the root surface area of order 2 and 3 roots in the longitudinal section at a given depth to the area of the root extension area in the horizontal direction, as shown in Equation (1):
R A I = i = 1 n π d i h π D r 2 4
where Δh is the calculated depth range, usually 10 mm; Dr is the maximum extension diameter of the root system in a horizontal direction; di is the diameter of the ith root system; the total number of roots is n.
The calculation of RAI requires first determining the number of order 2 and order 3 roots and their sizes. Before measurement the roots are excavated, and the soil attached to the roots is washed with a small stream of water. This process reduces the damage to the root system and increases the accuracy and efficiency of the measurement.
The root volume ratio Rv is defined as the total volume of all plant roots at a certain depth and for the proportion of the total soil volume in that soil layer, see Equation (2):
R v = i = 1 n π d i 2 4 h π D r 2 4 h
The measurement of Rv is approximately the same as that of RAI. After excavating the overall root system of the plant the number of all roots and the diameter of the roots were measured for all sections at each depth. The plant roots are then grouped by 0.5 mm diameter, and the number of roots in each diameter range is counted.

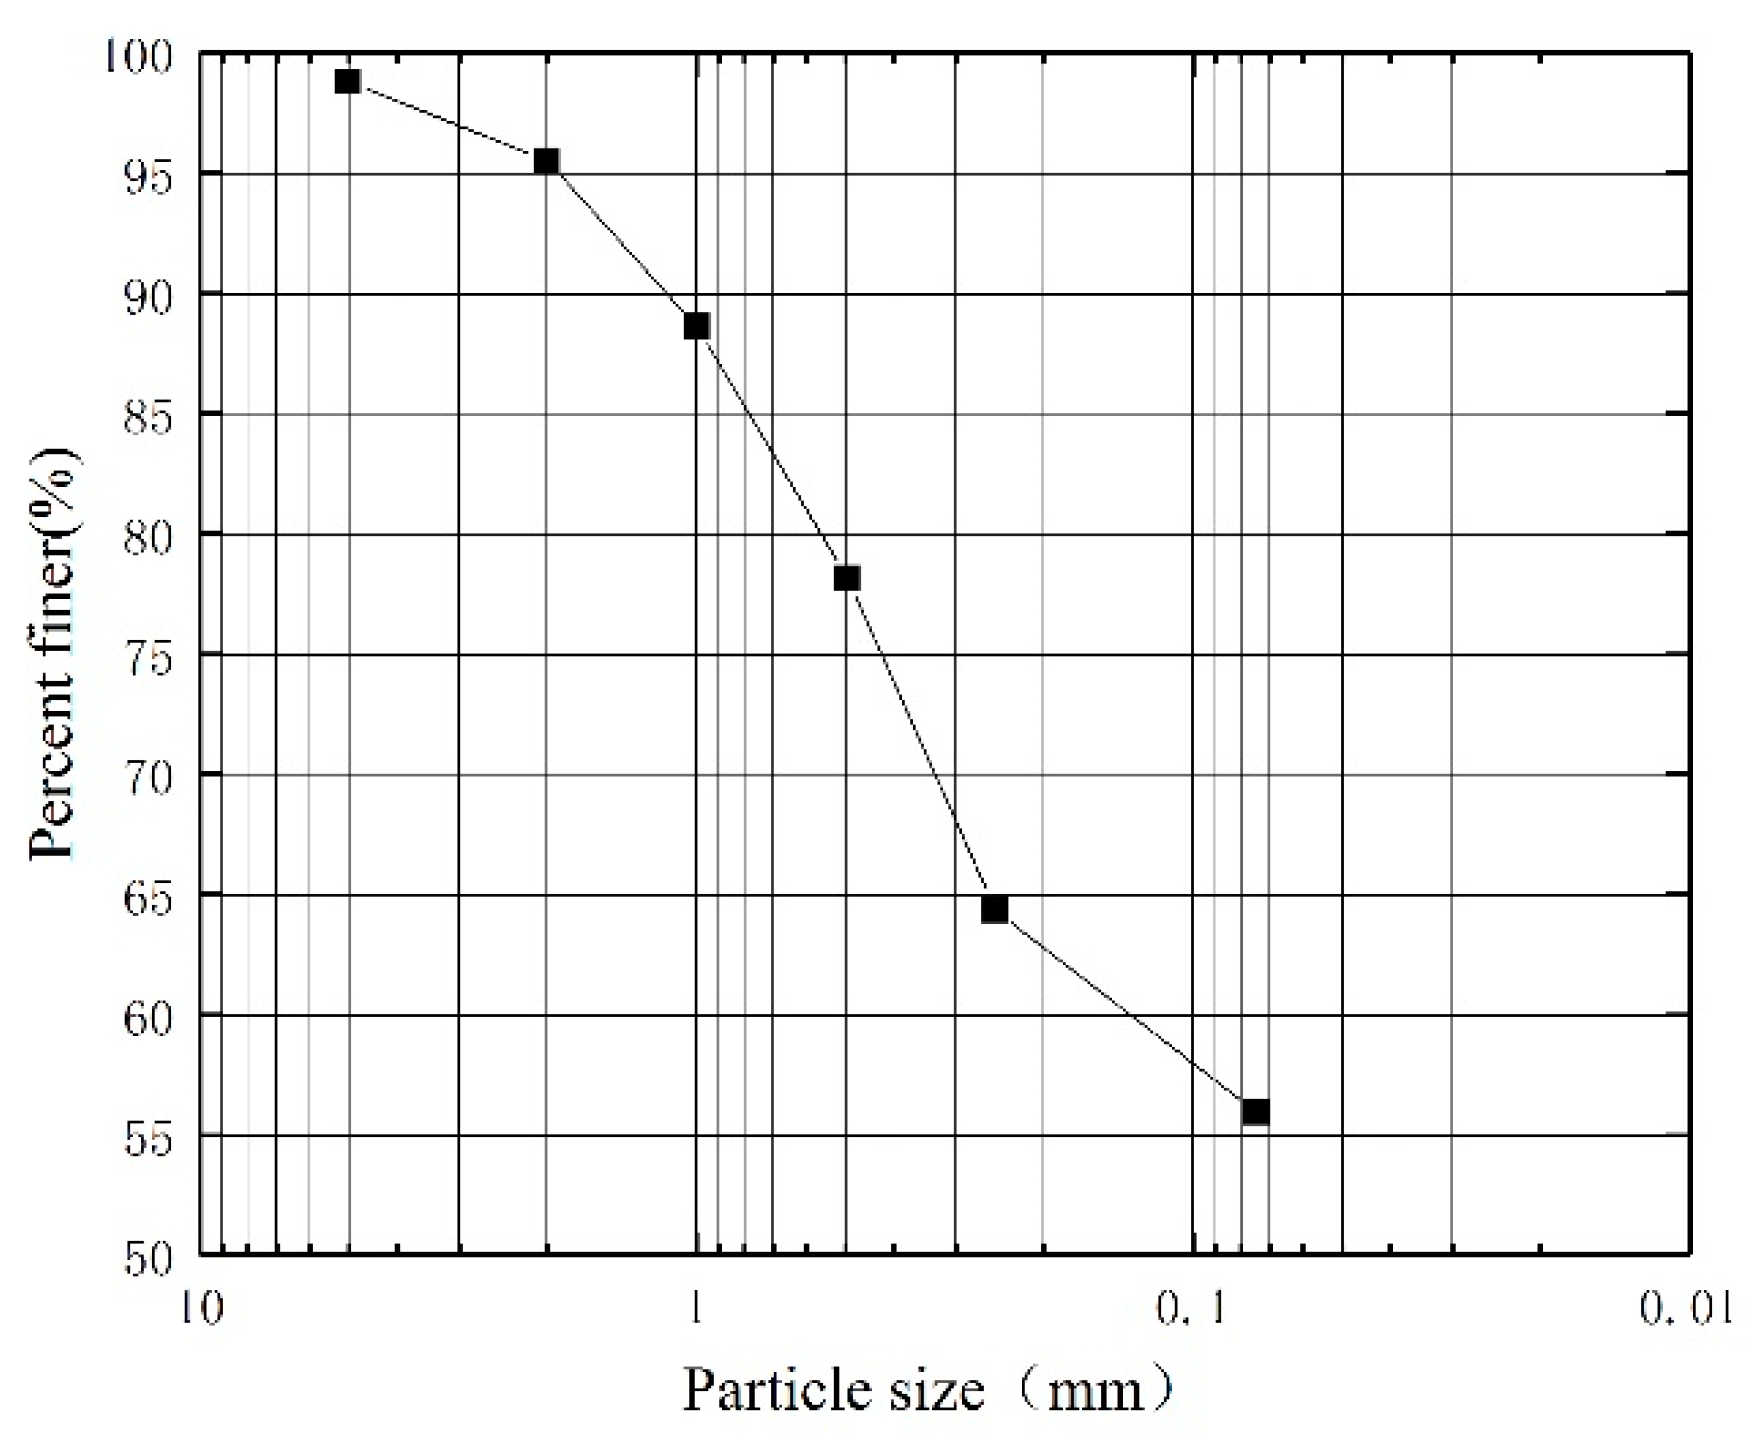
2.2.2. Soil–Water Characteristic Curve

In order to establish the mathematical model of the soil–water characteristic curve, the effective saturation Se defined by the saturated water content and residual water content was introduced, which can be expressed by Equation (3) [30]:
S e = θ θ r θ s θ r
where Se is effective saturation; θs is saturated water content; θr is residual moisture content. When the residual water content is 0, the effective saturation Se equals the soil saturation.
The Van Genuchten model [31] is the most commonly used mathematical model for describing soil–water characteristic curves, as shown in Equation (4). This model has high fitting accuracy for different types of soils and can describe the soil–water characteristic curve in the range of full negative pore water pressure:
S e = 1 [ 1 + ( α φ ) n ] m
where α, m and n are fitting parameters; ψ is matric suction.
Combined with Equation (3), the model can be expressed as:
θ = θ r + θ s θ r [ 1 + ( α φ ) n ] m
The fitting constants of the soil–water characteristic curve model depend on the physical properties of the soil such as pore size distribution and air entry pressure values.
The reason for the change in the hydraulic properties of the vegetated soil is the decrease in pore space and increase in water-holding capacity due to the root system occupying the pore space in the soil. Considering the influence of plant roots on the soil–water characteristic curve, the prediction order of suction change in vegetated soil can be improved, providing the basis for analyzing the stability and erosion resistance of shallow vegetated soil. Leung et al. [32] proposed a predicted model for the pore ratio of rooted soils based on the concept of a root system occupying the volume of the soil pore, as shown in Equation (6):
e = e 0 R v ( 1 + e 0 ) 1 + R v ( 1 + e 0 )
where e0 is Void ratio of bare soil; Rv is the volume ratio of root system, which varies with the depth of soil. See Section 2.2.1 for the volume ratio depth distribution characteristics of vetiver root system.
To simulate the effect of the root system on the water-holding capacity of the soil, Gallipoli et al. [33] proposed an equation with soil porosity ratio as a function; see Equation (7):
S r = [ 1 + ( s e m 4 m 3 ) m 2 ] m 1
where Sr is the saturation of soil mass, s is the matrix suction of soil mass, e is the void ratio, m1, m2, m3 and m4 are all fitting parameters of the model, dimensionless.

3. Results

3.1. Vetiver Root Morphology Characteristics

The Vetiver root system in this experiment is shown in Figure 6. The length, root diameter, and root depth were recorded by manual measurement.
The number of order 1 roots obtained from the experiment is 223, and the number of order 2 and 3 roots is 3158. The root diameters of order 1, order 2, and order 3 roots in each depth section were summed up at a unit depth of 10 mm to obtain the total root diameter of the root system, as shown in Figure 7.
The results show that order 2 and 3 roots are mainly concentrated in the surface layer from 0 to 20 cm, accounting for 73% of the total root system in the soil section. Then, the number of roots decreases with increasing depth. In soils below 20 cm, order 2 and 3 roots are also relatively enriched in some areas but the number is still lower than at the surface layer.
The RAI and Rv of each soil section of the Vetiver root system were fitted. The results showed that the variation in RAI and Rv with depth is consistent with the Gaussian function (Equation (8)), as shown in Figure 8.
f ( z ) = a e ( z b ) 2 / 2 c 2
The fitting results are shown in Table 2. The variation in RAI with depth is roughly similar to the variation in root diameter with soil depth, which resembles an upside-down clock in shape. The root system of the test vetiver has a maximum RAI of 0.05541 at a depth of 18.97 cm. In the surface soil with a depth of 15 cm, the RAI increases with depth. The Rv of vetiver shows a slight increase in the surface soil with a depth of 6 cm, and then it began to decrease with depth in the form of a Gaussian function.

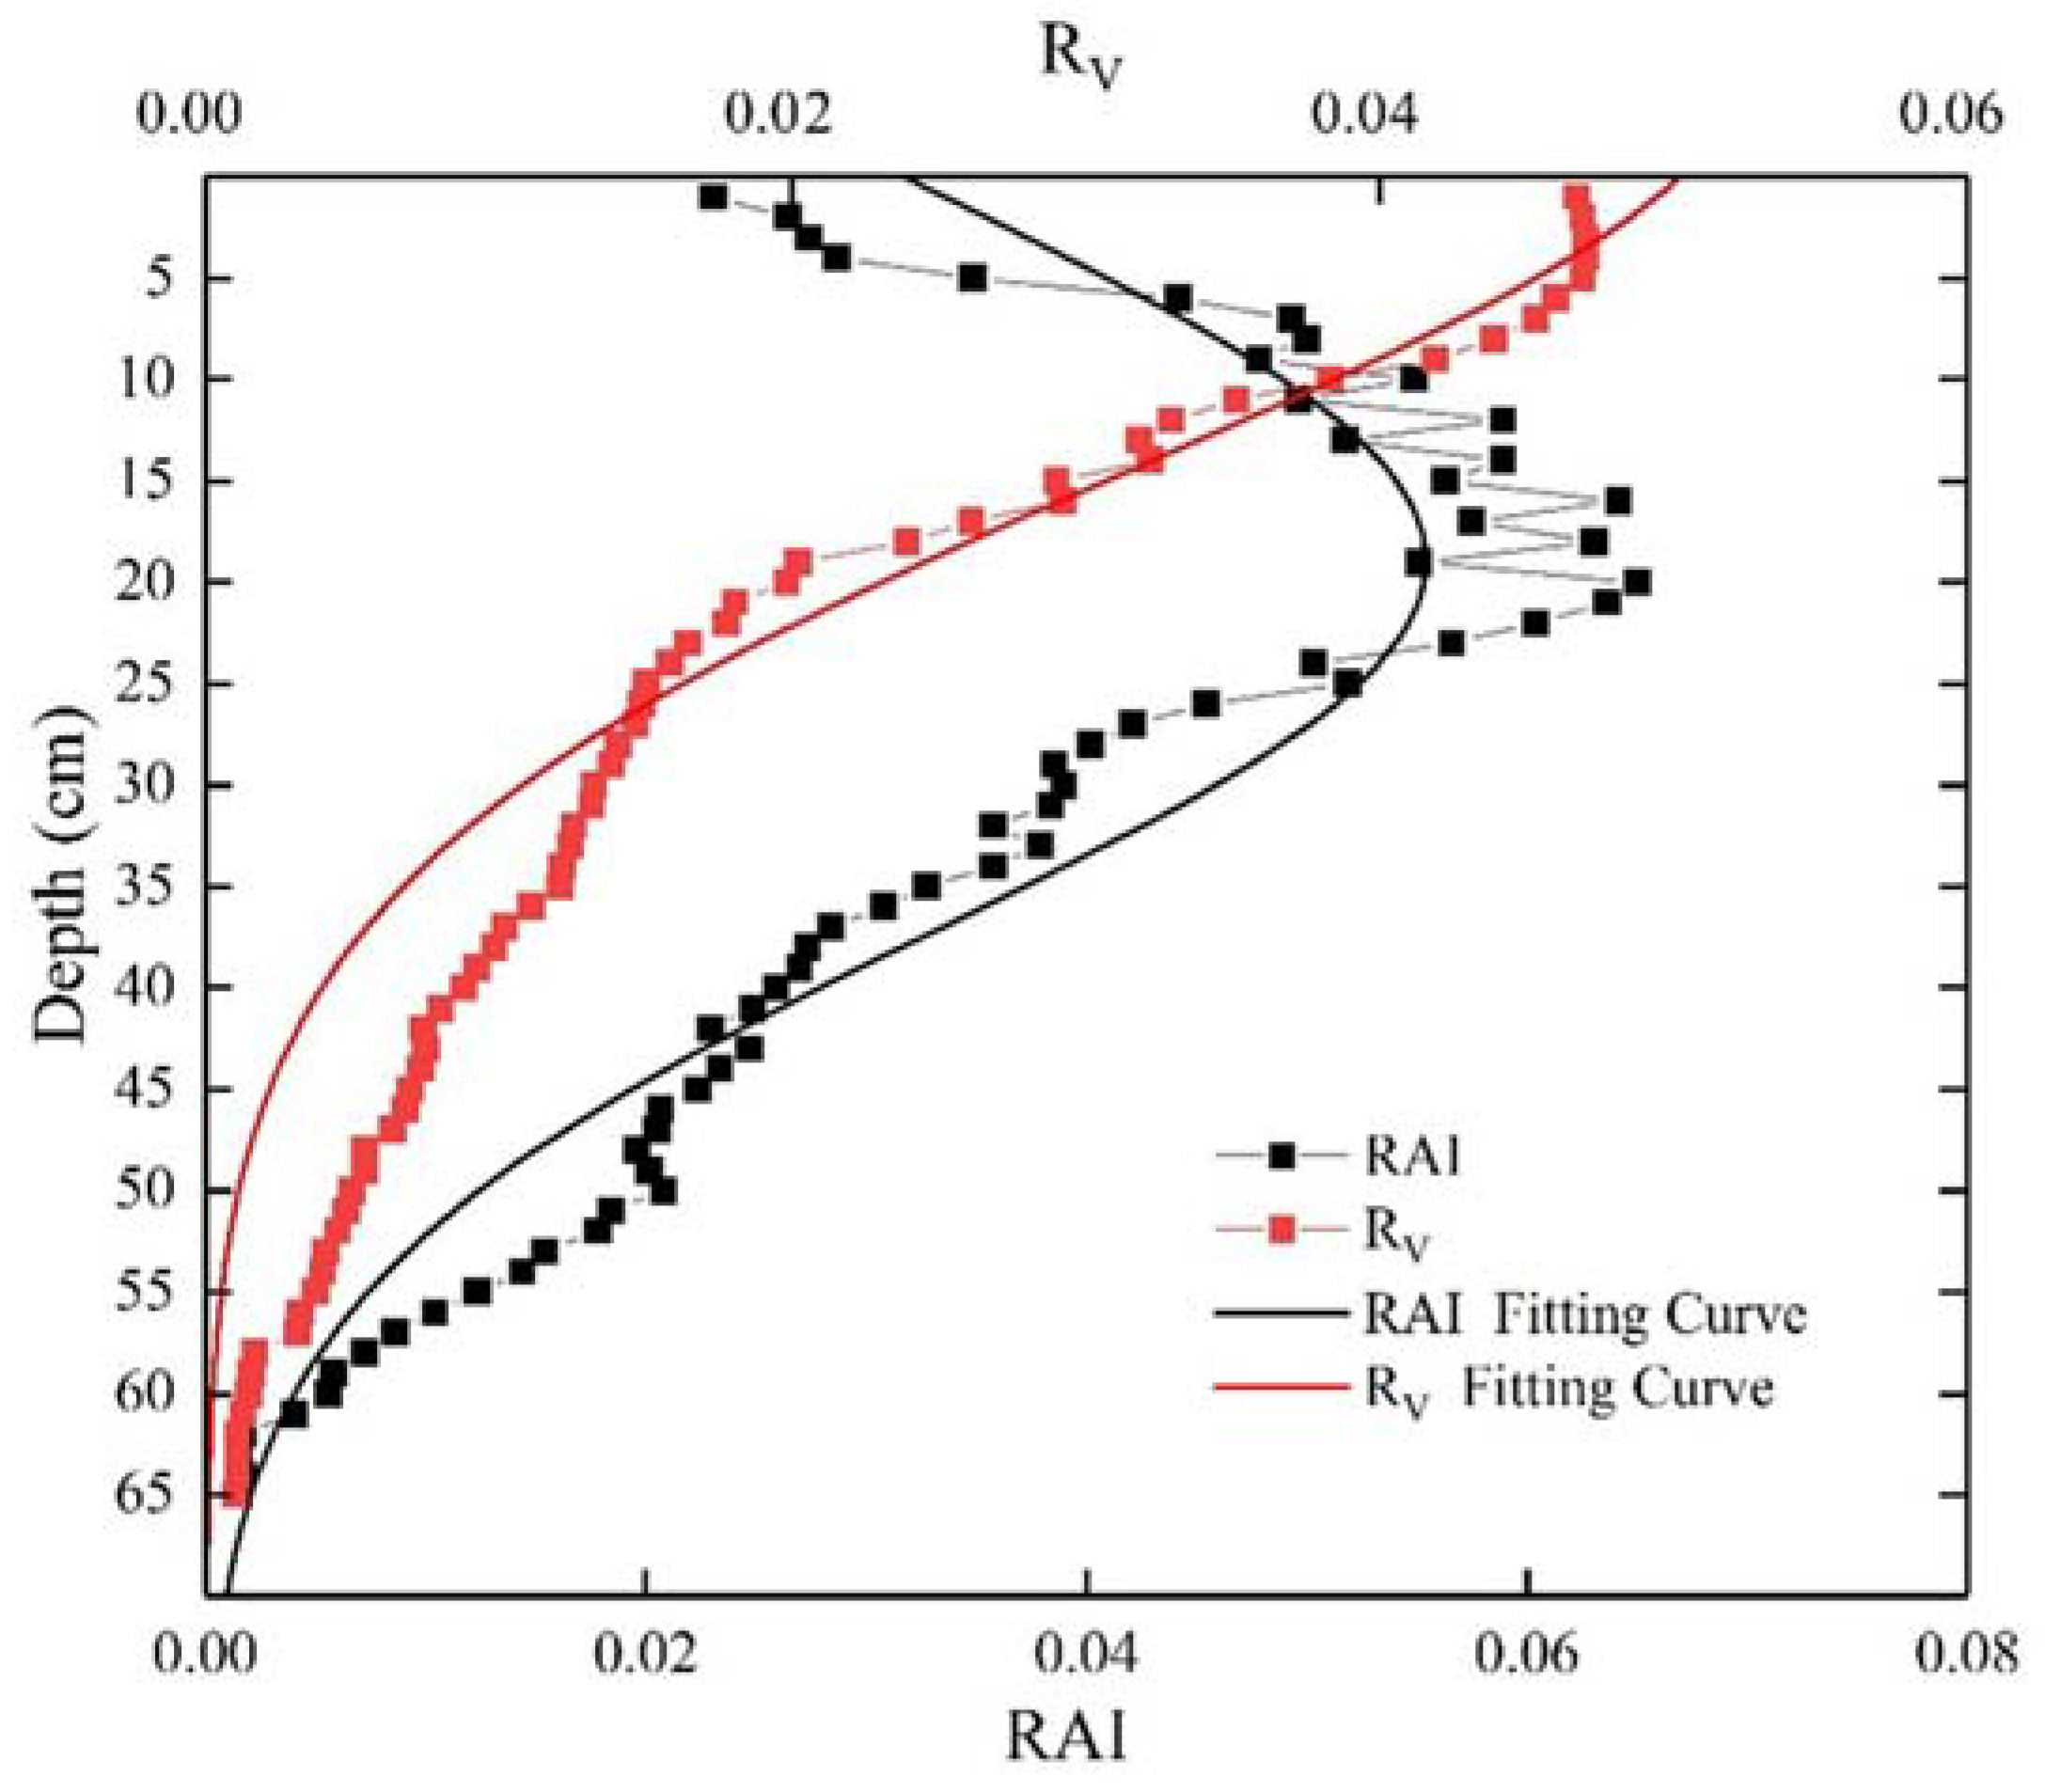
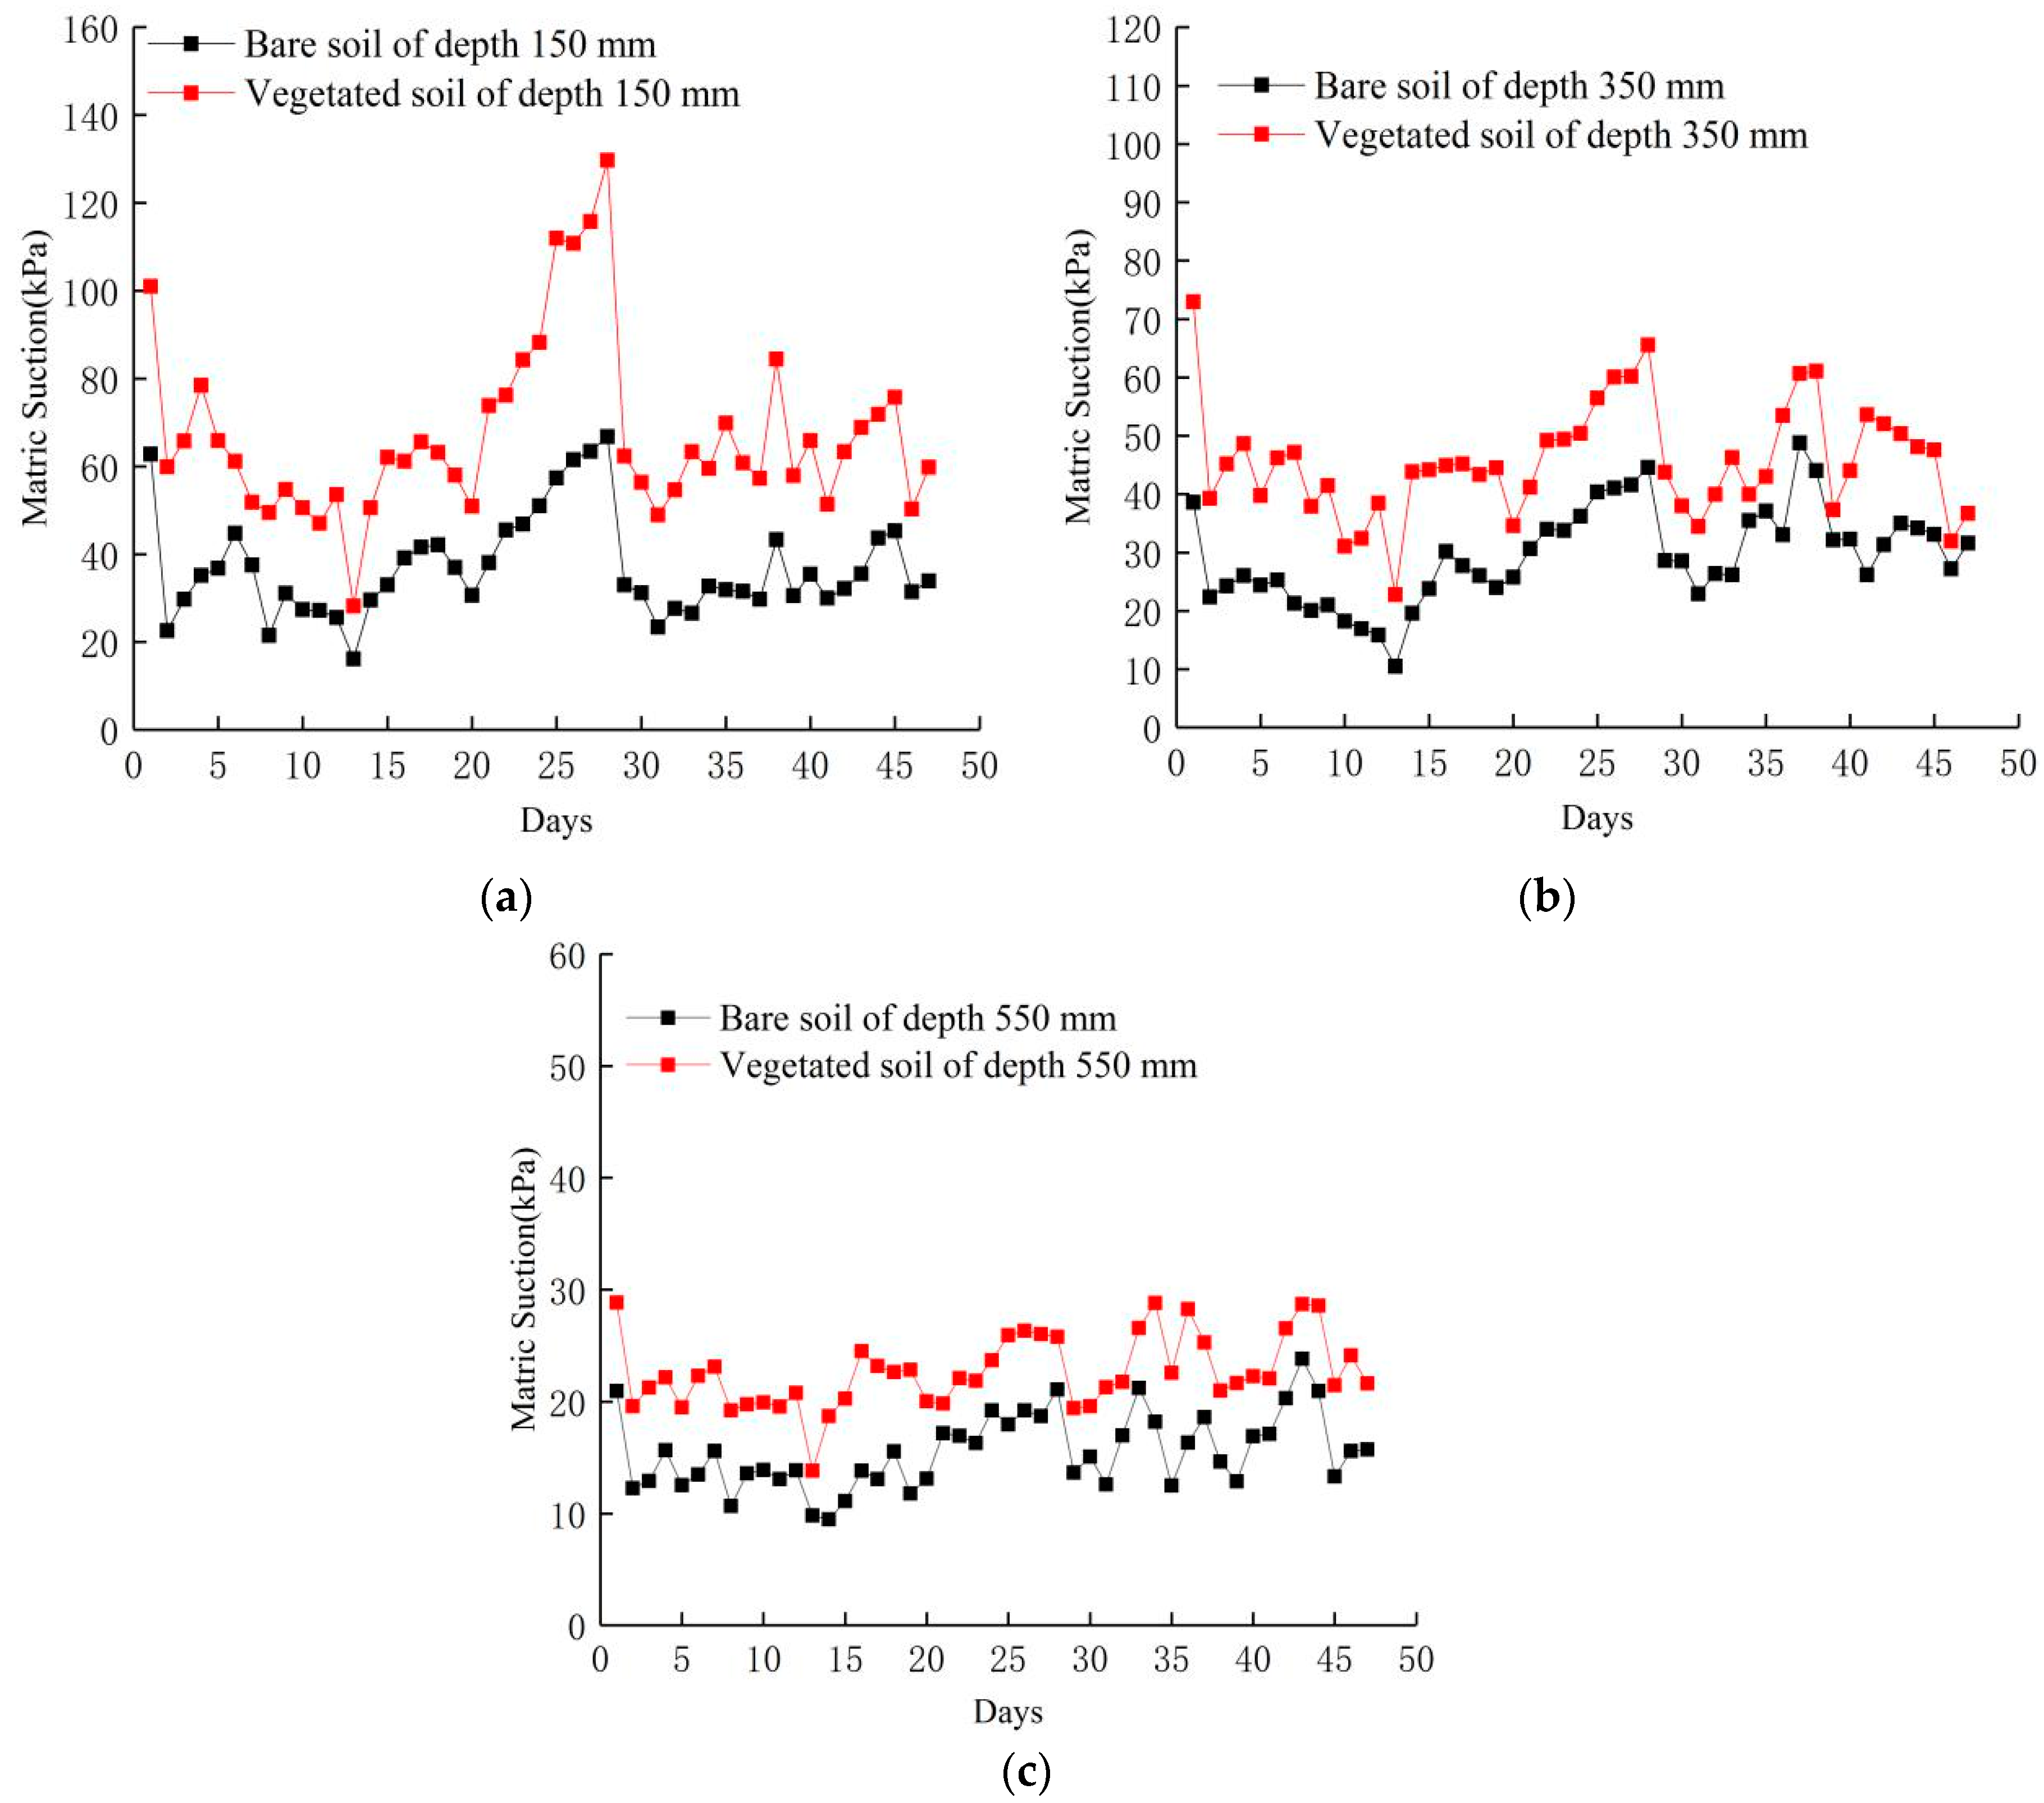
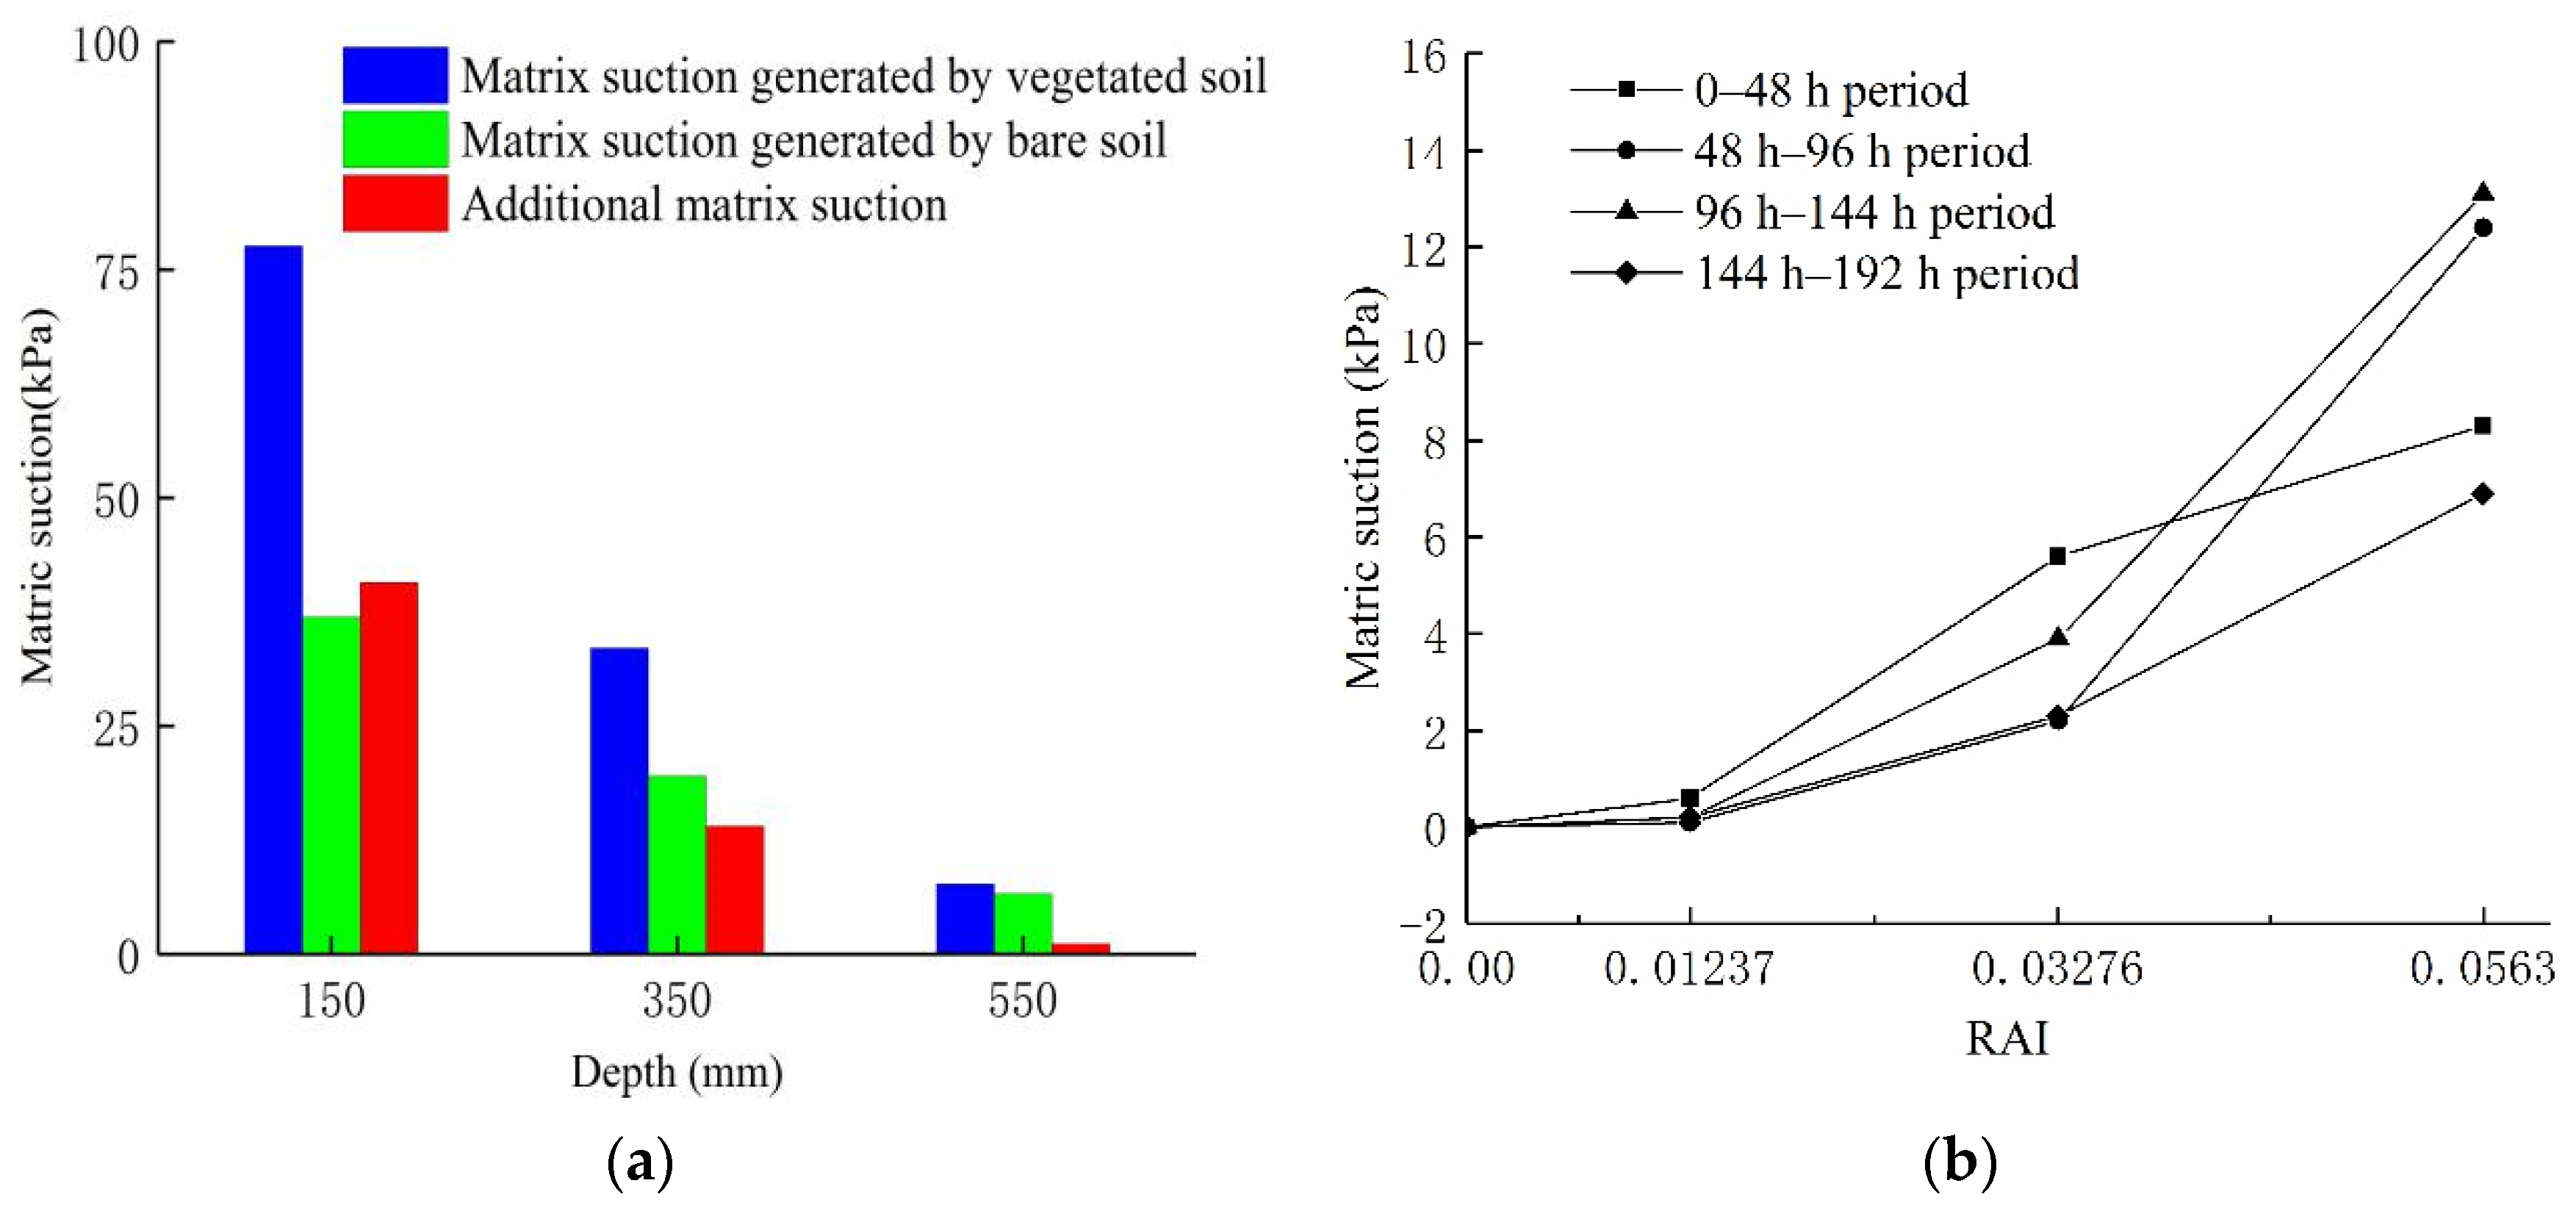
3.2. Influence of Vetiver Root Morphology on Matrix Suction

In this study, the effect of Vetiver transpiration and soil evaporation on side slope suction was studied by comparing and analyzing the changes in matric suction of side slopes with and without plant cover. The suction variation at the slope soil depths of 150 mm, 350 mm, and 550 mm was monitored by a tensiometer buried in the slope soil, and the results are shown in Figure 9.
The magnitude and variation in matric suction of vegetated soil were larger than those for bare soil in the same layer, indicating that the water transpiration effect of plant roots is significant. Compared to bare soil, the root system in the vegetated soil increased the matric suction by absorbing water from the soil, significantly reducing the water content. The root system near the surface soil was more densely distributed and strongly influenced by the atmosphere. Therefore, the soil closer to the slope surface showed a greater variation in matric suction, while the soil in the deeper layer had a smaller variation in matric suction.
Combined with the root morphology, the weather from day 20 to day 28 of the test period has been sunny with zero rainfall, and the slope soil is in a naturally dry state. The effect of transpiration and evaporation of vegetated soil and evaporation of bare soil on the soil matric suction during this period is shown in Figure 10. Table 3 shows the matric suction Δs generated in bare soil and vegetated soil in each period, i.e., Δs = s1 − s0, where s0 is the initial matric suction before soil drying, s1 is the matric suction after 48 h of drying.
From Figure 10a, it can be seen that the matric suction of the bare slope soil varies within 8 days of natural drying, with the greatest variation at a depth of 150 mm, increasing from 29.3 kPa to 66.2 kPa. The suction of the soil grows from 25.8 kPa to 45.3 kPa at a soil depth of 350 mm. The soil located at a depth of 550 mm has the smallest suction increase, growing from 14 kPa to 20.6 kPa. These results indicate a close relationship between the evaporation rate of the soil and the soil depth. The surface soils are strongly influenced by the atmosphere, with stronger evaporation and more significant suction changes than the deeper soils.
Comparing the relationship between RAI and soil matric suction in each soil layer, it can be found that the matric suction generated in the root system is significantly higher than that generated in the bare soil at the same layer. The matric suction of both vegetated soil and bare soil significantly increases at the beginning of the natural drying process (0–48 h). The matric suction of the soil covered by Vetiver reaches 76.6 kPa at a depth of 150 mm, and the matric suction generated by transpiration and evaporation reaches 25 kPa during that time, which is 8.3 kPa higher than that generated by the bare soil. At a soil depth of 350 mm the matric suction of the Vetiver-covered soil reaches 48.3 kPa, and the matric suction generated by transpiration and evaporation is 12.6 kPa, which is 5.6 kPa higher than that generated by the bare soil. At a soil depth of 550 mm, the substrate suction produced by both Vetiver-covered soil and bare soil is at a low order, with the former only 0.6 kPa greater than the bare soil. At 96 h of natural soil drying, the matric suction generated by both vegetated soil and bare soil is lower than that generated in other periods. The matric suction generated by each layer of vegetated soil at this period is 10.5 kPa, 4.7 kPa, and 1.8 kPa, which decreases by 58%, 62.7%, and 47%, respectively. These differences may be caused by the relatively weak evaporation rate of the soil, photosynthesis, and transpiration of the plants in cloudy or low-temperature environments. The enhancement of soil matric suction by plant transpiration is most significant during 96–144 h of the soil drying phase. The enhancement of matric suction is 23.1 kPa in the vegetated soil at a depth of 150 mm, 13.2 kPa higher than that of bare soil.
During the natural drying of the soil, the variation in soil suction in each soil layer was significantly influenced by the RAI of Vetiver roots, as shown in Figure 11.
It can be seen from Figure 11a that due to soil evaporation and plant transpiration, the surface soil is strongly influenced by the atmosphere and is rich in the root system. Therefore, the matric suction generated during natural drying is significantly greater in the surface soil than in the deep soil, where the vegetated soil generates a total of 77.6 kPa of matric suction, which is increased by 40.7 kPa compared to the bare soil. As the root volume in the deep soil decreases, the matric suction generated by the vegetated soil also decreases. At a depth of 550 mm, the matric suction generated by the vegetated soil during drying is only 1.1 kPa higher than that of bare soil.
As shown in Figure 11b, the RAI of the soil layer at a depth of 150 mm is 0.0563. Due to the environmental factors at each time, the matric suction generated by the vegetated soil is 6.9 kPa to 13.1 kPa higher than the bare soil. The RAI of the soil layer at a depth of 350 mm is 0.0328, and the increase in matrix suction generated by the vegetated soil at this depth ranges from 2.2 kPa to 5.6 kPa. For the sparse root system at 550 mm soil layer with an RAI of only 0.0124, the increase in matric suction in the vegetated soil reaches 0.6 kPa at the early drying stage and is less than or equal to 0.2 kPa at all other times. Based on the above results it can be concluded that plant roots can effectively enhance the matric suction during soil drying, and the enhancement increases with the RAI of the root-bearing soil and is affected by environmental factors.

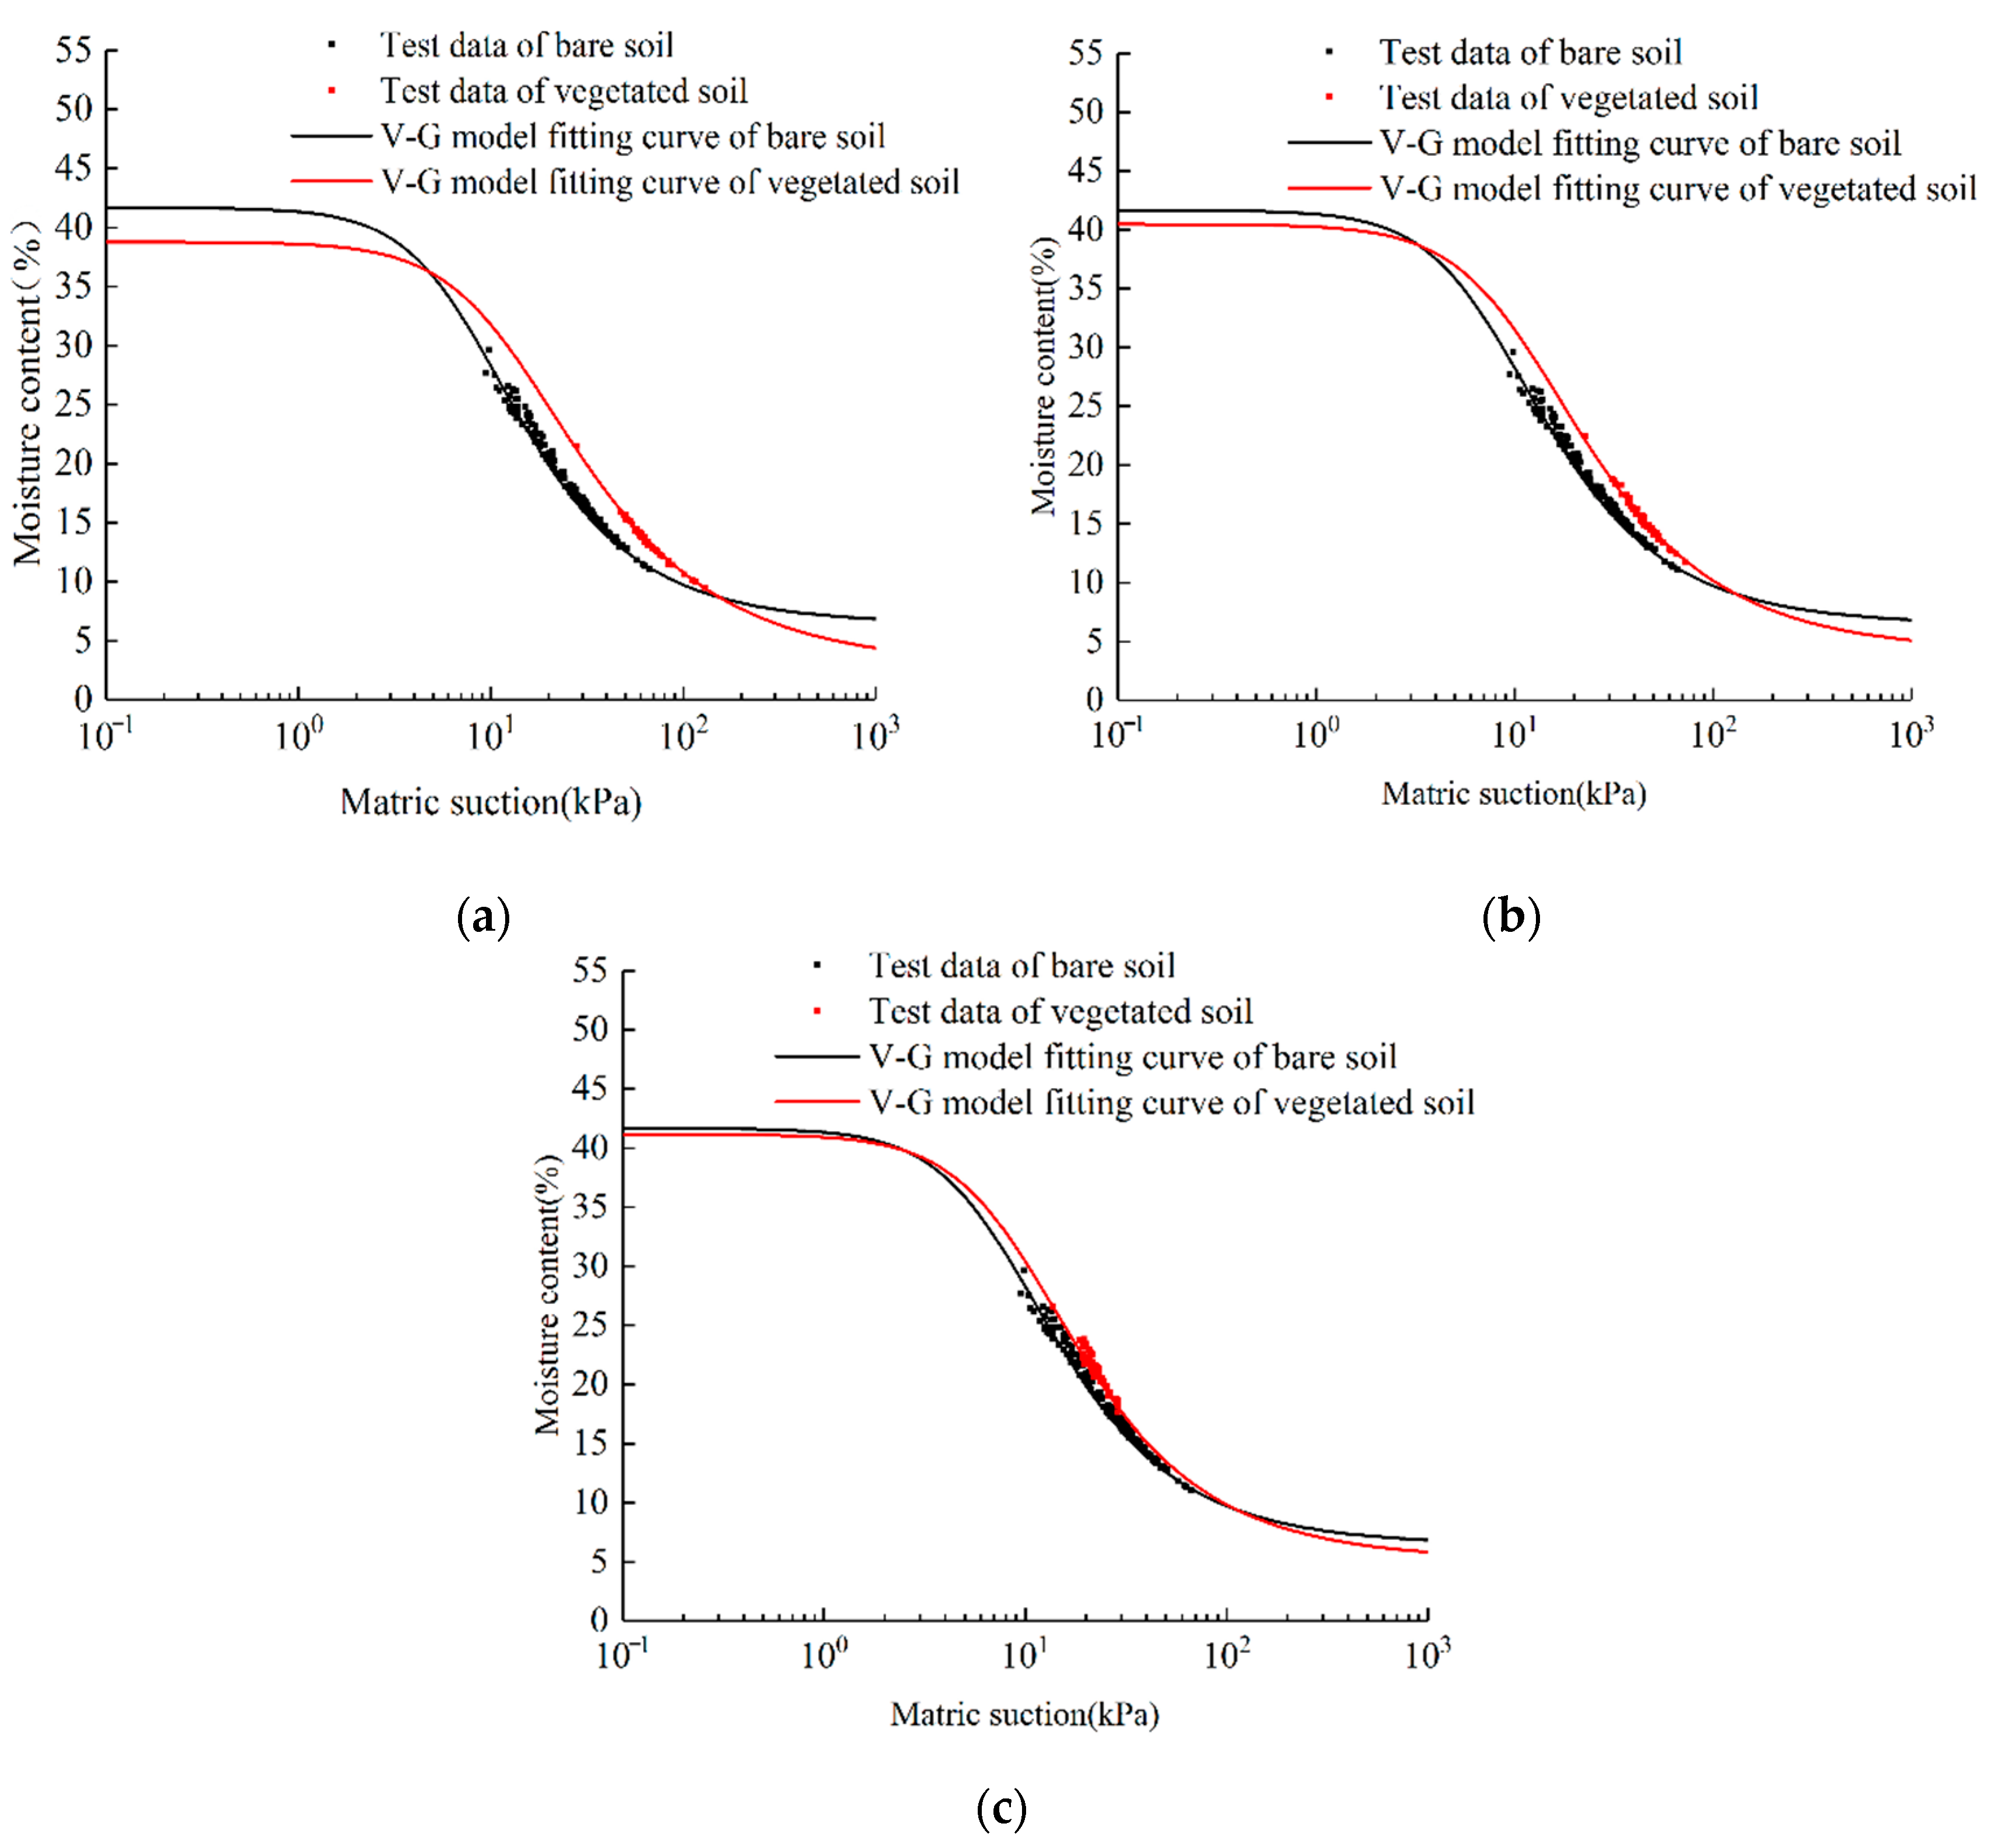
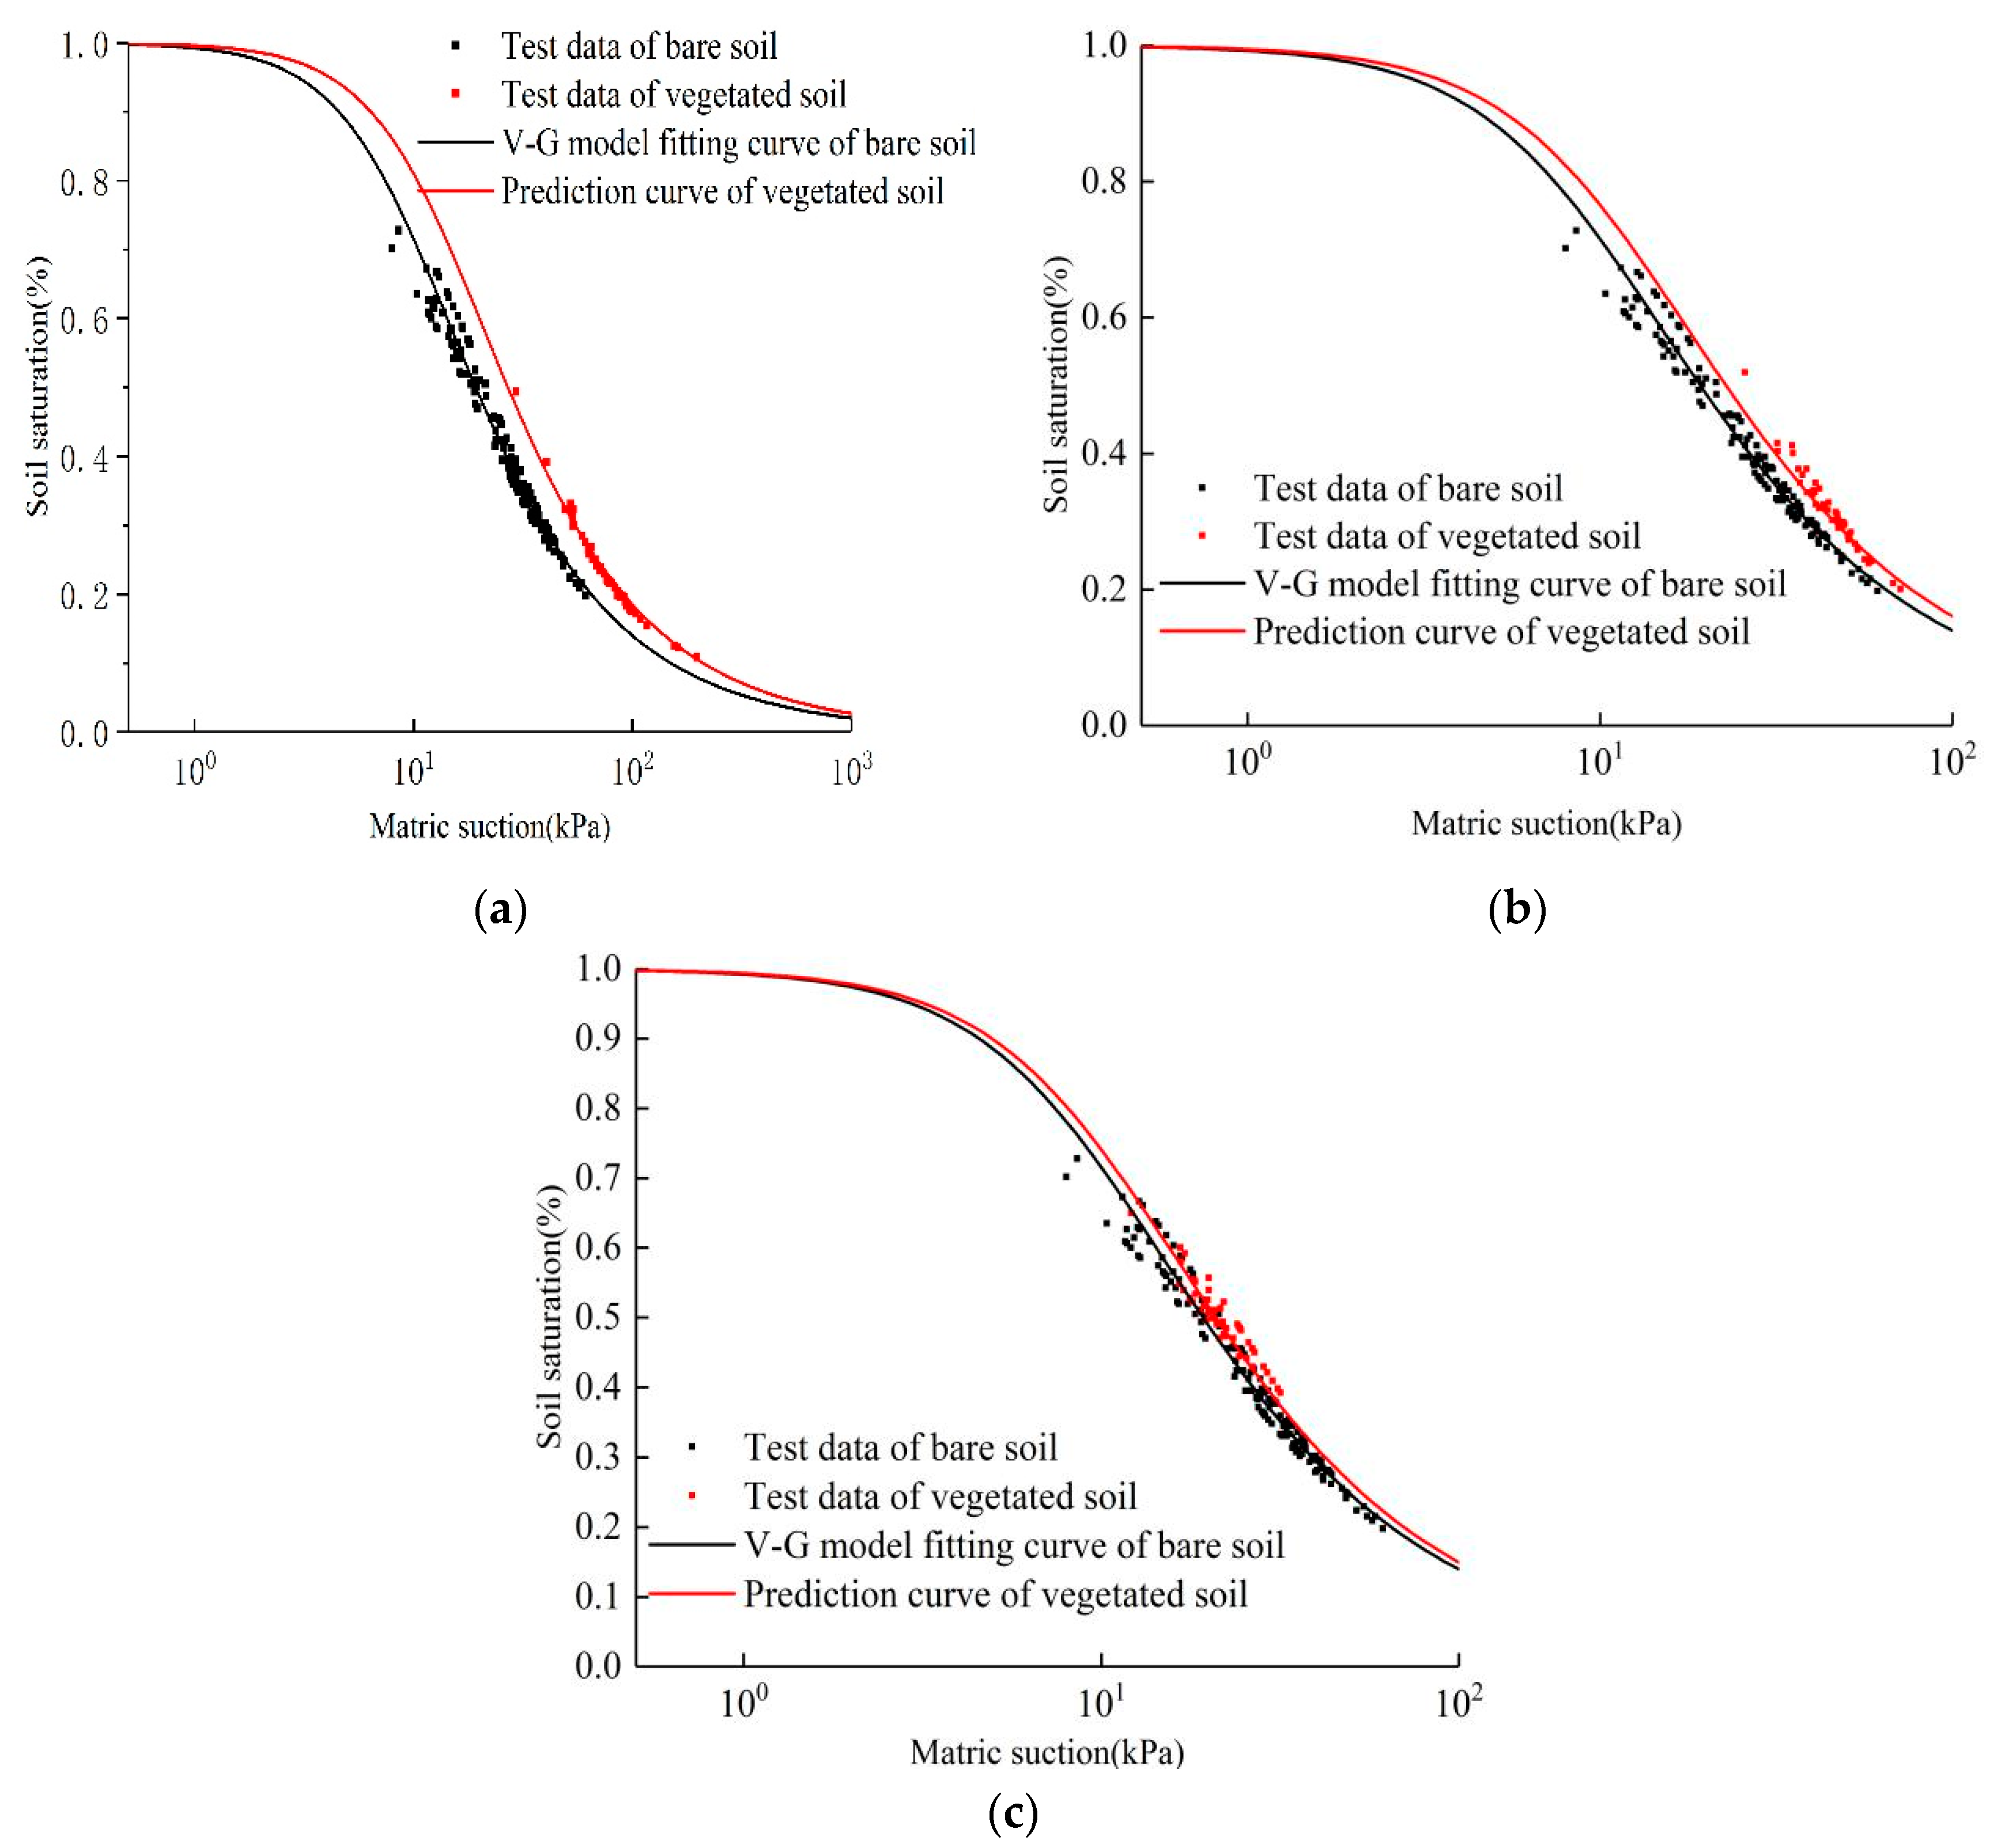
3.3. The Soil–Water Characteristic Curve Model of Vetiver-Covered Slope Soil

The above results suggest that the matric suction of each soil layer varies significantly with the decrease in the volumetric water content during the test period. On this basis, it can be assumed that the soil is in a four-phase state (solid–liquid–gas–shrinkage film) during the whole field test, which can be reflected by the transition of the soil–water characteristic curve.
Because of the limited variation range of water content and matric suction by the natural environment in the field test, it is often difficult to obtain the soil–water characteristic curve in the full suction range. Before fitting the test data to obtain the parameters α, m, and n, the saturated water content θs and the residual water content θr of the soil must be determined first. Because there is no uniform test standard the residual water content θr is generally obtained by fitting. The saturated water content θs can be calculated from the pore ratio e, see Equation (9) [32]:
θ s = e 1 + e
For vegetated soils, the growth of roots occupies part of the soil pore space and changes the pore structure, resulting in a change in pore size. Therefore, the pore ratio of root-penetrated soil can be expressed by Equation (6).
The parameters of the soil–water characteristic curve for each soil sample obtained by fitting the V-G model are shown in Table 4. Soil–water characteristic curves of soil with and without root systems are shown in Figure 12.
It can be seen that the fitted soil–water characteristic curves have three stages, including the boundary effect stage, the transition stage, and the unsaturated residual stage. In the boundary effect stage, the suction of the soil slightly increases and the water content maintains the saturation value. In the transition stage, the suction increases to the air entry suction value of the soil. The gas starts to enter the large pores in the soil, the soil starts to drain, and the water content starts to decrease significantly. In the unsaturated residual stage, the water content is gradually weakened by suction. The water content no longer decreases with the increase in suction at a certain critical point, and the water content at this point is the residual water content.
The soil sample data match the Van Genuchten model, and the fitted coefficients of determination R2 are all greater than 0.9. With the increase in matric suction the soil–water characteristic curves of each soil layer cross near the matric suction of 10 kPa. With further increase in the substrate suction the curves converge again. The saturated volumetric water content of the soil decreases with the increasing Rv of the soil layer, e.g., the saturated water content of the soil at 150 mm decreases by about 2.89% compared with that of the bare soil. The parameter α associated with the air entry value also varies with the Rv of the soil layer, with a larger Rv indicating the smaller the fitting parameter α. At the soil layer with a depth of 550 mm the fitted parameter α is 0.10868 for the vegetated soil, smaller than that for the bare soil (0.13295), and the curve is slightly smoother for the vegetated soil than for the bare soil. The most significant change in the soil–water characteristic curve of the bare soil is found at a depth of 150 mm. For the same water content at a gentler characteristic curve, the matric suction corresponding to the vegetated soil is significantly greater than that of bare soil. These results are of great significance for controlling surface soil erosion and shallow stability.
Determination of the air entry value of the soil–water characteristic curve is necessary for studying unsaturated soils. To obtain the air entry value, it is crucial to determine the inversion point on the soil–water–soil characteristic curve. The calculation process is shown below.
The coordinate of the inversion point is:
{ φ i = 1 α m 1 / n θ i = θ r + θ s θ r ( 1 + 1 / m ) m
After substituting the coordinate of the inversion point into the slope equation, the slope of the inversion point is obtained:
K i = θ ( φ ) = d θ ( φ ) d l g φ = l n ( 10 ) ( θ s θ r ) n [ 1 + 1 / m ] m + 1
After obtaining the coordinate of a point and the slope of the tangent line, the equation of the tangent line at that point can be expressed as:
θ 1 ( 1 + 1 m ) m = ( θ s θ r ) n [ 1 + 1 / m ] m + 1 [ l g φ l g ( 1 / α m 1 n ) ]
Finally, a horizontal tangent line tangent to the soil–water characteristic curve is created at the point (θs, 0), and the coordinate of its intersection with the tangent line of the inversion point is calculated. The obtained horizontal coordinate of the intersection point is the air entry value ψaev of the soil, as shown in Table 5. The results show that the air entry value of the soil increases with the increasing Rv of the soil layer. The air entry value of the bare soil is 3.2337 kPa. The Rv of the vegetated soil at a depth of 150 mm reaches 0.029, significantly increasing the air entry value which is 2.652 kPa higher than that of the bare soil. The presence of the root system also affects the location of the inversion point. With a larger Rv of the soil layer, the horizontal coordinate of the inversion point on the soil–water characteristic curve is larger. This result suggests that the period before the residual stage is prolonged, enhancing the water-holding capacity of the soil. It can be found through Table 5 that the slope of bare soil reaches −0.827 at the inversion point, while the slope of vegetated soil decreases with the increase in Rv. Therefore, the soil–water characteristic curve of vegetated soil can be smoother with increasing Rv compared with that of bare soil. Under the same water content, the matric suction of vegetated soil is greater than that of bare soil.
The presence of the root system has a significant and regular effect on the soil–water characteristic curve of the soil. The relationship between the soil–water characteristic curve parameters and Rv based on the V-G model is shown in Figure 13.
It can be seen from Figure 13a that when Rv is 0 (the soil does not contain roots), the value of α is 0.13295. When Rv is 0.029, the value of α decreases to 0.07981. Consistent with the reference [34], the value of parameter α in the V-G model tends to decrease with increasing Rv, with lower α indicating a higher air entry value. When Rv is 0, the α value reaches its maximum, corresponding to the minimum air entry value of 3.2337 kPa. When Rv is 0.029, the α value reaches its minimum and its corresponding air entry value reaches the maximum of 5.8857 kPa. Therefore, the air entry value of the soil increases with the increase in Rv.
As can be seen in Figure 13b, the values of the fitted parameters n of the V-G model for the test soil range from 1.7231 to 1.916, which increases with Rv.

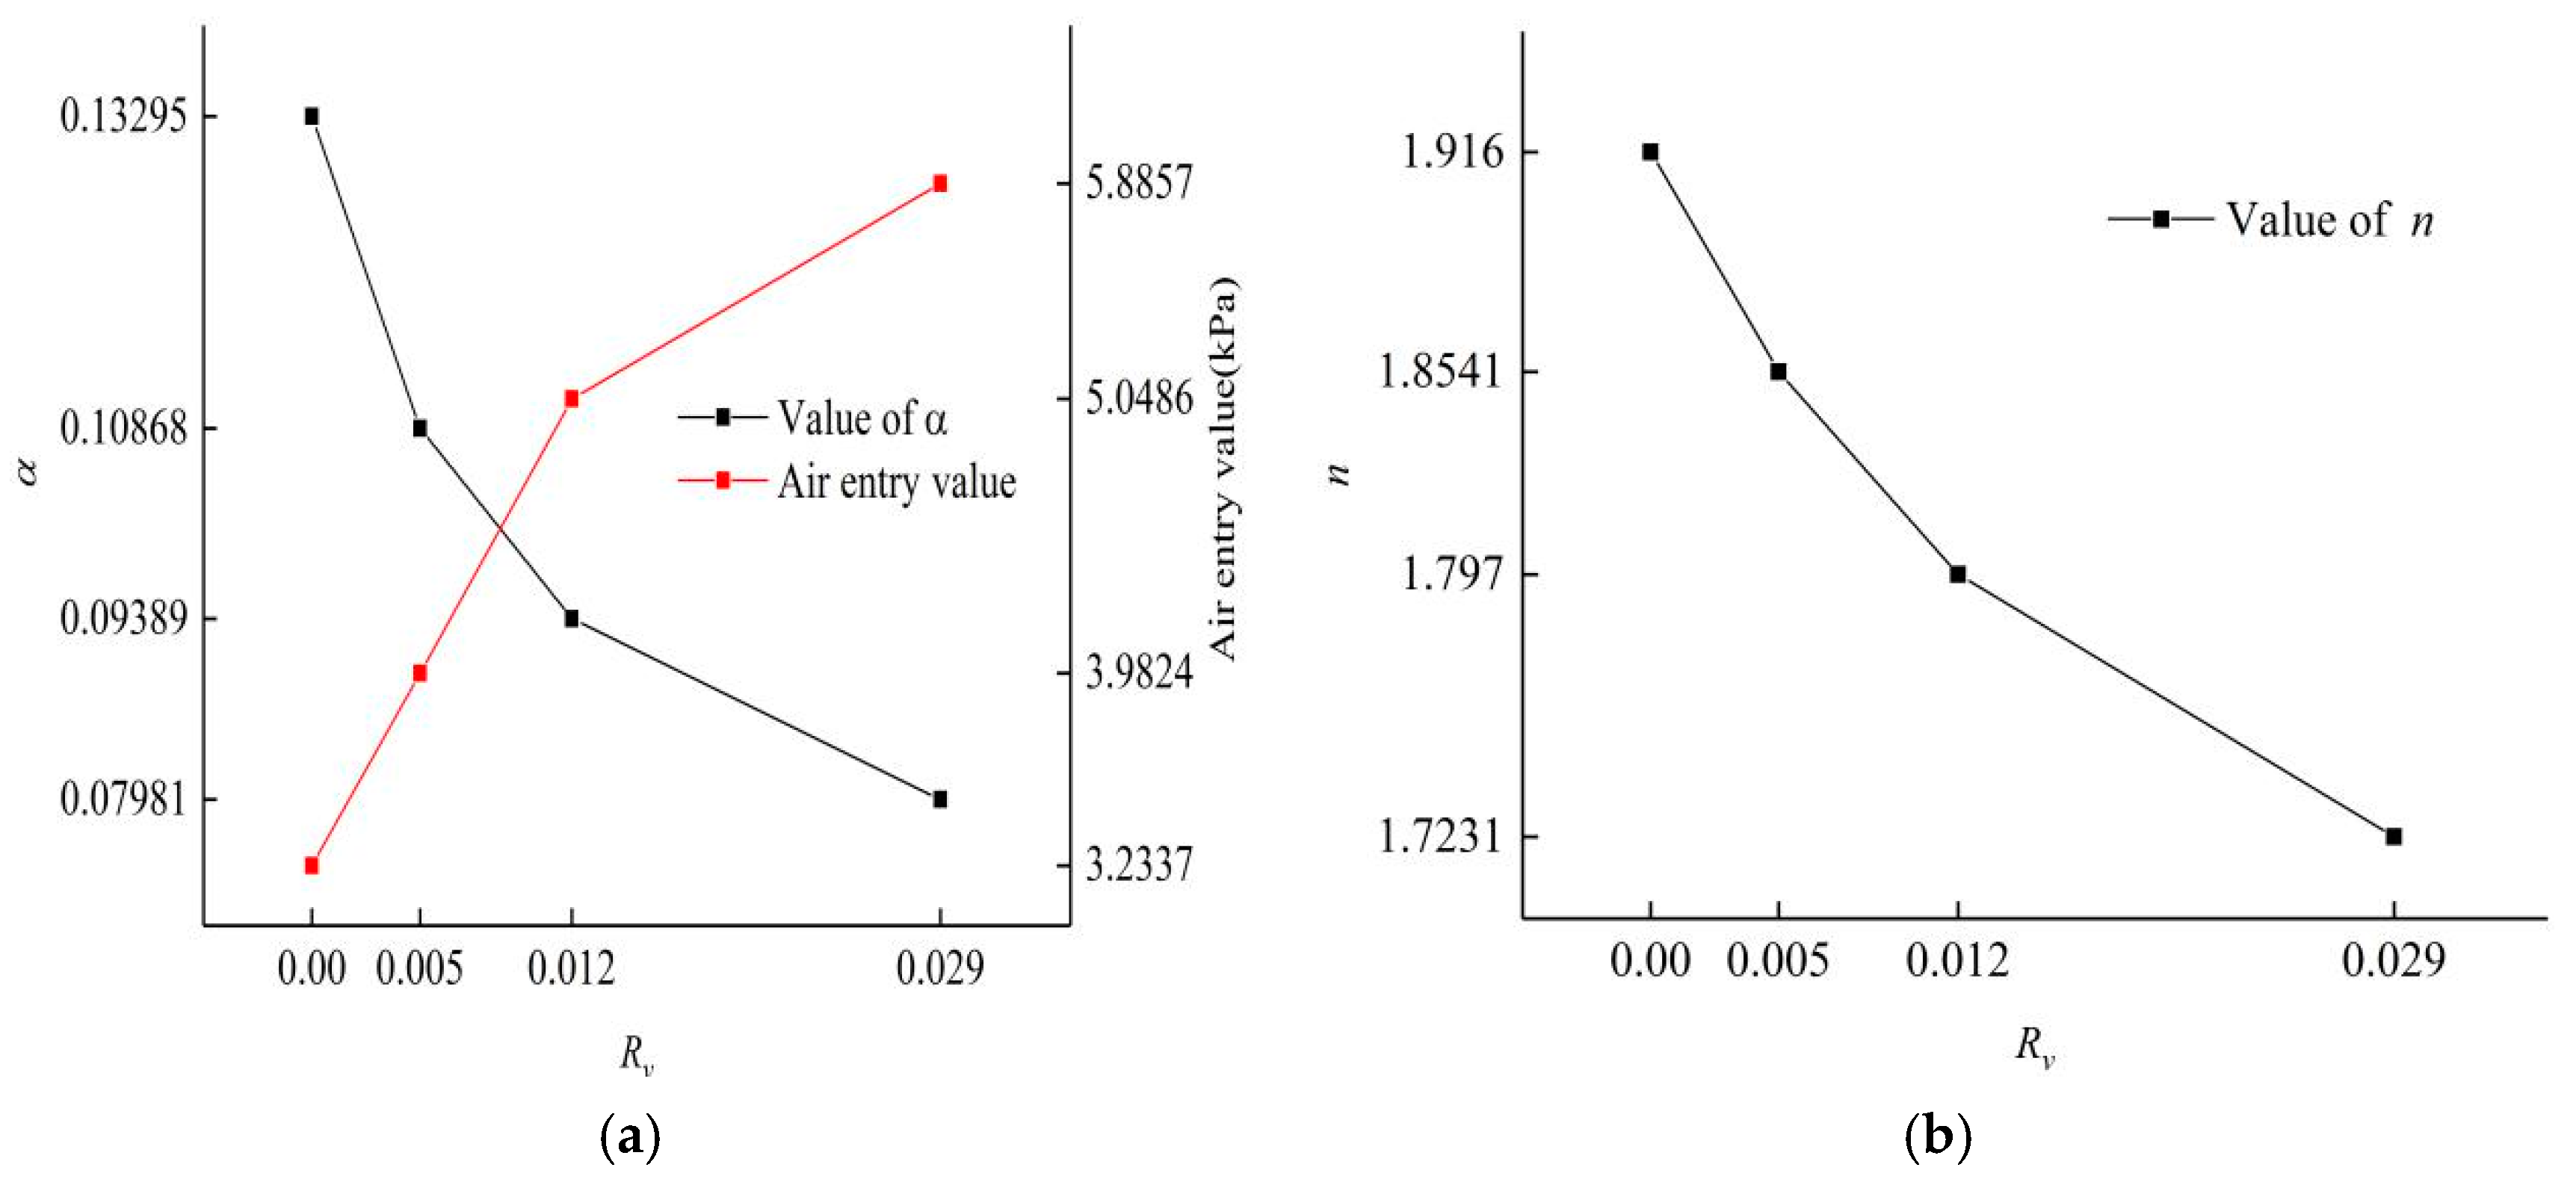
3.4. Prediction of the Soil–Water Characteristic Curve by Rv

The soil–water characteristic curves of both bare soil and vegetated soil are obtained using the V-G model, better characterizing the relationship between volumetric water content and matric suction of the soil. To better visualize the effect of plant roots on the soil–water characteristic curve, the equation related to the porosity ratio proposed by Gallipoli et al. [33] is adopted to investigate the effect of Rv on the water-holding capacity of the soil. Four fitting parameters (m1, m2, m3, and m4) are obtained by fitting the Gallipoli model to the test data points of bare soil, as shown in Table 6. Finally, the soil–water characteristic curve of the vegetated soil is obtained by combining the parameter Rv of the root system based on the soil–water characteristic curve, as shown in Figure 14.
From Figure 14, it can be found that the prediction curves obtained from the parametric root volume ratio Rv of the root system are in good agreement with the measured values. By analyzing the soil–water characteristic curves of the three sets of soil samples with roots, it can be seen that the presence of roots increases the air entry value of the soil.

4. Discussion

Compared with Li’s research [28] on the morphology of biennial vetiver root system, the results show that the distribution of Vetiver roots in depth direction exhibits similar patterns in different growth periods. The root system of vetiver is very dense within 0~20 cm below the ground surface. With the increase in soil depth, the biomass of grass root system decreases regularly [35]. It is more economical for plants to grow their roots closer to the soil surface where they can exploit most of the available nutrients and water from natural rainfall [36]. Vetiver grass belongs to the vertical root type, and its root group diffusion range is about 20~25 cm in diameter. The diffusion range of the Vetiver root group sampled in this study is 21.5 cm in diameter. The growth range of vetiver root group first increased and then decreased with the depth of soil layer, and its distribution conforms to the Gauss curve [28]. According to the change pattern of RAI with depth (Figure 7), it can be inferred that during the growth period the vetiver root system mainly produces more order 2 and 3 roots through order 1 roots, so as to meet the demand of expanding around the soil and absorbing more water and nutrients.
In this study the transpiration of plant roots is obvious. Compared with bare soil, where there is only soil evaporation, the roots in vegetation soil absorb water from the soil, thereby greatly reducing the soil moisture content and increasing the soil matrix suction. Ng [8] found that after 20 days of plant transpiration test, the maximum suction of Bermuda grass vegetation soil can reach 1.3 times that of bare soil, which is similar to the test results in this paper: the vegetation soil with the largest root surface area index RAI produces 40.7 kPa more than that of bare soil in the 8-day natural drying process. Moein et al. [37] also found that soil–water content was negatively correlated with very fine root density (length and biomass) by studying the relationship between root distribution and soil–water content of C. japonica and C. obtusa.
Rahardjo et al. [38] found that roots increased the air entry value of silty soils by about 4 kPa. Yan [39] also showed that silty soils were affected by the root system, with the air entry value increasing by about 3 kPa. The conclusions in the present study are similar to those of the above studies. In the study of the parameter n of the V-G model, Chen et al. [40] found that the flatness of the soil–water characteristic curve was affected by the value of parameter n, with a smaller n value indicating a higher flatness degree. There is a correlation between the n value and the pore size distribution of the soil. When the pore size distribution of the soil is uniform (the filling effect of the pore space between each soil group is poor), the n value is larger and the curve is steeper. Thus, it can be assumed that the presence of roots has a similar effect to the increased grain size of the soil for improving soil gradation.
Leung et al. also found similar changes caused by roots in soil–water characteristic curves [32]. Both the measured results and the Gallipoli model prediction curves show that the roots of plants can enhance the air entry value and the water-holding capacity of the soil. Romero et al. [41] and Ng et al. [42] also demonstrated that a lower porosity ratio indicated a higher air entry value of the soil.

5. Conclusions

In this study, Vetiver, a common slope protection plant, was selected as the test object, the root morphology of Vetiver was analyzed, and the characteristic parameters of root morphology were obtained. Through outdoor tests, the matric suction and moisture content of soil at different soil depths with or without plant coverage was measured, the variation rules of soil moisture content and matric suction under the action of plant roots were studied, and the relationship between root morphology and matric suction variation was analyzed. Through fitting the test data, the soil–water characteristic curves of soil layers at different depths with or without vegetation coverage were obtained. The soil–water characteristic curve model of slope soil considering the root form of Vetiver grass was established. The effects of root volume ratio on air entry value, saturated water content, and parameters of the V-G model were studied. The main conclusions are as follows:
The root surface area index RAI and root volume ratio Rv of each soil section of the Vetiver root system varied with depth in accordance with the Gaussian function distribution.
In the process of natural drying, the matric suction generated within the root system is significantly higher than that generated by the evaporation of bare soil in the same soil layer. The ability of vegetation soil to enhance soil matrix suction increases with the increase in soil root surface area index.
The V-G model fits the discrete data points of matrix suction and water content of bare soil and Vetiver vegetation soil obtained from the test well. Through the analysis of the soil–water characteristic curve of soil with or without vegetation coverage, it is found that a larger root volume ratio of soil leads to smaller α and n. As a result, the air entry value is larger, and the soil–water characteristic curve is gentler. Under the same water content, the matric suction corresponding to vegetation soil is obviously greater than that corresponding to bare soil.
According to the soil–water characteristic curve model related to the void ratio proposed by Gallipoli and the root volume ratio Rv of soil, the soil–water characteristic curve of vegetation soil is predicted. The results show that the method in this study can effectively predict the soil–water characteristic curve of vegetation soil mass. Furthermore, the steps are simplified by this method, thus obtaining the soil–water characteristic curve of vegetation soil mass when the plant root morphology characteristic parameters are available.

Author Contributions

Conceptualization, X.W. and Z.L.; methodology, X.W. and Z.L.; software, X.W.; validation, Y.C., Y.Y. and Z.L.; formal analysis, Y.C.; investigation, X.W. and Z.L.; resources, Z.L.; data curation, X.W.; writing—original draft preparation, X.W. and Y.Y.; writing—review and editing, X.W. and Y.C.; visualization, Y.C.; supervision, Z.L.; project administration, Z.L.; funding acquisition, Y.Y. All authors have read and agreed to the published version of the manuscript.

Funding

This research was funded by the Key Research and Development Program of Hunan Province, grant number 2021SK2050; the National Natural Science Foundation of China, grant number 51908562; the Science and Technology Project of the Department of Transportation of Jiangxi Province, grant number 2022H0024; the Research Foundation of Education Bureau of Hunan Province, China, grant number 19B581; the Standardization Project of Hunan Province; the Natural Science Foundation of Hunan Province, grant number 2020JJ5987.

Institutional Review Board Statement

Not applicable.

Informed Consent Statement

Not applicable.

Data Availability Statement

Not applicable.

Conflicts of Interest

The authors declare no conflict of interest.

References

  1. Zeng, L.X.; Xiao, L.; Zhang, J.-H.; Gao, Q.-F. Effect of the characteristics of surface cracks on the transient saturated zones in colluvial soil slopes during rainfall. Bull. Eng. Geol. Environ. 2020, 79, 11. [Google Scholar] [CrossRef]
  2. An, R.; Cai, J.R.; Qin, Y. Analysis on effect of vegetation root-system morphology on slope stability. Water Resour. Hydropower Eng. 2018, 49, 7. [Google Scholar]
  3. Zhang, J.-H.; Li, F.; Zeng, L.; Zheng, J.-L.; Zhang, A.-S.; Zhang, Y.-Q. Effect of cushion and cover on moisture distribution in clay embankments in southern China. J. Cent. South Univ. 2020, 27, 14. [Google Scholar] [CrossRef]
  4. Zhou, Y.Y.; Chen, J.P.; Wang, X.M. Progress of study on soil reinforcement mechanisms by root and its expectation. Ecol. Environ. 2012, 21, 7. [Google Scholar]
  5. Li, X.-W.; Kong, L.-W.; Guo, A.-G. Permeability and mechanical characteristics of expansive soil and cut slope protection mechanism under vegetation action. Rock Soil Mech. 2013, 34, 7. [Google Scholar]
  6. Zhang, D.; Wang, B. Mechanics Research on Vetiver Grass in Railway Side Slope Protection. Bull. Soil Water Conserv. 2006, 26, 3. [Google Scholar]
  7. LI, S.; Sun, H.; Yang, Z.; He, L.; Cui, B. Mechanical Characteristics of Interaction between Root System of Plants and Rock for Rock Slope Protection. Chin. J. Rock Mech. Eng. 2006, 25, 2051–2057. [Google Scholar]
  8. Ng, C.W.W. Atmosphere-plant-soil interactions: Theories and mechanisms. Chin. J. Geotech. Eng. 2017, 39, 47. [Google Scholar]
  9. Jie, H.; Jun, G. Geosynthetics used to stabilize vegetated surfaces for environmental sustainability in civil engineering. Front. Struct. Civ. Eng. 2017, 11, 10. [Google Scholar]
  10. Cheng, H.; Zhang, X.Q. An Experimental Study on Herb Plant Root System for Strength Principle of Soil-fixation. Bull. Soil Water Conserv. 2002, 22, 4. [Google Scholar]
  11. Hongbin, X.I.A.O.; Liang, Z.H.A.O.; Zhenyu, L.I.; Weidong, L.; Wen, Y.; Qingqing, T.; Wei, L. Experimental study on Vetiveria zizanioides root system distribution and tensile strength. J. Cent. South Univ. For. Technol. 2014, 3, 5. [Google Scholar]
  12. Deljouei, A.; Abdi, E.; Schwarz, M.; Majnounian, B.; Sohrabi, H.; Dumroese, R.K. Mechanical Characteristics of the Fine Roots of Two Broadleaved Tree Species from the Temperate Caspian Hyrcanian Ecoregion. Forests 2020, 11, 345. [Google Scholar] [CrossRef] [Green Version]
  13. Deljouei, A.; Cislaghi, A.; Abdi, E.; Borz, S.A.; Majnounian, B.; Hales, T.C. Implications of hornbeam and beech root systems on slope stability: From field and laboratory measurements to modelling methods. Plant Soil 2022. [Google Scholar] [CrossRef]
  14. Qiao, J. Present situation of landslide disaster and prevention countermeasures in China. J. Nat. Disasters 2007, 16, 7. [Google Scholar]
  15. Liu, W. Study on Hydrological Effect of Plant Slope Protection and Its Influence on Slope Stability; Central South University of Forestry and Technology: Changsha, China, 2017. [Google Scholar]
  16. Yang, F.; Cheng, J.; Zhang, H.; Zhou, Z. Effect of Herb Plants on Soil Detachment and Erosion Dynamics. Trans. Chin. Soc. Agric. Mach. 2016, 47, 9. [Google Scholar]
  17. Shan, Y.; Xie, J.; Lei, N. Spatial Distribution Characteristics and Influencing Factors of Soil Moisture on Loess Cutting Slope. Bull. Soil Water Conserv. 2014, 34, 5. [Google Scholar]
  18. Chen, J..-L.; Li, J.-H.; Cheng, P.; Song, L.; Zhou, T. Field test on seepage performance of soil cover with different types of vegetation. Rock Soil Mech. 2018, 39, 7. [Google Scholar]
  19. Ide, J.I.; Shinohara, Y.; Higashi, N.; Komatsu, K.; Otsuki, K. A preliminary investigation of surface runoff and soil properties in a moso-bamboo (Phyllostachys pubescens) forest in western Japan. Hydrol. Res. Lett. 2010, 4, 5. [Google Scholar] [CrossRef] [Green Version]
  20. Ng, C.W.W.; Leung, A.K.; Woon, K.X. Effects of soil density on grass-induced suction distributions in compacted soil subjected to rainfall. Can. Geotech. J. 2014, 51, 11. [Google Scholar] [CrossRef]
  21. Wang, D.L.; Luan, M.T.; Yang, Q. Experimental study of soil-water characteristic curve of remolded unsaturated clay. Rock Soil Mech. 2009, 30, 6. [Google Scholar]
  22. Li, Z.Q.; Hu, R.L.; Wang, L.C.; Li, Z.X. Study on SWCC of unsaturated expansive soil. Rock Soil Mech. 2006, 27, 15. [Google Scholar]
  23. Sun, D.A.; You, G.; Annan, Z.; Daichao, S. Soil–water retention curves and microstructures of undisturbed and compacted Guilin lateritic clay. Bull. Eng. Geol. Environ. 2016, 75, 11. [Google Scholar] [CrossRef]
  24. Xiao-kun, H.O.U.; Tong-lu, L.I.; Xiao, X.I.E. Effect of undisturbed Q3 loess’s microstructure on its SWCC. J. Hydraul. Eng. 2016, 47, 8. [Google Scholar]
  25. Cai, G.Q.; Liu, W.; Xu, R.Z.; Li, J.; Zhao, C.G. Experimental investigation for soil-water characteristic curve of red clay in full suction range. Chin. J. Geotech. Eng. 2019, 41, 4. [Google Scholar]
  26. Yao, Y.; Ni, J.; Li, J. Stress-dependent water retention of granite residual soil and its implications for ground settlement. Comput. Geotech. 2021, 129, 103835. [Google Scholar] [CrossRef]
  27. Yao, Y.; Li, J.; Xiao, Z.; Xiao, H. Soil-Water Characteristics and Creep Deformation of Unsaturated Expansive Subgrade Soil: Experimental Test and Simulation. Front. Earth Sci. 2021, 9, 1141. [Google Scholar] [CrossRef]
  28. Zhenyu, L.I.; Lifeng WA, N.G.; Hongbin, X.I.A.O. Distribution Characteristics of Vetiver’s Roots in Highway Slope. J. Basic Sci. Eng. 2017, 25, 11. [Google Scholar]
  29. Xi, B. Morphology, distribution, dynamic characteristics of poplar roots and its water uptake habits. J. Beijing For. Univ. 2019, 41, 13. [Google Scholar]
  30. Zhang, J.; Peng, J.; Zheng, J.; Yao, Y. Characterisation of stress and moisture-dependent resilient behaviour for compacted clays in South China. Road Mater. Pavement Des. 2020, 21, 14. [Google Scholar] [CrossRef]
  31. Van Genuchten, M.T. A closed form equation for predicting the hydraulic conductivity of unsaturated soils. Soil Sci. Soc. Am. J. 1980, 44, 7. [Google Scholar] [CrossRef] [Green Version]
  32. Leung, A.; Garg, A.; Ng, C. Effects of plant roots onsoil–water retention and induced suction in vegetated soil. Eng. Geol. 2015, 193, 15. [Google Scholar] [CrossRef] [Green Version]
  33. Gallipoli, D.; Wheeler, S.J.; Karstunen, M. Modelling the variation of degree of saturation in a deformable unsaturated soil. Géotechnique 2003, 53, 8. [Google Scholar] [CrossRef]
  34. Bao, C. Behavior of unsaturated soil and stability of expansive soil slope. Chin. J. Geotech. Eng. 2004, 26, 15. [Google Scholar]
  35. Karimi, Z.; Abdi, E.; Deljouei, A.; Cislaghi, A.; Shirvany, A.; Schwarz, M.; Hales, T.C. Vegetation-induced soil stabilization in coastal area: An example from a natural mangrove forest. Catena 2022, 216, 106410. [Google Scholar] [CrossRef]
  36. Mickovski, S.B.; Van Beek, L.P.H. Root morphology and effects on soil reinforcement and slope stability of young vetiver (Vetiveria zizanioides) plants grown in semi-arid climate. Plant Soil 2009, 324, 43–56. [Google Scholar] [CrossRef]
  37. Farahnak, M.; Mitsuyasu, K.; Hishi, T.; Katayama, A.; Chiwa, M.; Jeong, S.; Otsuki, K.; Sadeghi, S.M.M.; Kume, A. Relationship between Very Fine Root Distribution and Soil Water Content in Pre- and Post-Harvest Areas of Two Coniferous Tree Species. Forests 2020, 11, 1227. [Google Scholar] [CrossRef]
  38. Himmelbauer, M.L. Estimating length, average diameter and surface area of roots using two different image analysis systems. Plant Soil 2004, 1, 110. [Google Scholar]
  39. Ng, C.W.W.; Garg, A.; Leung, A.K.; Hau, B.C.H. Soil-water characteristics of Relationships between leaf and root area indices and soil suction induced during drying-wetting cycles. Ecol. Eng. 2016, 91, 6. [Google Scholar] [CrossRef] [Green Version]
  40. Chen, W.J.; Cheng, D.H.; Tao, W. Physical significance of the parameters in the van Genuchten model. Hydrogeol. Eng. Geol. 2017, 44, 7. [Google Scholar]
  41. Romero, E.; Gens, A.; Lloret, A. Water permeability, water retention and microstructure of unsaturated compacted boom clay. Eng. Geol. 1999, 54, 11. [Google Scholar] [CrossRef]
  42. Ng, C.W.; Pang, Y.W. Experimental investigations of the soil-water characteristics of a volcanic soil. Can. Geotech. J. 2000, 37, 1252–1264. [Google Scholar] [CrossRef]
Figure 1. Vetiver root system.
Sustainability 15 01365 g001
Figure 2. Gradation curve of soil sample.
Sustainability 15 01365 g002
Figure 3. (a) Installation position of soil moisture content and matrix suction measuring equipment; (b) Soil sensor reader.
Sustainability 15 01365 g003
Figure 4. Temperature and precipitation during the test.
Sustainability 15 01365 g004
Figure 5. Plane configuration of vetiver root system.
Sustainability 15 01365 g005
Figure 6. The experimental Vetiver root system.
Sustainability 15 01365 g006
Figure 7. Characteristics of depth distribution of (a) order 2 and 3 roots of Vetiver; (b) order 1 root of Vetiver.
Sustainability 15 01365 g007
Figure 8. Root area index (RAI) and Root volume ratio (Rv) of each soil layer section.
Sustainability 15 01365 g008
Figure 9. Change in matrix suction of (a) 150 mm; (b) 350 mm; (c) 550 mm soil layer.
Sustainability 15 01365 g009
Figure 10. Change in matrix suction of (a) bare soil and (b) vegetated soil at each depth under natural dry environment.
Sustainability 15 01365 g010
Figure 11. (a) Matrix suction generated by natural drying and dehumidification of soil mass; and (b) Relevance between matrix suction and root surface area coefficient.
Sustainability 15 01365 g011
Figure 12. Fitting soil–water characteristic curve of (a) 150 mm soil layer; (b) 350 mm soil layer; (c) 550 mm soil layer.
Sustainability 15 01365 g012
Figure 13. Variation law of (a) parameters α and air entry value; (b) n value with Rv.
Sustainability 15 01365 g013
Figure 14. Comparison between soil–water characteristic curve predicted by plant root parameter Rv and measured value (a) vegetation soil at 150 mm soil layer; (b) vegetation soil at 350 mm; (c) vegetation soil at 550 mm.
Sustainability 15 01365 g014
Table 1. Properties of soils samples.
ProportionNatural
Density
(g·cm3)
Maximum
Density
(g·cm3)
Optimum
Moisture
Content (%)
Liquid Limit (%)Plastic Limit (%)Saturated Penetration
Coefficient (mm·h−1)
2.721.821.6221.541.525.41.426
Table 2. Fitting parameters of distribution characteristic curve of vetiver root system.
Fitting ParametersCorrelation Coefficient
(R2)
abc
RAI0.0554118.9725.390.9149
Rv0.05241−5.924128.590.9560
Table 3. Matrix suction Δs (kPa) generated by soil in each period.
PeriodSoil Types150 mm350 mm550 mm
0–48 hBare Soil16.772.8
Vegetated Soil2512.63.4
48–96 hBare Soil3.62.41.6
Vegetated Soil10.54.71.8
96–144 hBare Soil9.95.91.3
Vegetated Soil23.19.81.5
144–192 hBare Soil4.74.20.6
Vegetated Soil17.16.40.7
Table 4. Fitting parameter values of V-G model for different soil layer.
Soil TypesθsFitting ParametersCorrelation Coefficient (R²)
θrαnm (1 − 1/n)
Bare soil 41.67356.4610.132951.9160.47810.90483
Vetiver covered slope
150 mm soil layer
38.77362.8850.079811.72310.41970.92725
Vetiver covered slope
350 mm soil layer
40.4744.1340.093891.7970.44350.93672
Vetiver covered slope
550 mm soil layer
41.17395.1930.108681.85410.46070.92746
Table 5. Basic parameters of Soil–Water Characteristic Curve of each soil layer.
Soil TypesBasic Parameters of Soil–Water Characteristic Curve
Air Entry Value
(ψaev)
Inversion Point
(ψi, θi)
Slope
(ki)
Bare soil3.2337(11.06, 0.2699)−0.827
Vetiver covered slope
150 mm soil layer
5.8857(20.74, 0.24)−0.688
Vetiver covered slope
350 mm soil layer
5.0486(16.74, 0.2567)−0.742
Vetiver covered slope
550 mm soil layer
3.9824(13.98, 0.2634)−0.789
Table 6. Parameter values of Gallipoli model.
Soil TypesParameters of Gallipoli ModelRv
m1m2m3m4e
Bare soil0.46951.8073.6572.9320.71610
Vetiver covered slope
150 mm soil layer
0.46951.8073.6572.9320.63320.029
Vetiver covered slope
350 mm soil layer
0.46951.8073.6572.9320.67990.012
Vetiver covered slope
550 mm soil layer
0.46951.8073.6572.9320.69610.005
Disclaimer/Publisher’s Note: The statements, opinions and data contained in all publications are solely those of the individual author(s) and contributor(s) and not of MDPI and/or the editor(s). MDPI and/or the editor(s) disclaim responsibility for any injury to people or property resulting from any ideas, methods, instructions or products referred to in the content.

