Article

Characterizing Current THD’s Dependency on Solar Irradiance and Supraharmonics Profiling for a Grid-Tied Photovoltaic Power Plant

Department of Electrical and Computer Engineering, Florida International University, Miami, FL 33174, USA
*
Authors to whom correspondence should be addressed.
Sustainability 2023, 15(2), 1214; https://doi.org/10.3390/su15021214
Submission received: 26 November 2022 / Revised: 22 December 2022 / Accepted: 3 January 2023 / Published: 9 January 2023
(This article belongs to the Special Issue Sustainable Research on Renewable Energy and Energy Saving)

Abstract

:
The rapidly increasing distributed energy resources (DERs) in power systems are now getting interconnected to set community grid structures, where power quality will be a major concern. The grid-to-grid (G2G) bidirectional power transfer among the distribution microgrid will not be considered commercially feasible unless the upstream harmonics are under the limits. The aggregation of such harmonics, measured as total harmonic distortion (THD), is feared to be beyond tolerable limits with the progression of rooftop grid-tied PV-like installations. Hence, this THD needs to be characterized with DER generation end variables. In this work, the photovoltaic (PV) DERs’ dependency on environment variables such as irradiance was profiled in the context of generating and injecting harmonics into the grid. A mathematical model of a grid-tied three-phase PV DER was developed as part of this correlation characterization, matching the fundamental unit structure of a 1.4 MW solar canopy located on the Florida International University (FIU) Miami campus. To determine the qualitative association with produced THD patterns, the model was evaluated with various irradiance settings. A real-time digital simulation (RTDS) platform was used to verify it. Following this confirmation, sets of data from power quality meters at the point of common coupling and FIU field sensors were utilized to validate further the correlation model. The results showed that the grid current’s THD exhibited a high correlation with the irradiance profile and its variation over time. The early morning and late afternoon periods of the day, associated with a low irradiance, constantly had higher harmonics generated from the PV DER. The midday THD was rather rational with partial shadings, hence a geolocation-dependent factor. These findings were verified by an RTDS and validated by real field data. In quantifying the THD injected by a single DER at a high-frequency (2–150 kHz) supraharmonics (SH) level, a 3% peak increment in magnitude was observed from the high-fixed to the low-fixed irradiance profile. The correlation characteristics depicted that the hybrid microgrid suffered from a daytime-dependent harmonic insertion from the grid-tied DER. This is a global problem unless specific measures are taken to mitigate the harmonics. The electrically notorious higher-frequency SH was found to increase proportionally. The G2G power transfer can be limited because of the higher THD in the early morning and late afternoon, which will also worsen because the numbers of grid-tied PV DERs (i.e., rooftop solar and industrial solar) are likely to increase rapidly soon. The community grid structure can thus have a controlled harmonics filtration setup purposefully designed to address the findings of this work, which also fall within the scope of our future research.

1. Introduction

With a greater penetration of renewable energy sources, the entire electric power system is undergoing a rapid development, and loads require high-quality power constantly to operate effectively. The upcoming hybrid grid will contain more and more distributed energy resources and their power-electronics-based converters. The new pattern of harmonics that are becoming noticeable in DER-powered grid systems, in contrast to earlier, raises new considerations about power quality. Moreover, when based on DERs, the community microgrid share the power between them, especially during a natural disaster when the bulk grid is absent, and they are required to exchange high-power quality energy amongst them to ensure the stability of the entire system. In the process of power-electronics-penetrated grid hybridization, researchers have proposed their novel topologies enriched by optimization technology to address several issues including the power quality. The authors in [1] showed a significant improvement in power quality by eliminating the fifth and seventh harmonics by implementing the Aquila Optimizer in a seven-level H-bridge inverter structure. In transforming the existing conventional grid to a hybrid grid, the cost of the transformation also needs to be accounted for, where the work in [1] was also able to assess by the inverter’s internal component counts. In a work of Khan et al. [2], selective harmonics elimination was addressed with the help of another algorithm, called the Archimedes optimization, where low order (third, fifth, ninth) harmonics were eliminated by optimizing the switching angles. The overall THD reduction was found to be better too when comparing with state-of-the-art optimization techniques such as particle swarm optimization (PSO) and genetic algorithms. In reference [3], the authors provided a comprehensive harmonic analysis of multiple grid-connected inverters connected in parallel. They studied identical and nonidentical inverters to check how the harmonics interaction between them affected the overall system harmonics. They found that the worst case occurred when all inverter-admittance total matches with the grid admittance were equal and the phase difference between them was close to +/−180°. Another finding of that study was when there were nonidentical multiparallel inverters, some inverters might be affected severely though there was no harmonic emission from any source of the system. In [4], the authors proposed and verified a strategy to address the second harmonic content (SHC) which was generated for the two-stage single-phase grid-connected inverter. The mathematical model of the SHC was analyzed by the authors and a mitigation of the SHC was proposed by adopting an inductor current feedback-based active-damping scheme. The authors also verified their work experimentally using a grid-tied PV inverter test bed. In another work in [5], the authors attempted to characterize the relationship between the current harmonics of PV inverters and the voltage harmonics that are prevailing in a low-voltage distribution network. They took an 8 kW PV system to collect the power quality parameters. The authors found that the PV inverter injected high-current harmonics when operated at power levels below the rated one based on two different functions: the unity power factor and the constant reactive power. An important finding of their research was that harmonic current increased with the increase of harmonic voltage except for the third and ninth harmonics. In a mitigation effort, a fuzzy logic proportional–integral–derivative (FLPID) controller was proposed to address the power quality issues in the grid-tied photovoltaic distribution system by the authors in [6]. The main objective of the FLPID controller was to regulate the DC-link voltage during transient conditions which eventually maintained a stable power between the dc and ac sides. The voltage and current harmonics were found within the limits from the IEEE-519 standard when using the proposed method.
In [7], the authors investigated the harmonic contents within 9–150 kHz for a 5 kW system. One of the interesting findings the authors reported was that when PCC was far from the transformer in the distribution system with a high penetration of solar devices, the harmonic contents increased considerably. In addition, the authors found that the controller’s gain had little impact in terms of high-frequency current harmonics in the system. In the article [8], the authors proposed a hybrid control scheme to achieve an improved power quality and power factor correction. The control strategy was based on the passivity theory of the current control loop that operated under zero or in intermittent power generation. The additional feature of the control scheme in making the inverter operational even in zero-power generation improved the power factor and reduced the total harmonic distortion when power was requested from the grid side. In the review paper [9], the authors mentioned the incapability of low-frequency active power filters to suppress supraharmonics (SH) that usually have a range of 2 kHz to 150 kHz. Photovoltaic inverters and electric vehicle charging devices act on high-frequency power electronic devices which create the SH range. In the reference paper [10], the authors provided good insights for overcoming some of the major challenges of grid-tied PV inverters, such as a modeling approach, frequency aggregation, and experimental setup-based black-box approach for high-frequency (HF) emission studies. The research found that the black-box model based on the data-collection-based modeling of the system was more suitable than the white-box model, which consisted of a detailed mathematical model of the system in terms of analyzing HF emissions. In [11], the authors concluded that renewables-based power plants could be the dominant sources of SH, and these could create significant distortions in modern low-voltage/medium-voltage (LV/MV) distribution networks. Another important finding the authors reported was that SH were very easily transferable from high-voltage (HV) to MV and LV power networks and could propagate over several kilometers.
The control part of the PV inverter and converters has been worked on for estimating and addressing PQ issues as well [12,13]. For a neutral-point-clamped (NPC) inverter for a PV-fed water pumping system, the authors of [14] suggested a modified reference-based PWM approach. Their suggested method made use of trapezoidal and ninth harmonic signals to produce the modulating signal, which was ultimately utilized to drive the IGBTs for the NPC inverter. The authors demonstrated that the suggested method lowered conduction, switching, and THD losses. They also studied existing technologies and their suggested one side by side. In [15], the authors proposed a self-adaptive proportional power-sharing control strategy for a microgrid to ensure a smooth transition between grid-connected and islanded modes. The proposed adaptive power control technique deployed an enhanced adaptive integrator to attenuate the current THD and to estimate the active and reactive power load components from the load current. The PV inverter’s control the authors proposed maintained the flow of active and reactive power sources between the DG units in the microgrid and provided a reactive power compensation at the PCC. A control method for a grid-tied PV system with all-encompassing active power filtering capabilities was put forth by the authors in [16]. Series and shunt voltage source inverters were used in the technology they proposed, and the reference signals for each were determined using the adaptive least-mean mixed-norm (LMMN) identification technique. They also used a hardware-in-loop (HIL) platform to show their suggested method under a variety of operational situations, including solar irradiance changes, voltage sags, swells, and current harmonics. The authors of article [17] developed a control technique based on a distributed incremental adaptive filter (DIAF) for a PV–battery hybrid microgrid system. The DIAF was used to operate the voltage source converter (VSC) control system with the aid of PV and a battery. The DIAF control also provided harmonics reduction, load balancing, and power factor optimization tools to handle systems linked with nonlinear loads. Using the battery energy storage (BES) reduced fuel expenditures and improved the MG’s ability to operate smoothly. For a grid-connected PV inverter with an LCL filter, the authors of [18] presented a modified double-band hysteresis current controller with a proportional resonant controller. Their suggested controller used a sequential logic-based adaptive clock and a unipolar PWM approach to lower the inverter’s switching losses. The suggested approach also decreased the switching frequency, steady-state error, and total current THD injected into the grid.
To improve the quality of the output signals of PV, the PV inverter plays a vital role [19]. A two-level inverter is simple and cost-effective but to provide a practical power quality, a limited filter size and a high-frequency operation are needed [20]. Three-level NPC inverters have been proposed for PV applications because of their simplicity and lower filter losses [21]. These inverters have two main drawbacks: first and foremost, they require an input of double the voltage in comparison with the full-bridge inverter; second, they require a high-frequency grid filter. Cascade H-bridge converters have been developed for PV applications to provide a higher voltage level to improve harmonic distortion [22]. When solar cells experience unequal solar irradiance due to partial shading or dust on the PV, this would give rise to unbalancing in the system. Multilevel inverters are the answer to the intraphase and interphase unbalancing problems, which are divided into two categories [23]. Due to the uneven irradiation on the solar cells, the difference in the working duty cycle of the solar cells and the operating voltage of the DC-link are the primary causes of harmonics being produced at the converter’s output. When the solar irradiance decreases, the controller limits the duty cycle in the shaded power cell to match the new MPP current; as a result, the modulator receives different duty cycles. Therefore, the shaded power cells inject power with delay. As timing is a vital factor in multilevel inverters, the delay between the operation of the power cell affects the quality of output signals adversely. Several works have been conducted to address this issue; in [24], the boost converter was added to the power cell, and a modified modulation technique was proposed in which the energy of DC-link capacitors was the same, which led to the same duty cycle operation of all the cells. This work used several active and passive components, increasing the weight and cost while also reducing efficiency. To overcome those drawbacks an H6 bridge topology was introduced [25]. The reported topology consisted of six switches on an H-bridge structure.
It is clear that a DER-enhanced microgrid (MG) may be further researched in terms of power quality (PQ), since community MG-oriented power sharing would not be possible at all without assuring PQ. The new SH kind of harmonics pollution will pose a significant regional or temporally variable PQ issue. It is critical to understand harmonic propagation from load to grid or from generation to grid. Additionally, a deeper understanding of the input energy and its correlation is required given this harmonic current flow. The papers described above looked at several facets of power quality measurement and enhancement. Control is a major area that has been investigated for the discovery and enhancement of microgrid PQ, while significant work has been done on the topology of the converters and inverters. When PV arrays are horizontally distributed, there has not been a lot of research on string inverters about the distinctive correlation study between input solar irradiance and ultimate harmonic injection by them. This is what drove the current focus of this study. In order to understand how irradiance correlates with PV-DER harmonics, a model is created, evaluated, and a grid-tied solar canopy configuration is used for a field data validation. This main objective can be broken down into the following sub-objectives:
1.
Development of a three-phase PV-DER grid-tied model in Matlab Simulink;
2.
Investigating different irradiance profile and record the grid current’s THD;
3.
Analyzing the results towards finding any correlation between input irradiance and output THD;
4.
Understanding the SH contribution to the grid current’s THD in several cases.
The key contributions of this research hold insights on the aforementioned prime objective, that can be listed as follows:
1.
Low irradiance values in the early morning and late afternoon are related to consistent injection of high harmonics by grid-tied PV-DERs irrespective of load on the grid.
2.
The mid-day fluctuation of the irradiance is related to harmonic injection for a shorter period of time, with high notches over that time.
3.
The THD correlation with the input irradiance is similar to supraharmonics that exist in a PV microgrid.
4.
A real-time simulation and field PQ data validate the model’s response.
The rest of this paper is organized as follows: Section 2 outlines the research methodology, the simulation model of the investigated PV power plant, the FIU’s PV power plant details, and an overview of the SH. Section 3 presents all the detailed results, discussions, and the SH inferences. Finally, Section 4 concludes the paper with results’ significance and the possible future scope of this work.

2. Total Harmonic Distortion at the Point of Common Coupling

In this section, the research methodology is elaborated by a stepwise working flowchart. The simulation model is then described along with the mathematical development details. Later, the field data setup information is provided. The section concludes with a description and impact of supraharmonics in modern power systems.

2.1. Research Methodology

Power quality seems to be one of the most serious concern in defining the effective operation of a renewable-source-enriched power grid from the reported literature. This hybrid grid contains high-frequency components from numerous power-electronics-based converters with intelligent algorithms that are installed grid wide. Voltage regulation is critical in the DC part of the DERs of the output that is reported in [26]. A better regulation is one of the prerequisite to guarantee power quality. Thus, the authors in [27] reported a better voltage regulation with a reduced controller cost to achieve an implementable design of converters. Moreover, the stability of the controllers needs a better optimization based on various objective functions. Hence, a PSO technique was proposed in [28] to design state-of-the art PID controllers. At this stage, the AC part of the DER-generated electric power chain holds a major interest in ensuring AC power quality. The high-volume installation of low-cost, unity-power-factor solar inverter in the distribution grid seems to weaken the inertia, where, on the other hand, switching their frequency injects different power quality issues for the grid power customers.
The low-quality power is also dominated by harmonics generated from the source end, creating a high loss in systems, unreliable operation and so on. The stresses generated at this grid end for the inverters can enforce a derating of the production, even shorten the lifetime of the inverter [29]. The identification of the fact that DERs can inject varying harmonics into the grid which are measurable in the form of current THD triggered this research to start modeling the problem and do the required analysis. Figure 1 holds a systematic approach to find any correlation existing between the daily irradiance distribution and the harmonics-generated and quantified by the GFL-inverter-coupled DER. The work started by developing a Matlab Simulink model which replicated the unit setup of FIU’s PV solar canopy. This was done to use the data from FIU’s sensors and servers, so that later, the findings could be verified from the sophisticated power quality meter. The simulation was also performed on a real-time platform to deliberately find the response with a high carrier frequency of 20 kHz in the simulation. Two categories of simulation results were cross-matched to verify the common findings on the correlation. Only when the correlation was reported as similar was it again compared with the grid THD profile over the day as logged by the physically installed PQ meter at the PCC. Any failure during these double checks would trigger a negative conformity. Lastly, the conclusive results were the key contributions shown in the bottom part of the flowchart.

2.2. Grid-Tied DER Model with Three-Phase Load

In this research, a detailed grid-tied DER-based model was constructed whose details are shown in Figure 2. In the model, an array of 46 PV units delivered 100 kW of active power to a grid (400 V A C , 60 Hz) with no battery in the system, where a linear load was connected at the PCC. The inductive load was constant, consuming 100 W of real power and 48.4 V A R of reactive power. In the DER part, the grid-following (GFL) inverter had a b c to d q transformation blocks, whereas a DC/DC boost converter was used to extract the MPP from the PV arrays. The conventional d q conversion equations are given from Equation (5) through Equation (7) [30].
To analyze the photovoltaic inverter three-phase power, an a b c d q o conversion was utilized. This conversion can drastically simplify the computations, setting it as a popular goal. Therefore, it transforms the three-phase instantaneous voltages and currents into the synchronously rotating reference in the form of a d q o frame. The other factor which benefits much is that the conversion provides a system-operator-independent control over the derived active (d-axis) and reactive (q-axis) components of the currents. Furthermore, the conversion helps implementing a proportional–integral (PI) closed-loop feedback controller. In our model, the grid-connected inverter equations were developed in the following way:
v D v Q = 2 3 sin ( ω t ) sin ω t 2 π 3 sin ω t + 2 π 3 cos ( ω t ) cos ω t 2 π 3 cos ω t + 2 π 3 × v a v b v c
i D i Q = 2 3 sin ( ω t ) sin ω t 2 π 3 sin ω t + 2 π 3 cos ( ω t ) cos ω t 2 π 3 cos ω t + 2 π 3 × i a i b i c
V d = V D + ω L I Q + K P + K I s I d ref I D
V q = V Q ω L I D + K P + K I s I Q ref I Q
were the symbols are defined as follows: V d and V q are the d-axis and q-axis desired voltage references. I D and I Q are the d-axis and q-axis measured currents. I d r e f is the reference current obtained from the voltage control loop and I Q r e f = 0 . The direct and quadrature axis values with the DC notation were then developed toward the desired form of the equations.
V d V q = R I D I Q + L d d t I D I Q + ω L I Q I D + V D V Q
V d = R I D + L d I D d t + ω L I Q + V D
V q = R I Q + L d I Q d t ω L I D
In Equation (7), V Q was kept at zero in order to align the d-axis with the grid voltage. The proportional–integral (PI) controller for MPPT algorithm was tuned to track the correct operating voltage under even highly varying irradiance profiles. The output filter used was an LCL filer (L = 500 μ H, C = 100 μ F). However, it was important to have the IGBT driver’s output PWM signals be adaptive with the following three-phase grid voltage; otherwise, the inverter would fall back from the synchronous operation. Figure 2 shows the controller configuration governed by the equations designed so far.
v a v b v c = 2 3 sin ( ω t ) cos ( ω t ) sin ω t 2 π 3 cos ω t 2 π 3 sin ω t + 2 π 3 cos ω t + 2 π 3 × v D v Q
In investigating the irradiance’s behavioral impact on THD, the PV array’s characteristic equation needs to be analyzed. The PV cell current and its terminal voltage are a function of solar irradiance and the PV panel’s temperature. By definition, the power delivered by the Sun in the form of electromagnetic radiation in the measuring device’s wavelength range per unit of the surface area is known as the solar irradiance, S. There are various improved mathematical models on solar cells’ characteristics to predict their dependency on S and the ambient temperature T [31,32,33]. Based on the existing approaches, the following equations can set a better understanding of a PV panel’s input–output operation [34].
I p v = I p h I 0 e V p v + R s I p v V T 1 V p v + R s I p v R s h
V T = A k T / q
I p h = S S S T C I s c , S T C 1 + α T T S T C
I 0 = I p h V o c R p e q V o c A k T 1 1
V o c = V o c , S T C 1 + β T T S T C + V T 0 S S S T C
where I p v denotes the PV output current; I p h is the photogenic current, I 0 is the diode’s reverse-saturation current, V p v denotes the PV voltage; R s and R s h are series and parallel resistances, respectively; A is the ideal diode factor; S is the irradiance; and V o c and I s c are the PV array’s open-circuit voltage and short-circuit current, respectively. Moreover, S S T C = 1000 W/m 2 and T S T C = 25 C at the standard test conditions (STC); I S C , S T C and V O C , S T C are short-circuited current and open-circuit voltage at the STC, respectively; and α and β are the thermal correlation coefficients.

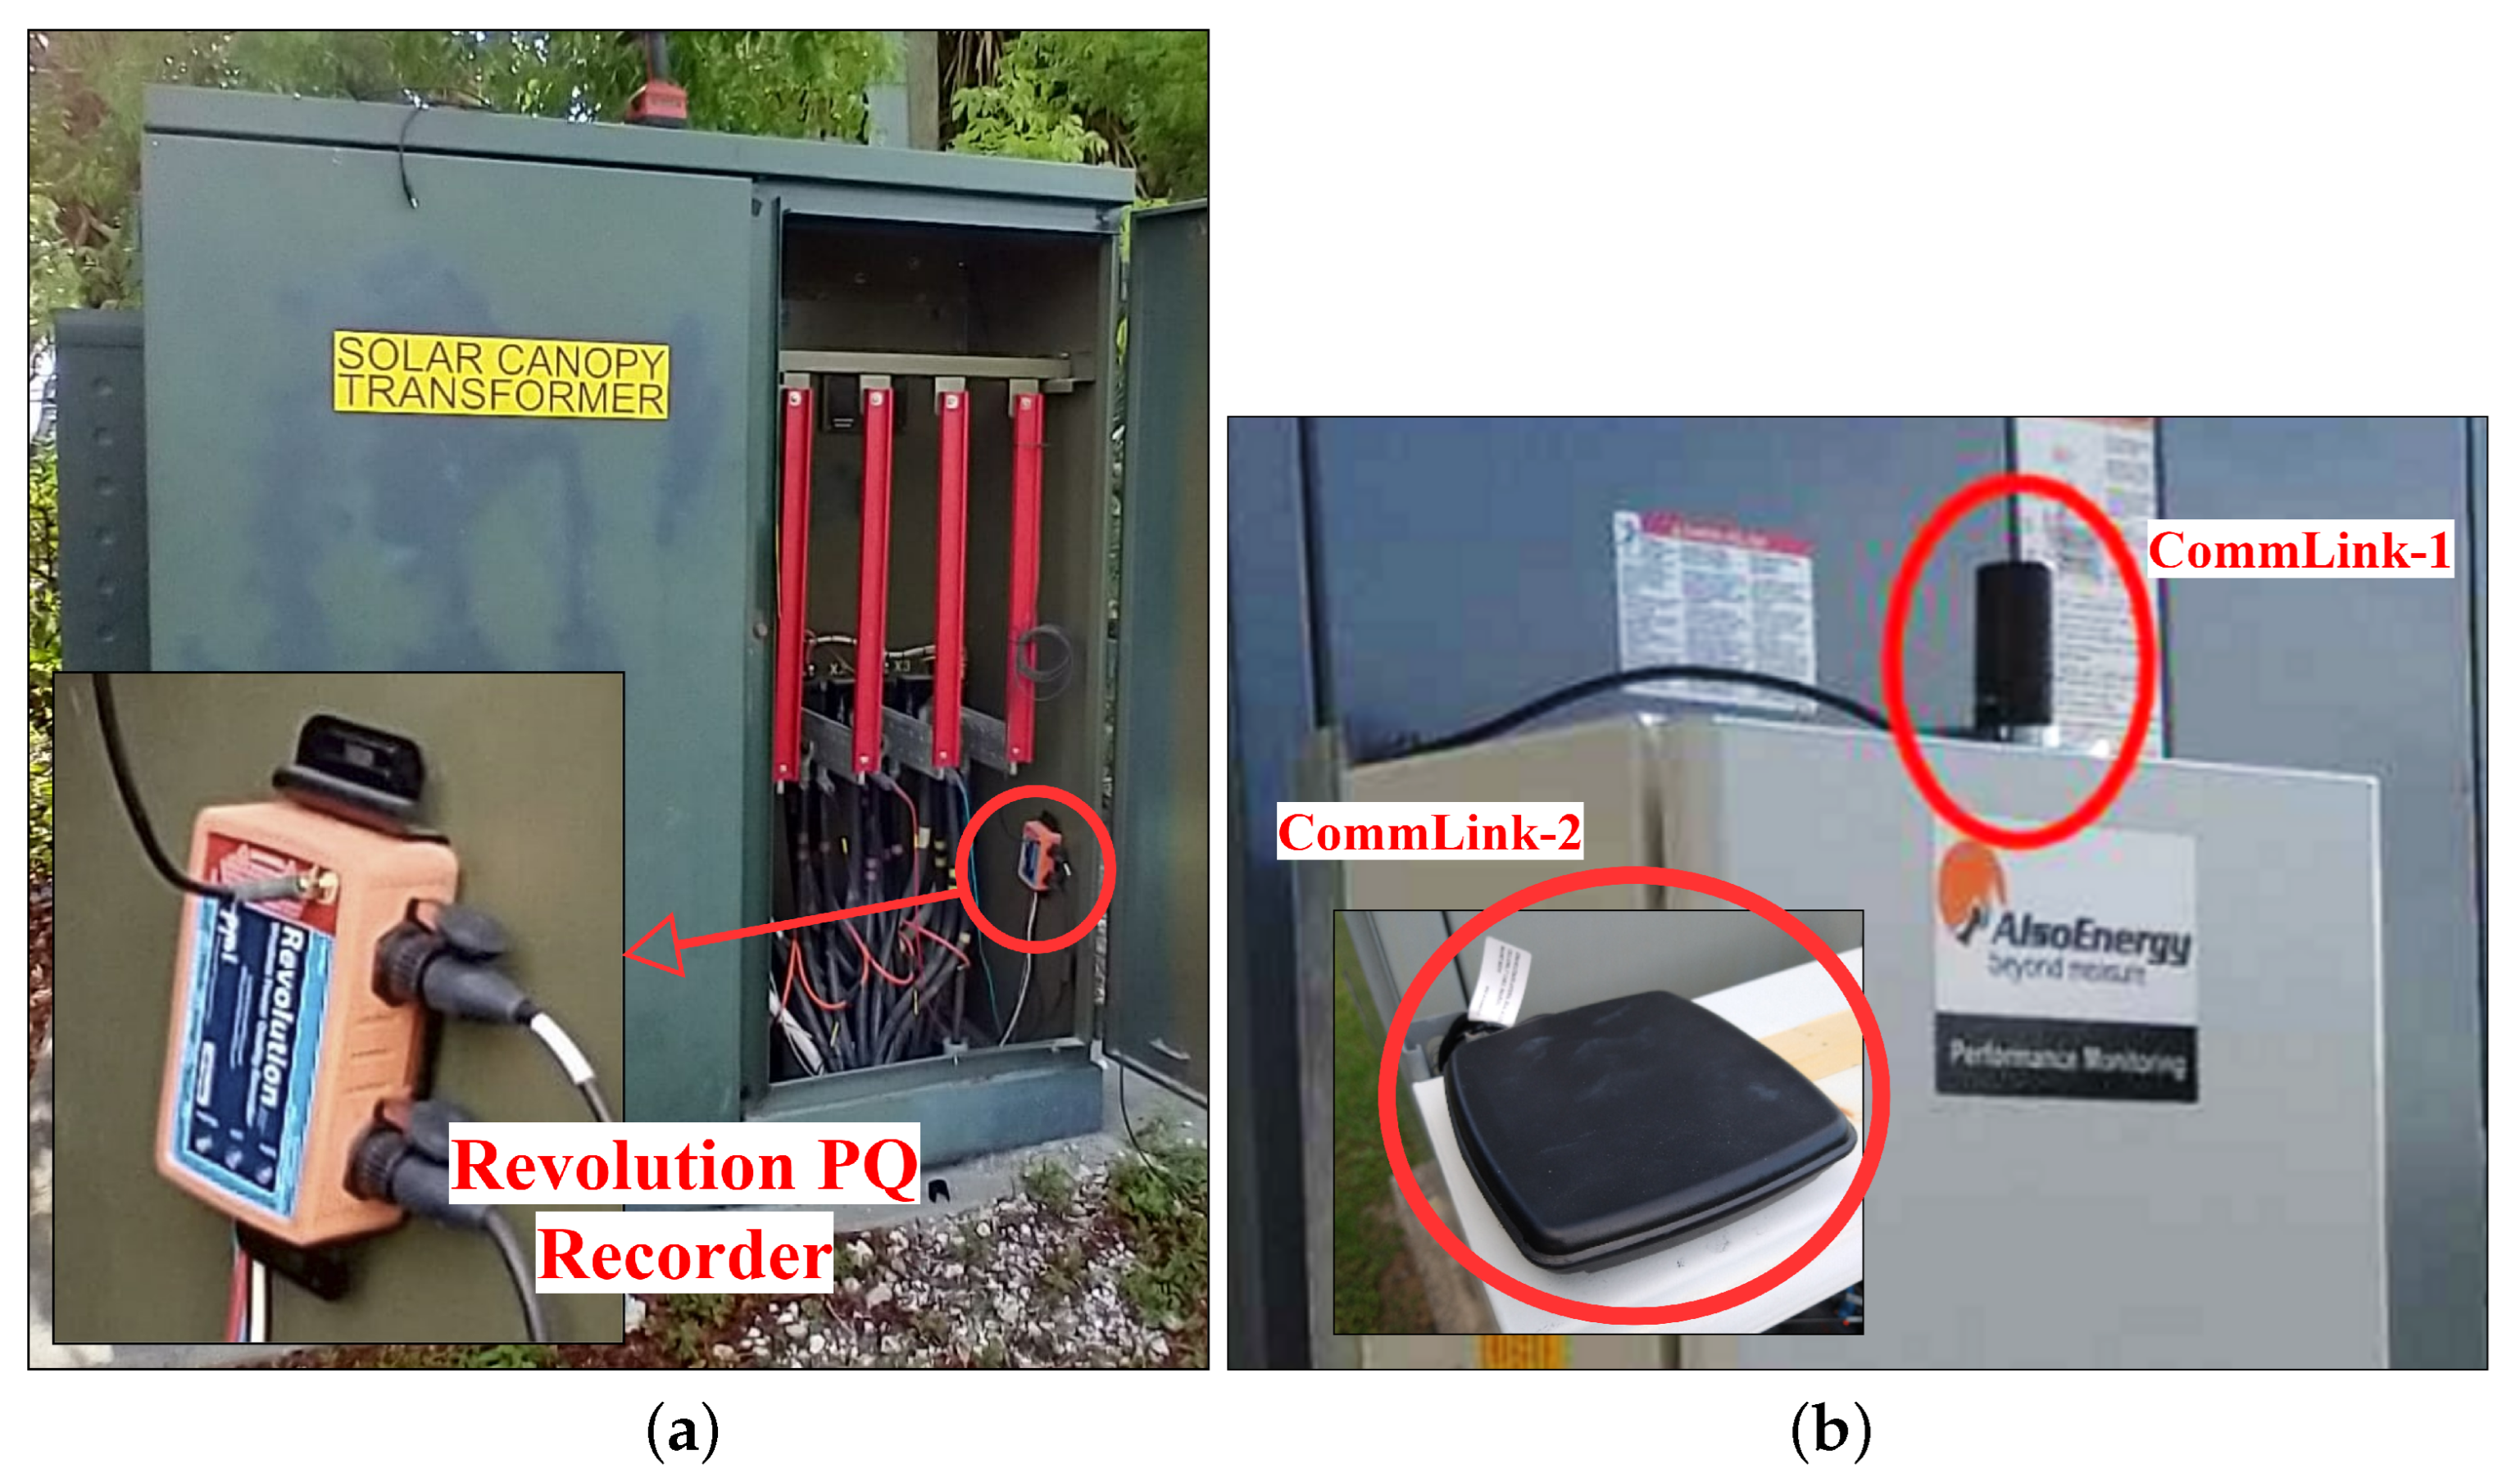
2.3. FIU’s Solar Canopy

At FIU, an artificial-intelligence-based renewable microgrid consisting of a solar PV canopy (1.4 MW maximum capacity) with 46 grid-tied GFL inverters, and a 3.35 MW/MVAR grid-forming (GFM) inverter with a 9 MWh Li-Ion battery energy storage system (BESS) was commissioned in 2016–2017. The solar canopy setup is fully operational for exporting an accumulated maximum power from the 46 units of GFL string inverters’ AC outputs to a 230 kV grid after stepping the voltage up by a solar transformer. Detailed information can be found in Table 1 [29]. There are a total of six units of Power Monitor Inc. (PMI) branded PQ recorders installed in the whole microgrid to capture the holistic dynamics of it. In this research, field data were taken from a low-voltage (600 V) Revolution ® PQ recorder, which is capable to record instantaneous three-phase voltages and currents, and IEEE 519 categorical THD, capture waveforms, and that is connected at the POI or PCC, as shown in Figure 3. The other source which was utilized for getting data was a data acquisition system (DAS) activated in FIU’s solar canopy. The role of the DAS was to log various data consistently at a high-resolution sampling rate. The data variables included irradiance, ambient temperature, GFL inverters’ input–output DC–AC values, alerts, warnings, and so on.

2.4. DER Penetration Impact on Supraharmonics

SH are aberrations of voltage or current waveforms at frequencies between 2 kHz and 150 kHz, which are becoming more prevalent in power systems, due to the accelerating development of distributed and embedded inverter technologies as well as active rectifier loads. Both emission and vulnerability are the concerns for power systems, especially with a high impedance or “weak” inertia. Limits are often not well defined or strictly enforced since this range does not conform to harmonic standards [35]. There exists a complex relationship among different events ranging from the start and stop of nonlinear loads, variation in resonance, environmental variations, and DER location. The supraharmonics component expression can be derived into the form of Equation (14) [36].
x ( k ) = s h A s h cos 2 π f s h k T s + θ s h
Here, A s h denotes the amplitude, θ s h represents the phase of SH where the SH frequency is f, T s is the sampling period, and n is the number of sample values of the continuous signal. K is the length of the signal sequence k = 0 , 1 , ; lastly s h denotes the SH orders.
Increased SH emission has resulted from efforts to improve the power factor and lower the harmonic content in the lower-frequency region of the output current of inverters used in grid-connected devices. In this instance, SH is generated by the switching circuits of the inverter and then pushed into the grid for the duration of the inverter’s operation. It is possible for the device to turn into a drain for SH while the inverter is not working or producing an output [37]. The fundamental concepts apply to harmonic current at the interface of a device or a complete installation. Both a source and a drain of SH can come from MG sources that use inverters to produce output. This makes SH mitigation difficult, because a microgrid or main grid depends on sources both inside and outside of it.

3. Results and Discussion

In the simulation part of this research, a 100 kW photovoltaic GFL inverter system delivered only active power to the grid, whereas the grid voltage and line frequency were maintained by a bulk grid. A fixed PQ (P for real power, Q for reactive power) type of load was connected at the POI or PCC where the grid exporting the three-phase current of DERs was analyzed to quantify the THD. The investigated variable was the irradiance profile, and the ambient temperature was taken as a constant. The varying pattern of irradiance was reconstructed from the observation of the generalized real-time pattern. On a normal sunny day, as the sun rises up, the irradiance increases from a very low to a mid–level during the early morning. The variation is high at that time. This is again happening in the afternoon period of the day. By the afternoon, all the switching devices and the filters of the inverters are stressed out. Solar irradiance can also significantly vary depending on the cloud pattern in the sky, which is a random variable. Complete shading due to the cloud can stop DER power production where it can come back again instantly when the cloud shifts away. Partial shading is the other cause of midday irradiance and power output variations. The legitimate hypothesis behind the time-specific variation of irradiance is the fact that sunlight has to travel through a large volume of air to reach the PV panel during the morning and afternoon in daytime. The fundamental properties of deflection and diffraction of photons on the air dust cause an irradiance fluctuation. However, because of moving clouds or external objects’ shadow patterns, the midday constant irradiance can have a steep drop for a shorter or longer period. In order to simulate one day of irradiance variation, a 14 h pattern (6 a.m. to 8 p.m., Eastern Standard Time, EST) was replicated into a 3 s simulation run window. The grid frequency was 60 Hz, so a 3 s window corresponded to 180 cycles of current which conformed to the IEEE 519 THD analysis time window. In the MATLAB simulation, one PV DER with GFL was tied into a swing-generator-based grid (400 V L L , 60 Hz) where a constant PQ type load was connected in the POI.

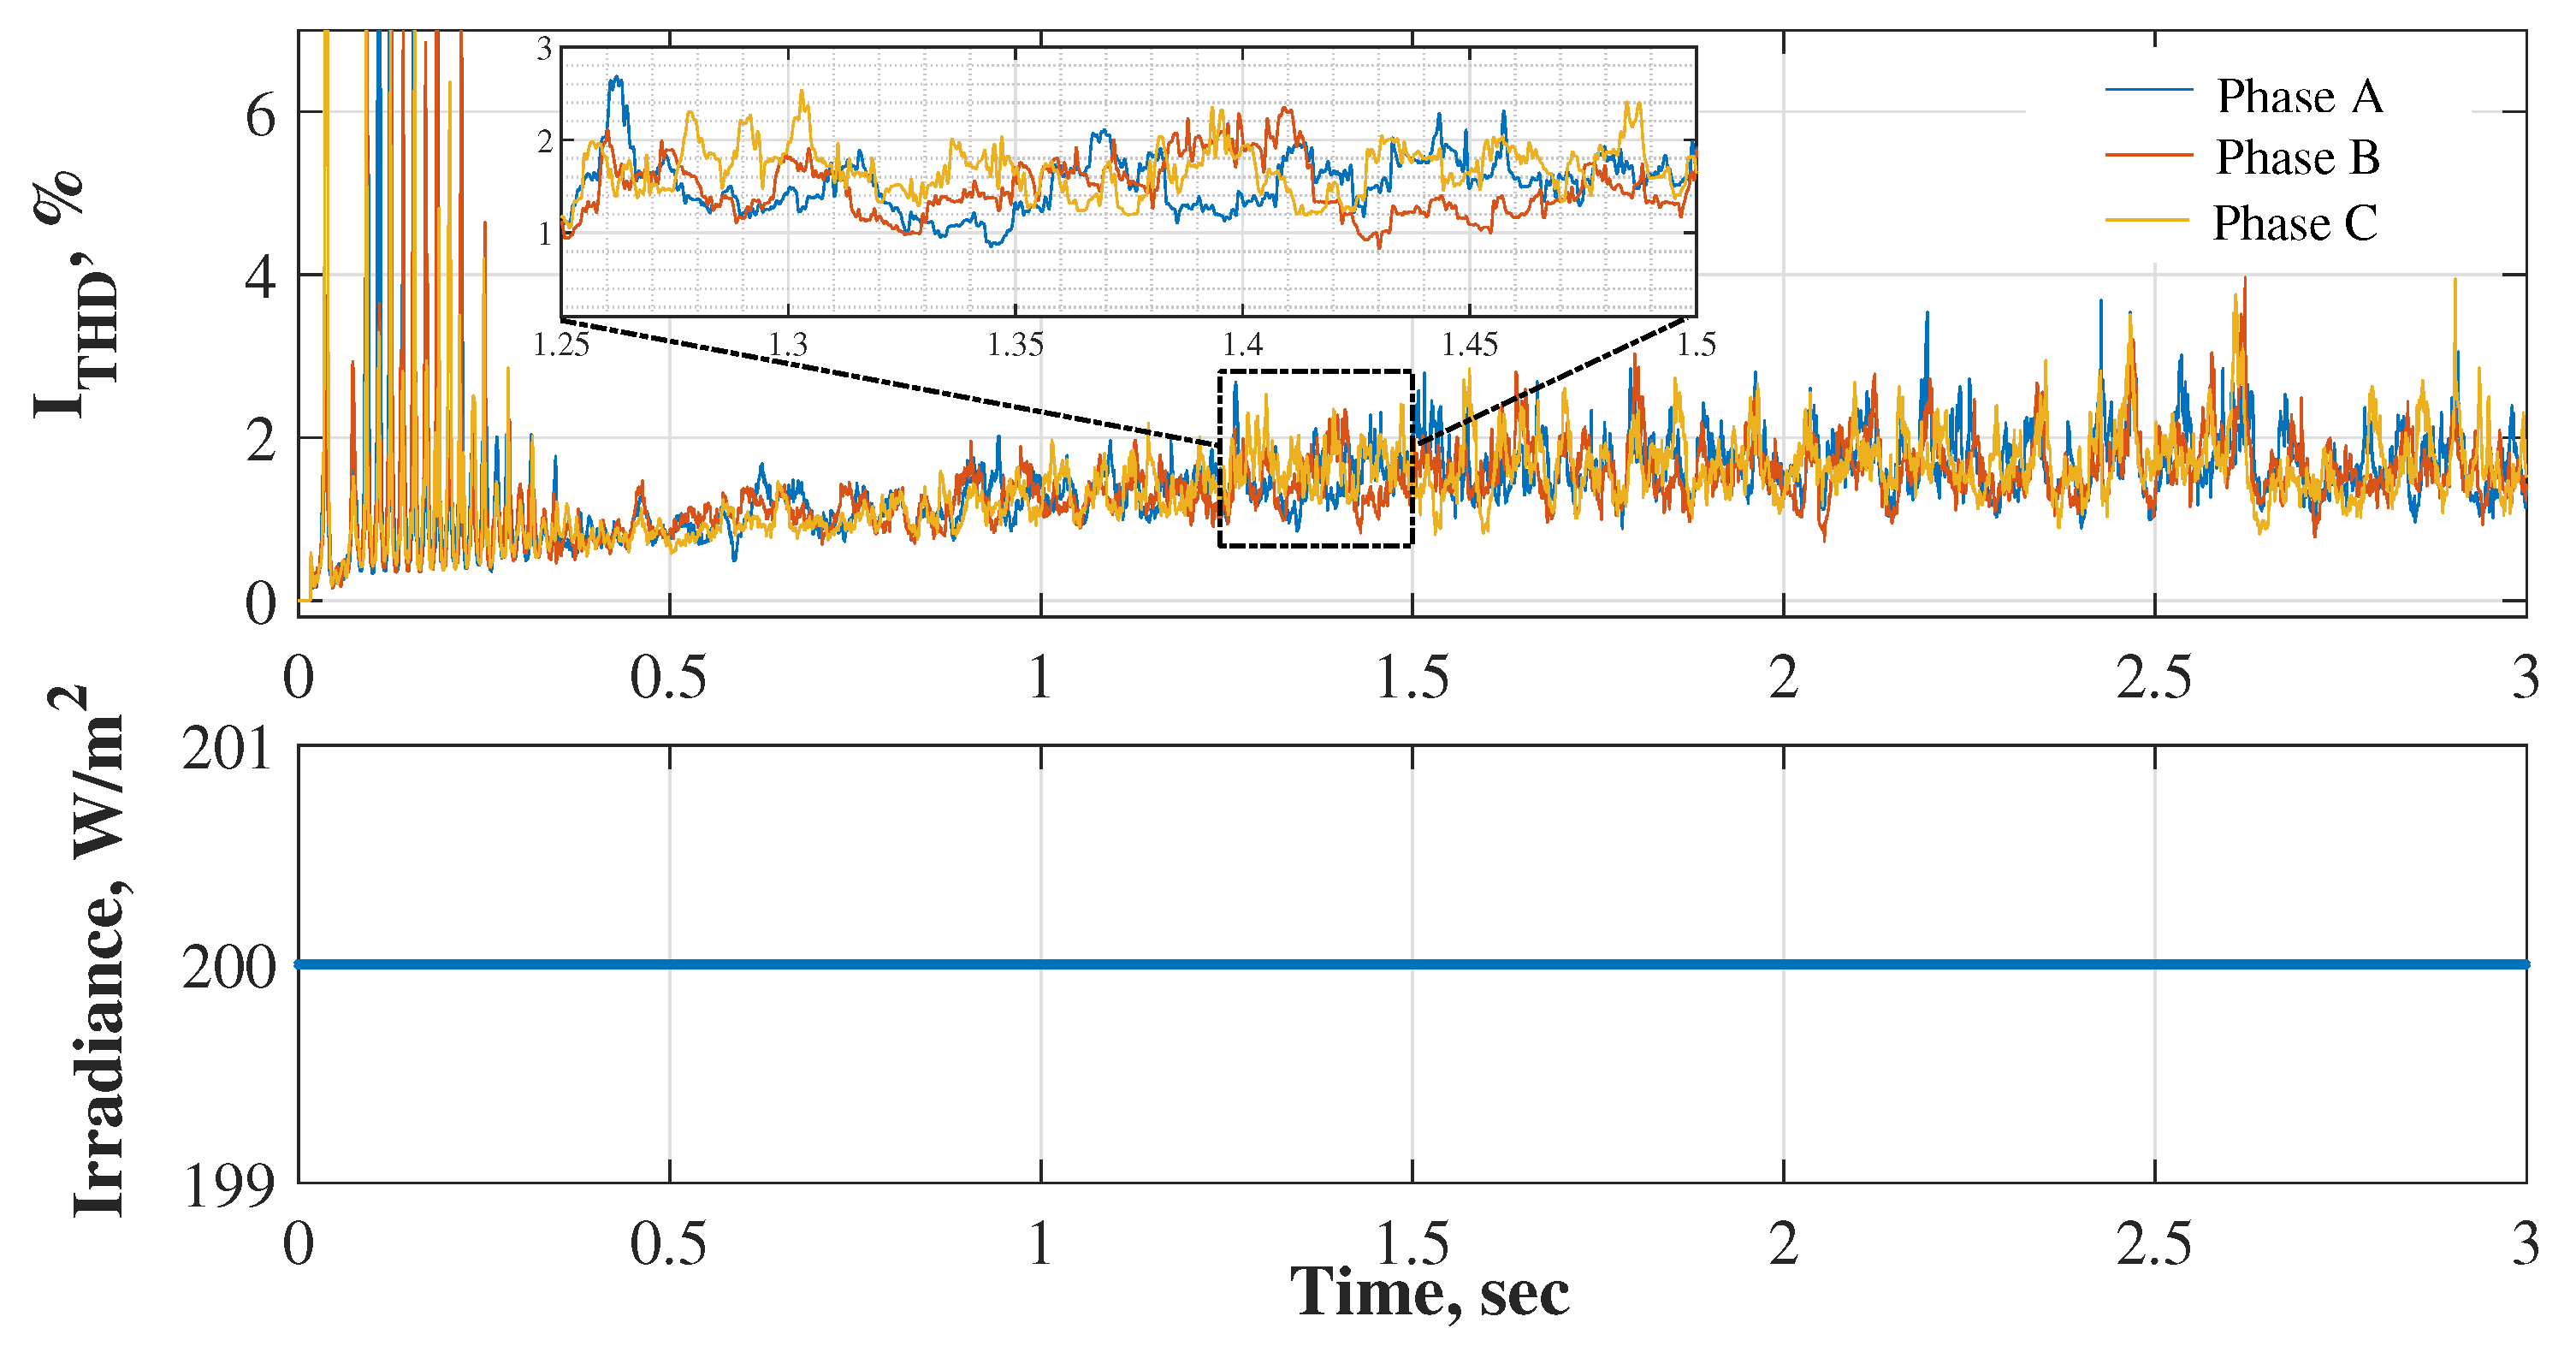
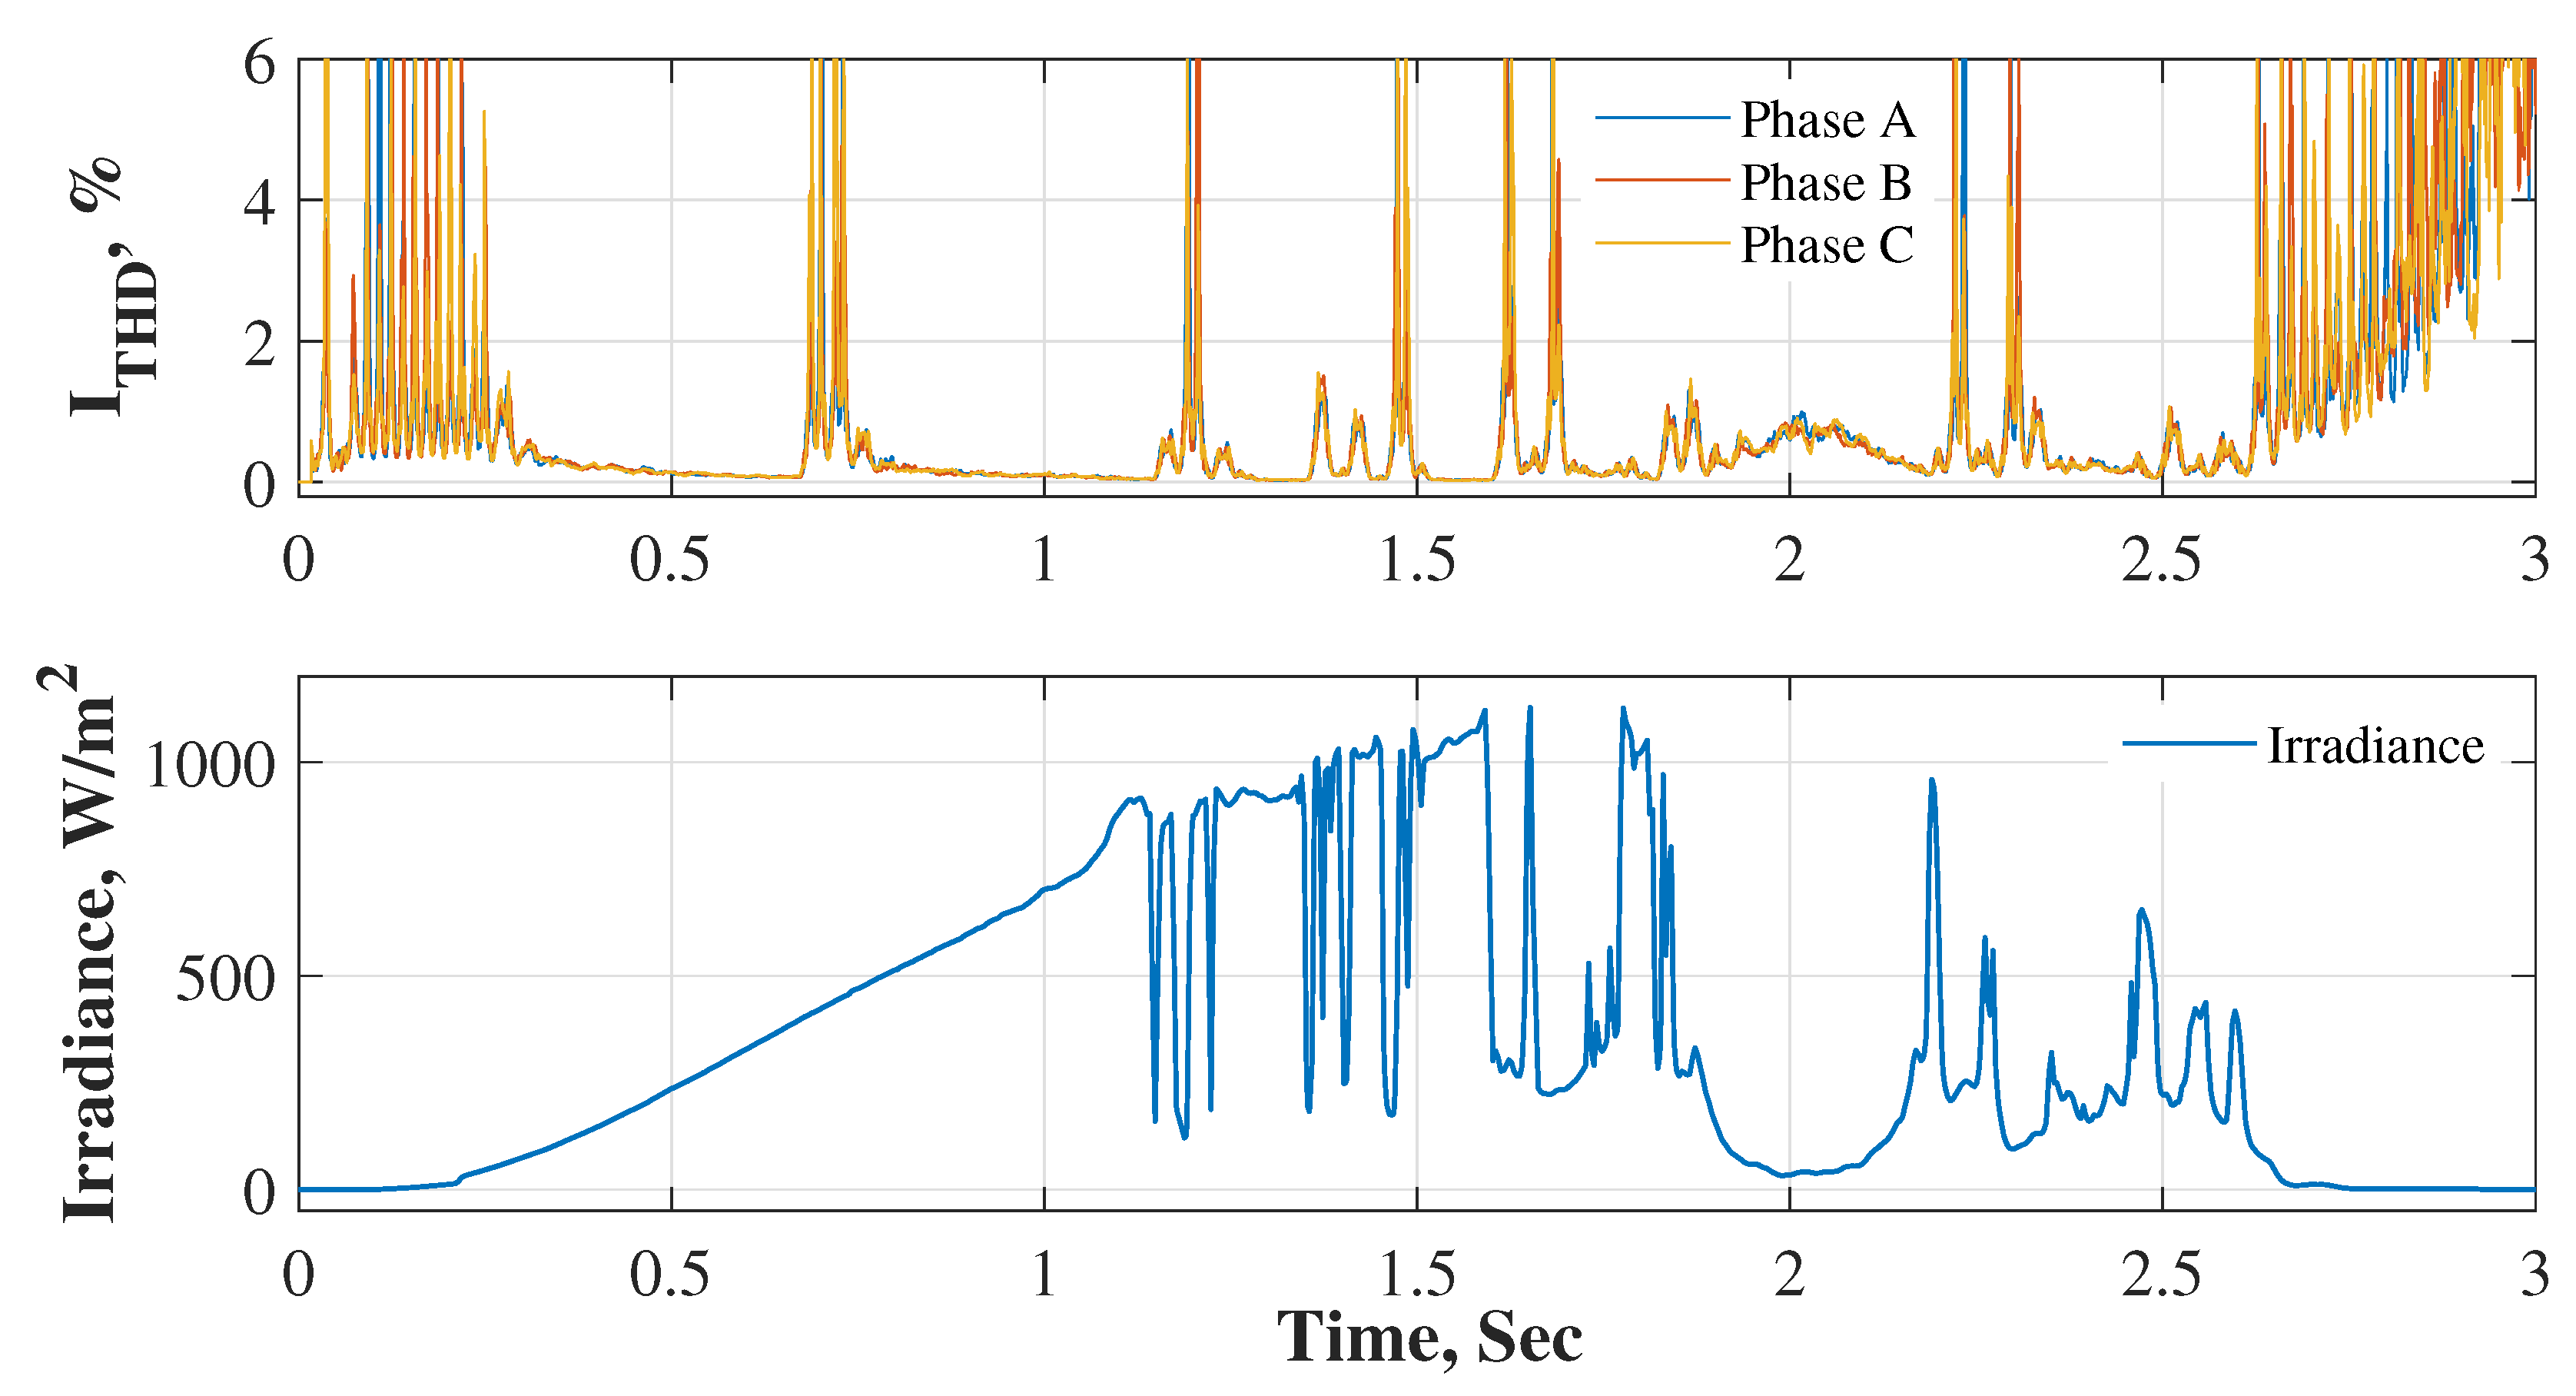
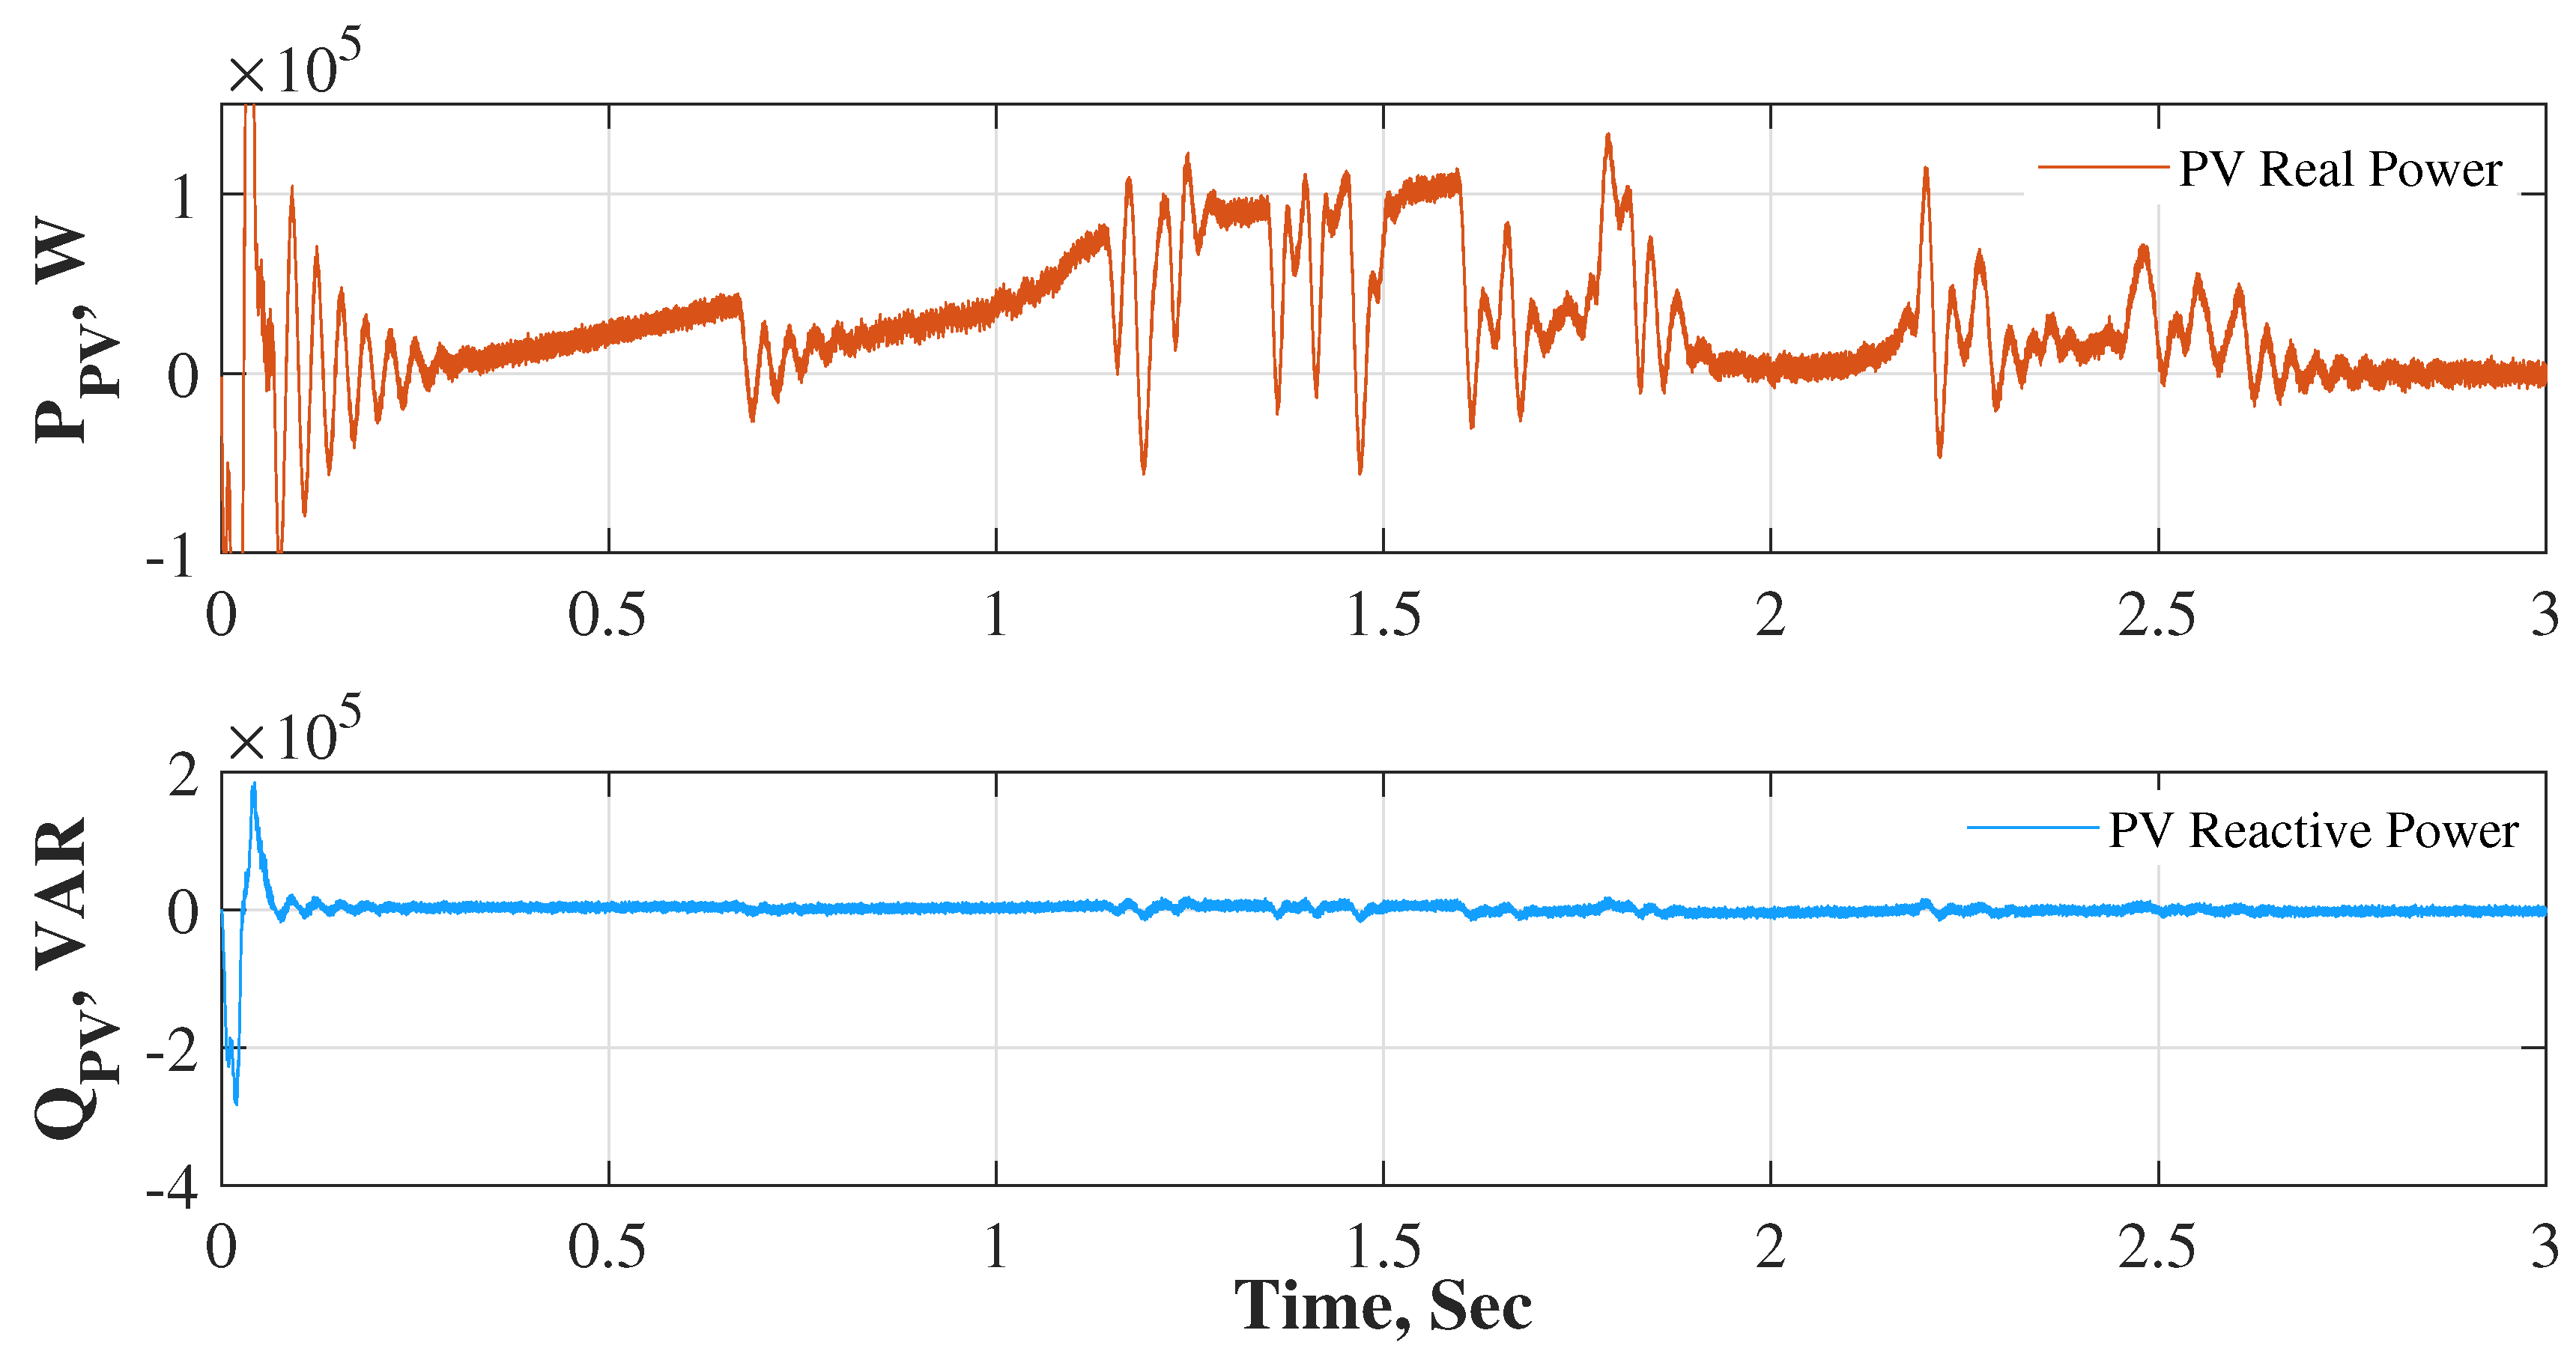
3.1. Irradiance Impact on Current THD at the PCC

The simulation results were obtained from fixed and varying irradiance profiles. However, the temperature was kept constant at 25 C for both cases in this work, in order to quantify only the effect of the irradiance. Moreover, we had the same intention when keeping the load at the grid side with a fixed PQ. The global horizontal index (GHI) irradiance was kept at 1000 W/m 2 over time, which injected an almost constant quantity of harmonics into the grid after the initial transients. The resultant THD is shown in Figure 4. With a low-fixed irradiance of 200 W/m 2 , the average THD was significantly increased. After the initial transient, the three-phase currents had a higher distortion, which was observed as a steadily high THD in Figure 5.
At this point, a daily natural variation of irradiance, as discussed earlier, was built in Simulink’s signal builder and fed into the DER’s input to see the THD pattern and the power production pattern. It can be seen from Figure 6 that the PV DER injected current harmonics differently into the grid although the load was linear and fixed. During the higher slope of irradiance transition from low to high or high to low, the average amount of current THD was dominantly higher than that in the state of high, steady irradiance. In the case of a sudden spike of high, steady irradiance, the harmonic distortion also showed notches. The boost converter held a perturb-and-observe (P&O) MPPT algorithm which was able to track the maximum available power, as seen in Figure 7. The DER-exported real power was visible at the PV inverter’s filter output where the reactive power remained at zero as per the designed control scheme. This helped confirming that the model was not going out of synchronization. The PCC-sided AC voltage and current wave shapes are given in Figure 8, which that also depicts the desired power-delivering capability of the designed DER-GFL inverter system.
Another aspect of understanding the harmonics propagation throughout energy systems is whether it is upstream or downstream. Downstream is related to load patterns where variable-frequency driven loads can inject harmonics. Upstream is about the generation center in injecting the harmonics. As seen in Figure 8, the grid current waveshape showed high ripples whereas the grid voltage was not distorted. This indicated the linear PQ load as used in this model had no contribution in the THD, but the upstream PV-DER and its input irradiance were related to the THD generation in this system.
The key objective of this work was to investigate the correlation of irradiance with grid current THD. In the simulation result shown in Figure 6, it is clearly observed that a high correlation exists. There are two facts to be noted from the resultant plots which are that, firstly, the current THD is proportional to irradiance fluctuations, and secondly, the THD pattern is almost inversely proportional to the irradiance profile. The critical insight from these facts can help predict consumer PQ issues in a DER-enriched grid system. The simulation results showing these high correlation characteristics spurred interest in investigating FIU’s PQ recorder’s logged data. Before that, a grid-tied DER-inverter and harmonics simulation needs to be performed in a high-switching-frequency environment. In this regard, a real-time simulation hardware platform is also a viable option to check the model’s response in real time and confirm the correlation patterns.

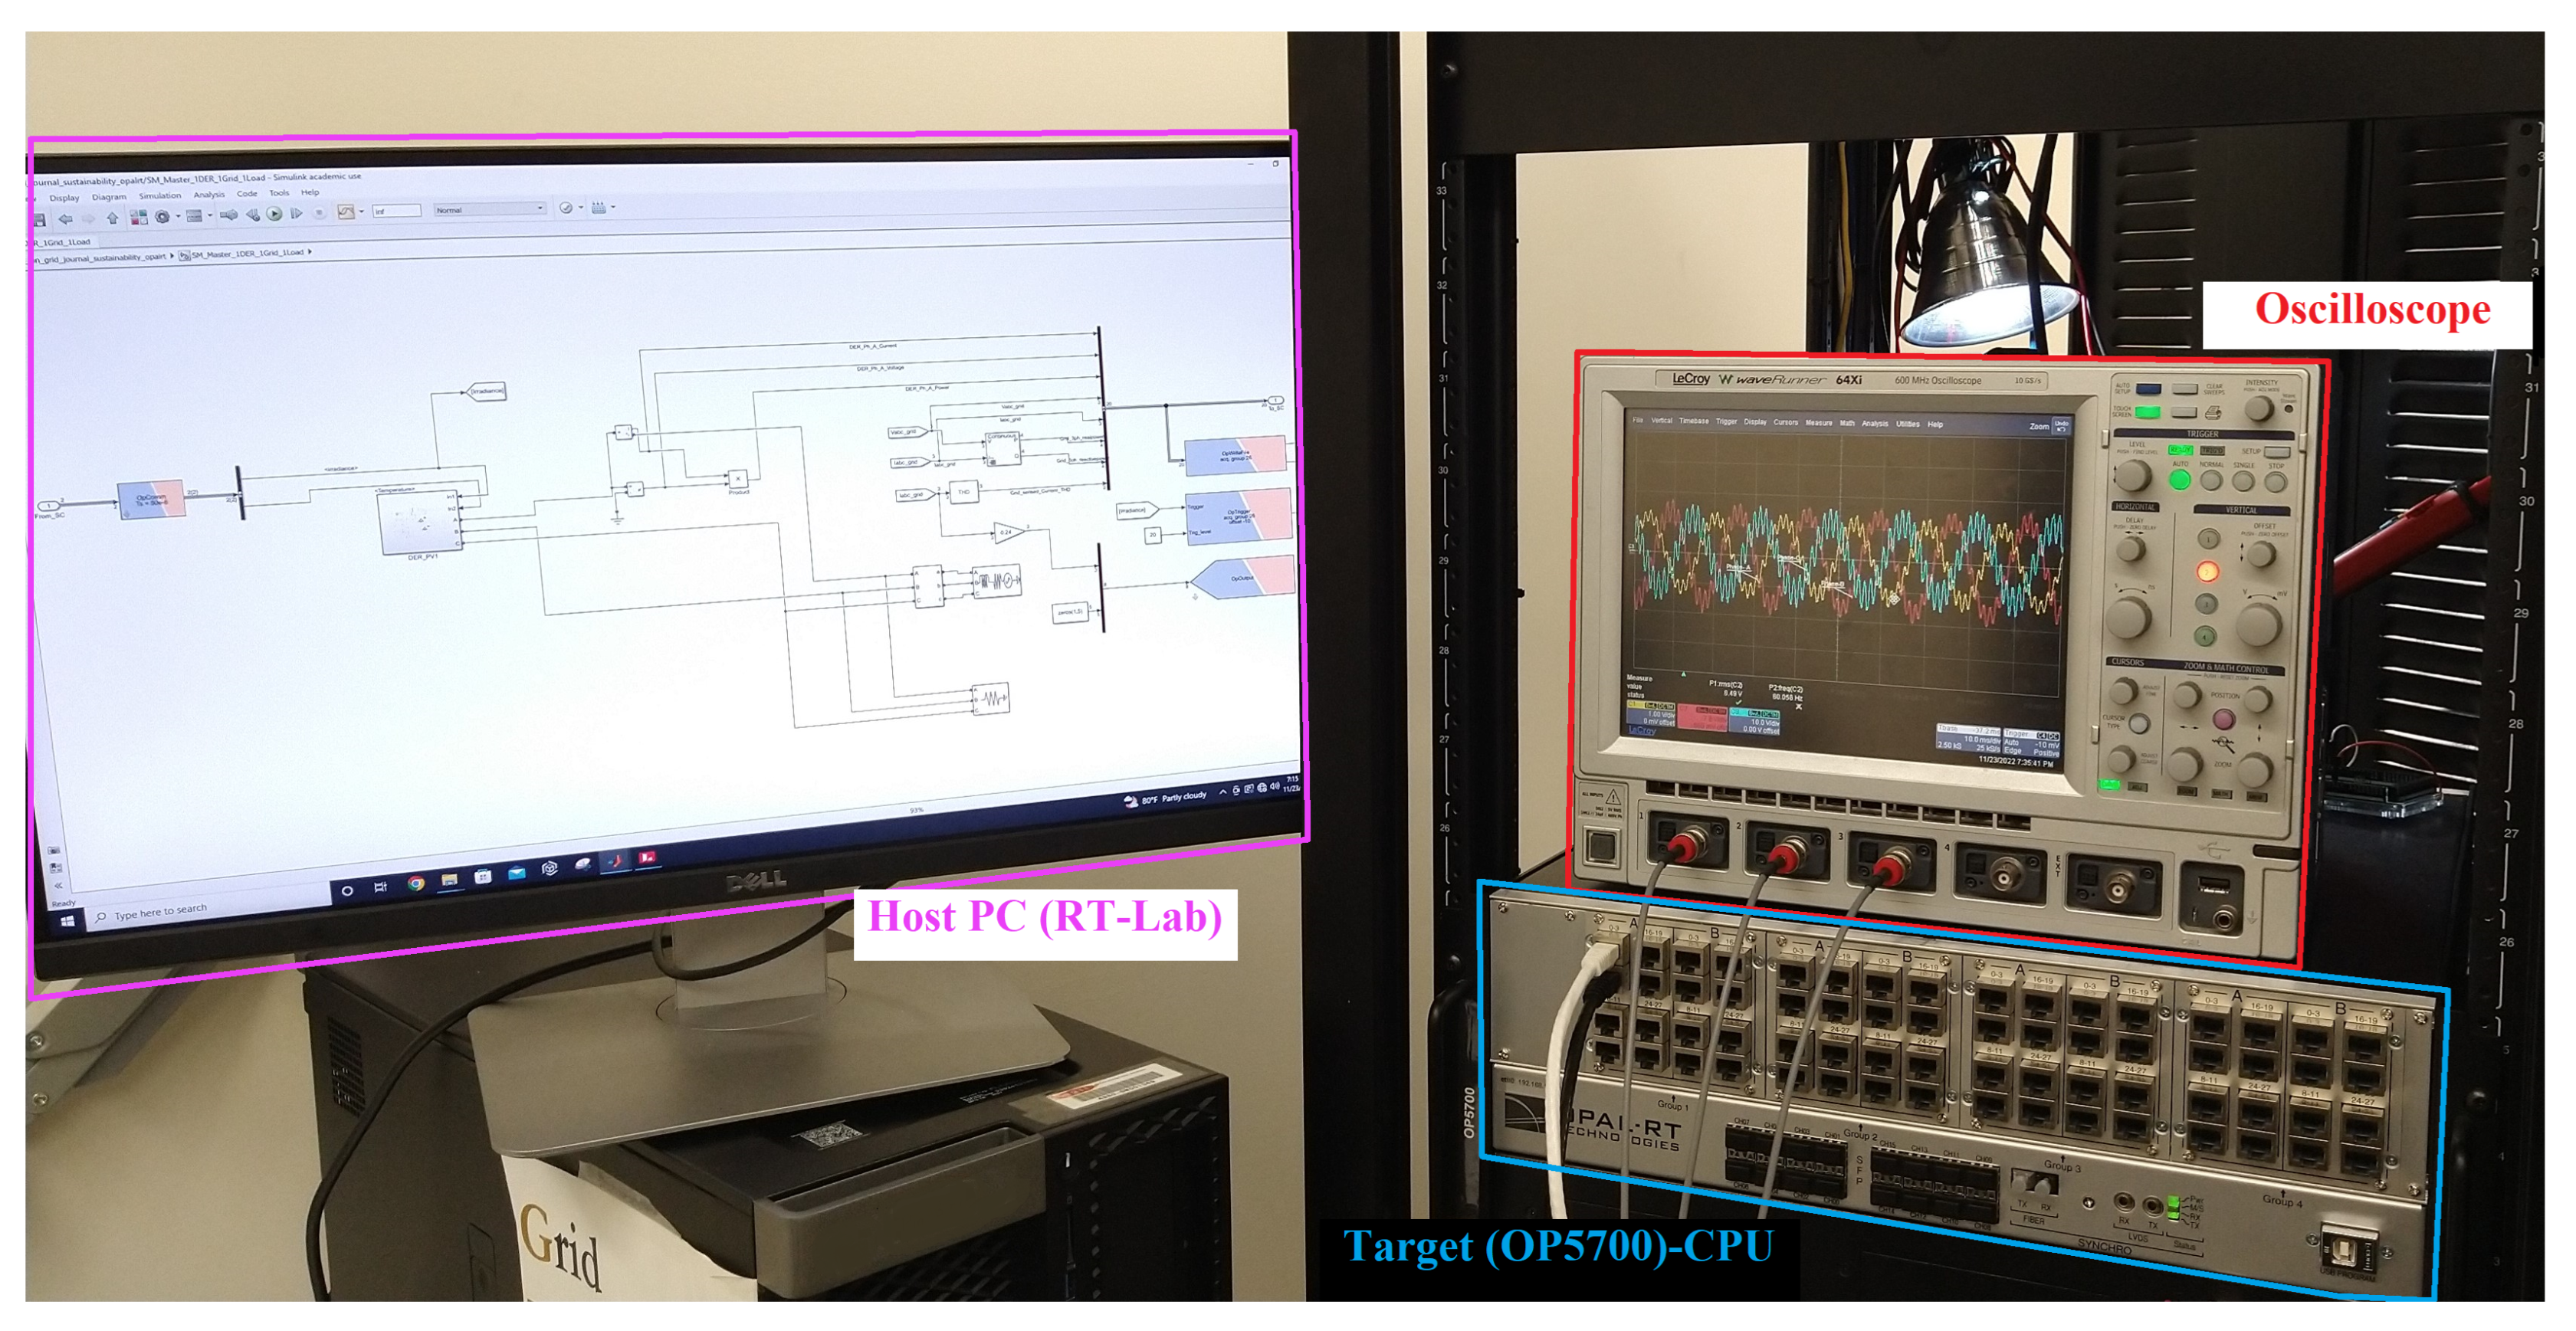
3.2. Real-Time Simulation by OPAL-RT

The HF switching-related THD pattern generation was investigated in a real-time digital simulation (RTDS) environment. The hardware instrument utilized was an OPAL-RT 5700 target and its eFPGA toolbox [38,39]. Three-phase grid currents were taken from the target into an oscilloscope from three analog outputs. A gain of 0.24 was used to constrain all the grid current parameters within the OPAL-RT 5700 limits of +/−16 V. Graphs on the oscilloscope showed the values of the parameter when the load was fixed, and the irradiance was varied from low (i.e., GHI 200 W/m 2 ) to high (i.e., GHI 800 W/m 2 ).
The laboratory setup is shown in Figure 9 where the target CPU was the OP5700 which ran the Simulink model in real time with a 50 μ s fixed step. OPAL-RT’s specialized platform of RT-LAB was used to build→load→execute the Simulink model in the target’s CPU. The Simulink model as designed in this work was reconstructed on the RT-LAB platform in such a way that there was no overrun in real time. By avoiding overrun, the high-frequency switching model was run inside the CPU of the RTDS. The grid-sided three-phase currents were taken to the oscilloscope via the analog output channels in order to observe the level of harmonic injection from the DER into the grid with the changes made on the irradiance from the host PC, acting as a user interface in the OPAL-RT setup.
The amount of distortion observed in the 60 Hz waveshape of the grid currents increased when the irradiance was increased from 200 W/m 2 to 800 W/m 2 . The results are shown in Figure 10 and Figure 11. This real-time hardware simulation results thus supported earlier findings, as presented in Figure 4, Figure 5 and Figure 6.
One phase of the grid current (phase B) was analyzed by a Fast Fourier Transform (FFT) in the RTDS and plotted on the oscilloscope. When the irradiance was varied at the host PC, the FFT spectrum depicted the quantified harmonics spectrum.
In Figure 12, the fundamental 60 Hz power frequency corresponded to the power observed at around 70 dB; however, the 12th harmonics power density magnitude reached around 70% of it. The high THD corresponding to the low irradiance was supported by this. On the other hand, the FFT spectrum shown in Figure 13 depicts a better THD or less harmonics injection, which corresponded to a high irradiance of 800 W/m 2 .
The overall findings from the RTDS simulation clearly supported the earlier findings found from the model. Hence, similar correlation characteristics of the THD with the irradiance values as those found from the two types of simulators gave a prediction that the real field PQ data logger could have a similar detection at the PCC corresponding to the daily irradiance profile.

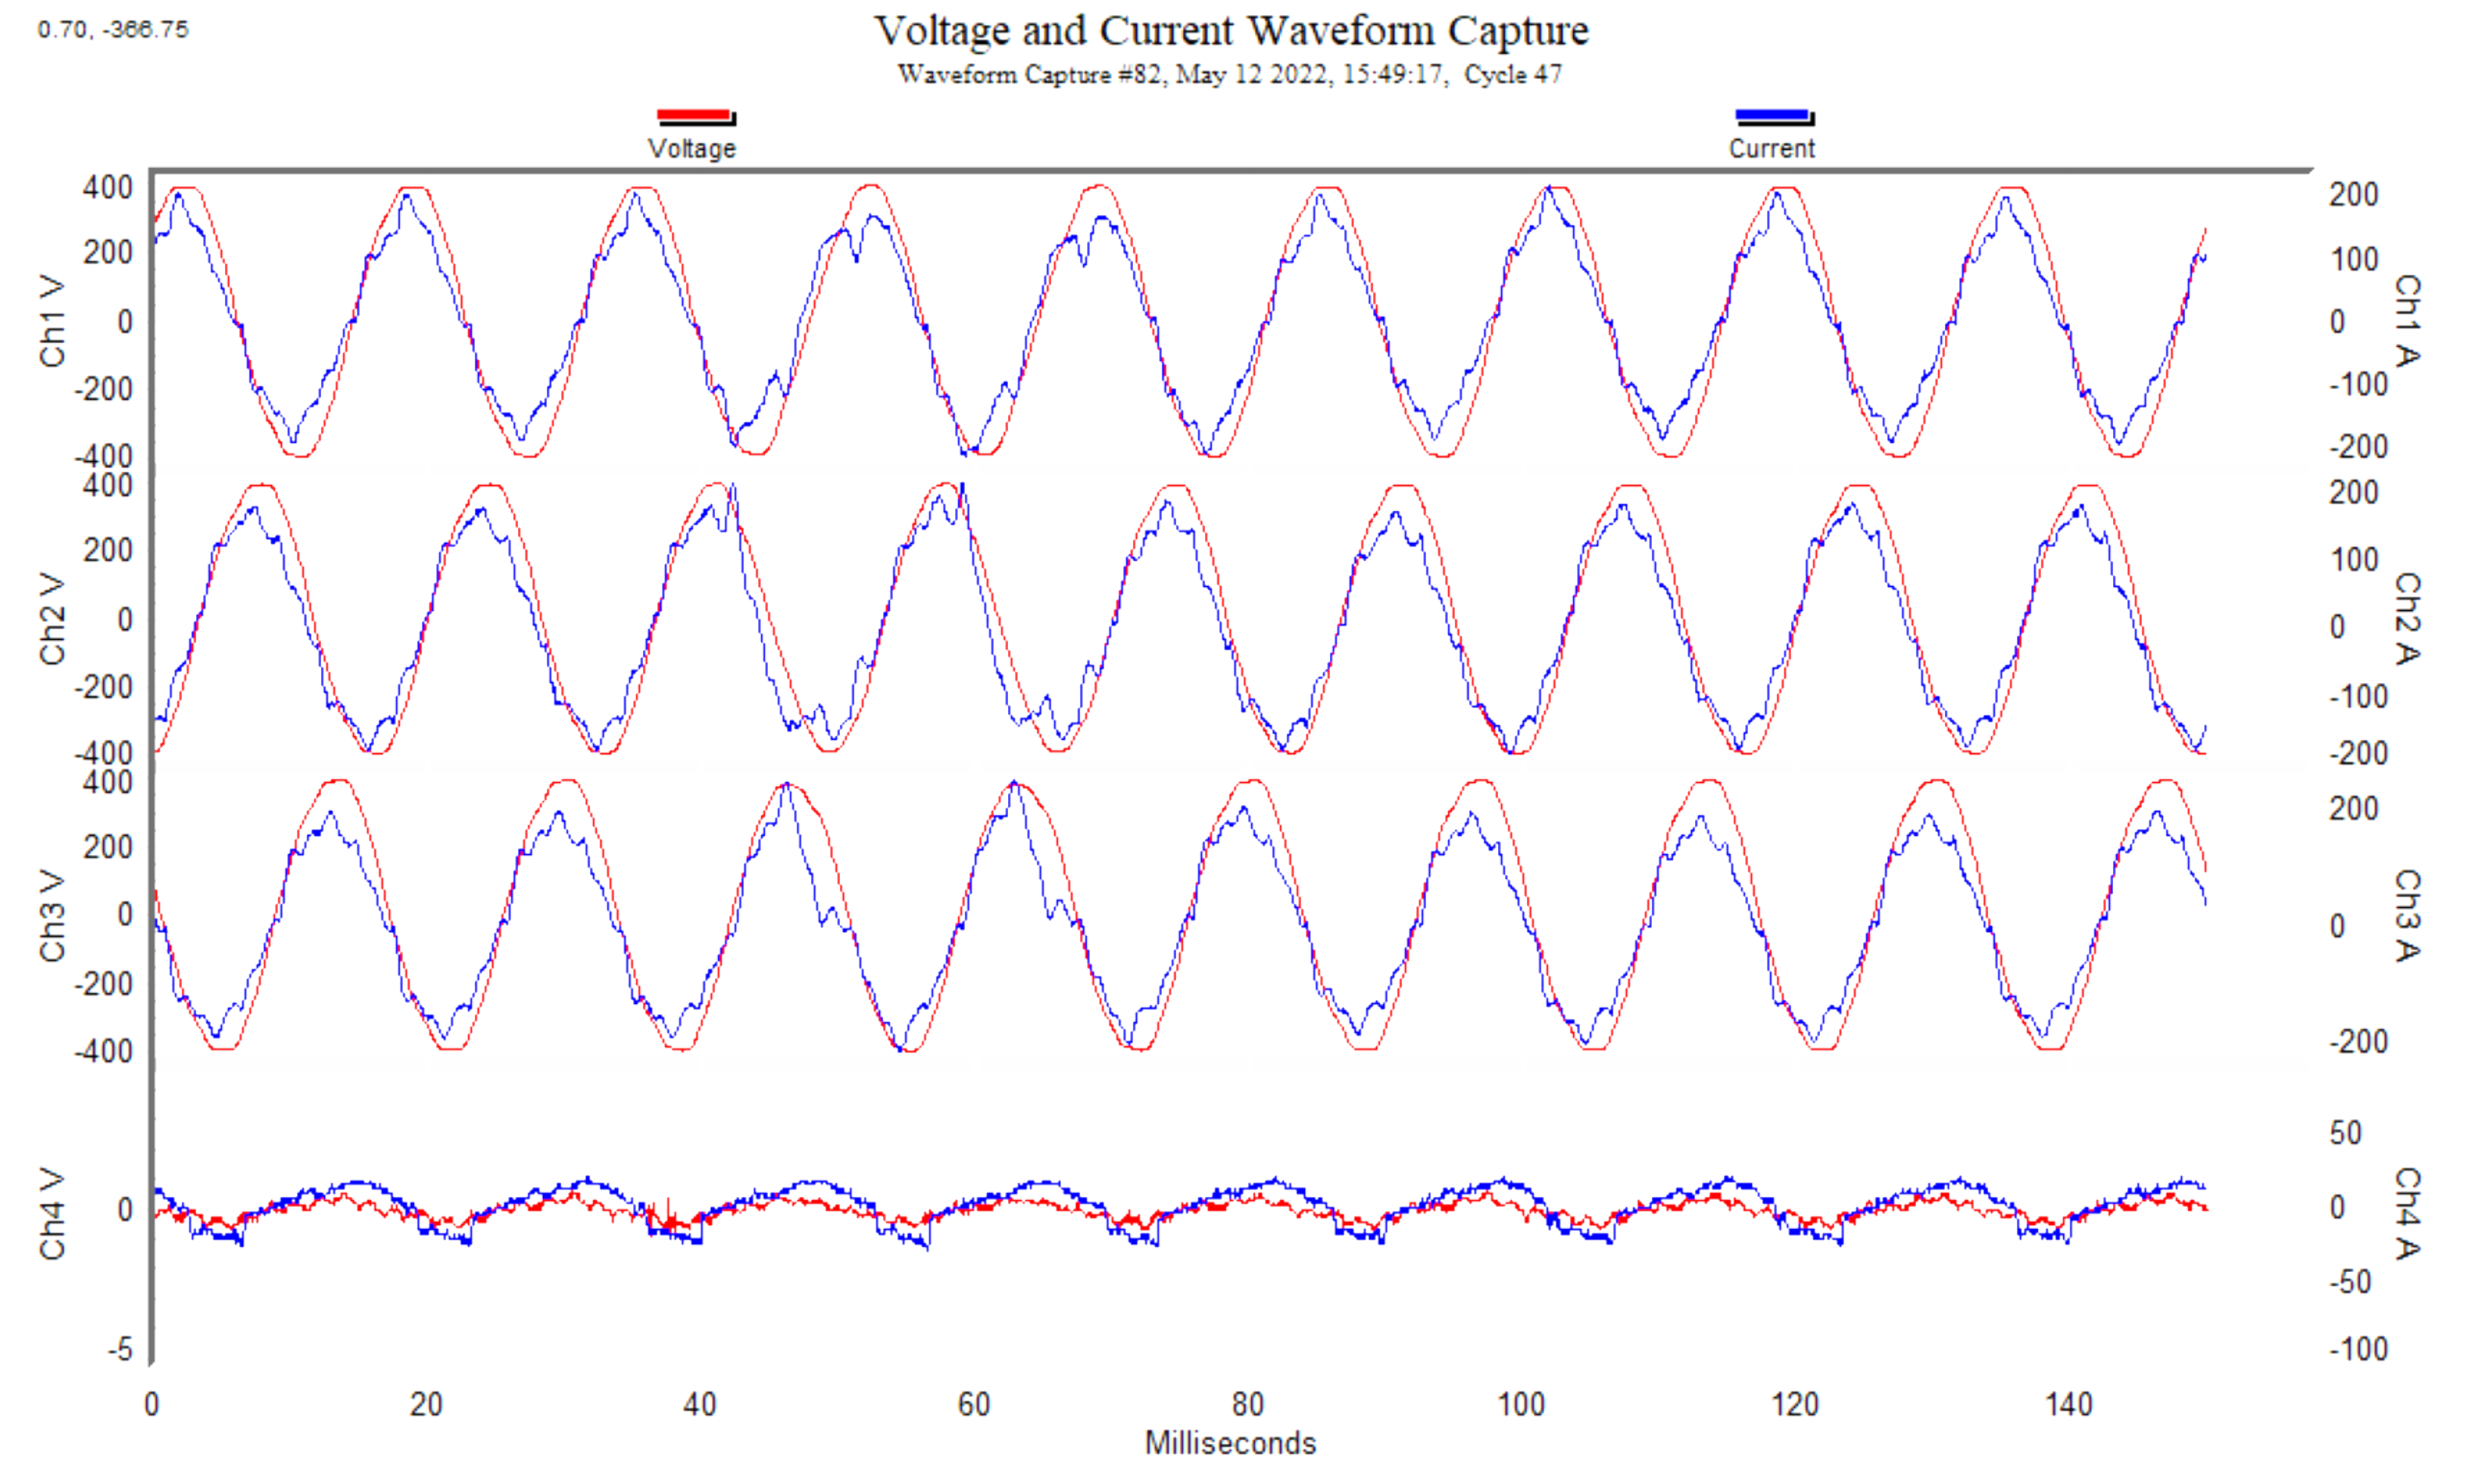
3.3. Revolution PQ Recorder Current THD Measurement at FIU’s PCC

FIU’s PQ recorder can store high-resolution data for up to 3 months. To analyze the intended effect of the irradiance on the current THD, the data from 12 May 2022 were considered. The characteristic pattern of correlation between the irradiance profile and the current THD can be observed from the irradiance profile of Figure 14 and three-phase THD profiles of Figure 15. The time-specific correlation revealed that during the morning and afternoon, the grid was heavily injected with current harmonics by the 46 inverters. It meant a lower irradiance and the fluctuation acted as catalysts for a higher current harmonic injection into the grid. The captured waveform at the PCC was also found to have some distortion over consecutive cycles, as seen in Figure 16. Channel four (or Ch4 V) did not have any signal captured by the PQ recorder; it was the fourth available redundant channel.
The simulated pattern of the current THD using real field irradiance data from 12 May 2022 is presented in Figure 17. The current THD variation pattern in this simulated output with just one DER is comparable with the PQ recorder’s logged data of 46 DERs as previously shown in Figure 15 for the irradiance profile of 12 May 2022. The power export characteristics in Figure 18 again show the model’s capability in maintaining MPPT for the whole day’s irradiance swing. The model was able to stay synchronized. As noticed on other irradiance profiles and THD patterns, similar inferences are also clear on this figure as well—the THD is getting larger while the irradiance values are getting smaller.

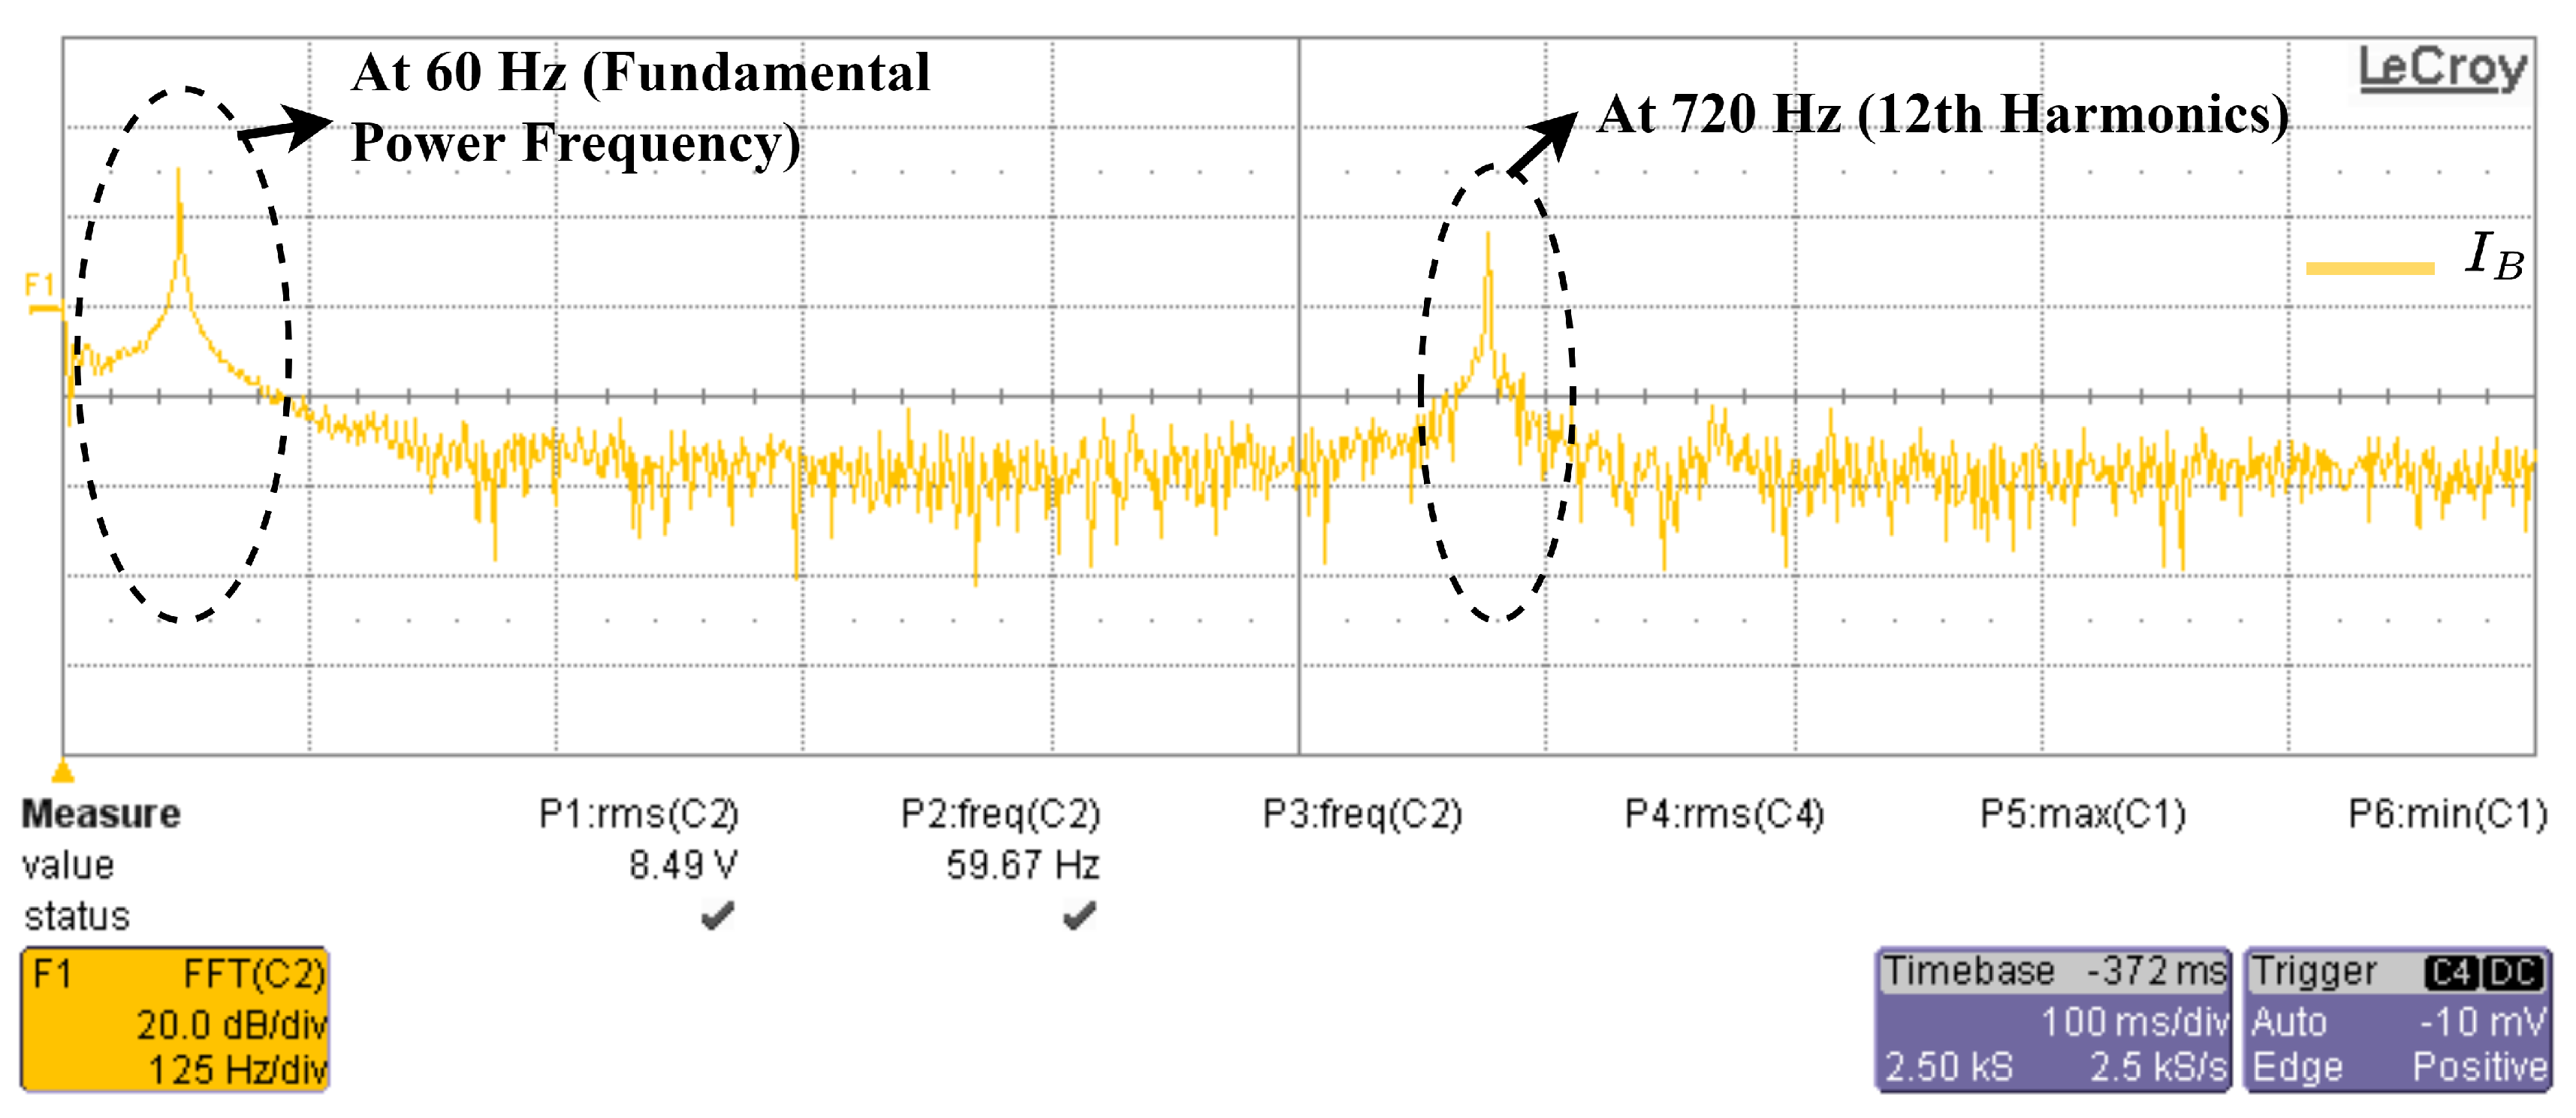
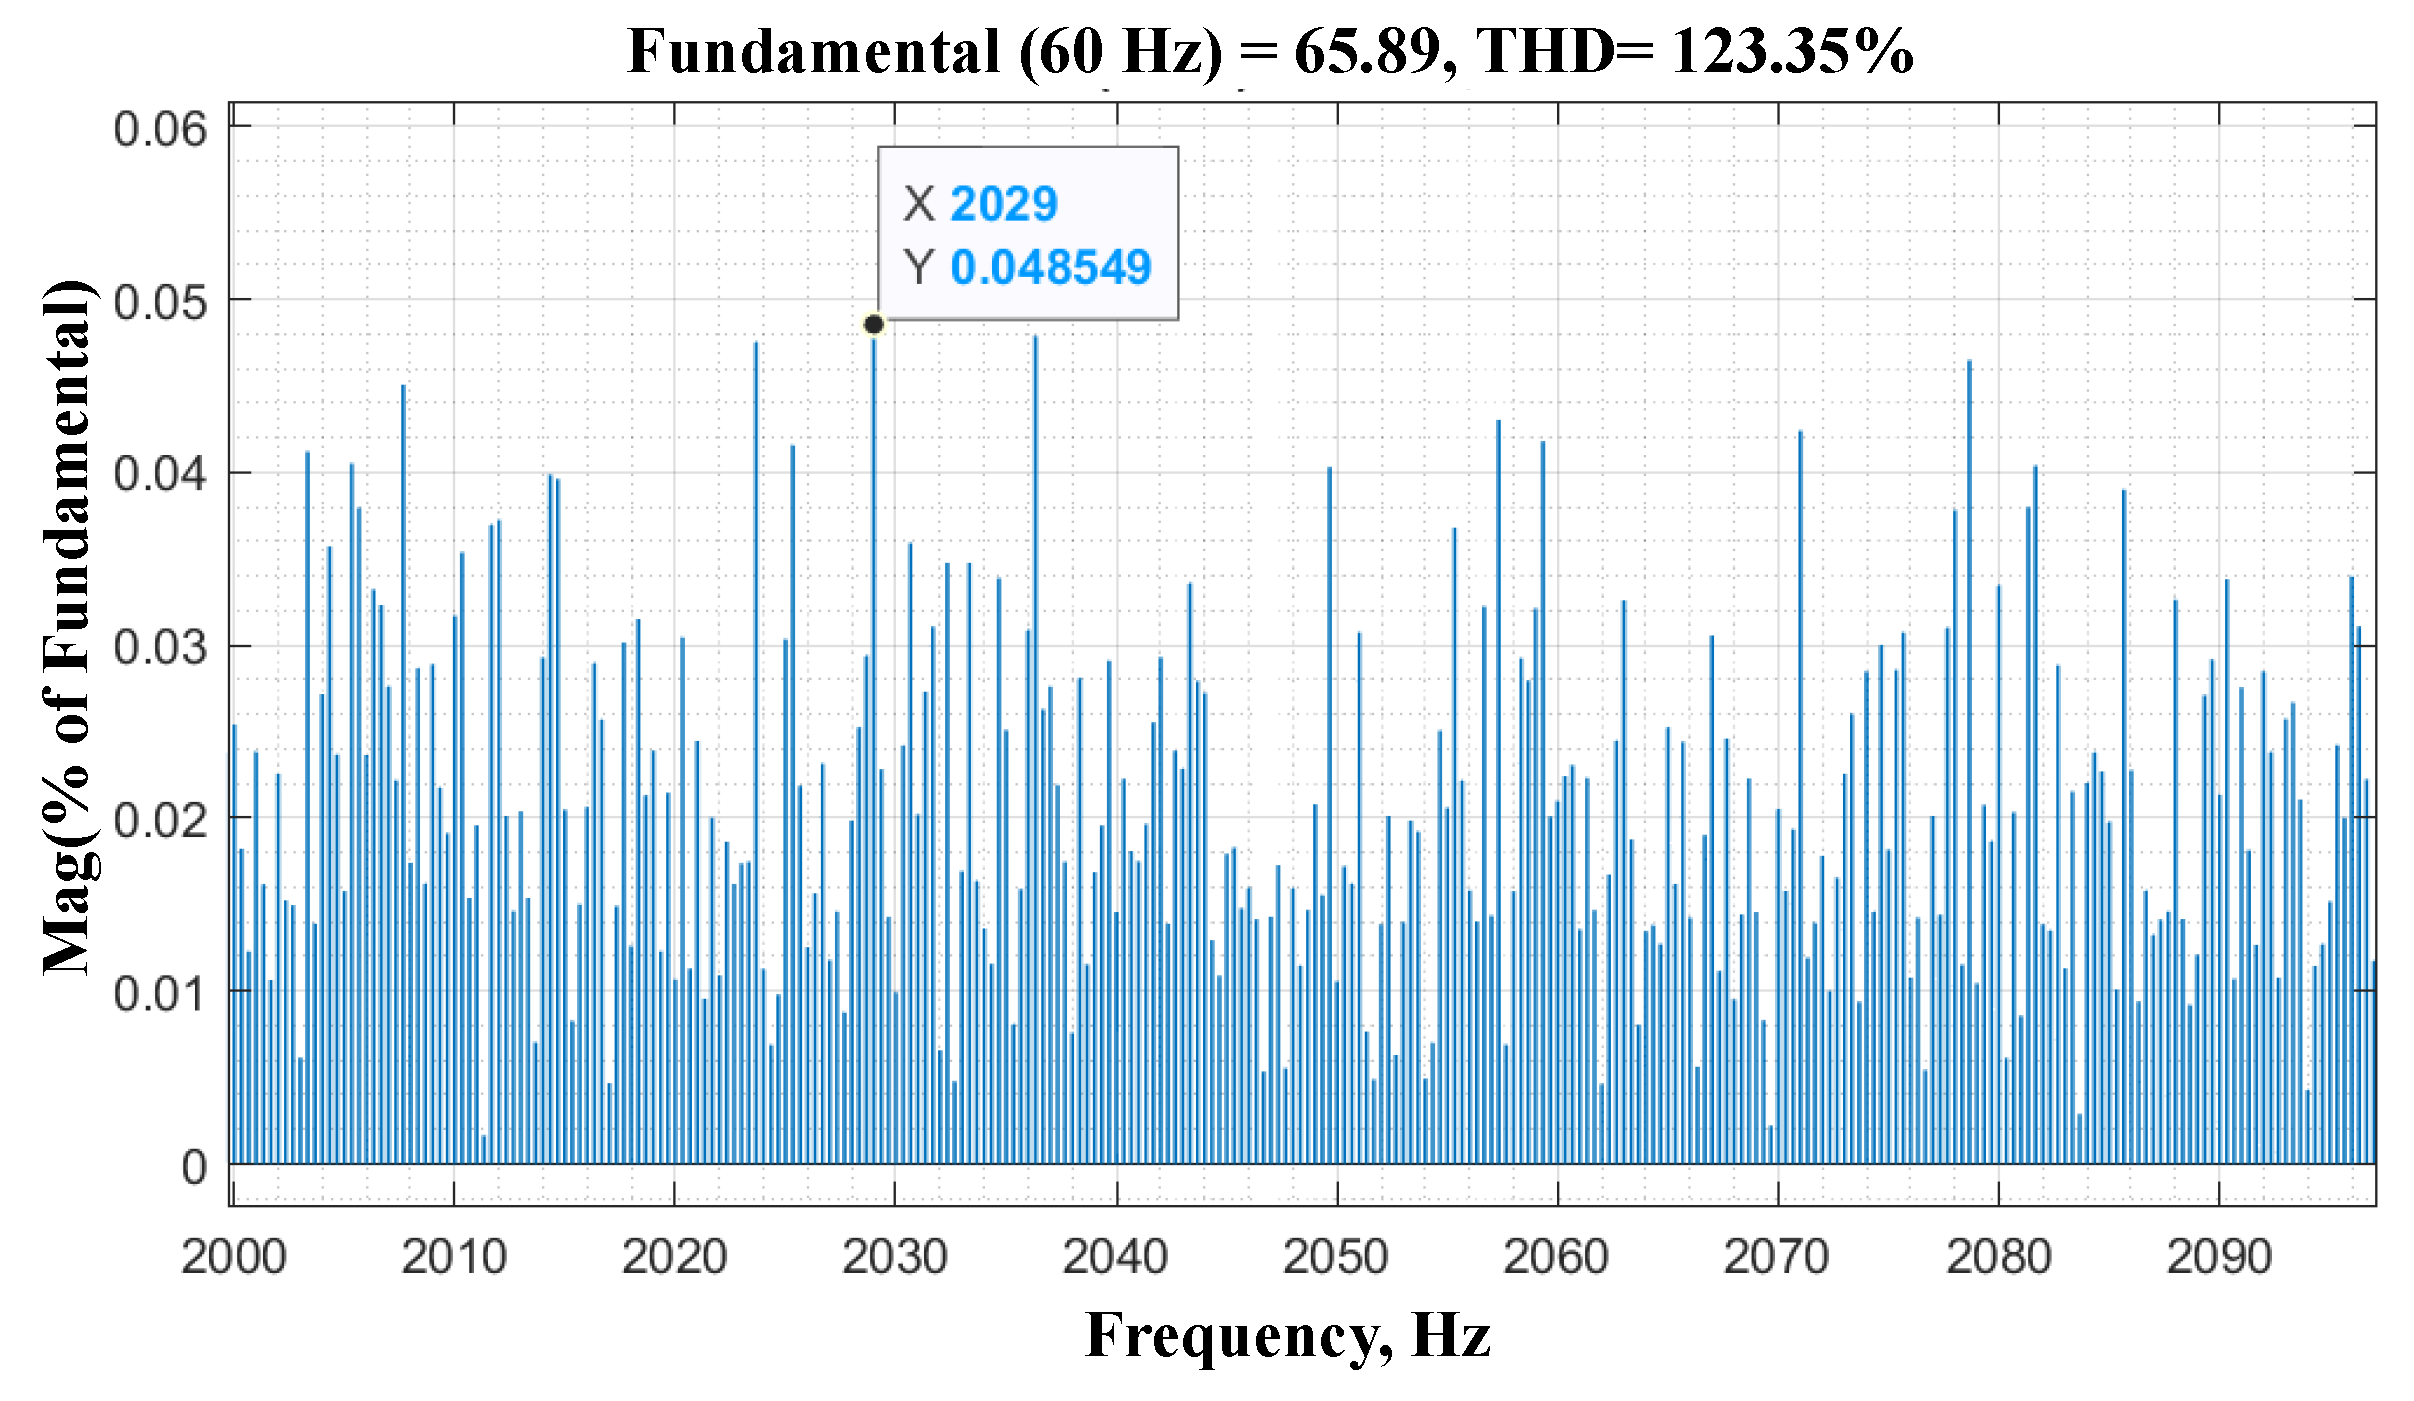
3.4. Supraharmonics Magnitude at 2 kHz Boundary

The fast Fourier transform (FFT) spectrum of the various simulation output in this work was investigated for the magnitude contribution of SH in percentage. According to the present definition of the SH band, only the starting 100 kHz band was analyzed (2000 Hz–2100 Hz) where a fixed PQ linear load was considered as connected. The objective was to understand the impact of the irradiance on the magnitude of SH. Starting from a fixed irradiance of 200 W/m 2 and 1000 W/m 2 to the varying irradiance of 12 May 2022, the results are shown in Figure 19, Figure 20, Figure 21 and Figure 22. As seen in Figure 19 and Figure 20, the amount of THD was 14.77% for an irradiance of 1000 W/m 2 and 123.35 % for an irradiance of 200 W/m 2 . The increase of SH THD percentage of magnitude was quite significant even with just one DER in operation. The whole-day irradiance variation could help further understand the net SH THD percentage seen in Figure 21 and Figure 22. The illustrated SH THD patterns from a 100 kHz frequency bandwidth showed a low magnitude with one DER, which would be a severe PQ problem in a high PV-penetrated microgrid. Table 2 summarizes the findings on the SH correlation with the irradiance.
As a result, multiple DERs connected to a weak grid can significantly increase the distortion when there is low irradiance in the first and last part of the day from a generation point of view. The findings hereby demand for specific measures to be taken in order to ensure time-specific power-quality enhancement in a DER-enriched grid. In this way, the broader improvement will lead to a feasible bidirectional grid-to-grid power-sharing architecture.

4. Conclusions and Future Work

In this work, a detailed grid-tied PV DER model consisting of a string inverter was designed, utilized, and tested in a real-time simulation. The aim was to find any correlation between the harmonics distortion and input solar irradiance. A Matlab Simulink simulation, showing the initial correlation findings, was first verified with an OPAL-RT real-time hardware simulation. Following this verification, the results were validated using information from the 1.4 MW solar power plant at FIU. According to a qualitative investigation of the DER current THD at the PCC, solar irradiance levels and fluctuations were strongly connected. The current THD amount increased significantly with a lower irradiance during the early morning and late afternoon of the daytime. This daily pattern of harmonics-related PQ issues was found to be common due to the global characteristics curve of “irradiance vs. time”. The other key finding was the correlation between the THD variation and a sudden variation of irradiance. During the simulation, SH were quantified in magnitude, demonstrating that when the irradiance was decreased from 800 to 200 W/m 2 , these known pollutants rose by 3%. This SH pollution originated from the PV generation end. It can be compounded by the load-sided nonlinear load increasing day-by-day in modern power systems.
In a bidirectional power-transfer community-grid structure, power quality assurance is a prime necessity. Understanding the relationship between daily irradiance profile and PV-injected THD, as discovered in this study, can make it possible to build a grid-to-grid power-sharing arrangement that effectively mitigates harmonics. The effect of the nonlinear load on the THD as well as higher DER numbers at the PCC will be examined in further expansions of the planned model. Afterwards, the net impact will be evaluated against the IEEE 519 standard. To propose control-based techniques for mitigating the adverse effect of irradiance on the THD is also a major future scope in this research. A physics-based neural network is one of the most promising tools that can be used to address this.

Author Contributions

Conceptualization, S.R.; formal analysis, S.R., A.D., M.T. and M.B.; funding acquisition, A.S.; investigation, A.D. and M.T.; methodology, S.R. and M.T.; supervision, A.D., M.T. and A.S.; validation, S.R. and M.B.; writing—original draft, S.R.; writing—review editing, A.D., M.T. and M.B. All authors have read and agreed to the published version of the manuscript.

Funding

This research was funded by the U.S. Department of Energy (DOE), grant number DE-EE0009349.

Institutional Review Board Statement

Not applicable.

Informed Consent Statement

Not applicable.

Data Availability Statement

Not applicable.

Acknowledgments

The authors are acknowledging the technical support provided by the GENIE Lab of FIU in accessing the OP5700 real-time simulator. This research was funded by the U.S. Department of Energy (DOE), grant number DE-EE0009349.

Conflicts of Interest

The authors declare no conflict of interest.

Abbreviations

The following abbreviations are used in this manuscript:
BESSBattery energy storage system
DASData acquisition system
DERDistributed energy resource
DIAFDistributed incremental adaptive filter
FIUFlorida International University
FLPIDFuzzy logic proportional–integral–differential
G2GGrid-to-grid
GHIGlobal horizontal index
HFHigh-frequency
HILHardware-in-loop
LCLInductor–capacitor–inductor
LMMNLeast-mean mixed-norm
LV-MV-HV(Low-medium-high) voltage
MGMicrogrid
MPPMaximum power point
NPCNeutral point clamped
PCCPoint of common coupling
PMIPower Monitor Inc.
POIPoint of interconnection
P&OPerturb and observe
PVPhotovoltaic
RTDSReal-time digital simulation
SHSupraharmonics
SHCSecond harmonic content
STCStandard test conditions
THDTotal harmonic distortion
VSCVoltage source converter

References

  1. Hussan, M.R.; Sarwar, M.I.; Sarwar, A.; Tariq, M.; Ahmad, S.; Shah Noor Mohamed, A.; Khan, I.A.; Ali Khan, M.M. Aquila Optimization Based Harmonic Elimination in a Modified H-Bridge Inverter. Sustainability 2022, 14, 929. [Google Scholar] [CrossRef]
  2. Khan, R.A.; Farooqui, S.A.; Sarwar, M.I.; Ahmad, S.; Tariq, M.; Sarwar, A.; Zaid, M.; Ahmad, S.; Shah Noor Mohamed, A. Archimedes Optimization Algorithm Based Selective Harmonic Elimination in a Cascaded H-Bridge Multilevel Inverter. Sustainability 2021, 14, 310. [Google Scholar] [CrossRef]
  3. Khajeh, K.G.; Solatialkaran, D.; Zare, F.; Mithulananthan, N. Harmonic Analysis of Multi-Parallel Grid- Connected Inverters in Distribution Networks: Emission and Immunity Issues in the Frequency Range of 0–150 kHz. IEEE Access 2020, 8, 56379–56402. [Google Scholar] [CrossRef]
  4. Kan, S.; Ruan, X.; Dang, H.; Zhang, L.; Huang, X. Second Harmonic Current Reduction in Front-End DC–DC Converter for Two-Stage Single-Phase Photovoltaic Grid-Connected Inverter. IEEE Trans. Power Electron. 2019, 34, 6399–6410. [Google Scholar] [CrossRef]
  5. Elkholy, A. Harmonics assessment and mathematical modeling of power quality parameters for low voltage grid connected photovoltaic systems. Solar Energy 2019, 183, 315–326. [Google Scholar] [CrossRef]
  6. Babu P, N.; Guerrero, J.M.; Siano, P.; Peesapati, R.; Panda, G. An Improved Adaptive Control Strategy in Grid-Tied PV System with Active Power Filter for Power Quality Enhancement. IEEE Syst. J. 2021, 15, 2859–2870. [Google Scholar] [CrossRef]
  7. Yaghoobi, J.; Zare, F.; Rehman, T.; Rathnayake, H. Analysis of High Frequency Harmonics in Distribution Networks: 9 – 150 kHz. In Proceedings of the 2019 IEEE International Conference on Industrial Technology (ICIT), Melbourne, VIC, Australia, 13–15 February 2019; pp. 1229–1234. [Google Scholar] [CrossRef]
  8. Reveles-Miranda, M.; Flota-Bañuelos, M.; Chan-Puc, F.; Ramirez-Rivera, V.; Pacheco-Catalán, D. A Hybrid Control Technique for Harmonic Elimination, Power Factor Correction, and Night Operation of a Grid-Connected PV Inverter. IEEE J. Photovolt. 2020, 10, 664–675. [Google Scholar] [CrossRef]
  9. Li, D.; Wang, T.; Pan, W.; Ding, X.; Gong, J. A comprehensive review of improving power quality using active power filters. Electr. Power Syst. Res. 2021, 199, 107389. [Google Scholar] [CrossRef]
  10. Darmawardana, D.; Perera, S.; Robinson, D.; Meyer, J.; Jayatunga, U. Important Considerations in Development of PV Inverter Models for High Frequency Emission (Supraharmonic) Studies. In Proceedings of the 2020 19th International Conference on Harmonics and Quality of Power (ICHQP), Dubai, United Arab Emirates, 6–7 July 2020; pp. 1–6. [Google Scholar] [CrossRef]
  11. Novitskiy, A.; Schlegel, S.; Westermann, D. Measurements and Analysis of Supraharmonic Influences in a MV/LV Network Containing Renewable Energy Sources. In Proceedings of the 2019 Electric Power Quality and Supply Reliability Conference (PQ) & 2019 Symposium on Electrical Engineering and Mechatronics (SEEM), Kärdla, Estonia, 12–15 June 2019; pp. 1–6. [Google Scholar] [CrossRef]
  12. Ali, A.; Almutairi, K.; Padmanaban, S.; Tirth, V.; Algarni, S.; Irshad, K.; Islam, S.; Zahir, M.H.; Shafiullah, M.; Malik, M.Z. Investigation of MPPT techniques under uniform and non-uniform solar irradiation condition—A retrospection. IEEE Access 2020, 8, 127368–127392. [Google Scholar] [CrossRef]
  13. Ali, A.; Almutairi, K.; Malik, M.Z.; Irshad, K.; Tirth, V.; Algarni, S.; Zahir, M.H.; Islam, S.; Shafiullah, M.; Shukla, N.K. Review of online and soft computing maximum power point tracking techniques under non-uniform solar irradiation conditions. Energies 2020, 13, 3256. [Google Scholar] [CrossRef]
  14. Haq, S.; Biswas, S.P.; Hosain, M.K.; Islam, M.R.; Rahman, M.A.; Muttaqi, K.M. A Modified PWM Scheme to Improve the Power Quality of NPC Inverter Based Solar PV Fed Induction Motor Drive for Water Pumping. In Proceedings of the 2021 IEEE Industry Applications Society Annual Meeting (IAS), Vancouver, BC, Canada, 10–14 October 2021; pp. 1–6. [Google Scholar]
  15. Singh, Y.; Singh, B.; Mishra, S. Control of Single-Phase Distributed PV-Battery Microgrid for Smooth Mode Transition with Improved Power Quality. IEEE Trans. Ind. Appl. 2022, 58, 6286–6296. [Google Scholar] [CrossRef]
  16. Chilipi, R.; Al Sayari, N.; Alsawalhi, J.Y. Control of single-phase solar power generation system with universal active power filter capabilities using least mean mixed-norm (LMMN)-based adaptive filtering method. IEEE Trans. Sustain. Energy 2019, 11, 879–893. [Google Scholar] [CrossRef]
  17. Singh, B.; Kumar, S. Distributed incremental adaptive filter controlled grid interactive residential photovoltaic-battery based microgrid for rural electrification. IEEE Trans. Ind. Appl. 2020, 56, 4114–4123. [Google Scholar] [CrossRef]
  18. Singh, J.K.; Al Jaafari, K.; Behera, R.K.; Al Hosani, K.; Muduli, U.R. Faster convergence controller with distorted grid conditions for photovoltaic grid following inverter system. IEEE Access 2022, 10, 29834–29845. [Google Scholar] [CrossRef]
  19. Nasr Esfahani, F.; Darwish, A.; Williams, B.W. Power converter topologies for grid-tied solar photovoltaic (PV) powered electric vehicles (EVs)—A comprehensive review. Energies 2022, 15, 4648. [Google Scholar] [CrossRef]
  20. Aghazadeh, A.; Davari, M.; Nafisi, H.; Blaabjerg, F. Grid integration of a dual two-level voltage-source inverter considering grid impedance and phase-locked loop. IEEE J. Emerg. Sel. Top. Power Electron. 2019, 9, 401–422. [Google Scholar] [CrossRef]
  21. Beniwal, N.; Tafti, H.D.; Farivar, G.G.; Ceballos, S.; Pou, J.; Blaabjerg, F. A control strategy for dual-input neutral-point-clamped inverter-based grid-connected photovoltaic system. IEEE Trans. Power Electron. 2021, 36, 9743–9757. [Google Scholar] [CrossRef]
  22. Stonier, A.A.; Murugesan, S.; Samikannu, R.; Venkatachary, S.K.; Kumar, S.S.; Arumugam, P. Power quality improvement in solar fed cascaded multilevel inverter with output voltage regulation techniques. IEEE Access 2020, 8, 178360–178371. [Google Scholar] [CrossRef]
  23. Basu, T.S.; Maiti, S. A hybrid modular multilevel converter for solar power integration. IEEE Trans. Ind. Appl. 2019, 55, 5166–5177. [Google Scholar] [CrossRef]
  24. Wang, C.; Zhang, K.; Xiong, J.; Xue, Y.; Liu, W. An efficient modulation strategy for cascaded photovoltaic systems suffering from module mismatch. IEEE J. Emerg. Sel. Top. Power Electron. 2017, 6, 941–954. [Google Scholar] [CrossRef]
  25. Lashab, A.; Sera, D.; Hahn, F.; Camurca, L.; Terriche, Y.; Liserre, M.; Guerrero, J.M. Cascaded multilevel PV inverter with improved harmonic performance during power imbalance between power cells. IEEE Trans. Ind. Appl. 2020, 56, 2788–2798. [Google Scholar] [CrossRef]
  26. Debnath, A.; Olowu, T.O.; Roy, S.; Sarwat, A. Voltage Regulation and Battery Stress-Reduction Strategy for DC microgrid. In Proceedings of the 2021 6th IEEE Workshop on the Electronic Grid (eGRID), New Orleans, LA, USA, 8–10 November 2021; pp. 1–6. [Google Scholar] [CrossRef]
  27. Debnath, A.; Roy, S.; Olowu, T.O.; Parvez, I.; Sarwat, A. A Unified Controller for Hybrid PV-Battery system with DC Microgrid Voltage Regulation in Grid-connected and Islanding-mode. In Proceedings of the 2022 IEEE Industry Applications Society Annual Meeting (IAS), Detroit, MI, USA, 9–14 October 2022; pp. 1–6. [Google Scholar] [CrossRef]
  28. Debnath, A.; Olowu, T.O.; Roy, S.; Parvez, I.; Sarwat, A. Particle Swarm Optimization-based PID Controller Design for DC-DC Buck Converter. In Proceedings of the 2021 North American Power Symposium (NAPS), College Station, TX, USA, 14–16 November 2021; pp. 1–6. [Google Scholar] [CrossRef]
  29. Sarwat, A.; McCluskey, P.; Mazumder, S.K.; Russell, M.; Roy, S.; Tufail, S.; Dharmasena, S.; Stevenson, A. Reliability Assessment of Grid Connected Solar Inverters in 1.4 MW PV Plant from Anomalous Classified Real Field Data. Available online: https://mazumder.lab.uic.edu/wp-content/uploads/sites/504/2022/08/NAPS_paper_619.pdf (accessed on 5 January 2023).
  30. Li, S.; Fairbank, M.; Johnson, C.; Wunsch, D.C.; Alonso, E.; Proao, J.L. Artificial Neural Networks for Control of a Grid-Connected Rectifier/Inverter Under Disturbance, Dynamic and Power Converter Switching Conditions. IEEE Trans. Neural Netw. Learn. Syst. 2014, 25, 738–750. [Google Scholar] [CrossRef] [PubMed] [Green Version]
  31. Hoarcă, I.C. Mathematical modeling and simulation of PV systems Part I: Mathematical modeling and Simulink implementation. In Proceedings of the 2021 International Conference on Applied and Theoretical Electricity (ICATE), Craiova, Romania, 27–29 May 2021; pp. 1–6. [Google Scholar] [CrossRef]
  32. Raya-Armenta, J.M.; Ortega, P.R.; Bazmohammadi, N.; Spataru, S.V.; Vasquez, J.C.; Guerrero, J.M. An Accurate Physical Model for PV Modules With Improved Approximations of Series-Shunt Resistances. IEEE J. Photovolt. 2021, 11, 699–707. [Google Scholar] [CrossRef]
  33. Zhang, C.; Zhang, Y.; Su, J.; Gu, T.; Yang, M. Modeling and Prediction of PV Module Performance Under Different Operating Conditions Based on Power-Law I–V Model. IEEE J. Photovolt. 2020, 10, 1816–1827. [Google Scholar] [CrossRef]
  34. Zhong, C.; Li, H.; Zhou, Y.; Lv, Y.; Chen, J.; Li, Y. Virtual synchronous generator of PV generation without energy storage for frequency support in autonomous microgrid. Int. J. Electr. Power Energy Syst. 2022, 134, 107343. [Google Scholar] [CrossRef]
  35. Photovoltaics, D.G.; Storage, E. IEEE Application Guide for IEEE Std 1547™, IEEE Standard for Interconnecting Distributed Resources with Electric Power Systems; IEEE: Piscataway, NJ, USA, 2009. [Google Scholar]
  36. Siyuan, Z.; Jiannan, Z.; Zhen, M.; Xuanzhe, Z.; Yong, F.; Zhiqian, L.; Guangzheng, Y. A Novel Supraharmonics Measurement Method Based on Flexible Atom Filtering. In Proceedings of the 2019 4th International Conference on Intelligent Green Building and Smart Grid (IGBSG), Yichang, China, 6–9 September 2019; pp. 113–117. [Google Scholar] [CrossRef]
  37. Yalcin, T.; Özdemir, M.; Kostyla, P.; Leonowicz, Z. Analysis of supra-harmonics in smart grids. In Proceedings of the 2017 IEEE International Conference on Environment and Electrical Engineering and 2017 IEEE Industrial and Commercial Power Systems Europe (EEEIC / I&CPS Europe), Milan, Italy, 6–9 June 2017; pp. 1–4. [Google Scholar] [CrossRef]
  38. OPAR-RT Energy Conversion. Available online: https://www.opal-rt.com/energy-conversion-controls/ (accessed on 16 November 2022).
  39. OPAR-RT eFPGA. Available online: https://www.opal-rt.com/systems-efpgasim/ (accessed on 16 November 2022).
Figure 1. Flowchart of the analytical method.
Sustainability 15 01214 g001
Figure 2. Simulation setup for grid-tied PV system.
Sustainability 15 01214 g002
Figure 3. FIU’s solar canopy data loggers: (a) Revolution® PQ recorder at the PCC/POI; (b) DAS panel with wireless data communication capability.
Sustainability 15 01214 g003
Figure 4. Current THD at PCC vs. fixed irradiance.
Sustainability 15 01214 g004
Figure 5. Current THD at PCC vs. fixed low irradiance.
Sustainability 15 01214 g005
Figure 6. Current THD at PCC vs. irradiance variation.
Sustainability 15 01214 g006
Figure 7. DER−to−gridreal and reactive power.
Sustainability 15 01214 g007
Figure 8. DER−to−grid AC output voltage and current.
Sustainability 15 01214 g008
Figure 9. Real-time simulation setup with OPAL-RT 5700.
Sustainability 15 01214 g009
Figure 10. Three−phase grid current in real-time simulation for a low irradiance of 200 W/m 2 .
Sustainability 15 01214 g010
Figure 11. Three−phase grid current in real-time simulation for a high irradiance of 800 W/m 2 .
Sustainability 15 01214 g011
Figure 12. Grid−current (Phase B) FFT spectrum at a low irradiance of 200 W/m 2 .
Sustainability 15 01214 g012
Figure 13. Grid−current (Phase B) FFT spectrum at a high irradiance of 800 W/m 2 .
Sustainability 15 01214 g013
Figure 14. Field irradiance profile of 12 May 2022.
Sustainability 15 01214 g014
Figure 15. Current−THD on 12 May 2022 captured by Revolution PQ recorder at the PCC.
Sustainability 15 01214 g015
Figure 16. Captured− waveform on 12 May 2022 by Revolution PQ recorder at the PCC.
Sustainability 15 01214 g016
Figure 17. Simulated current THD vs. irradiance variation of 12 May 2022.
Sustainability 15 01214 g017
Figure 18. Simulated−DER real and reactive power flow of 12 May 2022.
Sustainability 15 01214 g018
Figure 19. SH−magnitude with a fixed, high irradiance.
Sustainability 15 01214 g019
Figure 20. SH−magnitude with a fixed, low irradiance.
Sustainability 15 01214 g020
Figure 21. SH−magnitude with a varying irradiance.
Sustainability 15 01214 g021
Figure 22. SH−magnitude with irradiance from 12 May 2022.
Sustainability 15 01214 g022
Table 1. FIU’s 1.4 MW solar canopy setup detail 1.
Total DC kWModule Size (W)PV Module NumberCapacity per Inverter (kW)Inverter BrandInverter Size (kW)Inverter NumberCapacity Net Inverter (kW)Capacity Net Module (kW)DC/AC Ratio
1412.33315.462 × 152025.22SMA246144151.3211.05
315.461 × 134031.525SMA24409601261.0121.31
1 This tabulated information refer to the FIU’s site commissioning report.
Table 2. Summary of SH correlation with irradiance.
Supraharmonics (2000–2100), Hz Attributes
Irradiance CasesTHD, %Highest Magnitude, %Irradiance − SH Correlation
Low, fixed, 200 W/m 2 123.350.0485Low, high
High, fixed, 800 W/m 2 14.770.012High, low
Varying, 12 May 2022128.120.034Varying, high
Disclaimer/Publisher’s Note: The statements, opinions and data contained in all publications are solely those of the individual author(s) and contributor(s) and not of MDPI and/or the editor(s). MDPI and/or the editor(s) disclaim responsibility for any injury to people or property resulting from any ideas, methods, instructions or products referred to in the content.

