Article

Designing and Building an Intelligent Pavement Management System for Urban Road Networks

Faculty of Construction Engineering, École de Technologie Supérieure, 1100 Notre-Dame St. W, Montreal, QC H3C 1K3, Canada
*
Author to whom correspondence should be addressed.
Sustainability 2023, 15(2), 1157; https://doi.org/10.3390/su15021157
Submission received: 30 October 2022 / Revised: 30 December 2022 / Accepted: 4 January 2023 / Published: 7 January 2023

Abstract

:
Pavement maintenance plays a significant role in megacities. Managing complaints and scheduling road reviews are the two maintenance concerns under the intelligent pavement management system (PMS) plan. In contrast, if the damages are not treated immediately, they will increase over time. By leveraging accurate data from sensors, smart PMS will improve management capability, support sustainability, and drive economic growth in the road network. This research aimed to elaborate on the different modules of an intelligent city pavement network to advance to a sustainable city. First, a 3D mobile light detection and ranging (LiDAR) sensor, accompanied by a camera, was applied as the data collection tool. Although 3D mobile LiDAR data have gained popularity, they lack precise detection of pavement distresses, including cracks. As a result, utilizing RGB imaging may help to detect distresses properly. Two approaches were integrated alongside conducting the data analysis in this paper: (1) ArcGIS pro, developed by Esri Inc., which includes noise removal, digital elevation model (DEM) generation, and pavement and building footprint extraction; (2) the Mechanistic-Empirical Pavement Design Guide (AASHTOWare PMED), which was used to assess site specifications such as traffic, weather, subbase, and current pavement conditions in an effort to design the most appropriate pavement for each road section. For the 3D visualization module, CityEngine (a software from Esri) was used to provide the 3D city model. After implementing the research methodology, we drew the following conclusions: (1) using the AASHTOWare PMED method to make decisions about road maintenance and rehabilitation(M&R) actions can significantly speed up the decision-making process, essentially saving time and money and shortening the project’s duration; and (2) if the road conditions are similar, the smart geographical information system (GIS)-based PMS can make consistent decisions about road M&R strategies, i.e., the interference from human factors is less significant.

1. Introduction

Roads are critical to the economic growth and development of a megacity for transportation and building activities. Providing access to employment, social, health, and educational services is a vital role that road networks play in reducing poverty. As a result, researchers and city officials have been very interested in studying road maintenance as a significant aspect of urban infrastructure, one includes a network of pavements in all surrounding cities. Overall, in all weather conditions, pavements ensure safe and comfortable rides in any car moving at an average speed. The life cycle of a road can be measured by the number of years it has been used for its intended purpose. Due to the significant importance of road network health and its maintenance in citizens’ daily life, this topic should be appropriately addressed in academic plans.
The condition of a city’s road infrastructure directly impacts people’s quality of life [1], influencing residents’ safety, health, work, economic opportunities, and leisure activities [1]. As a result, because every action taken is very complicated and socially sensitive, action requires extensive consideration. To cope with such issues, municipalities frequently face significant challenges concerning planning development; for example, when they need to find a solution that fits the expectations of all stakeholders, which is critical, but is also consistent with the planned development concept. Public decision-making processes are constrained by specified budgeting for construction, maintenance, and remediation work on road infrastructure. Prioritizing projects is a crucial and challenging issue that must be resolved to effectively develop and implement a road infrastructure plan [2]. Therefore, regular pavement evaluation is an essential part of a municipality’s agenda.
When considering either municipal or technical aspects of the urban pavement maintenance procedure, it is essential to determine each road section’s condition and rate of pavement deterioration to plan for the financial costs of a maintenance strategy in a municipal budgeting program. To meet the optimal structural rehabilitation design and future budget needs, a technical evaluation of the road network’s quality based on a pavement management system (PMS) is required. PMSs have various tools and methods which help decision makers determine the most appropriate strategy for maintaining, evaluating, and providing pavements over a long period [3].
In previous decades, there have been some attempts all around the world to run efficient, knowledge-based PMSs. These were successful to some extent, but produced some inaccurate results. With the advent of innovative technologies such as the internet of things (IoT), machine learning (ML), and artificial intelligence (AI), of the number of municipalities attempting to apply intelligent urban infrastructure to overcome the defects of traditional systems is growing exponentially [4,5].
The process of creating a PMS and planning the best maintenance procedures for urban roads is influenced by the texture and skid resistance of the road’s surface, both of which contribute to the occurrence of traffic accidents, a significant social issue. The following are some key conclusions from an examination of elements relating to tire–road friction, as well as a well-liked and cutting-edge method for evaluating the crucial part of road safety; namely, the use of smart tires or tires implanted with sensors [6]:
  • Under different weather conditions, such as dry, wet, dusty, and snowy road surfaces, or combinations of these variables, a vehicle’s maneuvering and braking abilities are affected by the skid resistance of the pavement, which is directly related to tire–road friction.
  • Friction measures are usually included in the scope of a PMS because of its importance in and relevance to road occurrences.
  • The advantages of using smart sensors implanted in tires are similar to those of using a tool to support sophisticated vehicle control, but smart sensors also provide a practical method of determining in real-time the amount of friction on a roadway section while travelling.
Smart urban infrastructures are founded on four principles: data, analytics, feedback, and flexibility in an urban environment. In addition to their physical structure (cables, sensors, etc.), a city’s smart infrastructure can be characterized as a cyber-physical system that integrates all its aspects using various technological tools. These tools help acquire and analyze data to meet efficiency, sustainability, productivity, and safety goals. In a city, smart infrastructure refers to an intelligent system that leverages a data feedback loop to improve decision making. Sensor data can measure, analyze, monitor, communicate, and act on such an intelligent system (smart infrastructures, i.e., essential for smart cities) [7]. The following list describes the features that compose an intelligent urban infrastructure system:
  • Data: It is essential for an intelligent system to perform that the raw material that a smart infrastructure needs is present.
  • Analytics: Information analysis is essential to obtain reliable data for decision making.
  • Feedback: An intelligent system must have a data feedback loop. This feedback is visible when data is collected, utilized, and used to improve the system’s functionality.
  • Adaptability: Smart systems can adjust to current demands and accommodate future needs.
Considering intelligent urban infrastructures as spatial phenomena in nature, and the capacity of GIS to work with spatial data, the integration of GIS and PMS will move to resolve taxpayers’ concerns in a city. GIS is the best tool for improving pavement management since it can evaluate geographical data, especially regarding features such as a graphical depiction of pavement conditions. Government agencies are gradually integrating PMS data into GIS, as GIS is used more frequently and is becoming more valuable due to technological advancements in computer hardware and software. Flexible database editing and the ability to view statistics, charts, and the results of database queries are all advantages of this integration. Additional benefits include pavement management analysis on a road system map, dynamic highway section color coding, and access to sectional data through graphical 3D GIS models.
Reconstruction of 3D GIS models, high-definition mapping, and new applications for cities require accurate and efficient data collection and scene perception of urban environments [8]. Over the previous decade, many urban modeling studies have relied chiefly on aerial and 2D satellite data [9,10]. Additionally, self-driving car research has mainly relied extensively on 2D photos acquired by digital cameras [11]. Therefore, the need for an interrelated system of both 3D GIS and PMS is urgently felt among researchers.
Providing pavement design methods in a 3D GIS model, with different attitudes being utilized to optimize the serviceability of each road section, is in high demand. As far as the writers of this paper are aware, no study has covered this issue until now. Both the design and implementation of a smart urban infrastructure management system (SUIMS), such as the one developed here, could lead to clarification and briefing of the linked regulation to improve dealing with massive datasets in PMS, by combining accessible processes and overcoming the traditional operation difficulties at the same time. Additionally, the SUIMS could take advantage of a connected computerized framework integrating the city’s public capabilities to accomplish collaborative improvement, which has never been discussed before.
A city pavement network management system emphasizing the different components of an intelligent urban infrastructure management system is elaborated on in this paper. First, a mobile LiDAR sensor accompanied by a camera mounted on top of a car was used to collect data. Even though 3D mobile LiDAR data has become increasingly popular, thus method cannot accurately detect pavement distress, such as cracks. By using RGB images, it may be possible to extract distresses correctly. Like every other urban management system, for the designed structure, it is necessary to conduct the analysis and provide the results in an appropriate visualized form in the final step. Therefore, the most significant contributions of this paper are:
  • To build an urban outdoor point cloud dataset labeled pointwise on a large scale for SUIMS in terms of pavements.
  • To investigate an integrated road network consisting of the positions (via 3D LiDAR point cloud) and attribute information of the detected cracks, collected via RGB images.
  • To produce a detailed 3D intelligent pavement management system based on city stakeholders’ decision-making preferences.
This article is divided into five major sections: Section 2 provides a broad review of the literature, including data, analysis tools, visualization, and the relationships between them. Section 3 details the methodology followed in this study to meet the research objective and fill the research gap. Section 4 introduces the study area, defines the data used in this research, and the produced result is presented based on GIS and PMS integration. Finally, Section 5 concludes the article and proposes future trends in the smart PMS and GIS field.

2. Literature Review

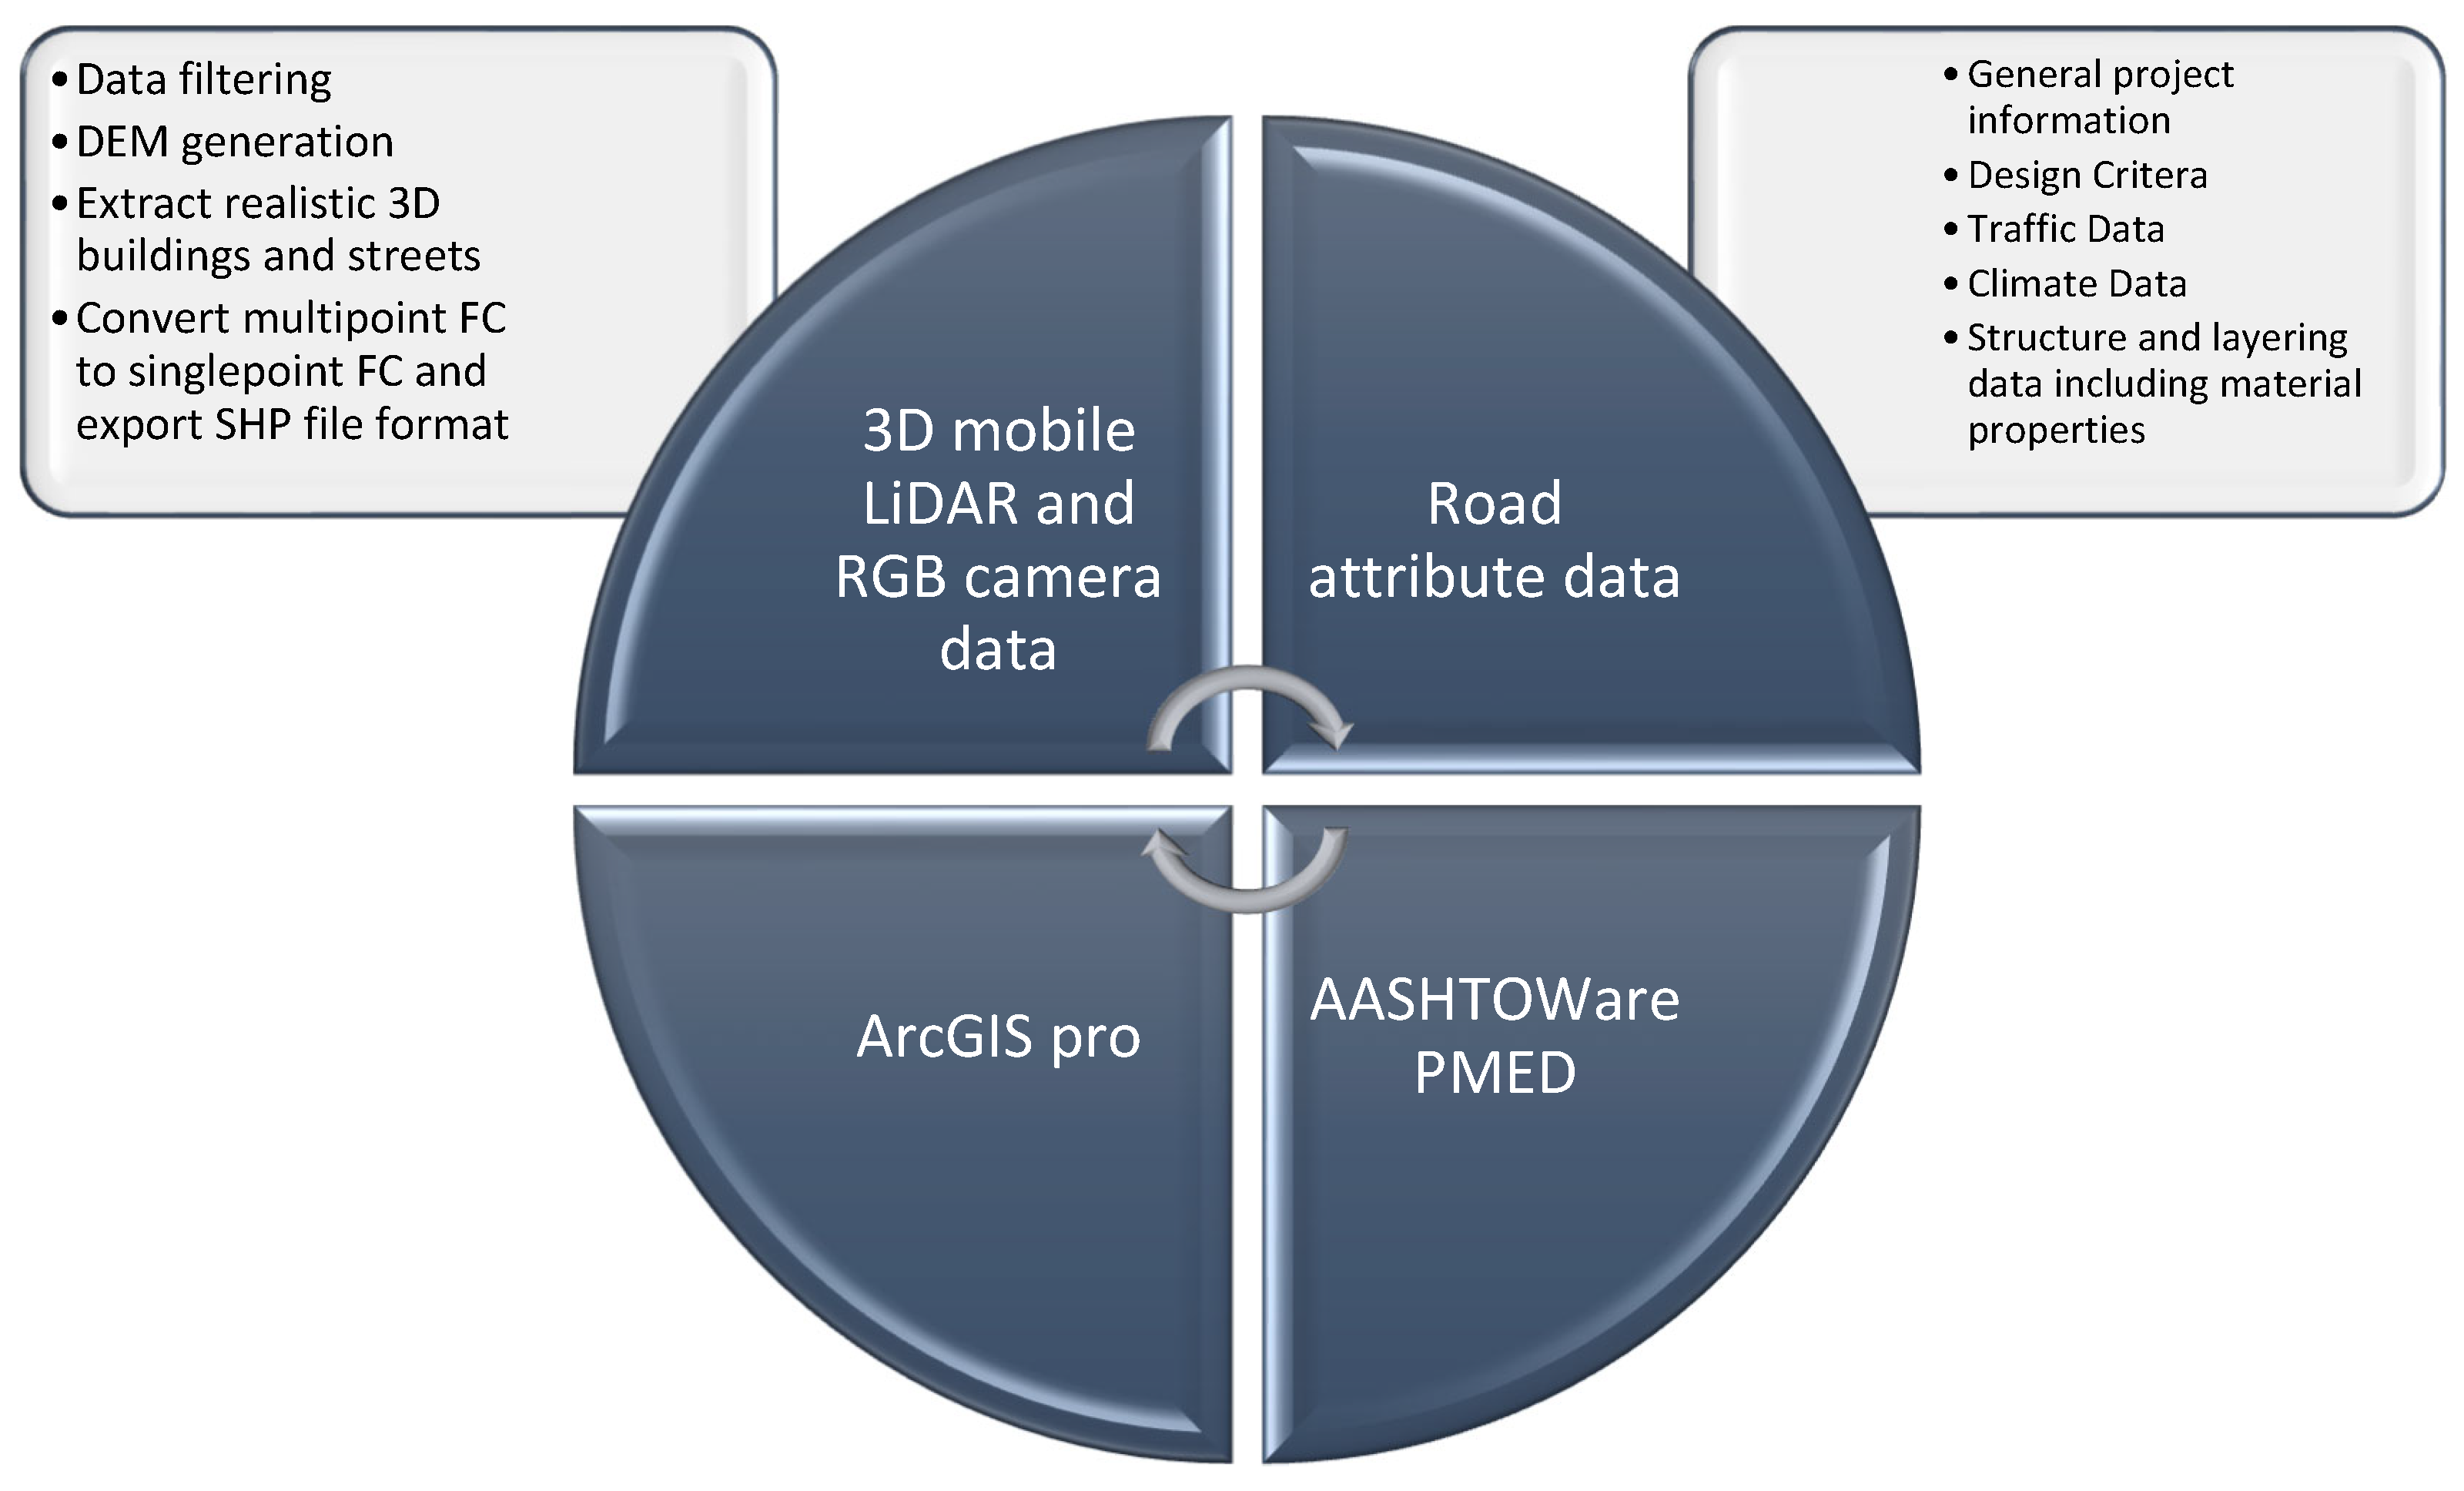
Algorithms that enable intelligent infrastructure decision making, including PMS, are needed to measure, monitor, analyze, and integrate decisions in urban road networks. Therefore, to move toward an SUIMS and having access to the most beneficial pavement design in a PMS is vital. A glance at the different tools and their interrelationships in a city, including in an SUIMS, is shown in Figure 1.
Building information modeling (BIM) technologies can assist in the gathering and archiving of pavement data, as well as the pavement management system, in such a way that all the information, which is suitably protected, is shared and dynamically updated over time. Three phases make up the majority of the proposed methodology [12]:
  • Gathering data on the road’s geometry and the mechanical properties of the materials that make up the asphalt pavement’s layers.
  • Simulating the road’s pavement in a BIM environment.
  • Putting in place a decision support system for the administration of maintenance procedures. The decision support system should be created with the goal of determining the ideal moment for an intervention at the analysis’s time.
A key component of establishing a PMS in a city is monitoring the status of road structures to ensure that the pavement is in an ideal condition [13]. This costs millions of dollars every year for each city. Various management information systems have been established to deal with the complexity involved. Typically, one of two methods is used: (1) using specially equipped vehicles manually or (2) automatically conducting distress surveys. However, because these investigation methods only record the distresses that have already occurred, they are reactive rather than proactive in identifying deterioration.
Two significant variables are considered when assessing the pavement quality: (1) the existing road quality and (2) the quantity, along with the intensity of distress signals. The category, frequency, and severity of distress are all critical indicators of structural appropriateness, material scarcity, and the risk of additional degradation [14]. Surface distress, including potholes or cracking on thicker pavements, may not be symptomatic of structural degradation. Surface depressions cannot be relied upon to signal structural conditions when pavement preservation efforts intervene early to maintain and prolong pavement life [15].
As a result, the required data to investigate the urban pavements and build a GIS-based smart PMS can fall into the following two categories:
  • Geometrical data of the pavements, captured via 3D mobile LiDAR and RGB photos using a vehicle outfitted with the necessary equipment for the distress detection phase.
  • Attribute data of each road section, consisting of general project information, design criteria, traffic data (vehicle/day), climate data, structure, and layering data, including material properties for the pavement design phase.

2.1. Data

2.1.1. Geometrical Data

Three-dimensional point clouds created by LiDAR equipment are beneficial for spatial analysis of 2D pictures that lack georeferenced 3D data [16,17]. Moreover, point clouds are unorganized, oriented irregularly, and frequently have large volumes. Due to the complexity of data collection, portable devices that connect with mobile laser scanning (MLS) sensors, location devices (e.g., GNSS), and two-dimensional cameras tend to be amazingly common on self-driving vehicles and in metropolitan regions [18,19].
Producing high-quality handwritten labels from LiDAR and RGB-D sensor datasets is complex and computationally expensive since they often contain a large amount of data and noise. According to some recent research, the following are examples of popular outdoor point cloud datasets that are freely available.
  • MLS and SICK sensors (abbreviation for an object between sensor and background [20]) were used to create Oakland 3D, an outdoor point cloud, in the first instance of its kind [21]. With a low point density, the LiDAR device used here is mono fiber. This dataset has around 1.6 million points, sorted into forty-four classes. However, only five classifications were examined in the literature: vegetation, wire, pole, ground, and facade. Because this dataset is small, lightweight networks can be constructed and evaluated.
  • The data file of iQmulus [22] was obtained using Stereopolis II [23] in Paris from the IQmulus and TerraMobilita Contest. A monofiber LiDAR called “Riegl LMS-Q120i” was applied to capture the spatial information data. There are around three hundred million points within the entire dataset divided into twenty-two classes. Consequently, for the contest dataset, just one sample was shared with the public: 12 million observations in a 200-m domain with eight accurate classifications. The classification quality in this dataset is low due to the obstructive sensing device, which is monofiber, and the labeling process used, and as such, the image appears distorted.
  • Semantic 3D uses terrestrial laser scanners to collect data and has far better point density and precision than the other datasets. This dataset contained eight class labels. However, static laser scanners can only capture a limited number of perspectives, and equivalent datasets are difficult to achieve in practice [24].
  • In recent years, the Paris-Lille-3D collection has been widely used as a point cloud dataset for outdoor applications, and it has grown in popularity due to its advantages [25]. Data was collected using an operational support system and a Velodyne HDL32E LiDAR, with a point frequency and an analysis precision comparable to those of self-driving automobile point clouds. Over 140 million points and specific labeling for fifty different points are included in the collection, which spans about two kilometers. The dataset uses nine classes for semantic segmentation in the benchmarks.
  • SemanticKITTI is one of the most novel and comprehensive semantic segmentation datasets publicly available [26]. The KITTI dataset was utilized to annotate the dataset better [27]. This dataset incorporates more than 4.5 billion points encompassing forty kilometers, and each consecutive scan is tagged with twenty-five classifications for semantic segmentation assessment. The indicated dataset focuses on algorithms for self-driving vehicles.
  • Toronto-3D [28]: A Teledyne Optech Maverick car-mounted MLS device was used to capture actual point clouds for the entirety of this dataset. A 32-line LiDAR scanner, a GNSS, a Ladybug-5 360-degree camera, and a synchronous localization and mapping (SLAM) structure are all parts of the system. With an accuracy of more than 3 cm and a field of vision angle of −10 to +30 degrees in the vertical direction, LiDAR technology can capture point clouds at a rate of up to 700,000 per second. LMS Pro software was used to process the gathered point clouds further. Each point is assigned a natural color (RGB) regarding the imaging camera. Following that, points on the upper level of the pavement are broken into frames, each of which covers a road segment. The camera produces two-dimensional footage that has been preprocessed to retrieve frames. Each frame is classified as either having pavement distress or not having pavement distress.

2.1.2. Attribute Data

For pavement design, three fundamental parameters must be considered: the characteristics of the subgrade on which the pavement is placed, the applied loads, and the environment [29]. To begin with, the subgrade’s depth will affect the pavement’s design. Pavement layer thickness, the number of layers, load restrictions during seasonal change, and any improvements to the subgrade’s stiffness and drainage are determined by the stiffness and drainage of the sub-base.
For example, one study focused on implementing the Mechanistic-Empirical Pavement Design Guide (MEPDG) in Turkey. This study aimed to collect local information for Izmir City’s MEPDG evaluation and local calibration, including weather, traffic, and materials. The weather and traffic data were gathered, examined, and converted to the MEPDG format for this objective. Additionally, the properties of the bound and unbound pavement materials were established. Some locally collected data, such as the climate, vehicle classification, traffic growth factor, and axle load distribution, could not be used directly as design inputs. As a result, these were generated and transformed into a format that can be used by the MEPDG [30].

2.2. Analysis Tool

Access to the scheme of the most efficient PMS needs introducing and comparing to the well-known approaches to mechanical pavement designs. The AASHTO 1993 design technique is widely employed in the mechanical design of flexible roads [3]. The pavement design procedure for road sections with different temperatures and varied subgrade circumstances has limitations compared to the AASHTO 1993 Guide for Design of Pavement Structures [31,32]. The calculated drainage layer coefficients are one of the method’s significant flaws. Together with the seasonal shift in the robust subbase modulus, these coefficients are the only environmental factors in the AASHTO 1993 design technique.
Additionally, environmental conditions have a severe effect on pavements. As a result, there is a focus on employing a cost-effective pavement model that results in detailed designs and, as a result, superior pavement function over time. Closed-form structures are applied in the MEPDG [33] to evaluate city interactions, weather conditions, base developments, and laboratory surveys of all the different element properties to anticipate the actions of the several pavements plans for as long as they are in service [32]. The MEPDG is projected to deliver more dependable pavement designs than the AASHTO 1993 approach when adjusted to local conditions. In contrast to AASHTO 1993, the MEPDG examines the effects of temperature and relative humidity on layers of pavement and their mechanical properties.
According to a correlation study of the MEPDG and the AASHTO 1993 design guide [34], even though all pavement sections were calculated using the AASHTO 1993 technique for equal service failure, they behaved differently when forecasted by MEPDG. The AASHTO 1993 acts anticipated by the MEPDG changed as traffic levels increased and subgrade strength decreased. This difference is significant for various meteorological circumstances, which have an exponential effect on the quality of road infrastructure. Access to the pavement mechanistic-empirical design (PMED) report of a single road section requires sufficient and accurate data to be used as input for the PMED step. Therefore, before every action, the municipalities need access to these data. Furthermore, they must integrate the MEPDG design method with the 3D GIS models to obtain the most efficient urban infrastructure management strategy.
Soil water characteristics curve (SWCC) characteristics, and other soil conditions needed by the enhanced integrated climatic module (EICM) within the MEPDG, were the focus of a decisive study on the extensive national soil database [35]. This study offered a GIS-based technique for precisely superimposing any road section on soil maps. Additionally, there is ongoing research into monitoring sites and collecting data for the MEPDG prediction models’ calibration, as well as evaluating the impact of various materials and construction techniques on pavement performance [36]. To visualize the sites, a GIS project and add-in tools were created. Additionally, the MEPDG’s projected distresses on interstate areas were confirmed, and the contrasts between the MEPDG’s designs and those of the AASHTO 1972 Interim Design Guide were reviewed to offer recommendations on how to apply the MEPDG.

2.3. Visualization

Aside from the data and analysis required for the SUIMS, visualization tools are also needed to represent the productivity of the proposed architecture. As a result, GIS has recently gained widespread popularity among urban researchers due to its potential and ability to “generate support systems, decision-making architectures integrating a combination of AI and ML, urban expansion models, and software visualization techniques to help community-based strategies” [37].
The development of visualization products such as CityEngine for designing, storing, and interchanging 3D city and scene layouts led to recent advances in 3DGIS and urban data modeling. GIS is no longer only 2D but also 3D. The ability to create 3D city models in a GIS context will enable a variety of tasks, such as cadaster, public safety, urban infrastructure management, and traffic control, to take on new dimensions. CityEngine defines a rule-based schema for the most compatible topographic features in metropolitan and local models that incorporate topological and semantic characteristics. It also includes adding detectable features to the data while maintaining semantic compatibility.

3. Methodology

In recent years, advances in information and communication technologies (ICTs) have represented a substantial threat to the previously predictable landscape of urban infrastructure services. Smart pavements offer many benefits to road users and the agencies constructing and maintaining these roads. A diagram exhibiting the SUIMS intended for this paper’s purpose is elaborated in Figure 2 to fulfill this objective. The 3D mobile LiDAR and RGB camera, and the road attribute data are two data groups working together to satisfy the research objectives. At the same time, AASHTOWare PMED and ArcGIS Pro are integrated to analyze this paper. The details of the designed methodology are presented in the following sections.

3.1. Data Collection

3.1.1. Data Acquisition Vehicle

A sensor mounted on a vehicle was required to collect road data. The device included a LiDAR and a camera fixed together in a solid frame. In this research, the data used was collected recently [38]. The LiDAR installed for data collection was the Ouster os-16 channel (the specifications of this LiDAR sensor are provided in Table 1), which is based on the concept of time of flight. Four separate signals were acquired with this LiDAR [39]: the first one was “range”, the calculated length between the sensor and an object. The next was “reflectivity”, which yielded scaled readings depending on the sensor sensitivities within that range and device sensation within that spectrum. The third category was “signal”, which determined how strong the returned signals were. The last was “ambient”, which also produced the backlight measurement’s strength.
The hardware was positioned two meters above the ground on the top of a car. The LiDAR and camera were angled at a 50-degree angle from the ground. Both sensors covered an area of two × four (square meters). At 10 Hz and 20 Hz, the resolution of LiDAR scanning was 512 × 16 and 256 × 16 pixels. At 120 frames per second, the camera resolution was 1920 × 1080 pixels. The car could reach speeds of up to forty kilometers per hour.

3.1.2. 3D Mobile LiDAR Data and RGB Camera

The 3D LiDAR sensor produced three-dimensional point clouds in the study area. By minimizing the LiDAR field of view, the road surface could be obtained by removing data that was not relevant to the road surface. Since the LiDAR data is not a good choice for distress detection goals, the RGB cameras were used simultaneously for video recording. Therefore, the areas were divided into video frames on the road surface, each covering a section of the road. The camera produced a two-dimensional video that was obtained to extract frames. Each frame was assigned to one of two categories using the convolutional neural network (CNN): (1) pavement distress or (2) no pavement distress.
A CNN is an ML model designed to learn spatial hierarchies of information automatically and adaptively, from low-level to high-level patterns, while processing data with a grid pattern, such as pictures. Object detection is one of CNN’s most effective uses. This study employed the convolutional layer, composed of several kernels, to extract distress features from CNN. The number and size of kernels in a convolutional layer, which should be suitable for object recognition, is a crucial parameter. Another intriguing study found that it is possible to recognize distress successfully using this method [40]. The pooling layer i utilized by either max pooling or mean pooling to lessen the complexity of imported data to decrease the danger of overfitting [41]. To identify and localize distresses, feature maps created by convolutional layers and pooling layers were imported into softmax layers and regression layers. Here, cracking was the only type of pavement strain that was considered. The regression layer identified the locations of distresses, whereas the softmax layer classified the image frames used in this paper as cracked or non-cracked.

3.1.3. Road Attribute Data

As stated in the preceding sections, the design and implementation of an SUIMS focusing on a pavement management system must meet specific criteria. To reach these goals, a pavement design approach should be developed. The primary purpose of pavement design is to construct a low-cost road surface that fulfills site-specific efficiency, service life, and regulatory standards. Pavement design is not a straightforward process, and various factors affect pavement performance, making analysis challenging [38]. The process necessitates a thorough knowledge of soils and construction materials and their behaviors under varying traffic loads and weather conditions [42].
One of the essential pavement design aspects is traffic loading, which includes road congestion, load factors and distribution (trucks, cars, etc.), tire pressure, and suspension system characteristics. Rainfall, humidity in the pavement layers, temperature variations, and defrost periods are all environmental concerns. The subgrade soil, moisture content, and other physical factors also impact pavement design [42]. This study, for this category of data, benefited from the data produced in another recent study [43]. The available data were as follows:
  • Name, start and endpoint, length, width, and functional class of the roads.
  • Traffic data (vehicle/day).
  • Comfort index and estimated international roughness index (IRI).
  • Primary diagnosis of causes of deterioration.
  • Tests and actions made by the public work department and cost of work.
  • Cost to users (annual cost).

3.2. Analysis Tools

3.2.1. Spatial Analysis with ArcGIS Pro

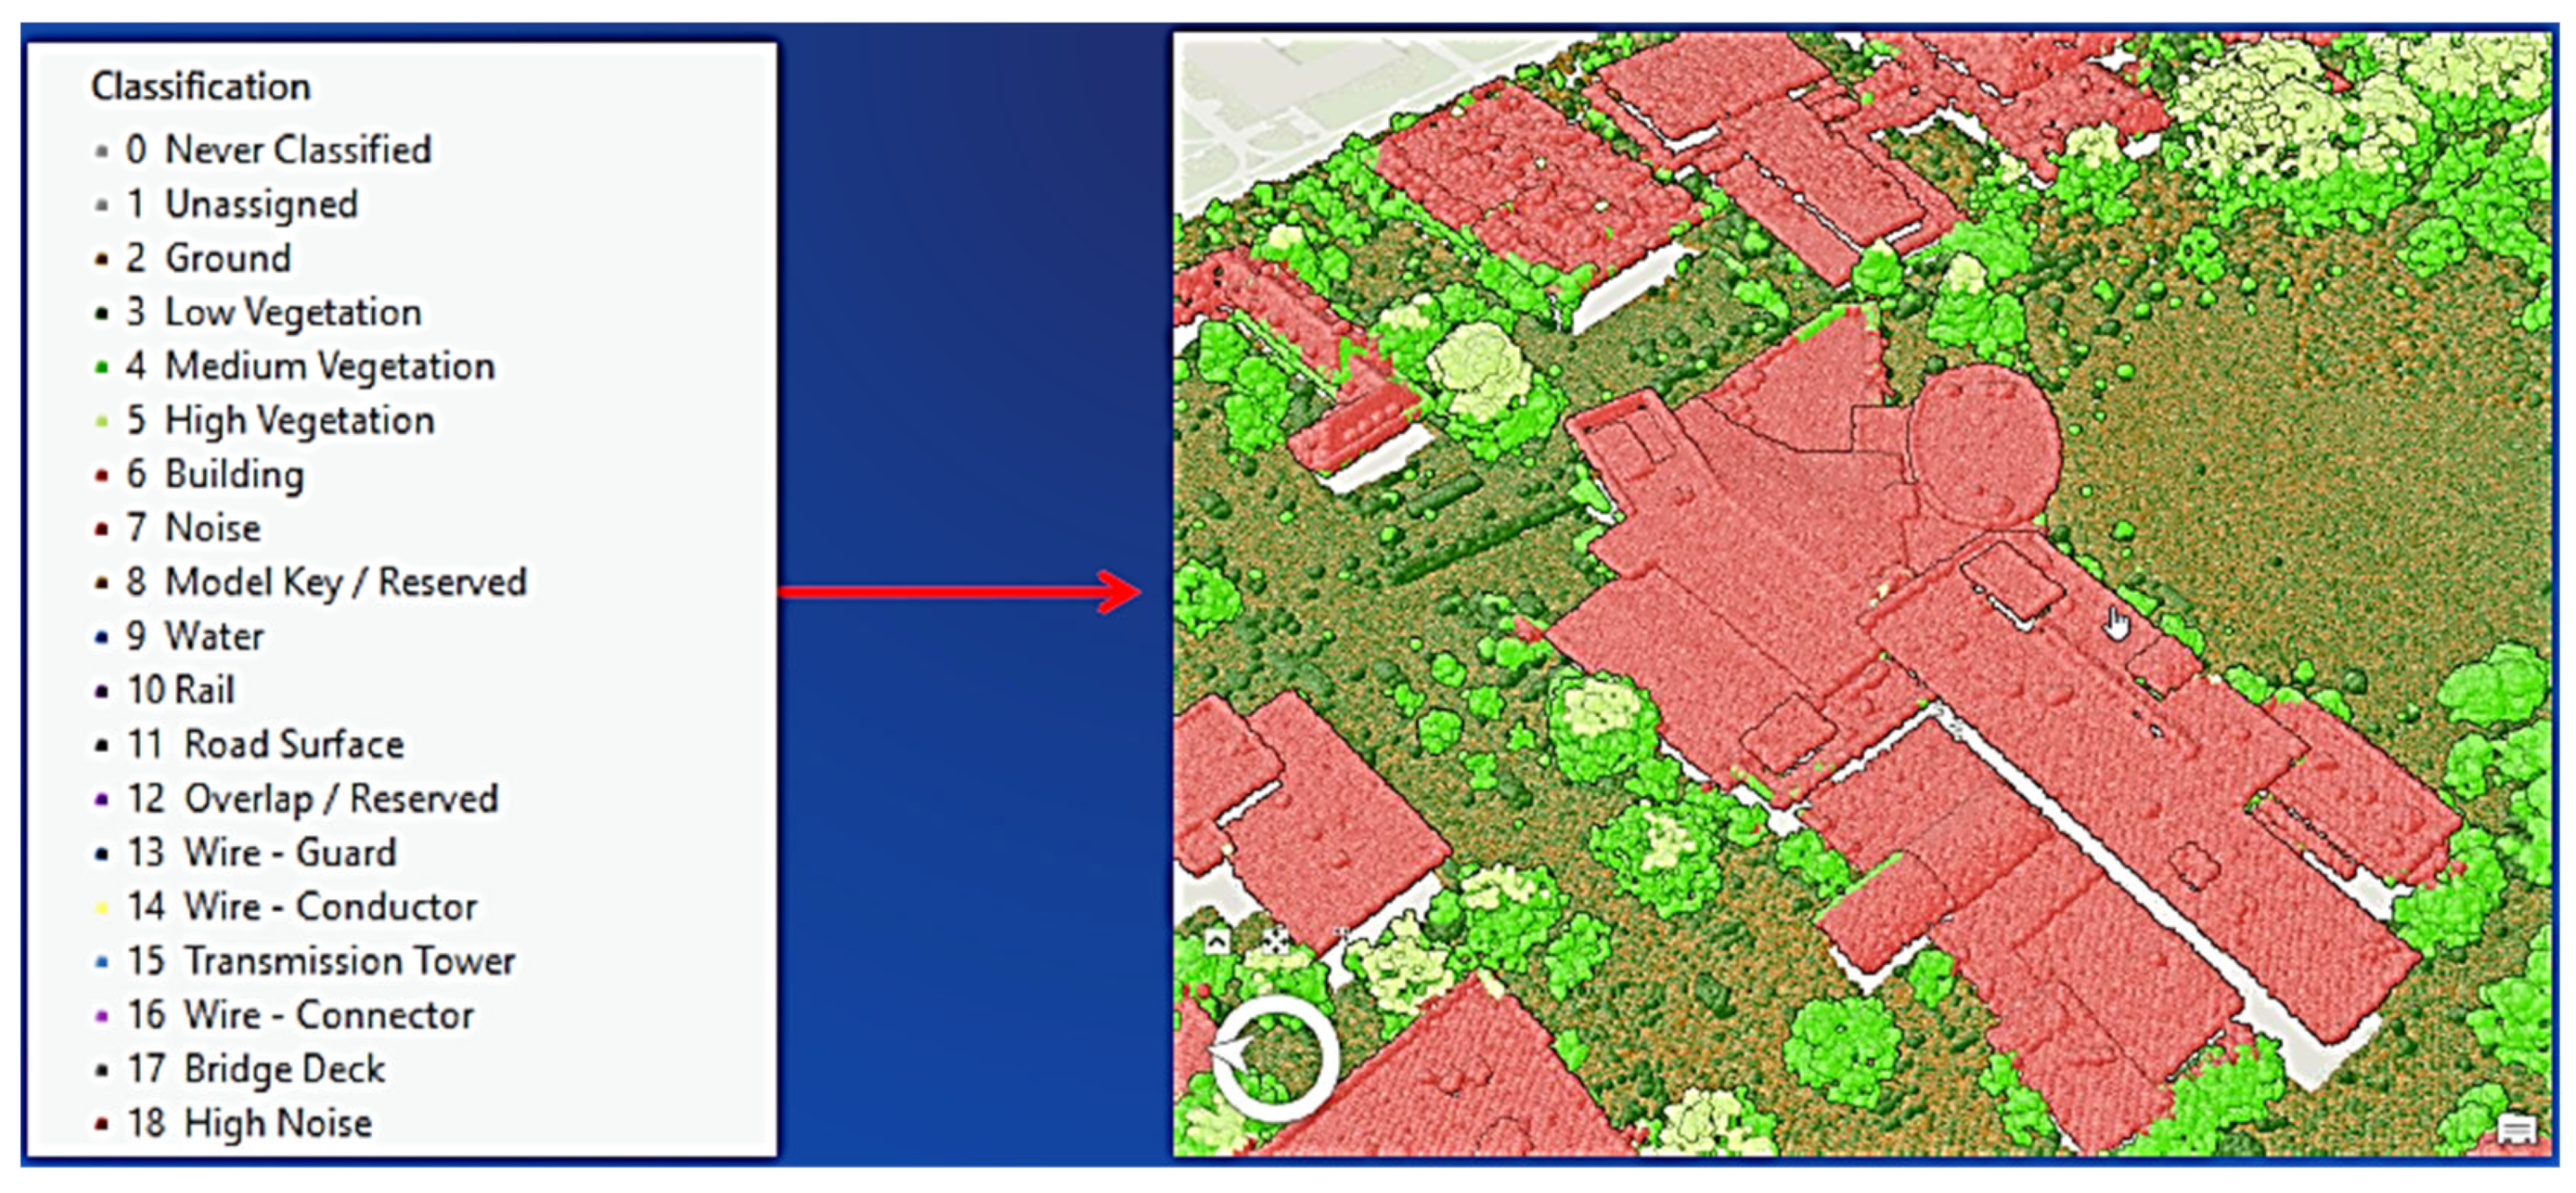
Roads and buildings are two LiDAR points divided into several groups and categories. A classification can be applied to each LiDAR point to identify the type of object that reflected the laser pulse. The different classes are defined in the .las file using numeric integer codes, as seen in Figure 3.
The next spatial analysis steps after getting road surfaces and buildings from the .las dataset were as follows:
  • Data filtering to remove all noises.
  • Digital elevation model (DEM) production.
  • Realistic building and street pavement generation.
  • Multipoint feature conversion into a mono-point feature class.
  • Export the single point feature classes as .shp files.
Thus, the outputs included a polyline shapefile with the road surface and a polygon shapefile with the building footprints in two different shapefile layers for importing into the final visualization and decision-making step. It should be noted that the extraction of building footprints in this study was just for visualization purposes in the 3D city model. Analysis of the building’s footprints was not conducted.

3.2.2. Pavement Design Analysis with AASHTOWare PMED

In the MEPDG, pavement design is approached using significant changes. The conventional method involves considering various inputs and determining the design requirements for the pavement structure. Mechanics-empirical pavement design relies on a trial-and-error model of pavement structure design and information from traffic and climate. Inputs such as load and environmental factors can be modeled by MEPDG software to calculate how the trial design responds to their effects. Upon doing so, an estimate can be made as to how much damage will be sustained over time by the pavement due to a deterioration in ride quality and the distressing of the pavement.

3.3. Decision Making and Visualization

An urban environment and its development are often reflected in the use of GIS. GIS is well-adapted to deal with spatial and visualization challenges connected with multi-scale geographical data from a technical standpoint in an urban environment. The potential of a GIS to create new information by combining incompatible datasets with a suitable geographical referencing system is exclusive [44]. Therefore, in this paper, since the integrated GIS data and MEPDG results required a platform for displaying the research results, CityEngine was applied.
Professionals in GIS, urban planning, architecture, multimedia modeling, and general 3D content production can benefit from Esri CityEngine. This desktop software application offers an effective solution for rapidly producing 3D cities and buildings. For decades, CityEngine has aided in making significant decisions that benefit communities. It is possible to create and modify as many scenarios as needed. From every viewpoint, buildings and street proposals can be analyzed and examined. It is clear how they tie into the broader vision for the city’s future.
Based on these capabilities, in this step of the methodology, which was the final stage, first, the result of data analysis based on the combination of the previous two stages (spatial analysis and PMED) was entered into the CityEngine and then, based on the priorities of the city officers and macro-management policies that will be the criterion in each executive project, the appropriate rules were applied. Then, for the visualization goal, a three-dimensional model was prepared.
The geometry type of street axes was a line. The attribute table for each street consists of the street name, lane type, speed limit, the existence of sidewalks, the presence of cracks, traffic data (vehicle/day), comfort index and estimated IRI, primary diagnosis of the causes of deterioration for each road section, tests and actions made by the public work department and the cost of this work, the cost to users (annual cost), and internal performance (rate of return). The geometry building footprint data was a polygon. The attribute table of building footprints consisted of the building type, the height of building, and the number of floors.

4. Implementation of the System and Expected Results

4.1. Study Area

A small-to-medium-sized city in the Canadian province of Québec, Châteauguay, has a road network that spans approximately five hundred kilometers and a replacement value of roughly $1 billion. It is seeing rapid residential and industrial growth. Due to an outdated network, increased traffic, and numerous roads, pavement degradation has occurred more quickly than anticipated. The issue, as is the case in other Canadian municipalities, is that the yearly budget is inadequate to sustain these constantly deteriorating roads to an acceptable level. As a result, a significant backlog of M&R work must either be completed immediately or delayed at a higher cost. The streets of this study area were extracted from [38] to serve as the data for this paper. The building of the study area is presented to provide a better 3D city model and show a more realistic result. The two analysis and visualization sections were conducted accordingly, and the results demonstrated an urban environment, and its development is often reflected in the use of GIS. GIS is well adapted to deal with spatial and visualization challenges connected with multi-scale geographical data from a technical standpoint in an urban environment. The potential of a GIS to create new information by combining incompatible datasets with a suitable geographical referencing system is exclusive [44]. Therefore, in this paper, since the integrated GIS data and MEPDG results require a platform for displaying the research results, CityEngine was applied.

4.2. Data Establishment

As mentioned in Section 3.1.2, the data in LiDAR is unstructured and unordered. Consequently, it cannot be used for the next steps unless preprocessed. Blunders are common in LiDAR data, and they can be created by photon scattering in a returned laser pulse, which causes noise. As a result, once the point cloud data has been converted to a LAS dataset using Cloudcompare software, the dataset must be imported into ArcGIS Pro for additional data preparation, including noise removal and acquiring the geometrical pavement shapes. In this implementation stage, access to the shapes of the roads is available. However, the database still lacks classified data regarding cracks, which are essential indicators of pavement distress.
A low-cost action camera was used in addition to the LiDAR sensor on top of a car to acquire pavement data. At a maximum speed of 40 km/h, footage on arterial roads was recorded. Action cameras are famous for capturing action footage from the shooter’s perspective because they are small and simple to set up. The camera was angled at a 40-degree angle toward the pavement. This design can collect a four × two square meters road section as a sample unit of pixels, meaning one pixel covers around 1 mm. The output was then entered into a CNN designed to identify and classify the frames. Based on [38], using RGB-camera image frames as an input to the CNN is recommended to obtain the most accurate classified data. The CNN in this paper focused on identifying the cracks and pavement distresses. After applying the CNN, there were two categories of frames: (1) including cracks and (2) without cracks.
Numerous methods have been devised to locate and classify pavement cracks. The standard area convolution neural network pipeline consists of three phases: (1) area suggestions, (2) object detection, and (3) classification. This technique has been improved further so that instead of providing a boundary, the object’s boundaries are additionally recognized [45].
This method was broken down into three primary stages to realize the multiple stages of detection and segmentation [38]. The outputs of these phases are shown in Figure 4 one by one.
  • In the first step, the Region Proposal Network (RPN) applied a classification algorithm to classify the objects in the image as background or foreground items. RPN additionally improved the suggested coordinates to fit the identified object better.
  • The final proposals were grouped by type in the next phase, and their edge pixels were refined.
  • A mask was generated for each image instance from phase two, which could then be combined after it was applied pixel-by-pixel in phase three.

4.3. Spatial Data Analysis

4.3.1. GIS Module

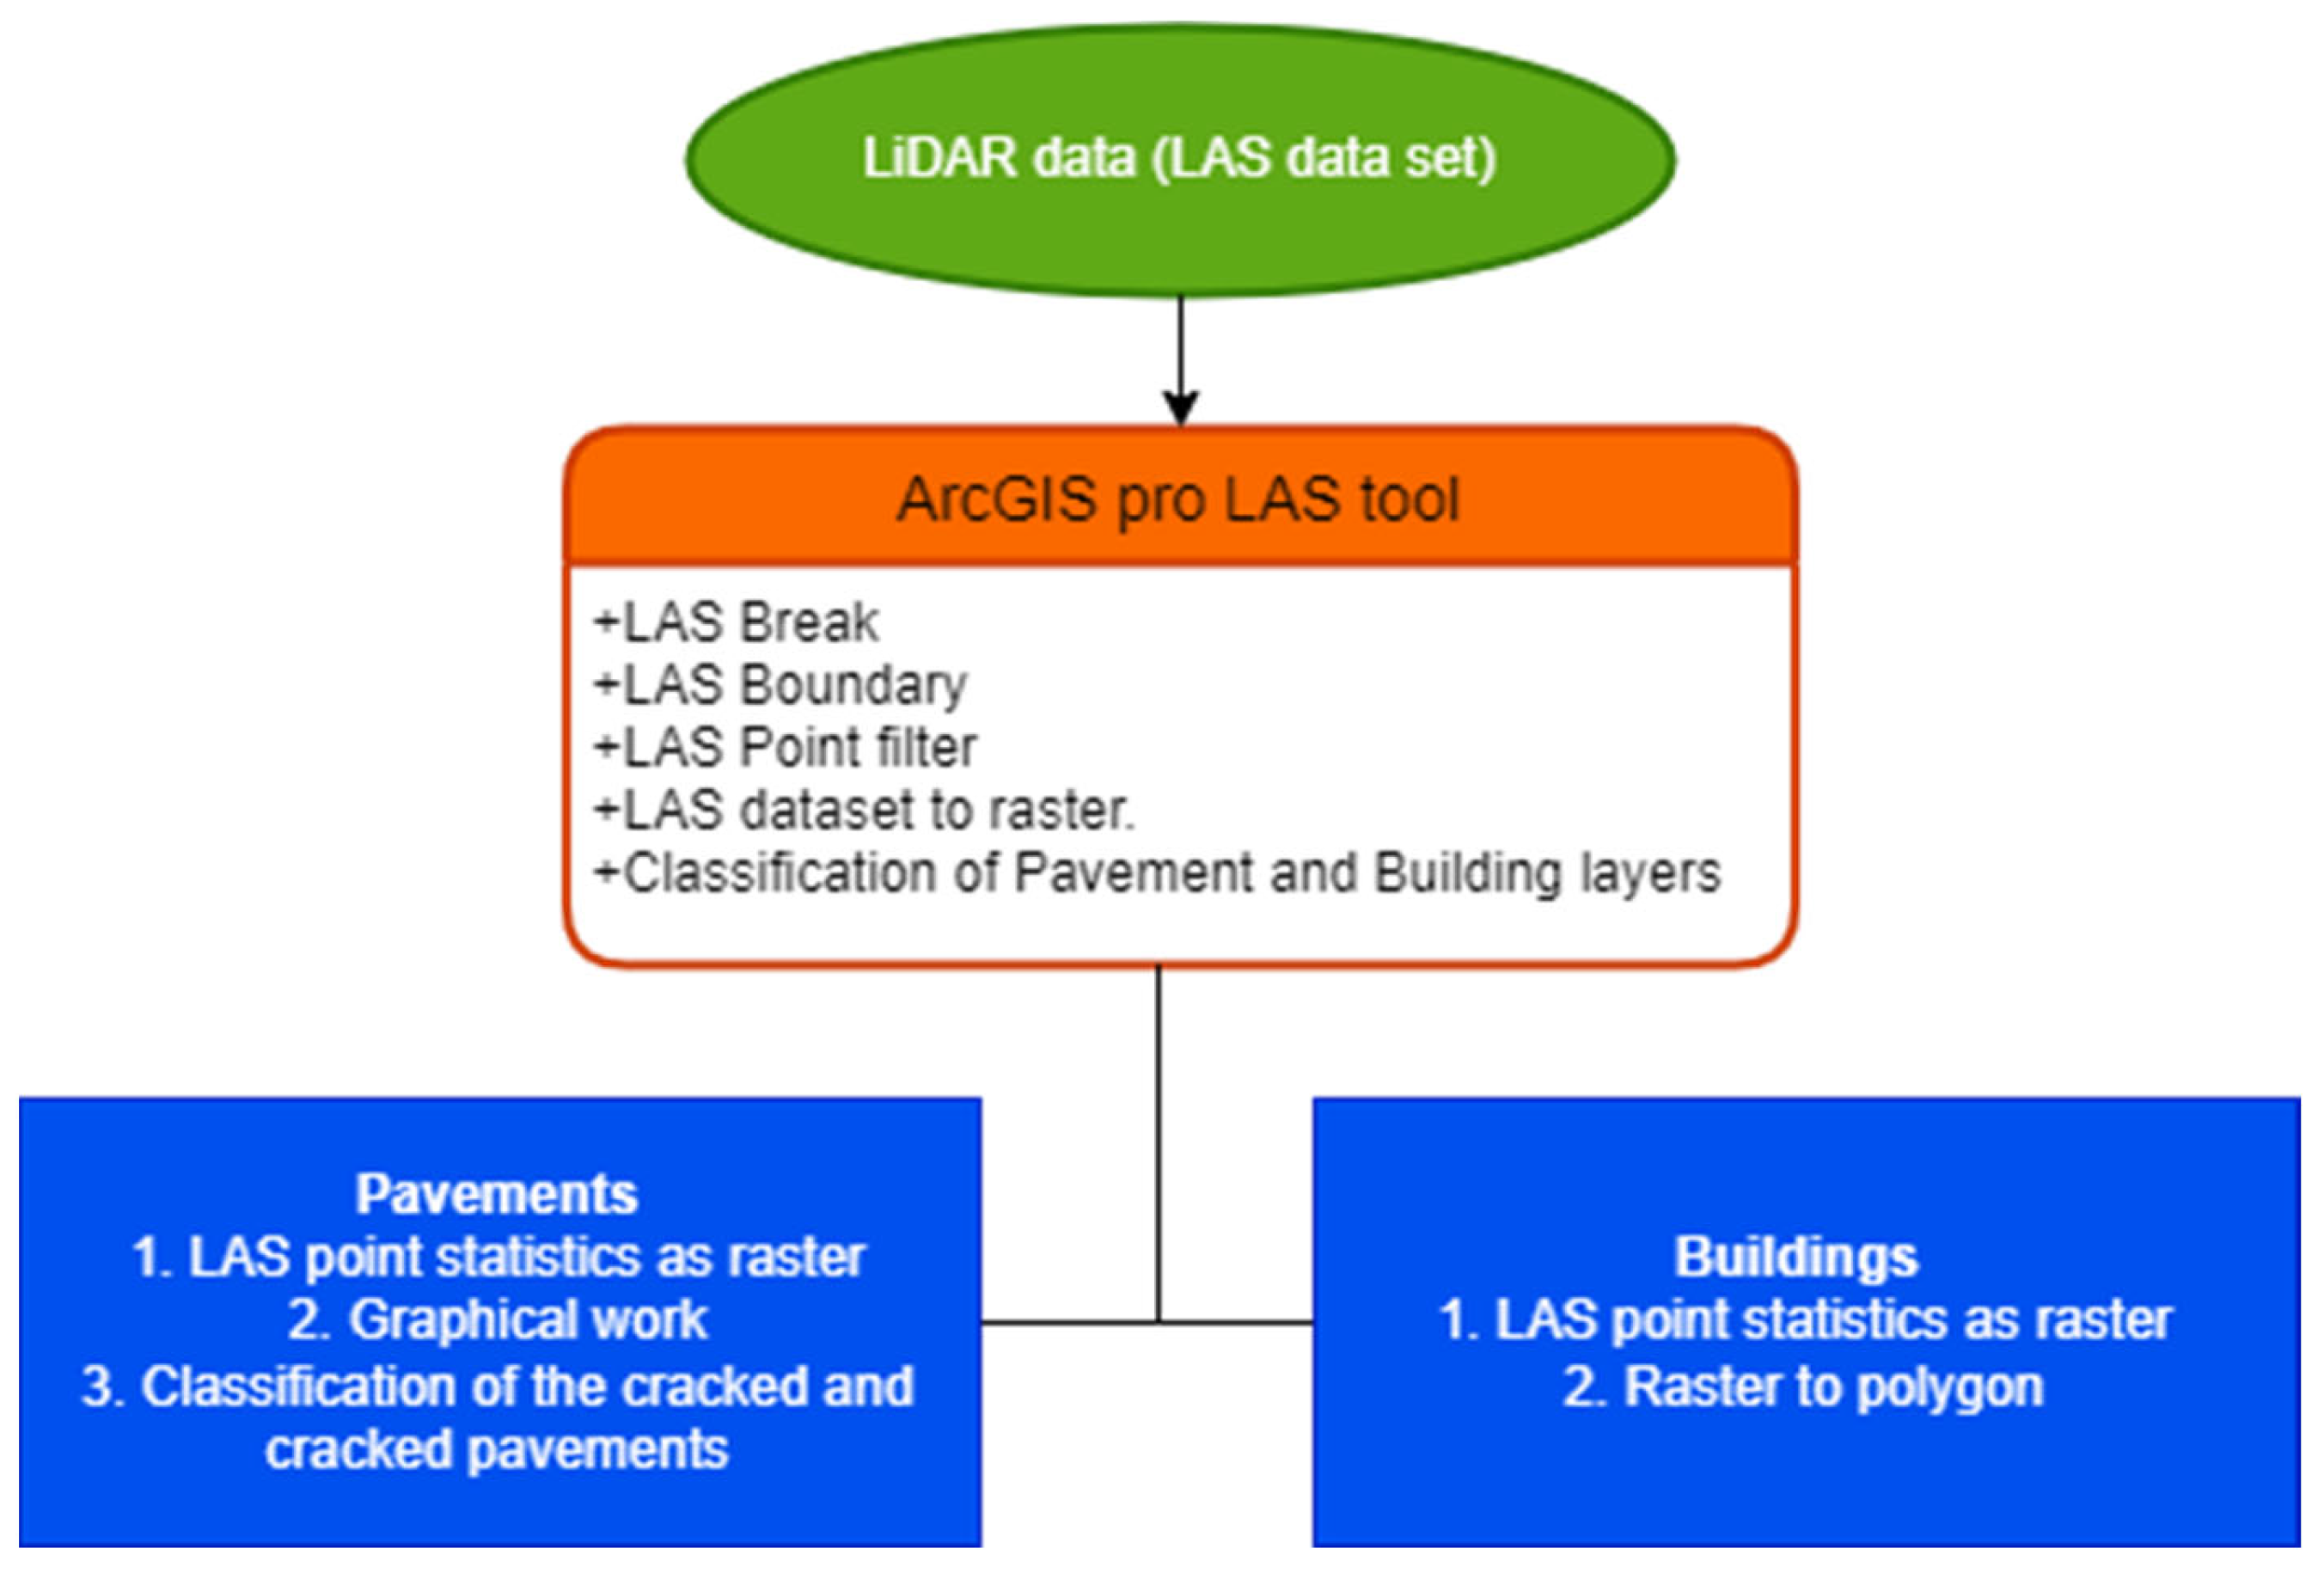
Figure 5 depicts an overview of the data stream to the visualization step. The detailed step-by-step process will be explained in the following paragraphs.
The LAS tool is an open-source toolkit for working with LiDAR files in ArcGIS Pro. LAS Break is used to split a LiDAR point cloud into a file that contains only those road surface and building points that meet the criteria. The road surface and building footprint are then extracted using the LAS boundary. The LAS boundary program checks LiDAR data and creates a polygon border for the points. The input to LAS Boundary is a LiDAR point cloud comprising only road surface and building points, with Concavity set to two and the disjoint option checked.
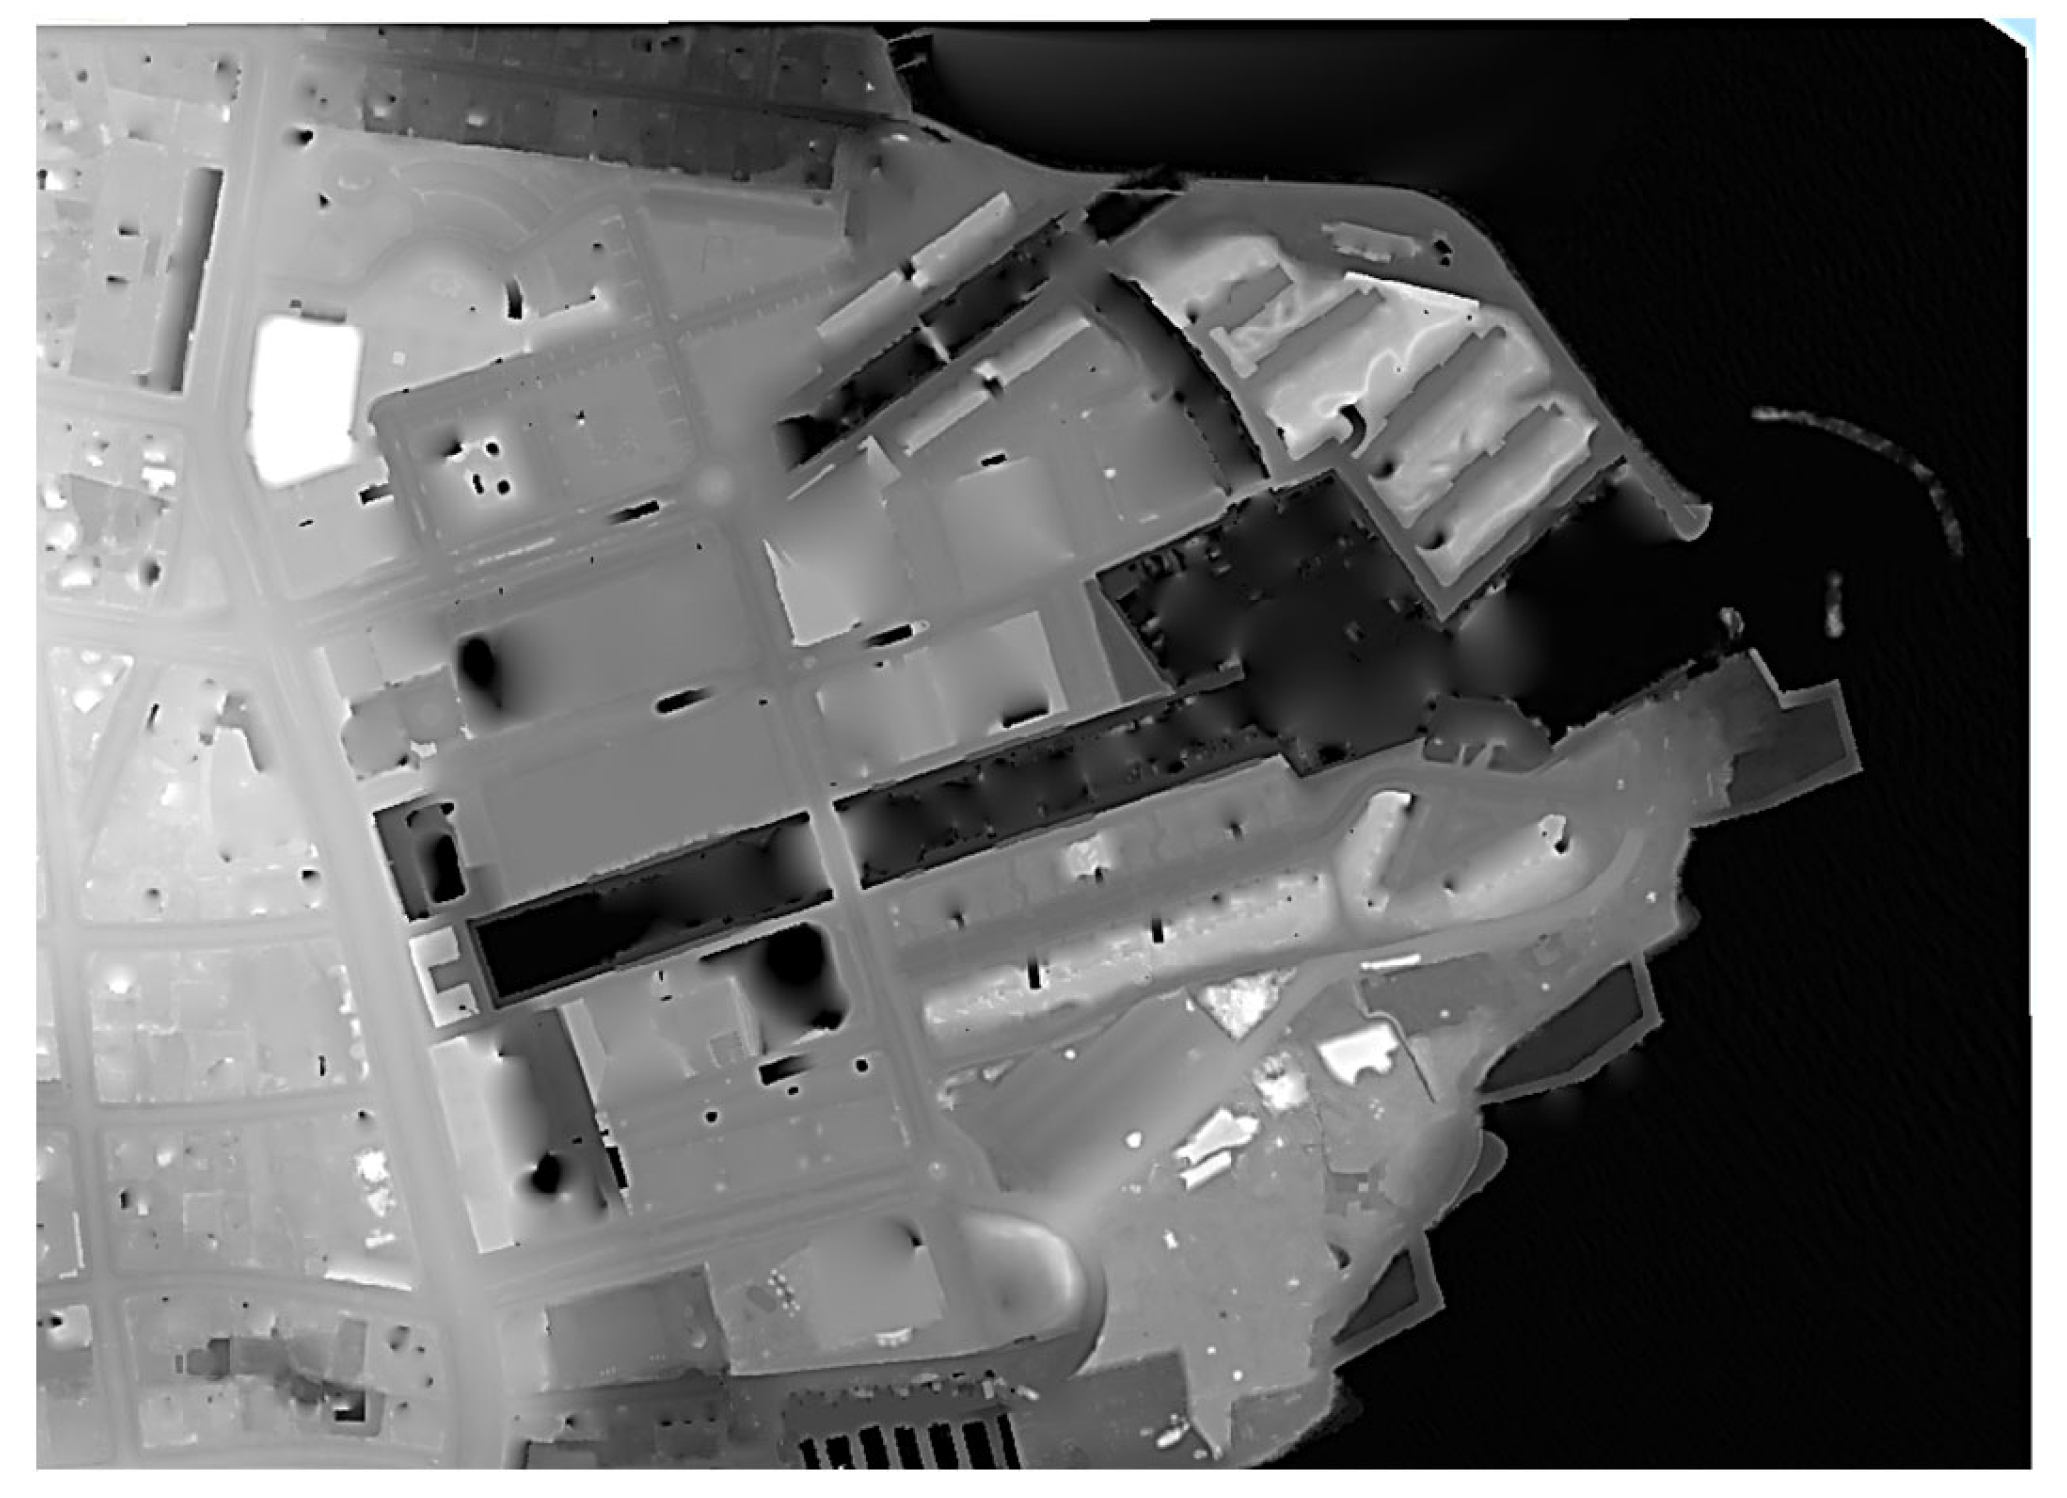
After importing the LAS dataset into the ArcGIS Pro software, all the noises were removed by the “LAS point filter” in the LAS dataset layer panel. Then, an accurate digital elevation model (DEM) was needed; this is the base of all the analyses requiring height and 3D model construction. For this objective, the ground points were obtained by filtering the data and extracting the ground points. By applying the “LAS dataset to Raster” option and selecting the interpolation type as “triangulation”, which is more accurate and publicly known, DEM was created, as shown in Figure 6.
Classifying buildings and pavement locations is the next phase in the analysis procedure. The “Classify” analytic tool, accessible through the geoprocessing module, was used to classify buildings and pavement. The classification technique indicates whether places are classed as buildings and pavements accurately or not. Access to the minimum rooftop height and area limits is essential to guarantee that a surface that is too low or too small in the region is not mistakenly classified as a building.
It is necessary to extract building and pavement footprints before moving on to the primary 3D model of this analysis stage, which would be the output of this step imported straight into CityEngine to apply city officers’ rules. Building footprints were extracted with the help of a simple tool in ArcGIS Pro called “LAS Point Statistics as Raster” and then “Raster to Polygon”. On the other hand, pavement polyline extraction is more complex and requires more investigation.
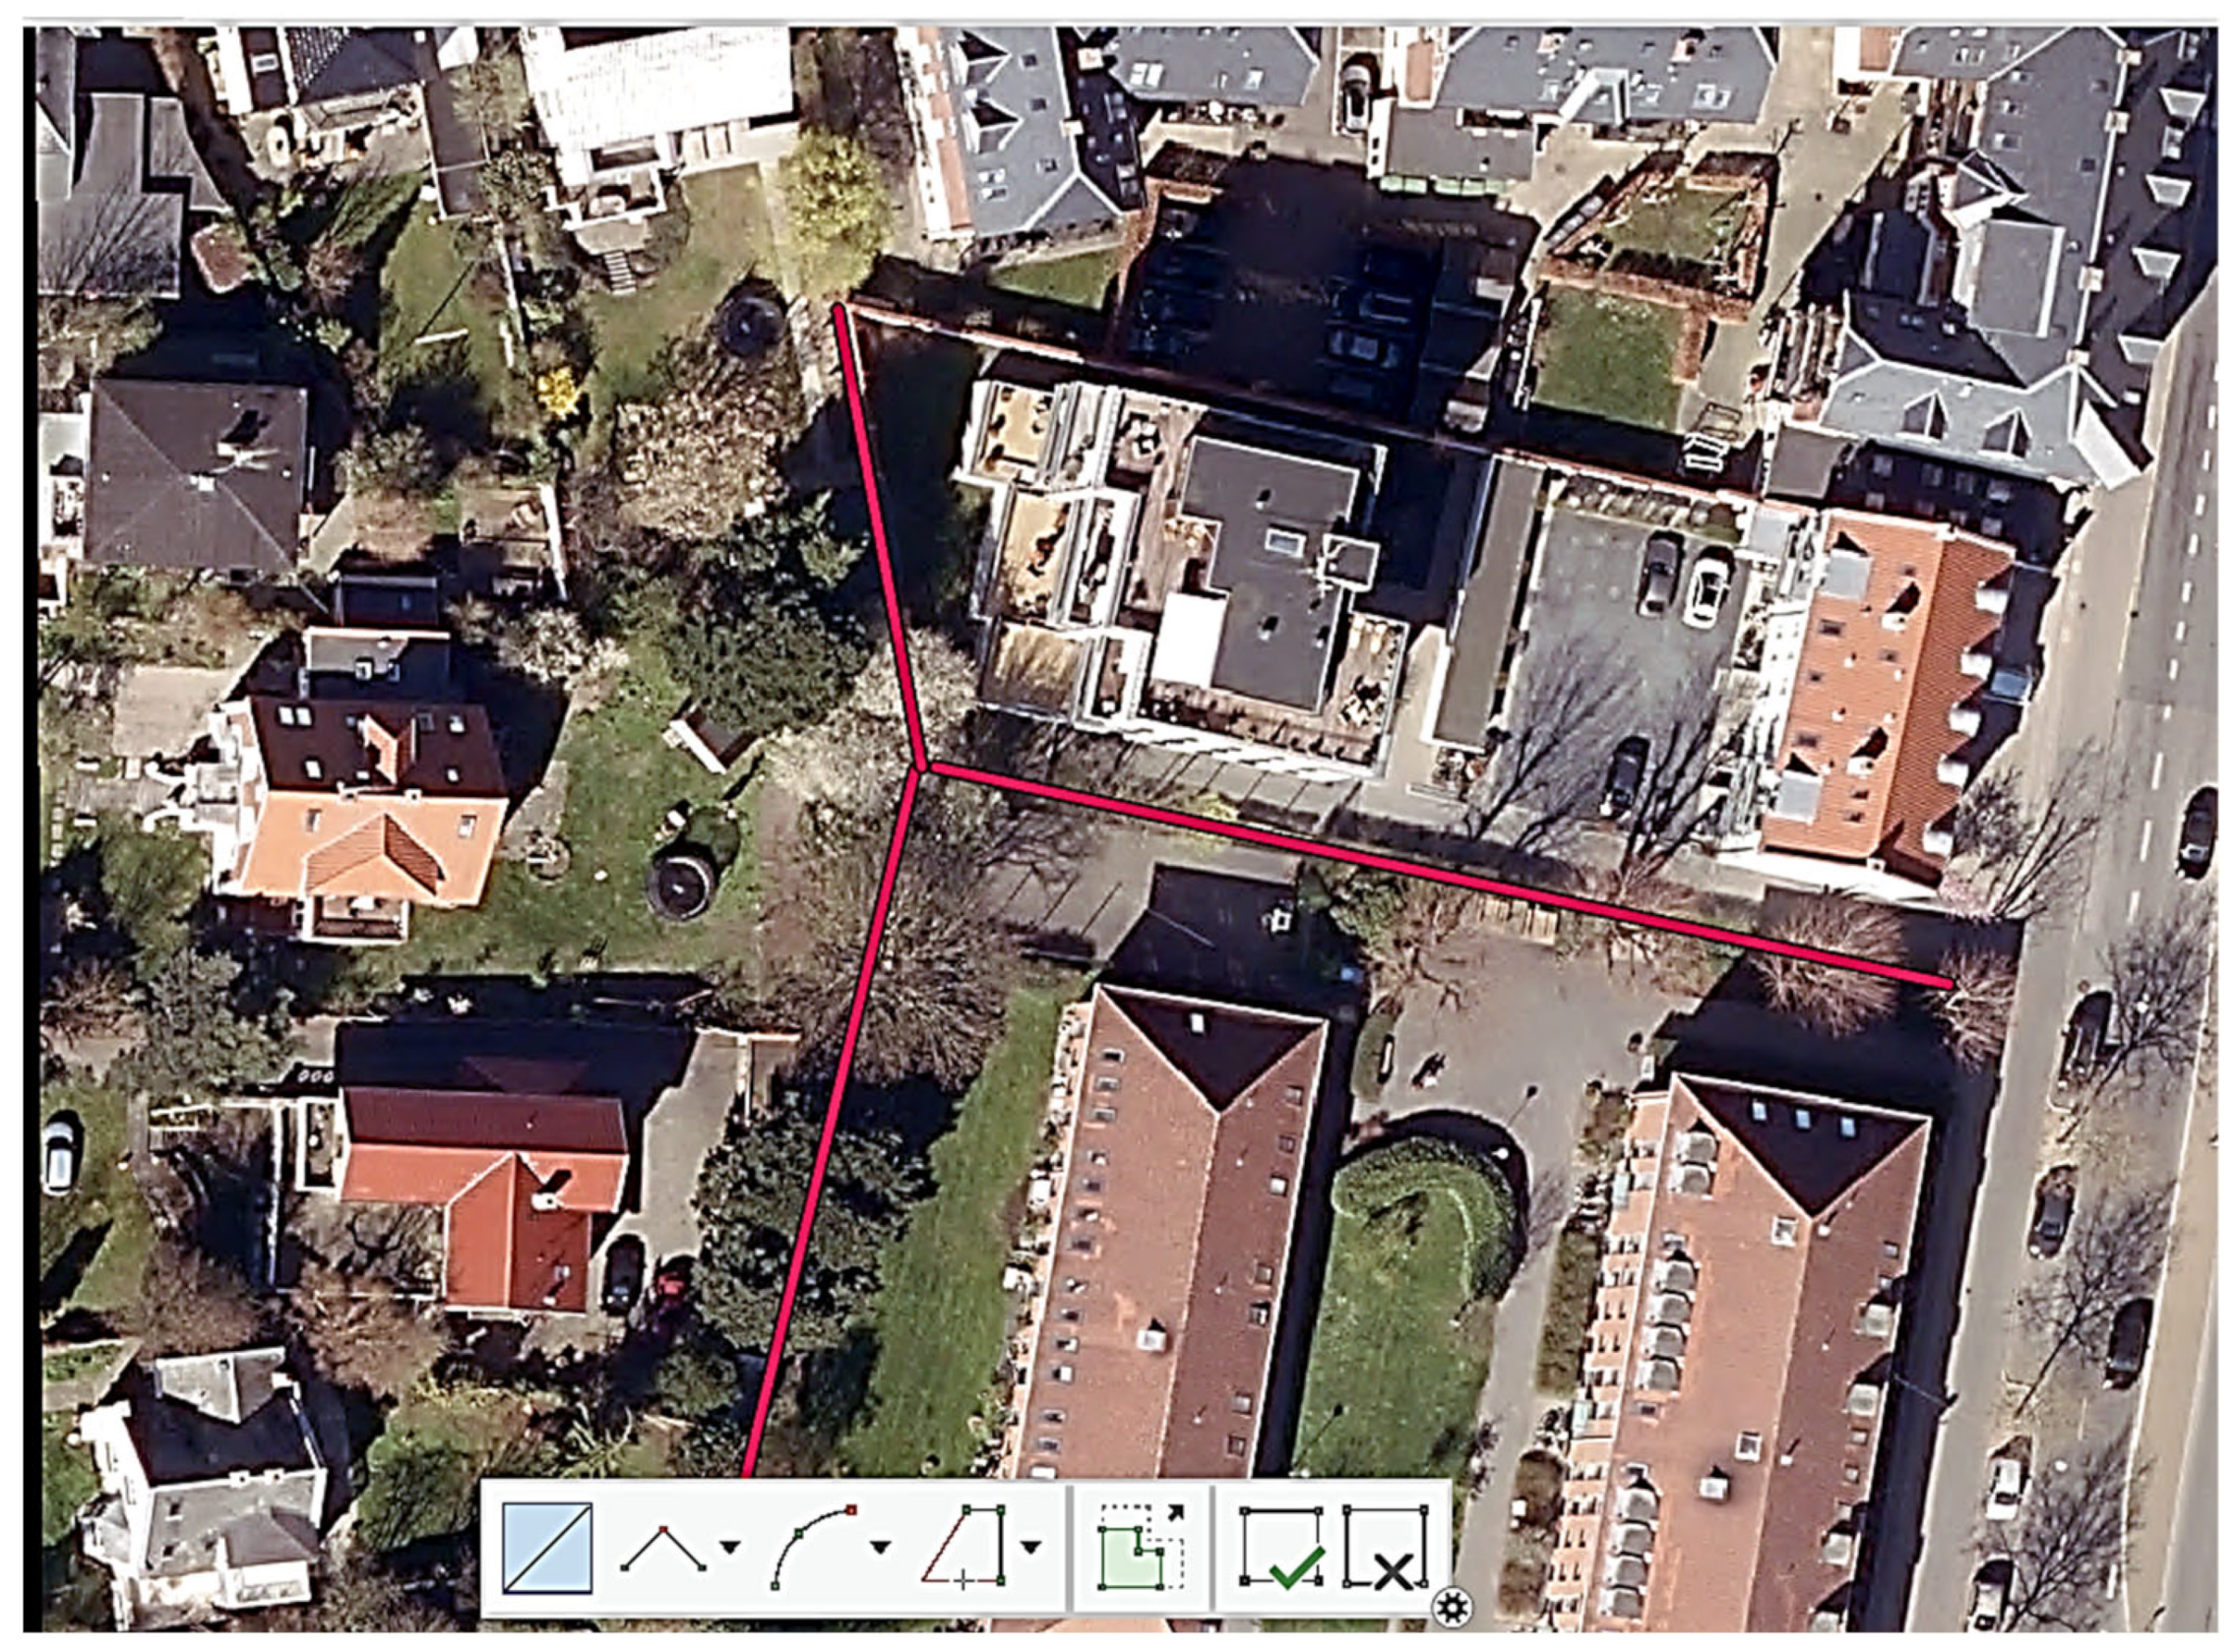
For pavement polyline extraction, first, it is necessary to filter the LAS dataset and access the road points. Then, the appropriate raster is prepared to run the LAS point statistics as a raster tool. Applying another tool to convert this raster to a polyline makes us move forward with the extraction of pavement polyline. However, some graphical works are needed to clean the feature class created and access the pavements’ best appropriate shape, as shown in Figure 7. In addition, based on the crack detection phase, the pavement layer needs another classification step to differentiate between cracked and non-cracked pavements. Therefore, this analysis was conducted, and from then on, all road sections were classified in terms of their crack inclusion. This classification is presented as an attribute value in the attribute table of the pavement layer.

4.3.2. AASHTOWare PMED

Since the objective of applying MEPDG in this study was to benefit from the excellent results of this design method compared with others of the same category, one of the recent MEPDG final reports of the study area was used. Providing the necessary data for a MEPDG requires time and money. As a result, and to show that getting the most efficient pavement design for the study area is both possible and beneficial in the SUIMS, the integration of the MEPDG final report and the analysis result of the GIS module was conducted accordingly. This means that the results can now help access the urban categorized road sections, which also have been designated as cracked or non-cracked, and at the same time, they have their own best pavement design result.

4.4. 3D City Model Rules and Visualization

CityEngine supports several file formats for importing street polylines, depending on the data type. In this study, streets were imported as Shapefiles. Polylines that were put into CityEngine as street segments comprised the data. A width attribute, which determines street width in CityEngine, and another column indicating the presence of cracks were also included in the data (where ‘zero’ meant there were no cracks, and ‘one’ indicated some cracks). The street network layer was generated automatically, and the Viewport showed street centerlines. Using the “Resolve Conflicting Shapes” tools in Cleanup Graph, various graphical disorders in the street centerlines shapefile were automatically corrected.
In this CityEngine configuration, the computer graphics and applications (CGA) syntax defines streets and buildings. A CGA rule file is a collection of rules that define how geometry is created. A CGA rule file is usually allocated to a shape. The street model in this project was created using CGA from the Esri library. The Essential Street.CGA file classifies the road network with its pavement design and the buildings.
Last but not least, SUIMSs are technological systems that manage all public works operations on a single platform, as presented in Table 2. The efficacy of decisions made by city officers and stakeholders can be increased with the appropriate selection and application of a SUIMS. SUIMSs cover a variety of procedures, including asset inventory and data collection, asset inspection, performance data collection, asset maintenance, financial asset management, DSS, and, finally, data visualization for each category of infrastructure assets. The SUIMS designed explicitly for managing urban pavements in this paper is a subclass of municipal integrated infrastructure asset management systems (i.e., roads and pavements).

5. Conclusions and Future Works

Whether cities already have substantial outdated systems or start from scratch, smart-city technologies help them use their assets more effectively. Budget management is essential to prevent spending millions of dollars on physical assets and maintenance, but emerging technology can provide new capabilities as fundamental components are improved. The most up-to-date methods and software can be used to monitor, measure, analyze, communicate, and act between pavements, a critical part of urban infrastructure.
Moving away from the old-fashioned methods of managing urban infrastructure, which lead to massive wastes of money and time, is discussed in this paper. Using the 3D mobile LiDAR and RBG cameras as data collection tools is faster and more accurate. Since there is no need for human interruption, it requires less calibration for post-processing analysis. Additionally, applying analysis tools such as ArcGIS pro, PMED design, and CityEngine for innovative spatial visualization helps city administrators access the most reliable data and research simultaneously.
This paper found that the best advantage of SUIMSs is that they are applicable in different situations worldwide. Getting the support of CityEngine rules on the one hand, and the capabilities of ArcGIS Pro and PMED design analysis tools on the other, will empower all city officers to establish their objectives in pavement design and maintenance procedure based on either their local or national sustainable development plans.
Although this study provided a significant contribution to designing and building an intelligent PMS, we present here some suggestions for future studies. Applying different multi-criterion methods for analyzing the main factors and barriers to a PMS is suggested [46]. Proposing efficient optimization algorithms based on metaheuristics [47,48] and machine learning models [49] is suggested to further study the PMS for predicting and optimizing large data sets in the PMS modeling.

Author Contributions

Conceptualization, Methodology, and Software, Writing and Original Draft Preparation, Visualization, and Investigation, M.M.; Supervision, Review and editing, G.J.A. All authors have read and agreed to the published version of the manuscript.

Funding

This research received no external funding.

Institutional Review Board Statement

Not applicable.

Informed Consent Statement

Not applicable.

Data Availability Statement

Not applicable.

Conflicts of Interest

The authors declare no conflict of interest.

Abbreviations

ICTInformation and communication technologies
PMSPavement management system
AIArtificial intelligence
IoTInternet of things
GISGeographic information systems
MEPDGMechanistic-empirical pavement design guide
MLMachine learning
IRIInternational roughness index
CNNConvolutional neural network
DEMDigital elevation model
SUIMSSmart urban infrastructure management system

References

  1. Hanák, T.; Marović, I.; Pavlović, S. Preliminary identification of residential environment assessment indicators for sustainable modelling of urban areas. Int. J. Eng. Model. 2014, 27, 61–68. [Google Scholar]
  2. Jajac, N.; Marović, I.; Hanák, T. Decision support for management of urban transport projects. Gradevinar 2015, 67, 131–141. [Google Scholar]
  3. AASHTO. Pavement Management Guide, 2nd ed.; American Association of State Highway and Transportation Officials: Washington, DC, USA, 2012. [Google Scholar]
  4. Gupta, S.; Langhans, S.D.; Domisch, S.; Fuso-Nerini, F.; Felländer, A.; Battaglini, M.; Tegmark, M.; Vinuesa, R. Assessing whether artificial intelligence is an enabler or an inhibitor of sustainability at indicator level. Transp. Eng. 2021, 4, 100064. [Google Scholar] [CrossRef]
  5. Vinuesa, R.; Azizpour, H.; Leite, I.; Balaam, M.; Dignum, V.; Domisch, S.; Felländer, A.; Langhans, S.D.; Tegmark, M.; Fuso Nerini, F. The role of artificial intelligence in achieving the Sustainable Development Goals. Nat. Commun. 2020, 11, 233. [Google Scholar] [CrossRef] [PubMed] [Green Version]
  6. Pomoni, M. Exploring Smart Tires as a Tool to Assist Safe Driving and Monitor Tire–Road Friction. Vehicles 2022, 4, 744–765. [Google Scholar] [CrossRef]
  7. Shtayat, A.; Moridpour, S.; Best, B.; Shroff, A.; Raol, D. A review of monitoring systems of pavement condition in paved and unpaved roads. J. Traffic Transp. Eng. 2020, 7, 629–638. [Google Scholar] [CrossRef]
  8. Campbell, M.; Egerstedt, M.; How, J.P.; Murray, R.M. Autonomous driving in urban environments: Approaches, lessons and challenges. Philos. Trans. R. Soc. A Math. Phys. Eng. Sci. 2010, 368, 4649–4672. [Google Scholar] [CrossRef] [Green Version]
  9. Crommelinck, S.; Bennett, R.; Gerke, M.; Nex, F.; Yang, M.Y.; Vosselman, G. Review of automatic feature extraction from high-resolution optical sensor data for UAV-based cadastral mapping. Remote Sens. 2016, 8, 689. [Google Scholar] [CrossRef] [Green Version]
  10. Ma, L.; Li, M.; Ma, X.; Cheng, L.; Du, P.; Liu, Y. A review of supervised object-based land-cover image classification. ISPRS J. Photogramm. Remote Sens. 2017, 130, 277–293. [Google Scholar] [CrossRef]
  11. Ros, G.; Ramos, S.; Granados, M.; Bakhtiary, A.; Vazquez, D.; Lopez, A.M. Vision-based offline-online perception paradigm for autonomous driving. In Proceedings of the 2015 IEEE Winter Conference on Applications of Computer Vision, Hawaii, HI, USA, 5–9 January 2015; pp. 231–238. [Google Scholar]
  12. Oreto, C.; Massotti, L.; Biancardo, S.A.; Veropalumbo, R.; Viscione, N.; Russo, F. BIM-Based Pavement Management Tool for Scheduling Urban Road Maintenance. Infrastructures 2021, 6, 148. [Google Scholar] [CrossRef]
  13. Mubaraki, M. Identification of pavement distress types and pavement condition evaluation based on network level inspection for Jazan City road network. J. Eng. Res. 2014, 11, 44–54. [Google Scholar] [CrossRef] [Green Version]
  14. Chong, G. Manual for Condition Rating of Flexible Pavements; Ministry of Transportation and Communications: Toronto, ON, Canada, 1982.
  15. Lajnef, N.; Chatti, K.; Chakrabartty, S.; Rhimi, M.; Sarkar, P. Smart Pavement Monitoring System; Federal Highway Administration. Federal Highway Administration, Michigan State University: East Lansing, MI, USA, 2013. [Google Scholar]
  16. Ma, L.; Li, Y.; Li, J.; Tan, W.; Yu, Y.; Chapman, M.A. Multi-scale point-wise convolutional neural networks for 3D object segmentation from LiDAR point clouds in large-scale environments. IEEE Trans. Intell. Transp. Syst. 2019, 22, 821–836. [Google Scholar] [CrossRef]
  17. Remondino, F. Heritage recording and 3D modeling with photogrammetry and 3D scanning. Remote Sens. 2011, 3, 1104–1138. [Google Scholar] [CrossRef] [Green Version]
  18. Levinson, J.; Askeland, J.; Becker, J.; Dolson, J.; Held, D.; Kammel, S.; Kolter, J.Z.; Langer, D.; Pink, O.; Pratt, V. Towards fully autonomous driving: Systems and algorithms. In Proceedings of the 2011 IEEE Intelligent Vehicles Symposium (IV), Baden-Baden, Germany, 5–9 June 2011; pp. 163–168. [Google Scholar]
  19. Yang, Z.; Zhang, Y.; Yu, J.; Cai, J.; Luo, J. End-to-end multi-modal multi-task vehicle control for self-driving cars with visual perceptions. In Proceedings of the 2018 24th International Conference on Pattern Recognition (ICPR), Beijing, China, 20–24 August 2018; pp. 2289–2294. [Google Scholar]
  20. SICK Home Page. Available online: https://www.sick.com/us/en/ (accessed on 29 December 2022).
  21. Munoz, D.; Bagnell, J.A.; Vandapel, N.; Hebert, M. Contextual classification with functional max-margin markov networks. In Proceedings of the 2009 IEEE Conference on Computer Vision and Pattern Recognition, Miami, FL, USA, 20–25 June 2009; pp. 975–982. [Google Scholar]
  22. Brédif, M.; Vallet, B.; Serna, A.; Marcotegui, B.; Paparoditis, N. Terramobilita/iqmulus urban point cloud analysis benchmark. Comput. Graph. 2015, 49, 126–133. [Google Scholar]
  23. Paparoditis, N.; Papelard, J.-P.; Cannelle, B.; Devaux, A.; Soheilian, B.; David, N.; Houzay, E. Stereopolis II: A multi-purpose and multi-sensor 3D mobile mapping system for street visualisation and 3D metrology. Rev. Française Photogrammétrie Télédétection 2012, 200, 69–79. [Google Scholar] [CrossRef]
  24. Hackel, T.; Savinov, N.; Ladicky, L.; Wegner, J.D.; Schindler, K.; Pollefeys, M. Semantic3d. net: A new large-scale point cloud classification benchmark. arXiv 2017, arXiv:1704.03847. [Google Scholar]
  25. Roynard, X.; Deschaud, J.-E.; Goulette, F. Paris-Lille-3D: A large and high-quality ground-truth urban point cloud dataset for automatic segmentation and classification. Int. J. Robot. Res. 2018, 37, 545–557. [Google Scholar] [CrossRef] [Green Version]
  26. Behley, J.; Garbade, M.; Milioto, A.; Quenzel, J.; Behnke, S.; Stachniss, C.; Gall, J. Semantickitti: A dataset for semantic scene understanding of lidar sequences. In Proceedings of the IEEE/CVF International Conference on Computer Vision, Seoul, Republic of Korea, 27 October–2 November 2019; pp. 9297–9307. [Google Scholar]
  27. Geiger, A.; Lenz, P.; Urtasun, R. Are we ready for autonomous driving? The kitti vision benchmark suite. In Proceedings of the 2012 IEEE Conference on Computer Vision and Pattern Recognition, Providence, RI, USA, 16–21 June 2012; pp. 3354–3361. [Google Scholar]
  28. Tan, W.; Qin, N.; Ma, L.; Li, Y.; Du, J.; Cai, G.; Yang, K.; Li, J. Toronto-3D: A large-scale mobile LiDAR dataset for semantic segmentation of urban roadways. In Proceedings of the IEEE/CVF Conference on Computer Vision and Pattern Recognition Workshops, Seattle, WA, USA, 14–19 June 2020; pp. 202–203. [Google Scholar]
  29. Local Calibration of the Mechanistic Empirical Design Software for Wisconsin. 2012. Available online: https://www.wistatedocuments.org/digital/collection/p267601coll4/id/15923/ (accessed on 29 December 2022).
  30. Shakhan, M.R.; Topal, A.; Sengoz, B. Data Collection for Implementation of the Mechanistic-Empirical Pavement Design Guide (MEPDG) in Izmir, Turkey. Tek. Dergi 2020, 36, 2021. [Google Scholar] [CrossRef]
  31. Bayomy, F.M. Dynamic Characterization of Egyptian Hot Mix Asphalt Concrete for Highway Pavement Design and Evaluation; US–Egypt Cooperative Research, Final Report No. 612630; University of Idaho: Moscow, ID, USA, 2010. [Google Scholar]
  32. Elfino, M.K.; Nair, H.; Gudimettla, J.M.; Crawford, G.L. Design comparison between 1993 AASHTO and MEPDG using level 1 input for continuously reinforced concrete pavement: A case study in Virginia. In Proceedings of the Transportation Research Board 89th Annual Meeting, Washington, DC, USA, 10–14 January 2010. [Google Scholar]
  33. Gusto, T. Mechanistic-Empirical Pavement Design Guide (MEPDG) Method Implemented to Estimate Damage in Flexible and Rigid Pavements. Master’s Thesis, The City College of New York, New York, NY, USA, 2016. [Google Scholar]
  34. El-shaib, M.A.; El-Badawy, S.M.; Shawaly, E.-S.A. Comparison of AASHTO 1993 and MEPDG considering the Egyptian climatic conditions. Innov. Infrastruct. Solut. 2017, 2, 18. [Google Scholar] [CrossRef] [Green Version]
  35. Kim, Y.R. GIS-Based Implementation Methodology for the NCHRP Project 9-23A Recommended Soil Parameters for Use as Input to the MEPDG in North Carolina. In Proceedings of the Transportation Research Board 90th Annual Meeting, Washington, DC, USA, 23–27 January 2011. [Google Scholar]
  36. Tsai, Y.J.; Wu, Y.-C. Developing a Comprehensive Pavement Condition Evaluation System for Rigid Pavements in Georgia. Georgia Department of Transportation: Atlanta, GA, USA, 2019. [Google Scholar]
  37. Brail, R.K.; Klosterman, R.E. Planning Support Systems: Integrating Geographic Information Systems, Models, and Visualization Tools. ESRI, Inc.: Redlands, CA, USA, 2001. [Google Scholar]
  38. Tarabay, N. Pavement Distress Detection with Conventional Self-Driving; École de Technologie Supérieure: Montreal, QC, Canada, 2020. [Google Scholar]
  39. OUSTER. OS1-16/64 High Resolution Imaging Lidar—Hardware User Guide. 2019. Available online: https://levelfivesupplies.com/wp-content/uploads/2019/03/OS-1-User-Guide-Hardware.pdf (accessed on 29 December 2022).
  40. Tong, Z.; Gao, J.; Zhang, H. Recognition, location, measurement, and 3D reconstruction of concealed cracks using convolutional neural networks. Constr. Build. Mater. 2017, 146, 775–787. [Google Scholar] [CrossRef]
  41. Li, J.; Song, G.; Yan, J.; Li, Y.; Xu, Z. Data-driven fault detection and classification for MTDC systems by integrating HCTSA and softmax regression. IEEE Trans. Power Deliv. 2021, 37, 893–904. [Google Scholar] [CrossRef]
  42. Kazmierowski, T. Pavement Design and Rehabilitation Manual; Materials Engineering and Research Office, Ministry of Transportation: Ottawa, ON, Canada, 2013.
  43. Capotosto, L. Développement d’une Plateforme Intégrée Pour L’optimisation de la Conception de la Réhabilitation des Chaussées; École de Technologie Supérieure: Montreal, QC, Canada, 2021. [Google Scholar]
  44. Goodchild, M.F.; Parks, B.O.; Steyaert, L.T. Environmental Modeling with GIS. Oxford University Press, Inc.: Oxford, UK, 1993. [Google Scholar]
  45. He, K.; Gkioxari, G.; Dollár, P.; Girshick, R. Mask r-cnn. In Proceedings of the 2017 IEEE International Conference on Computer Vision, Venice, Italy, 22–29 October 2017; pp. 2961–2969. [Google Scholar]
  46. Kamranfar, S.; Azimi, Y.; Gheibi, M.; Fathollahi-Fard, A.M.; Hajiaghaei-Keshteli, M. Analyzing green construction development barriers by a hybrid decision-making method based on DEMATEL and the ANP. Buildings 2022, 12, 1641. [Google Scholar] [CrossRef]
  47. Zhang, X.; Yuan, J.; Chen, X.; Zhang, X.; Zhan, C.; Fathollahi-Fard, A.M.; Wang, C.; Liu, Z.; Wu, J. Development of an Improved Water Cycle Algorithm for Solving an Energy-Efficient Disassembly-Line Balancing Problem. Processes 2022, 10, 1908. [Google Scholar] [CrossRef]
  48. Zhang, Y.; Zhu, Z.; Ning, W.; Fathollahi-Fard, A.M. An Improved Optimization Algorithm Based on Density Grid for Green Storage Monitoring System. Sustainability 2022, 14, 10822. [Google Scholar] [CrossRef]
  49. Shakerian, M.; Karrabi, M.; Gheibi, M.; Fathollahi-Fard, A.M.; Hajiaghaei-Keshteli, M. Evaluating the Performance of a Solar Distillation Technology in the Desalination of Brackish Waters. Processes 2022, 10, 1626. [Google Scholar] [CrossRef]
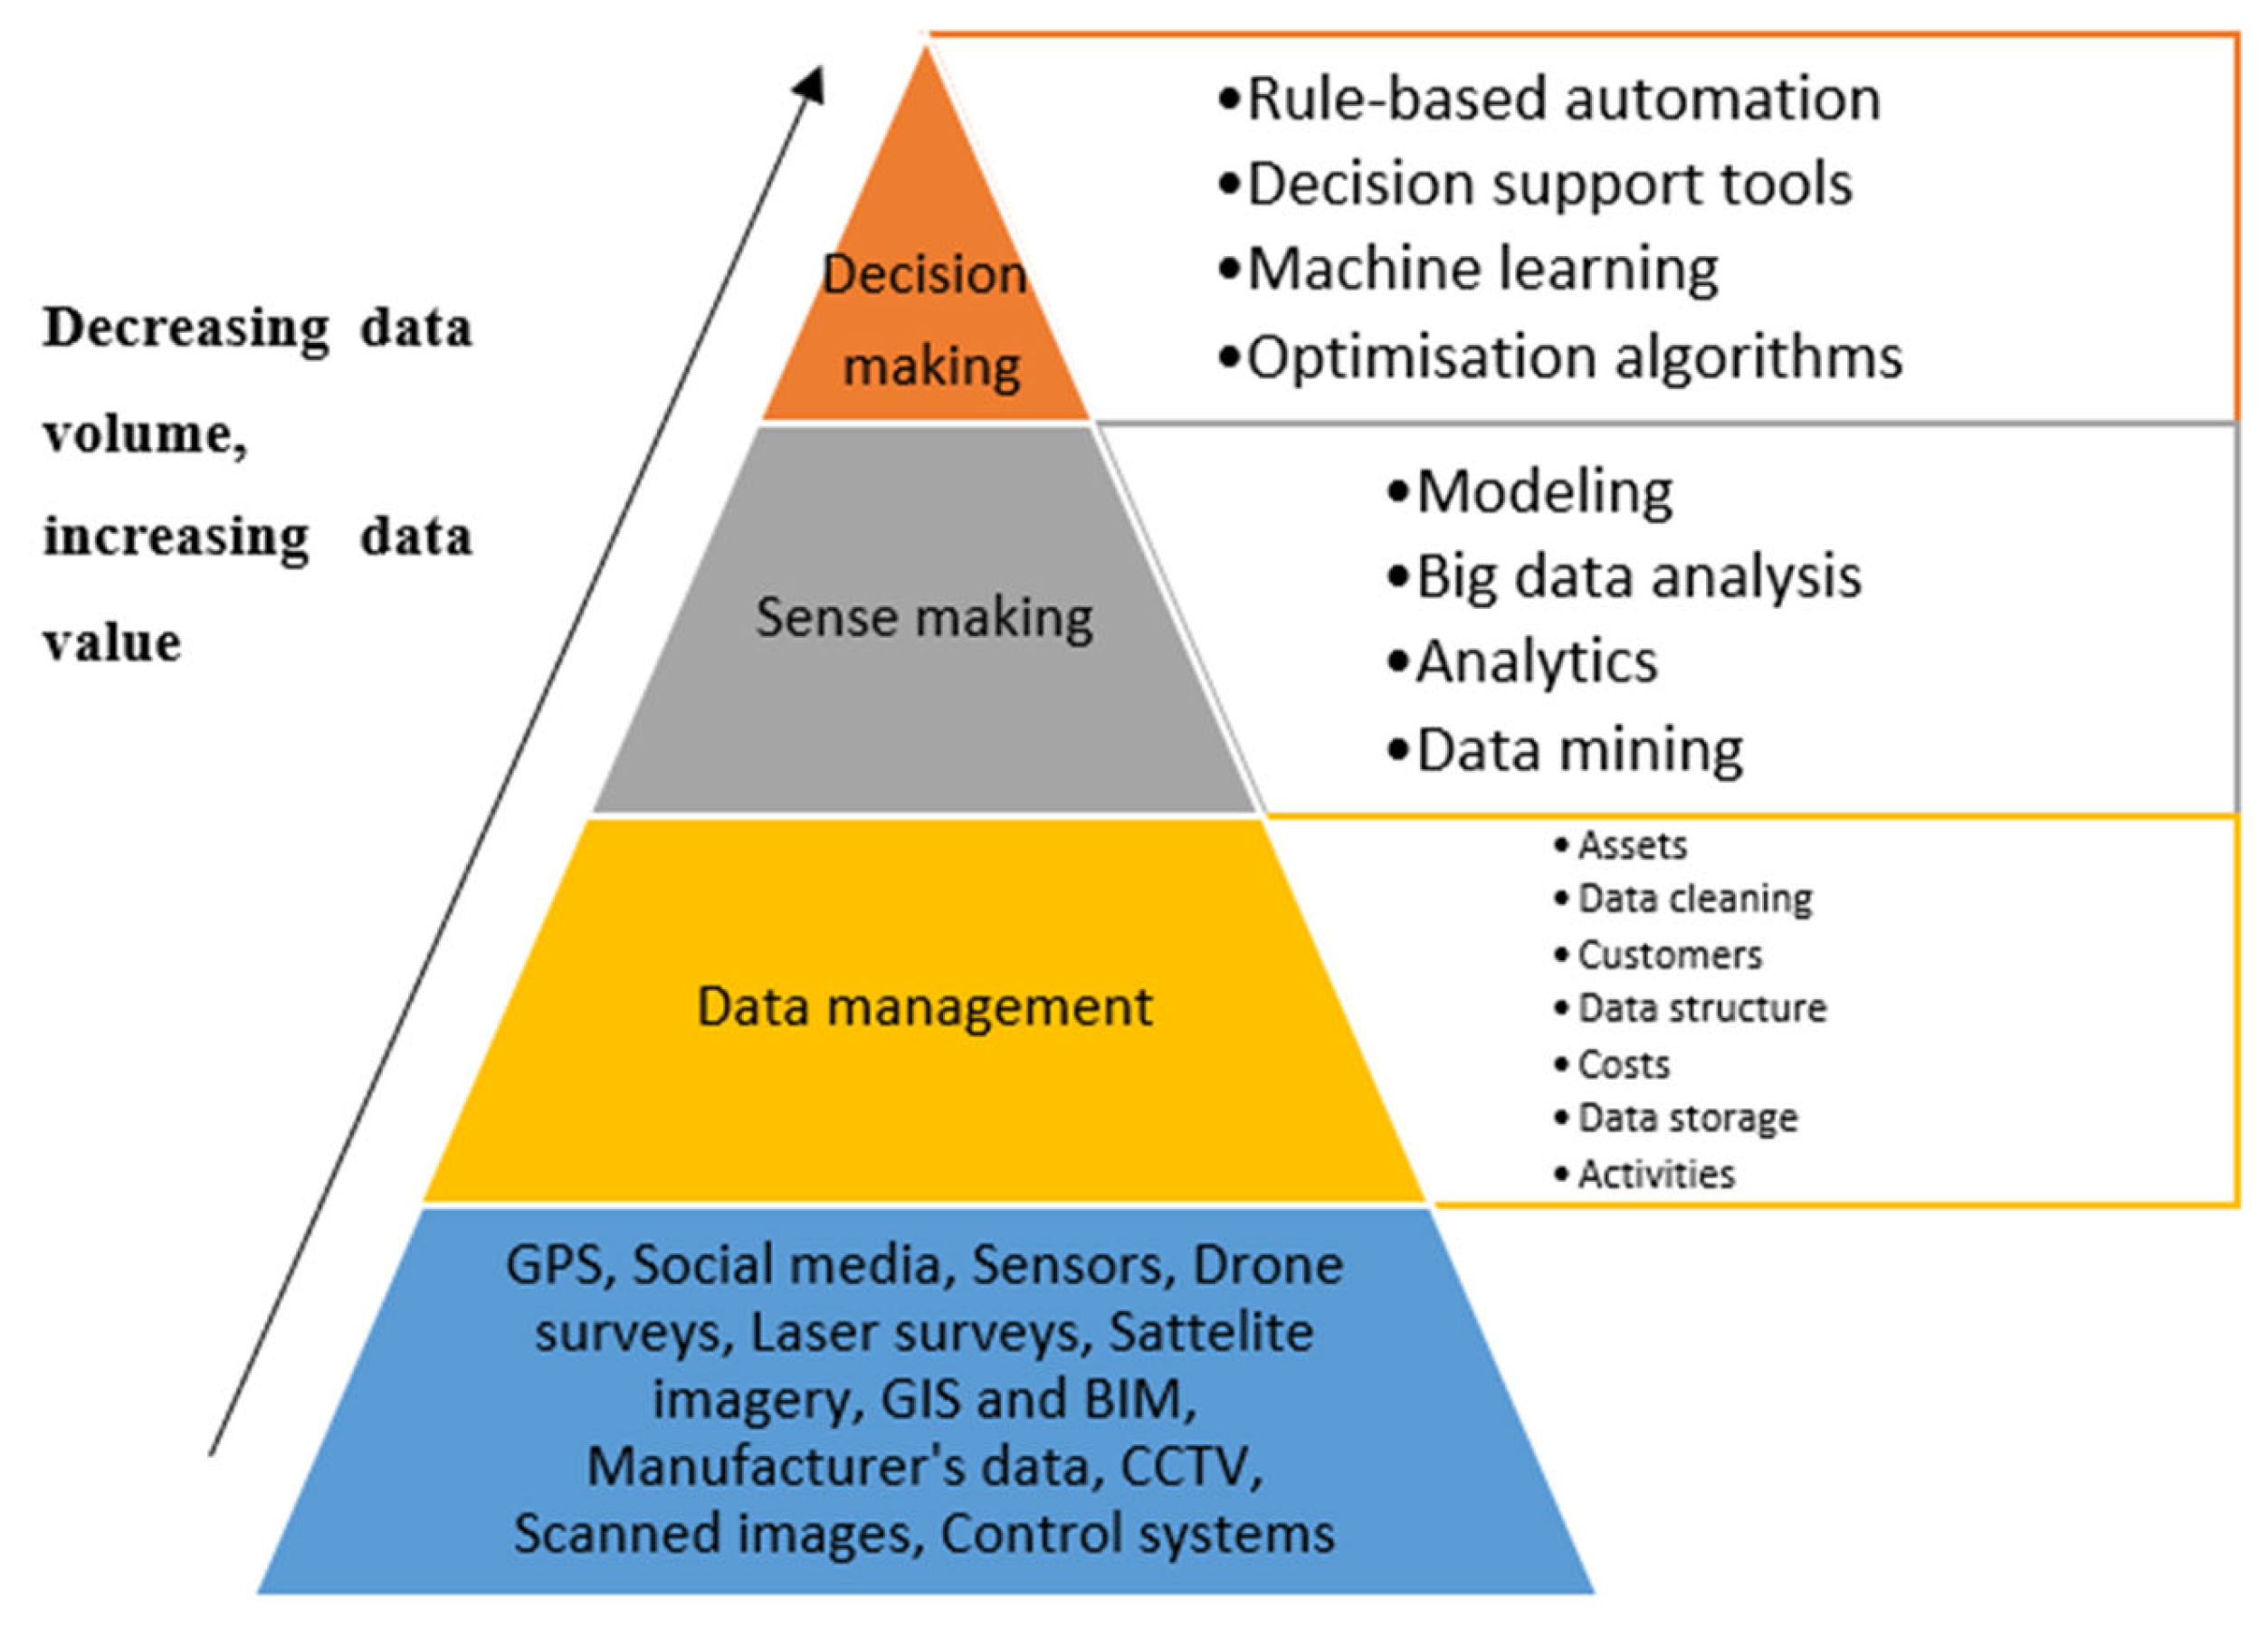
Figure 1. Different components and tools of a SUIMS.
Sustainability 15 01157 g001
Figure 2. Workflow of the methodology.
Sustainability 15 01157 g002
Figure 3. Different integer codes in a .las file.
Sustainability 15 01157 g003
Figure 4. Mask R-CNN outputs for the three stages (left to right) [38].
Sustainability 15 01157 g004
Figure 5. An analytical flowchart of the spatial analysis module of the research.
Sustainability 15 01157 g005
Figure 6. DEM extracted from ground point data.
Sustainability 15 01157 g006
Figure 7. Pavement polyline extraction.
Sustainability 15 01157 g007
Table 1. Ouster OS-1 specifications, reprinted with permission from [39].
Specifications3D LiDAR (Ouster OS-1
16ch)
3D points/profile200 to 400 (4 m Field of View (FoV))
Car’s velocity70–100 km/h
Distance between profiles7–15 cm
X-axis resolution1.1 to 2.4 cm
Lateral FoVUp to 100 m
Precision on the Z-axis3 cm
Frequency of sampling160–320 profiles/s
Table 2. Four Different Modules of SUIMS.
Asset inventory and maintenance management module (1)Asset inventory and data collectionAsset performance modeling module (2)Asset deterioration forecasting functionsDSS module (3)Decision scenario generatorIntelligence and reporting module (4)Interactive data postprocessing and visualization tools
Asset inspection and maintenance managementOptimizer (solver)
GIS
Disclaimer/Publisher’s Note: The statements, opinions and data contained in all publications are solely those of the individual author(s) and contributor(s) and not of MDPI and/or the editor(s). MDPI and/or the editor(s) disclaim responsibility for any injury to people or property resulting from any ideas, methods, instructions or products referred to in the content.