

The Impact of Degradation on a Building’s Energy Performance in Hot-Humid Climates


Abstract
1. Introduction
- Collect and evaluate available data on the degradation of various building components.
- Determine the impact of the degradation of various building components on building energy performance by conducting a series of dynamic thermal simulations.
- Develop a set of guidelines, taking into consideration the effects of the degradation of various building components over time on the energy performance of buildings.
2. Literature Review
2.1. Review of Approaches to Assessing Building Performance Degradation
2.2. Overview of Data on Degradation of Various Building Components
2.2.1. Data on Degradation of Insulated Glass Units (IGU)
2.2.2. Data on Degradation of Thermal Insulation
2.2.3. Data on Degradation of Airtightness
2.2.4. Data on the Degradation of Building Envelope Coatings (Deterioration of SRI)
2.2.5. Data on Degradation of PV Modules
2.2.6. Literature Appraisal
3. The Case Studies
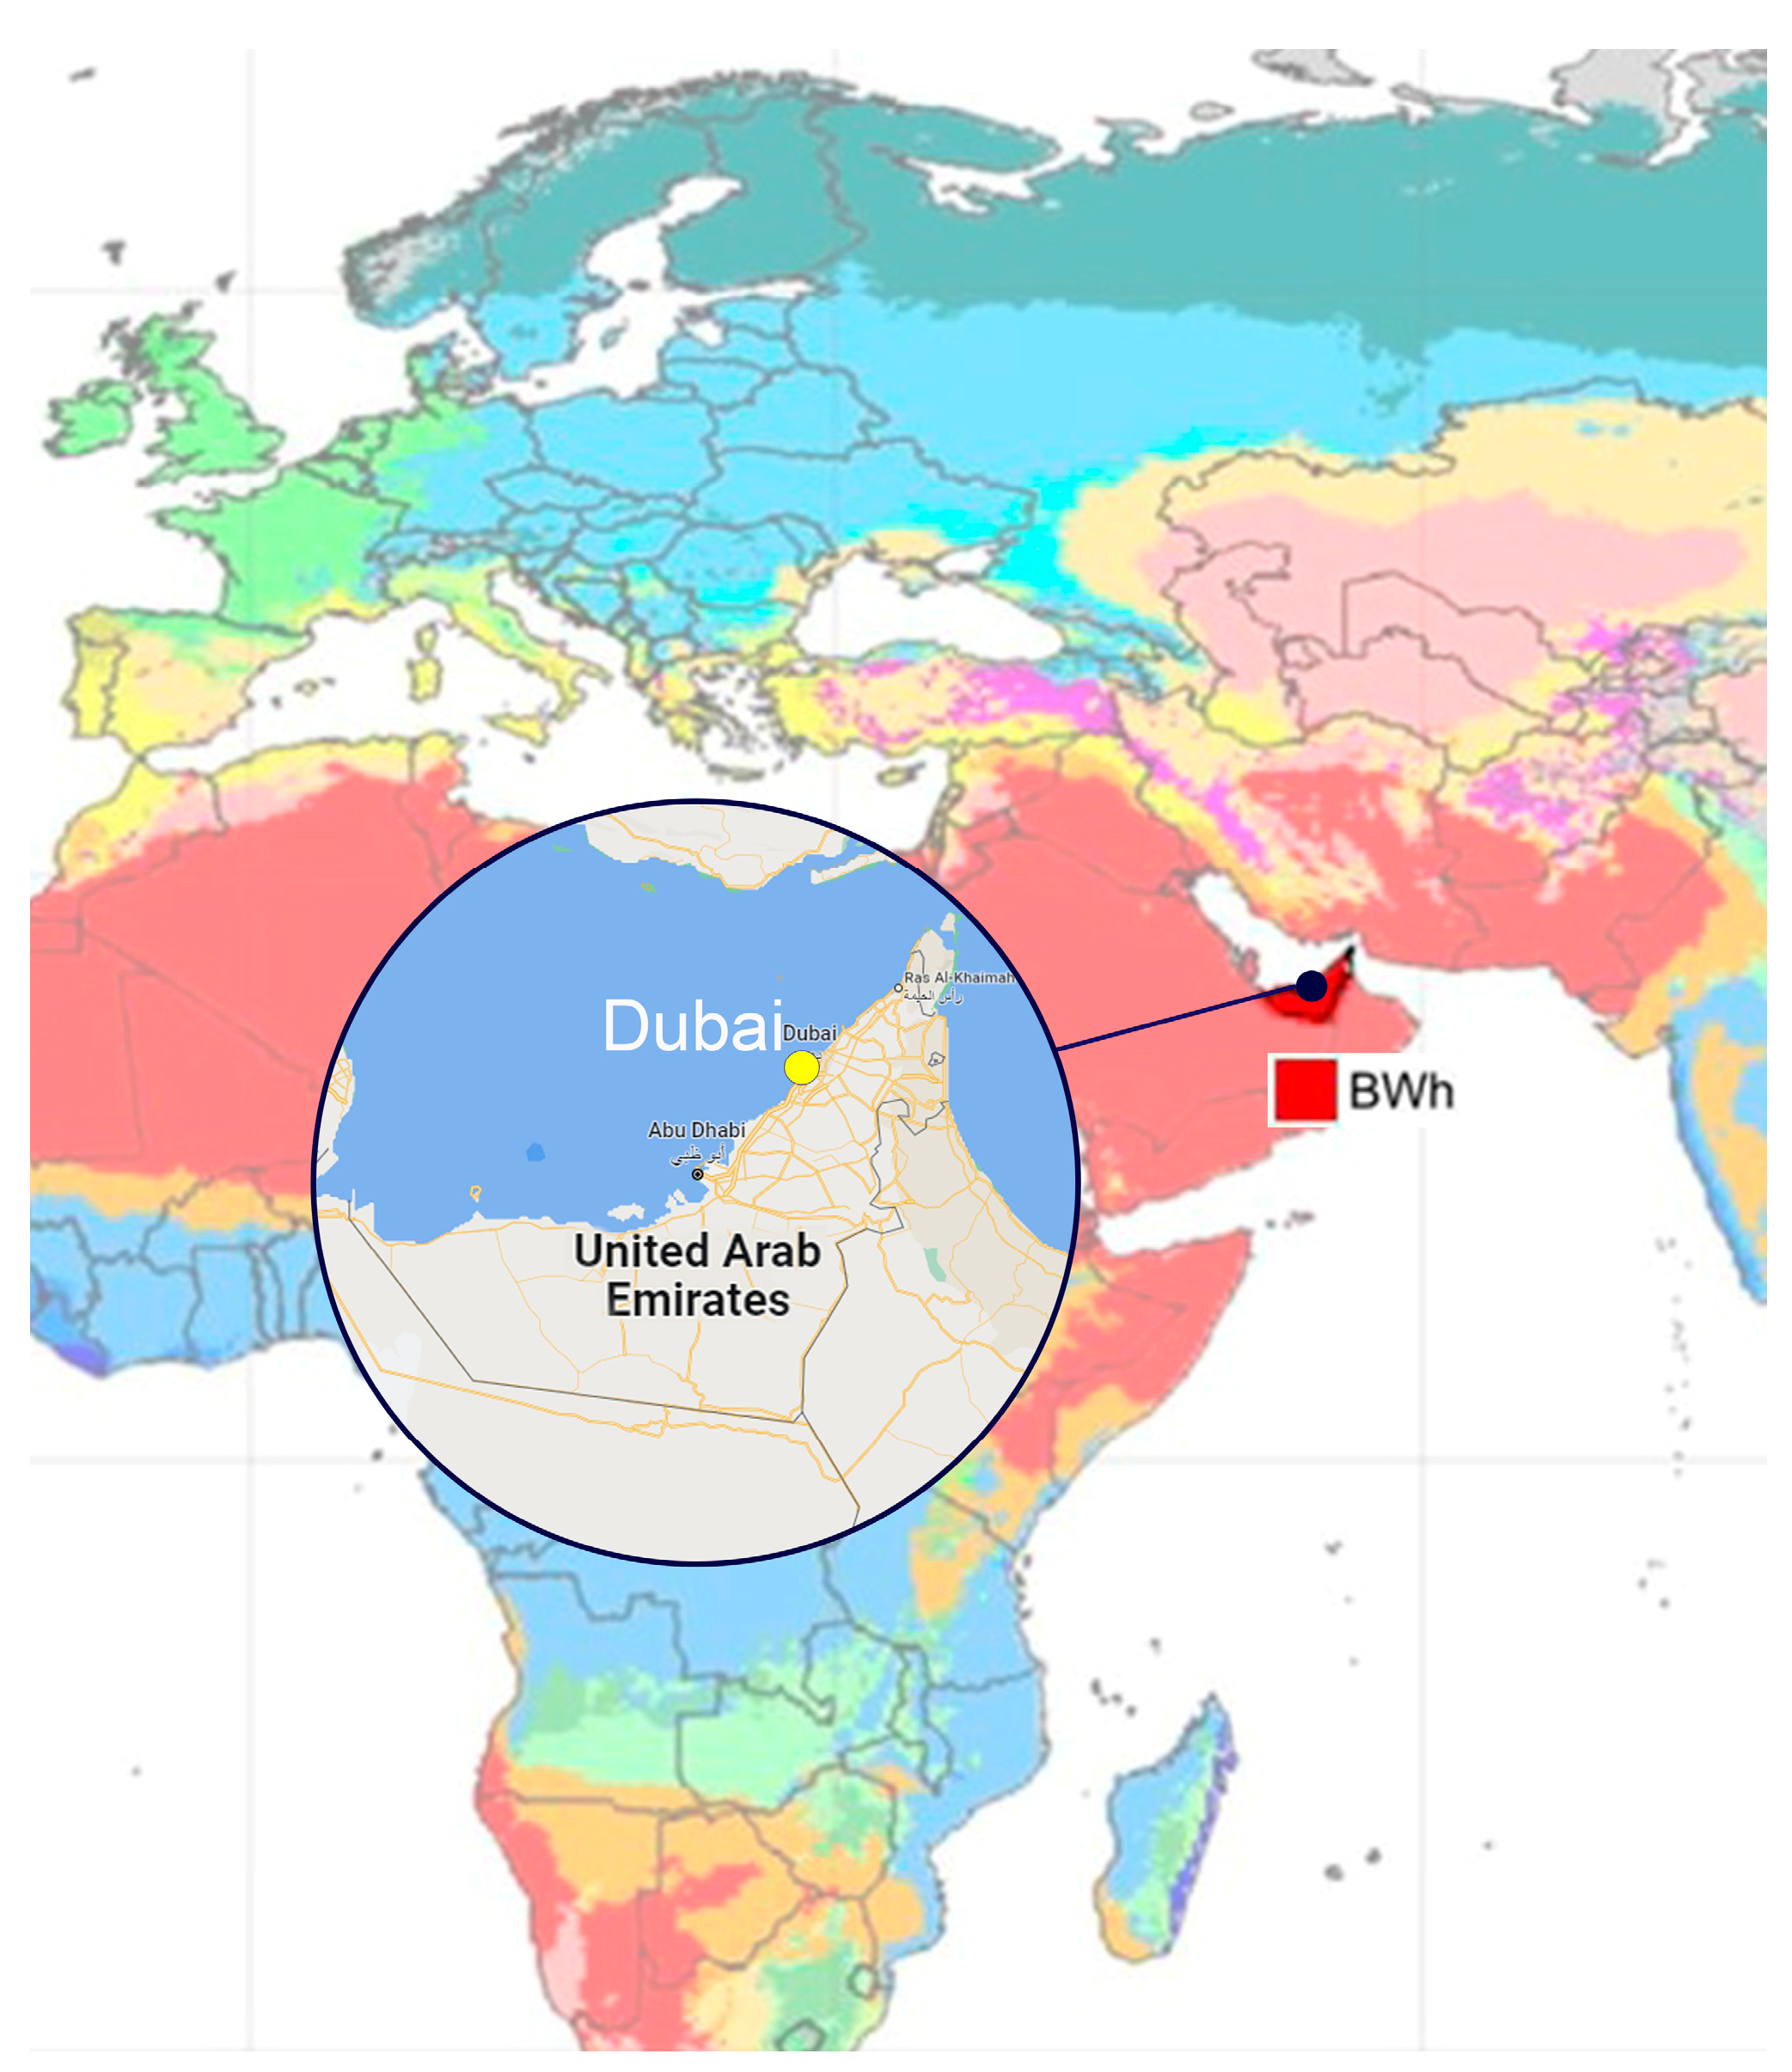
3.1. The Climate
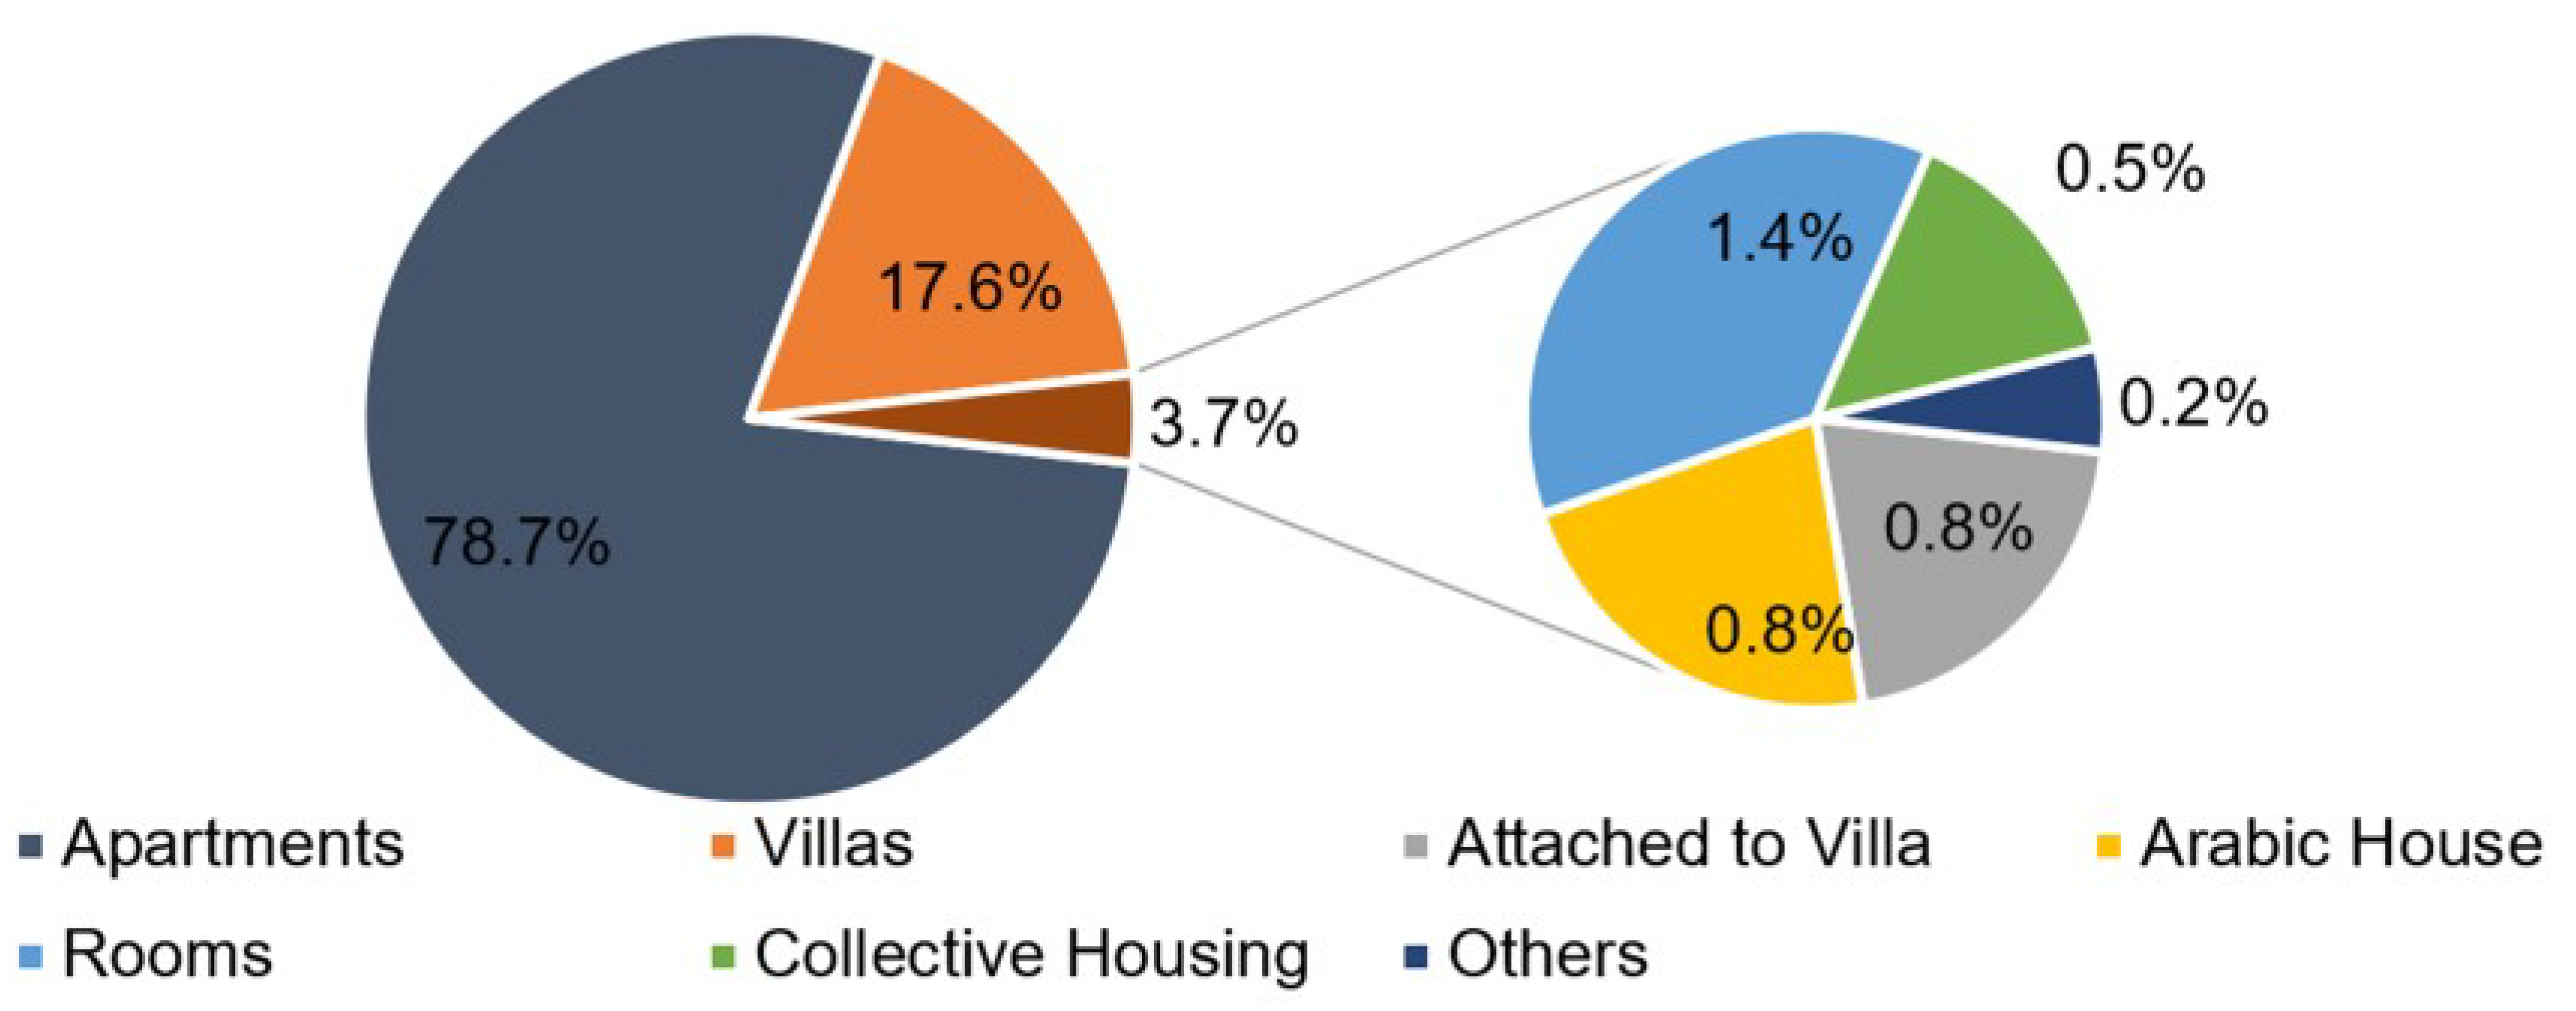
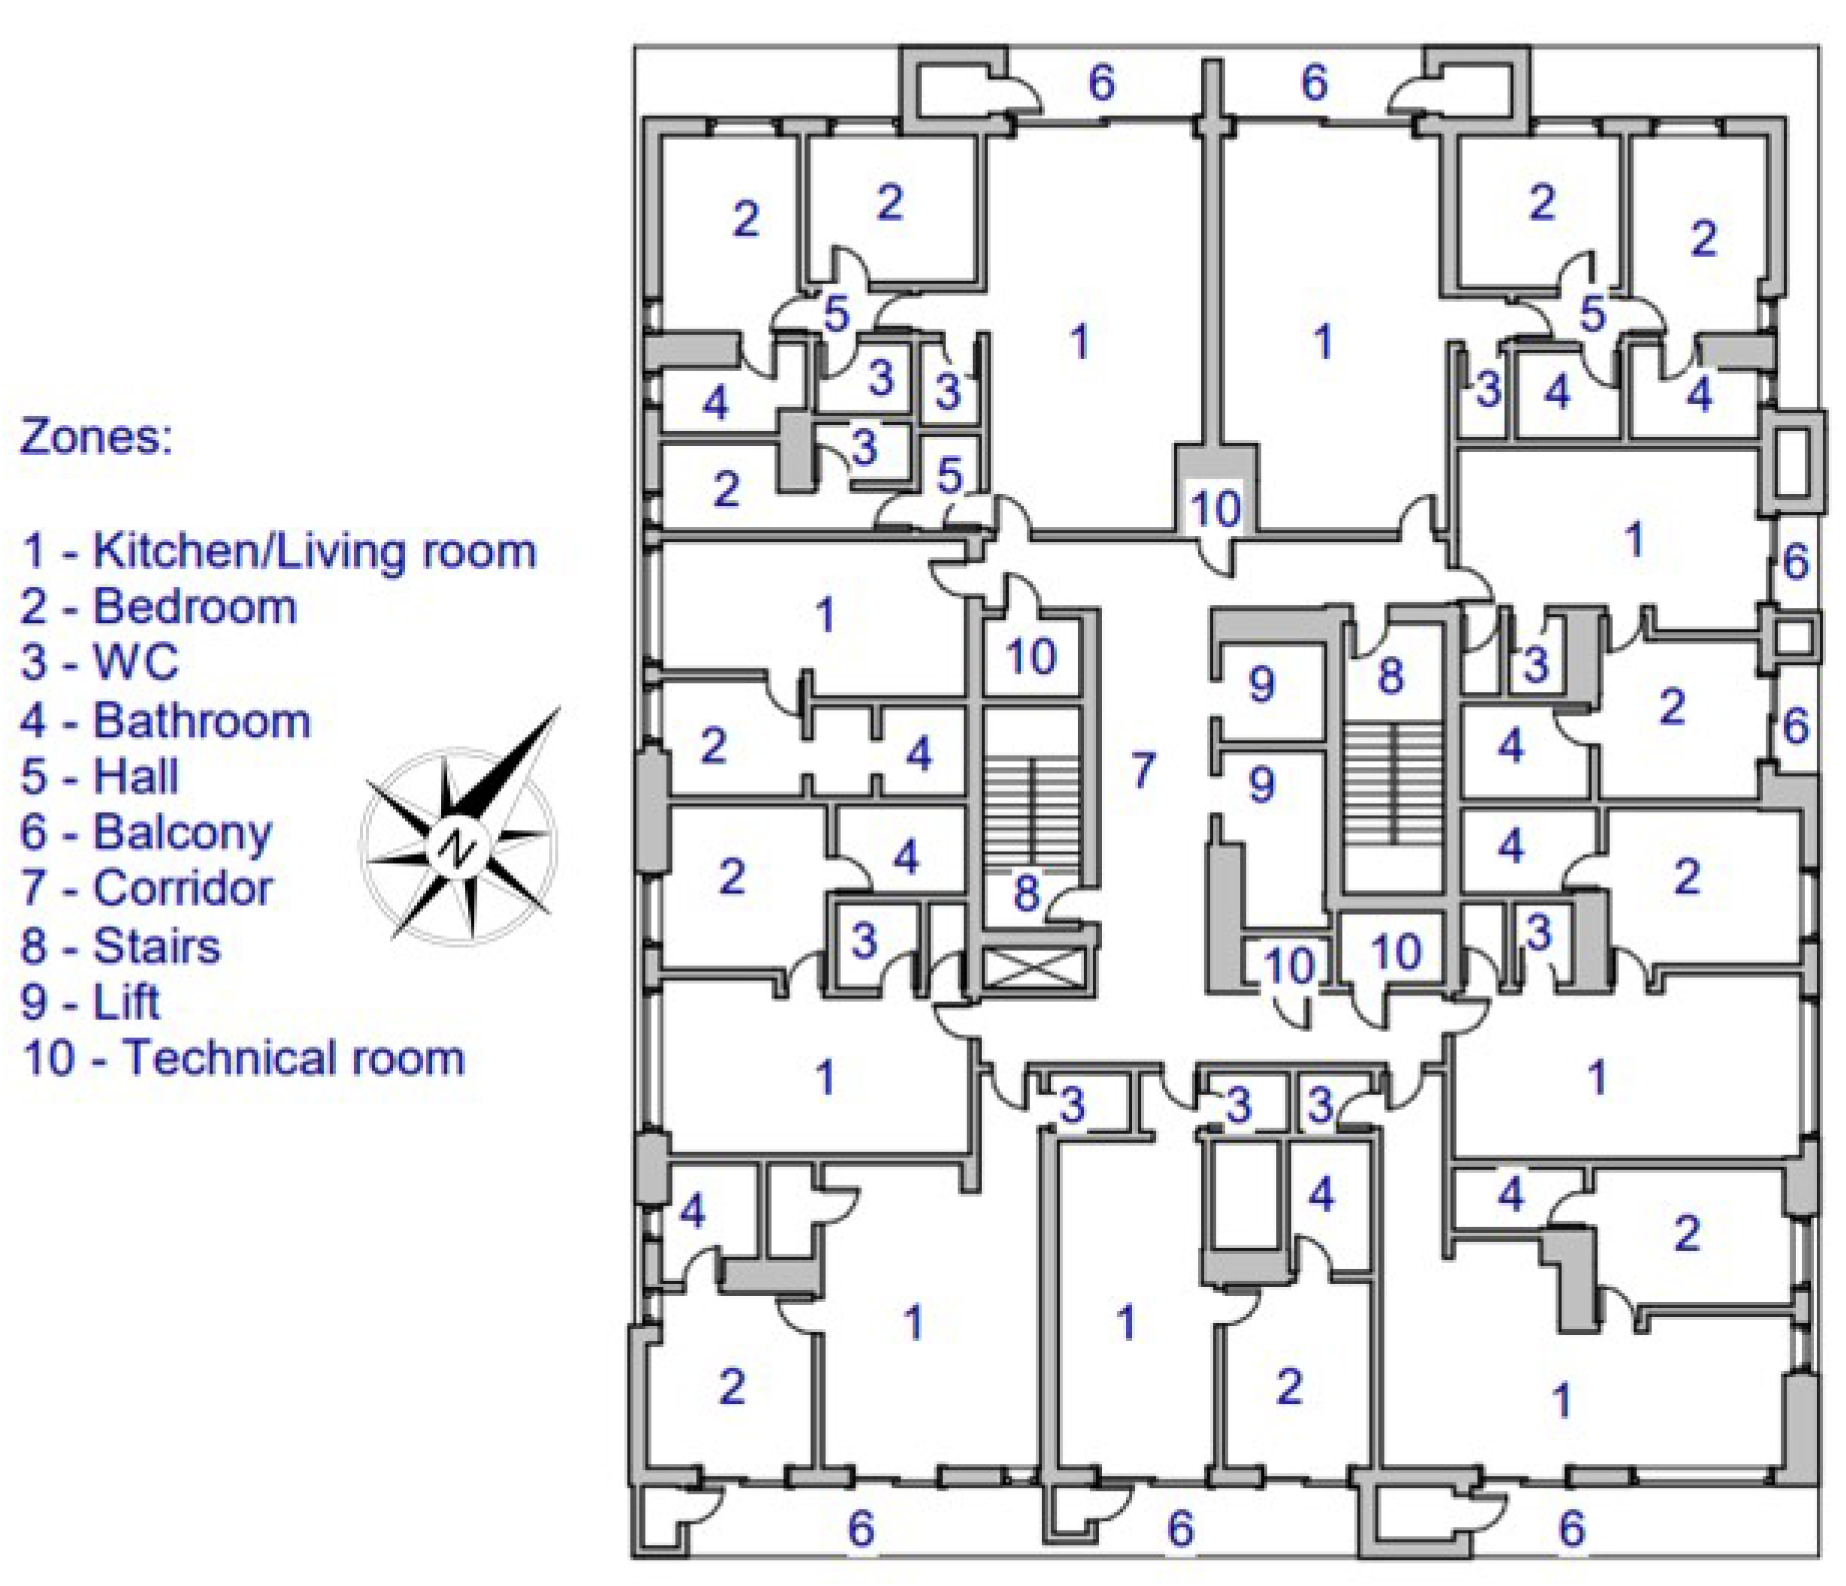
3.2. Description of Buildings
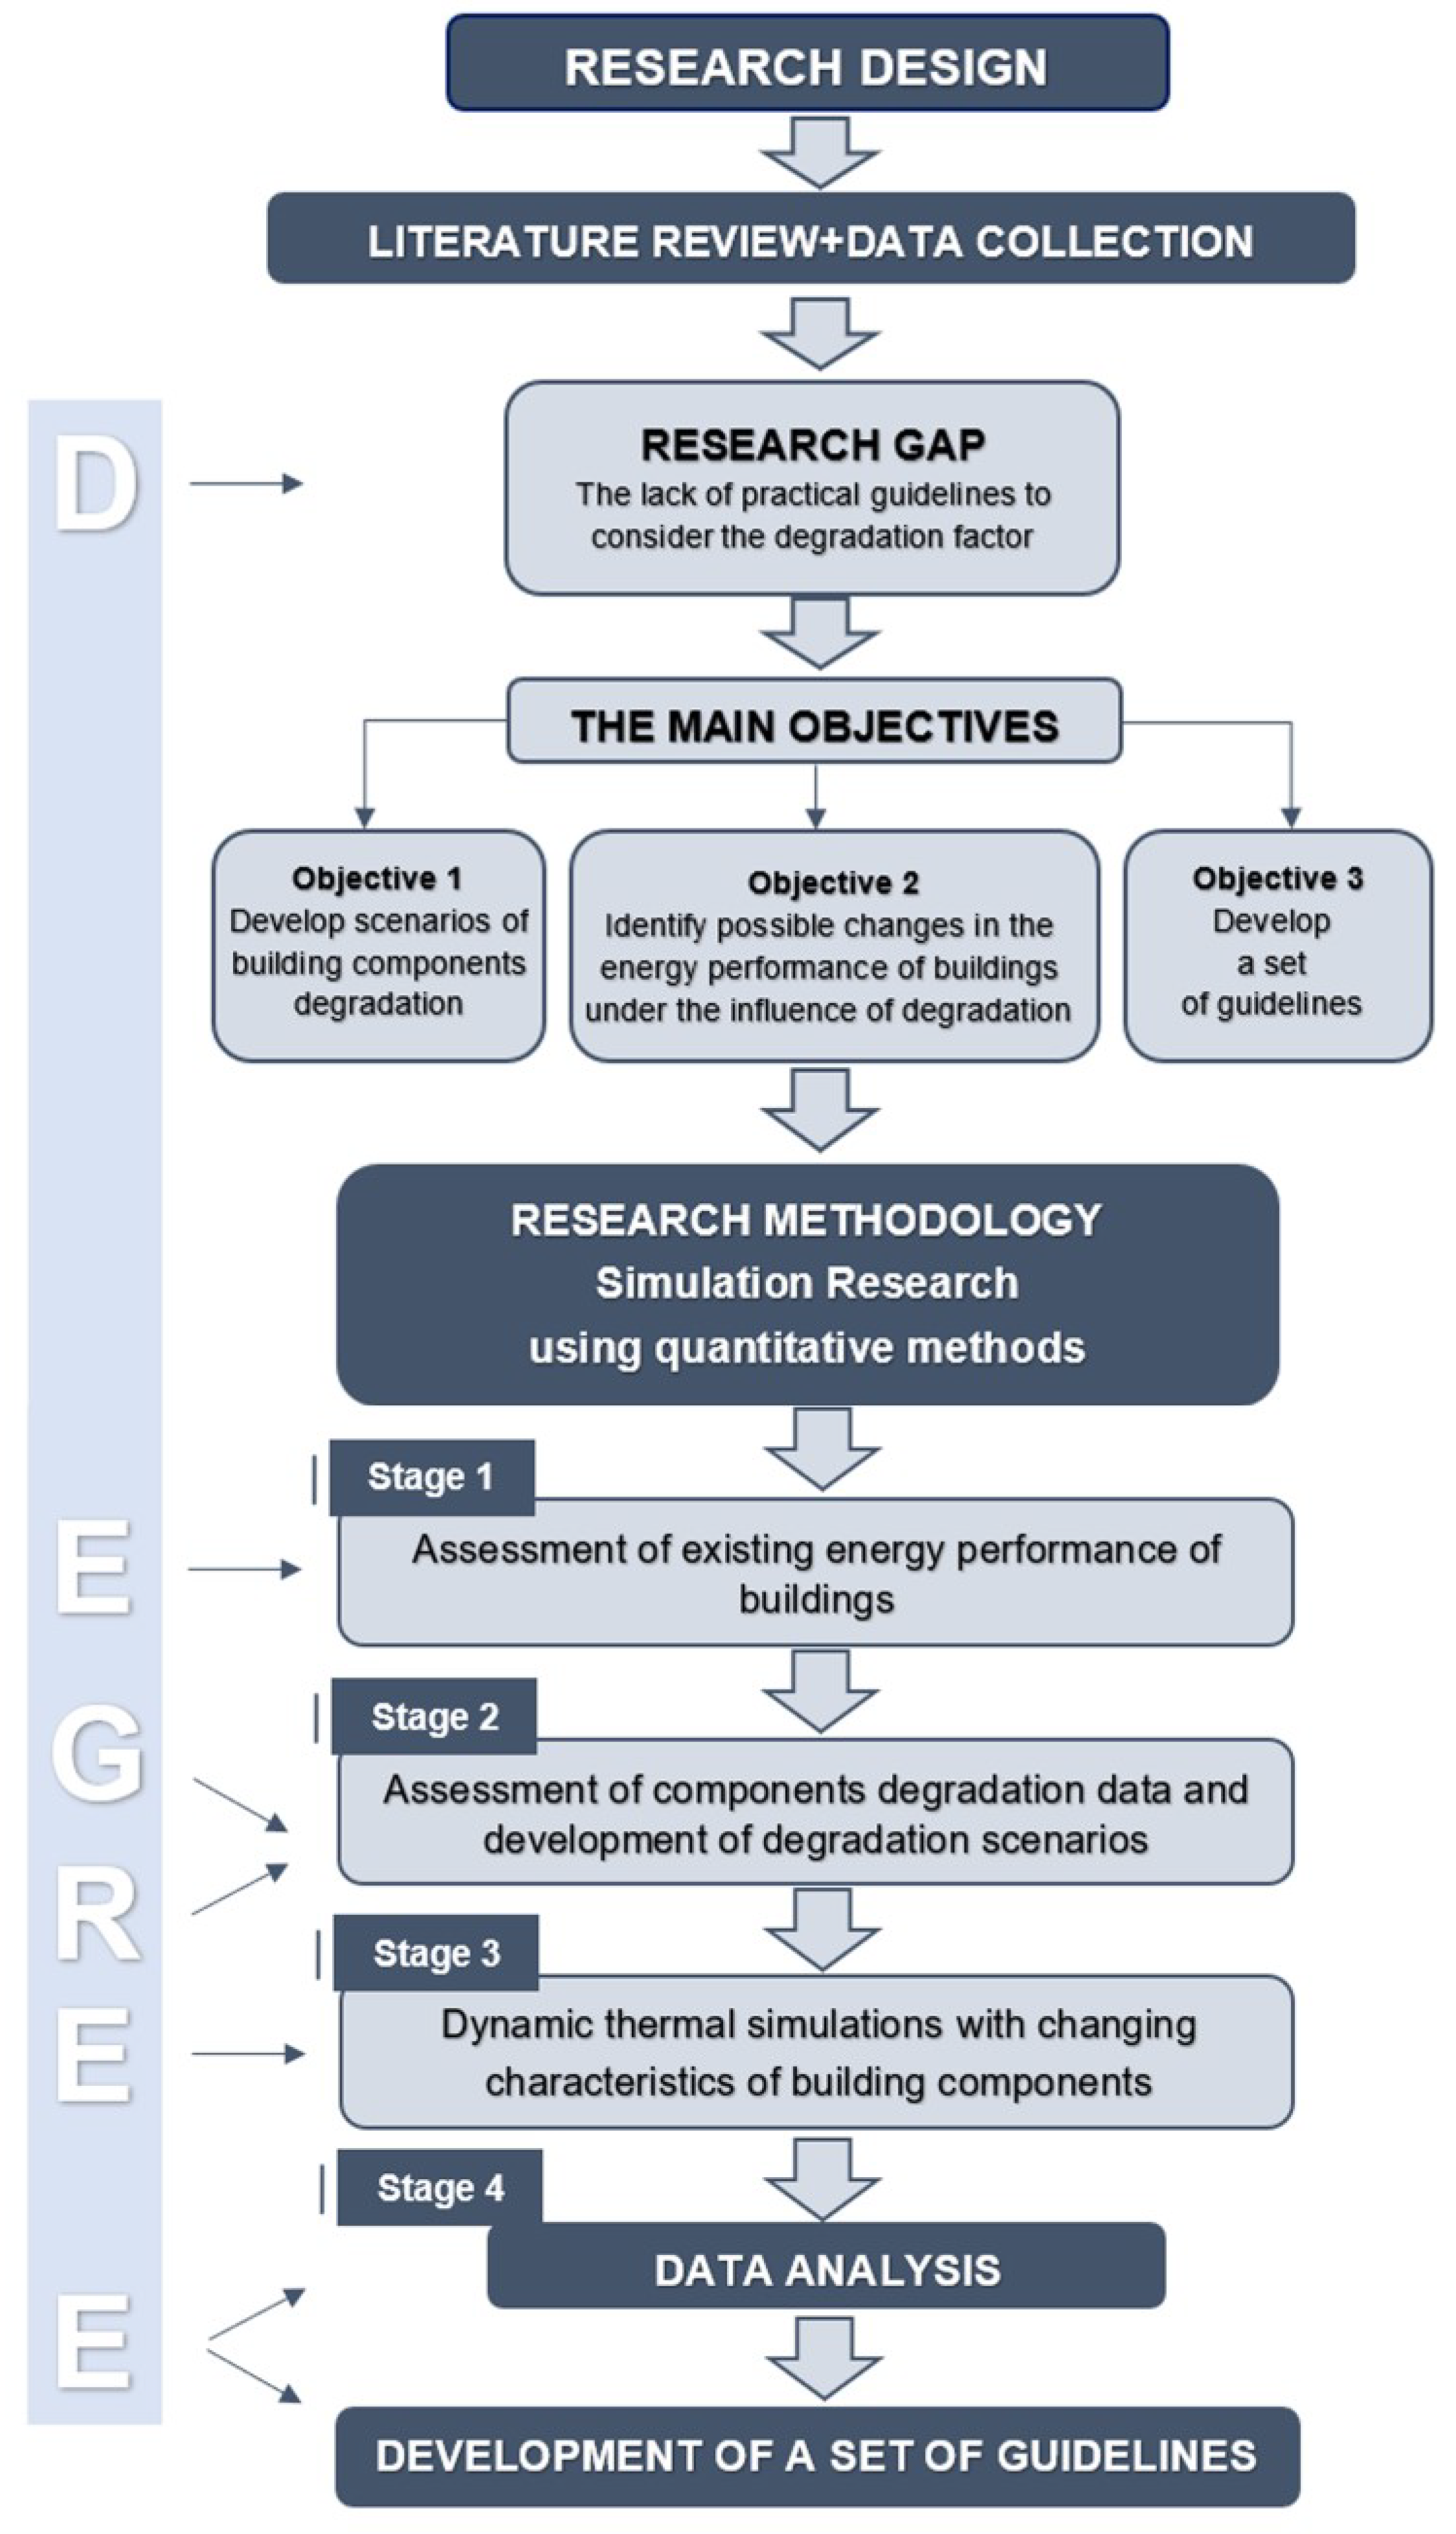
4. Methodology
4.1. Research Methods
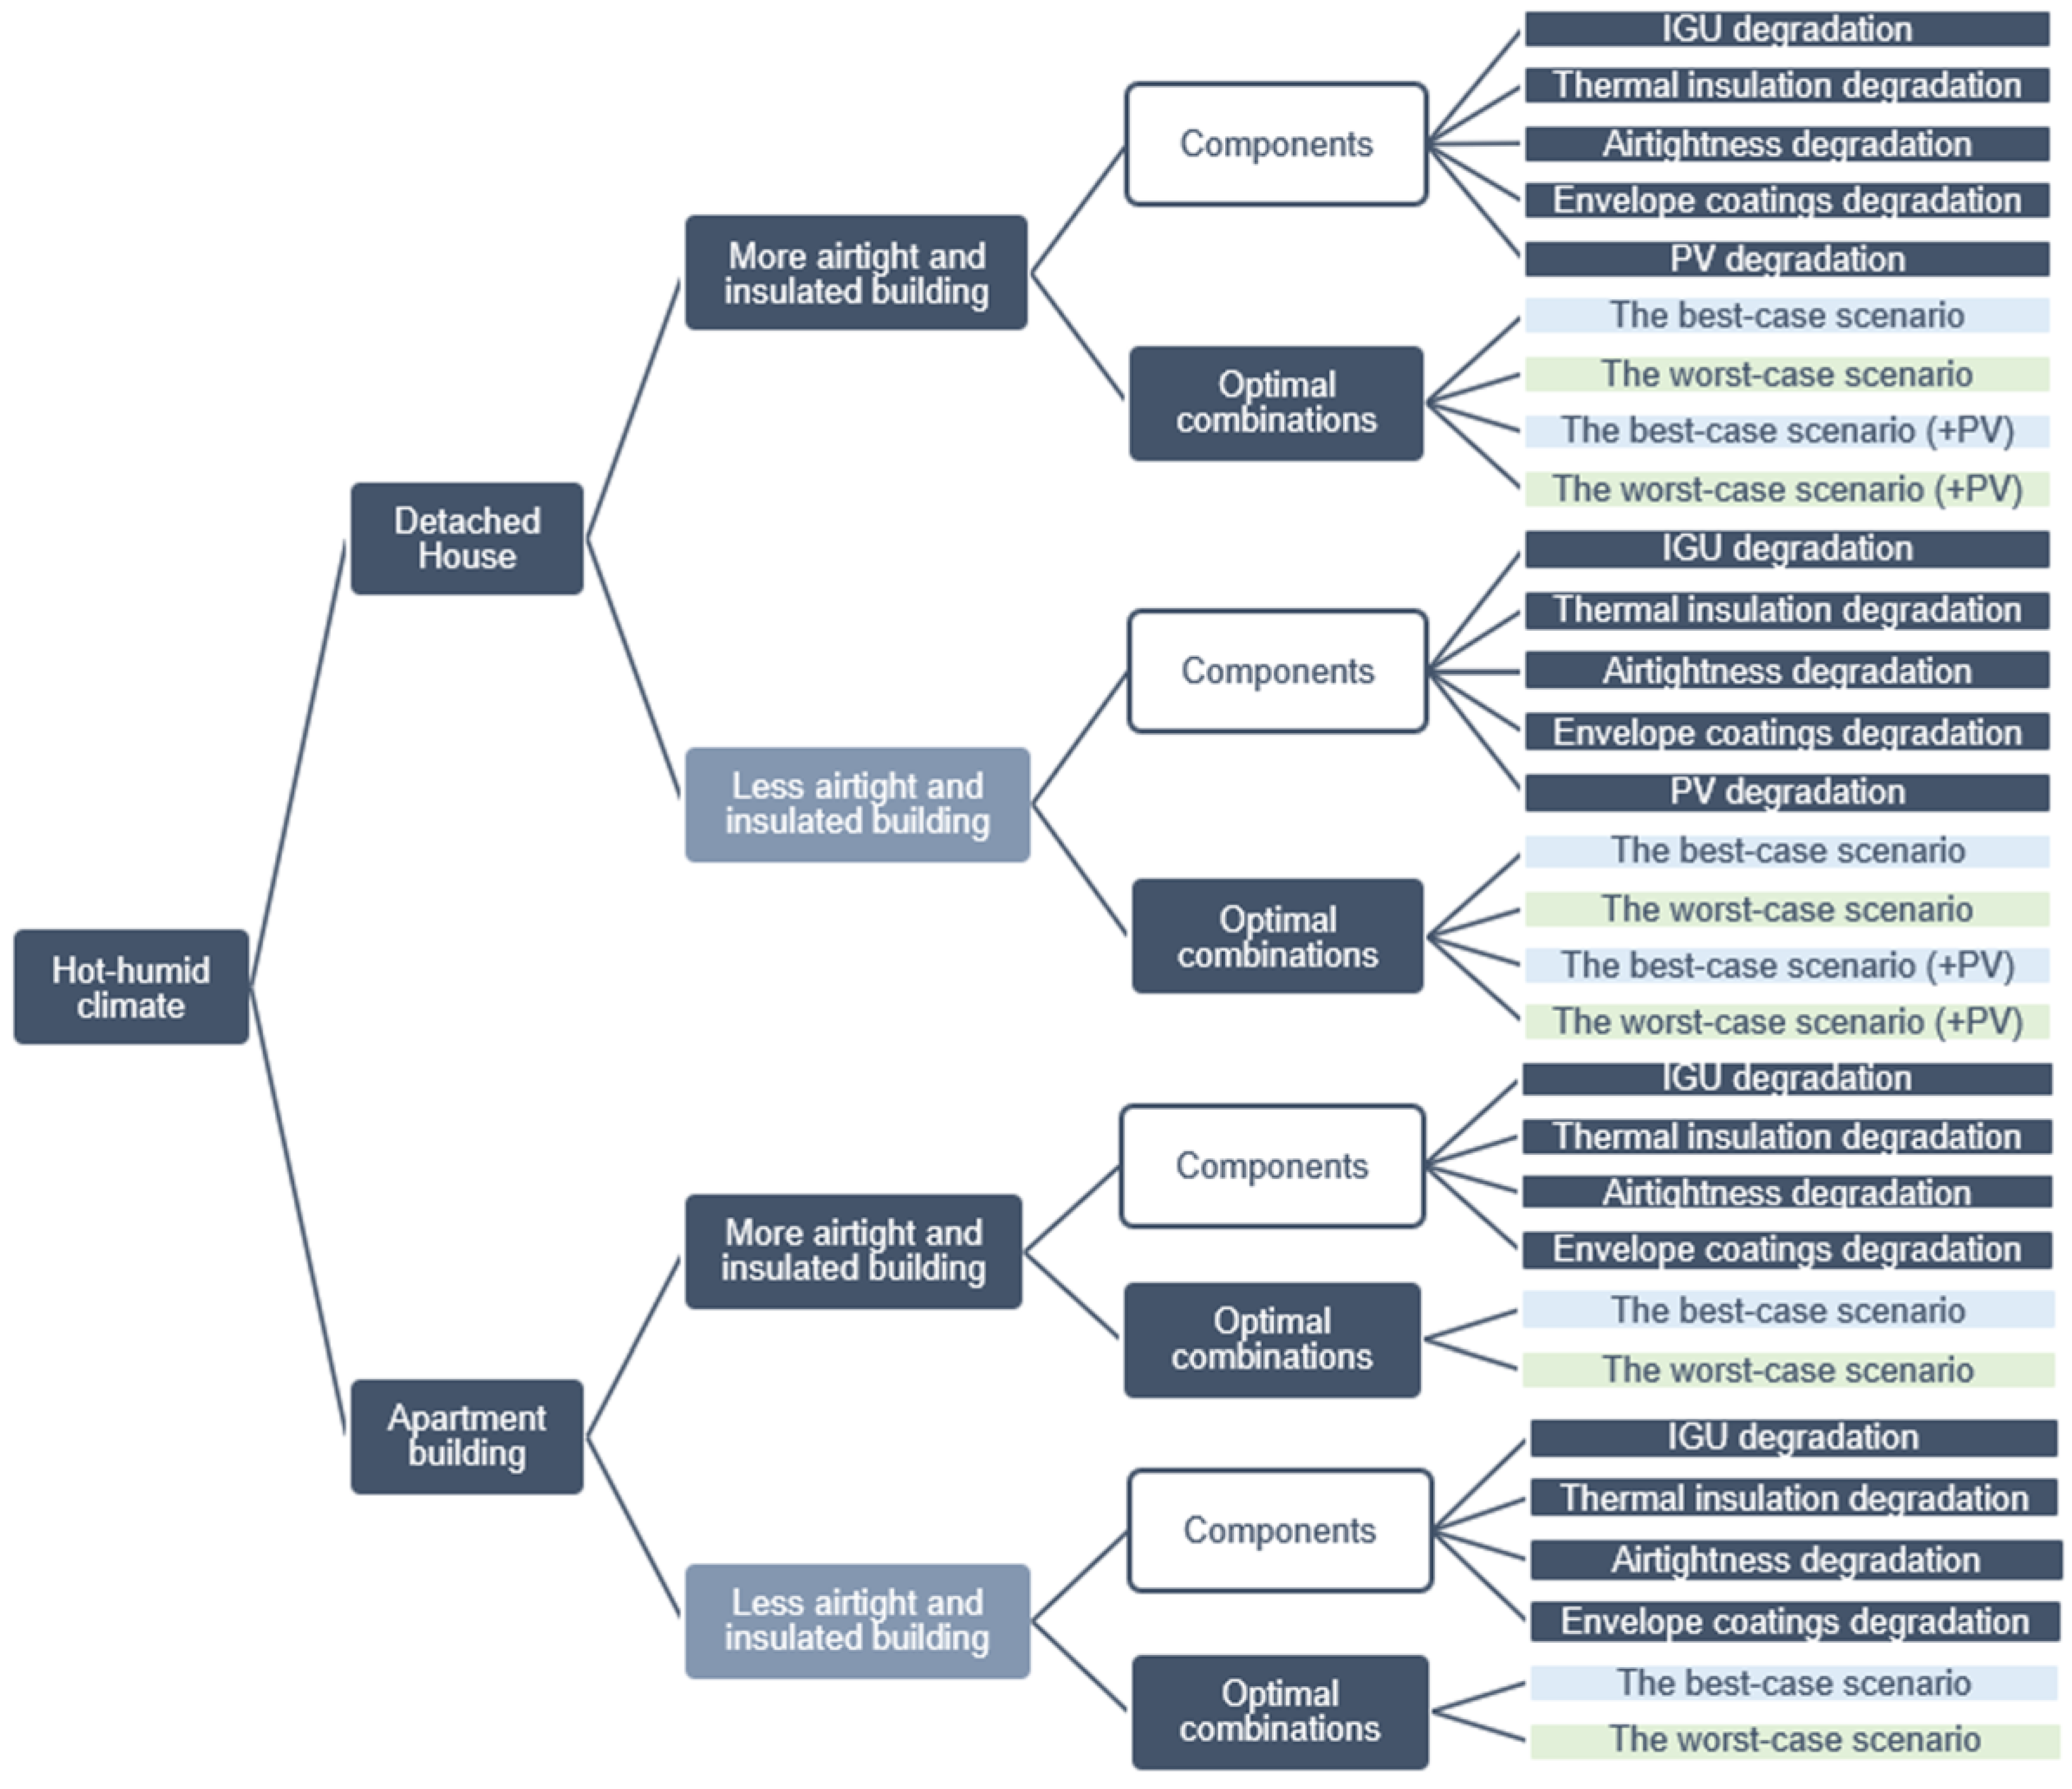
4.2. Development of Degradation Scenarios of Various Building Components
4.3. Dynamic Thermal Simulations
5. Results and Discussion
5.1. The Impact of IGU’s Degradation on the Energy Performance of Buildings
- In the more airtight and insulated detached house, the increase in energy consumption for cooling due to the degradation of IGU occurred faster (by 0.33–22.6% over 25 years) than in the less airtight and insulated detached house (by 0.23–15.18%). The main reason for this could be that in the more airtight and insulated buildings, the envelope is initially critical in maintaining the thermal balance, and the ageing of its components results in a rapid reaction of energy consumption. It is obvious that the greatest increase in energy for cooling was observed in scenario 1.4, i.e., simultaneous leakage of inert gas and degradation of low-emission coating. Figure 9 also shows data on the increase in solar gains and indoor air temperature according to this scenario.
- In the more airtight and insulated apartment building, the increase in energy consumption for cooling due to the degradation of IGU also occurred faster (by 0.25–17.83% over 25 years) than in the less airtight and insulated apartment building (by 0.17–12.06%).
- Therefore, it is obvious that more airtight and insulated buildings are more vulnerable to the degradation of insulated glass units. In addition, it is shown that detached buildings are more vulnerable compared to apartment buildings, where the increase in cooling energy consumption was approximately 1.3 times slower.
5.2. The Impact of Thermal Insulation Degradation on the Energy Performance of Buildings
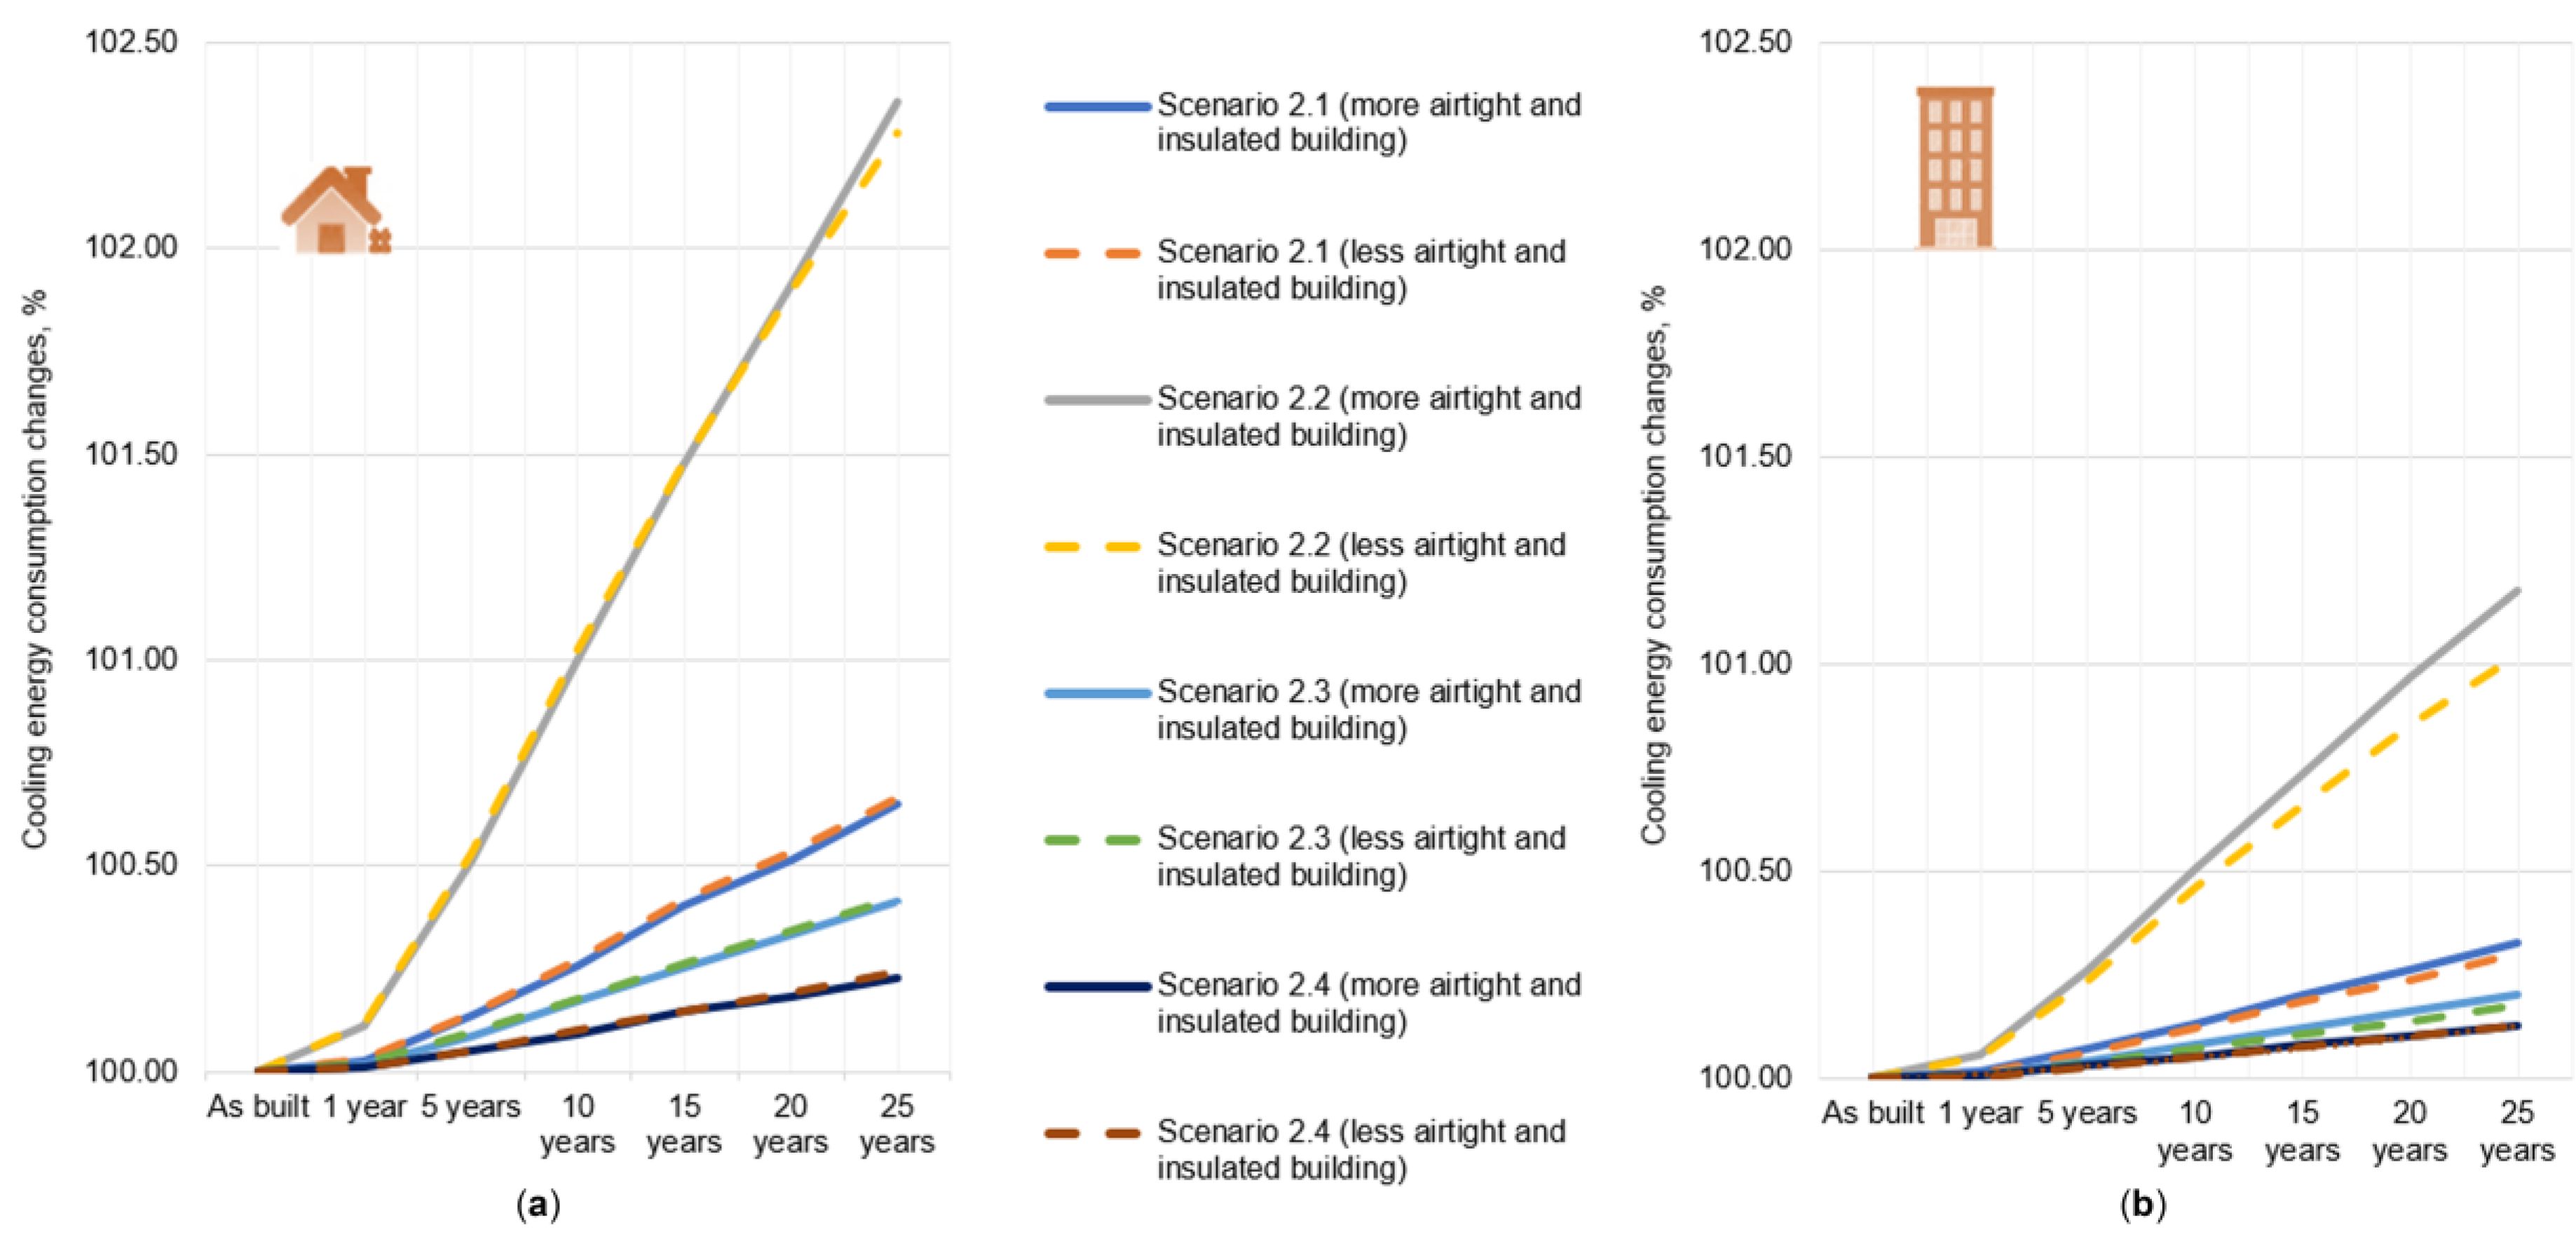
- In the more airtight and insulated detached house, the increase in energy consumption for cooling due to the degradation of thermal insulation occurred slightly faster (it reached up to 2.36% over 25 years) than in the less airtight and insulated detached house (up to 2.28%).
- In the more airtight and insulated apartment building, the increase in energy consumption for cooling due to the degradation of thermal insulation also occurred faster (it reached up to 1.18% over 25 years) than in the less airtight and insulated apartment building (up to 1.02%).
- Therefore, it is obvious that more airtight and insulated buildings are more vulnerable to the degradation of thermal insulation. In addition, detached buildings are more vulnerable compared to apartment buildings, where the increase in cooling energy consumption was approximately 2.0–2.4 times slower.
- It is also worth noting that the resulting percentage increase in energy consumption for cooling due to the degradation of thermal insulation was quite small. Therefore, it can be concluded that, at least in conditions of predominant of energy consumption for cooling, the deterioration of thermal insulation leads to relatively small changes. Other studies [17,21,23] found a relatively small increase in energy consumption in buildings due to the degradation of thermal insulation materials. Most likely, this indicator is an effective energy-efficient solution only in the complete absence of thermal insulation at the initial stage.
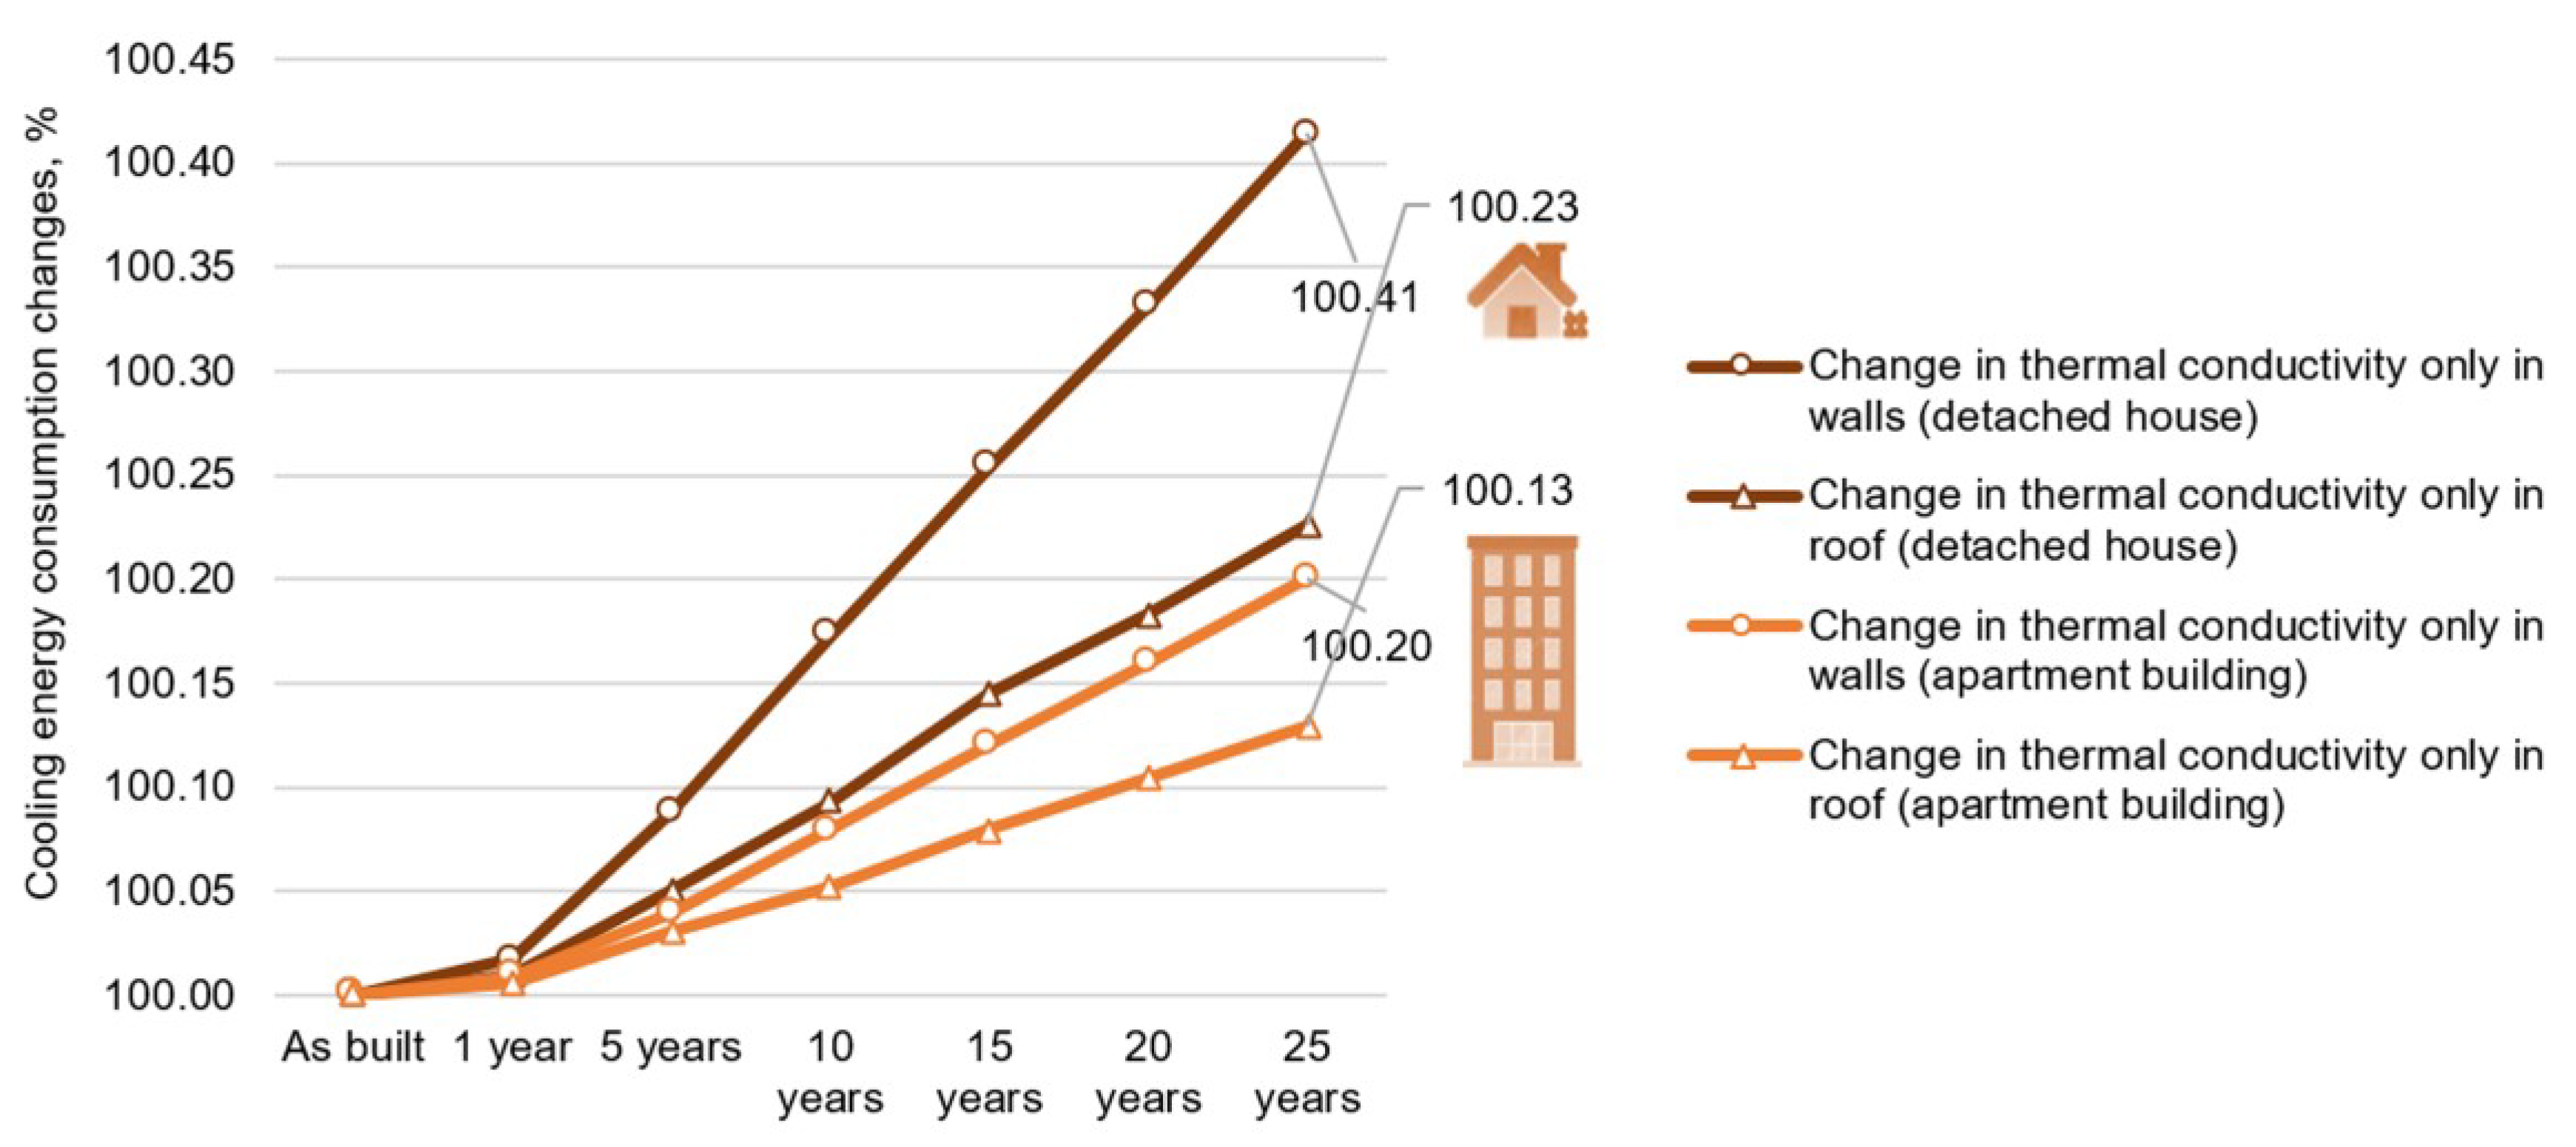
- As a result of the analysis of the separate effects of the deterioration of the thermal insulation of walls and roofs (Figure 11), it was found that an increase in the thermal conductivity of wall insulation has a greater impact on energy consumption compared with an increase in the thermal conductivity of roof insulation. For detached houses, the possible gap is (+0.41%wall)/(+0.23%roof) ≈ 1.78, and for apartment buildings, (+0.20%wall)/(+0.13%roof) ≈ 1.54. It is worth noting that such a predominant influence of wall insulation over roof insulation has also been noted in other research works. The authors of [17], for example, stated that the gap between wall and roof insulation was (+2.26%wall)/(+1.77%roof) ≈ 1.28.
5.3. The Impact of Airtightness Degradation on the Energy Performance of Buildings
- In the more airtight and insulated detached house, with an increase in air permeability, the increase in energy consumption for cooling occurred slower (by 7.0–11.15% over 25 years) than in the less airtight and insulated building (by 9.43–14.75%). The main reason for this might be that in more airtight and insulated buildings, the initial infiltration value is significantly lower than in less airtight and insulated buildings, which also has a smaller impact on energy consumption. In addition, a more airtight and insulated building envelope also played a significant role in curbing the increase in energy consumption.
- In the more airtight and insulated apartment building, with an increase in air permeability, the increase in energy consumption for cooling also occurred slower (by 7.94–12.66% over 25 years) than in the less airtight and insulated apartment building (by 10.35–16.17%).
- Therefore, it is obvious that less airtight and insulated buildings are more vulnerable to degradation of airtightness. In addition, apartment buildings are more vulnerable compared to detached houses, where the increase in cooling energy consumption was approximately 1.1 times slower.
5.4. The Impact of SRI of Buildings Envelope Coatings Degradation on Their Energy Performance
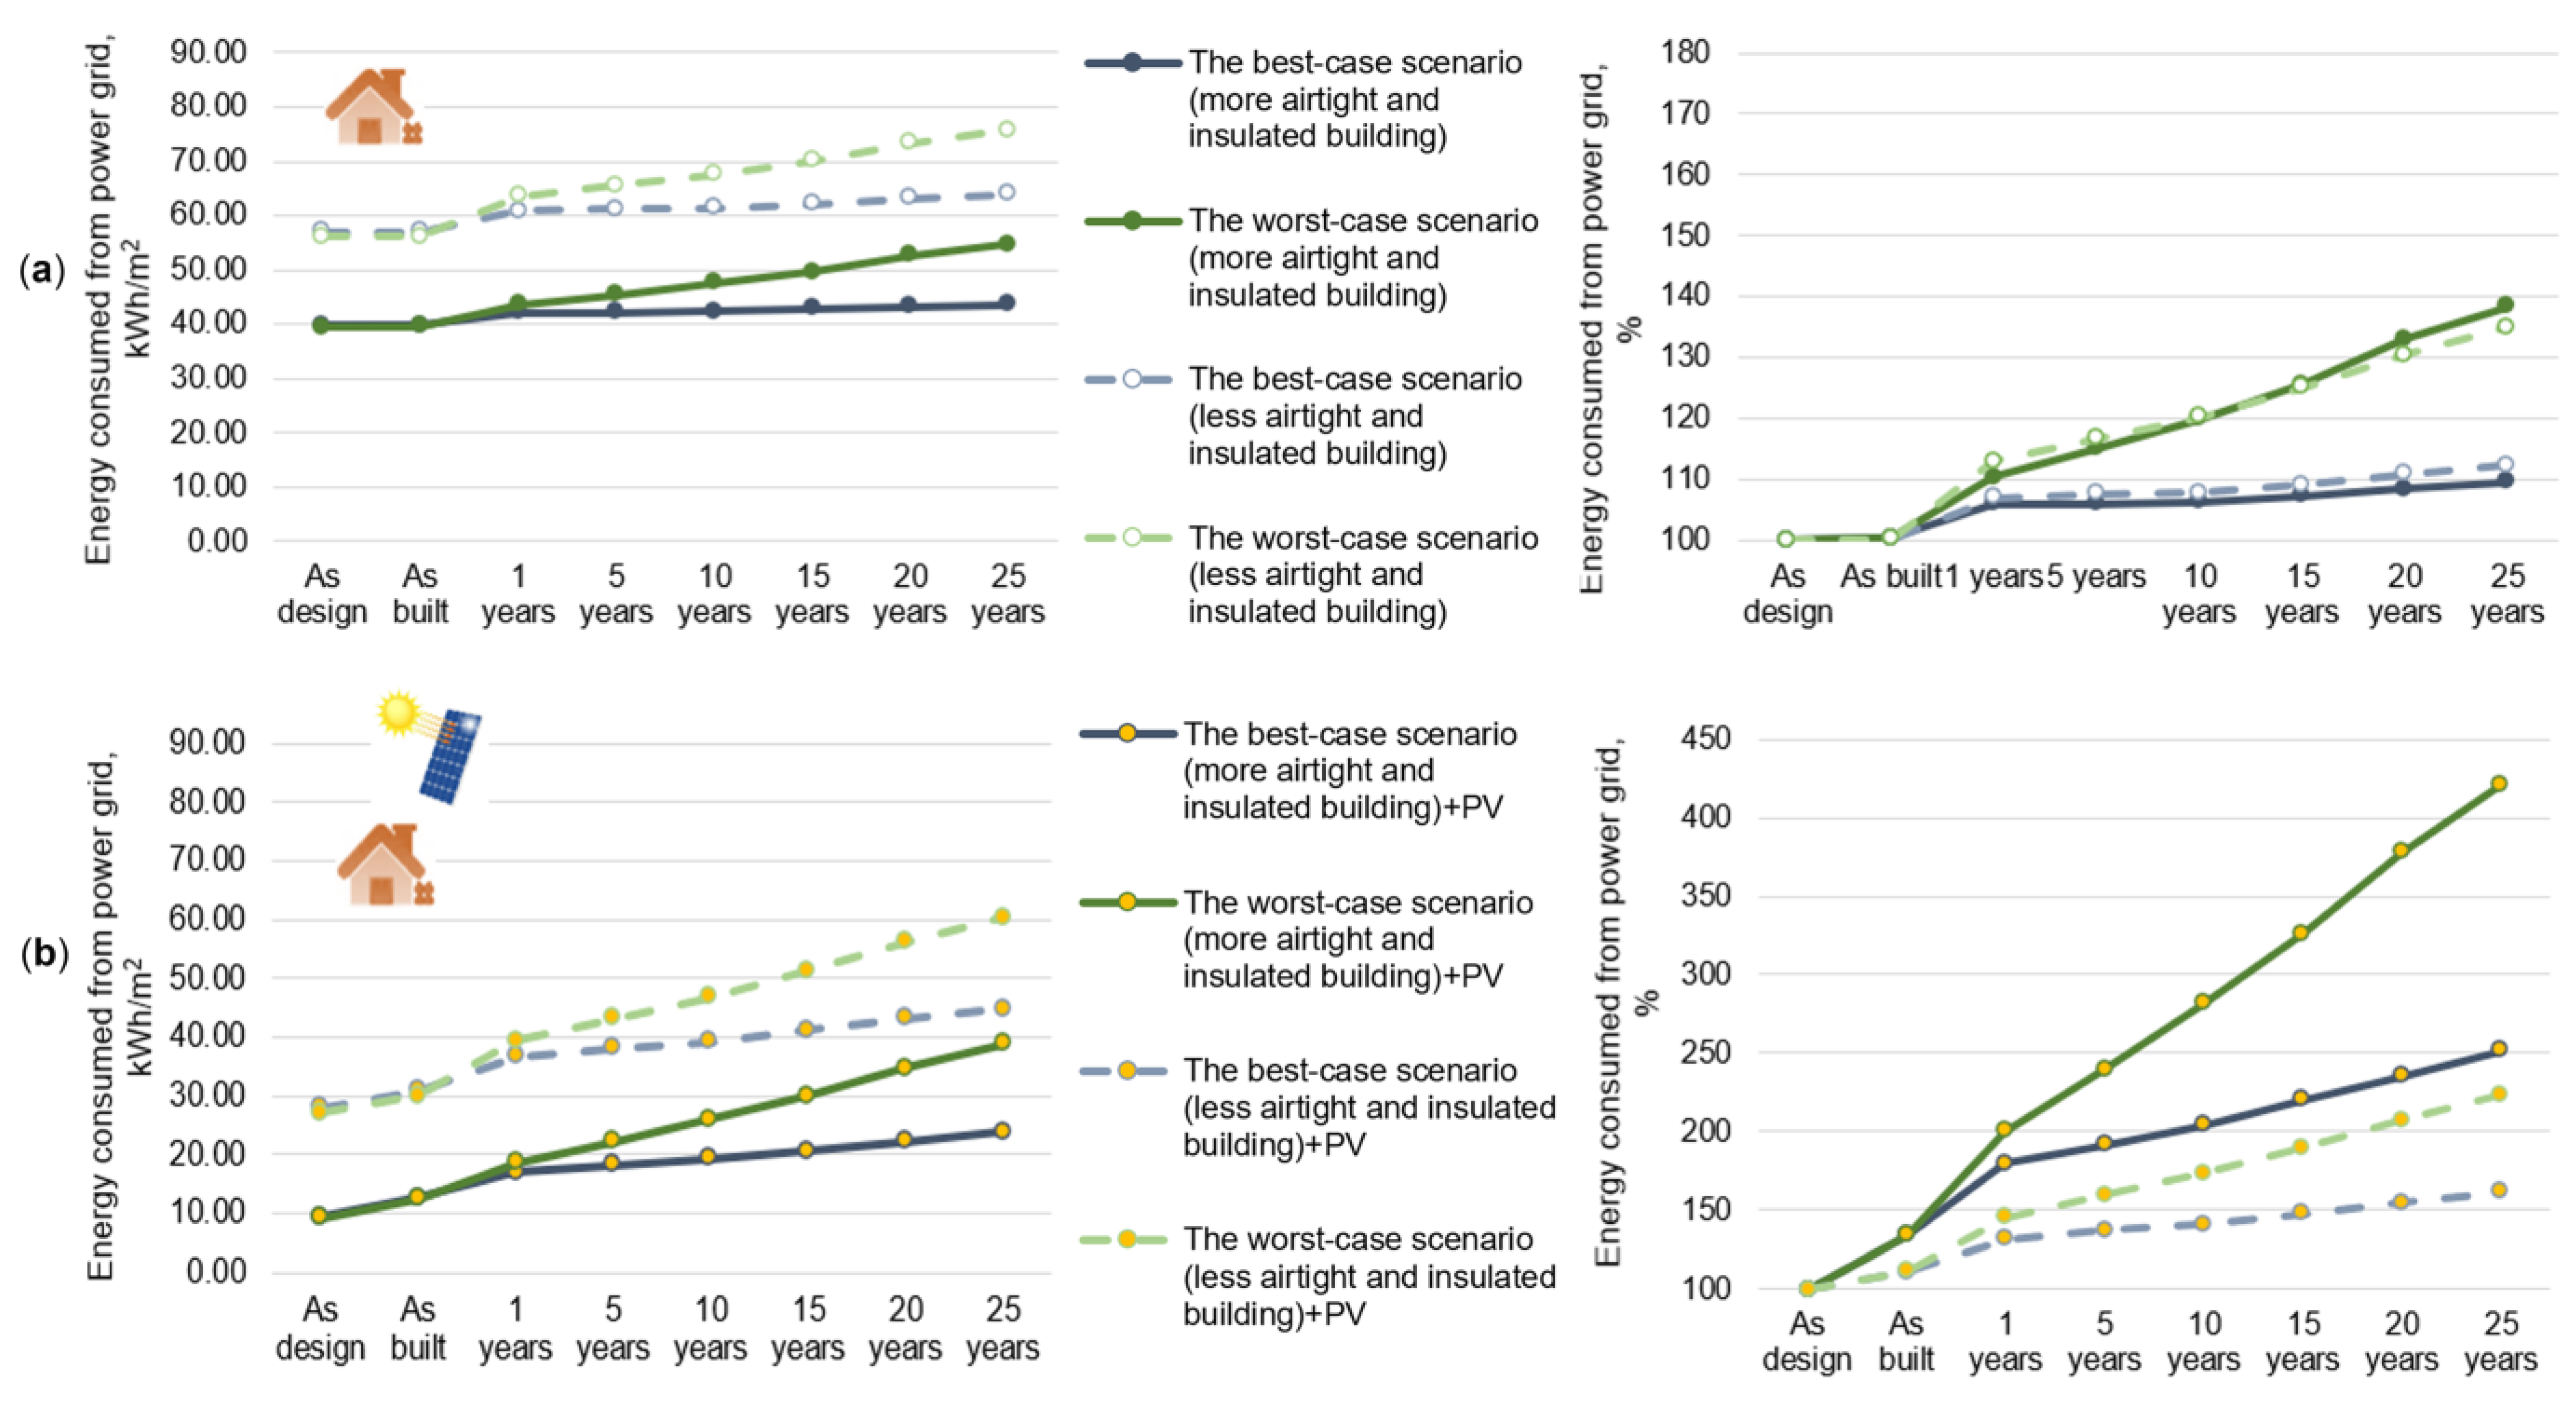
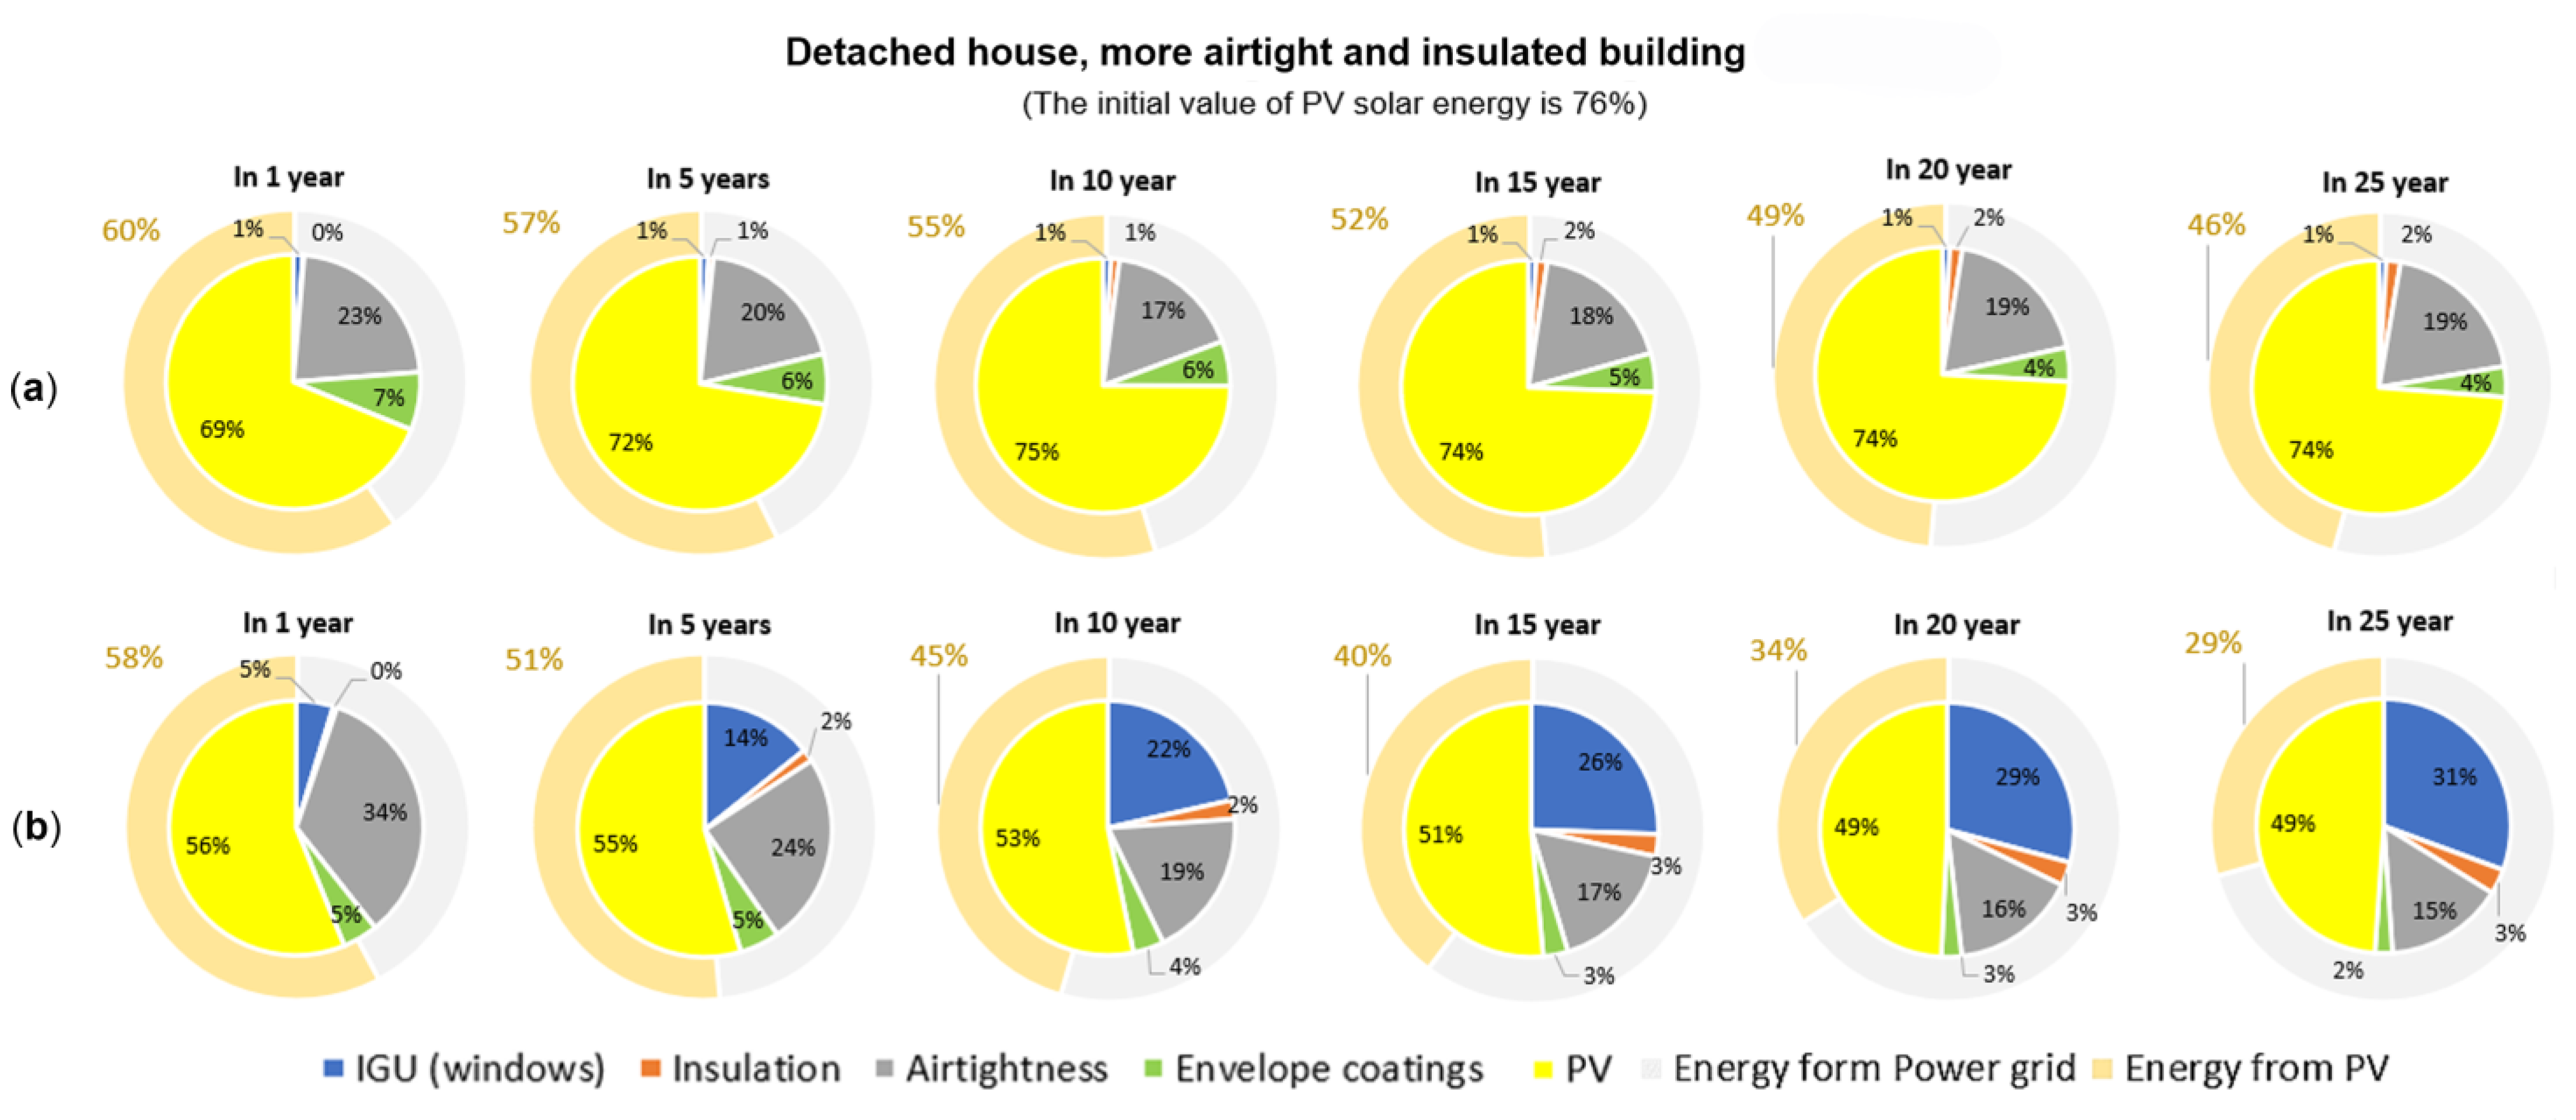
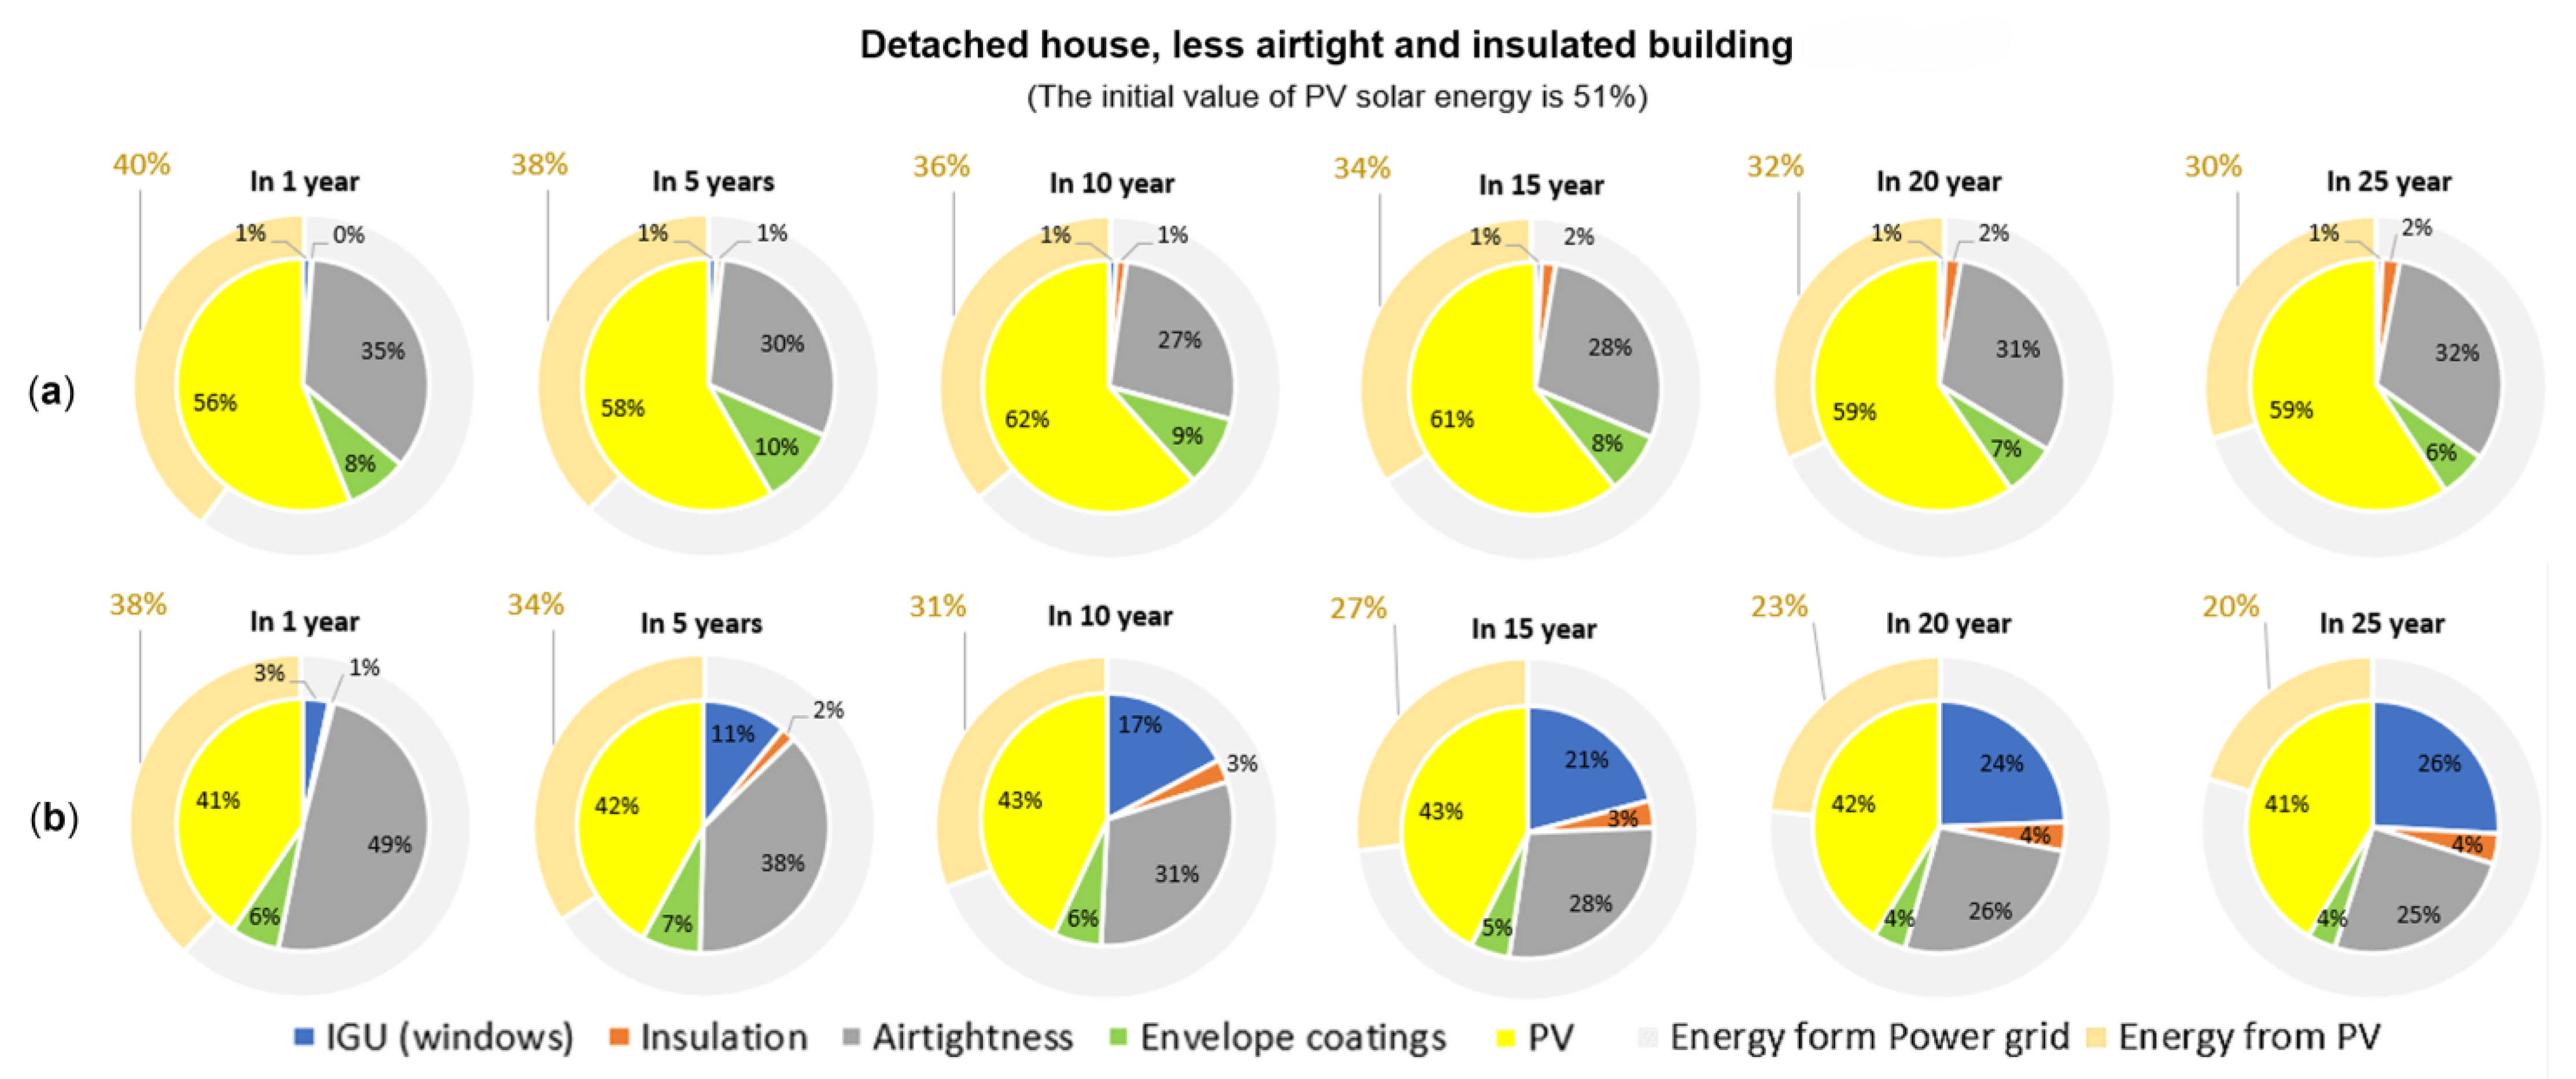
5.5. The Impact of PV Modules Degradation on the Energy Performance of Buildings
5.6. Optimal Combinations of Degrading Building Components
6. A Set of Guidelines
6.1. Recommendations for the Entire Building
- More airtight and insulated buildings are more vulnerable to the degradation of various building components, i.e., in such buildings the increase in energy consumption occurs faster compared with less airtight and insulated buildings. Therefore, the more energy-efficient a building is planned to be, the more high-quality and reliable building materials and building services should be selected.
- The greatest increase in energy consumption due to the degradation of various building components occurs in the first 1–5 years after putting the building into operation. This is due to the specific features of degradation of the components considered. In particular, the characteristics of airtightness, solar reflectance of the building envelope, etc., are subject to the greatest deterioration during the first years of operation. Therefore, it is during this time that specialists need to pay particular attention to fixing various defects. Figure 17 shows the estimated values of the increase in energy consumption over the first years of operation for different types of buildings, which can become a reference point for specialists when evaluating these parameters.
6.2. Recommendations Regarding Insulated Glass Units (IGU) Degradation
- The increase in energy consumption for cooling occurs at a faster rate in more airtight and insulated buildings due to the degradation of insulated glass units. This means that the more airtight and insulated a building is, the more attention must be paid when choosing a window manufacturer in terms of reliability and durability of performance. For a better understanding of the quantitative indicators of this dependence, it is possible to refer to the graphs in Figure 9.
- As for different types of buildings, it is worth noting that the change in energy consumption during the degradation of insulated glass units is slower in apartment buildings than in detached buildings.
- In a hot-humid climate, particular attention should be paid to the quality and protection of low-emission coatings in insulated glass units as their degradation leads to a major increase in energy consumption.
6.3. Recommendations Regarding Thermal Insulation Degradation
6.4. Recommendations Regarding Airtightness Degradation
6.5. Recommendations Regarding Degradation of Solar Reflectance of the Building Envelope
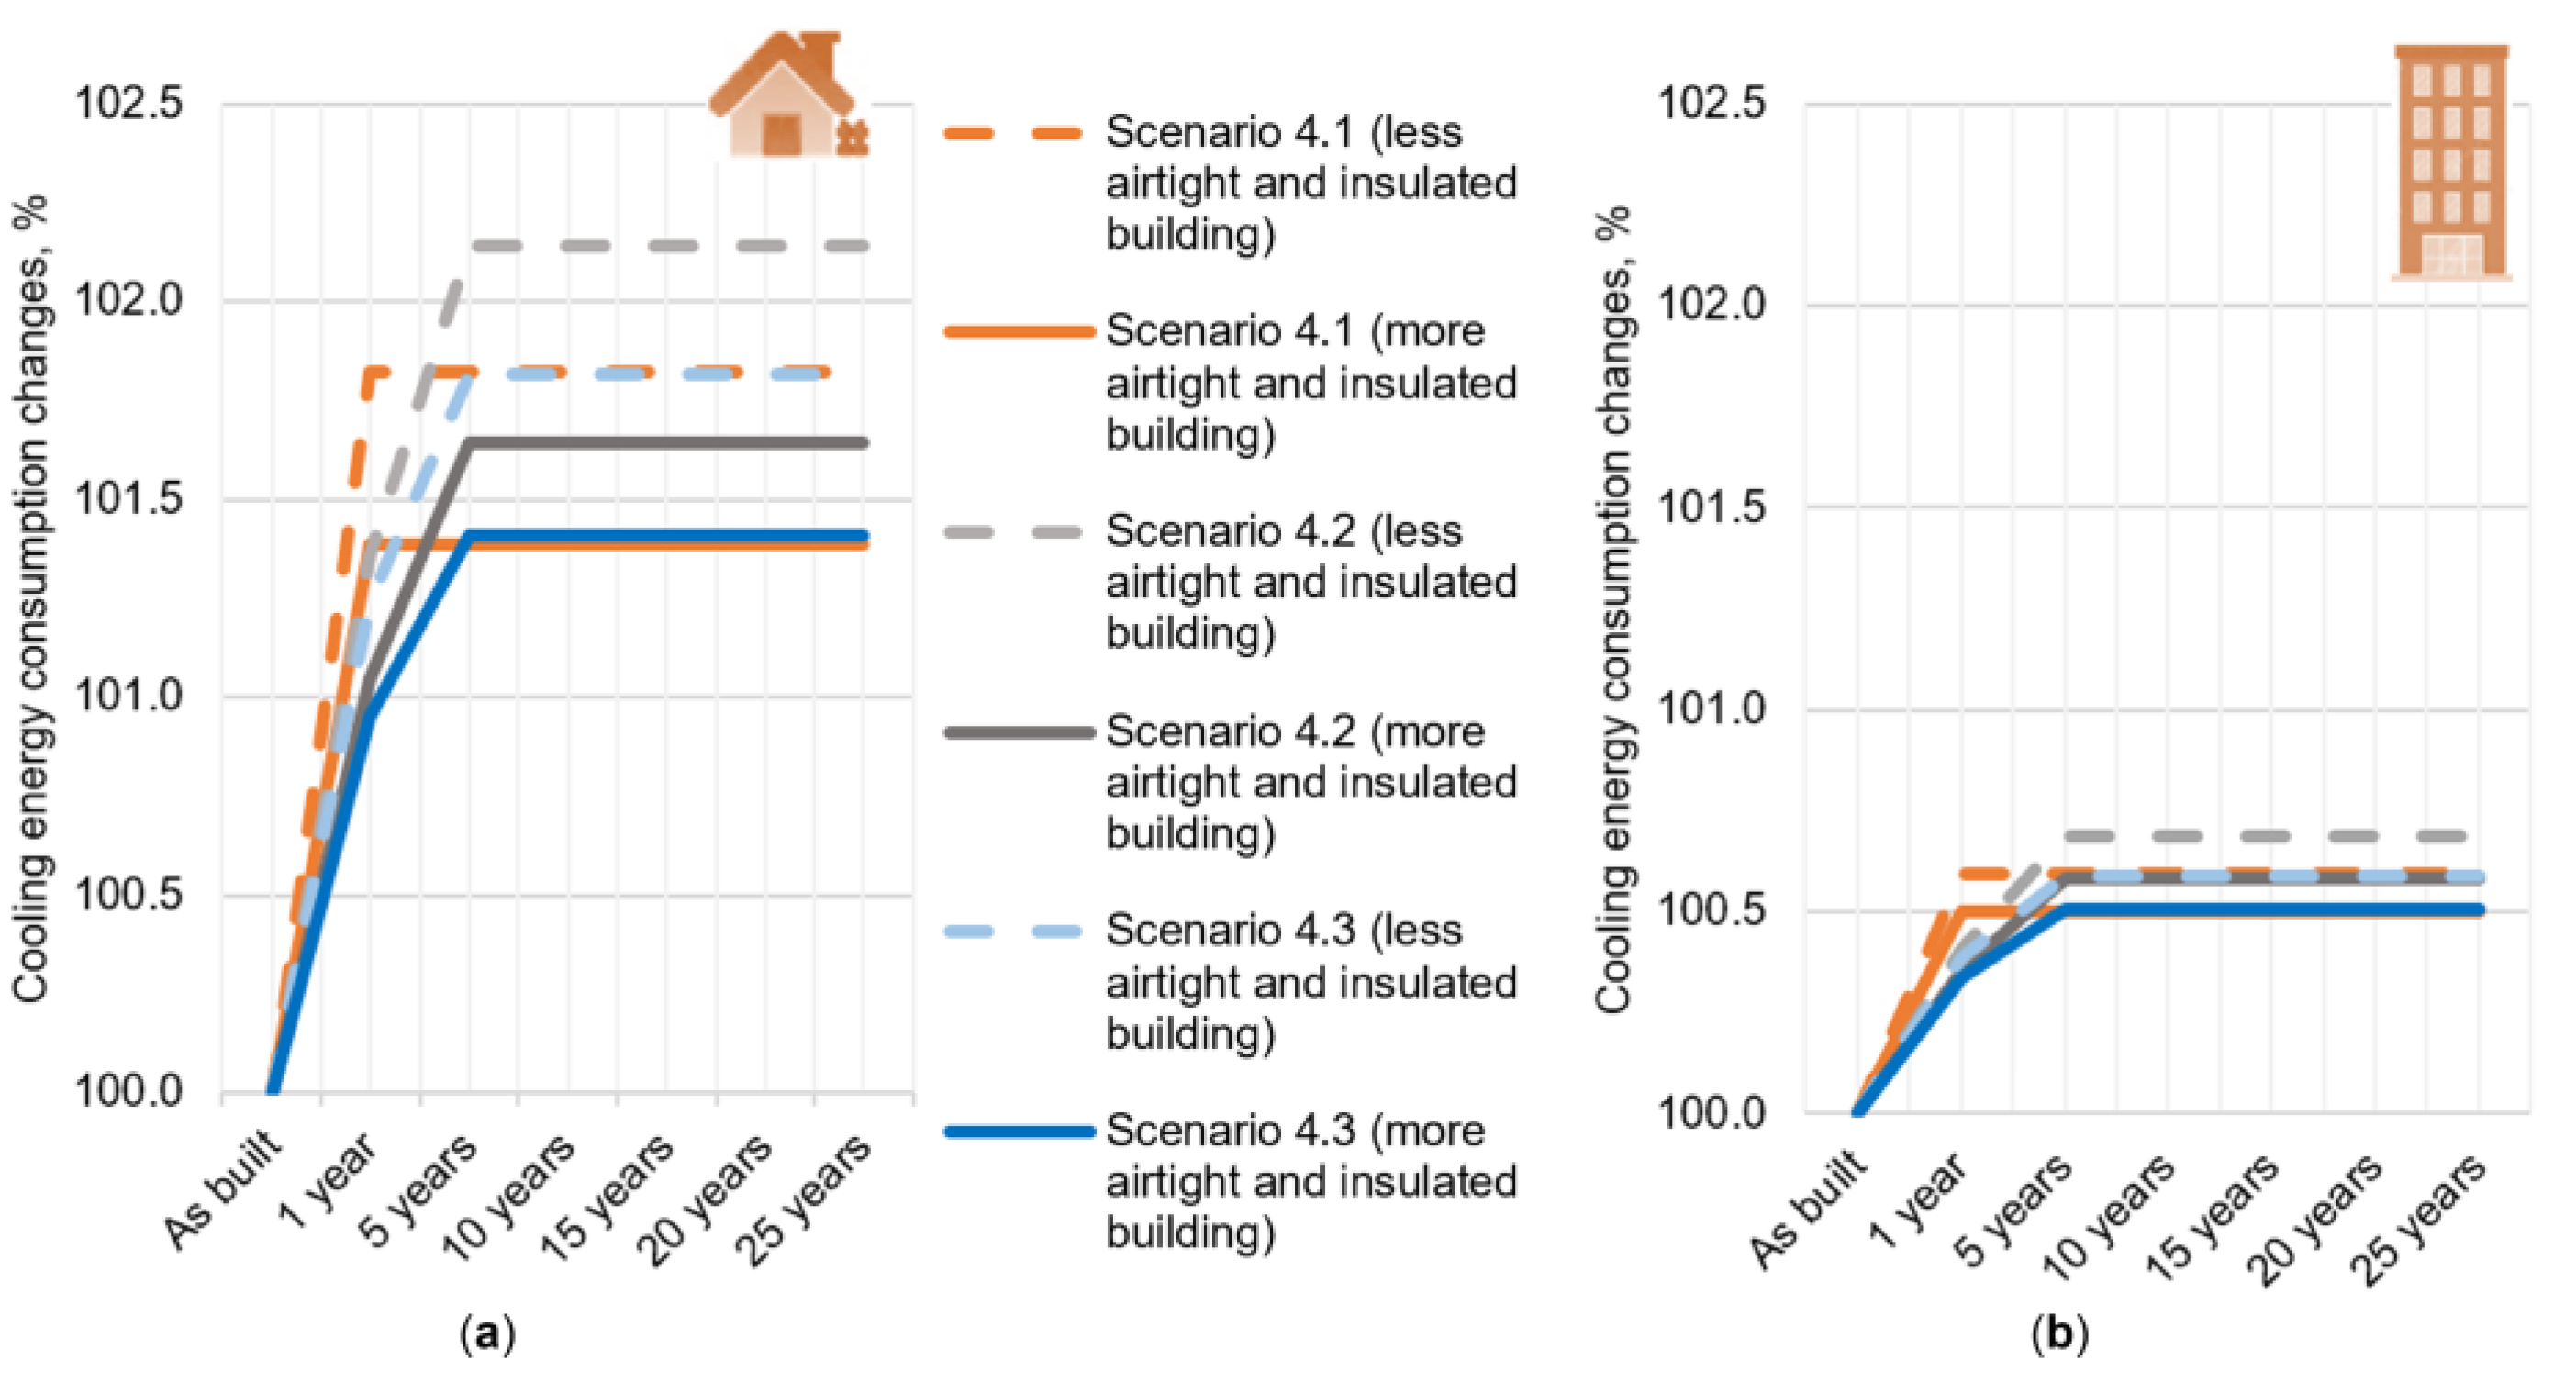
- Less airtight and insulated buildings are more susceptible to an increase in energy consumption for cooling with a decrease in the solar reflectance of the building envelope. Therefore, the best option is to use coatings for enclosing structures of buildings with high solar reflection along with other energy-efficient solutions.
- It is necessary to consider that the energy performance of detached buildings is more vulnerable to deterioration of the solar reflectance of the building envelope coatings compared to apartment buildings. For less airtight and insulated buildings, the difference is about 3.1 times, and for more airtight and insulated buildings, is about 2.8 times.
- The most effective measure in terms of all elements of the building envelope is to ensure that the roof has a high solar reflectance.
6.6. Recommendations Regarding PV Module Degradation
6.7. Application of Graphic Material
7. Output and Impacts
- The degradation of such building components as insulated glass units, thermal insulation, airtightness, coatings of building enclosing structures, and photovoltaic modules can really have a significant impact on the increase in energy consumption over time, which was proved by the example of two types of buildings and two levels of their airtightness and insulation. It is worth noting that the degradation of both low-emission coatings on windows and airtightness had the greatest impact on increasing energy consumption for cooling in a hot-humid climate.
- The results allowed to formulate key patterns that can be effectively used to consider the degradation factor both at the design stage and during the operation of buildings. Among the main ones, the following can be distinguished: the most significant increase in energy consumption due to the degradation of various building components occurred during the first 1–5 years of operation; it was found that more airtight and insulated buildings were more vulnerable to degradation compared to less airtight and insulated ones; the degradation of the thermal insulation of walls had a greater impact on the increase in energy consumption than the degradation of the thermal insulation of roofs; in turn, the degradation of the solar reflectance of roofs turned out to be more meaningful than the degradation of the solar reflectance of walls. An important conclusion was also obtained regarding the degradation of photovoltaic modules, in particular, despite the high efficiency of using solar energy in a hot-humid climate, there was a rapid increase in energy consumption from the power grid with the degradation of PV modules.
- Based on the above conclusions, a set of guidelines was developed that can be used by specialists in various fields (architects, designers, customers, manufacturers, etc.) to take into consideration the degradation factor in their practice during the design or building operation. In addition, this work presents numerous graphic materials that can help specialists more clearly understand the trend of changing the impact of degradation of various components of buildings on changes in their energy performance.
8. Conclusions and Recommendations
- Consider other climatic conditions for a comparative assessment of the results obtained.
- Include more buildings of various types, configurations, and structural systems to get a broader picture of changes in their energy performance over time.
- Continue to collect data on the degradation of various building components and statistically process them to reflect the stochastic nature of degradation processes.
Author Contributions
Funding
Institutional Review Board Statement
Informed Consent Statement
Data Availability Statement
Conflicts of Interest
References
- González-Torres, M.; Pérez-Lombard, L.; Coronel, J.F.; Maestre, I.R.; Yan, D. A review on buildings energy information: Trends, end-uses, fuels and drivers. Energy Rep. 2022, 8, 626–637. [Google Scholar] [CrossRef]
- Jackson, R.B.; Le Quéré, C.; Andrew, R.M.; Canadell, J.G.; Korsbakken, J.I.; Liu, Z.; Zheng, B. Global energy growth is outpacing decarbonization. Environ. Res. Lett. 2018, 13, 120401. [Google Scholar] [CrossRef]
- Ihara, T.; Gustavsen, A.; Jelle, B.P. Fatigue resistance of double sealant composed of polyisobutylene sealant adjacent to silicone sealant. Constr. Build. Mater. 2014, 66, 467–475. [Google Scholar] [CrossRef]
- Danza, L.; Belussi, L.; Guazzi, G.; Meroni, I.; Salamone, F. Durability of technologies in the keeping of ZEB’s performances. Energy Procedia 2018, 148, 138–145. [Google Scholar] [CrossRef]
- Feng, H.; Liyanage, D.R.; Karunathilake, H.; Sadiq, R.; Hewage, K. BIM-based life cycle environmental performance assessment of single-family houses: Renovation and reconstruction strategies for aging building stock in British Columbia. J. Clean. Prod. 2020, 250, 119543. [Google Scholar] [CrossRef]
- Naji, S.; Aye, L.; Noguchi, M. Sensitivity analysis on energy performance, thermal and visual discomfort of a prefabricated house in six climate zones in Australia. Appl. Energy 2021, 298, 117200. [Google Scholar] [CrossRef]
- Mohamed, S.; Smith, R.; Rodrigues, L.; Omer, S.; Calautit, J. The correlation of energy performance and building age in UK schools. J. Build. Eng. 2021, 43, 103141. [Google Scholar] [CrossRef]
- Dadzie, J.; Ding, G.; Runeson, G. Relationship between Sustainable Technology and Building Age: Evidence from Australia. Procedia Eng. 2017, 180, 1131–1138. [Google Scholar] [CrossRef]
- de Wilde, P.; Tian, W.; Augenbroe, G. Longitudinal prediction of the operational energy use of buildings. Build. Environ. 2011, 46, 1670–1680. [Google Scholar] [CrossRef]
- Thomas, A.; Menassa, C.C.; Kamat, V.R. System dynamics framework to study the effect of material performance on a building’s lifecycle energy requirements. J. Comput. Civ. Eng. 2016, 30, 04016034. [Google Scholar] [CrossRef]
- International Energy Agency. World Energy Outlook. 2021. Available online: https://www.iea.org/reports/world-energy-outlook-2021 (accessed on 29 June 2022).
- #BuildingToCOP. Built Environment Highlights from COP26. Available online: https://buildingtocop.org/ (accessed on 20 October 2022).
- Thomas, A.; Menassa, C.C.; Kamat, V.R. A Framework to Understand Effect of Building Systems Deterioration on Life Cycle Energy. Procedia Eng. 2015, 118, 507–514. [Google Scholar] [CrossRef]
- Eleftheriadis, G.; Hamdy, M. Impact of building envelope and mechanical component degradation on the whole building performance: A review paper. Energy Procedia 2017, 132, 321–326. [Google Scholar] [CrossRef]
- Litti, G.; Audenaert, A.; Lavagna, M. Life cycle operating energy saving from windows retrofitting in heritage buildings accounting for technical performance decay. J. Build. Eng. 2018, 17, 135–153. [Google Scholar] [CrossRef]
- Eleftheriadis, G.; Hamdy, M. The Impact of Insulation and HVAC Degradation on Overall Building Energy Performance: A Case Study. Buildings 2018, 8, 23. [Google Scholar] [CrossRef]
- Waddicor, D.A.; Fuentes, E.; Sisó, L.; Salom, J.; Favre, B.; Jiménez, C.; Azar, M. Climate change and building ageing impact on building energy performance and mitigation measures application: A case study in Turin, northern Italy. Build. Environ. 2016, 102, 13–25. [Google Scholar] [CrossRef]
- Li, L.; Wang, Y.; Wang, M.; Hu, W.; Sun, Y. Impacts of multiple factors on energy consumption of aging residential buildings based on a system dynamics model--Taking Northwest China as an example. J. Build. Eng. 2021, 44, 102595. [Google Scholar] [CrossRef]
- Danza, L.; Bellazzi, A.; Devitofrancesco, A.; Guazzi, G. The Influence of Technology Performance Durability in the Cost-Optimal Analysis of a ZEB. In Proceedings of the IOP Conference Series: Earth and Environmental Science, Prague, Czech Republic, 2–4 July 2019; Volume 290, p. 012041. [Google Scholar] [CrossRef]
- Feist, W.; Pfluger, R.; Hasper, W. Durability of building fabric components and ventilation systems in passive houses. Energy Effic. 2020, 13, 1543–1559. [Google Scholar] [CrossRef]
- De Masi, R.F.; Ruggiero, S.; Vanoli, G.P. Multi-layered wall with vacuum insulation panels: Results of 5-years in-field monitoring and numerical analysis of aging effect on building consumptions. Appl. Energy 2020, 278, 115605. [Google Scholar] [CrossRef]
- D’Agostino, D.; Landolfi, R.; Nicolella, M.; Minichiello, F. Experimental Study on the Performance Decay of Thermal Insulation and Related Influence on Heating Energy Consumption in Buildings. Sustainability 2022, 14, 2947. [Google Scholar] [CrossRef]
- Stazi, F.; Tittarelli, F.; Politi, G.; Di Perna, C.; Munafò, P. Assessment of the actual hygrothermal performance of glass mineral wool insulation applied 25 years ago in masonry cavity walls. Energy Build. 2014, 68, 292–304. [Google Scholar] [CrossRef]
- Asphaug, S.K.; Jelle, B.P.; Gullbrekken, L.; Uvsløkk, S. Accelerated ageing and durability of double-glazed sealed insulating window panes and impact on heating demand in buildings. Energy Build. 2016, 116, 395–402. [Google Scholar] [CrossRef]
- Mastrapostoli, E.; Santamouris, M.; Kolokotsa, D.; Vassilis, P.; Venieri, D.; Gompakis, K. On the ageing of cool roofs: Measure of the optical degradation, chemical and biological analysis and assessment of the energy impact. Energy Build. 2016, 114, 191–199. [Google Scholar] [CrossRef]
- Paolini, R.; Zani, A.; Poli, T.; Antretter, F.; Zinzi, M. Natural aging of cool walls: Impact on solar reflectance, sensitivity to thermal shocks and building energy needs. Energy Build. 2017, 153, 287–296. [Google Scholar] [CrossRef]
- Tootkaboni, M.P.; Ballarini, I.; Corrado, V. Analysing the future energy performance of residential buildings in the most populated Italian climatic zone: A study of climate change impacts. Energy Rep. 2021, 7, 8548–8560. [Google Scholar] [CrossRef]
- Pilli-Sihvola, K.; Aatola, P.; Ollikainen, M.; Tuomenvirta, H. Climate change and electricity consumption—Witnessing increasing or decreasing use and costs? Energy Policy 2010, 38, 2409–2419. [Google Scholar] [CrossRef]
- Radhi, H. Evaluating the potential impact of global warming on the UAE residential buildings—A contribution to reduce the CO2 emissions. Build. Environ. 2009, 44, 2451–2462. [Google Scholar] [CrossRef]
- Gaterell, M.R.; McEvoy, M.E. The impact of climate change uncertainties on the performance of energy efficiency measures applied to dwellings. Energy Build. 2005, 37, 982–995. [Google Scholar] [CrossRef]
- Smagulov, Z.; Anapiya, A.; Dikhanbayeva, D.; Rojas-Solorzano, L. Impact of Module Degradation on the Viability of On-Grid Photovoltaic Systems in Mediterranean Climate: The Case of Shymkent Airport. Int. J. Renew. Energy Dev. 2021, 10, 139–147. [Google Scholar] [CrossRef]
- Jordan, D.; Kurtz, S.; VanSant, K.; Newmiller, J. Compendium of photovoltaic degradation rates. Prog. Photovolt. Res. Appl. 2016, 24, 978–989. [Google Scholar] [CrossRef]
- van den Brom, P.; Meijer, A.; Visscher, H. Actual energy saving effects of thermal renovations in dwellings—Longitudinal data analysis including building and occupant characteristics. Energy Build. 2019, 182, 251–263. [Google Scholar] [CrossRef]
- Gupta, R.; Kapsali, M.; Howard, A. Evaluating the influence of building fabric, services and occupant related factors on the actual performance of low energy social housing dwellings in UK. Energy Build. 2018, 174, 548–562. [Google Scholar] [CrossRef]
- Marshall, A.; Fitton, R.; Swan, W.; Farmer, D.; Johnston, D.; Benjaber, M.; Ji, Y. Domestic building fabric performance: Closing the gap between the in situ measured and modelled performance. Energy Build. 2017, 150, 307–317. [Google Scholar] [CrossRef]
- Gupta, R.; Kotopouleas, A. Magnitude and extent of building fabric thermal performance gap in UK low energy housing. Appl. Energy 2018, 222, 673–686. [Google Scholar] [CrossRef]
- Samaitis, V.; Mažeika, L.; Jankauskas, A.; Rekuvienė, R.; Laurs, V.; Bliūdžius, R.; Kumžienė, J.; Banionis, K. Hybrid ultrasonic technique for non-invasive evaluation of argon gas content in insulated glass units. Energy Build. 2022, 266, 112123. [Google Scholar] [CrossRef]
- Kralj, A.; Drev, M.; Žnidaršič, M.; Černe, B.; Hafner, J.; Jelle, B.P. Investigations of 6-pane glazing: Properties and possibilities. Energy Build. 2019, 190, 61–68. [Google Scholar] [CrossRef]
- Feldmeier, F.; Schmid, J. Gasdichtheit von Mehrscheiben-Isolierglas. Bauphysik 1992, 14, 12–17. [Google Scholar]
- Knudsen, R.; Jensen, C.T. Long-Term Tightness of Gas-Filled Insulating Glass Units; J. no. 75661/98-004; DTI: Århus, Denmark, 2000. [Google Scholar]
- Maghull Double Glazing. How Long Does Double Glazing Last? Available online: https://maghulldoubleglazing.com/how-long-does-double-glazing-last/ (accessed on 6 June 2022).
- Ghazi Wakili, K.; Raedle, W.; Krammer, A.; Uehlinger, A.; Schüler, A.; Stöckli, T. Ug-value and edge heat loss of triple glazed insulating glass units: A comparison between measured and declared values. J. Build. Eng. 2021, 44, 103031. [Google Scholar] [CrossRef]
- Nagy, B.; Simon, T.K.; Nemes, R. Effect of built-in mineral wool insulations durability on its thermal and mechanical performance. J. Therm. Anal. Calorim. 2020, 139, 169–181. [Google Scholar] [CrossRef]
- Choi, H.-J.; Kang, J.-S.; Huh, J.-H. A Study on Variation of Thermal Characteristics of Insulation Materials for Buildings According to Actual Long-Term Annual Aging Variation. Int. J. Thermophys. 2018, 39, 2. [Google Scholar] [CrossRef]
- Choi, H.-J.; Ahn, H.; Choi, G.-S.; Kang, J.-S.; Huh, J.-H. Analysis of Long-Term Change in the Thermal Resistance of Extruded Insulation Materials through Accelerated Tests. Appl. Sci. 2021, 11, 9354. [Google Scholar] [CrossRef]
- Kehrer, M.; Christian, J. Measurement of Exterior Foundation Insulation to Assess Durability in Energy-Saving Performance; ORNL Report: Oak Ridge, TN, USA, 2012. [Google Scholar]
- Zirkelbach, D.; Schafaczek, B.; Künzel, H. Thermal performance degradation of foam insulation in inverted roofs due to moisture accumulation. In Proceedings of the 12th International Conference on Durability of Building Materials and Components–XII DBMC, Porto, Portugal, 12–15 April 2011; pp. 529–536. [Google Scholar]
- Albrecht, W. Change over Time in the Thermal Conductivity of Ten-Year-Old PUR Rigid Foam Boards with Diffusion-Open Facings. Cell. Polym. 2004, 23, 161–172. [Google Scholar] [CrossRef]
- FIW-München. Thermal Conductivity (A2). In Desk Research on Durability of Insulation Products; Final report; FIW-München: Gräfelfing, Germany, 2010; pp. 31–88. [Google Scholar]
- Persson, C. Predicting the Long-Term Insulation Performance of District Heating Pipes. Ph.D. Thesis, Chalmers University of Technology, Göteborg, Sweden, 2015. [Google Scholar]
- Mukhopadhyaya, P.; Bomberg, M.; Kumaran, M.K.; Drouin, M.; Lackey, J.; van Reenen, D.; Normandin, N. Long-Term Thermal Resistance of Polyisocyanurate Foam Insulation with Impermeable Facers. ASTM Spec. Tech. Publ. 2002, 1426, 351–365. [Google Scholar]
- Singh, S.N.; Coleman, P.D. Accelerated Aging Test Methods for Predicting the Long Term Thermal Resistance of Closed-Cell Foam Insulation; Huntsman Advanced Technology Center: The Woodlands, TX, USA, 2007. [Google Scholar]
- Stazi, F.; Di Perna, C.; Munafò, P. Durability of 20-year-old external insulation and assessment of various types of retrofitting to meet new energy regulations. Energy Build. 2009, 41, 721–731. [Google Scholar] [CrossRef]
- Zheng, H.; Long, E.; Cheng, Z.; Yang, Z.; Jia, Y. Experimental exploration on airtightness performance of residential buildings in the hot summer and cold winter zone in China. Build. Environ. 2022, 214, 108848. [Google Scholar] [CrossRef]
- Bomberg, M.; Kisilewicz, T.; Nowak, K. Is there an optimum range of airtightness for a building? J. Build. Phys. 2016, 39, 395–421. [Google Scholar] [CrossRef]
- Moujalled, B.; Leprince, V.; Berthault, S.; Litvak, A.; Hurel, N. Mid-term and long-term changes in building airtightness: A field study on low-energy houses. Energy Build. 2021, 250, 111257. [Google Scholar] [CrossRef]
- Sherman, M.; Chan, W.; Walker, I. Durable Airtightness in Single-Family Dwellings: Field Measurements and Analysis. Int. J. Vent. 2015, 14, 27–38. [Google Scholar] [CrossRef]
- Hansen, M.; Ylmén, P. Changes in airtightness for six single family houses after 10–20 years. In Proceedings of the TightVent-AIVC International Workshop “Achieving Relevant and Durable Airtightness Levels: Status, Options and Progress Needed”, Brussels, Belgium, 28–29 March 2012; pp. 67–75. [Google Scholar]
- Erhorn-Kluttig, H.; Erhorn, H.; Lahmidi, H.; Anderson, R. Airtightness requirements for high performance building envelopes. ASIEPI Inf. Pap. P 2009, 157, 2009. [Google Scholar]
- Verbeke, S.; Audenaert, A. A prospective Study on the Evolution of Airtightness in 41 low energy Dwellings. E3S Web Conf. EDP Sci. 2020, 172, 05005. [Google Scholar] [CrossRef]
- Bracke, W.; Laverge, J.; Van Den Bossche, N.; Janssens, A. Durability and Measurement Uncertainty of Airtightness in Extremely Airtight Dwellings. Int. J. Vent. 2016, 14, 383–394. [Google Scholar] [CrossRef]
- Leprince, V.; Moujalled, B.; Litvak, A. Durability of building airtightness, review and analysis of existing studies. In Proceedings of the 38th AIVC Conference Ventilating Healthy Low-Energy Buildings, Nottingham, UK, 13–14 September 2017; pp. 13–14. [Google Scholar]
- Vinha, J.; Manelius, E.; Korpi, M.; Salminen, K.; Kurnitski, J.; Kiviste, M.; Laukkarinen, A. Airtightness of residential buildings in Finland. Build. Environ. 2015, 93, 128–140. [Google Scholar] [CrossRef]
- Hallik, J.; Kalamees, T. Development of Airtightness of Estonian Wooden Buildings. J. Sustain. Archit. Civ. Eng. 2019, 24, 36–43. [Google Scholar] [CrossRef]
- Böhm, M.; Beránková, J.; Brich, J.; Polášek, M.; Srba, J.; Němcová, D.; Černý, R. Factors influencing envelope airtightness of lightweight timber-frame houses built in the Czech Republic in the period of 2006–2019. Build. Environ. 2021, 194, 107687. [Google Scholar] [CrossRef]
- Wahlgren, P. Seasonal variation in airtightness. In Proceedings of the 35th AIVC Conference “Ventilation and Airtightness in Transforming the Building Stock to High Performance”, Poznań, Poland, 24–25 September 2014. [Google Scholar]
- Carrié, F.; Leprince, V. Model error due to steady wind in building pressurization tests. In Proceedings of the 35th AIVC Conference “Ventilation and Airtightness in Transforming the Building Stock to HIGH Performance”, Poznań, Poland, 24–25 September 2014; pp. 770–774. [Google Scholar]
- Feijó-Muñoz, J.; Pardal, C.; Echarri, V.; Fernández-Agüera, J.; Assiego de Larriva, R.; Montesdeoca Calderín, M.; Poza-Casado, I.; Padilla-Marcos, M.Á.; Meiss, A. Energy impact of the air infiltration in residential buildings in the Mediterranean area of Spain and the Canary islands. Energy Build. 2019, 188, 226–238. [Google Scholar] [CrossRef]
- Pal, R.K.; Goyal, P.; Sehgal, S. Thermal performance of buildings with light colored exterior materials. Mater. Today Proc. 2020, 28, 1307–1313. [Google Scholar] [CrossRef]
- Dias, D.; Machado, J.; Leal, V.; Mendes, A. Impact of using cool paints on energy demand and thermal comfort of a residential building. Appl. Therm. Eng. 2014, 65, 273–281. [Google Scholar] [CrossRef]
- Boixo, S.; Diaz-Vicente, M.; Colmenar, A.; Castro, M.A. Potential energy savings from cool roofs in Spain and Andalusia. Energy 2012, 38, 425–438. [Google Scholar] [CrossRef]
- De Masi, R.F.; Ruggiero, S.; Vanoli, G.P. Acrylic white paint of industrial sector for cool roofing application: Experimental investigation of summer behavior and aging problem under Mediterranean climate. Sol. Energy 2018, 169, 468–487. [Google Scholar] [CrossRef]
- Paolini, R.; Terraneo, G.; Ferrari, C.; Sleiman, M.; Muscio, A.; Metrangolo, P.; Poli, T.; Destaillats, H.; Zinzi, M.; Levinson, R. Effects of soiling and weathering on the albedo of building envelope materials: Lessons learned from natural exposure in two European cities and tuning of a laboratory simulation practice. Sol. Energy Mater. Sol. Cells 2020, 205, 110264. [Google Scholar] [CrossRef]
- Maestri, A.; Marinoski, D.L.; Lamberts, R.; Guths, S. Measurement of solar reflectance of roofs: Effect of paint aging and a discussion on ASTM E1918 standard. Energy Build. 2021, 245, 111057. [Google Scholar] [CrossRef]
- Alchapar, N.L.; Correa, E.N. Optothermal properties of façade coatings. Effects of environmental exposure over solar reflective index. J. Build. Eng. 2020, 32, 101536. [Google Scholar] [CrossRef]
- Yao, J.; Yan, C. Effects of solar absorption coefficient of external wall on building energy consumption. World Acad. Sci. Eng. Technol. 2011, 76, 758–760. [Google Scholar]
- USGBC. LEED v4: Building Design and Construction; U.S. Green Building Council: Washington, DC, USA, 2019. [Google Scholar]
- Energy Star. Program Requirements for Roof Products. Available online: https://www.energystar.gov/sites/default/files/specs/Roof%20Products%20V3%20Program%20Requirements_0.pdf (accessed on 25 June 2022).
- Omazic, A.; Oreski, G.; Halwachs, M.; Eder, G.C.; Hirschl, C.; Neumaier, L.; Pinter, G.; Erceg, M. Relation between degradation of polymeric components in crystalline silicon PV module and climatic conditions: A literature review. Sol. Energy Mater. Sol. Cells 2019, 192, 123–133. [Google Scholar] [CrossRef]
- Osterwald, C.R.; Adelstein, J.; del Cueto, J.A.; Kroposki, B.; Trudell, D.; Moriarty, T. Comparison of Degradation Rates of Individual Modules Held at Maximum Power. In Proceedings of the 2006 IEEE 4th World Conference on Photovoltaic Energy Conference, Waikoloa, HI, USA, 7–12 May 2006; pp. 2085–2088. [Google Scholar] [CrossRef]
- Vazquez, M.; Rey-Stolle, I. Photovoltaic module reliability based on field degradation studies. Prog. Photovolt. Res. Appl. 2008, 16, 419–433. [Google Scholar] [CrossRef]
- Smith, R.M.; Jordan, D.C.; Kurtz, S.R. Outdoor PV Module Degradation of Current-Voltage Parameters; National Renewable Energy Lab.: Golden, CO, USA, 2012. [Google Scholar]
- Kellas, A. Utilizing the solar energy for power generation in Cyprus. In Proceedings of the 8th Mediterranean Conference on Power Generation, Transmission, Distribution and Energy Conversion (MEDPOWER 2012), Cagliari, Italy, 1–3 October 2012; pp. 1–7. [Google Scholar] [CrossRef]
- Strevel, N.; Trippel, L.; Gloeckler, M. Performance characterization and superior energy yield of First Solar PV power plants in high-temperature conditions. Photovolt. Int. 2012, 17, 7. [Google Scholar]
- Jordan, D.; Kurtz, S. Photovoltaic Degradation Rates—An Analytical Review. Prog. Photovolt. Res. Appl. 2013, 21, 12–29. [Google Scholar] [CrossRef]
- Malvoni, M.; Leggieri, A.; Maggiotto, G.; Congedo, P.M.; De Giorgi, M.G. Long term performance, losses and efficiency analysis of a 960kWP photovoltaic system in the Mediterranean climate. Energy Convers. Manag. 2017, 145, 169–181. [Google Scholar] [CrossRef]
- Dubey, R.; Chattopadhyay, S.; Kuthanazhi, V.; John, J.J.; Vasi, J.; Kottantharayil, A.; Arora, B.M.; Narsimhan, K.L.; Kuber, V.; Solanki, C.S.; et al. Performance degradation in field-aged crystalline silicon PV modules in different Indian climatic conditions. In Proceedings of the 2014 IEEE 40th Photovoltaic Specialist Conference (PVSC), IEEE, Denver, CO, USA, 8–13 June 2014; pp. 3182–3187. [Google Scholar] [CrossRef]
- Beck, H.E.; Zimmermann, N.E.; McVicar, T.R.; Vergopolan, N.; Berg, A.; Wood, E.F. Present and future Köppen-Geiger climate classification maps at 1-km resolution. Sci. Data 2018, 5, 180214. [Google Scholar] [CrossRef]
- Climate Change Knowledge Portal. The Climate of UAE. Available online: https://climateknowledgeportal.worldbank.org/country/united-arab-emirates/climate-data-historical (accessed on 8 June 2022).
- Taleb, H.M. Using passive cooling strategies to improve thermal performance and reduce energy consumption of residential buildings in U.A.E. buildings. Front. Archit. Res. 2014, 3, 154–165. [Google Scholar] [CrossRef]
- Dubai Statistics Centre. System Energy Requirement and Consumed by Type of Consumption—Emirate of Dubai (2019–2021). Available online: https://www.dsc.gov.ae/en-us/Themes/Pages/Manufacturing-Energy-Water.aspx?Theme=29 (accessed on 28 October 2022).
- Dubai Statistics Centre. Housing Units (Urban and Rural)* by Type—Emirate of Dubai. 2021. Available online: https://www.dsc.gov.ae/en-us/Themes/Pages/Housing-and-Building.aspx?Theme=40 (accessed on 28 June 2022).
- Abdel, H. Taupe Residence/Loci Architecture + Design. Available online: https://www.archdaily.com/948027/taupe-residence-loci-architecture-plus-design?ad_medium=gallery (accessed on 21 August 2022).
- Friess, W.A.; Rakhshan, K.; Hendawi, T.A.; Tajerzadeh, S. Wall insulation measures for residential villas in Dubai: A case study in energy efficiency. Energy Build. 2012, 44, 26–32. [Google Scholar] [CrossRef]
- Rossetti, M.D. Simulation Modeling and Arena, 2nd ed.; John Wiley & Sons, Inc.: Hoboken, NJ, USA, 2016; pp. 8–15. [Google Scholar]
- DesignBuilder. Designbuilder Software Features, Simulation Made Easy. 2022. Available online: https://designbuilder.co.uk/. (accessed on 3 January 2023).
- EnergyPlus. EnergyPlus Software Features. 2022. Available online: https://energyplus.net/ (accessed on 3 January 2023).


| Case Study 1 | Case Study 2 | ||||||||
|---|---|---|---|---|---|---|---|---|---|
| Location | Dubai (UAE) | Dubai (UAE) | |||||||
| Type | Detached house | Apartment building | |||||||
| Latitude Longitude | LAT 25°16′11″ N LONG 55°18′34″ E | LAT 25°16′11″ N LONG 55°18′34″ E | |||||||
| Shape | Rectangle | Square | |||||||
| Building length, m | 17.6 | 35.6 | |||||||
| Building width, m | 12.35 | 30.0 | |||||||
| Number of stories | 2 | 6 | |||||||
| Occupied floor area, m2 | 253.1 | 3648.8 | |||||||
| Occupied volume, m3 | 881.4 | 13826.0 | |||||||
| Unoccupied floor area, m2 | - | 472.9 | |||||||
| Unoccupied volume, m3 | - | 1705.8 | |||||||
| U-value, W/m2K | Walls Roof Ground floor Windows External door | More airtight and insulated | 0.183 0.236 0.126 1.68 1.108 | Less airtight and insulated | 0.372 0.467 0.25 1.68 2.208 | More airtight and insulated | 0.183 0.236 0.126 1.68 1.108 | Less airtight and insulated | 0.372 0.467 0.25 1.68 2.208 |
| Airtightness, h−1 | 0.86 | 1.71 | 0.86 | 1.71 | |||||
| Gross Window-Wall Ratio (WWR), % | 29.23 | 29.78 | |||||||
| Power density, W/m2 | Bathroom—1.67, bedroom—3.58, domestic circulation—2.16, Dress room—3.58, kitchen—30.28, living/dining room—3.9, WC—1.67 | Bathroom—1.67, bedroom—3.58, domestic circulation—2.16, Dress room—3.58, kitchen-dining-living—30.28, WC—1.67 | |||||||
| Occupancy schedule | by default | by default | |||||||
| Cooling Setpoint Temperatures | |||||||||
| Domestic circulation, Bathroom/WC Bedroom, Dress room, Study room, Kitchen | Cooling—25 °C Cooling setback—28 °C | Cooling—25 °C Cooling setback—28 °C | |||||||
| Common circulation areas Technical room/Storage | Cooling—25 °C Cooling setback—28 °C | Cooling—25 °C Cooling setback—28 °C | |||||||
| Living/Dining | Cooling—21 °C Cooling setback—25 °C | Cooling—21 °C Cooling setback—25 °C | |||||||
| Lighting | LED with linear control | LED with linear control | |||||||
| Cooling | mini-split cooling system (CoP = 4.5) | cooling system (CoP = 4.5) | |||||||
| Operation season of heating/cooling systems | March-November—all-time cooling | March-November—all-time cooling | |||||||
| Hot water | Instantaneous hot water system—CoP = 0.85 | Instantaneous hot water system—CoP = 0.85 | |||||||
| Ventilation | Natural Ventilation (Ventilation rate—0.35 ac/h) | Natural Ventilation (Ventilation rate—0.35 ac/h) | |||||||
| PV modules (ASE 300-DFG/50) | 250W—15 units S = 36.44 m2 | - | |||||||
| Building Component | Type of Degradation | № of Scenario | Description |
|---|---|---|---|
| Insulated Glass Units (IGU) | reduction of filling with inert gas | 1.1 | from 90% to 65% (↓ 1%/year) |
| 1.2 | from 90% to 85% (↓ 0.2%/year) | ||
| 1.3 | from 90% to 0% | ||
| reduction of filling with inert gas+Low-E coating degradation | 1.4 | from 90% to 65% (↓ 1%/year), ↑ SHGC | |
| Thermal insulation | an increase in thermal conductivity | 2.1 | by 12.5% (walls and roof) (↑ λ 0.5%/year) |
| 2.2 | by 50% (walls and roof) (↑ λ 2.0%/year) | ||
| 2.3 | by 12.5% (only walls) (↑ λ 0.5%/year) | ||
| 2.4 | by 12.5% (only roof) (↑ λ 0.5%/year) | ||
| Airtightness | an increase in air permeability | 3.1 | by 27.5% (↑ up to 20% in a year, 0.5%/year after 10 years) |
| 3.2 | by 17.5% (↑ up to 10% in a year, 0.5%/year after 10 years) | ||
| a decrease in air permeability | 3.3 | by 17.5% (↓ up to 10% in a year, 0.5%/year after 10 years) | |
| Solar reflectance of the building envelope | reduction of the solar reflectance | 4.1 | by 20% in a year (from 0.732 to 0.586—roof) by 10% in a year (from 0.732 to 0.659—walls) |
| 4.2 | from 0.82 to 0.64 in 3 years—roof (acc. LEED) by 10% in a year (from 0.732 to 0.659—walls) | ||
| 4.3 | from 0.65 to 0.5 in 3 years—roof (acc.Energy Star) by 10% in a year (from 0.732 to 0.659—walls) | ||
| PV modules (only for case study 1) | performance reduction | 5.1 | by 34.5% (↓ 7% in a year, ↓ 0.7%/year after) |
| 5.2 | by 47% (↓ 7% in a year, ↓ 1.2%/year after) |
| Case Study 1 | Case Study 2 | |||
|---|---|---|---|---|
| More Airtight and Insulated Building | Less Airtight and Insulated Building | More Airtight and Insulated Building | Less Airtight and Insulated Building | |
| Total Energy consumption, kWh/m2, including: | 76.01 | 92.8 | 66.70 | 82.25 |
| Room Electricity | 15.41 | 15.39 | 11.87 | 11.87 |
| Lighting | 5.97 | 5.95 | 8.50 | 8.46 |
| Cooling | 39.82 | 56.59 | 32.464 | 48.1 |
| DHW | 14.81 | 14.87 | 13.83 | 13.82 |
| Energy from PV modules, kWh/m2 | 30.40 | 29.10 | ― | ― |
| CO2 emissions, kg/m2 | 27.64 | 38.60 | 40.4 | 49.85 |
| Operative temperature, °C | Jan—23.2 °C July—25.15 °C | Jan—21.2 °C Aug—25.3 °C | Jan—23.04 °C Aug—25.51 °C | Jan—21.05 °C Aug—25.93 °C |
| Solar gains, kWh/m2 | 46.66 | 45.61 | 25.63 | 25.52 |
| Heat gains, kWh/m2: Windows Walls Roof External infiltration | +20.84 +4.93 +1.51 +23.89 | +23.01 +11.28 +4.06 +56.91 | +13.69 +1.28 +0.58 +25.09 | +13.89 +2.92 +2.16 +57.48 |
| The Operational Stage | Windows (↓ Filling with Inert Gas) | Insulation (↑ Thermal Conductivity) | Air Permeability (↑) | Envelope Coatings (↓ Solar Reflectance of Envelope Coatings) | PV Modules (↓ Performance) | |||
|---|---|---|---|---|---|---|---|---|
| Scenario 1.2 | Scenario 2.1 | Scenario 3.2 | Scenario 4.1 (More Airtight and Insulated) | Scenario 4.3 (Less Airtight and Insulated) | Scenario 5.1 | |||
| ↓ 0.2%/Year | ↑ λ 0.5%/Year | ↑ up to 10% in a Year, 0.5%/Year after 10 Years | Roof | Walls | Roof | Walls | ↓ 7% in a Year, ↓ 0.7%/Year after | |
| ↓ 20% in a Year | ↓ 10% in a Year | ↓ 30% in 3 Years | ↓ 10% in a Year | |||||
| As design | 100 | 100 | 100 | 100 | 100 | 100 | 100 | 100 |
| As built | 90 | 100 | 100 | 100 | 100 | 100 | 100 | 90 |
| 1 year | 89.8 | 100.5 | 110 | 80 | 90 | 85 | 90 | 83 |
| 5 years | 89 | 102.5 | 110 | 80 | 90 | 70 | 90 | 79.5 |
| 10 years | 88 | 105 | 110 | 80 | 90 | 70 | 90 | 76 |
| 15 years | 87 | 107.5 | 112.5 | 80 | 90 | 70 | 90 | 72.5 |
| 20 years | 86 | 110 | 115 | 80 | 90 | 70 | 90 | 69 |
| 25 years | 85 | 112.5 | 117.5 | 80 | 90 | 70 | 90 | 65.5 |
| The Operational Stage | Windows (↓ Filling with Inert Gas + ↑ SHGC) | Insulation (↑ Thermal Conductivity) | Air Permeability (↑) | Envelope Coatings (↓ Solar Reflectance of Envelope Coatings) | PV Modules (↓ Performance) | ||
|---|---|---|---|---|---|---|---|
| Scenario 1.4 | Scenario 2.2 | Scenario 3.1 | Scenario 4.2 | Scenario 5.2 | |||
| ↓ 1%/Year + ↑ SHGC | ↑ λ 2.0%/Year | ↑ up to 20% in a Year, 0.5%/Year after 10 Years | Roof | Walls | ↓ 7% in a Year, ↓ 1.2%/Year after | ||
| ↓ 28% in 3 Years | ↓ 10% in a Year | ||||||
| As design | 100% Ar | Low-e glass | 100 | 100 | 100 | 100 | 100 |
| As built | 90% Ar | Low-e glass | 100 | 100 | 100 | 100 | 90 |
| 1 year | 89% Ar | ↑ 4% SolarTr | 102 | 120 | 86 | 90 | 83 |
| 5 years | 85% Ar | ↑ 20% SolarTr | 110 | 120 | 72 | 90 | 77 |
| 10 years | 80% Ar | ↑ 40% SolarTr | 120 | 120 | 72 | 90 | 71 |
| 15 years | 75% Ar | ↑ 60% SolarTr | 130 | 122.5 | 72 | 90 | 65 |
| 20 years | 70% Ar | ↑ 80% SolarTr | 140 | 125 | 72 | 90 | 59 |
| 25 years | 65% Ar | Clear glass | 150 | 127.5 | 72 | 90 | 53 |
Disclaimer/Publisher’s Note: The statements, opinions and data contained in all publications are solely those of the individual author(s) and contributor(s) and not of MDPI and/or the editor(s). MDPI and/or the editor(s) disclaim responsibility for any injury to people or property resulting from any ideas, methods, instructions or products referred to in the content. |
© 2023 by the authors. Licensee MDPI, Basel, Switzerland. This article is an open access article distributed under the terms and conditions of the Creative Commons Attribution (CC BY) license (https://creativecommons.org/licenses/by/4.0/).
Share and Cite
Taki, A.; Zakharanka, A. The Impact of Degradation on a Building’s Energy Performance in Hot-Humid Climates. Sustainability 2023, 15, 1145. https://doi.org/10.3390/su15021145
Taki A, Zakharanka A. The Impact of Degradation on a Building’s Energy Performance in Hot-Humid Climates. Sustainability. 2023; 15(2):1145. https://doi.org/10.3390/su15021145
Chicago/Turabian StyleTaki, Ahmad, and Anastasiya Zakharanka. 2023. "The Impact of Degradation on a Building’s Energy Performance in Hot-Humid Climates" Sustainability 15, no. 2: 1145. https://doi.org/10.3390/su15021145
APA StyleTaki, A., & Zakharanka, A. (2023). The Impact of Degradation on a Building’s Energy Performance in Hot-Humid Climates. Sustainability, 15(2), 1145. https://doi.org/10.3390/su15021145