


A Comparison of Students’ Thermal Comfort and Perceived Learning Performance between Two Types of University Halls: Architecture Design Studios and Ordinary Lecture Rooms during the Heating Season


Abstract
1. Introduction
1.1. Literature Review
1.2. Research Objectives
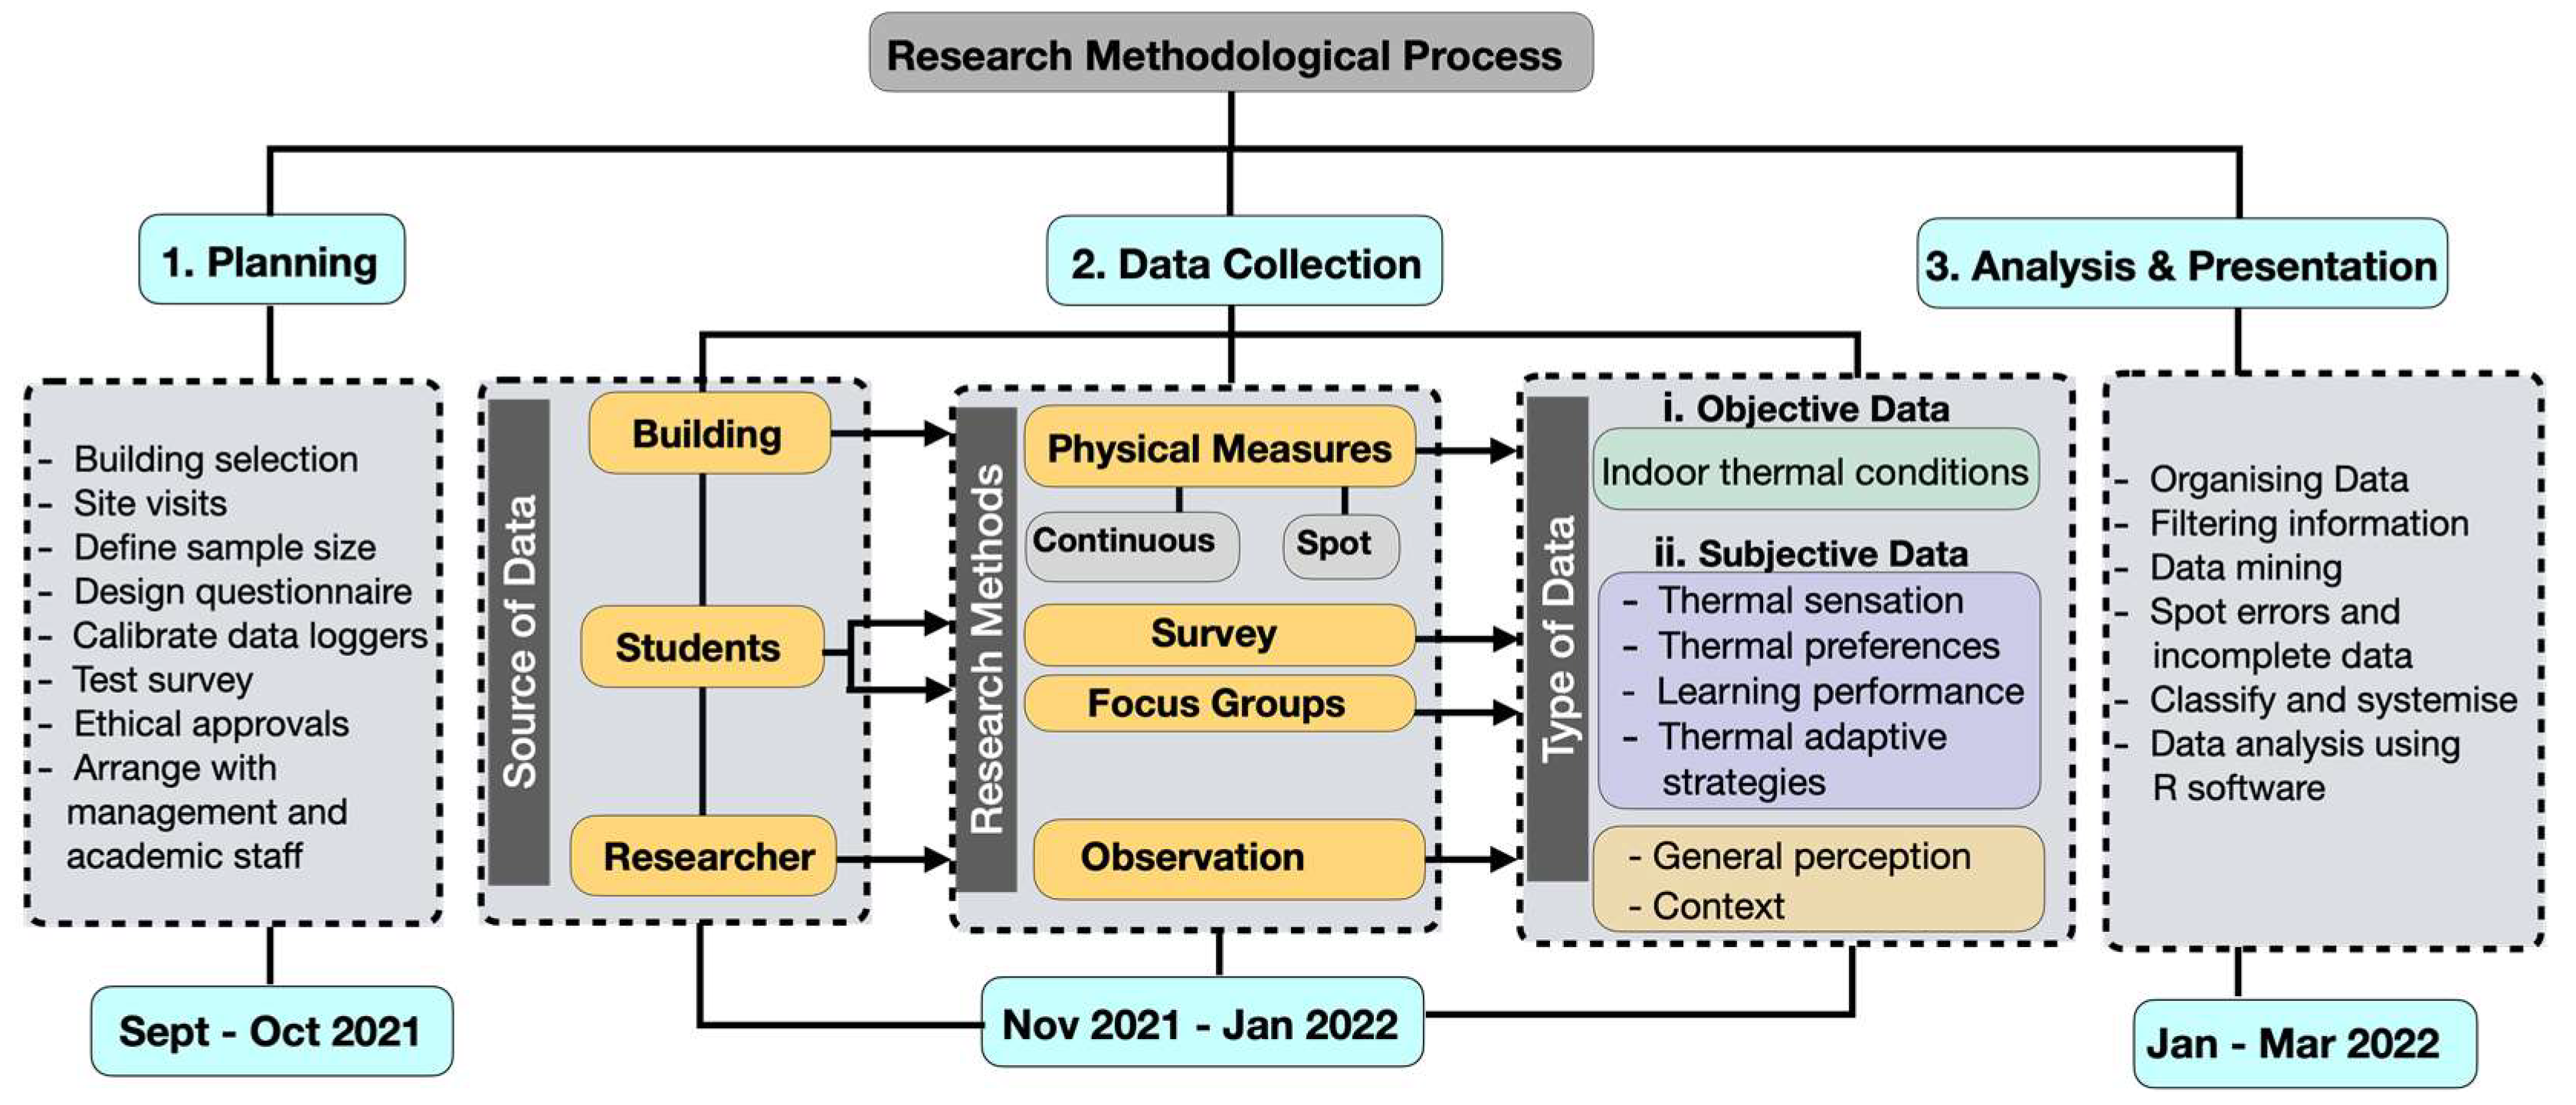
2. Materials and Methods
- i.
- The planning stage included preparation for the fieldwork activities such as building selection, sample size calculations, site visits, coordination with buildings’ management and academic staff, design questionnaires, calibrating, and testing equipment.
- ii.
- The data collection stage was developed to collect on-site records from three main sources: (i) the building (i.e., physical measurements); (ii) the students (i.e., thermal perception, perceived learning performance, physiological and psychological data); (iii) the research team or data collector, since they play a vital role during fieldwork by systematically inspecting on-site parameters related to the design of a surveyed building or students’ behaviour.
- iii.
- The data analysis and presentation stage phase involved data filtering, refining, and analysing. This stage allowed for identifying trends, patterns, and any potential inaccuracy in the collected data.
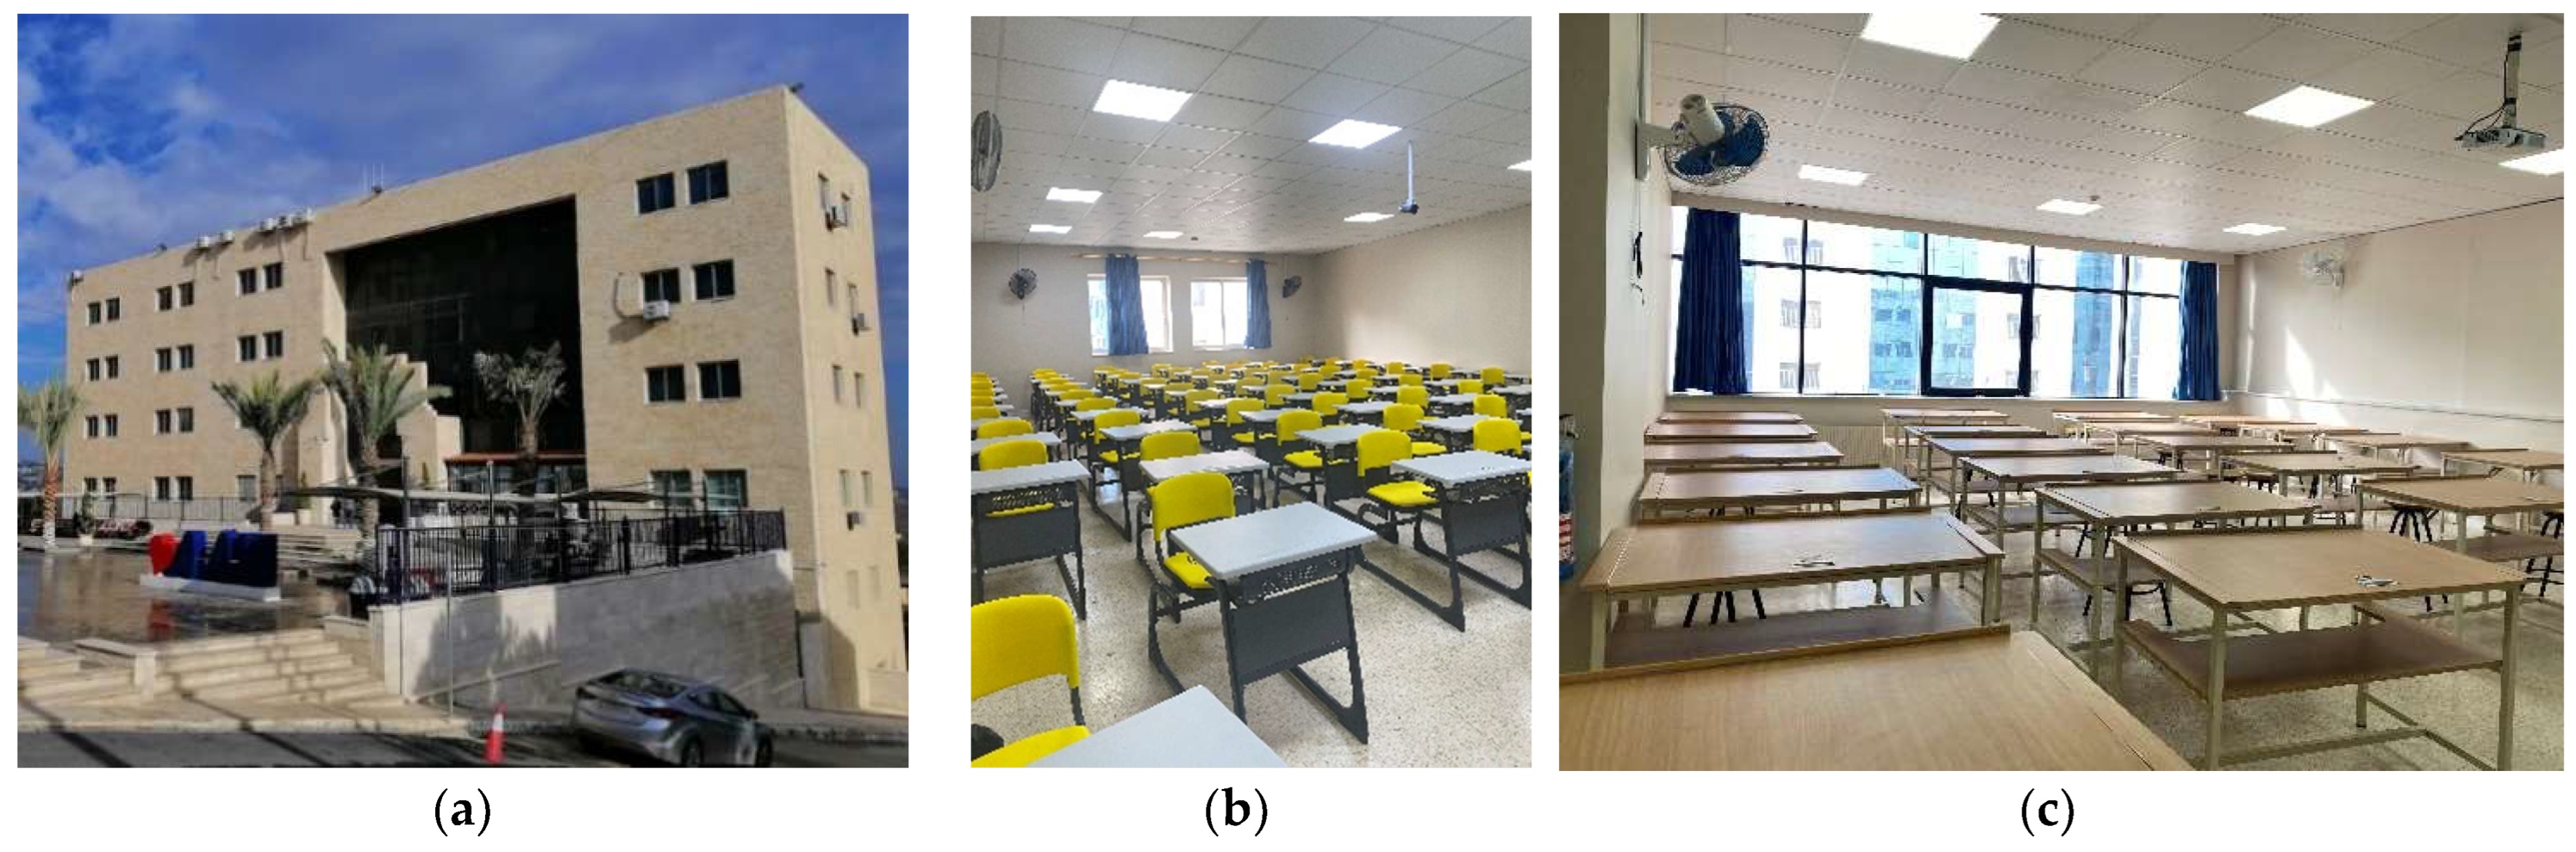
2.1. University Halls Selection
2.2. Data Collection
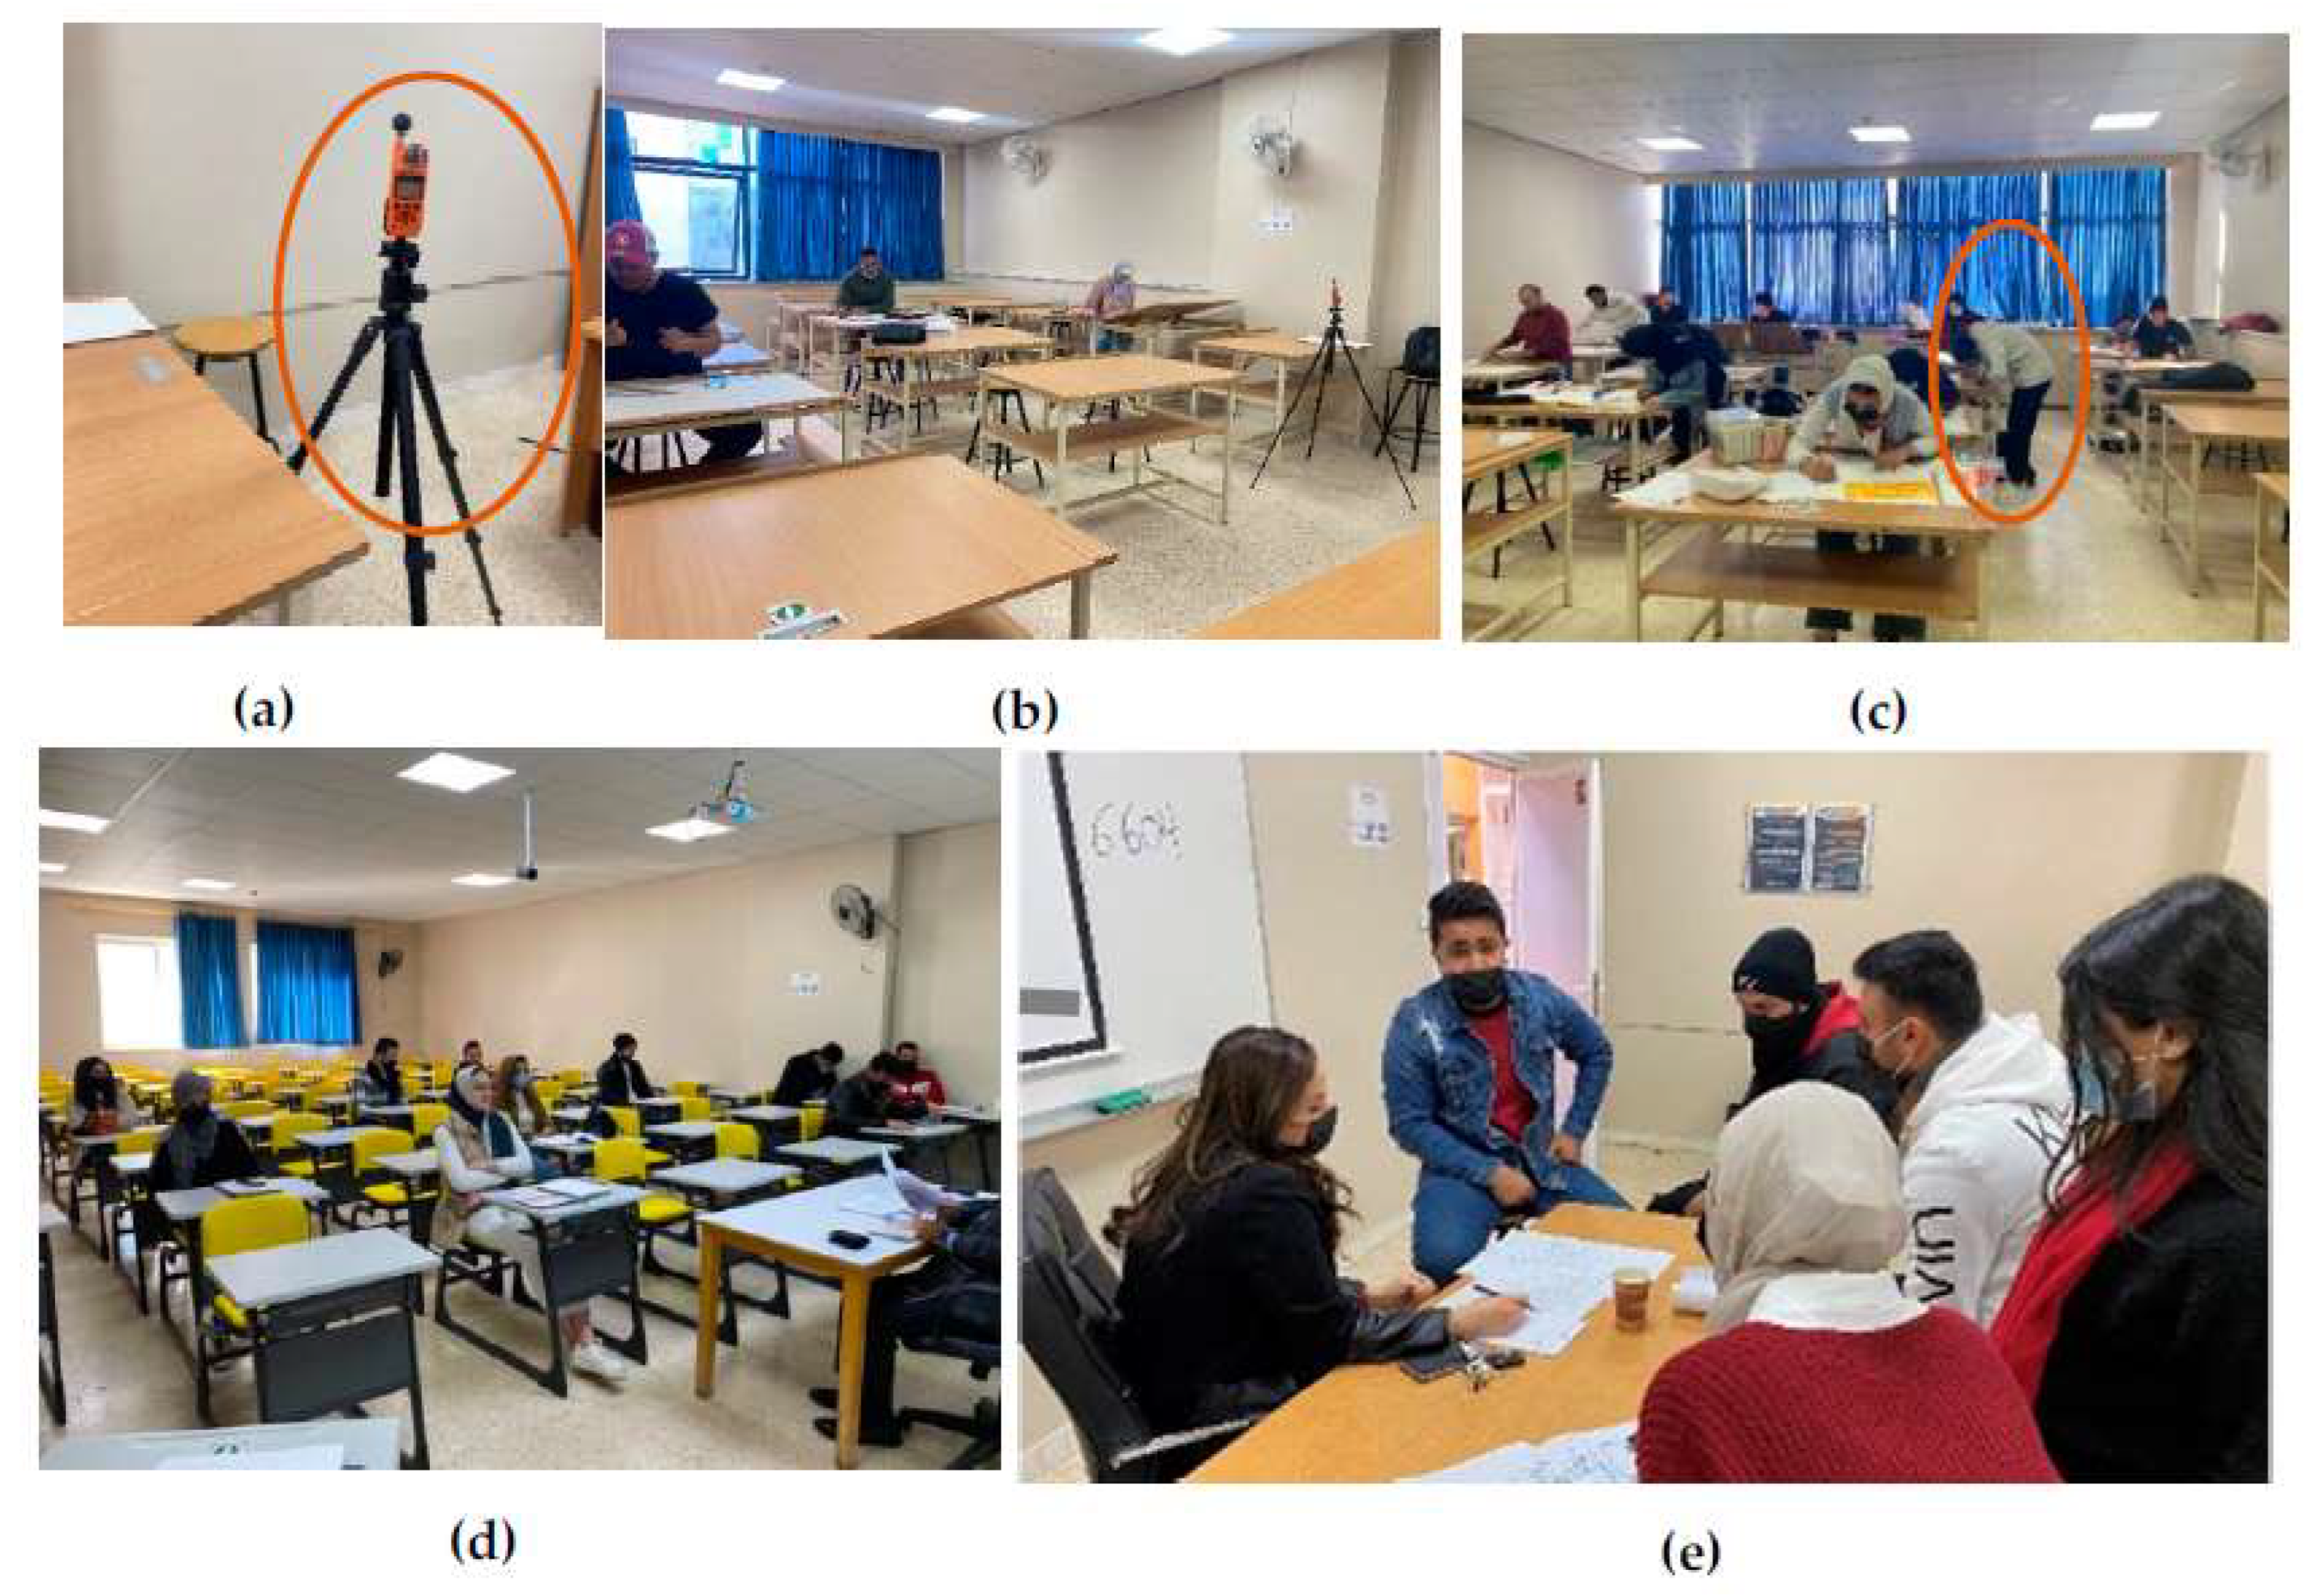
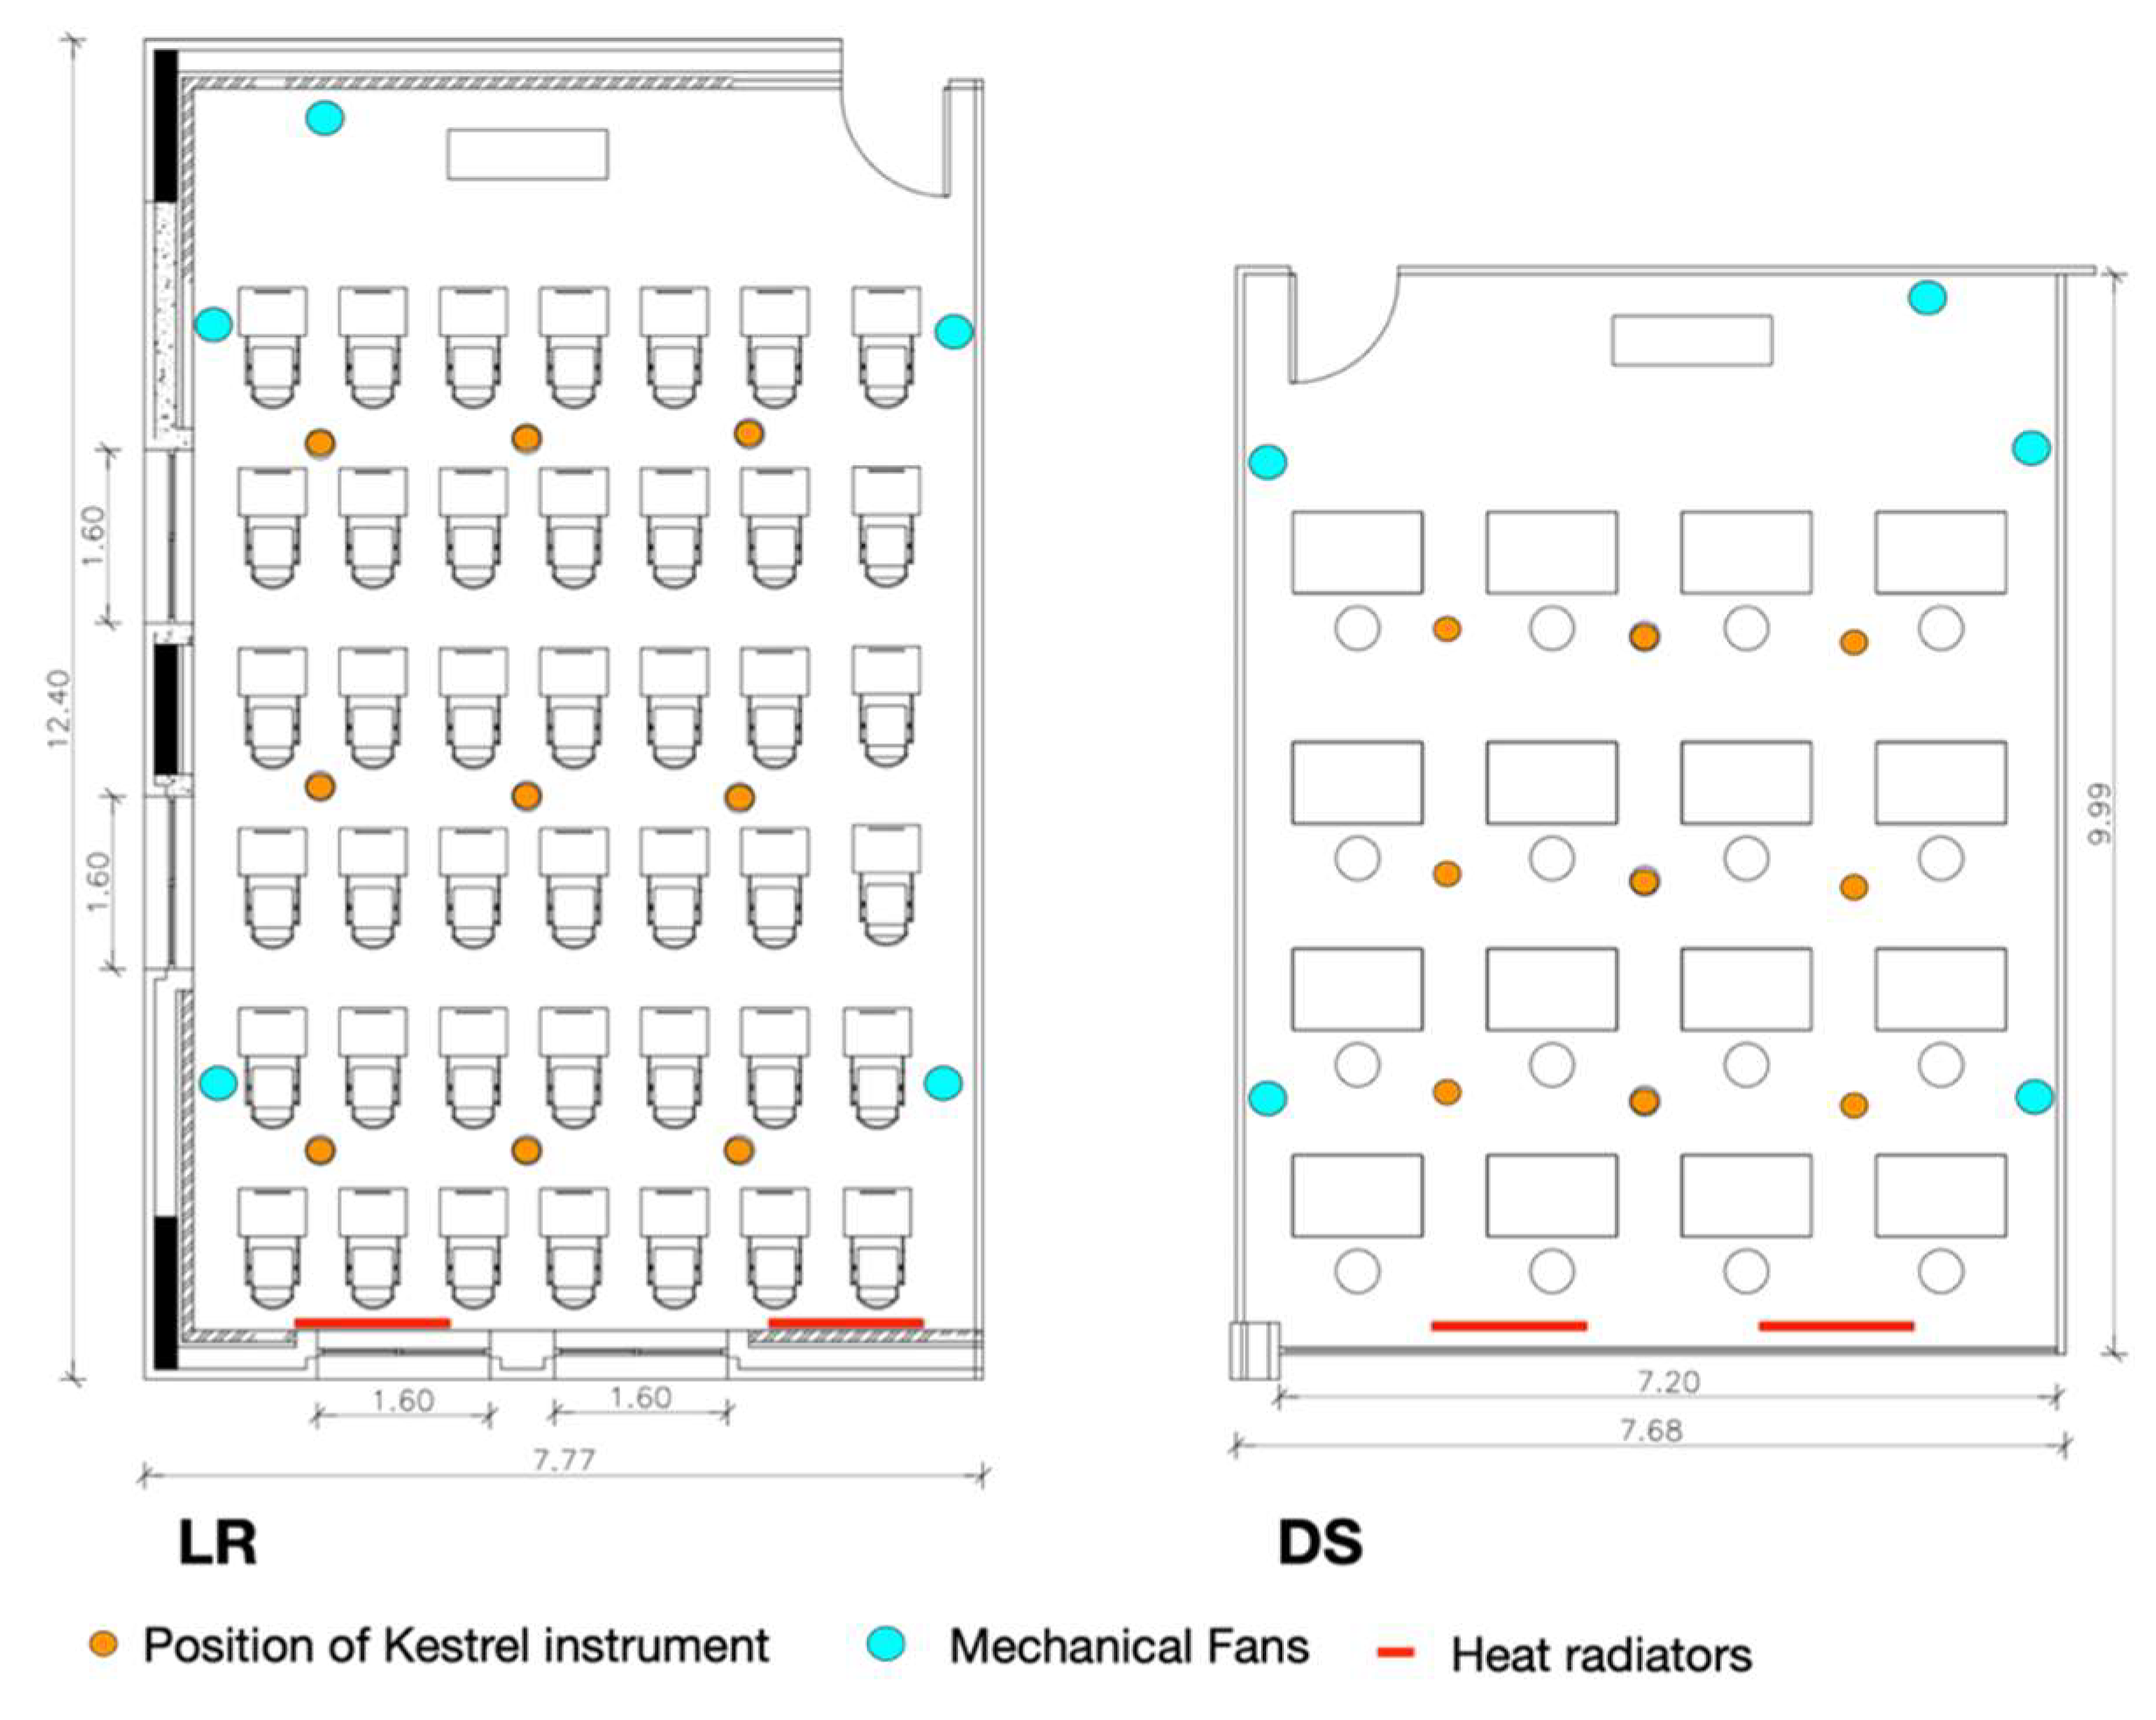
2.2.1. Physical Measurements
2.2.2. Survey, Focus Groups, and Observations
- The first section included five questions to collect information on students’ physiological aspects (e.g., age, gender, height, weight, and nationality).
- The second section included four questions focused on students’ thermal sensation votes (TSV), thermal preference votes (TPV), and clothes and physical activities adopted from ASHRAE 55-2017 [32].
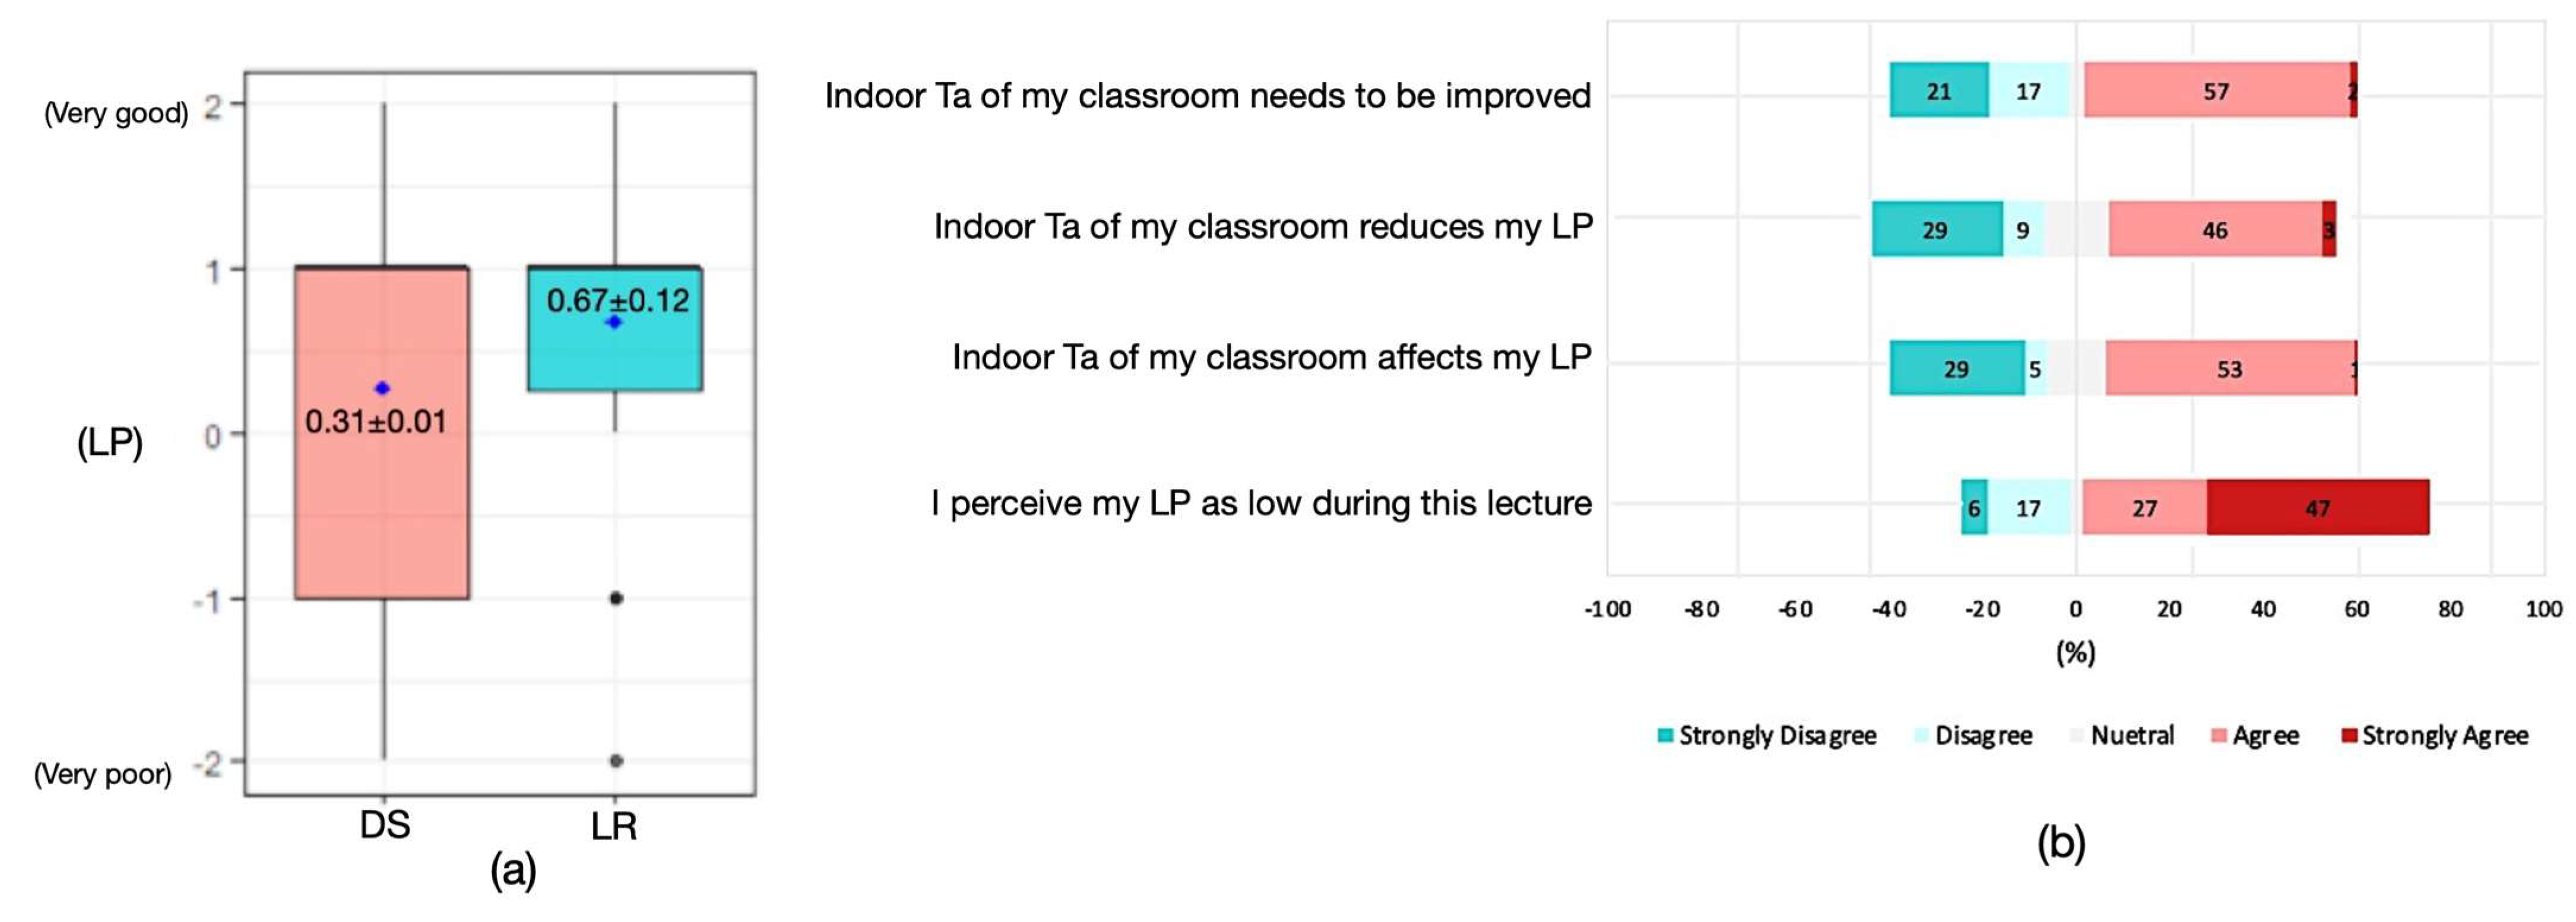
- The third section evaluated students’ perceived learning performance during lecture time using self-reported learning performance. It also evaluated the impact of indoor temperature on learning performance. In our study, the survey was used to assess perceived learning performance, since the use of objective tools such as students’ test scores, speed in task performance, and percentage of error was challenging in our study, due to the university guides and restrictions.
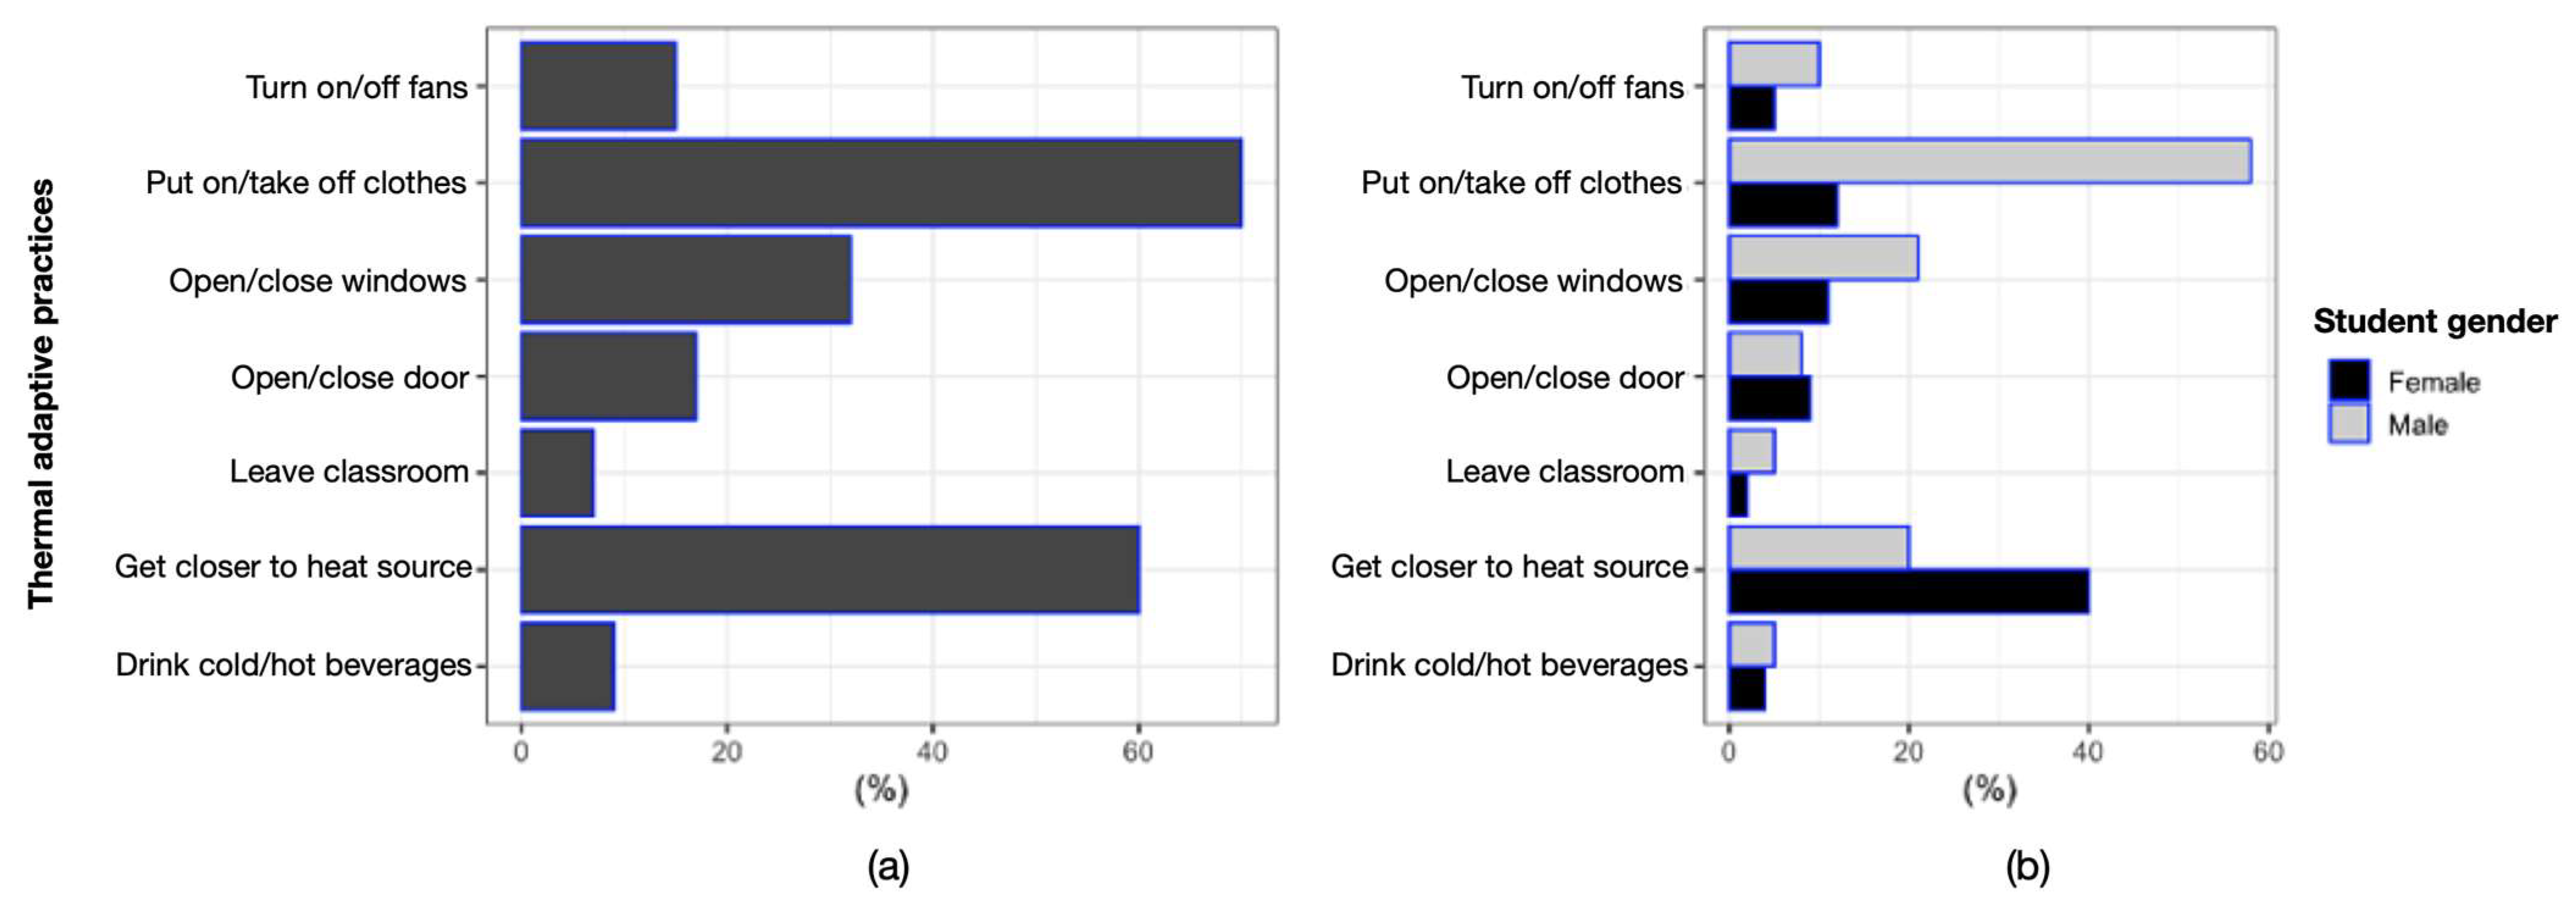
- The fourth section aimed to collect data about students’ thermal adaptive strategies.
2.3. Data Analysis Methods
- For continuous interval data, i.e., Ta (°C); Tr (°C); Va (ms−1); and ratio scale data, i.e., RH (%), the independent sample t-test was used to test the difference in mean scores. In addition, the objective measures from surveyed university halls were compared to the recommended ranges of thermal conditions in the ASHRAE 55-2017 standard. Confidence intervals are reported together with the differences between groups. The effect size is reported using Cohen’s well-known metric, calculated using [81]:where represents the sample mean in one group, is the mean of the other group, and is the pooled variance of the samples.
- For the ordinal variables, i.e., TSV, TPV, and perceived learning performance, the Wilcoxon rank sum test (i.e., Mann–Whitney test) was used, due to its applicability with the ordinal data [82]. Further, the power analysis was performed by calculating the effect size index, and Spearman rank correlation (Rho) was used to investigate the correlation between categorical variables [83].
3. Results
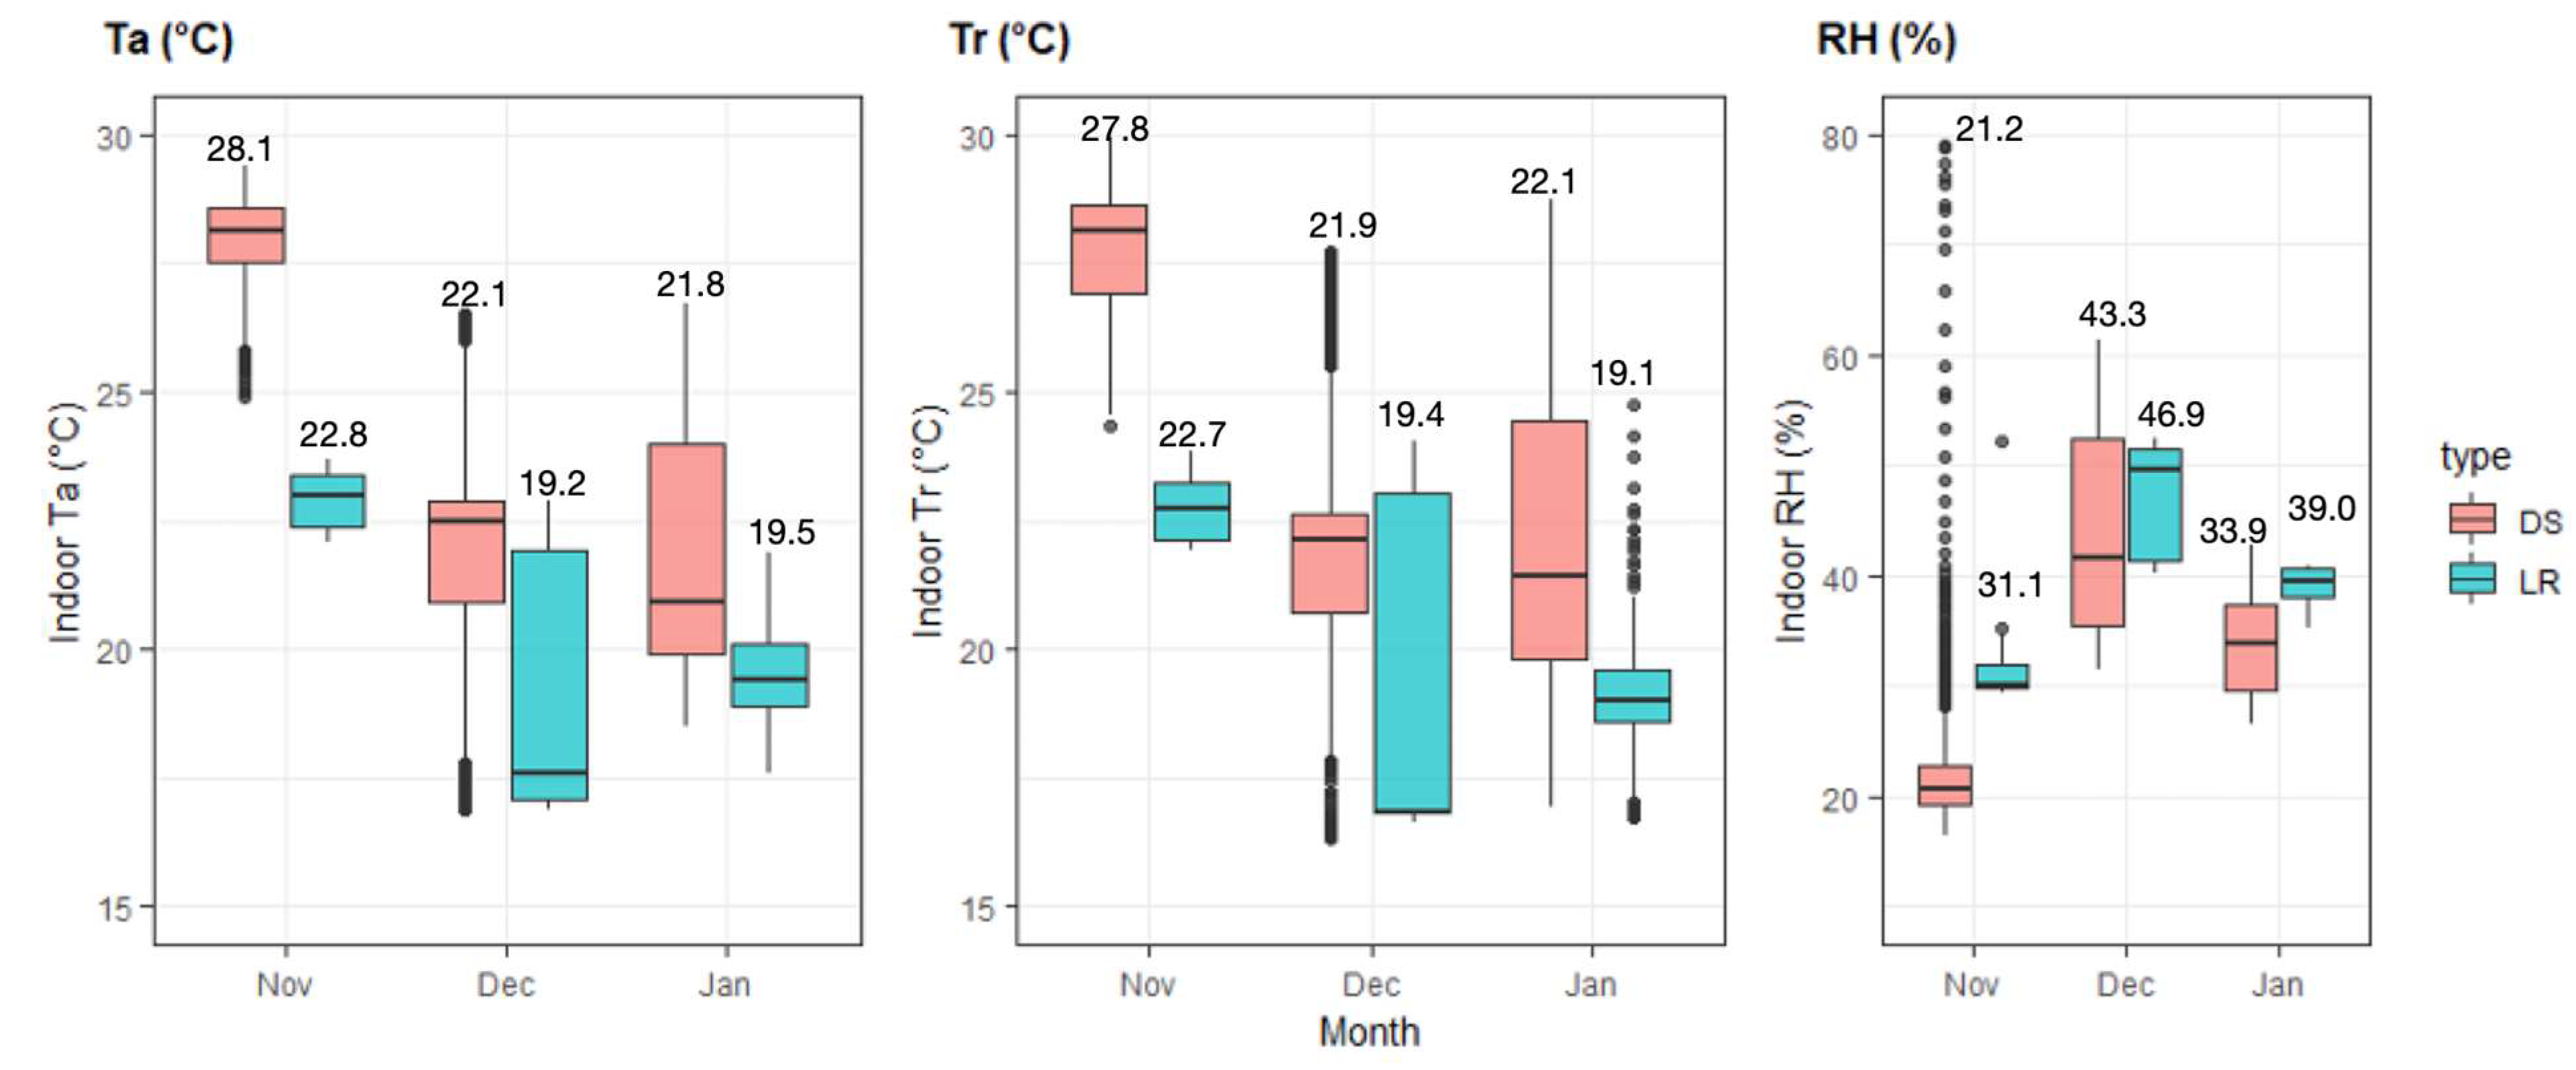
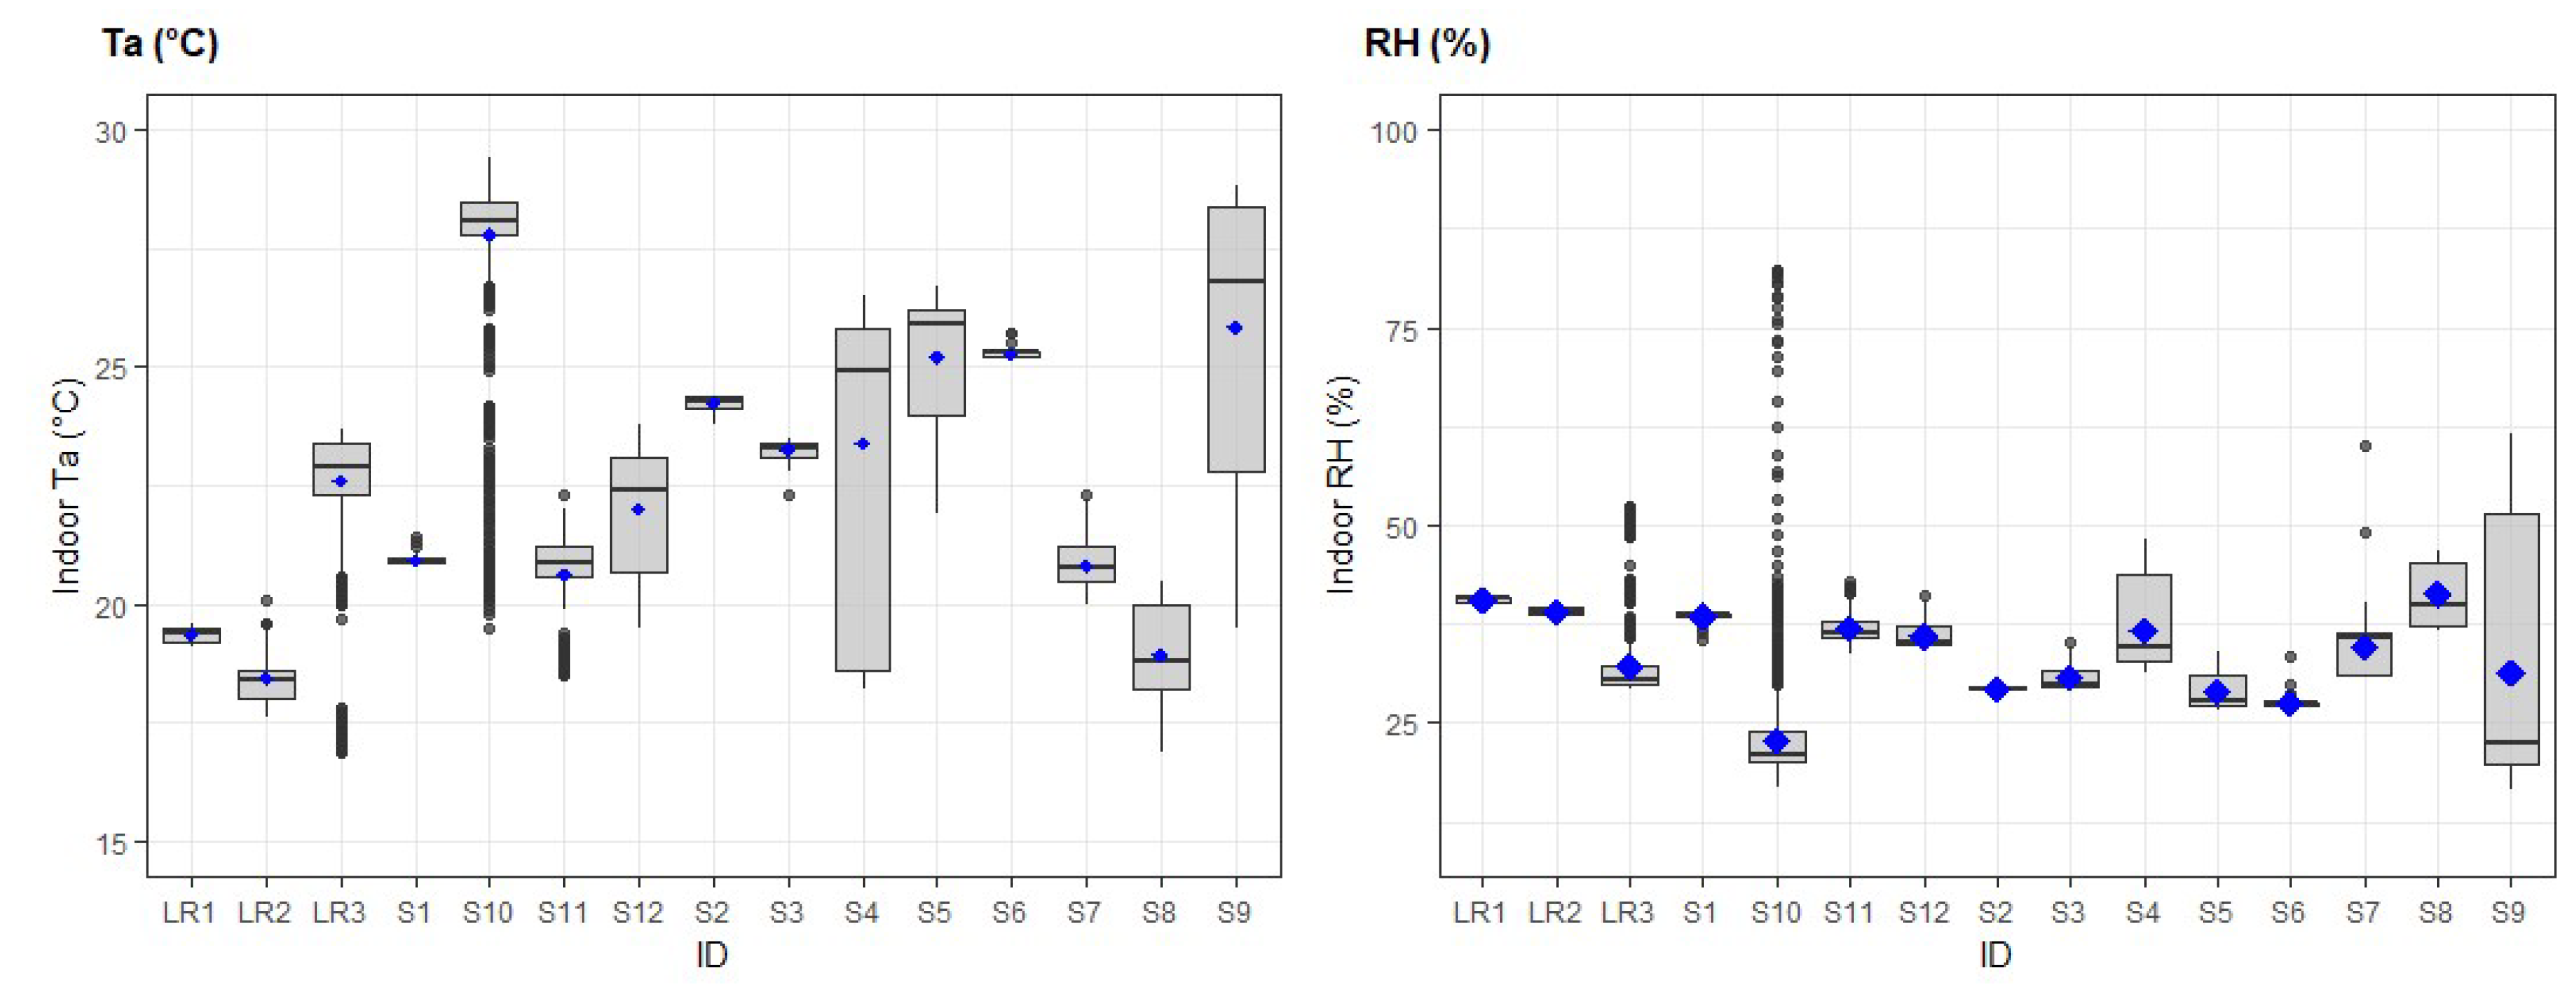
3.1. Comparison of Thermal Conditions between DS and LR
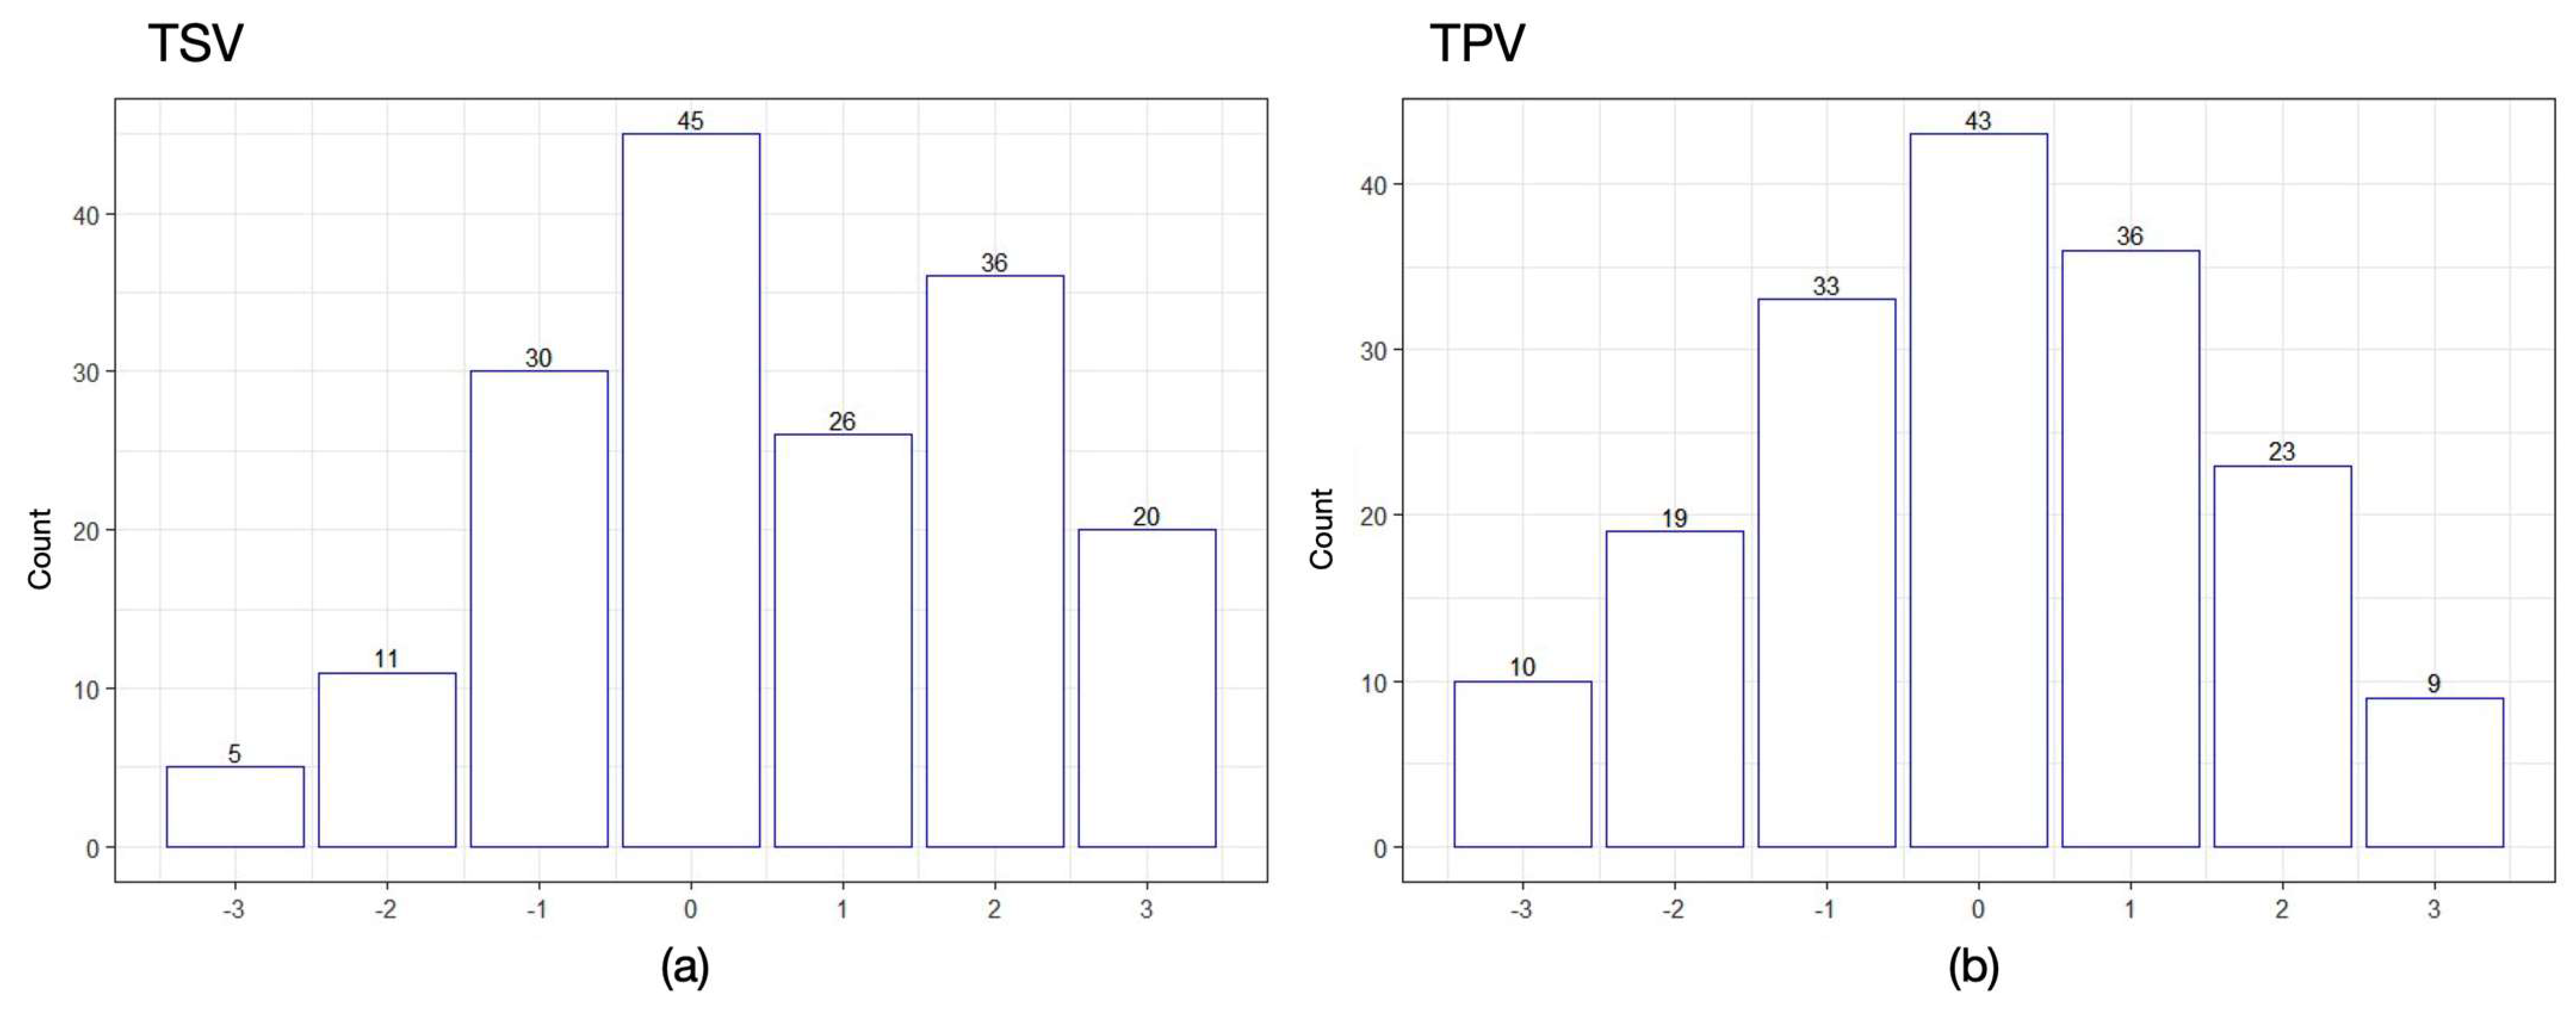
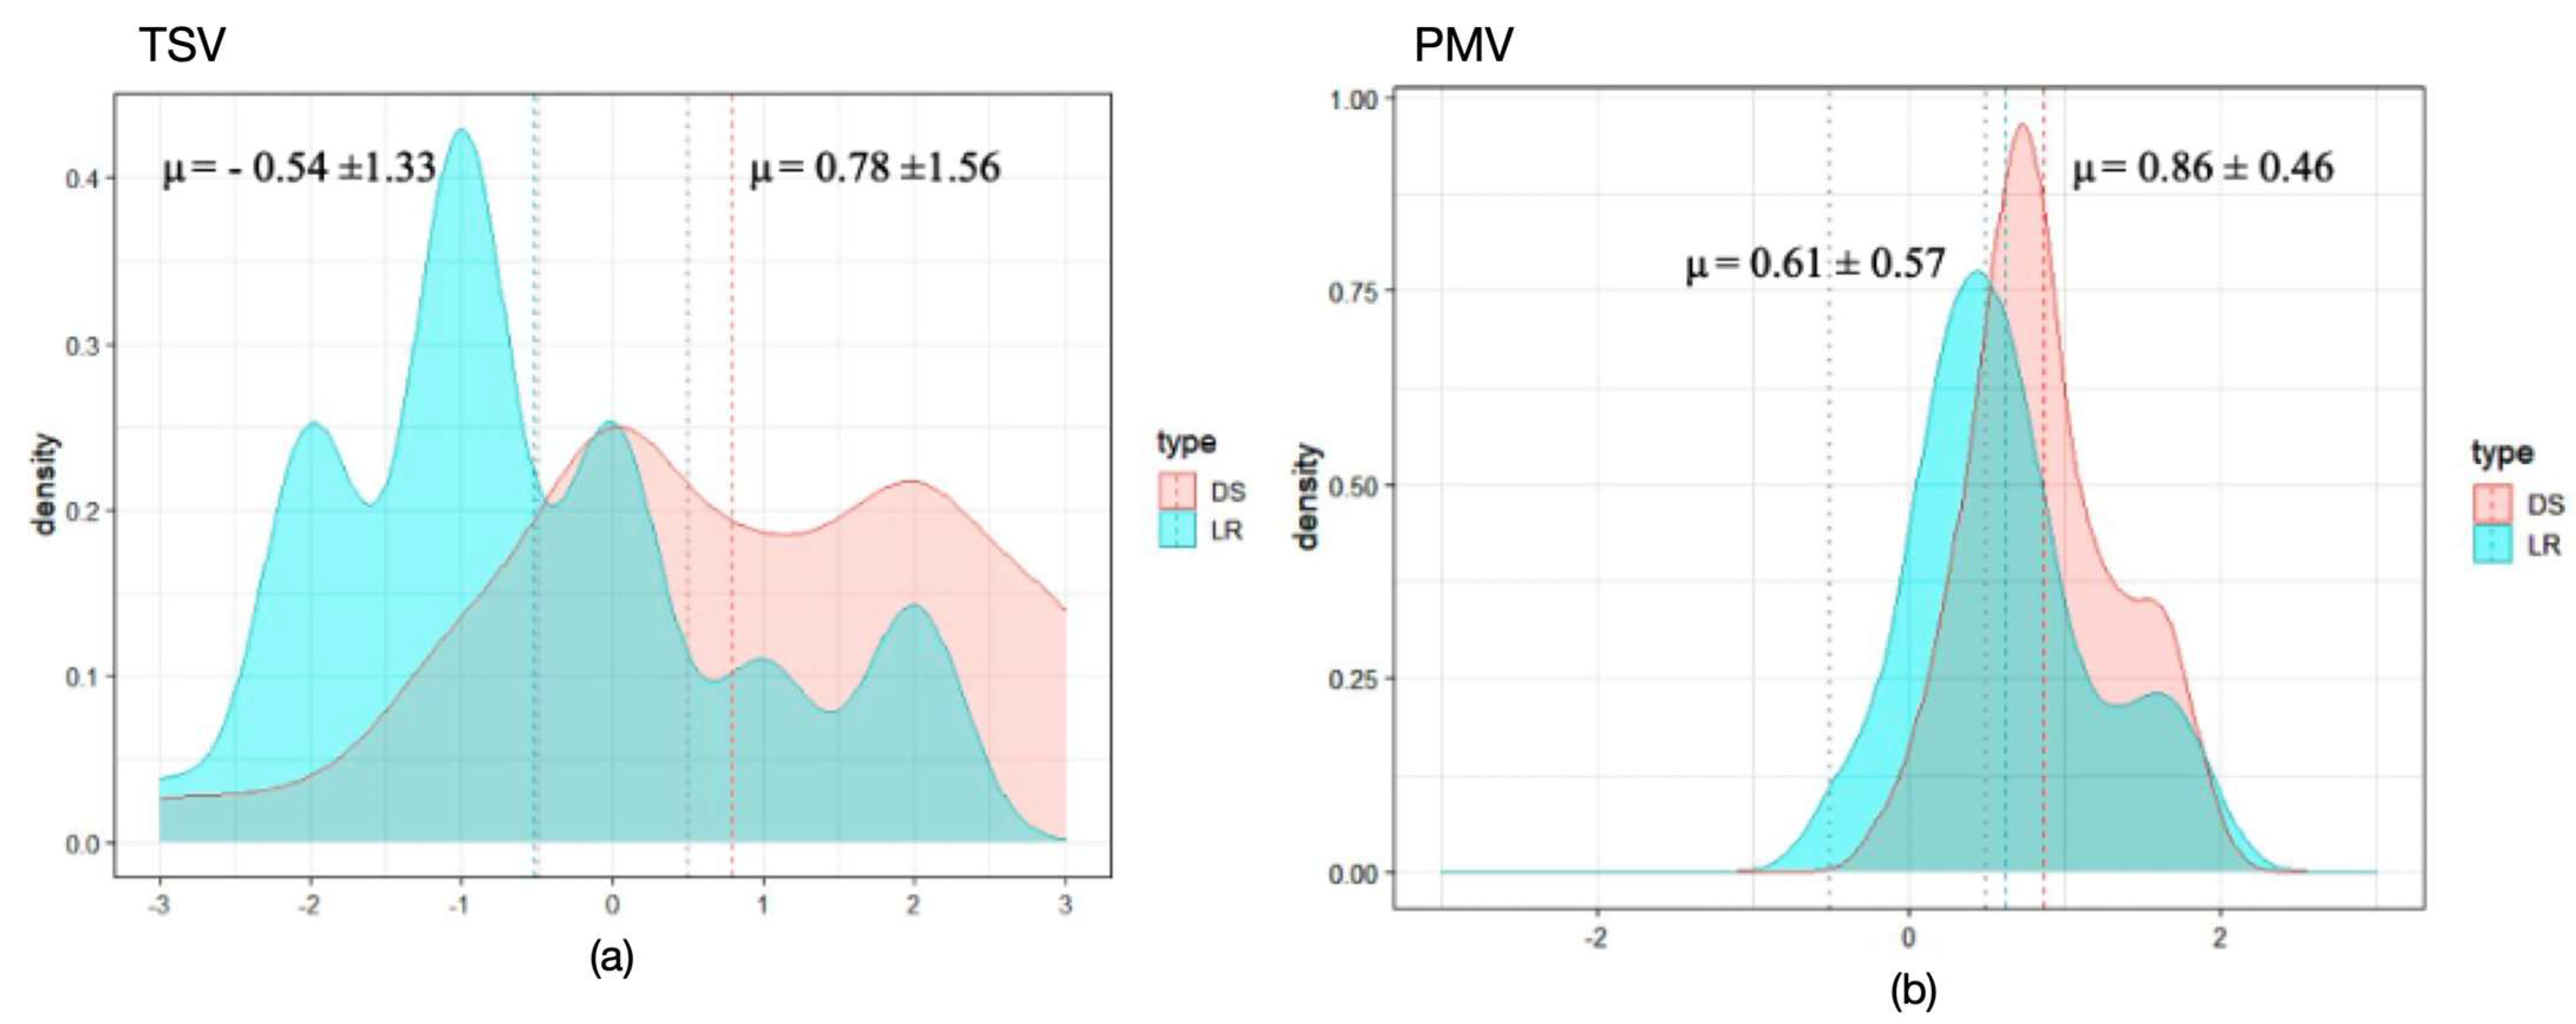
3.2. Comparison of Students’ TSV, TPV, and PMV between DS and LR
3.3. Students’ Thermal Adaptive Strategies
3.4. Comparison of Perceived Learning Performance between DS and LR
4. Discussion
4.1. The Physical Indoor Thermal Environment
4.2. Thermal Sensation and Perceived Learning Performance of Students
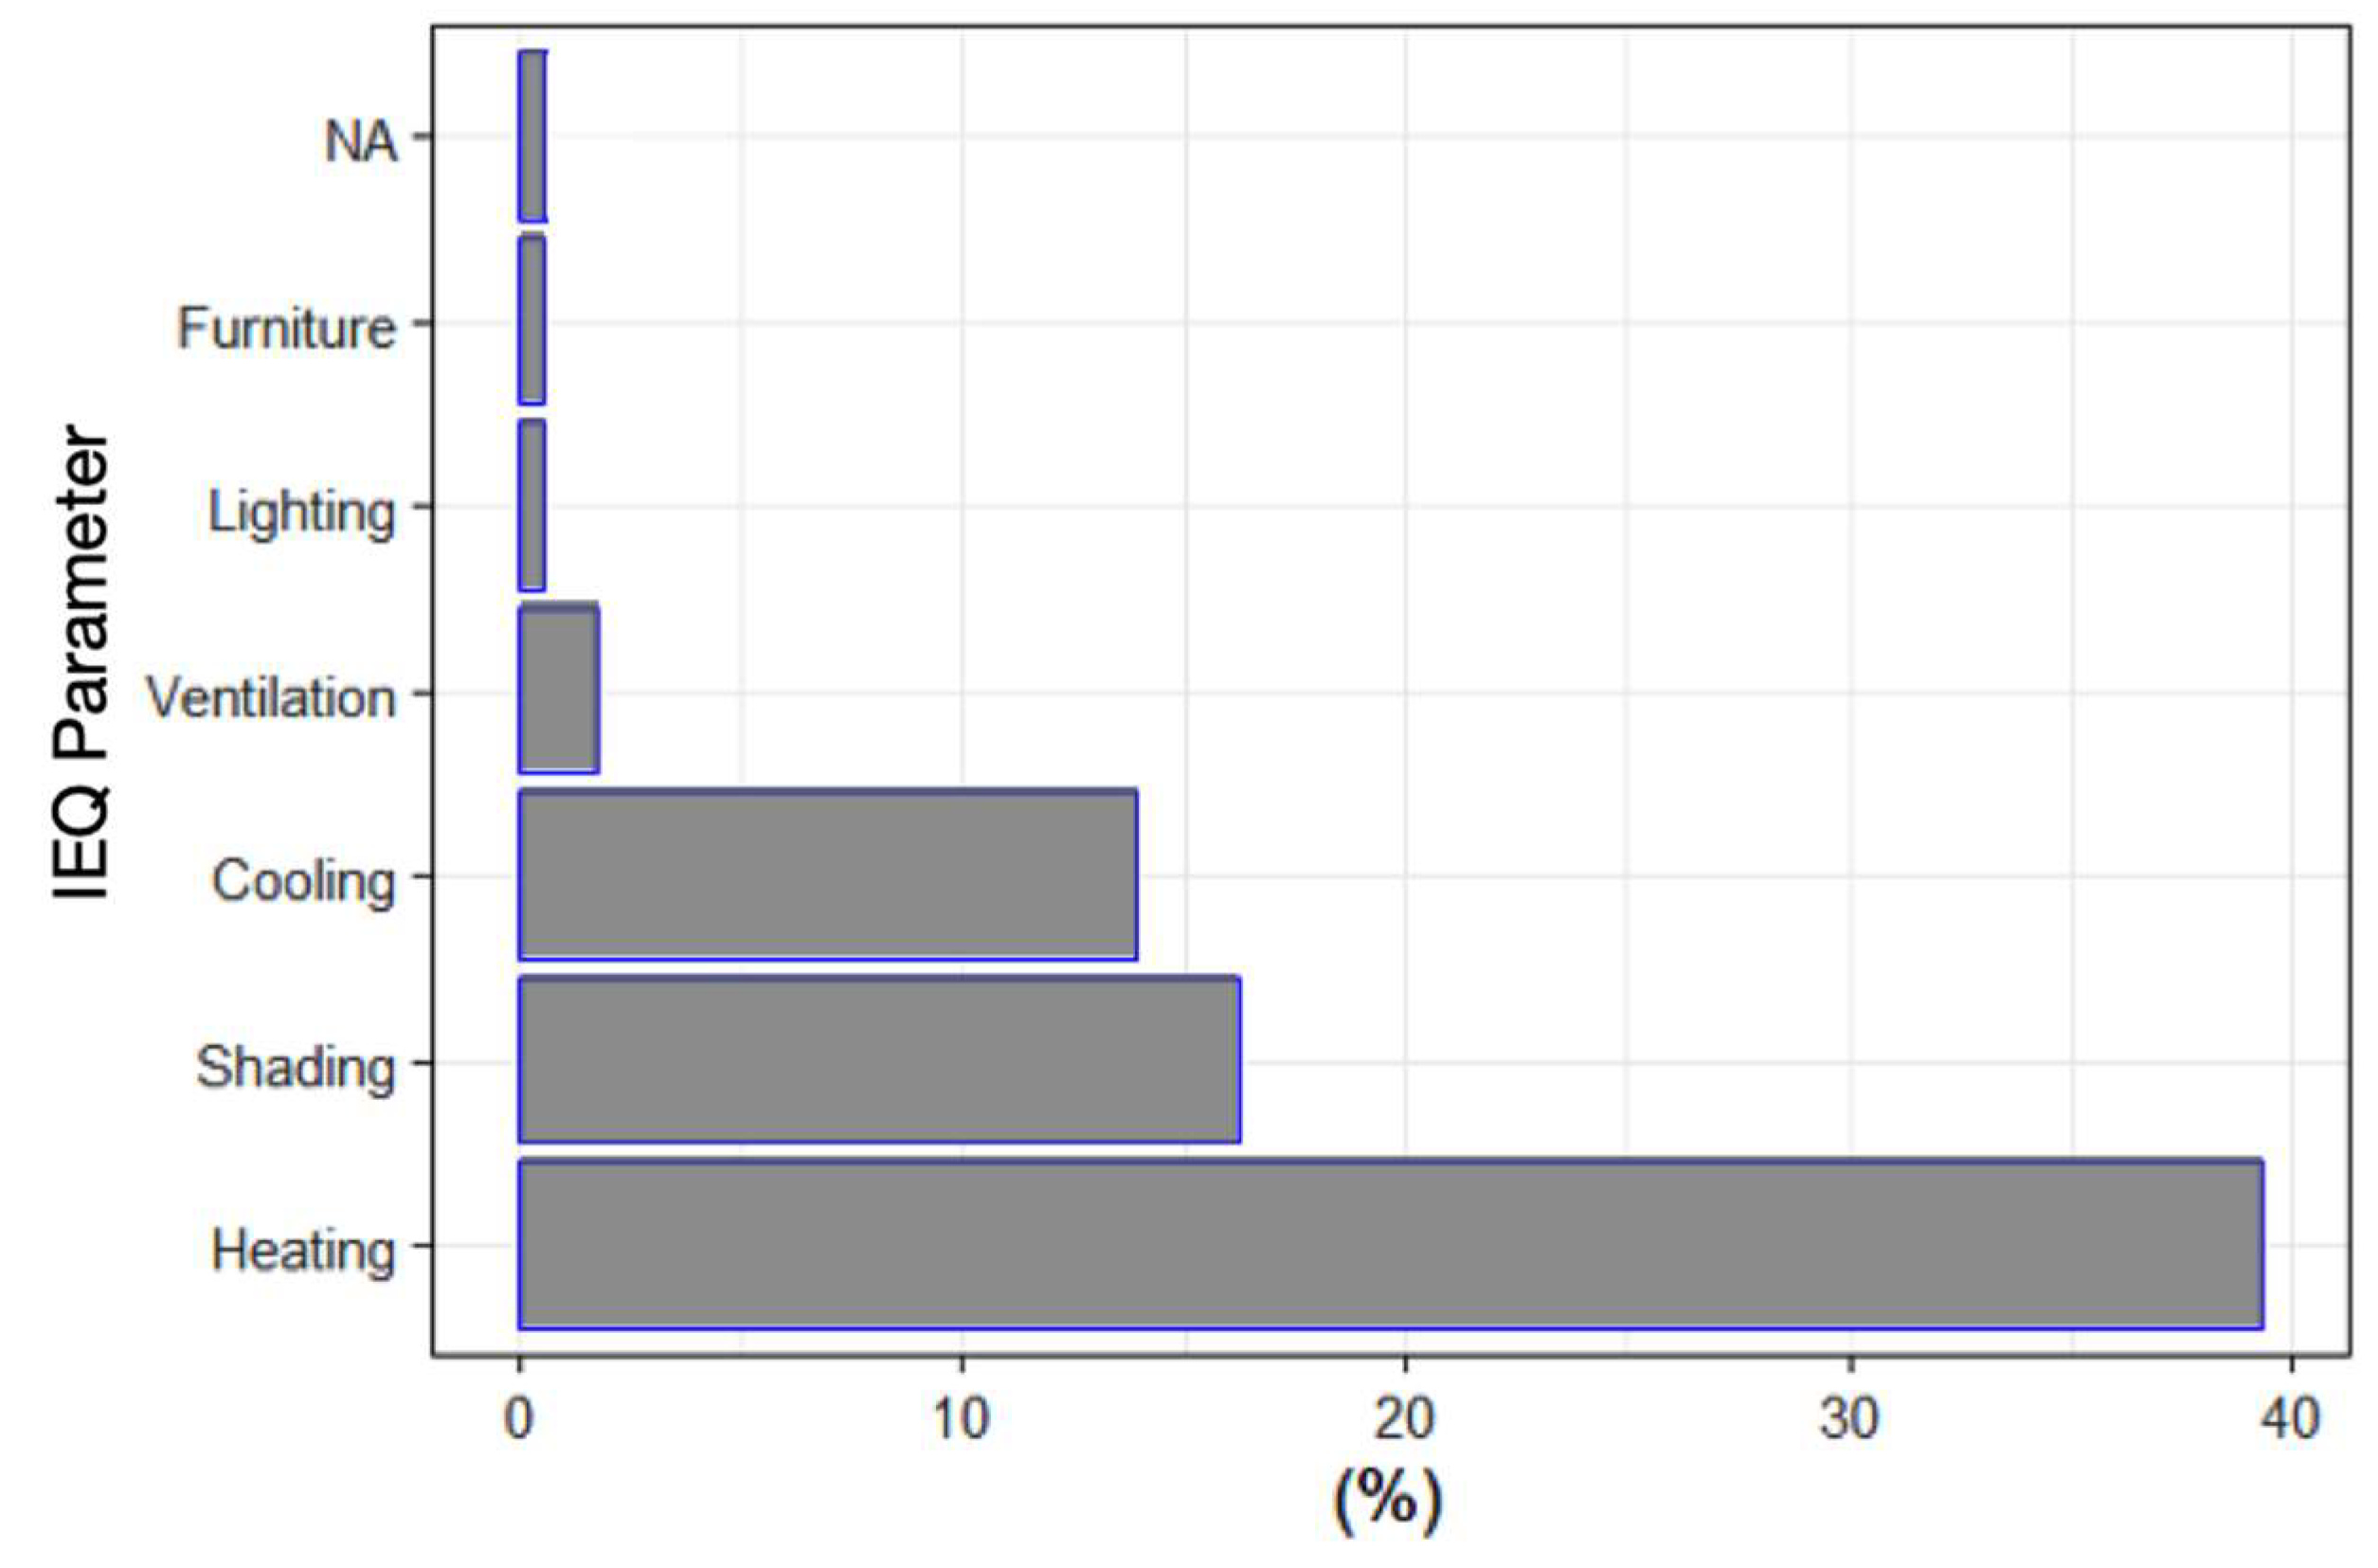
4.3. Future Improvements of University Halls
5. Conclusions
Author Contributions
Funding
Institutional Review Board Statement
Informed Consent Statement
Data Availability Statement
Acknowledgments
Conflicts of Interest
Appendix A. Survey
| We are evaluating your classroom to assess how well it performs for those who occupy it. This information will be used to assess areas that need improvement and provide feedback for similar buildings. Responses are anonymous. Please answer all the relevant questions | ||||
| Classroom number: ID: | Time: | Date: | ||
| Age: …………….. | Gender Female Male | Level First year Second year Third year Fourth year Fifth year | Nationality Jordanian Non-Jordanian | Education Level B.Sc. M.Sc. |
| |||||||
| English | Cold | Cool | Slightly cool | Neutral | Slightly warm | Warm | Hot |
| Number | −3 | −2 | −1 | 0 | +1 | +2 | +3 |
| Arabic (Levantine) | بردان كتير | بردان | بردان شوي | مرتاح | مشوب شوي | دافئ | كتير مشوب |
| |||||||
| English | Much cooler | Cooler | A bit cooler | No Change | A bit warmer | Warmer | Much warmer |
| Number | −3 | −2 | −1 | 0 | +1 | +2 | +3 |
| Arabic (Levantine) | ابرد كتير | ابرد | ابرد شوي | لا تغيير | ادفى شوي | ادفى | ادفى كتير |
| |
| Short-sleeve shirt/blouse | |
| Long-sleeve shirt/blouse | |
| Vest | |
| Trousers/long skirt | |
| Shorts | |
| Dress | |
| Pullover | |
| Jacket | |
| Long socks | |
| Short socks | |
| Tights | |
| Tie | |
| Boots | |
| Shoes | |
| Sandals | |
| Head wear | |
| Barefoot | |
| |
| Sitting (passive work) | |
| Sitting (active work) | |
| Standing relaxed | |
| Standing working | |
| Walking indoors | |
| Walking outdoors | |
| Other……………… | |
- 5.
- Rate your learning performance in the classroom now
- 6.
- The current indoor air temperature in my classroom affects my learning performance
- 7.
- Temperature in my classroom can reduce my overall productivity
- 8.
- If you feel uncomfortable with the indoor temperature in the lecture room, which adaptive strategies you follow, select from the below answers:
- -
- Open/close windows
- -
- Turn on/off fans
- -
- Use heater
- -
- Drinking cold/hot drinks beverages
- -
- Putting on/taking off a piece of garment
- -
- Changing positions within the classroom
- -
- Leave lecture room
- 9.
- If you choose to improve any item in your classroom, what would it be?
References
- Allen, J.G.; Macomber, J.D. Healthy Buildings: How Indoor Spaces Can Make You Sick—or Keep You Well; Harvard University Press: Cambridge, MA, USA, 2022. [Google Scholar]
- Clements-Croome, D.J. Designing Buildings for People: Sustainable Liveable Architecture; The Crowood Press Ltd.: Wiltshire, England, 2021. [Google Scholar]
- Banu-Ogundere, A. Leadership for Wellbeing in Schools: A Guide to Building Healthy and Engaged Workforce in Schools; Kindle and Selar: Seattle, WA, USA, 2021. [Google Scholar]
- Battisto, D.; Wilhelm, J.J. Architecture and Health Guiding Principles for Practice; Routledge: London, UK, 2020. [Google Scholar]
- Rider, T.R.; van Bakergem, M. Building for Well-Being; Routledge: London, UK, 2021. [Google Scholar]
- Ghaffarianhoseini, A.; AlWaer, H.; Omrany, H.; Ghaffarianhoseini, A.; Alalouch, C.; Clements-Croome, D.; Tookey, J. Sick building syndrome: Are we doing enough? Arch. Sci. Rev. 2018, 61, 99–121. Available online: https://www.tandfonline.com/doi/full/10.1080/00038628.2018.1461060 (accessed on 2 November 2022). [CrossRef]
- Elnaklah, R.; Walker, I.; Natarajan, S. Moving to a green building: Indoor environment quality, thermal comfort and health. Build. Environ. 2021, 191, 107592. [Google Scholar] [CrossRef]
- Lucialli, P.; Marinello, S.; Pollini, E.; Scaringi, M.; Sajani, S.Z.; Marchesi, S.; Cori, L. Indoor and outdoor concentrations of benzene, toluene, ethylbenzene and xylene in some Italian schools evaluation of areas with different air pollution. Atmos. Pollut. Res. 2020, 11, 1998–2010. [Google Scholar] [CrossRef]
- Zomorodian, Z.S.; Tahsildoost, M.; Hafezi, M. Thermal comfort in educational buildings: A review article. Renew. Sustain. Energy Rev. 2016, 59, 895–906. [Google Scholar] [CrossRef]
- Shield, B.M.; Dockrell, J.E. The Effects of Noise on Children at School: A Review. Build. Acoust. 2003, 10, 97–116. [Google Scholar] [CrossRef]
- Puglisi, G.E.; Cutiva, L.C.C.; Pavese, L.; Castellana, A.; Bona, M.; Fasolis, S.; Lorenzatti, V.; Carullo, A.; Burdorf, A.; Bronuzzi, F.; et al. Acoustic Comfort in High-school Classrooms for Students and Teachers. Energy Procedia 2015, 78, 3096–3101. [Google Scholar] [CrossRef]
- Chiou, Y.-S.; Saputro, S.; Sari, D.P. Visual Comfort in Modern University Classrooms. Sustainability 2020, 12, 3930. [Google Scholar] [CrossRef]
- Lolli, F.; Marinello, S.; Coruzzolo, A.M.; Butturi, M.A. Post-Occupancy Evaluation’s (POE) Applications for Improving Indoor Environment Quality (IEQ). Toxics 2022, 10, 626. [Google Scholar] [CrossRef]
- Bluyssen, P.M.; Zhang, D.; Kurvers, S.; Overtoom, M.; Ortiz-Sanchez, M. Self-reported health and comfort of school children in 54 classrooms of 21 Dutch school buildings. Build. Environ. 2018, 138, 106–123. [Google Scholar] [CrossRef]
- Sarbu, I.; Pacurar, C. Experimental and numerical research to assess indoor environment quality and schoolwork performance in university classrooms. Build. Environ. 2015, 93, 141–154. [Google Scholar] [CrossRef]
- Issa, M.H.; Rankin, J.H.; Attalla, M.; Christian, A.J. Absenteeism, performance and occupant satisfaction with the indoor environment of green Toronto schools. Indoor Built Environ. 2011, 20, 511–523. [Google Scholar] [CrossRef]
- Corgnati, S.P.; Filippi, M.; Viazzo, S. Perception of the thermal environment in high school and university classrooms: Subjective preferences and thermal comfort. Build. Environ. 2007, 42, 951–959. Available online: https://linkinghub.elsevier.com/retrieve/pii/S036013230500449X (accessed on 4 October 2022). [CrossRef]
- Elnaklah, R.; Alnuaimi, A.; Alotaibi, B.S.; Topriska, E.; Walker, I.; Natarajan, S. Thermal comfort standards in the Middle East: Current and future challenges. Build. Environ. 2021, 200, 107899. [Google Scholar] [CrossRef]
- Alnuaimi, A.N.; Natarajan, S. The Energy Cost of Cold Thermal Discomfort in the Global South. Buildings 2020, 10, 93. [Google Scholar] [CrossRef]
- Sun, Y.; Luo, X.; Ming, H. Analyzing the Time-Varying Thermal Perception of Students in Classrooms and Its Influencing Factors from a Case Study in Xi’an, China. Buildings 2022, 12, 75. [Google Scholar] [CrossRef]
- Rodríguez, C.M.; Coronado, M.C.; Medina, J.M. Thermal comfort in educational buildings: The Classroom-Comfort-Data method applied to schools in Bogotá, Colombia. Build. Environ. 2021, 194, 107682. [Google Scholar] [CrossRef]
- Rodriguez, C.M.; Coronado, M.C.; Medina, J.M. Classroom-comfort-data: A method to collect comprehensive information on thermal comfort in school classrooms. Methodsx 2019, 6, 2698–2719. [Google Scholar] [CrossRef]
- Teli, D.; Bourikas, L.; James, P.A.; Bahaj, A.S. Thermal Performance Evaluation of School Buildings using a Children-based Adaptive Comfort Model. Procedia Environ. Sci. 2017, 38, 844–851. [Google Scholar] [CrossRef]
- Singh, M.K.; Ooka, R.; Rijal, H.B.; Kumar, S.; Kumar, A.; Mahapatra, S. Progress in thermal comfort studies in classrooms over last 50 years and way forward. Energy Build. 2019, 188–189, 149–174. [Google Scholar] [CrossRef]
- Al-Khatri, H.; Alwetaishi, M.; Gadi, M.B. Exploring thermal comfort experience and adaptive opportunities of female and male high school students. J. Build. Eng. 2020, 31, 101365. [Google Scholar] [CrossRef]
- Trebilcock, M.; Soto-Muñoz, J.; Yañez, M.; Figueroa-San Martin, R. The right to comfort: A field study on adaptive thermal comfort in free-running primary schools in Chile. Build. Environ. 2017, 114, 455–469. [Google Scholar] [CrossRef]
- Rajkumar, S.; Amirtham, L.R.; Horrison, E. Thermal Comfort assessment of a Studio Classroom in Hot & Humid Climate Conditions. Proceedings of the International Conference on Urban Climate Jointly with 12th Symposium on the Urban Environment Volume 3, 2–7.
- Lamberti, G.; Salvadori, G.; Leccese, F.; Fantozzi, F.; Bluyssen, P.M. Advancement on Thermal Comfort in Educational Buildings: Current Issues and Way Forward. Sustainability 2021, 13, 10315. Available online: https://www.mdpi.com/2071-1050/13/18/10315 (accessed on 1 December 2022). [CrossRef]
- Evans, M. Design Thinking: Understanding How Designers Think and Work by Nigel Cross. Des. J. 2012, 15, 141–143. [Google Scholar] [CrossRef]
- EN ISO 8996; Ergonomics of the Thermal Environment—Determination of Metabolic Rate. British Standard Institution: London, UK, 2004; Volume 3.
- Wang, Y.; Kuckelkorn, J.; Zhao, F.-Y.; Spliethoff, H.; Lang, W. A state of art of review on interactions between energy performance and indoor environment quality in Passive House buildings. Renew. Sustain. Energy Rev. 2017, 72, 1303–1319. [Google Scholar] [CrossRef]
- ANSI/ASHRAE 55; Thermal Environmental Conditions for Human Occupancy. American Society for Heating, Refrigerating and Air Conditioning Engineers, Inc.: Atlanta, GA, USA, 2017; Volume 2017, p. 66.
- ISO 7730; Ergonomics of the Thermal Environment Analytical Determination and Interpretation of Thermal Comfort Using Calculation of the PMV and PPD Indices and Local Thermal Comfort Criteria. British Standard Institution: London, UK, 2005.
- Altomonte, S.; Schiavon, S. Occupant satisfaction in LEED and non-LEED certified buildings. Build. Environ. 2013, 68, 66–76. Available online: http://ced.berkeley.edu/ced/faculty-staff/stefano-schiavon/ (accessed on 2 September 2022). [CrossRef]
- Fanger, P.O. Thermal Comfort; Danish Technical Press: Copenhagen, Denmark, 1970. [Google Scholar]
- Alotaibi, B.S.; Lo, S.; Southwood, E.; Coley, D. Evaluating the suitability of standard thermal comfort approaches for hospital patients in air-conditioned environments in hot climates. Build. Environ. 2019, 169, 106561. Available online: https://linkinghub.elsevier.com/retrieve/pii/S0360132319307735 (accessed on 17 October 2022). [CrossRef]
- Indraganti, M.; Boussaa, D. Comfort temperature and occupant adaptive behavior in offices in Qatar during summer. Energy Build. 2017, 150, 23–36. [Google Scholar] [CrossRef]
- Van Hoof, J. Forty years of Fanger’s model of thermal comfort: Comfort for all? Indoor Air 2008, 18, 182–201. [Google Scholar] [CrossRef]
- Popovic, C. Teaching for Quality Learning at University, 2nd ed.; Innovations in Education and Teaching International; Routledge: London, UK, 2013; Volume 50, pp. 422–423. [Google Scholar]
- Zain, Z.M.; Taib, M.N.; Baki, S.M.S. Hot and humid climate: Prospect for thermal comfort in residential building. Desalination 2007, 209, 261–268. [Google Scholar] [CrossRef]
- Karjalainen, S. Thermal comfort and gender: A literature review. Indoor Air 2012, 22, 96–109. [Google Scholar] [CrossRef] [PubMed]
- Indraganti, M.; Ooka, R.; Rijal, H.B. Thermal comfort in offices in India: Behavioral adaptation and the effect of age and gender. Energy Build 2015, 103, 284–295. [Google Scholar] [CrossRef]
- Abdallah, A.S.H. Analysis of Thermal Comfort and Energy Consumption in Long Time Large Educational Halls (Studios), Assiut University, Egypt. Procedia Eng. 2015, 121, 1674–1681. [Google Scholar] [CrossRef]
- Fazio, P.; Ge, H.; Rao, J.; Desmarais, G. (Eds.) Research in Building Physics and Building Engineering; CRC Press: Boca Raton, FL, USA, 2020. [Google Scholar]
- Jiang, H.; Iandoli, M.; Van Dessel, S.; Liu, S.; Whitehill, J. Measuring students’ thermal comfort and its impact on learning. In Proceedings of the International Educational Data Mining Society, Montreal, QU, Canada, 2–5 July 2019; pp. 89–98. [Google Scholar]
- Fabozzi, M.; Dama, A. Field study on thermal comfort in naturally ventilated and air-conditioned university classrooms. Indoor Built. Environ. 2020, 29, 851–859. [Google Scholar] [CrossRef]
- Bajc, T.; Banjac, M.; Todorovic, M.; Stevanovic, Z. Experimental and statistical survey on local thermal comfort impact on working productivity loss in university classrooms. Therm. Sci. 2019, 23, 379–392. [Google Scholar] [CrossRef]
- Mishra, A.K.; Ramgopal, M. A thermal comfort field study of naturally ventilated classrooms in Kharagpur, India. Build. Environ. 2015, 92, 396–406. [Google Scholar] [CrossRef]
- Nico, M.A.; Liuzzi, S.; Stefanizzi, P. Evaluation of thermal comfort in university classrooms through objective approach and subjective preference analysis. Appl. Ergon. 2015, 48, 111–120. [Google Scholar] [CrossRef]
- Tao, Q.; Li, Z. Field Study and Adaptive Equation of Thermal Comfort in University Classrooms in the Subtropics in Winter. In Proceedings of the 8th International Symposium on Heating, Ventilation and Air Conditioning, Xi’an, China, 1 September 2014; pp. 121–129. [Google Scholar]
- Yao, R.; Liu, J.; Li, B. Occupants’ adaptive responses and perception of thermal environment in naturally conditioned university classrooms. Appl. Energy 2010, 87, 1015–1022. [Google Scholar] [CrossRef]
- Zeiler, W.; Boxem, G. Effects of thermal activated building systems in schools on thermal comfort in winter. Build. Environ. 2009, 44, 2308–2317. [Google Scholar] [CrossRef]
- Shi, Z.; Liu, Q.; Zhang, Z.; Yue, T. Thermal Comfort in the Design Classroom for Architecture in the Cold Area of China. Sustainability 2022, 14, 8307. [Google Scholar] [CrossRef]
- Wargocki, P.; Wyon, D.P. Providing better thermal and air quality conditions in school classrooms would be cost-effective. Build. Environ. 2013, 59, 581–589. [Google Scholar] [CrossRef]
- Lee, M.C.; Mui, K.W.; Wong, L.T.; Chan, W.Y.; Lee, E.W.M.; Cheung, C.T. Student learning performance and indoor environmental quality (IEQ) in air-conditioned university teaching rooms. Build. Environ. 2012, 49, 238–244. [Google Scholar] [CrossRef]
- Wang, D.; Song, C.; Wang, Y.; Xu, Y.; Liu, Y.; Liu, J. Experimental investigation of the potential influence of indoor air velocity on students’ learning performance in summer conditions. Energy Build. 2020, 219, 110015. [Google Scholar] [CrossRef]
- Barrett, P.; Davies, F.; Zhang, Y.; Barrett, L. The impact of classroom design on pupils’ learning: Final results of a holistic, multi-level analysis. Build. Environ. 2015, 89, 118–133. [Google Scholar] [CrossRef]
- Jiang, J.; Wang, D.; Liu, Y.; Di, Y.; Liu, J. A holistic approach to the evaluation of the indoor temperature based on thermal comfort and learning performance. Build. Environ. 2021, 196, 107803. [Google Scholar] [CrossRef]
- Lu, S.; Liu, Y.; Sun, Y.; Yin, S.; Jiang, X. Indoor thermal environmental evaluation of Chinese green building based on new index OTCP and subjective satisfaction. J. Clean Prod. 2019, 240, 118151. [Google Scholar] [CrossRef]
- Gao, J.; Wargocki, P.; Wang, Y. Ventilation system type, classroom environmental quality and pupils’ perceptions and symptoms. Build. Environ. 2014, 75, 46–57. [Google Scholar] [CrossRef]
- Jiang, J.; Wang, D.; Liu, Y.; Xu, Y.; Liu, J. A study on pupils’ learning performance and thermal comfort of primary schools in China. Build. Environ. 2018, 134, 102–113. [Google Scholar] [CrossRef]
- Puteh, M.; Ibrahim, M.H.; Adnan, M.; Che’Ahmad, C.N.; Noh, N.M. Thermal Comfort in Classroom: Constraints and Issues. Procedia-Soc. Behav. Sci. 2012, 46, 1834–1838. [Google Scholar] [CrossRef]
- Chen, Y.H.; Hwang, R.L.; Huang, K.T. Sensitivity analysis of envelope design on the summer thermal comfort of naturally ventilated classrooms in Taiwan. IOP Conf. Ser. Mater Sci. Eng. 2019, 609, 042035. [Google Scholar] [CrossRef]
- Waseem, M.; Lin, Z.; Ding, Y.; Wen, F.; Liu, S.; Palu, I. Technologies and Practical Implementations of Air-conditioner Based Demand Response. J. Mod. Power Syst. Clean Energy 2021, 9, 1395–1413. Available online: https://ieeexplore.ieee.org/document/9096505 (accessed on 19 September 2022). [CrossRef]
- Turunen, M.; Toyinbo, O.; Putus, T.; Nevalainen, A.; Shaughnessy, R.; Haverinen-Shaughnessy, U. Indoor environmental quality in school buildings, and the health and wellbeing of students. Int. J. Hyg. Environ. Health 2014, 217, 733–739. [Google Scholar] [CrossRef] [PubMed]
- Miller, S. Experimental Design and Statistics, 2nd ed.; Routledge: New York, NY, USA, 1984. [Google Scholar]
- Kestrel meter. Kestrel 5400 Heat Stress Tracker. Available online: https://kestrelmeters.com/products/kestrel-5400-heat-stress-tracker (accessed on 12 January 2022).
- EN ISO 7726; Ergonomics of the Thermal Environment—Instruments for Measuring Physical Quantities. British Standard Institution: London, UK, 2001.
- Richard, J.; de Dear, G.S.B. Developing an adaptive model of thermal comfort and preference. UC Berkeley Cent. Built Environ. 1998, 104, 145–167. Available online: https://escholarship.org/uc/item/4qq2p9c6 (accessed on 2 October 2022).
- Havenith, G.; Kuklane, K.; Fan, J.; Hodder, S.; Ouzzahra, Y.; Lundgren, K.; Au, Y.; Loveday, D. A Database of Static Clothing Thermal Insulation and Vapor Permeability Values of Non-Western Ensembles for Use in ASHRAE Standard 55, ISO 7730, and ISO 9920. In ASHRAE Transactions; ASHRAE: New York, NY, USA, 2015; pp. 197–215. Available online: http://www.techstreet.com/ashrae/products/1894263#jumps (accessed on 5 January 2022).
- EN ISO 9920; Ergonomics of the thermal environment—Estimation of thermal insulation and water vapour resistance of a clothing ensemble. British Standard Institution: London, UK, 2009; Volume 3.
- Jordan Meteorological Department, Department of Meteorology. [Internet]. Available online: https://portal.jordan.gov.jo (accessed on 2 January 2022).
- Faul, F.; Erdfelder, E.; Lang, A.-G.; Buchner, A. G*Power 3: A flexible statistical power analysis program for the social, behavioral, and biomedical sciences. Behav. Res. Methods 2007, 39, 175–191. Available online: http://link.springer.com/10.3758/BF03193146 (accessed on 7 June 2022). [CrossRef] [PubMed]
- Grace, D.; Weaven, S.; Bodey, K.; Ross, M.; Weaven, K. Putting student evaluations into perspective: The Course Experience Quality and Satisfaction Model (CEQS). Stud. Educ. Eval. 2012, 38, 35–43. [Google Scholar] [CrossRef]
- Albadra, D.; Vellei, M.; Coley, D.; Hart, J. Thermal comfort in desert refugee camps: An interdisciplinary approach. Build. Environ. 2017, 124, 460–477. [Google Scholar] [CrossRef]
- Ebert, J.F.; Huibers, L.; Christensen, B.; Christensen, M.B. Paper- or Web-Based Questionnaire Invitations as a Method for Data Collection: Cross-Sectional Comparative Study of Differences in Response Rate, Completeness of Data, and Financial Cost. J. Med. Internet Res. 2018, 20, e24. Available online: http://www.jmir.org/2018/1/e24/ (accessed on 11 December 2022). [CrossRef]
- Mason, J. Qualitative Researching; SAGE Publications Ltd.: London, UK, 2002. [Google Scholar]
- Bloor, M.; Wood, F. Keywords in Qualitative Methods, A Vocabulary of Research Concepts; SAGE Publications Ltd.: London, UK, 2006. [Google Scholar]
- Gebhardt A, Bivand R, Sinclair D. Interpolation Methods (Package ‘interp’) [Internet]. 2022. Available online: https://cran.r-project.org/web/packages/interp/interp (accessed on 2 February 2022).
- Shapiro, S.S.; Wilk, M.B. An analysis of variance test for normality (complete samples). Biometrika 1965, 52, 591–611. [Google Scholar] [CrossRef]
- Cohen, J. Statistical Power Analysis for the Behavioral Sciences, 2nd ed.; Lawrence Erlbaum Associates: New York, NY, USA, 1988; Volume 1, p. 53. [Google Scholar]
- Zimmerman, D.W. A Note on Interpretation of the Paired-Samples t Test. J. Educ. Behav. Stat. 1997, 22, 349. Available online: https://www.jstor.org/stable/1165289 (accessed on 3 January 2022). [CrossRef]
- Ferguson, C.J. An effect size primer: A guide for clinicians and researchers. Prof. Psychol. Res. Pract. 2009, 40, 532–538. Available online: http://doi.apa.org/getdoi.cfm?doi=10.1037/a0015808 (accessed on 8 February 2022). [CrossRef]
- Indraganti, M.; Boussaa, D. An adaptive relationship of thermal comfort for the Gulf Cooperation Council (GCC) Countries: The case of offices in Qatar. Energy Build. 2018, 159, 201–212. Available online: https://doi.org/10.1016/j.enbuild.2017.10.087 (accessed on 9 May 2022). [CrossRef]
- R Core Team. R: A Language and Environment for Statistical Computing; R Foundation for Statistical Computing: Vienna, Austria, 2019; Available online: https://www.r-project.org/ (accessed on 2 June 2020).
- Wickham, M.H.; Averick, J.; Bryan, W.C. Welcome to the Tidyverse. J. Open Source Softw. 2019, 4, 16–86. [Google Scholar] [CrossRef]
- Schweiker, M.; Mueller, S.; Kleber, M.; Kingma, B.; Shukuya, M. Package ‘Comf’ 2019. Available online: https://cran.r-project.org/web/packages/comf/comf.pdf (accessed on 27 July 2020).
- Claus, O.W. Cowplot: Streamlined Plot Theme and Plot Annotations for “ggplot2”; R package version 1.0.0 [Internet]. 2020. Available online: https://cran.r-project.org/package=cowplot (accessed on 8 July 2022).
- Lim, T.; Kim, D.D. Thermal Comfort Assessment of the Perimeter Zones by Using CFD Simulation. Sustainability 2022, 14, 15647. [Google Scholar] [CrossRef]
- Maaeda, S.; Fikry, M.A. Impact of glass facades on internal environment of buildings in hot arid zone. Alex. Eng. J. 2019, 58, 1063–1075. [Google Scholar]
- Altan, H.; Ward, I.; Mohelníková, J.; Vajkay, F. Daylight, Solar Gains and Overheating Studies in a Glazed Office Building. Int. J. Energy Environ. 2008, 2, 129–138. [Google Scholar]
- Seppanen, O.; Fisk, W.J.; Lei, Q. Effect of Temperature on Task Performance in Office Environment. Lawrence Berkeley Natl. Lab. 2006, 373, 77–81. Available online: https://linkinghub.elsevier.com/retrieve/pii/S0375960109004782 (accessed on 3 July 2022).
- Wargocki, P.; Wyon d Baik, Y.; Clausen g Fanger, O. Perceived air quality, sick building syndrome (SBS) symptoms and productivity in an office with two different pollution loads. Indoor Air 1999, 9, 165–179. [Google Scholar] [CrossRef]
- Kumar, S.; Singh, M.K.; Mathur, A.; Mathur, J.; Mathur, S. Evaluation of comfort preferences and insights into behavioural adaptation of students in naturally ventilated classrooms in a tropical country, India. Build. Environ. 2018, 143, 532–547. [Google Scholar] [CrossRef]
- Shahzad, S.; Brennan, J.; Theodossopoulos, D.; Calautit, J.K.; Hughes, B.R. Does a neutral thermal sensation determine thermal comfort? Build. Serv. Eng. Res. Technol. 2018, 39, 183–195. [Google Scholar] [CrossRef]
- Çelik, D.; Meral, M.E.; Waseem, M. Investigation and analysis of effective approaches, opportunities, bottlenecks and future potential capabilities for digitalization of energy systems and sustainable development goals. Electr. Power Syst. Res. 2022, 211, 108251. [Google Scholar] [CrossRef]
- Waseem, M.; Lin, Z.; Liu, S.; Sajjad, I.A.; Aziz, T. Optimal GWCSO-based home appliances scheduling for demand response considering end-users comfort. Electr. Power Syst. Res. 2020, 187, 106477. [Google Scholar] [CrossRef]
- AlWaer, H.; Speedie, J.; Cooper, I. Unhealthy Neighbourhood “Syndrome”: A Useful Label for Analysing and Providing Advice on Urban Design Decision-Making? Sustainability 2021, 13, 6232. Available online: https://www.mdpi.com/2071-1050/13/11/6232 (accessed on 6 May 2022). [CrossRef]
- AlWaer, H.; Rintoul, S.; Cooper, I. An investigation into decision-making and delivery activities following design-led events in collaborative planning. Archnet IJAR Int. J. Arch. Res. 2021, 15, 752–773. Available online: https://www.emerald.com/insight/content/doi/10.1108/ARCH-10-2020-0246/full/html (accessed on 5 February 2022). [CrossRef]


| Author, Year | Region | Climate | Season | Ventilation Type | Building Type | Class Rooms (n) | Students (n) | Monitored Days (n) | Outcomes |
|---|---|---|---|---|---|---|---|---|---|
| Sun et al., 2022 | China | Cold | W | MV | University | 1 | 587 | 4 | TSV and TPV in the afternoon were significantly higher than those in the morning. Students’ TSV was greatly affected by the pre-class activity. |
| Jiang et al., 2019 | China | - | MV | University | 1 | 25 | - | Changing the room temperature by a few degrees Celsius can significantly impact students’ self-reported TC. | |
| Fabozzi and Dama, 2020 | Italy | Temperate | S | M-M | University | 16 | 985 | - | In NV classrooms, the adaptive model was proven to be suitable for predicting students’ comfort zone according to ASHRAE 55 Standard. No significant differences in thermal comfort perception between genders. |
| Bajc et al., 2019 | Serbia | Temperate | W | M-M | University | 1 | 240 | 19 | Local thermal comfort is an important factor that can impact productivity. |
| Mishra and Ramgopal, 2015 | India | Hot–humid | All seasons | NV | University | 1 | 67 | 12 | Regression neutral temperature was found close to 29 °C. 80% of occupant satisfaction was found for temperatures between 22 and 31.5 °C. Occupant adaptive actions mostly focused on clothing variation and fan usage. |
| Nico et al., 2015 | Italy | Temperate | Spring | NV | University | 2 | 126 | 1 | A difference in thermal perception was found between women and men. |
| Tao and Li, 2014 | China | Cold and subtropics | W | NV | University | 640 | - | A new adaptive equation was developed, which could be used to predict the thermal response in classrooms in subtropics region. | |
| Fazio et al., 2020 | Italy | Temperate | W | NV | University | 3 | 959 | - | Female students who had a slightly lower metabolism reported more acceptance for the warm thermal environmental. |
| Shi et al., 2022 | China | Cold | W | MV | University | - | 89 | The PMV can predict the indoor thermal environment. | |
| Jiang., et al 2018 | China | Cold | W | MV | School | 26 | 781 | 4 | The comfort temperature of students in the classroom was found to be between 13.0 and 15.0 °C. |
| Wang et al., 2020 | China | Temperate | S | MV | School | 1 | 30 | 1 | Learning performance was more efficiently when the TSV was “slightly warm”. |
| Chen et al., 2019 | Taiwan | Temperate | S | NV | School | 400 | - | - | Building design parameter such window opening rate, ventilation rate, orientation, and external shading depth affected students’ TC. |
| Bluyssen et al., 2018 | Netherlands | Temperate | Spring | MV | School | 54 | 1311 | 15 | Physical building characteristics (e.g., location of school building, heating system, windows, and ventilation) can affect student TC. |
| Jiang et al., 2018 | China | Cold | W | MV | School | 1 | 12 | 60 | Thermal discomfort caused by high or low temperatures had a negative impact on pupil learning performance. |
| Barrett, 2015 | UK | Temperate | All seasons | M-M | School | 153 | 3766 | - | Individuality had an impact on students’ thermal perception. |
| Gao et al., 2014 | Denmark | Temperate | All seasons | MV | School | 4 | 81 | 60 | Perceptions of the indoor environment were more positive in the classroom that was ventilated by automatically operable windows with an exhaust fan in operation. |
| Turunen et al., 2014 | Finland | Continental | S–S | MV | School | 297 | 4248 | - | Most frequently reported IEQ factors causing daily inconvenience in classrooms were noise and stuffy air or poor IAQ. |
| Wargocki and wyon, 2013 | Denmark | Temperate | S | MV | School | 10 | 380 | 7 | The thermal and air quality conditions were below the recommended standards. |
| Puteh et al., 2012 | Malaysia | Tropical | - | NV | School | - | - | - | Students have high level of awareness regarding the climate change. |
| Lee et al., 2012 | Hong Kong | - | - | MV | School | 4 | 340 | 90 | TC, IAQ, and visual environment were the most reported aspects that can affect students learning performance. |
| Research Objective | Research method | |
|---|---|---|
| 1. | To assess and compare the indoor thermal conditions between the two types of university halls (i.e., DS and LR). Moreover, to investigate if the indoor thermal conditions in the two types of university halls comply with the recommended range by ASHRAE 55-2017 standard during the heating season. | Continuous on-site measurements of indoor thermal condition (i.e., , , RH, and ) for three months during winter + cross-sectional measures |
| 2. | To compare students’ thermal sensation vote (TSV), thermal preference vote (TPV), and predictive mean vote (PMV). | Surveying the same students within the two types of spaces using the ASHRAE 55 tool. |
| 3. | To investigate thermal adaptation strategies adopted by students in their university halls. | Surveying students + focus groups + qualitative observations |
| 4. | To assess and compare perceived learning performance between the two types of university halls (i.e., DS and LR). | Surveying the same students within the two types of university halls using the self-reported learning performance tool. |
| Hall ID | Area (m2) | Floor Level | Orientation | HVAC | Opening Area (m2) | Glazing Ratio to Wall (%) | Max. Density (n) | Window Type | Window Numb. and Orientation | Open/Close Windows |
|---|---|---|---|---|---|---|---|---|---|---|
| DS1 | 86 | 4th | S | M.M | 9.6 | 35.2 | 24 | Sliding | 2 S 2 W | √ |
| DS2 | 84.5 | 4th | S | M.M | 2.4 | 21.9 | 24 | Sliding | 2 S | √ |
| DS3 | 61.4 | 4th | S | M.M | - | - | 15 | - | - | - |
| LR1 | 85.6 | 5th | S | M.M | 9.6 | 35.2 | 63 | Sliding | 2 S 2 W | |
| DS4 | 84.1 | 5th | S | M.M | 4.8 | 21.6 | 21 | Sliding | 2 S | √ |
| DS5 | 84.5 | 5th | S | M.M | 4.8 | 21.6 | 21 | Sliding | 2 S | √ |
| DS6 | 66.2 | 5th | S | M.M | 13.8 | 66.0 | 21 | 1 Hopper 4 Fixed | 5 S | × |
| DS7 | 84.7 | 5th | S | M.M | 9.6 | 35.2 | 26 | Sliding | 2 S 2 E | √ |
| LR2 | 87 | 6th | S | M.M | 9.6 | 34.0 | 63 | Sliding | 2 S 2 W | √ |
| LR3 | 85 | 6th | S | M.M | 4.8 | 21.0 | 63 | Sliding | 2 S | √ |
| DS8 | 87 | 6th | S | M.M | 4.8 | 20.7 | 24 | Sliding | 2 S | √ |
| DS9 | 73 | 6th | S | M.M | 15.1 | 64.3 | 22 | 1 Hopper 4 Fixed | 5 S | × |
| DS10 | 69 | 6th | S | M.M | 15 | 67.6 | 23 | 1 Hopper 4 Fixed | 5 S | × |
| DS11 | 84.7 | 7th | S | M.M | 4.8 | 21.9 | 24 | 2 Sliding | 2 S | √ |
| DS12 | 70.2 | 7th | S | M.M | 14.7 | 67.6 | 20 | 3 Hopper 2 Fixed | 5 S | × |
| Data Type | Aspect | Investigated Variable | Unit | Measuring Tool |
|---|---|---|---|---|
| A. Objective data | 1. Indoor thermal conditions | Indoor air temperature (Ta) | (°C) | Temperature sensor Range: −29.0 to 70.0 °C Accuracy: 0.5 °C Resolution: 0.1 °C Time interval: 5 s |
| Indoor relative humidity (RH) | % | RH sensor Range: 10 to 90% 25°C noncondensing Accuracy: 2% RH Resolution: 0.1% RH Time interval: 5 s | ||
| Globe temperature (Tg) | (°C) | Black globe thermometer Ø 150 mm Range: −29.0 to 60.0 °C Accuracy: 1.4 °C Resolution: 0.1 °C Time interval: 5 s | ||
| Mean radiant temperature (Tr) | (°C) | Temperature sensor Range: −29.0 to 70.0 °C Accuracy: 0.5 °C Resolution: 0.1 °C Time interval: 5 s | ||
| Indoor air speed (Va) | ms−1 | 1 inch|25 mm diameter impeller Range: 0.6 to 40.0 m/s Accuracy: larger of 3% of reading, least significant digit or 20 ft/min Resolution: 0.1 m/s Time interval: 5 s | ||
| 2. Outdoor thermal conditions | Outdoor air temperature (Tout) | (°C) | General data collection * | |
| Outdoor RH (RHout) | % | |||
| B. Subjective data | 3. Students’ physiological factors | Metabolic rate | met | ASHRAE55-2017 and ISO 8996 |
| Clothing insulation | clo | ASHRAE55-2017 and ISO 9920 | ||
| Gender | (F, M) | |||
| Age | (Year) | |||
| Nationality | Jordanian, non-Jordanian | |||
| Education level Height Weight | BSC, MA M kg | |||
| 4. Students’ psychological factors | Students’ thermal adaptation strategies | Environmental Behavioural Withdrawal from classroom | Survey + observation logbook | |
| 5. Students’ thermal comfort | Thermal sensation vote (TSV) | [−3, +3] 7-point scale | ASHRAE55 survey | |
| Thermal preference vote (TPV) | [−3, +3] 7-point scale | |||
| Predictive mean vote (PMV) | [−0.05, +0.5] | |||
| 6. Students’ perceived learning performance | Self-appraisal | 5-point scale | Survey + focus group | |
| 7. Architectural design | Building envelope materials, HVAC systems, windows ratio, control over temperature, type of windows, and building orientation | Observation logbook |
| Variable | Month | |||
|---|---|---|---|---|
| Nov | Dec | Jan | ||
| (°C) | Max. | 20.0 | 15.0 | 13.0 |
| Min. | 10.0 | 6.00 | 4.00 | |
| Mean | 15.0 | 10.5 | 8.50 | |
| (%) | Max. | 61 | 70 | 73.0 |
| Min. | 49 | 60 | 65.0 | |
| Mean | 56 | 67 | 69.0 | |
| CDDs | 0.0 | 0.0 | 0.0 | |
| HDDs | 50 | 121 | 702 | |
| Sunshine hours (h) | 220 | 190 | 192 | |
| Solar radiation (KWh/m2) | 5.60 | 4.90 | 4.50 | |
| Gender | Education Level | Nationality | Age (y) | Clo | Met | Height | Weight | |||
|---|---|---|---|---|---|---|---|---|---|---|
| F | M | Bachelor | Master | Jordanian | Non- Jordanian | M ± SD | M ± SD | M ± SD | M ± SD | M ± SD |
| 51% | 49% | 94% | 6% | 81% | 19% | 22 ± 0.01 | 0.91 ± 0.21 | 1.24 ± 0.27 | 169.3 ± 3.9 | 69.7 ± 4.6 |
| DS | LR | ||||||||
|---|---|---|---|---|---|---|---|---|---|
| Variable | (μ ± SD) | (μ ± SD) | Δμ DS-LR | CI 99% | t | p-Value | Effect Size (d) | ||
| Ta (◦C) | 25.5 ± 1.43 | 22.4 ± 1.01 | 3.10 | 0.12 | 1.20 | −11.67 | 0.01 * | 0.61 | Large |
| Tr (◦C) | 25.3 ± 1.22 | 22.3 ± 1.1 | 3.01 | 0.85 | 0.96 | −13.89 | 0.00 ** | 0.55 | Medium |
| RH (%) | 29.4 ± 11.7 | 32.5 ± 4.6 | - 3.10 | 56.33 | 81.13 | −10.88 | 0.00 ** | 0.41 | Small |
| Variable | TSV | TPV | PMV |
|---|---|---|---|
| (μ ± SD) | 0.52 ± 1.56 | −0.41 ± 0.01 | 0.81 ± 0.49 |
| Recommended range | [−1, 1] | [−1, 1] | [−0.5, +0.5] |
| DS | 56.8% | 61.7% | 25.1% |
| LR | 64.7% | 65.4% | 52.9% |
| Overall | 58.3% | 64.7% | 30.6% |
| DS | LR | ||||||
|---|---|---|---|---|---|---|---|
| Variable | Reference Figure | (μ ± SD) | (μ ± SD) | Δμ DS-LR | p-Value | Effect Size | (Spearman Rho) |
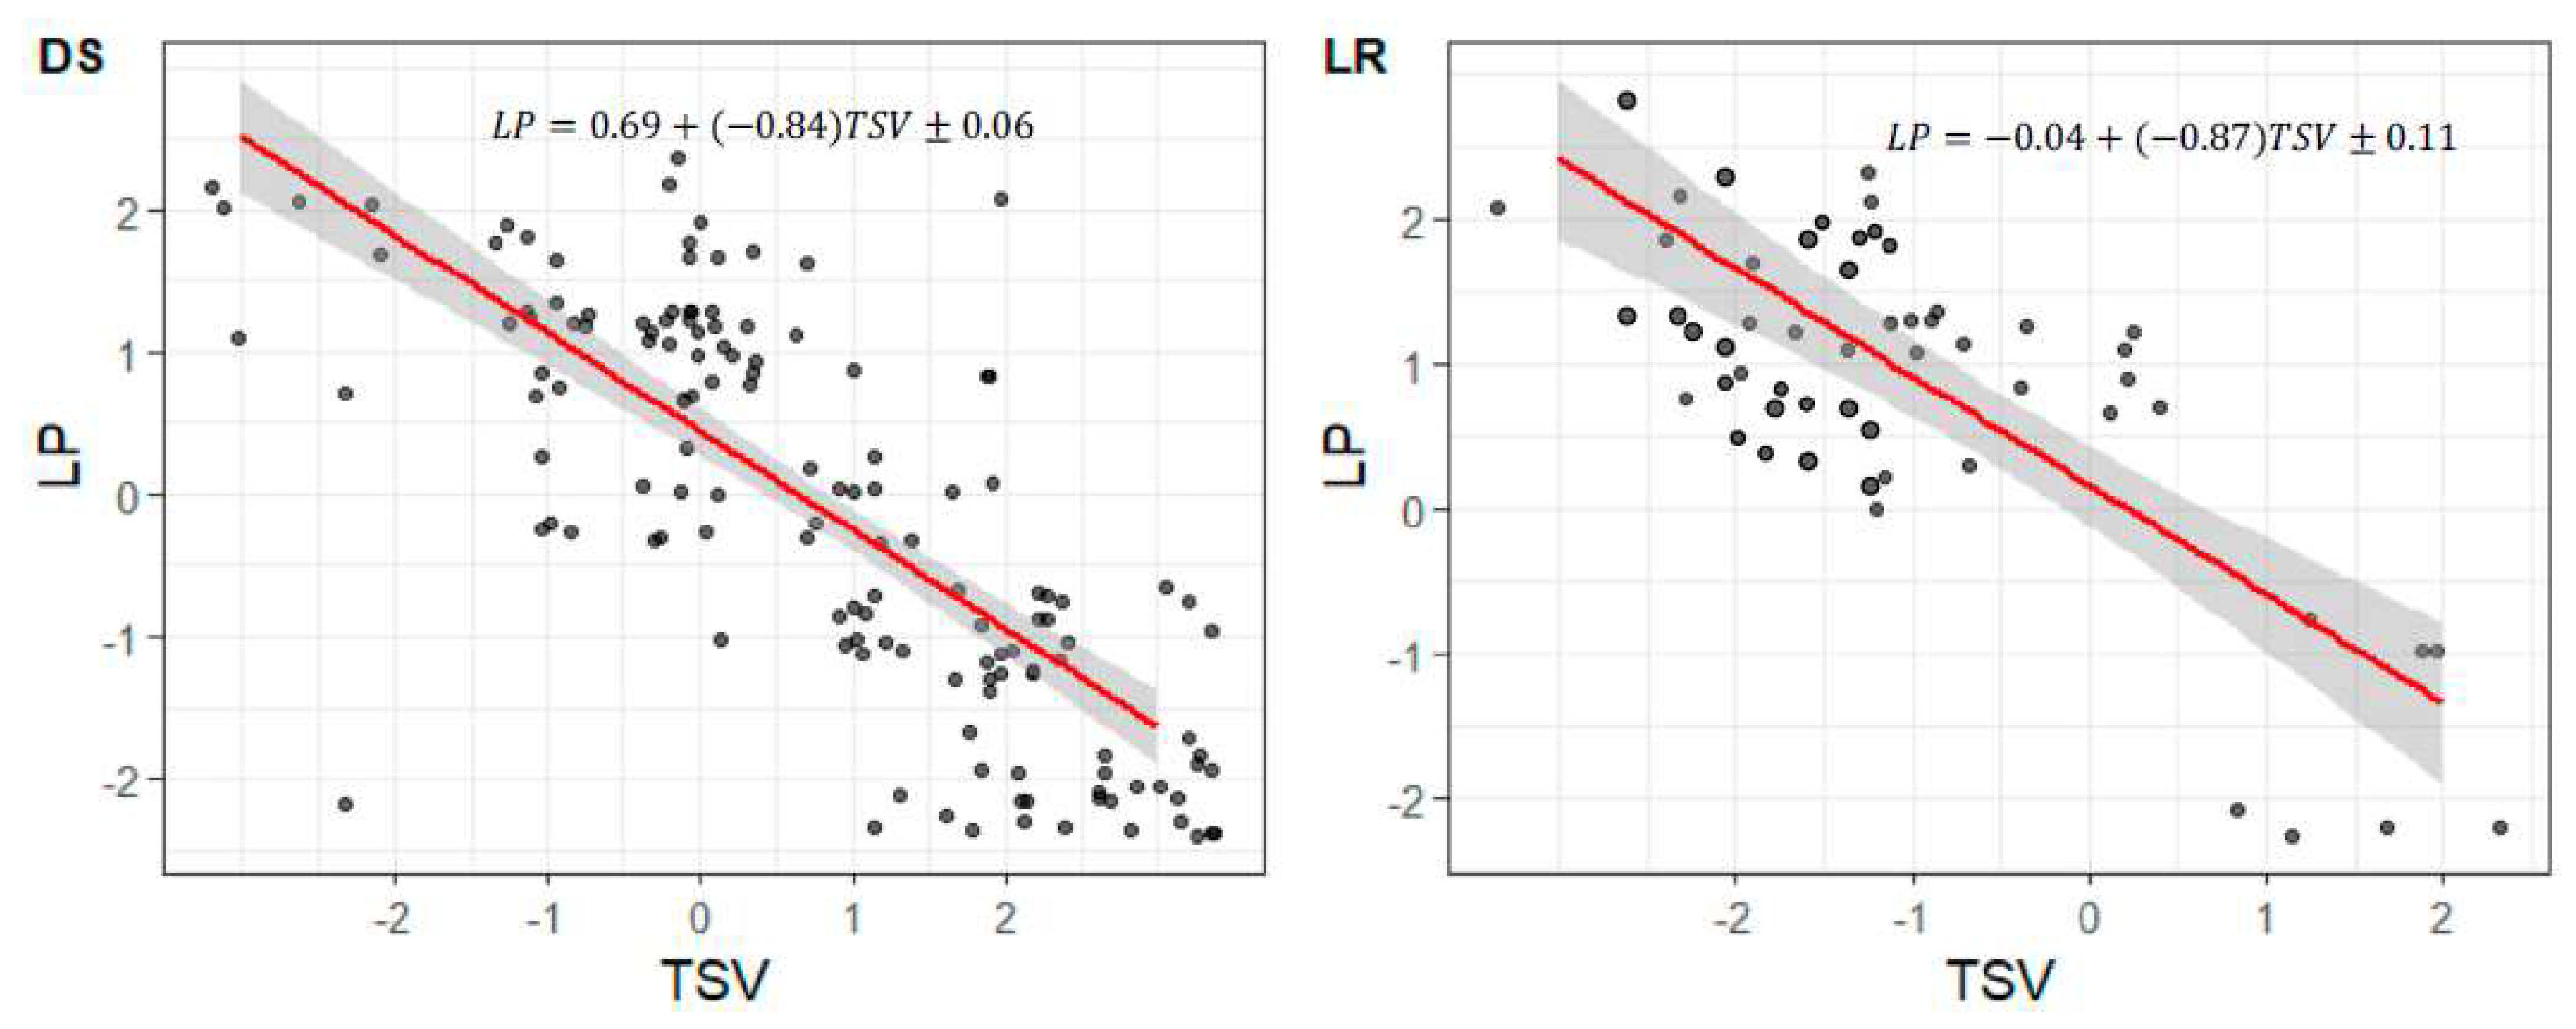
| TSV | Figure 8a | 0.78 ± 1.56 | −0.54 ± 1.33 | 1.32 | 0.00 *** | 0.51 | (Medium) |
| TPV | Figure 7b | −0.81 ± 0.71 | 0.92 ± 1.01 | −1.72 | 0.01 ** | 0.45 | (Small) |
| PMV | Figure 8b | 0.86 ± 0.46 | 0.61 ± 0.57 | 0.25 | 0.06 n.s. | 0.06 | (Negligible) |
| Perceived LP | Figure 10a | 0.31 ± 0.01 | 0.67 ± 0.12 | −0.36 | 0.01 ** | 0.62 | (Medium) |
Disclaimer/Publisher’s Note: The statements, opinions and data contained in all publications are solely those of the individual author(s) and contributor(s) and not of MDPI and/or the editor(s). MDPI and/or the editor(s) disclaim responsibility for any injury to people or property resulting from any ideas, methods, instructions or products referred to in the content. |
© 2023 by the authors. Licensee MDPI, Basel, Switzerland. This article is an open access article distributed under the terms and conditions of the Creative Commons Attribution (CC BY) license (https://creativecommons.org/licenses/by/4.0/).
Share and Cite
Elnaklah, R.; Ayyad, Y.; Alnusairat, S.; AlWaer, H.; AlShboul, A. A Comparison of Students’ Thermal Comfort and Perceived Learning Performance between Two Types of University Halls: Architecture Design Studios and Ordinary Lecture Rooms during the Heating Season. Sustainability 2023, 15, 1142. https://doi.org/10.3390/su15021142
Elnaklah R, Ayyad Y, Alnusairat S, AlWaer H, AlShboul A. A Comparison of Students’ Thermal Comfort and Perceived Learning Performance between Two Types of University Halls: Architecture Design Studios and Ordinary Lecture Rooms during the Heating Season. Sustainability. 2023; 15(2):1142. https://doi.org/10.3390/su15021142
Chicago/Turabian StyleElnaklah, Rana, Yara Ayyad, Saba Alnusairat, Husam AlWaer, and Abdulsalam AlShboul. 2023. "A Comparison of Students’ Thermal Comfort and Perceived Learning Performance between Two Types of University Halls: Architecture Design Studios and Ordinary Lecture Rooms during the Heating Season" Sustainability 15, no. 2: 1142. https://doi.org/10.3390/su15021142
APA StyleElnaklah, R., Ayyad, Y., Alnusairat, S., AlWaer, H., & AlShboul, A. (2023). A Comparison of Students’ Thermal Comfort and Perceived Learning Performance between Two Types of University Halls: Architecture Design Studios and Ordinary Lecture Rooms during the Heating Season. Sustainability, 15(2), 1142. https://doi.org/10.3390/su15021142