
Morphometric Evaluation and Its Incidence in the Mass Movements Present in the Chicamocha Canyon, Colombia


Abstract
1. Introduction
2. Regional Setting
3. Geological and Geomorphological Context
4. Materials and Methods
- (a)
- SCS–Ranser method: Tc = 0.97K0.385, , where Tc is the concentration time (hours), H is the difference between the highest and lowest elevation of the basin (feet) and Lc is the length of the main channel (km) [57].
- (b)
- California Culvert Practice method: Tc = , where Tc is the concentration time (hours), H is the difference between the highest and the lowest level of the basin (m) and Lc is the length of the main channel (km) [58].
- (c)
- Kirpich’s method: Tc = , where Tc is the concentration time (hours), L is the length of the main channel to the divide (km) and S0 is the average slope of the main channel (m/m) [59].
- (d)
- Témez’s method: Tc = , where Tc is the concentration time (hours), Lc is the length of the main channel (km) and S0 is the average slope of the main channel (in percentage) [60].
- (e)
- Giandotti’s method: Tc = , where Tc is the concentration time (hours), Lc is the length of the main channel (km), S0 is the average slope of the main channel (m/m) and A is the area of the basin (km2) [61].
- (f)
- V.T Chow’s method: Tc = , where Tc is the concentration time (hours), Lc is the length of the main channel (km), CM is the highest bound of the main channel (m.a.s.l.) and Cmc is the lowest bound of the main channel (m.a.s.l.) [56].
- (g)
- Clark’s method: Tc = , where Tc is the concentration time (hours), S0 is the average slope of the main channel (m/m) and A is the area of the basin (km2) [62].
- (h)
- Ventura–Heron method: Tc = , where Tc is the concentration time (hours), Lc is the length of the main channel (km) and S0 is the average slope of the main channel (in percentage) [63].
- (i)
- Passini’s method: Tc = , where Tc is the concentration time (hours), Lc is the length of the main channel (km), S0 is the average slope of the main channel (m/m) and A is the area of the basin (km2) [64].
5. Results
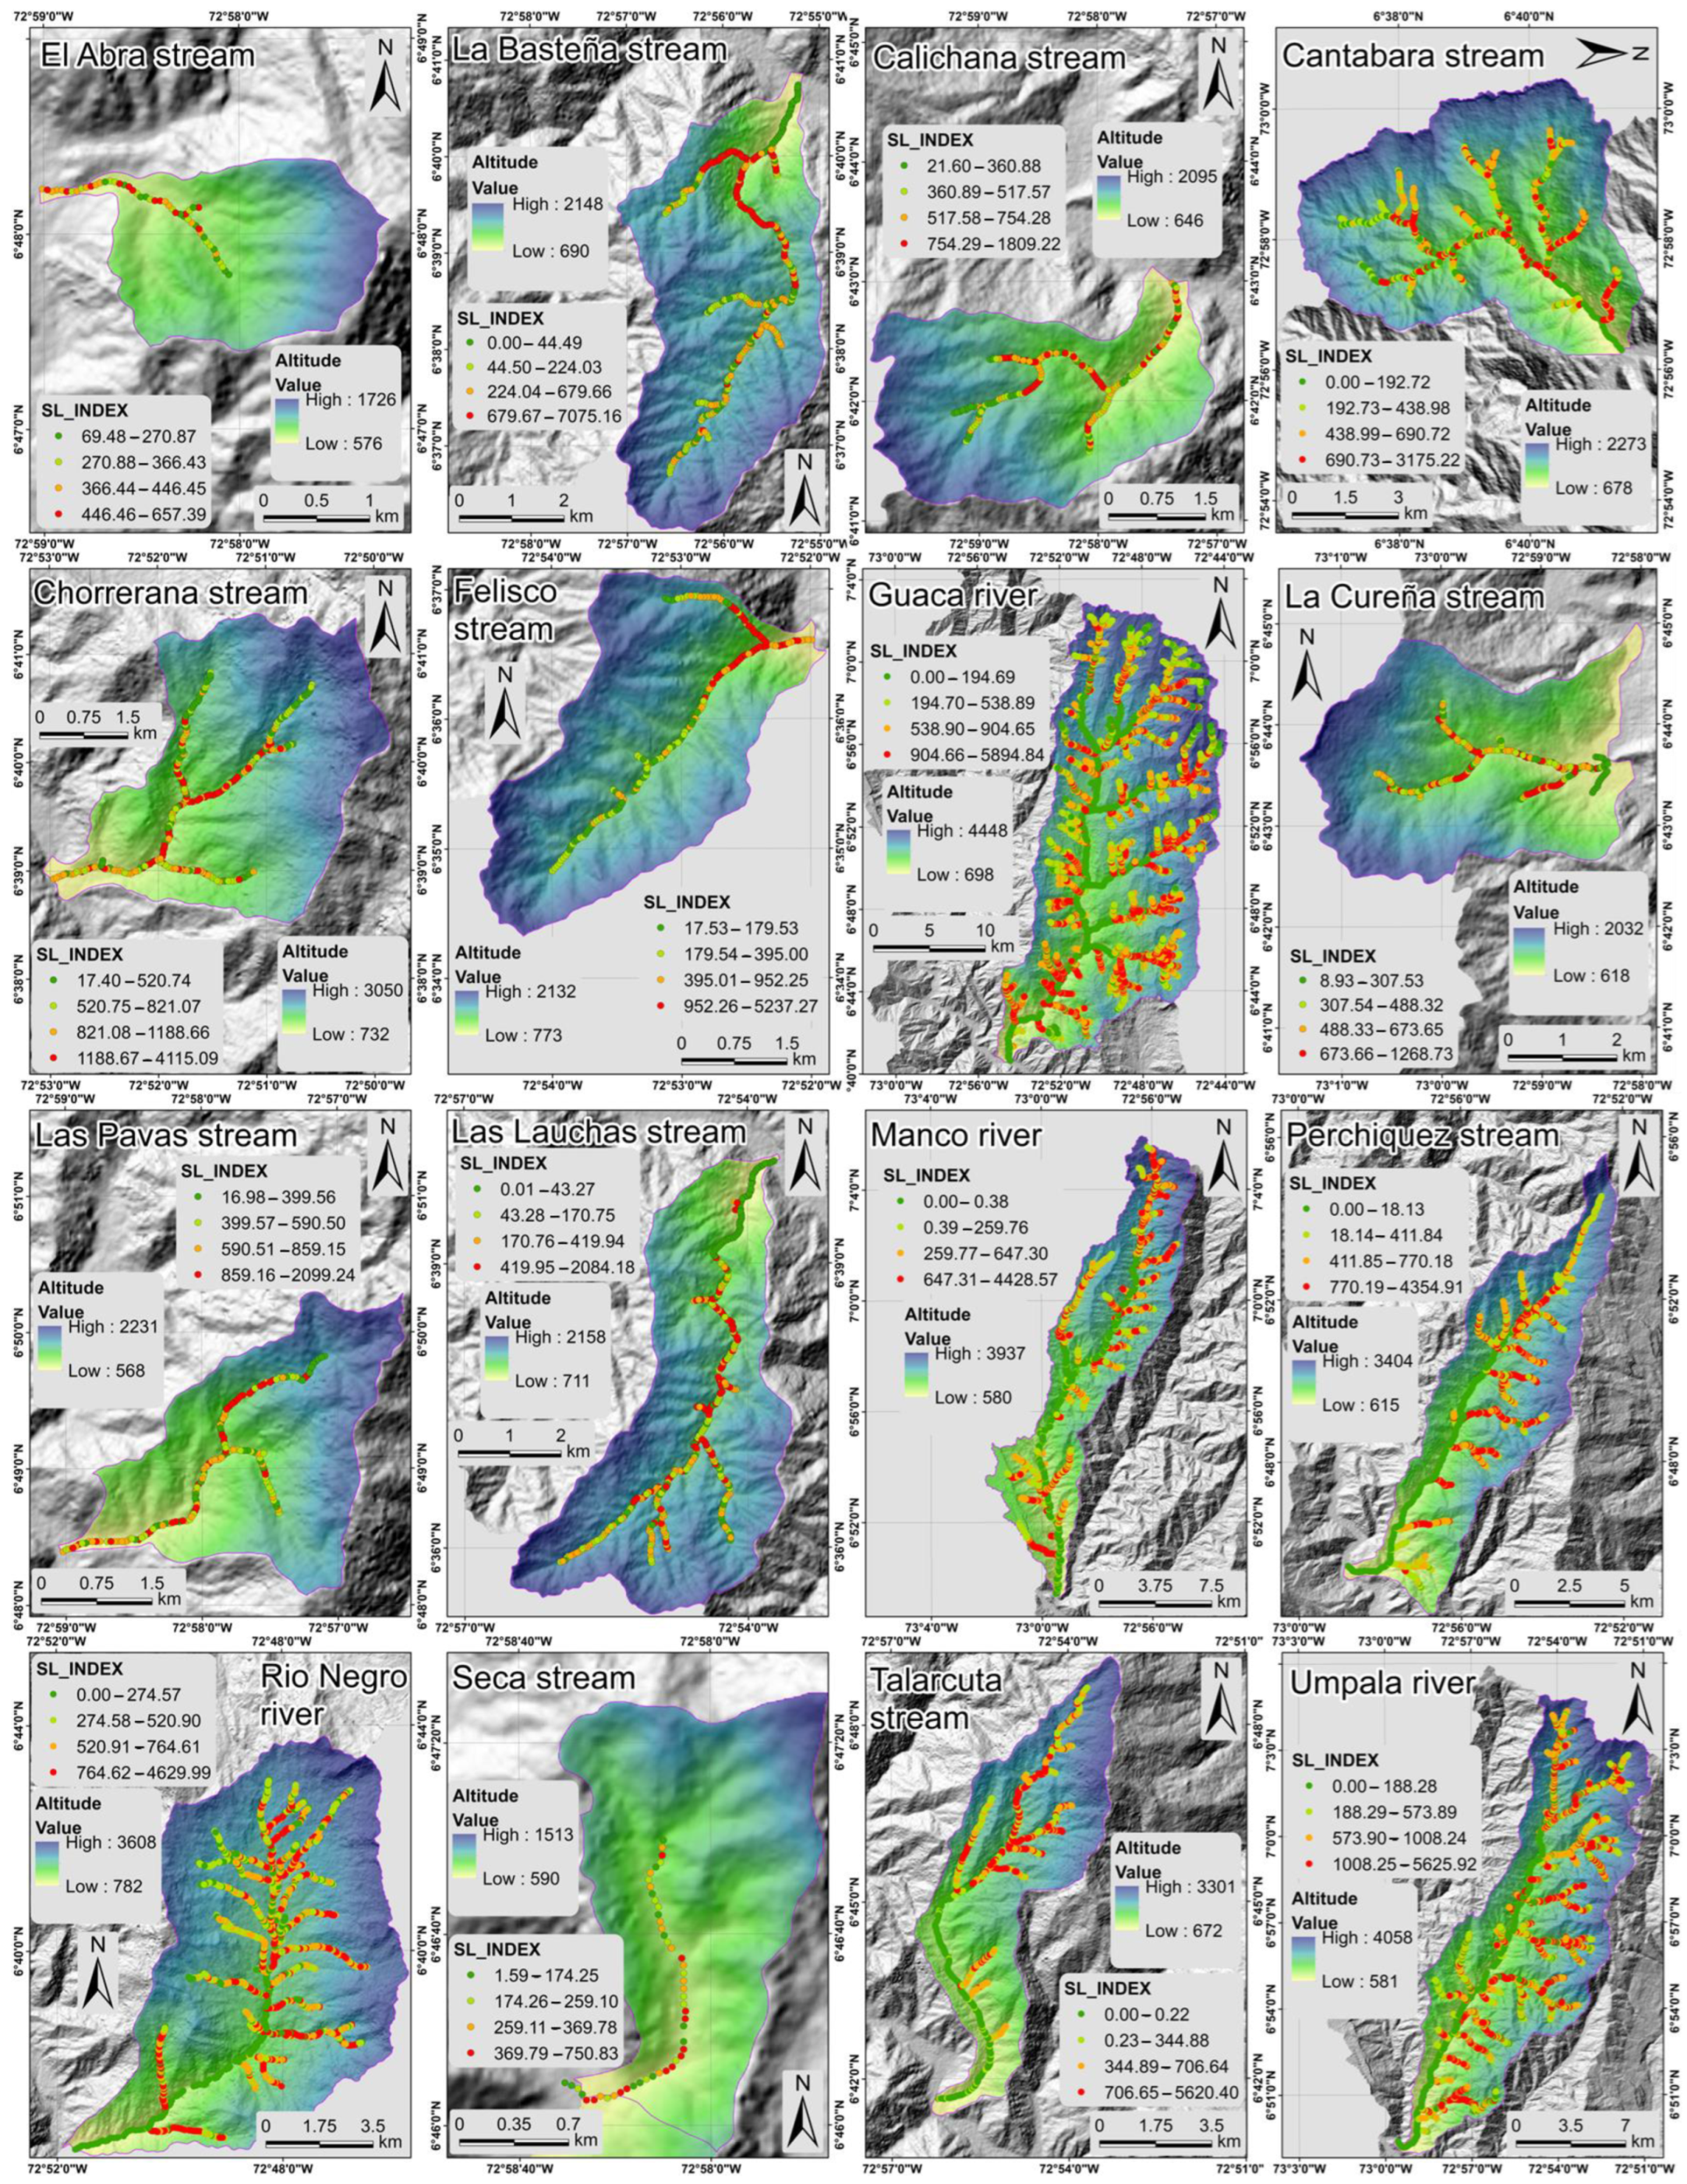
- The Manco River has the largest number of knickzones towards the upper part of the basin. It is related to a slope change and altitudinal difference. Due to high concentration of knickzones in this part of the basin, it is more susceptible to generate processes of erosion of the channel that can trigger events of the type of torrential flows.
- Umpalá River presents on its tributaries on the left bank (downstream) a high concentration of knickzones. This may be related to the stroke of Umpalá Fault and the tilting present in the basin.
- Guaca River presents a condition like that of Umpalá River, with the exception that the knickzones are concentrated in the upper parts of each tributary.
- The Rio Negro basin presents knickzones in several segments of the river, upper part of the basin, tributaries of the left surface (downstream) and the lower zone of the basin. It can be mainly related to the stroke of the Bucaramanga fault, in addition to multiple structures and lithologies present in the area.
- The Perchiquez stream basin has the same condition as that of the Umpalá, and the Talarcuta stream basin has a higher concentration of knickzones in the region of change in course of drainage. This change in direction and concentration of knickzones is associated with the stroke and kinematics of the Bucaramanga Fault.
- The other basins present on the right bank of Chicamocha River (downstream), such as the Seca, Chorrerana, Abra and Pavas streams, present a greater number of knickzones in the middle part of the basins. This is associated with a structural behavior (mainly the Bucaramanga fault), altitudinal difference and lithological change.
- The basins of the Calichana, Cantabara, Felisco, Cureña, Lauchas and Basteña streams (left bank of the Chicamocha River) have the highest concentration of knickzones in the middle part of each basin. These knickzones are associated with the structural behavior of the Bucaramanga fault, together with an altitudinal difference.
6. Discussion
7. Conclusions
Author Contributions
Funding
Institutional Review Board Statement
Informed Consent Statement
Data Availability Statement
Acknowledgments
Conflicts of Interest
References
- Intergovernmental Panel on Climate Change (IPCC). Climate change 2007: The Physical Science Basis. In Contribution of Working Group I to the Fourth Assessment Report of the Intergovernmental Panelon Climate Change; Solomon, S., Qin, D., Manning, M., Chen, Z., Marquis, M., Averyt, K.B., Tignor, M., Miller, H.L., Eds.; Cambridge University Press: Cambridge, UK, 2007. [Google Scholar]
- Gariano, S.L.; Guzzetti, F. Landslides in a changing climate. Earth Sci. Rev. 2016, 162, 227–252. [Google Scholar] [CrossRef]
- Alvioli, M.; Melillo, M.; Guzzetti, F.; Rossi, M.; Palazzi, E.; Hardenberg, J.; Peruccacci, S. Implications of climate change on landslide hazard in Central Italy. Sci. Total Environ. 2018, 630, 1528–1543. [Google Scholar] [CrossRef] [PubMed]
- Patton, A.I.; Rathburn, S.L.; Capps, D.M. Landslide response to climate change in permafrost regions. Geomorphology 2019, 340, 116–128. [Google Scholar] [CrossRef]
- Wood, J.L.; Harrison, S.; Reinhardt, L.; Taylor, F.E. Landslide databases for climate change detection and attribution. Geomorphology 2020, 355, 107061. [Google Scholar] [CrossRef]
- World Health Organization (WHO). Landslides. 2022. Available online: https://www.who.int/health-topics/landslides#tab=tab_1 (accessed on 18 March 2022).
- EM-DAT. Centre for Research on the Epidemiology of Disasters. Available online: https://www.emdat.be/ (accessed on 25 June 2022).
- University of Oxford. Our World in Data. Available online: https://ourworldindata.org/grapher/number-of-deaths-from-natural-disasters (accessed on 19 February 2022).
- Carolyn, K. Informing climate adaptation: A review of the economic costs of natural disasters. Energy Econ. 2014, 46, 576–592. [Google Scholar]
- Cuñado, J.; Ferreira, S. The Macroeconomic Impacts of Natural Disasters: New Evidence from Floods. In Agricultural and Applied Economics Association’s 2011; Ageconsearch: Pittsburgh, PA, USA, 2011; p. 25. [Google Scholar]
- Desinventar. Disaster Information Management System. Available online: https://www.desinventar.org/ (accessed on 30 December 2022).
- Dávid, L. Quarrying: An anthropogenic geomorphological approach. Acta Montan. Slovaca 2008, 13, 66–74. [Google Scholar]
- Szabó, J.; Dávid, L.; Lóczy, D. Anthropogenic Geomorphology: A Guide to Man-Made Landforms; Springer Science & Business Media: Berlin/Heidelberg, Germany, 2010. [Google Scholar] [CrossRef]
- Abedini, A.; Calagari, A.A. Geochemistry of claystones of the Ruteh Formation, NW Iran: Implications for provenance, source-area weathering, and paleo-redox conditions. Neues. Jahrb. Miner. Abh. 2017, 194, 107–123. [Google Scholar] [CrossRef]
- Abedini, A.; Khosravi, M. Geochemical constraints on the Zola-Chay river sediments, NW Iran: Implications for provenance and source-area weathering. Arab. J. Geosci. 2022, 15, 1515. [Google Scholar] [CrossRef]
- Strahler, A.N. Part II. Quantitative Geomorphology of Drainage Basins and Channel Networks. In Handbook of Applied Hydrology; McGraw-Hill: New York, NY, USA, 1964; pp. 4–39. [Google Scholar]
- Clarke, J.I. Morphometry from Maps: Essay in Geomorphology; Elsevier Publishing Co.: New York, NY, USA, 1996; pp. 235–274. [Google Scholar]
- Magesh, N.S.; Chandrasekar, N.; Soundranayagam, J.P. Morphometric evaluation of Papanasam and Manimuthar watersheds, parts of Western Ghats, Tirunelveli district, Tamil Nadu, India: A GIS approach. Environ. Earth Sci. 2011, 64, 373–381. [Google Scholar] [CrossRef]
- Silva, M.T.; da Silva, V.D.; de Souza, E.P. Morphometric analysis of the basin low middle São Francisco river. J. Hyperspectral Remote Sens. 2014, 4, 168–174. [Google Scholar] [CrossRef]
- Ehrenfried, L. Geographic information systems in mountain risk and disaster. Appl. Geogr. 2015, 63, 212–219. [Google Scholar]
- Gravelius, H. Flusskunde; Goschen’sche Verlagshandlung: Berlin, Germany, 1914. [Google Scholar]
- Horton, R.E. Drainage-basin characteristics. Trans. Am. Geophys. Union 1932, 13, 350–361. [Google Scholar] [CrossRef]
- Smith, K.G. Standards for grading texture of erosional topography. Am. J. Sci. 1950, 248, 655–668. [Google Scholar] [CrossRef]
- Schumm, S.A. Evolution of drainage systems and slopes in badlands at Perth Amboy, New Jersey. Geol. Soc. Am. Bull. 1956, 67, 597–646. [Google Scholar] [CrossRef]
- Bull, W.B.; Mcfadden, I.M. Tectonic geomorphology north and south of the Garlock Fault, California. Geomorphology 1977, 1, 15–32. [Google Scholar] [CrossRef]
- Verstappen, H.T. Applied Geomorphology: Geomorphologicai Surveys for Environmental Development; Elsevier: Amsterdam, The Netherlands, 1983. [Google Scholar]
- Gregory, J.K.; Walling, E.D. Drainage Basin Analysis; The Bath Press: Armadale, VIC, Australia, 1985. [Google Scholar]
- Maidment, D.R. Handbook of Hydrology; McGraw Hill: New York, NY, USA, 1992. [Google Scholar]
- IDEAM—Institute of Hydrology, Meteorology and Environmental Studies. Geoportal—IDEAM. Available online: http://www.ideam.gov.co/geoporta (accessed on 27 January 2022).
- IDEAM. Caracterización Climática de la Evapotranspiración de Referencia (ETo) en Colombia: Distribución Espacio-Temporal, Variabilidad Interanual y Afectación por el Fenómeno el Niño-Oscilación Sur (ENOS); IDEAM: Bogota, Colombia, 2019.
- Espinal, L.S. Zonas de Vida o Formaciones Vegetales de Colombia: Mapa Ecológico. In Memoria Explicativa Sobre el Mapa Ecológico; Instituto Geográfico Agustín Codazzi (IGAC): Bogota, Colombia, 1977; Volume 11, p. 13. [Google Scholar]
- Instituto Geográfico Agustín Codazzi—IGAC. Los Cañones Colombianos: Una Síntesis Geográfica; Ciaf, O., Guzmán, I.D.G., Eds.; IGAC: Bogota, Colombia, 2007.
- Rangel-Ch, J.O.; Cadena, A. Vegetation of the Chicamocha River Canyon (Santander, Colombia). Caldasia 2003, 25, 73–99. [Google Scholar]
- Ward, D.E.; Goldsmith, R.; Jimeno, A.; Cruz, J.; Restrepo, H.; Gómez, E. Geología de la Plancha 109 Rionegro; Ingeominas: Bogota, Colombia, 1977.
- Ward, D.E.; Goldsmith, R.; Cruz, J.; Jaramillo, L.; Vargas, R. Geología de la Plancha 110 Pamplona; Ingeominas: Bogota, Colombia, 1977.
- Ward, D.E.; Goldsmith, R.; Jimeno, A.; Cruz, J.; Restrepo, H.; Gómez, E. Geología de la Plancha 120 Bucaramanga; Ingeominas: Bogota, Colombia, 1977.
- Vargas, R.; Arias, A.; Jaramillo, L.; Tellez, N. Geología de la Plancha 136 Málaga; Ingeominas: Bogota, Colombia, 1984.
- González, O.P. Geología de la Plancha 135 San Gil; Ingeominas: Bogota, Colombia, 1985.
- Velandia, F.; Bermúdez, M. The transpressive southern termination of the Bucaramanga fault (Colombia): Insights from geological mapping, stress tensors, and fractal analysis. J. Struct. Geol. 2018, 115, 190–207. [Google Scholar] [CrossRef]
- Siravo, G.; Fellin, M.G.; Faccena, C.; Maden, C. Transpression and build-up of the cordillera: The example of the Bucaramanga fault (eastern cordillera, Colombia). J. Geol. Soc. 2020, 177, 14–30. [Google Scholar] [CrossRef]
- Naranjo, J.A.O.; Moreno, C.H.; Jaimes, E.M.T.; Santa, P.A.B. Modelo Geodinámico del Macizo de Santander; Ingeominas: Bogotá, Colombia, 2008.
- IGAC. Agustín Codazzi Geographical Institute. Datos Abiertos. Available online: https://geoportal.igac.gov.co/contenido/datos-abiertos-cartografia-y-geografia (accessed on 1 November 2021).
- ASF, A.P. Dataset: ASF DAAC 2015, ALOS PALSAR_Radiometric_Terrain_Corrected_Low_Res. Available online: https://asf.alaska.edu/data-sets/derived-data-sets/alos-palsar-rtc/alos-palsar-radiometric-terrain-correction/ (accessed on 1 November 2021).
- Hack, J.T. Studies of Longitudinal Stream Profiles in Virginia and Maryland; US Government Printing Office: Washington, DC, USA, 1957; Volume 294, p. 95.
- Strahler, A.N. Hypsometric (area-altitude) analysis of erosional topography. Geol. Soc. Am. Bull. 1952, 63, 1117–1142. [Google Scholar] [CrossRef]
- Horton, R.E. Erosional Development of Streams and Their Drainage Basins; Hydrophysical Approach to Quantitative Morphology. Geol. Soc. Am. Bull. 1945, 56, 275–370. [Google Scholar] [CrossRef]
- Diaz, M.A.R.; Bermúdez, F.L. Morfometría de Redes Fluviales: Revisión Crítica de los Parámetros Más Utilizados y Aplicación al alto Guadalquivir. Pap. Geogr. 1987, 12. Available online: https://revistas.um.es/geografia/article/view/42391 (accessed on 23 March 2022).
- Keller, E.A.; Pinter, N. Active tectonics. In Upper Saddle River; Prentice Hall: Hoboken, NJ, USA, 1996; Volume 338. [Google Scholar]
- Martonne, E. Traité de Geographie Physique; Armand Colin: Paris, France, 1940. [Google Scholar]
- Fournier, F. Climat et Erosion; Presses Universitaires de France: Paris, France, 1960; p. 201. [Google Scholar]
- Miller, V.C. A Quantitative Geomorphic Study of Drainage Basin Characteristics in the Clinch Mountain Area, Varginia and Tennessee; Project NR 389042; Technical Report 3; Columbia University, Department of Geology, ONR, Geography Branch: New York, NY, USA, 1953. [Google Scholar]
- Patton, P.C.; Baker, V.R. Morphometry and floods in small drainage basins subject to diverse hydrogeomorphic controls. Water Resour. Res. 1976, 12, 941–952. [Google Scholar] [CrossRef]
- Melton, M.A. The geomorphic and paleoclimatic significance of alluvial deposits in southern Arizona. J. Geol. 1965, 73, 1–38. [Google Scholar] [CrossRef]
- Piacentini, D.; Troiani, F.; Servizi, T.; Nesci, O.; Veneri, F. SLiX: A GIS Toolbox to Support Along-Stream Knickzones Detection through the Computation and Mapping of the Stream Length-Gradient (SL) Index. ISPRS Int. J. Geo Inf. 2020, 9, 69. [Google Scholar] [CrossRef]
- Perez, L. Fundamentos del Ciclo Hidrológico; Universidad Central de Venezuela: Caracas, Venezuela, 1979; Volume 38. [Google Scholar]
- Chow, V.T.; Maidment, D.R.; Mays, L.W.; Saldarriaga, J.G. Hidrología Aplicada; No. 551.48 C4H5; McGraw-Hill: Bogota, Colombia, 1994. [Google Scholar]
- Soil Conservation Service—SCS. Urban Hydrology for Small Watersheds; No. 55; Engineering Division, Soil Conservation Service, US Department of Agriculture: Washington, DC, USA, 1986.
- California Highways and Public Works. California Culvert Practice: Reprint of a Series of Technical Abstracts, 2nd ed.; Department of Public Works, Division of Highways, State of California: Sacramento, CA, USA, 1955.
- Kirpich, T.P. Time of Concentration of Small Agricultural Watersheds. J. Civil. Eng. 1940, 10, 362. [Google Scholar]
- Témez, J.R. Cálculo Hidrometeorológico de Caudales Máximos en Pequeñas Cuencas Naturales; Dirección General de Carreteras-MOPU: Madrid, Spain, 1978. [Google Scholar]
- Giandotti, M. Previsione delle Piene e delle Magre dei corsi D’acqua; Ministero dei LL. PP., Servizio Idrografico Italiano. Memorie e Studi Idrografici: Acireale, Italy, 1934; Volume 8. [Google Scholar]
- Clark, C.O. Storage and the unit hydrograph. Trans. Am. Soc. Civ. Eng. 1945, 110, 1419–1446. [Google Scholar] [CrossRef]
- Enderson, F.M.; Wooding, R.A. Overland flow and groundwater flow from a steady rain of finite duration. J. Geophys. Res. 1964, 69, 1531–1540. [Google Scholar] [CrossRef]
- Salimi, E.T.; Nohegar, A.; Malekian, A.; Hoseini, M.; Holisaz, A. Estimating time of concentration in large watersheds. Paddy Water Environ. 2017, 15, 123–132. [Google Scholar] [CrossRef]
- Hack, J.T. Stream-profile analysis and stream-gradient index. J. Res. Us Geol. Surv. 1973, 1, 421–429. [Google Scholar]
- Hack, J.T. Interpretation of Erosional Topography in Humid Temperate Regions; Bobbs-Merrill: Washington, DC, USA, 1960. [Google Scholar]
- Sala, M.; Gay, R. Algunos Datos Morfométricos de la Cuenca de Isábena. In Notes de Geografía Física; Department de Geografía, Universitat de Barcelona: Barcelona, Spain, 1981. [Google Scholar]
- García-Delgado, H.; Villamizar-Escalante, N.; Matthias, B. Recent tectonic activity along the Bucaramanga Fault System (Chicamocha River Canyon, Eastern Cordillera of Colombia): A geomorphological approach. Z. Geomorphol. 2019, 62, 199–215. [Google Scholar] [CrossRef]
- Velandia, F. Cinemática de las Fallas Mayores del Macizo de Santander—Énfasis en el Modelo Estructural y Temporalidad Al Sur de la Falla de Bucaramanga. Ph.D. Dissertation, Universidad Nacional de Colombia, Bogota, Colombia, 2017. [Google Scholar]
- Amaya, S.; Zuluaga, C.; Bernet, M. Different Levels of Exhumation Across the Bucaramanga Fault in the Cepitá Area of the Southwestern Santander Massif, Colombia: Implications for the Tectonic Evolution of the Northern Andes in Northwestern South America; The Geology of Colombia: Bogotá, Colombia, 2020; Volume 3. [Google Scholar]
- García-Delgado, H.; Villamizar-Escalante, N.; Bermúdez, M.A.; Bernet, M.; Velandia, F. Climate or tectonics? What controls the spatial-temporal variations in erosion rates across the Eastern Cordillera of Colombia? Glob. Planet. Chang. 2021, 203, 103541. [Google Scholar] [CrossRef]
- Thornthwaite, C.W. An approach toward a rational classification of climate. Geogr. Rev. 1948, 38, 55–94. [Google Scholar] [CrossRef]
- Albesiano, S.; Rangel-Ch, J.O. Estructura de la Vegetación del Cañón del río Chicamocha, 500–1200 m; Santandercolombia: Una Herramienta Para la Conservación; Caldasia: Santander, Colombia, 2006; pp. 307–325. [Google Scholar]
- Mejía, I.S. Geografía Económica de la Región Andina Oriental; Banco de la República: Cartagena de Indias, Colombia, 2010.
- Gómez-Heras, M.; Bernard, J.; Rafael, F. Surface temperature differences between minerals in crystalline. Geomorphology 2006, 78, 236–249. [Google Scholar] [CrossRef]
- Richter, C. Elementary Seismology; W.H. Freeman: San Francisco, CA, USA, 1958. [Google Scholar]
- Prieto, G.A.; Beroza, G.C.; Barrett, S.A.; López, G.A.; Florez, M. Earthquake nests as natural laboratories for the study of intermediate-depth earthquake mechanics. Tectonophysics 2012, 570, 42–56. [Google Scholar] [CrossRef]
- Gutenberg, B.; Richter, C.F. Earthquake magnitude, intensity, energy, and acceleration: (Second paper). Bull. Seismol. Soc. Am. 1956, 46, 105–145. [Google Scholar] [CrossRef]
- Kranz, R.L. Microcracks in rocks: A review. Tectonophysics 1993, 100, 449–480. [Google Scholar] [CrossRef]
- Vanguardia. La Avalancha en Piedecuesta Arrasó Con Todo. Available online: https://www.vanguardia.com/area-metropolitana/bucaramanga/la-avalancha-arraso-con-todo-FD2063766 (accessed on 26 February 2020).


| Methods of Calculating Morphometric Parameters | |||
|---|---|---|---|
| Morphometric Parameters | Methods | References | |
| Drainage Network | Area (km2) (A) | GIS Software | GIS processing |
| Perimeter (km) (P) | GIS Software | Schumm [24] | |
| Relative perimeter (Pr) | Pr = A/P | Schumm [24] | |
| Basin length (Lb) (km) | GIS Software | Schumm [24] | |
| Length area relation (Lar) | Lar = 1.4 × A0.6 | Hack [44] | |
| Stream order | Hierarchical Rank | Strahler [45] | |
| Stream number (Nu) | Nu = N1 + N2 … + Nn | Horton [46] | |
| Total stream order | Sum of Stream order | GIS processing | |
| Total stream length (Lu) (km) | Lu = L1 + L2 … + Ln | Strahler [16] | |
| Bifurcation ratio (Rb) | Rb= Nn/Nn + 1 | Strahler [16] | |
| Form factor (Rf) | Rf = A/Lb2 | Horton [22] | |
| Drainage Texture and Flow Mobility Analysis | Drainage density (Dd) | Dd = Lu/A | Horton [22] |
| Stream frequency (Fs) | Fs = Nu/A | Horton [22] | |
| Drainage texture (T) | T = Dd × Fs | Smith [23] | |
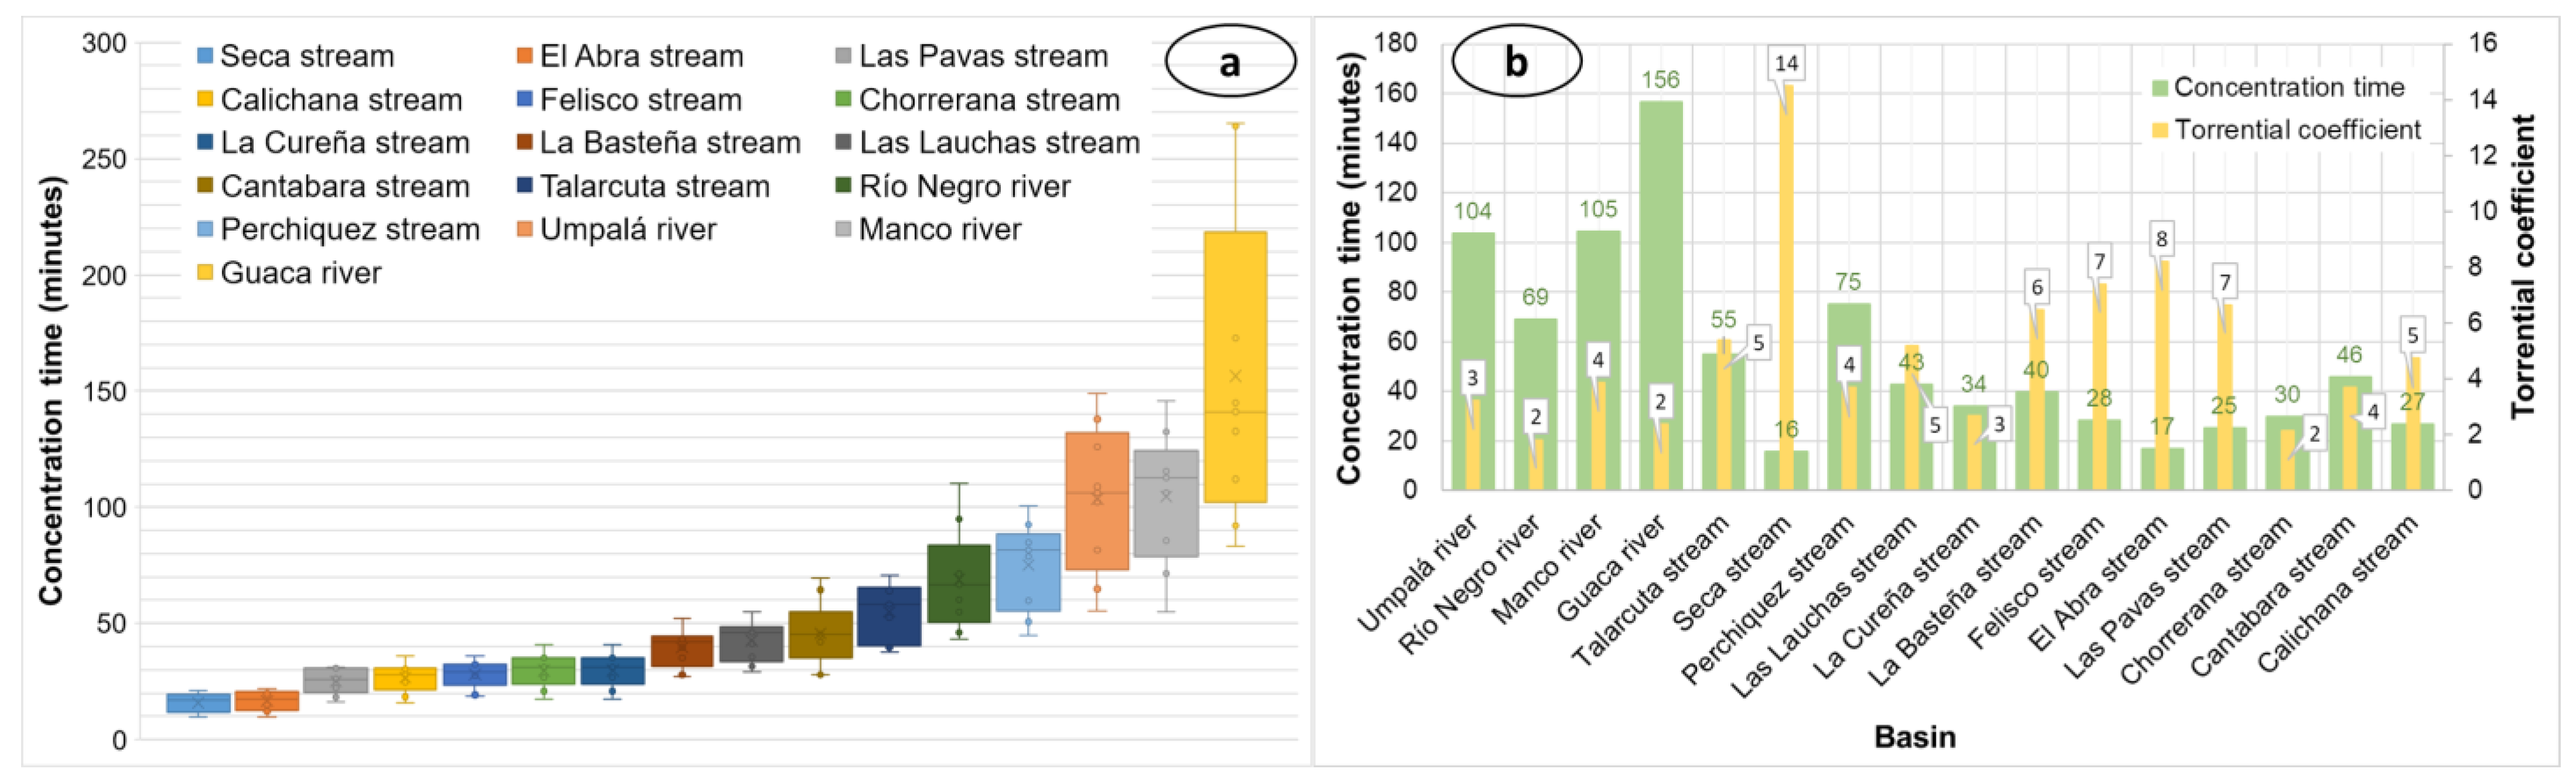
| Torrential coefficient (Ct) | Ct = Stream order 1/A | Romero Díaz [47] | |
| Basin concentration time (Tc) | Different equations | References in the text | |
| Relief Characterization | Average height of the basin (Hm) | ||
| Average slope (°) | GIS Analysis/DEM | GIS processing | |
| Average slope (%) | GIS Analysis/DEM | GIS processing | |
| Total basin relief (H) (m) | H = Z-z | Strahler [16] | |
| Relief ratio (Rhl) (m) | Rhl = H/Lb | Schumm [24] | |
| Asymmetry factor (Af) | Af = 100 × (Ar/A) | Keller and Pinter [48] | |
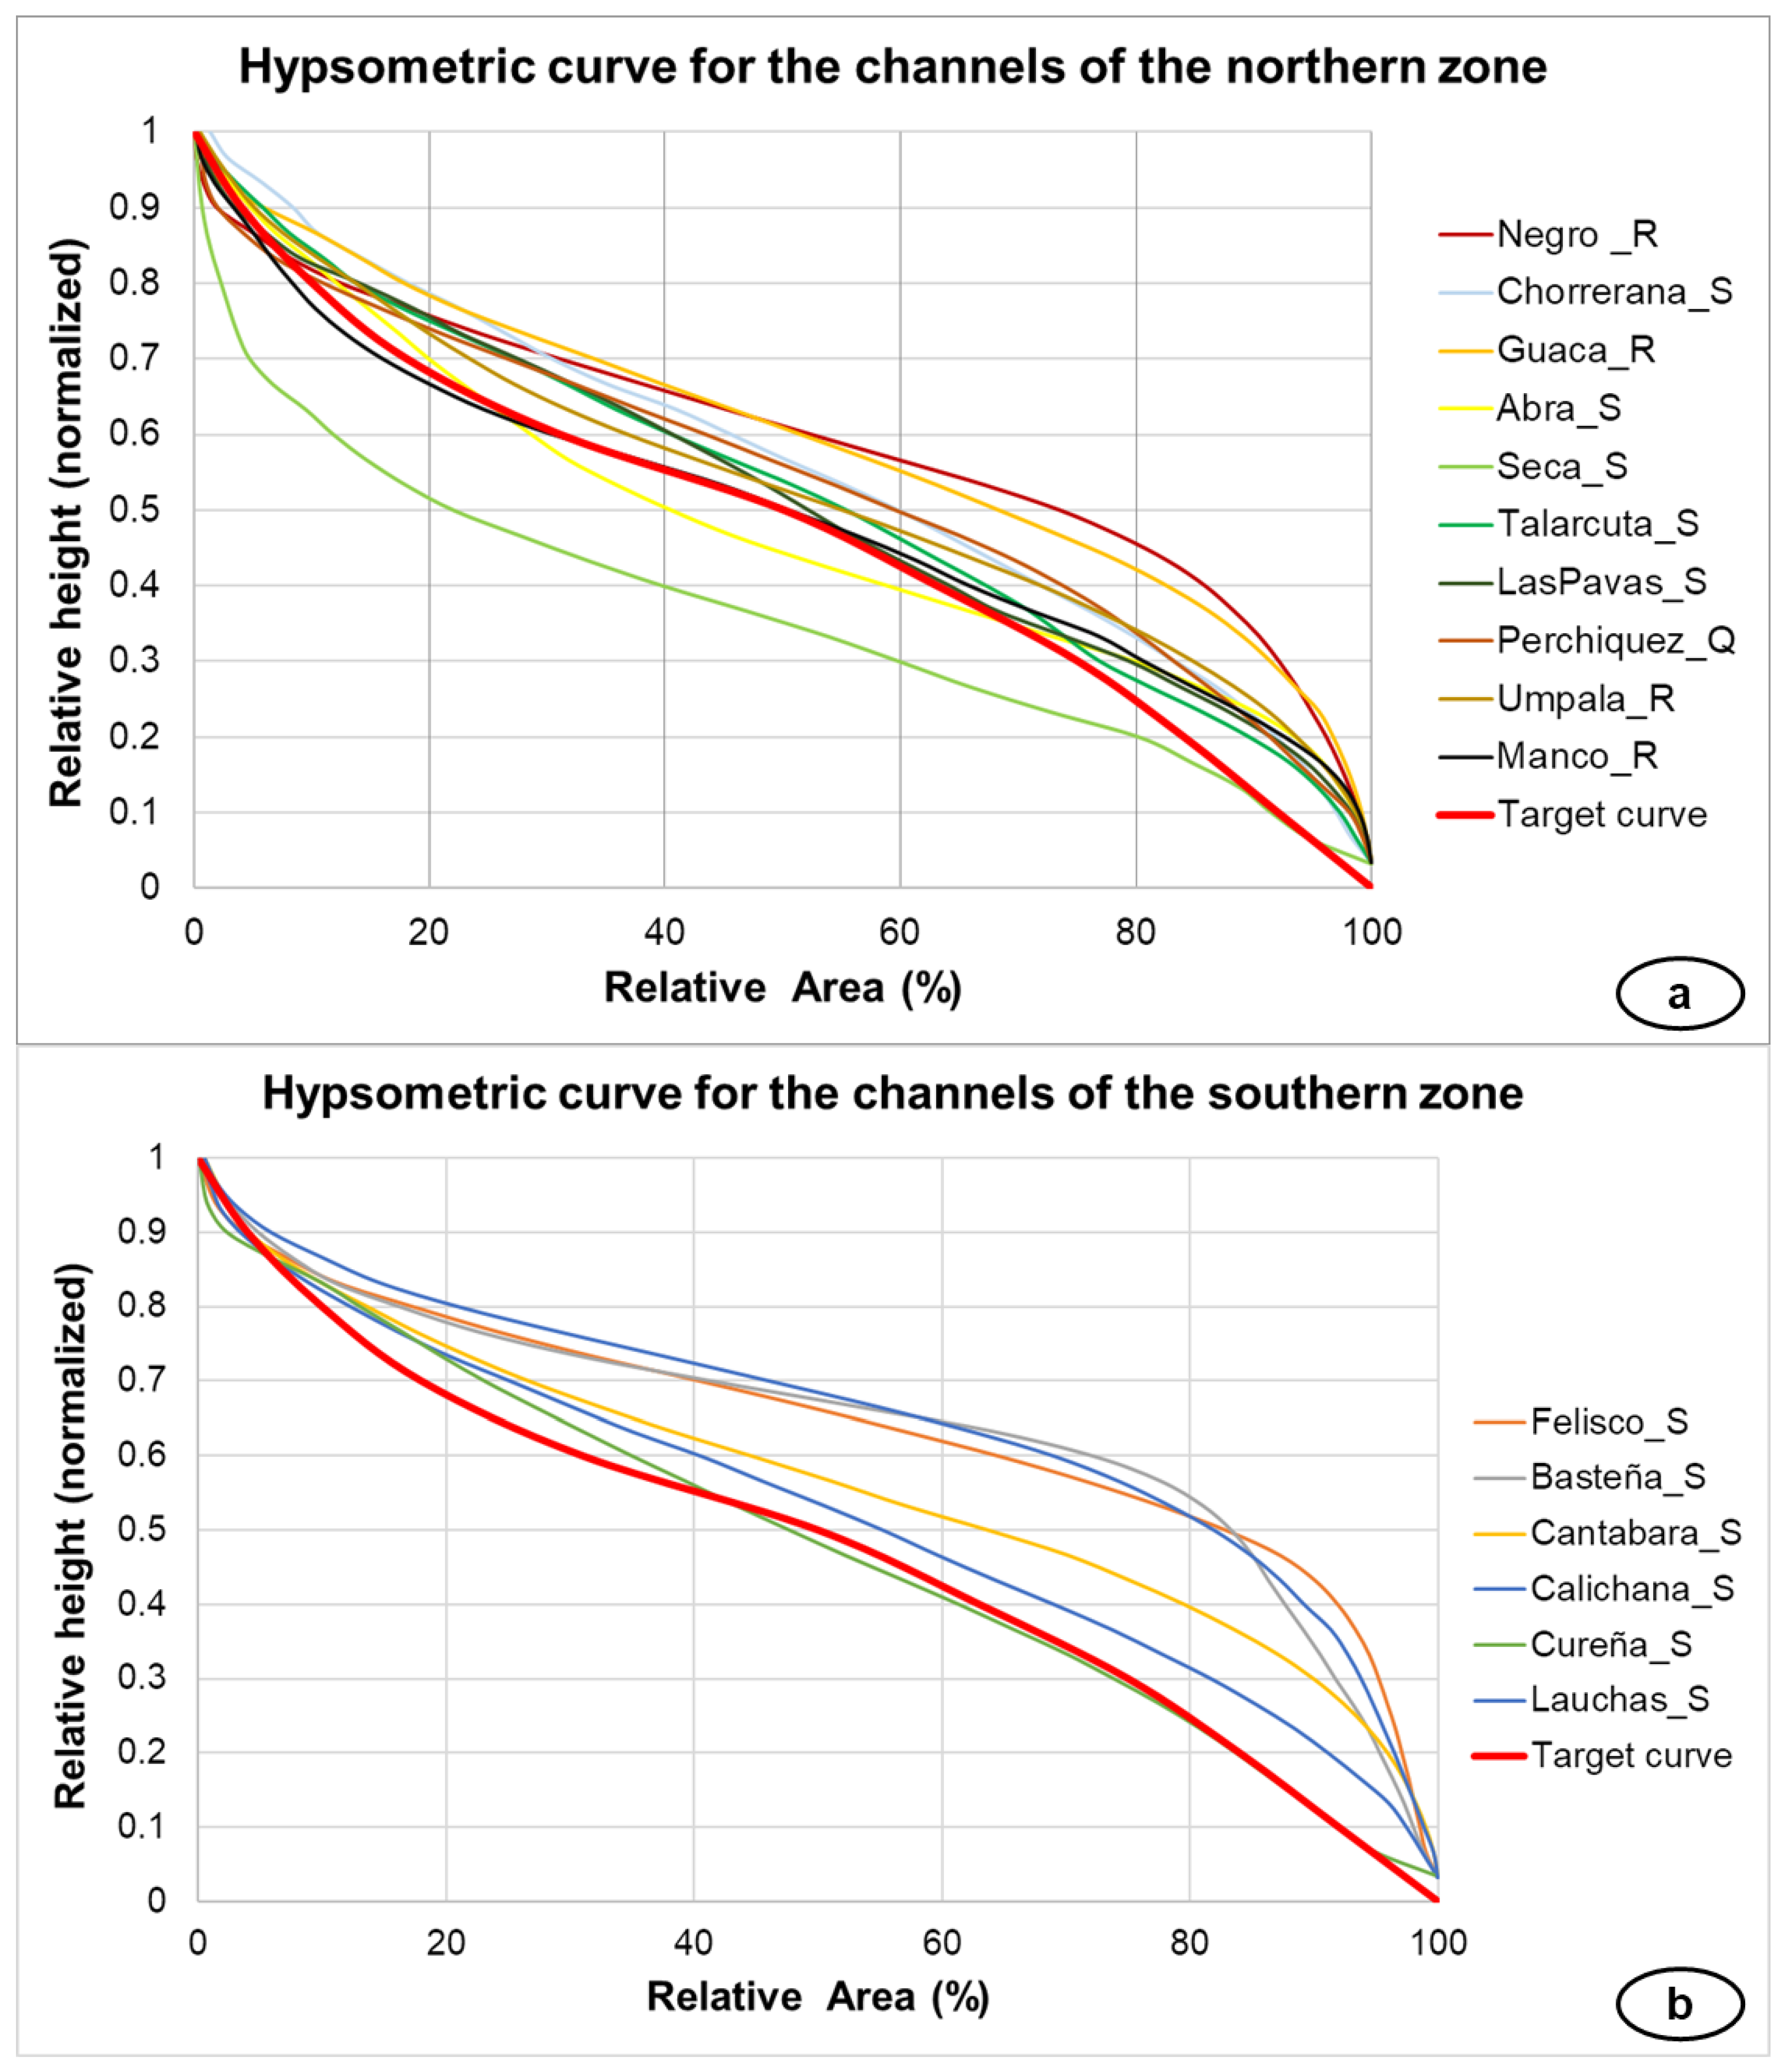
| Hypsometric curve | Area-altitude relates | Strahler [16] | |
| Compactness coefficient (Kc) | Kc = 0.28 × (P/√A) | Gravelius [21] | |
| Massive coefficient (Cm) | Cm = Hm/A | Martonne [49] | |
| Orographic coefficient (Co) | Co = ((Hm/1000)2)/A | Fournier [50] | |
| Elongation relation (Re) | Re = 1.128 × √A/L | Schumm [24] | |
| Circulatory ratio (Rc) | Rc = 4π × A/P2 | Miller [51] | |
| Sinuosity of mountain front (Smf) | Smf = Lmf/Ls | Bull and McFadden [25] | |
| Ruggedness number (Rn) | Rn = Dd × (H/1000) | Patton and Baker [52] | |
| Melton ruggedness number (MRn) | MRn = H/A0.5 | Melton [53] | |
| Stream length–gradient index (SL) | GIS Toolbox | Daniela Piacentini [54] | |
| Reason for valley width and valley height (Vf) | Vf = 2Vfw/[(Eld-Esc) + (Erd-Esc)] | Keller and Pinter [48] | |
| Basin | Area (km2) (A) | Perimeter (km) (P) | Relative Perimeter (Pr) | Basin Length (Lb) (km) | Length Area Relation (Lar) | Stream Order (max.) | Total Stream Order | Total Stream Length (Lu) (km) | Bifurcation Ratio (Rb) | Form Factor (Rf) | ||||
|---|---|---|---|---|---|---|---|---|---|---|---|---|---|---|
| 1–2 | 2–3 | 3–4 | 4–5 | 5–6 | ||||||||||
| Umpalá River | 205.58 | 86.27 | 2.38 | 30.19 | 34.19 | 5 | 881 | 663.90 | 3.9 | 4.9 | 3.5 | 10.0 | - | Elongated (0.23) |
| Río Negro River | 91.91 | 45.36 | 2.03 | 16.22 | 21.09 | 5 | 230 | 245.84 | 3.6 | 3.5 | 4.3 | 3.0 | - | Slightly elongated (0.35) |
| Manco River | 140.16 | 83.59 | 1.68 | 31.10 | 27.17 | 5 | 732 | 522.51 | 3.8 | 4.1 | 3.2 | 11.0 | - | Very elongated (0.14) |
| Guaca River | 529.52 | 123.82 | 4.28 | 40.69 | 60.32 | 6 | 1707 | 1524.53 | 4.0 | 3.2 | 3.2 | 5.0 | 6.0 | Slightly elongated (0.32) |
| Talarcuta stream | 39.11 | 37.79 | 1.03 | 15.30 | 12.63 | 5 | 270 | 168.75 | 4.8 | 4.4 | 2.5 | 4.0 | - | Very elongated (0.17) |
| Seca stream | 3.24 | 8.98 | 0.36 | 3.03 | 2.84 | 4 | 60 | 21.04 | 5.9 | 2.0 | 4.0 | - | - | Slightly elongated (0.35) |
| Perchiquez stream | 82.90 | 56.90 | 1.46 | 21.44 | 19.83 | 5 | 415 | 293.82 | 3.4 | 5.9 | 5.0 | 3.0 | - | Very elongated (0.18) |
| Las Lauchas stream | 24.69 | 26.31 | 0.94 | 9.86 | 9.59 | 5 | 180 | 121.32 | 3.9 | 2.4 | 3.5 | 4.0 | - | Elongated (0.25) |
| La Cureña stream | 19.43 | 21.56 | 0.90 | 6.98 | 8.30 | 5 | 81 | 63.42 | 2.4 | 5.5 | 2.0 | 2.0 | - | Neither elongated nor widened (0.4) |
| La Basteña stream | 23.04 | 23.17 | 0.99 | 8.93 | 9.20 | 5 | 201 | 117.15 | 4.1 | 3.0 | 4.0 | 3.0 | - | Elongated (0.29) |
| Felisco stream | 13.25 | 17.07 | 0.78 | 6.08 | 6.60 | 4 | 125 | 69.89 | 4.7 | 4.2 | 5.0 | - | - | Slightly elongated (0.36) |
| El Abra stream | 3.79 | 9.27 | 0.41 | 3.29 | 3.11 | 4 | 43 | 22.40 | 3.9 | 2.7 | 3.0 | - | - | Slightly elongated (0.35) |
| Las Pavas stream | 9.47 | 15.82 | 0.60 | 5.77 | 5.39 | 4 | 82 | 46.66 | 3.9 | 8.0 | 2.0 | - | - | Elongated (0.28) |
| Chorrerana stream | 18.16 | 20.48 | 0.89 | 6.87 | 7.97 | 4 | 62 | 48.51 | 2.6 | 2.1 | 7.0 | - | - | Neither elongated nor widened (0.39) |
| Cantabara stream | 52.03 | 32.84 | 1.58 | 9.23 | 14.99 | 5 | 248 | 189.20 | 4.9 | 3.3 | 3.0 | 4.0 | - | Widened (0.61) |
| Calichana stream | 12.83 | 16.96 | 0.76 | 5.47 | 6.47 | 4 | 75 | 85.77 | 6.1 | 3.3 | 3.0 | - | - | Neither elongated nor widened (0.43) |
| Basin | Average Height of the Basin (m) | Average Slope (°) | Average Slope (%) | Total Basin Relief (H) (m) | Relief Ratio (Rhl) (m) | Asymmetry Factor (Af) | Compactness Coefficient (Kc) | Massive Coefficient (Cm) | Orographic Coefficient (Co) | Elongation Relation (Re) | Circulatory Ratio (Rc) | Sinuosity of Mountain Front (Smf) | Ruggedness Number (Rn) | Melton Ruggedness Number (MRn) |
|---|---|---|---|---|---|---|---|---|---|---|---|---|---|---|
| Umpalá River | 2321.49 | 31.36 | 63.96 | 3477.00 | 115.19 | 25.86 | 1.70 | 11.29 | 0.08 | 0.54 | 0.35 | 1.50 | 11.23 | 0.24 |
| Río Negro River | 2369.52 | 23.08 | 45.00 | 2826.00 | 174.27 | 44.76 | 1.33 | 25.78 | 0.19 | 0.67 | 0.56 | 1.50 | 7.56 | 0.29 |
| Manco River | 2139.88 | 26.74 | 52.80 | 3357.00 | 107.93 | 50.29 | 1.99 | 15.27 | 0.11 | 0.43 | 0.25 | 1.37 | 12.51 | 0.28 |
| Guaca River | 2815.29 | 23.83 | 46.68 | 3750.00 | 92.16 | 32.66 | 1.52 | 5.32 | 0.04 | 0.64 | 0.43 | 1.41 | 10.80 | 0.16 |
| Talarcuta stream | 1963.93 | 29.68 | 59.67 | 2629.00 | 171.88 | 32.54 | 1.70 | 50.22 | 0.37 | 0.46 | 0.34 | 1.22 | 11.34 | 0.42 |
| Seca stream | 895.32 | 29.72 | 58.99 | 923.00 | 304.90 | 26.99 | 1.41 | 276.21 | 2.04 | 0.67 | 0.51 | 1.67 | 5.99 | 0.51 |
| Perchiquez stream | 2026.94 | 30.12 | 61.04 | 2789.00 | 130.07 | 34.06 | 1.76 | 24.45 | 0.18 | 0.48 | 0.32 | 1.17 | 9.88 | 0.31 |
| Las Lauchas stream | 1609.22 | 27.57 | 53.89 | 1447.00 | 146.73 | 53.91 | 1.49 | 65.17 | 0.48 | 0.57 | 0.45 | 1.43 | 7.11 | 0.29 |
| La Cureña stream | 1254.66 | 25.29 | 48.70 | 1414.00 | 202.64 | 43.48 | 1.38 | 64.58 | 0.48 | 0.71 | 0.53 | 1.65 | 4.62 | 0.32 |
| La Basteña stream | 1577.34 | 27.39 | 53.79 | 1458.00 | 163.19 | 39.85 | 1.36 | 68.45 | 0.51 | 0.61 | 0.54 | 1.28 | 7.41 | 0.30 |
| Felisco stream | 1601.00 | 30.49 | 60.88 | 1359.00 | 223.39 | 40.96 | 1.32 | 120.85 | 0.89 | 0.67 | 0.57 | 1.26 | 7.17 | 0.37 |
| El Abra stream | 1097.79 | 29.52 | 58.48 | 1150.00 | 349.16 | 64.83 | 1.34 | 289.87 | 2.14 | 0.67 | 0.55 | 1.22 | 6.80 | 0.59 |
| Las Pavas stream | 1379.42 | 31.13 | 63.12 | 1663.00 | 288.38 | 38.56 | 1.45 | 145.72 | 1.08 | 0.60 | 0.48 | 1.46 | 8.20 | 0.54 |
| Chorrerana stream | 1948.34 | 30.72 | 62.80 | 2318.00 | 337.60 | 46.81 | 1.36 | 107.31 | 0.79 | 0.70 | 0.54 | 1.13 | 6.19 | 0.54 |
| Cantabara stream | 1530.51 | 27.20 | 53.30 | 1595.00 | 172.86 | 34.69 | 1.28 | 29.41 | 0.22 | 0.88 | 0.61 | 1.71 | 5.80 | 0.22 |
| Calichana stream | 1361.16 | 28.12 | 54.90 | 1449.00 | 265.08 | 60.60 | 1.34 | 106.07 | 0.78 | 0.74 | 0.56 | 2.10 | 9.68 | 0.40 |
| Basin | Drainage Density (Dd) | Stream Frequency (Fs) | Drainage Texture (T) | Torrential Coefficient (Ct) | Basin Concentration Time. Methods (Result in Hours) | |||||||||
|---|---|---|---|---|---|---|---|---|---|---|---|---|---|---|
| Scs-Ranser | California Culvert Practice (1942) | Kirpich (1942) | Témez (1978) | Giandotti | V.T Chow | Clark | Ventura-Heron (1949) | Passini | Average | |||||
| Umpalá River | 3.23 | 4.29 | 13.84 | 3.23 | 1.36 | 2.10 | 1.08 | 1.81 | 0.92 | 1.70 | 2.30 | 1.77 | 2.48 | 1.73 |
| Río Negro River | 2.67 | 2.50 | 6.69 | 1.82 | 0.72 | 1.11 | 0.77 | 1.21 | 0.92 | 1.00 | 1.58 | 1.19 | 1.84 | 1.15 |
| Manco River | 3.73 | 5.22 | 19.47 | 3.87 | 1.43 | 2.20 | 1.19 | 1.92 | 0.92 | 1.77 | 1.94 | 1.88 | 2.43 | 1.74 |
| Guaca River | 2.88 | 3.22 | 9.28 | 2.38 | 1.87 | 2.88 | 1.54 | 2.42 | 1.39 | 2.21 | 4.42 | 2.35 | 4.40 | 2.61 |
| Talarcuta stream | 4.31 | 6.90 | 29.79 | 5.40 | 0.69 | 1.07 | 0.66 | 1.10 | 0.63 | 0.97 | 0.88 | 1.08 | 1.18 | 0.92 |
| Seca stream | 6.49 | 18.51 | 120.12 | 14.50 | 0.16 | 0.25 | 0.19 | 0.32 | 0.35 | 0.29 | 0.20 | 0.32 | 0.30 | 0.26 |
| Perchiquez stream | 3.54 | 5.01 | 17.74 | 3.70 | 1.00 | 1.54 | 0.85 | 1.41 | 0.75 | 1.31 | 1.36 | 1.38 | 1.67 | 1.25 |
| Las Lauchas stream | 4.91 | 7.29 | 35.82 | 5.18 | 0.52 | 0.81 | 0.49 | 0.80 | 0.59 | 0.77 | 0.69 | 0.79 | 0.92 | 0.71 |
| La Cureña stream | 3.26 | 4.17 | 13.61 | 2.68 | 0.35 | 0.55 | 0.39 | 0.63 | 0.60 | 0.56 | 0.61 | 0.62 | 0.79 | 0.57 |
| La Basteña stream | 5.08 | 8.72 | 44.34 | 6.47 | 0.47 | 0.72 | 0.45 | 0.74 | 0.59 | 0.70 | 0.66 | 0.73 | 0.87 | 0.66 |
| Felisco stream | 5.28 | 9.44 | 49.78 | 7.40 | 0.31 | 0.47 | 0.32 | 0.54 | 0.49 | 0.49 | 0.46 | 0.54 | 0.60 | 0.47 |
| El Abra stream | 5.91 | 11.35 | 67.15 | 8.19 | 0.16 | 0.25 | 0.20 | 0.34 | 0.36 | 0.29 | 0.22 | 0.34 | 0.33 | 0.28 |
| Las Pavas stream | 4.93 | 8.66 | 42.70 | 6.66 | 0.27 | 0.41 | 0.30 | 0.52 | 0.43 | 0.44 | 0.37 | 0.51 | 0.52 | 0.42 |
| Chorrerana stream | 2.67 | 3.41 | 9.12 | 2.15 | 0.29 | 0.44 | 0.35 | 0.59 | 0.52 | 0.47 | 0.55 | 0.59 | 0.68 | 0.50 |
| Cantabara stream | 3.64 | 4.77 | 17.33 | 3.69 | 0.47 | 0.72 | 0.47 | 0.76 | 0.76 | 0.70 | 1.07 | 0.75 | 1.16 | 0.76 |
| Calichana stream | 6.68 | 5.84 | 39.06 | 4.75 | 0.26 | 0.41 | 0.31 | 0.51 | 0.51 | 0.44 | 0.46 | 0.51 | 0.60 | 0.45 |
Disclaimer/Publisher’s Note: The statements, opinions and data contained in all publications are solely those of the individual author(s) and contributor(s) and not of MDPI and/or the editor(s). MDPI and/or the editor(s) disclaim responsibility for any injury to people or property resulting from any ideas, methods, instructions or products referred to in the content. |
© 2023 by the authors. Licensee MDPI, Basel, Switzerland. This article is an open access article distributed under the terms and conditions of the Creative Commons Attribution (CC BY) license (https://creativecommons.org/licenses/by/4.0/).
Share and Cite
Valencia Ortiz, J.A.; Martínez-Graña, A.M. Morphometric Evaluation and Its Incidence in the Mass Movements Present in the Chicamocha Canyon, Colombia. Sustainability 2023, 15, 1140. https://doi.org/10.3390/su15021140
Valencia Ortiz JA, Martínez-Graña AM. Morphometric Evaluation and Its Incidence in the Mass Movements Present in the Chicamocha Canyon, Colombia. Sustainability. 2023; 15(2):1140. https://doi.org/10.3390/su15021140
Chicago/Turabian StyleValencia Ortiz, Joaquín Andrés, and Antonio Miguel Martínez-Graña. 2023. "Morphometric Evaluation and Its Incidence in the Mass Movements Present in the Chicamocha Canyon, Colombia" Sustainability 15, no. 2: 1140. https://doi.org/10.3390/su15021140
APA StyleValencia Ortiz, J. A., & Martínez-Graña, A. M. (2023). Morphometric Evaluation and Its Incidence in the Mass Movements Present in the Chicamocha Canyon, Colombia. Sustainability, 15(2), 1140. https://doi.org/10.3390/su15021140