Article

Response of Photosynthetic Efficiency to Extreme Drought and Its Influencing Factors in Southwest China

1
College of Urban and Environmental Sciences, Northwest University, Xi’an 710127, China
2
Institute of Qinling Mountains, Northwest University, Xi’an 710127, China
3
Yellow River Institute of Shaanxi Province, Xi’an 710127, China
4
The Research Center of Soil and Water Conservation and Ecological Environment, Chinese Academy of Sciences and Ministry of Education, Yangling 712100, China
*
Authors to whom correspondence should be addressed.
Sustainability 2023, 15(2), 1095; https://doi.org/10.3390/su15021095
Submission received: 29 November 2022 / Revised: 19 December 2022 / Accepted: 3 January 2023 / Published: 6 January 2023
(This article belongs to the Section Sustainability in Geographic Science)

Abstract

:
In the context of the continuous change in global climate, the frequency and intensity of drought and heatwaves are increasing. This study took the extreme drought event in southwest China in 2009/2010 as a case study. Based on the sunlight-induced chlorophyll fluorescence (SIF), we explored the effects of high-temperature weather on the photosynthetic efficiency, the vegetation responses to drought in two ecosystems, and the differences in influencing factors. The results showed a disproportionate change between the vegetation productivity represented by SIF and the greenness symbolized by the leaf area index (LAI). The response of photosynthetic efficiency to drought was significantly inequitable between the grassland and cropland. The geodetector showed that grassland ecosystems with more superficial canopy structures were more susceptible to high temperature. The correlation between the Photosynthesis efficiency index (PEI) and temperature (T) and vapor pressure deficit (VPD) of the grassland ecosystem was above 0.6. This study suggests that drought exacerbates the disproportionate change between vegetation productivity and greenness, and grasslands are more vulnerable to drought. The result is helpful for ecosystem management.

1. Introduction

In the context of a changing global climate, the duration and frequency of drought continue to threaten global vegetation and carbon uptake [1,2]. Over the past 20 years, the droughts and heat waves occurring in many countries and regions have had extensive and far-reaching effects on crop growth, regional vegetation, and human life [3,4]. For example, extreme drought during the 2001–2012 growing season in Ukraine dropped grain yield by 40 percent compared to previous decades [5]; heat waves in the IGP region of India in 2010 caused a significant reduction in wheat yields [6]. A severe high-temperature event occurred in the North China Plain during the summer maize growing season in 2014 [7]. Drought and heat waves have become devastating extreme climate events that continue to threaten human society on a regional and global scale [8,9].
Vegetation can regulate the energy exchange between the land and the atmosphere and affect the global carbon-water cycle [10,11,12]. The photosynthesis of the vegetation closely couples with the carbohydrate flux. Studies show that climate change and human activities work together to contribute to the changes in ecosystem structure and function [13,14,15]. For example, when drought occurs, vegetation is suddenly exposed to high temperatures, especially during the growing season, and cell damage leads to a decline in vegetation productivity [6]. Globally, extreme drought reduces net primary productivity (NPP), and high temperatures can weaken terrestrial carbon sinks [16,17]. The simultaneous improvement in the greening degree and productivity was widely recognized over the past few years [18,19]. However, it remains unclear whether the positive correlation between green vegetation greening and productivity changes in the contemporary context of frequent extreme drought events.
The traditional vegetation index based on the green-degree can detect potential photosynthesis and understand vegetation growth [19,20]. The normalized vegetation index (NDVI) and the enhanced vegetation index (EVI) were widely used for vegetation monitoring. In recent years, with the continuous development of remote sensing technology, the emerging sun-induced chlorophyll fluorescence (SIF) index provided great convenience in monitoring the vegetation at the regional and global scale [12,21]. Sunlight-induced chlorophyll fluorescence can serve as a direct proxy for photosynthesis to characterize the actual physiological conditions of vegetation [22,23,24]. Recently, that the relationship between vegetation greenness and productivity is not positive was pointed out by some researchers, especially on a short time scale, where changes are inconsistent, and using traditional vegetation green-based indices to represent vegetation productivity is not always effective [25,26]. For instance, Southern China experienced a heat wave in 2013; Wang found that EVI was slow to respond to environmental pressure and did not capture changes in vegetation’s physiological state in time [27]. In southwestern North America, EVI failed to capture seasonal and interannual gross primary productivity (GPP) dynamics in dryland ecosystems [25]. Chen found a significant association between SIF and GPP, while the NDVI did not respond very well to changes in system productivity during the severe drought that occurred during the growth period of the North China Plain [7]. Studies show that the sensitivity of vegetation productivity to environmental change is higher than that of greenness [7,21,27,28]. Our understanding of the relationship between photosynthesis and plant greenness is not comprehensive. Under the conditions of constant environmental changes, especially drought, the impact of the relationship between actual vegetation productivity and canopy greenness, and whether there are differences in this relationship under different ecosystems, is still unknown.
The Leaf Area Index (LAI) refers to the multiple that the total area of plant leaves occupies the land area on the unit land area [29]. It is used to characterize the leaf density and canopy structure and reflect the structural parameters of vegetation. The Leaf Area Index is a good indicator of vegetation greenness or leaf biomass [30]. In our study, SIF, as a proxy for vegetation photosynthesis, could directly represent vegetation productivity, and the LAI is an indicator of vegetation greenness. We adopted the approach of Wei, using the ratio of the system productivity and vegetation green degree (SIF/LAI) to define the new indicator PEI (photosynthetic efficiency index) [31]. The photosynthetic efficiency index represents the unit leaf area light and capacity of photosynthesis. We focused on the extreme drought events in 2009/2010 in southwest China to explore the trend and spatial distribution of vegetation photosynthetic efficiency in southwest China. More importantly, we want to explore the impact of drought on vegetation and the difference in the factors affecting photosynthesis in different ecosystems. Further, we will study the drought from the following three aspects: (1) to confirm the range and time of drought based on the SPEI and meteorological index; (2) to determine the changing trend in the PEI from 2001 to 2015 and the spatial pattern change of the drought period in southwest China; (3) to explore the disparate influencing factors of vegetation photosynthesis in different ecosystems during extreme drought based on the geodetector.

2. Materials and Methods

2.1. Study Area

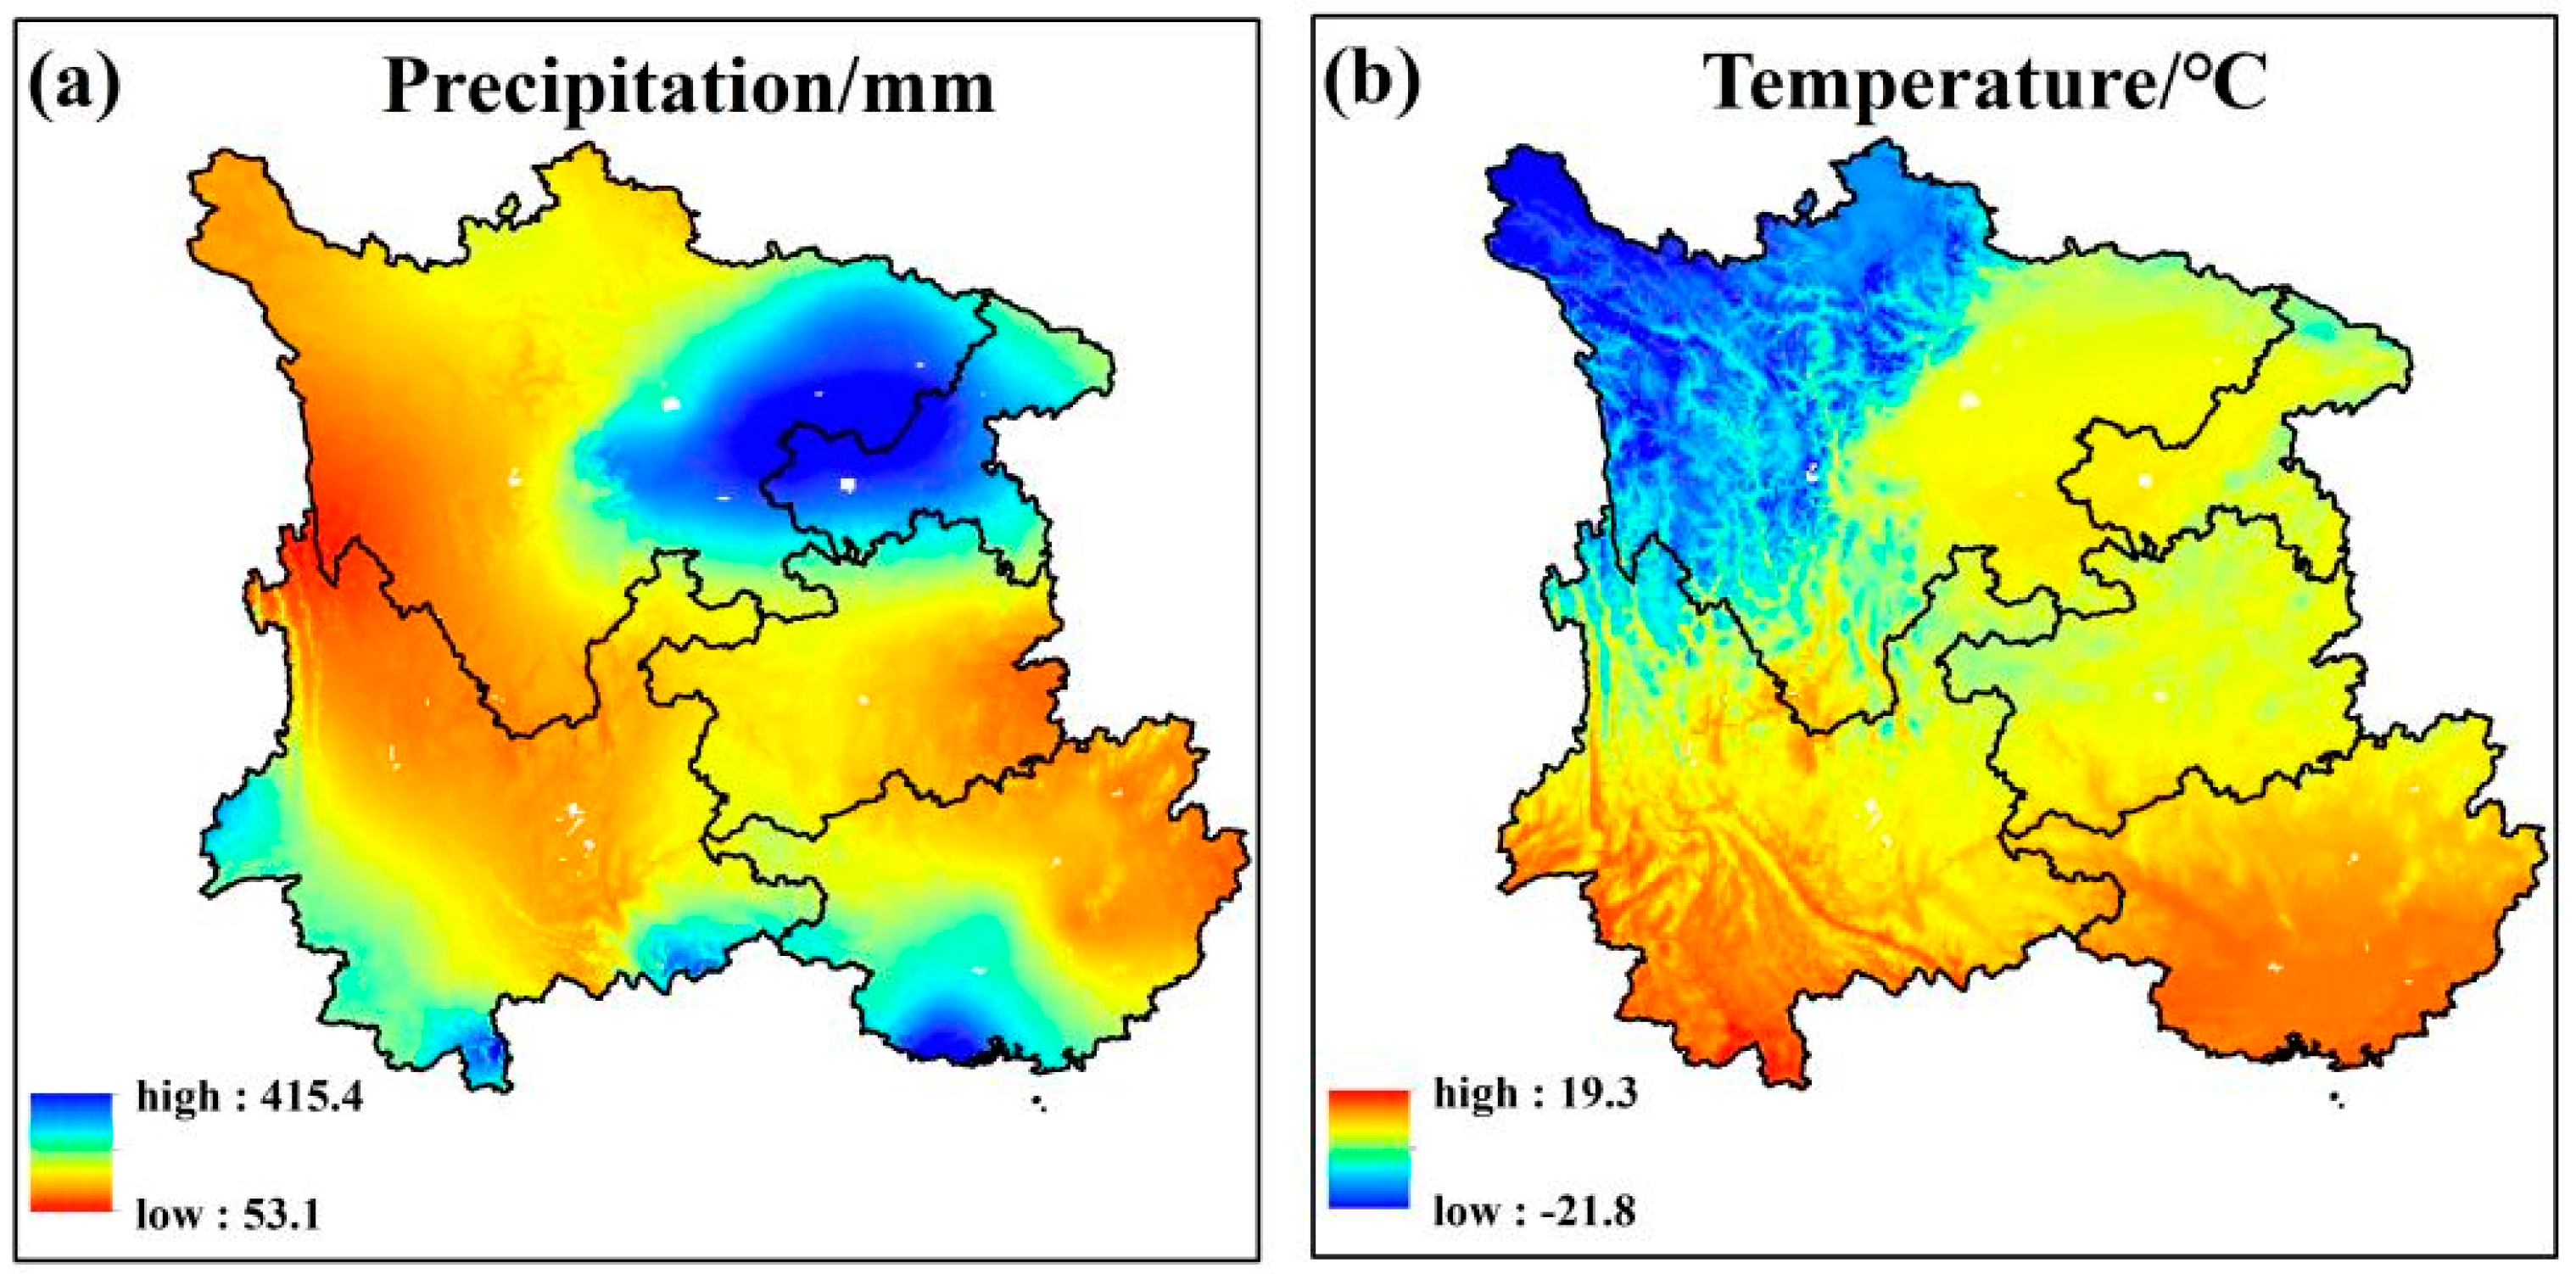
The study area is located in southwest China (Figure 1), including Sichuan, Yunnan, Guangxi, Guizhou, and Chongqing (97°22′–112°10′ E, 20°57′–34°26′ N), and the whole study area is about 1,364,000 km2 [31,32,33]. The area is rich in various vegetation types, mainly farmland, grassland, forest, and shrubland (Figure 1a). The average precipitation in the study region during 2000 and 2015 is 50~415 mm (Figure 2a), and the temperature is −22~20 °C (Figure 2b). The spatial and temporal distribution of precipitation is extremely uneven, with distinct dry and wet seasons [34]. The area is located on the plateau of low latitude, with a special geographical location and complex terrain (Figure 1b). In spring, southwest China is controlled by subtropical high pressure; the rainfall decreases; and the precipitation variation rate is large, which is easy to produce spring drought [32,34]. In the region, rivers and valleys are widely spread; the landform is mainly plateau and mountain but also has widely distributed karst landform, valley, hilly and basin landforms, the terrain ups and downs. Under the influence of a special geographical location, a karst landform, climate and geological factors, this region faces ecological problems such as vegetation degradation and soil erosion [15,33,34]. The ecosystem is very fragile, which is a frequent drought area.

2.2. Land Cover Data

Land cover data are from the National Earth System Science Data Center of the United States. By transforming the combination into a vector gate (area maximization method), a land use data product with a national area of 1 km was finally obtained. The land cover data could be found in http://www.nesdc.org.cn, accessed on 10 November 2022.

2.3. Meteorological Data

The monthly temperature and precipitation data with a resolution of 1 km from 2001 to 2015 in China are from the National Earth System Science Data Center. Data can be obtained from the National Earth System Science Data Center and the National Science and Technology Infrastructure Center (http://www.geodata.cn, accessed on 25 November 2022).
The Chinese terrestrial soil moisture dataset is monthly data with a resolution of 0.05° from the National Tibetan Plateau Data Center. The time series we used is 2001–2015. This data product was made by Mao from three passive microwave remote-sensing products [35]. The soil moisture dataset is a product with good accuracy that was verified and can be used for hydrological and drought monitoring. The dataset can cover the 10–20 cm surface soil layer.

2.4. Sun-Induced Chlorophyll Fluorescence (SIF), Photosynthetically Active Radiation (PAR), and Leaf Area Index (LAI) Products

The SIF data we used are from Li [36]. The product is based on OCO-2 SIF, MODIS, and re-analysis of meteorological data, using a machine learning algorithm to obtain the GOSIF products with a global continuous 8 days, 0.05 degree, and long time series (2000–2018). We used the data from 2001 to 2015.
The practical spectral component of plant photosynthesis in solar radiation is photosynthetically active radiation (PAR). The 2001–2015 PAR data were obtained from the Global Land Surface Satellite (GLASS) product (http://www.glass.umd.edu/Download.html, accessed on 25 November 2022). The PAR data are 0.05° × 0.05° with a time resolution of 1 day, respectively.
The Leaf Area Index (LAI) is a comprehensive indicator of vegetation utilization of light energy and canopy structure, and it is directly and closely related to the final yield. The LAI is a structural parameter of the ecosystem, which reflects the change in the plant leaf number, the canopy structure, the life vitality of the plant community, and its environmental impact. The LAI data used in this study were obtained from the MOD15A2H (V6) with a spatial resolution of 0.05° and the 8-day data product released by the National Aeronautics and Space Administration (NASA), which was pre-processed with a radiation and atmospheric correction. We used the maximum value composite (MVC) to generate month-scale LAI data. The data period we used is 2001–2015.

2.5. SPEI

The monthly 0.5° standardized precipitation evapotranspiration index (SPEI) is based on the long-term observed precipitation and vapor distribution. The SPEI can be used to assess dry and wet conditions within the region. We used SPEI data from 2000 to 2015 to assess drought in southwest China. The data are available from http://spei.csic.es/database.html, accessed on 25 November 2022, and the SPEI drought classification standard is as follows in Table 1.

2.6. VPD

The Vapor Pressure Deficit (VPD) is the actual distance between the air and water vapor saturation state, that is, the dryness of the air. The VPD affects the stomatal closure of plants, thus controlling plant transpiration, photosynthesis, and other physiological processes, and has an essential impact on the evapotranspiration process and water use efficiency of forest ecosystems. The VPD can be estimated from the air relative humidity (RH) and air temperature (Ta). The calculation formula is as follows:
V P D = 0.61078 × e 17.27 × T a T a + 237.3 × ( 1 R H )  
The VPD in our study is the spatial data calculated from the grid data. The RH product is based on 824 meteorological stations on the ground in China. After strict quality control and screening, the national 1 km resolution topographic map DEM is adopted as the covariate. The spline method of 1 km resolution (TPS, Thin Plate Spline) is used to generate the monthly grid data of 1 km × 1 km. We calculated the VPD from 2001 to 2015.

2.7. The Calculation of the Photosynthesis Efficiency Index (PEI)

In our study, to explore photosynthesis, light efficiency, and the vegetation carbon cycle in Southwest China further, we calculated the photosynthesis efficiency index (PEI) during 2001 and 2015 regarding Wei’s method, which is the ratio of the actual vegetation photosynthetic to a green degree (SIF/LAI) [31]. The PEI can quantify the ability of photosynthesis per unit leaf area.

2.8. Trend Analysis

The Mann–Kendall method we used is the non-parametric statistical test. The non-parametric test method is also called the no distribution test. The M–K test does not require samples to follow a particular distribution and is not interfered by a few abnormal values, so it has strong applicability [37]. We assessed the trends in photosynthesis–efficiency at the pixel-by-pixel scale in Southwest China from 2001 to 2015 using the M–K test.

2.9. Methods for Data Standardization

To study the deviation of each variable relative to the long-term more intuitively, we normalized the variables using the standard deviation from 2001 to 2015 and calculated the temperature/precipitation/SIF standard deviation (SD):
X ( i , j , t ) = X ( i , j , t ) X ¯ ( i , j ) std ( X ( i , j , t ) )  
where X′(i, j, t) is the standardized anomaly of pixel (i, j) at time t; X(i, j, t) is the original value of pixel (i, j) at time t; X ¯ ( i , j ) is the mean value of pixel (i, j) from 2001 to 2015; and std(X(i, j, t)) is the standard deviation of pixel (i, j) from 2001 to 2015.

2.10. Mann–Kendall Test

The Mann–Kendall trend test (M–K) is a widely used statistical test that can be used to predict the long-term trends of meteorological elements such as temperature, precipitation, and air pressure. The non-parametric test method is also known as the no distribution test. The change elements do not necessarily have normal distribution characteristics and will not be affected by a few outliers. It has a high degree of quantification, wide detection range, small interference degree, and simple calculation, so it is applicable to the change trend analysis with non-normal distribution characteristics.

2.11. Geodetector

The geodetector is a statistical method used to detect spatial differentiation, and it can reveal the driving factors behind it. The geodetector is based on the assumption that if the independent variable has an important influence on the dependent variable, its spatial distribution should be similar. The interpretation of the independent variable to the dependent variable is measured by testing spatial differentiation [38]. It can evaluate the effects of individual factors and the associated effects of two factors. All results were quantified using q-values and were calculated as follows:
q = 1 1 N σ 2 z = 1 L N z σ z 2
where z represents the hierarchical structure of variable Y or probe factor X; z = 1, …, L; Nz and N represent layer z and the number of regional cells; σ z 2 and σ 2 represent the variance of layer z and full Y values, respectively.
More details about the geodetector can be found at the website of http://www.geodetector.cn/, accessed on 25 November 2022.

3. Results

3.1. Drought Condition in 2009/2010

From January 2009 to December 2010, the average SPEI-01 in southwest China was −1.76–0.66 (Figure 3). The big difference in SPEI values in different months indicates that drought conditions in some months are more serious. The mean value of SPEI-01 was lower than −0.5 during September 2009 to March 2010, which was significantly lower than the multi-year average, indicating that the study area suffered from drought during this period. In particular, the spatial mean of SPEI-01 for September 2009 and January and February 2010 is below −1.0, illustrating the severity of the drought event.
To show the variation of meteorological elements during drought better, especially compared to the multi-year average, we used the spatial distribution of standardized anomalies temperature and precipitation to describe the deficit in detail.
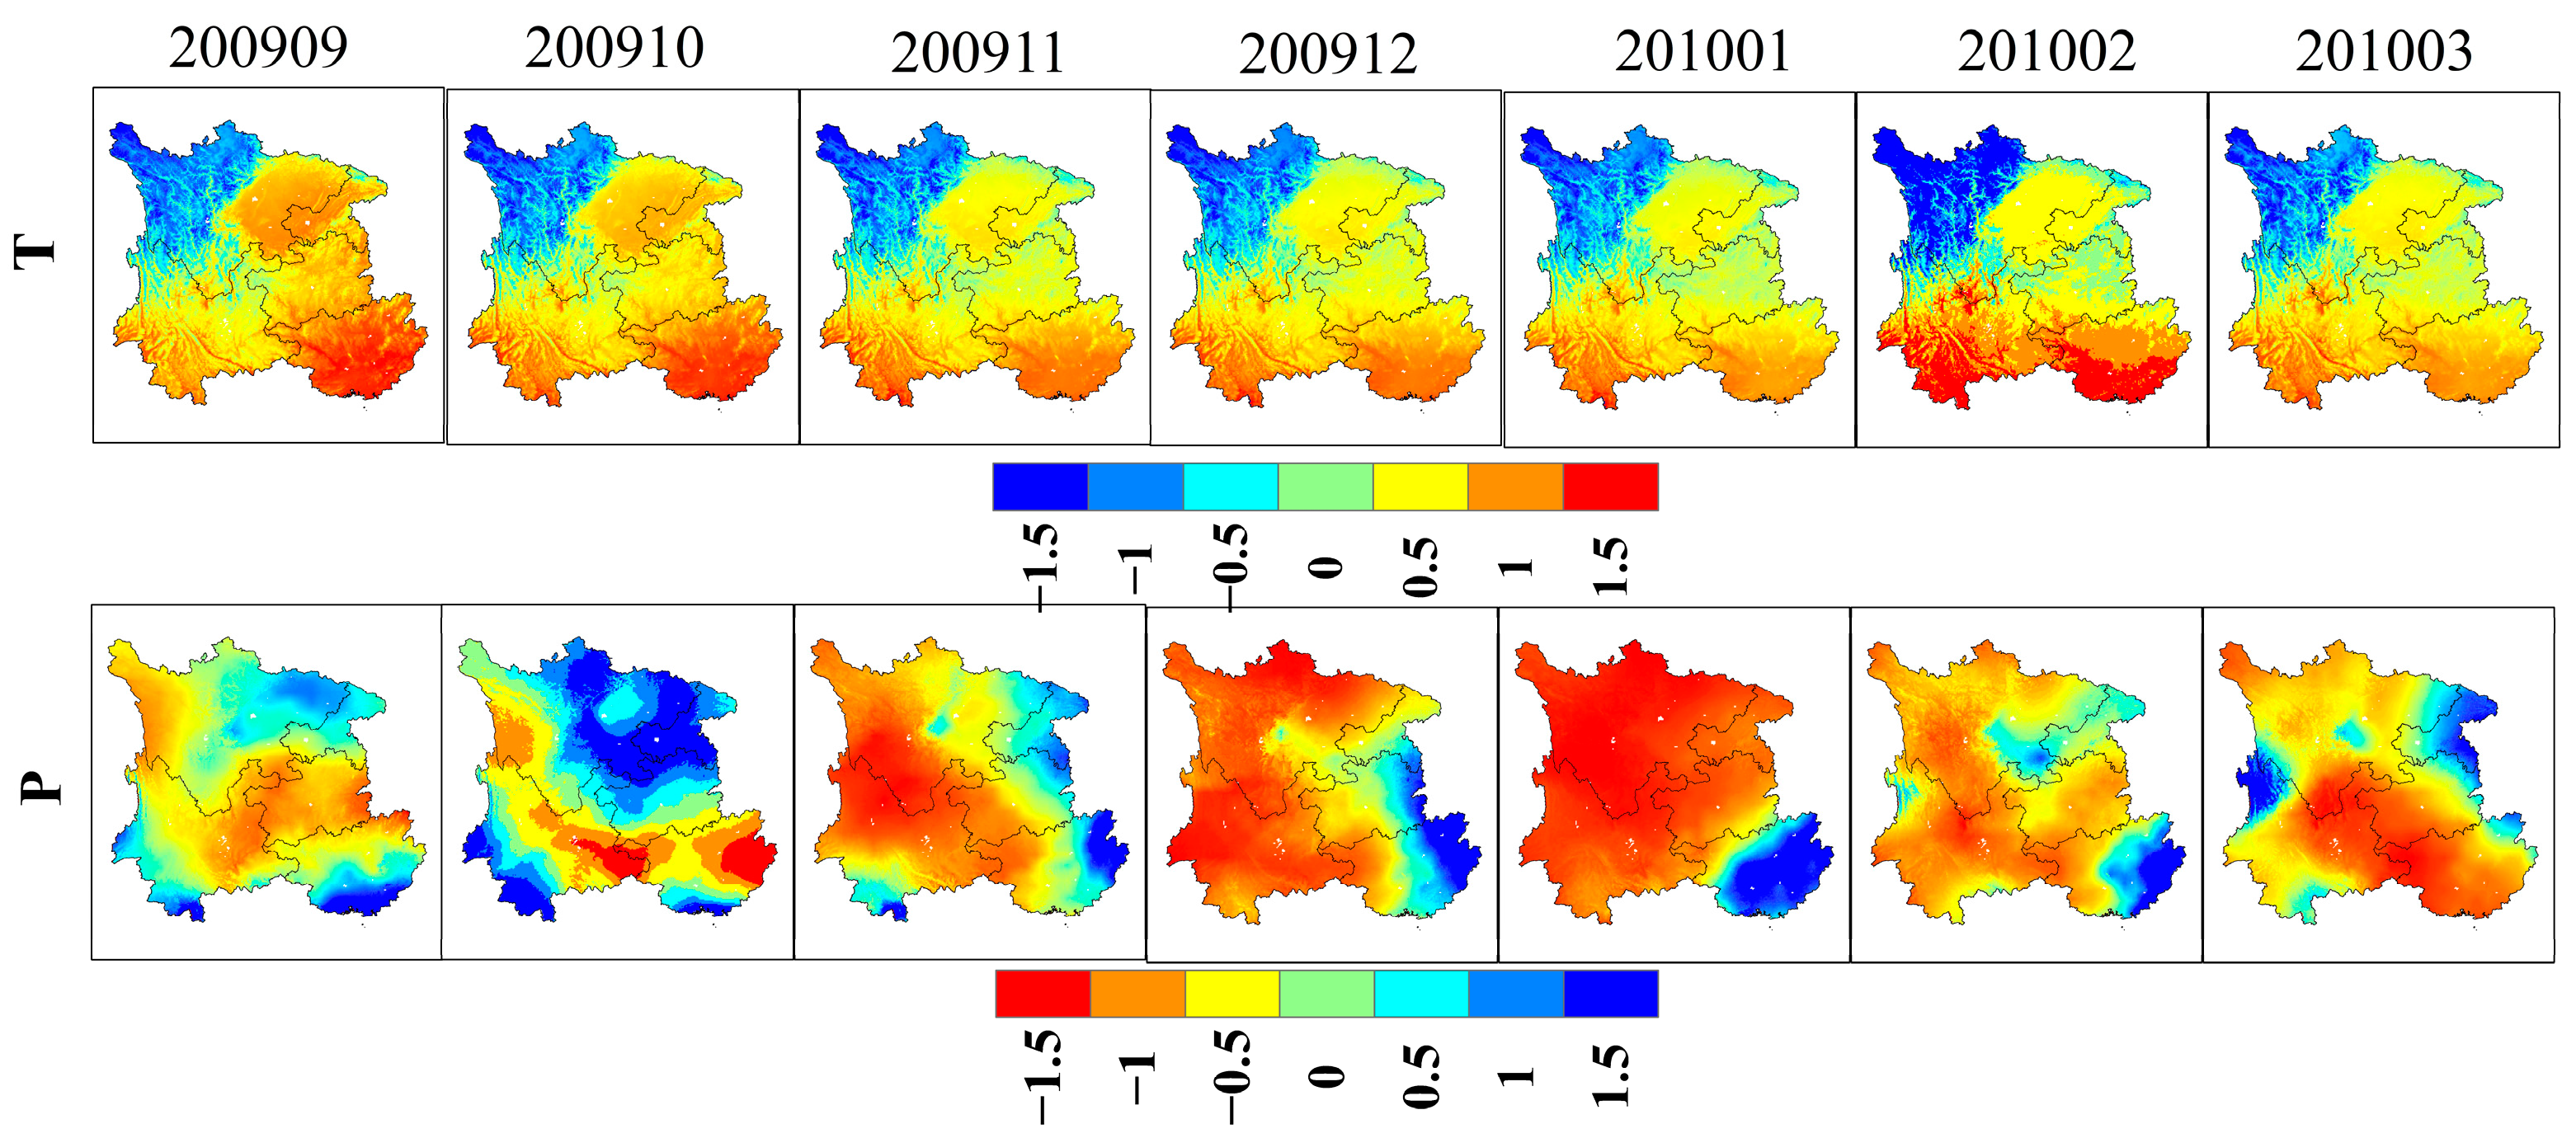
From the autumn of 2009, most areas in southwest China showed positive temperatures and negative precipitation anomalies (Figure 4). Among them, in September 2009, almost all of the Guangxi province showed >1.5 SD positive anomalies, and the central part of southwest China began to show precipitation gradually <−1 SD negative anomalies. With the drought spread, almost all of the study areas showed negative anomalies with <−1.5 SD during the winter and spring communes. In February 2010, the southern part of the study area showed positive abnormal temperature values higher than the multi-year average. The spatial distribution of temperature and precipitation anomalies shows the severity and wide range of the drought event.

3.2. PEI Changes in the Context of Long-Term Climate Change and Extreme Drought

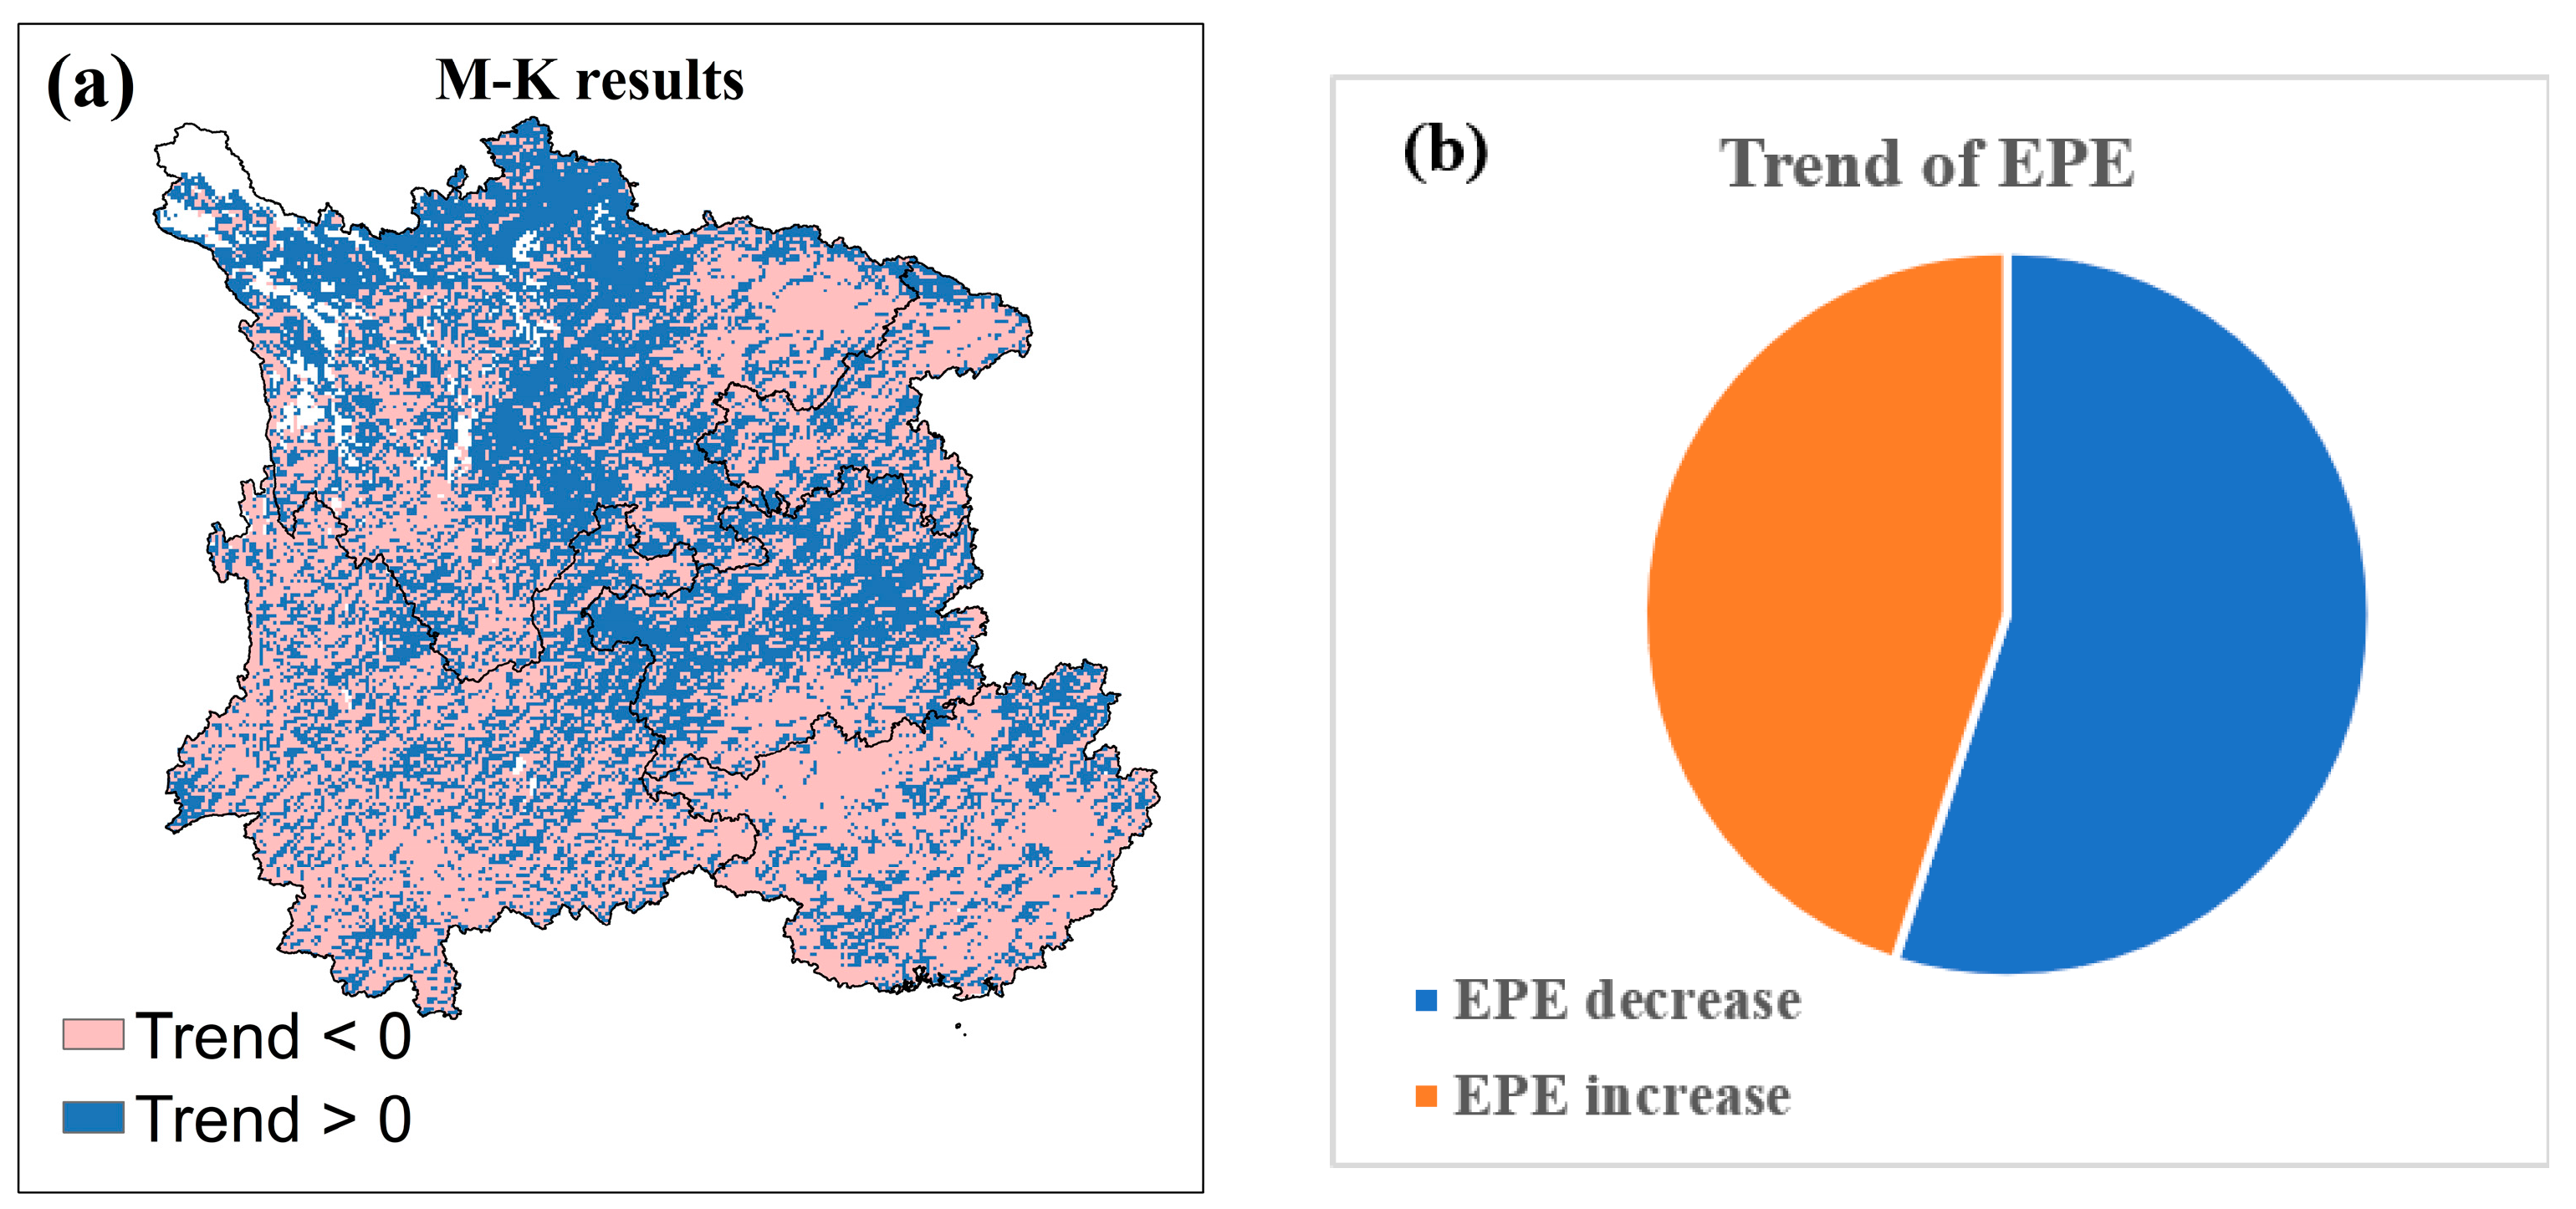
According to the M–K test results of photosynthetic efficiency indicators in southwest China, 55% of the study areas showed a trend toward a PEI reduction between 2001 and 2015 (Figure 5). Most areas of the Yunnan and Guangxi provinces showed a decreasing trend in the PEI. In contrast, the central Sichuan Province and the intersection of the Sichuan, Guizhou, and Yunnan provinces showed a trend of an increasing PEI. Photosynthetic efficiency indexes are obtained from the ratio of SIF to the LAI, which shows that the increasing proportion of SIF and the LAI is inconsistent in southwest China.
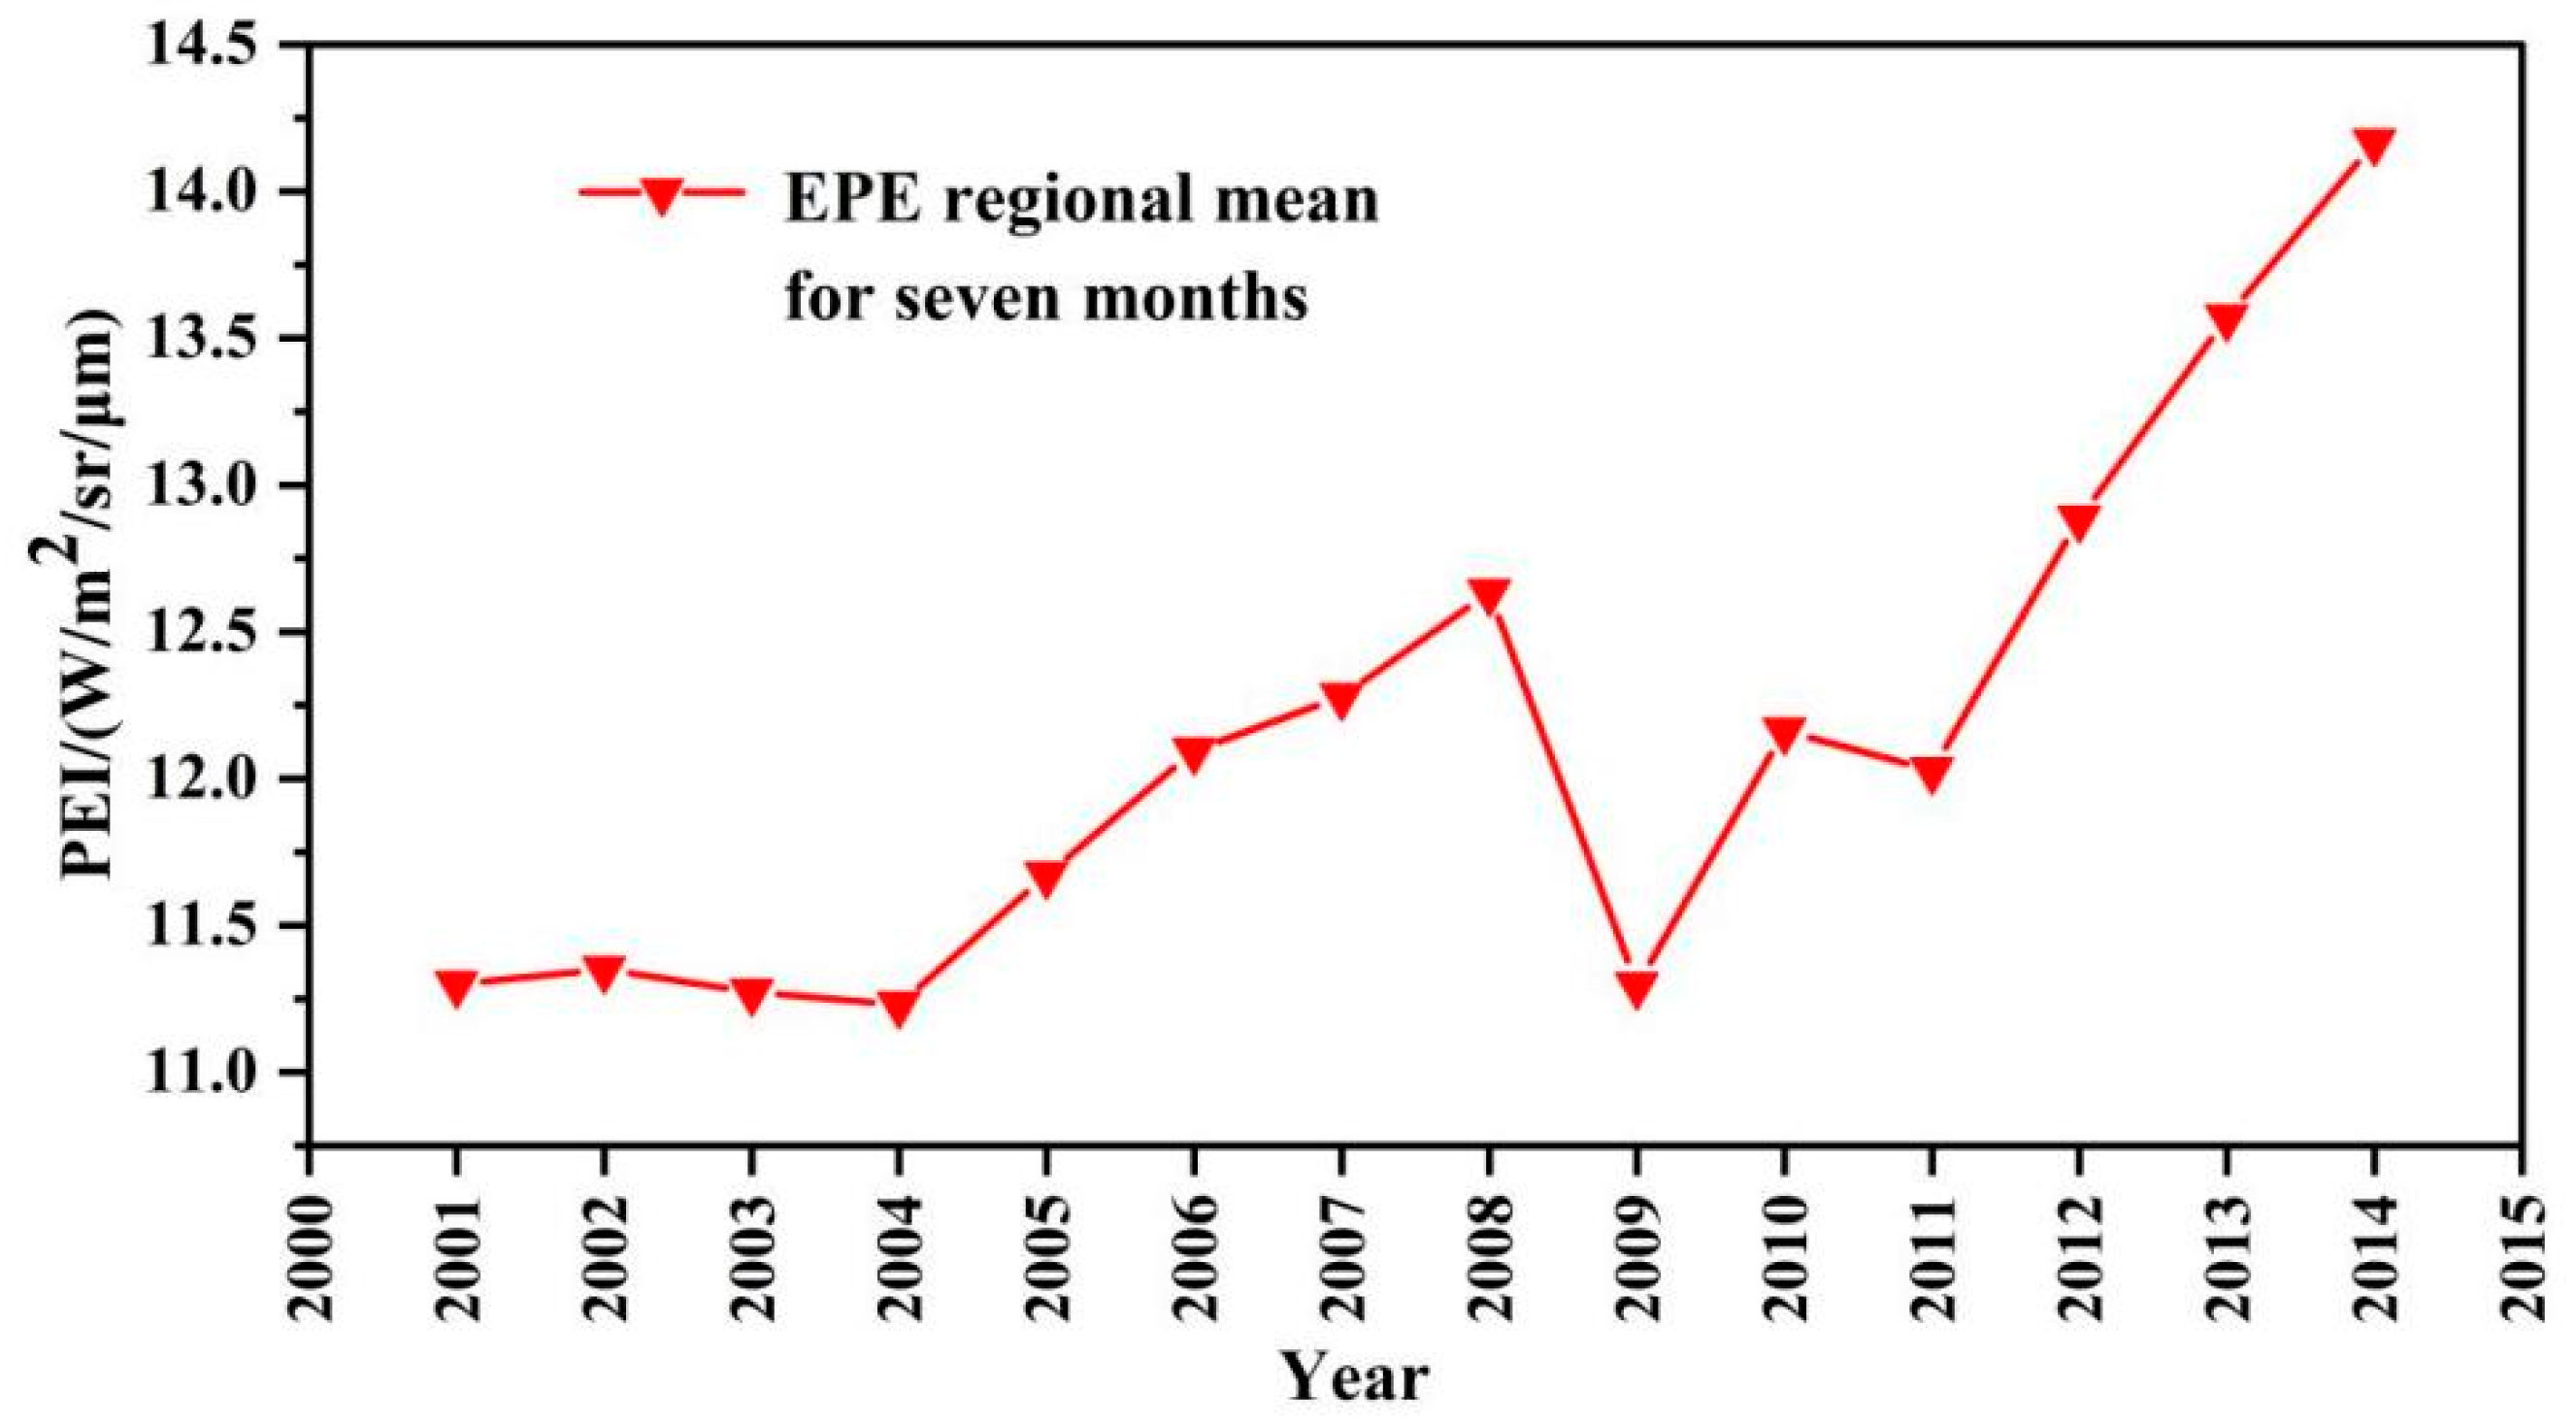
According to the SPEI during the drought, we explored the changing trend in the photosynthetic efficiency index from September to April of each year under a long time series. The results showed that the extreme drought events from the autumn of 2009 affected the PEI of the southwest ecosystem. The high temperature and lack of rain made the PEI regional mean at that time the lowest level in 15 years (Figure 6).
The spatial distribution of standardized PEI anomalies depicts the variation range of photosynthetic efficiency in space during extreme drought. Figure 7 shows that the overall PEI of the northern grassland in the study area during drought is lower than the multi-year average (<−1.5 SD), and the trend of the PEI in the south was more moderate.
The spatial distribution map showed that the PEI of grassland in the north of Southwest China was significantly lower than the multi-year average during extreme drought. We explored the variation trend in the regional mean of the PEI under different vegetation types. We concluded that the PEI regional mean of grassland was significantly lower than that of other ecosystems, and the photosynthetic efficiency of cropland was the highest during drought (Figure 8).

3.3. The Influencing Factors of Cropland and Grassland during Drought Period Based on Geodetector

According to the temporal and spatial variation of the PEI during drought, the photosynthetic efficiency of grassland and farmland ecosystems is significantly different in response to drought in the southwest. We used geographical detectors based on statistical methods to reveal the variability of different meteorological factors on the photosynthetic efficiency of farmland and grassland ecosystems.
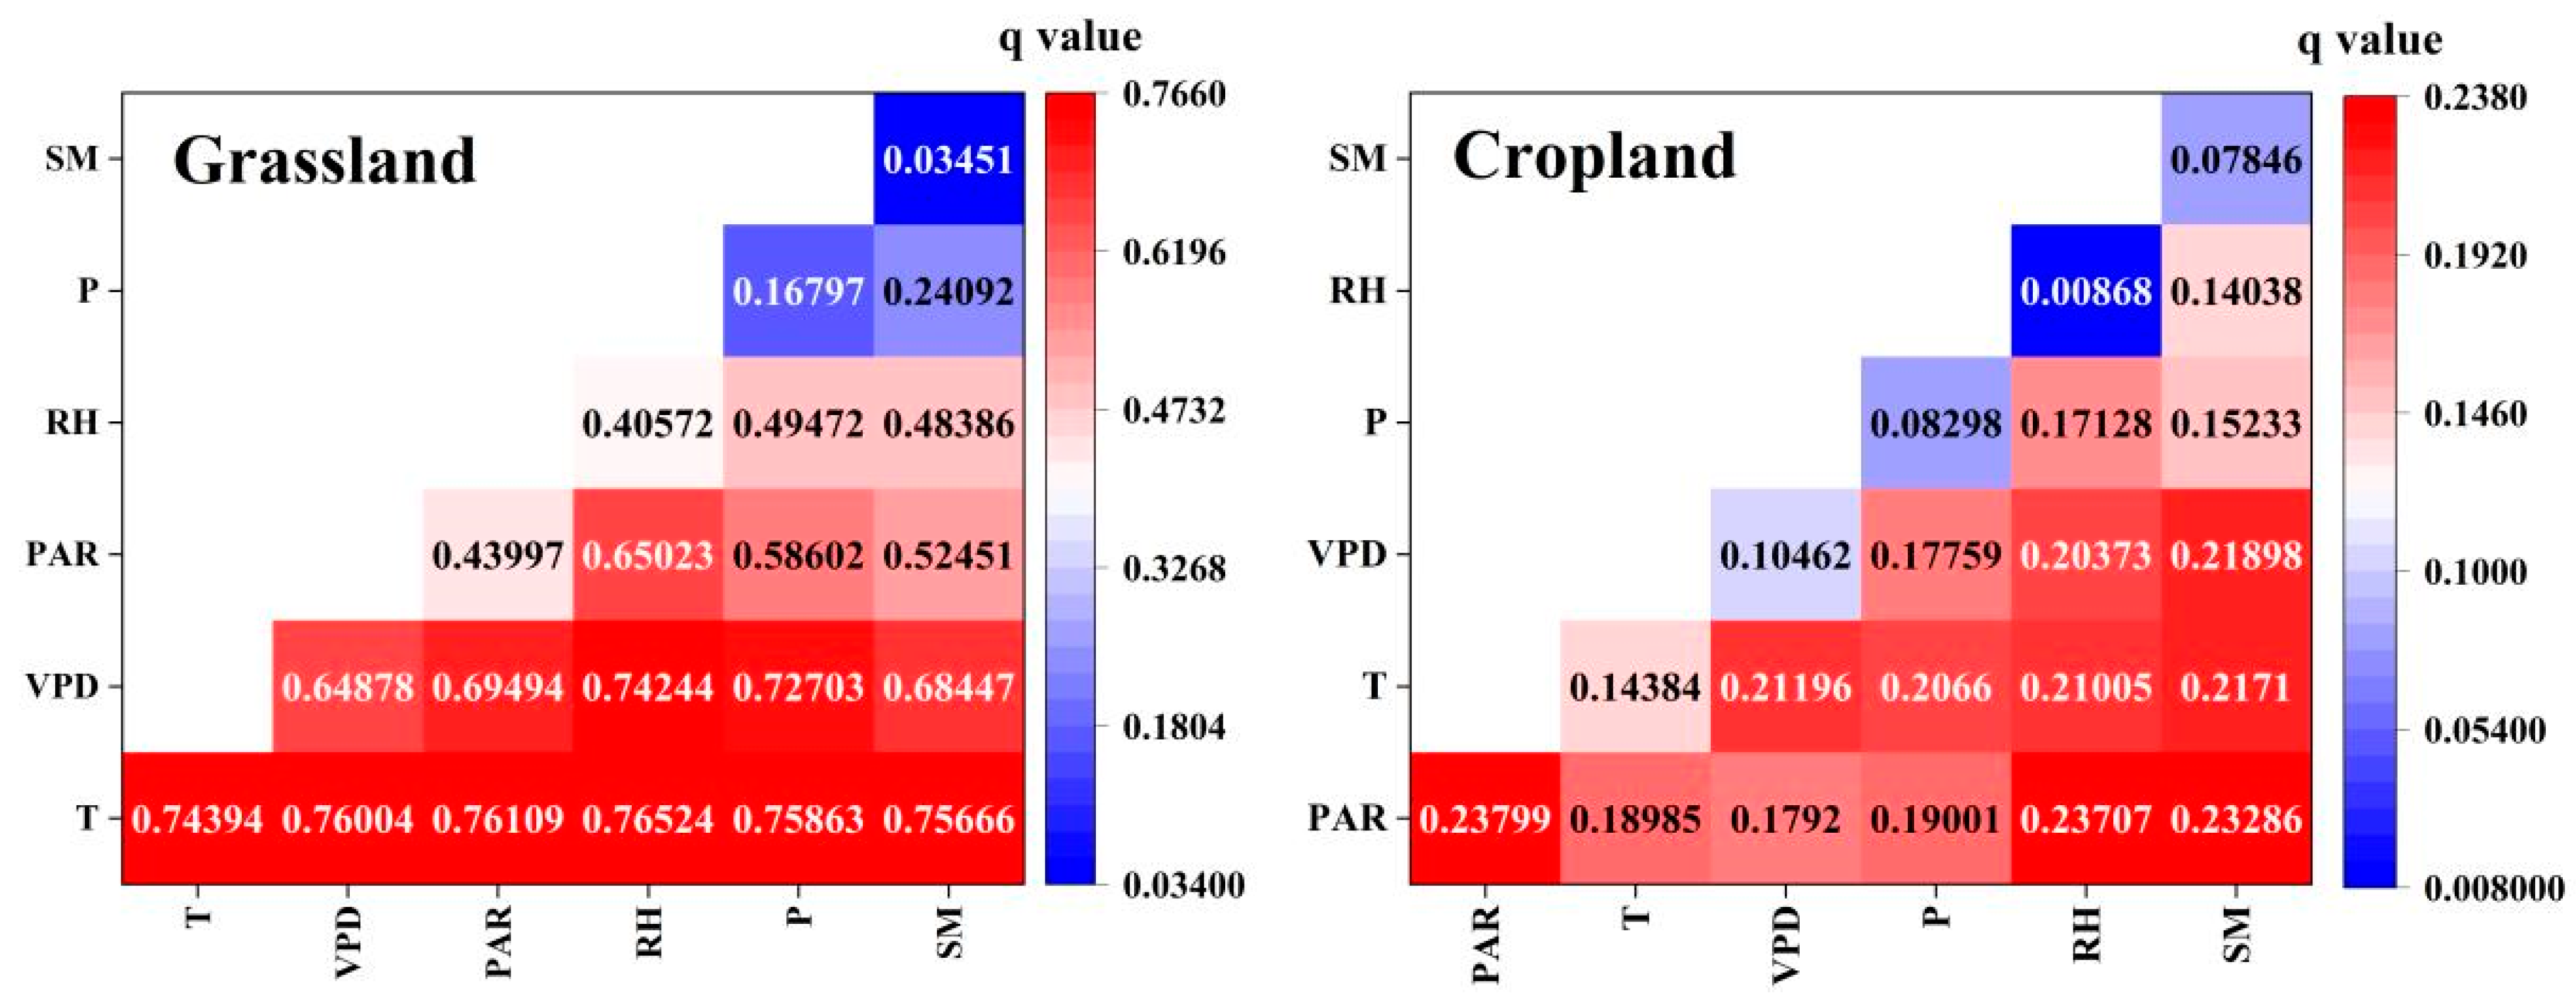
The results of the geodetector showed that the photosynthetic efficiency of grassland ecosystems was more susceptible to drought. The correlation between temperature and the VPD and PEI could reach 0.75 and 0.65, indicating that grassland would respond to a higher VPD caused by increasing temperature and decreasing precipitation in southwest China. On the contrary, the cropland ecosystem was insensitive to drought, and the correlation between photosynthetic efficiency and temperature/VPD was only about 0.2 (Figure 9). The lag effect of soil moisture on drought resulted in a low correlation with light and efficiency.
The explanatory power of a single factor is usually limited because photosynthetic efficiency in an ecosystem is affected by multiple factors. We leveraged the interaction in the geodetector tool to detect the strength of the combined effect of two factors on photosynthetic efficiency in the southwest region. The detection results of the interaction of farmland and grassland ecosystems are shown in Figure 10. Generally speaking, if the interaction of two independent influencing factors is more potent than that of a single individual factor [q(X1∩X2) > q(X1) + q(X2), where ∩ denotes the interaction between X1 and X2], it indicates that the interpretation of the interaction effect on the distribution of light and efficiency in southwest China will be further enhanced.
Among these interactions, the strength between temperature and other factors in the grassland ecosystem showed a strong explanatory power, in which T∩RH reached the highest level (q = 0.77), followed by T∩PAR (q = 0.76), which indicated that temperature had a great impact on the distribution of grassland photosynthetic efficiency in southwest China. The radiation conditions can also affect the photosynthesis efficiency of vegetation. On the contrary, the explanatory strength of various interactions in the farmland ecosystem is weak, and PAR∩RH only reaches the level of q = 0.24.

4. Discussion

4.1. Effect of Drought on Long-Term Changes in Photosynthesis Efficiency in Southwest China

According to Wei’s method, we quantified the photosynthetic capacity per unit leaf area as SIF/LAI [31]. The M–K trend test results showed that photosynthetic efficiency was in a decreasing trend under long-term conditions in southwest China, which indicated that there was a gap between the actual productivity of the ecosystem and the growth rate of greening. This is different from previous reports that both ecosystem productivity and greening were widely improved [14,15,18]. Wei believed that the response to drought would affect the long-term trend of photosynthetic efficiency. After the extreme drought event in 2015–2016, photosynthesis in the Amazon forest decreased significantly, but vegetation greenness slightly increased [39]. This is consistent with our findings in the southwest, where drought consistently decouples ecosystem greenness and efficiency. In other words, the greening rate of vegetation and the growth rate of ecosystem productivity will be more mismatched [14,15,27].
Our results indicate that ecosystem photosynthetic efficiency was significantly low during the 2009/2010 southwest drought event, which illustrates the uncertainty of the relationship between changes in vegetation canopy greenness and ecosystem productivity during drought. Further, an augment in observed greenness does not always lead to increased productivity. Some researchers believe that it is due to the light saturation effect, and the light absorption/photosynthesis per leaf decreases as the LAI becomes higher [40,41]. Previous studies believe that vegetation greenness is insensitive to environmental changes and that photosynthesis is directly related to the physiological state of plant; the vegetation productivity will first decrease when subjected to water and heat stress [10,12,28,42,43].

4.2. Differences in the Influencing Factors of Vegetation Photosynthetic Efficiency in Cropland and Grassland Ecosystems during Drought

In our study, the photosynthetic efficiencies of vegetation in cropland and grassland ecosystems showed different responses to drought. We used the geodetector to examine how vegetation in these two ecosystems responded to different influencing factors during drought. The results showed that the correlation between photosynthetic efficiency and temperature/VPD was higher in the grassland ecosystems. The differences in the sensitivity of vegetation to different influencing factors in the two ecosystems indicate the influence of the canopy structure of different vegetation on vegetation photosynthesis. Previous studies demonstrated that the complexity of the vegetation canopy also influences the relationship between vegetation photosynthesis and system productivity [44,45,46,47]. In addition, the photosynthesis of vegetation reaches saturation under strong light, while SIF has a strong tendency to increase continuously in high light [48]. During drought, increased temperature within the plant growth range leads to an increase in photosynthesis [49]. However, the stress caused by particularly high temperatures reduces the SIF values by a reduction in red and far-red fluorescent [50,51].
In addition, Migliavacca added nitrogen (N), phosphorous (P), or nitrogen phosphorous (NP) to the Mediterranean grassland to explore the impact of canopy structure and functional vegetation characters on the linear relationship of SIF [45]. Migliavacca concluded that the addition of nutrients had an effect on the prosperity of vegetation morphology and canopy biochemistry that control F760 (SIF at 760 nm). Perez-Priego’s [52] all-factor nutrient fertilization experiments on the Mediterranean grasslands found that the regulatory mechanisms associated with adding nitrogen (N) and phosphorus (P) may reduce the coupling degree between fluorescence released by the vegetation and photosynthesis. Moreover, due to drought, the farmers’ measures, such as irrigation to the cropland ecosystem, may influence the photosynthesis efficiency. Reflectance-based VIs typically encounter saturation effects in areas with higher vegetation, such as in forest areas or in agricultural fields with higher fertilizers. VIs on grasslands in semi-arid regions are also susceptible to soil reflectivity [21,53,54].
Through interaction detection, we can find that in addition to the influence of meteorological and drought factors such as temperature, the effect of radiation on vegetation photosynthesis cannot be ignored. By analyzing the different radiation conditions affecting SIF and photosynthesis, Yao believes that low radiation changed the widely recognized linear relationship between fluorescence and photosynthesis [55]. Porcar-castell’s observation experiments on fluorescence and photosynthesis at the leaf scale showed that a close relationship between fluorescence and photosynthesis was found, but this relationship would be nonlinear and affected by environmental changes [23]. Photochemical quenching mainly controls the photochemical reaction and therefore is negatively correlated with fluorescence [21]. With the increase in PAR, the carbon reaction related to photosynthesis gradually reached light saturation under stress conditions, and the non-photochemical quenching mechanism was activated. Under non-photochemical quenching, photochemical reactions and fluorescence decreased proportionally, and these photochemical reactions and fluorescence produced a positive correlation [23,56]. Therefore, in the context of constant environmental change, especially in drought-prone areas, water and heat stress will continue to change the linear relationship between chlorophyll fluorescence and the photochemical reaction, making it nonlinear [57,58]. This will also exacerbate the mismatch between system productivity and vegetation greenness.

4.3. Limitations and Implications of This Study

In the last decade, the rapid development of vegetation remote sensing provided great convenience for our extensive monitoring of vegetation at a regional scale [6,7,21,27,28]. The emergence of SIF, in particular, made it possible to monitor the physiological state of vegetation in real-time on a global scale. As a direct proxy for photosynthesis, SIF can accurately capture the changes in vegetation caused by environmental changes [10,12,43]. However, the current widely used SIF products do not have advantages in either temporal continuity or spatial resolution, which makes it difficult for us to conduct more refined SIF studies. In this study, we used the GOSIF data with a finer spatio-temporal resolution, but the GOSIF belongs to the reconstructed data, and there may be some uncertainty. In the future, OCO-3 [59], the Geostationary Carbon cycle Observatory (GeoCarb) [60], the Fluorescence Detector (FLEX) [61], and more organizations will provide more accurate SIF products and observation data in the future. With the more refined SIF products, we can more accurately distinguish between different vegetation types and thus study the vegetation productivity of diverse ecosystems.
Drought is frequent in southwest China, and the spatial and temporal distribution of rainfall is extremely nonuniform. In this area with a continuously changing environment, the nonlinear relationship between fluorescence and photosynthesis exists not only at the leaf scale but also at the canopy scale. This complex mechanism still needs further exploration and experimental research.

5. Conclusions

In this study, we first explored the long-term trend of photosynthetic efficiency in southwest China. We then took the 2009/2010 drought event as a case study to investigate the impact of extremely high temperatures on vegetation. Finally, the diverse responses of grassland and farmland ecosystems to drought and the differences in influencing factors were analyzed based on the geodetector. The results show that the changes between vegetation productivity and greenness are not synchronized, and drought can continuously affect the coordination between vegetation photosynthesis and canopy greenness. Grassland ecosystems with simple canopy structures were more susceptible to high temperature, and the correlations between the PEI and VPD/T reached above 0.6. In addition, radiation conditions may alter the linear relationship between fluorescence and photosynthesis. Future studies of more accurate ecosystem photosynthesis capacity also rely on long-term observations and SIF datasets with finer spatial and temporal resolution.

Author Contributions

Conceptualization, Y.H. and W.L.; methodology, Y.H. and L.J.; writing—original draft preparation, L.J.; writing—review and editing, Y.Z. and Y.L. All authors have read and agreed to the published version of the manuscript.

Funding

This research was jointly supported by the National Science and Technology Basic Resource Investigation Program (Grant No. 2017FY100904), the China Postdoctoral Science Foundation (Grant No. 2018M633602), Postdoctoral Research Fund of Shaanxi Province (Grant No. 2017BSHEDZZ144), and the Natural Science Basic Research Plan in Shaanxi Province of China (Grant No. 2021JQ-449).

Institutional Review Board Statement

Not applicable.

Informed Consent Statement

Not applicable.

Data Availability Statement

The datasets analysed during the current study are derived from public resources and made available with the article. These datasets were derived from the following public domain resources. Temperature and precipitation data: http://www.geodata.cn, accessed on 25 November 2022; Soil moisture data: https://www.esa-soilmoisture-cci.org, accessed on 25 November 2022; Evapotranspiration: http://www.nesdc.org.cn, accessed on 10 November 2022; Sun-induced chlorophyll fluorescence (SIF): https://globalecology.unh.edu/data/GOSIF.html, accessed on 25 November 2022; Land cover data: http://www.geodata.cn, accessed on 25 November 2022; Leaf Area Index: https://ladsweb.modaps.eosdis.nasa.gov, accessed on 25 November 2022; Relative humidity: http://www.geodata.cn; accessed on 25 November 2022.

Conflicts of Interest

The authors declare no conflict of interest.

References

  1. Frank, D.; Reichstein, M.; Bahn, M.; Thonicke, K.; Frank, D.; Mahecha, M.D.; Smith, P.; van der Velde, M.; Vicca, S.; Babst, F.; et al. Effects of Climate Extremes on the Terrestrial Carbon Cycle: Concepts, Processes and Potential Future Impacts. Glob. Change Biol. 2015, 21, 2861–2880. [Google Scholar] [CrossRef] [PubMed] [Green Version]
  2. Reichstein, M.; Bahn, M.; Ciais, P.; Frank, D.; Mahecha, M.D.; Seneviratne, S.I.; Zscheischler, J.; Beer, C.; Buchmann, N.; Frank, D.C.; et al. Climate Extremes and the Carbon Cycle. Nature 2013, 500, 287–295. [Google Scholar] [CrossRef]
  3. Dai, A. Increasing Drought under Global Warming in Observations and Models. Nat. Clim. Change 2013, 3, 52–58. [Google Scholar] [CrossRef]
  4. Trenberth, K.E.; Dai, A.; Van Der Schrier, G.; Jones, P.P.D.; Barichivich, J.; Briffa, K.R.; Sheffield, J. Global Warming and Changes in Drought. Nat. Clim. Change 2014, 4, 17–22. [Google Scholar] [CrossRef]
  5. Kogan, F.; Adamenko, T.; Guo, W. Global and Regional Drought Dynamics in the Climate Warming Era. Remote Sens. Lett. 2013, 4, 364–372. [Google Scholar] [CrossRef]
  6. Song, L.; Guanter, L.; Guan, K.; You, L.; Huete, A.; Ju, W.; Zhang, Y. Satellite Sun-Induced Chlorophyll Fluorescence Detects Early Response of Winter Wheat to Heat Stress in the Indian Indo-Gangetic Plains. Glob. Change Biol. 2018, 24, 4023–4037. [Google Scholar] [CrossRef] [Green Version]
  7. Chen, X.; Mo, X.; Zhang, Y.; Sun, Z.; Liu, Y.; Hu, S.; Liu, S. Drought Detection and Assessment with Solar-Induced Chlorophyll Fluorescence in Summer Maize Growth Period over North China Plain. Ecol. Indic. 2019, 104, 347–356. [Google Scholar] [CrossRef]
  8. Wolf, S.; Keenan, T.F.; Fisher, J.B.; Baldocchi, D.D.; Desai, A.R.; Richardson, A.D.; Scott, R.L.; Law, B.E.; Litvak, M.E.; Brunsell, N.A.; et al. Warm Spring Reduced Carbon Cycle Impact of the 2012 US Summer Drought. Proc. Natl. Acad. Sci. USA 2016, 113, 5880–5885. [Google Scholar] [CrossRef] [Green Version]
  9. Li, X.; Xiao, J.; He, B. Chlorophyll Fluorescence Observed by OCO-2 Is Strongly Related to Gross Primary Productivity Estimated from Flux Towers in Temperate Forests. Remote Sens. Environ. 2018, 204, 659–671. [Google Scholar] [CrossRef]
  10. Lee, J.E.; Frankenberg, C.; Van Der Tol, C.; Berry, J.A.; Guanter, L.; Boyce, C.K.; Fisher, J.B.; Morrow, E.; Worden, J.R.; Asefi, S.; et al. Forest Productivity and Water Stress in Amazonia: Observations from GOSAT Chlorophyll Fluorescence. Tohoku J. Exp. Med. 2013, 230, 20130171. [Google Scholar] [CrossRef] [PubMed]
  11. Qiu, B.; Xue, Y.; Fisher, J.B.; Guo, W.; Berry, J.A.; Zhang, Y. Satellite Chlorophyll Fluorescence and Soil Moisture Observations Lead to Advances in the Predictive Understanding of Global Terrestrial Coupled Carbon-Water Cycles. Glob. Biogeochem. Cycles 2018, 32, 360–375. [Google Scholar] [CrossRef]
  12. Yoshida, Y.; Joiner, J.; Tucker, C.; Berry, J.; Lee, J.E.; Walker, G.; Reichle, R.; Koster, R.; Lyapustin, A.; Wang, Y. The 2010 Russian Drought Impact on Satellite Measurements of Solar-Induced Chlorophyll Fluorescence: Insights from Modeling and Comparisons with Parameters Derived from Satellite Reflectances. Remote Sens. Environ. 2015, 166, 163–177. [Google Scholar] [CrossRef]
  13. Chen, J.M.; Ju, W.; Ciais, P.; Viovy, N.; Liu, R.; Liu, Y.; Lu, X. Vegetation Structural Change since 1981 Significantly Enhanced the Terrestrial Carbon Sink. Nat. Commun. 2019, 10, 4259. [Google Scholar] [CrossRef] [Green Version]
  14. Chen, C.; Park, T.; Wang, X.; Piao, S.; Xu, B.; Chaturvedi, R.K.; Fuchs, R.; Brovkin, V.; Ciais, P.; Fensholt, R.; et al. China and India Lead in Greening of the World through Land-Use Management. Nat. Sustain. 2019, 2, 122–129. [Google Scholar] [CrossRef]
  15. Li, X.; Li, Y.; Chen, A.; Gao, M.; Slette, I.J.; Piao, S. The Impact of the 2009/2010 Drought on Vegetation Growth and Terrestrial Carbon Balance in Southwest China. Agric. For. Meteorol. 2019, 269–270, 239–248. [Google Scholar] [CrossRef]
  16. Anderegg, W.R.L.; Schwalm, C.; Biondi, F.; Camarero, J.J.; Koch, G.; Litvak, M.; Ogle, K.; Shaw, J.D.; Shevliakova, E.; Williams, A.P.; et al. Pervasive Drought Legacies in Forest Ecosystems and Their Implications for Carbon Cycle Models. Science 2015, 349, 528–532. [Google Scholar] [CrossRef] [Green Version]
  17. Schwalm, C.R.; Anderegg, W.R.L.; Michalak, A.M.; Fisher, J.B.; Biondi, F.; Koch, G.; Litvak, M.; Ogle, K.; Shaw, J.D.; Wolf, A.; et al. Global Patterns of Drought Recovery. Nature 2017, 548, 202–205. [Google Scholar] [CrossRef] [PubMed]
  18. Huang, K.; Xia, J.; Wang, Y.; Ahlström, A.; Chen, J.; Cook, R.B.; Cui, E.; Fang, Y.; Fisher, J.B.; Huntzinger, D.N.; et al. Enhanced Peak Growth of Global Vegetation and Its Key Mechanisms. Nat. Ecol. Evol. 2018, 2, 1897–1905. [Google Scholar] [CrossRef]
  19. Zhu, Z.; Piao, S.; Myneni, R.B.; Huang, M.; Zeng, Z.; Canadell, J.G.; Ciais, P.; Sitch, S.; Friedlingstein, P.; Arneth, A.; et al. Greening of the Earth and Its Drivers. Nat. Clim. Change 2016, 6, 791–795. [Google Scholar] [CrossRef]
  20. Zhou, L.; Tian, Y.; Myneni, R.B.; Ciais, P.; Saatchi, S.; Liu, Y.Y.; Piao, S.; Chen, H.; Vermote, E.F.; Song, C.; et al. Widespread Decline of Congo Rainforest Greenness in the Past Decade. Nature 2014, 508, 86–90. [Google Scholar] [CrossRef]
  21. Guanter, L.; Zhang, Y.; Jung, M.; Joiner, J.; Voigt, M.; Berry, J.A.; Frankenberg, C.; Huete, A.R.; Zarco-Tejada, P.; Lee, J.E.; et al. Global and Time-Resolved Monitoring of Crop Photosynthesis with Chlorophyll Fluorescence. Proc. Natl. Acad. Sci. USA 2014, 111, E1327–E1333. [Google Scholar] [CrossRef] [PubMed] [Green Version]
  22. Damm, A.; Guanter, L.; Paul-Limoges, E.; van der Tol, C.; Hueni, A.; Buchmann, N.; Eugster, W.; Ammann, C.; Schaepman, M.E. Far-Red Sun-Induced Chlorophyll Fluorescence Shows Ecosystem-Specific Relationships to Gross Primary Production: An Assessment Based on Observational and Modeling Approaches. Remote Sens. Environ. 2015, 166, 91–105. [Google Scholar] [CrossRef]
  23. Porcar-Castell, A.; Tyystjärvi, E.; Atherton, J.; Van Der Tol, C.; Flexas, J.; Pfündel, E.E.; Moreno, J.; Frankenberg, C.; Berry, J.A. Linking Chlorophyll a Fluorescence to Photosynthesis for Remote Sensing Applications: Mechanisms and Challenges. J. Exp. Bot. 2014, 65, 4065–4095. [Google Scholar] [CrossRef] [PubMed] [Green Version]
  24. Verrelst, J.; van der Tol, C.; Magnani, F.; Sabater, N.; Rivera, J.P.; Mohammed, G.; Moreno, J. Evaluating the Predictive Power of Sun-Induced Chlorophyll Fluorescence to Estimate Net Photosynthesis of Vegetation Canopies: A SCOPE Modeling Study. Remote Sens. Environ. 2016, 176, 139–151. [Google Scholar] [CrossRef]
  25. Smith, W.K.; Biederman, J.A.; Scott, R.L.; Moore, D.J.P.; He, M.; Kimball, J.S.; Yan, D.; Hudson, A.; Barnes, M.L.; MacBean, N.; et al. Chlorophyll Fluorescence Better Captures Seasonal and Interannual Gross Primary Productivity Dynamics Across Dryland Ecosystems of Southwestern North America. Geophys. Res. Lett. 2018, 45, 748–757. [Google Scholar] [CrossRef]
  26. Yan, D.; Scott, R.L.; Moore, D.J.P.; Biederman, J.A.; Smith, W.K. Understanding the Relationship between Vegetation Greenness and Productivity across Dryland Ecosystems through the Integration of PhenoCam, Satellite, and Eddy Covariance Data. Remote Sens. Environ. 2019, 223, 50–62. [Google Scholar] [CrossRef]
  27. Wang, X.; Qiu, B.; Li, W.; Zhang, Q. Impacts of Drought and Heatwave on the Terrestrial Ecosystem in China as Revealed by Satellite Solar-Induced Chlorophyll Fluorescence. Sci. Total Environ. 2019, 693, 133627. [Google Scholar] [CrossRef]
  28. Song, L.; Li, Y.; Ren, Y.; Wu, X.; Guo, B.; Tang, X.; Shi, W.; Ma, M.; Han, X.; Zhao, L. Divergent Vegetation Responses to Extreme Spring and Summer Droughts in Southwestern China. Agric. For. Meteorol. 2019, 279, 107703. [Google Scholar] [CrossRef]
  29. Chen, J.M.; Black, T.A. Defining Leaf Area Index for Non-flat Leaves. Plant. Cell Environ. 1992, 15, 421–429. [Google Scholar] [CrossRef]
  30. Sprintsin, M.; Cohen, S.; Maseyk, K.; Rotenberg, E.; Grünzweig, J.; Karnieli, A.; Berliner, P.; Yakir, D. Long Term and Seasonal Courses of Leaf Area Index in a Semi-Arid Forest Plantation. Agric. For. Meteorol. 2011, 151, 565–574. [Google Scholar] [CrossRef]
  31. Wei, F.; Wang, S.; Fu, B.; Wang, L.; Zhang, W.; Wang, L.; Pan, N.; Fensholt, R. Divergent Trends of Ecosystem-Scale Photosynthetic Efficiency between Arid and Humid Lands across the Globe. Glob. Ecol. Biogeogr. 2022, 31, 1824–1837. [Google Scholar] [CrossRef]
  32. Cheng, Q.; Gao, L.; Zhong, F.; Zuo, X.; Ma, M. Spatiotemporal Variations of Drought in the Yunnan-Guizhou Plateau, Southwest China, during 1960–2013 and Their Association with Large-Scale Circulations and Historical Records. Ecol. Indic. 2020, 112, 106041. [Google Scholar] [CrossRef]
  33. Ma, S.; Zhang, S.; Wang, N.; Huang, C.; Wang, X. Prolonged Duration and Increased Severity of Agricultural Droughts during 1978 to 2016 Detected by ESA CCI SM in the Humid Yunnan Province, Southwest China. Catena 2021, 198, 105036. [Google Scholar] [CrossRef]
  34. Liu, C.; Liu, Y.; Guo, K.; Wang, S.; Liu, H.; Zhao, H.; Qiao, X.; Hou, D.; Li, S. Aboveground Carbon Stock, Allocation and Sequestration Potential during Vegetation Recovery in the Karst Region of Southwestern China: A Case Study at a Watershed Scale. Agric. Ecosyst. Environ. 2016, 235, 91–100. [Google Scholar] [CrossRef]
  35. Meng, X.; Mao, K.; Meng, F.; Shi, J.; Zeng, J.; Shen, X.; Cui, Y.; Jiang, L.; Guo, Z. A Fine-Resolution Soil Moisture Dataset for China in 2002–2018. Earth Syst. Sci. Data 2021, 13, 3239–3261. [Google Scholar] [CrossRef]
  36. Li, X.; Xiao, J. Mapping Photosynthesis Solely from Solar-Induced Chlorophyll Fluorescence: A Global, Fine-Resolution Dataset of Gross Primary Production Derived from OCO-2. Remote Sens. 2019, 11, 2563. [Google Scholar] [CrossRef] [Green Version]
  37. Hamed, K.H.; Rao, A.R. Hydrology A Modified Mann-Kendall Trend Test for Autocorrelated Data. J. Hydrol. 1998, 204, 186–192. [Google Scholar] [CrossRef]
  38. Wang, J.; Xu, C. Geodetector: Principle and Prospective. Dili Xuebao/Acta Geogr. Sin. 2017, 72, 116–134. [Google Scholar] [CrossRef]
  39. Yang, J.; Tian, H.; Pan, S.; Chen, G.; Zhang, B.; Dangal, S. Amazon Drought and Forest Response: Largely Reduced Forest Photosynthesis but Slightly Increased Canopy Greenness during the Extreme Drought of 2015/2016. Glob. Change Biol. 2018, 24, 1919–1934. [Google Scholar] [CrossRef]
  40. Marrs, J.K.; Reblin, J.S.; Logan, B.A.; Allen, D.W.; Reinmann, A.B.; Bombard, D.M.; Tabachnik, D.; Hutyra, L.R. Solar-Induced Fluorescence Does Not Track Photosynthetic Carbon Assimilation Following Induced Stomatal Closure. Geophys. Res. Lett. 2020, 47, e2020GL087956. [Google Scholar] [CrossRef]
  41. Jain, A.K. Large-scale droughts responsible for dramatic reductions of terrestrial net carbon uptake over North America in 2011 and 2012. J. Geophys. Res. Biogeosci. 2018, 123, 2053–2071. [Google Scholar]
  42. Guan, K.; Berry, J.A.; Zhang, Y.; Joiner, J.; Guanter, L.; Badgley, G.; Lobell, D.B. Improving the Monitoring of Crop Productivity Using Spaceborne Solar-Induced Fluorescence. Glob. Change Biol. 2016, 22, 716–726. [Google Scholar] [CrossRef] [PubMed]
  43. Sun, Y.; Fu, R.; Dickinson, R.; Joiner, J.; Frankenberg, C.; Gu, L.; Xia, Y.; Fernando, N. Drought Onset Mechanisms Revealed by Satellite Solar-Induced Chlorophyll Fluorescence: Insights from Two Contrasting Extreme Events. J. Geophys. Res. G Biogeosci. 2015, 120, 2427–2440. [Google Scholar] [CrossRef] [Green Version]
  44. Daumard, F.; Champagne, S.; Fournier, A.; Goulas, Y.; Ounis, A.; Hanocq, J.F.; Moya, I. A Field Platform for Continuous Measurement of Canopy Fluorescence. IEEE Trans. Geosci. Remote Sens. 2010, 48, 3358–3368. [Google Scholar] [CrossRef]
  45. Migliavacca, M.; Perez-Priego, O.; Rossini, M.; El-Madany, T.S.; Moreno, G.; van der Tol, C.; Rascher, U.; Berninger, A.; Bessenbacher, V.; Burkart, A.; et al. Plant Functional Traits and Canopy Structure Control the Relationship between Photosynthetic CO2 Uptake and Far-Red Sun-Induced Fluorescence in a Mediterranean Grassland under Different Nutrient Availability. New Phytol. 2017, 214, 1078–1091. [Google Scholar] [CrossRef] [Green Version]
  46. Fan, Y.; Wang, L.; Su, T.; Lan, Q. Spring Drought as a Possible Cause for Disappearance of Native Metasequoia in Yunnan Province, China: Evidence from Seed Germination and Seedling Growth. Glob. Ecol. Conserv. 2020, 22, e00912. [Google Scholar] [CrossRef]
  47. Su, B.; Huang, J.; Fischer, T.; Wang, Y.; Kundzewicz, Z.W.; Zhai, J.; Sun, H.; Wang, A.; Zeng, X.; Wang, G.; et al. Drought Losses in China Might Double between the 1.5 °C and 2.0 °C Warming. Proc. Natl. Acad. Sci. USA 2018, 115, 10600–10605. [Google Scholar] [CrossRef] [PubMed] [Green Version]
  48. Gu, L.; Han, J.; Wood, J.D.; Chang, C.Y.Y.; Sun, Y. Sun-Induced Chl Fluorescence and Its Importance for Biophysical Modeling of Photosynthesis Based on Light Reactions. New Phytol. 2019, 223, 1179–1191. [Google Scholar] [CrossRef] [Green Version]
  49. Hikosaka, K.; Ishikawa, K.; Borjigidai, A.; Muller, O.; Onoda, Y. Temperature Acclimation of Photosynthesis: Mechanisms Involved in the Changes in Temperature Dependence of Photosynthetic Rate. J. Exp. Bot. 2006, 57, 291–302. [Google Scholar] [CrossRef] [Green Version]
  50. Kimm, H.; Guan, K.; Burroughs, C.H.; Peng, B.; Ainsworth, E.A.; Bernacchi, C.J.; Moore, C.E.; Kumagai, E.; Yang, X.; Berry, J.A.; et al. Quantifying High-Temperature Stress on Soybean Canopy Photosynthesis: The Unique Role of Sun-Induced Chlorophyll Fluorescence. Glob. Change Biol. 2021, 27, 2403–2415. [Google Scholar] [CrossRef]
  51. Rossini, M.; Nedbal, L.; Guanter, L.; Ač, A.; Alonso, L.; Burkart, A.; Cogliati, S.; Colombo, R.; Damm, A.; Drusch, M.; et al. Red and Far Red Sun-Induced Chlorophyll Fluorescence as a Measure of Plant Photosynthesis. Geophys. Res. Lett. 2015, 42, 1632–1639. [Google Scholar] [CrossRef]
  52. Perez-Priego, O.; Guan, J.; Rossini, M.; Fava, F.; Wutzler, T.; Moreno, G.; Carvalhais, N.; Carrara, A.; Kolle, O.; Julitta, T.; et al. Sun-Induced Chlorophyll Fluorescence and Photochemical Reflectance Index Improve Remote-Sensing Gross Primary Production Estimates under Varying Nutrient Availability in a Typical Mediterranean Savanna Ecosystem. Biogeosciences 2015, 12, 6351–6367. [Google Scholar] [CrossRef] [Green Version]
  53. Wen, L.; Guo, M.; Yin, S.; Huang, S.; Li, X.; Yu, F. Vegetation Phenology in Permafrost Regions of Northeastern China Based on MODIS and Solar-Induced Chlorophyll Fluorescence. Chin. Geogr. Sci. 2021, 31, 459–473. [Google Scholar] [CrossRef]
  54. Guo, M.; Li, J.; Huang, S.; Wen, L. Feasibility of Using MODIS Products to Simulate Sun-Induced Chlorophyll Fluorescence (SIF) in Boreal Forests. Remote Sens. 2020, 12, 680. [Google Scholar] [CrossRef] [Green Version]
  55. Yao, T.; Liu, S.; Hu, S.; Mo, X. Response of Vegetation Ecosystems to Flash Drought with Solar-Induced Chlorophyll Fluorescence over the Hai River Basin, China during 2001–2019. J. Environ. Manage 2022, 313, 114947. [Google Scholar] [CrossRef]
  56. Mohammed, G.H.; Colombo, R.; Middleton, E.M.; Rascher, U.; van der Tol, C.; Nedbal, L.; Goulas, Y.; Pérez-Priego, O.; Damm, A.; Meroni, M.; et al. Remote Sensing of Solar-Induced Chlorophyll Fluorescence (SIF) in Vegetation: 50 years of Progress. Remote Sens. Environ. 2019, 231, 111177. [Google Scholar] [CrossRef]
  57. Alonso, L.; Van Wittenberghe, S.; Amorós-López, J.; Vila-Francés, J.; Gómez-Chova, L.; Moreno, J. Diurnal Cycle Relationships between Passive Fluorescence, PRI and NPQ of Vegetation in a Controlled Stress Experiment. Remote Sens. 2017, 9, 770. [Google Scholar] [CrossRef] [Green Version]
  58. Deng, H.J.; Pepin, N.C.; Chen, Y.N.; Guo, B.; Zhang, S.H.; Zhang, Y.Q.; Chen, X.W.; Gao, L.; Liu, M.B.; Chen, Y. Dynamics of Diurnal Precipitation Differences and Their Spatial Variations in China. J. Appl. Meteorol. Clim. 2022, 61, 1015–1027. [Google Scholar] [CrossRef]
  59. Taylor, T.E.; Eldering, A.; Merrelli, A.; Kiel, M.; Somkuti, P.; Cheng, C.; Rosenberg, R.; Fisher, B.; Crisp, D.; Basilio, R.; et al. OCO-3 Early Mission Operations and Initial (VEarly) XCO2 and SIF Retrievals. Remote Sens. Environ. 2020, 251, 112032. [Google Scholar] [CrossRef]
  60. O’Brien, D.M.; Polonsky, I.N.; Utembe, S.R.; Rayner, P.J. Potential of a Geostationary GeoCARB Mission to Estimate Surface Emissions of CO2, CH4 and CO in a Polluted Urban Environment: Case Study Shanghai. Atmos. Meas. Tech. 2016, 9, 4633–4654. [Google Scholar] [CrossRef]
  61. Kraft, S.; Del Bello, U.; Bouvet, M.; Drusch, M.; Moreno, J. FLEX: ESA’s Earth Explorer 8 Candidate Mission. In Proceedings of the International Geoscience and Remote Sensing Symposium (IGARSS), Munich, Germany, 22–27 July 2012; pp. 7125–7128. [Google Scholar]
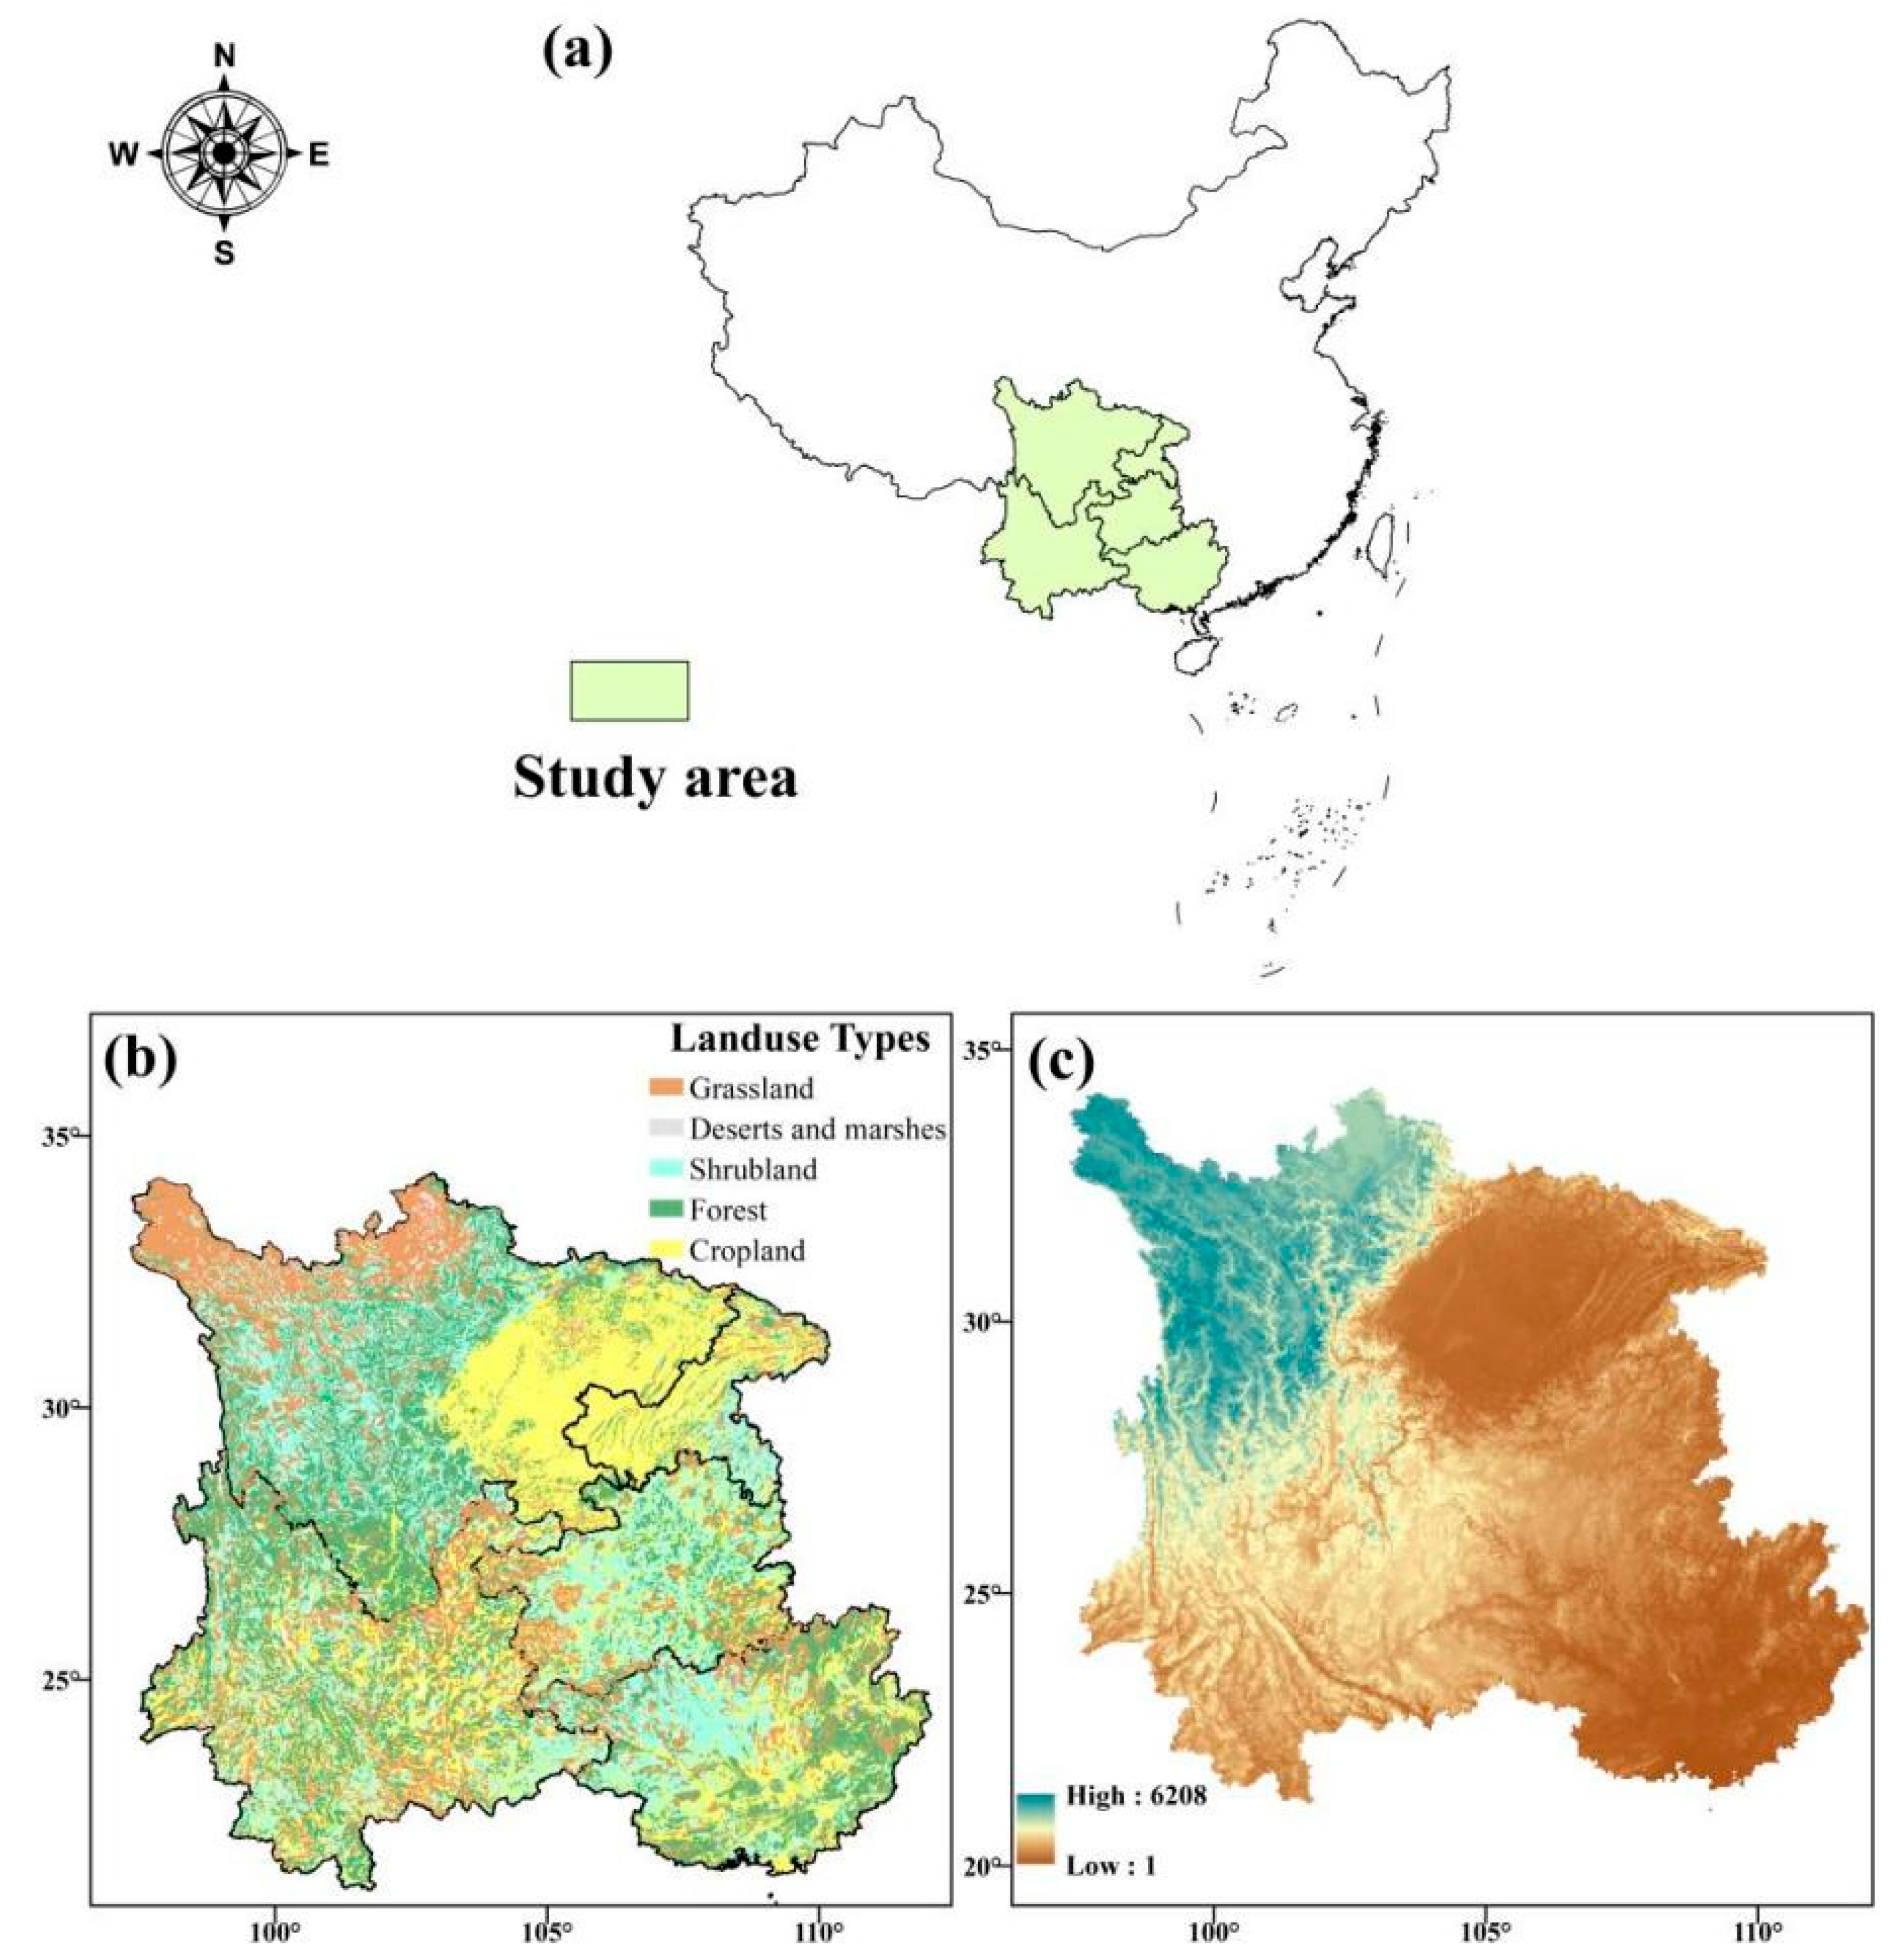
Figure 1. (a) Geographical location of southwest China; (b) vegetation types’ distribution map of the study area, reclassified according to 1:1,000,000 vegetation types in China; the main vegetation types in southwest China are cropland, forestland, grassland, and shrubland; (c) elevation map of the study area. The terrain in southwest China is very undulating and different.
Sustainability 15 01095 g001
Figure 2. Average (a) precipitation; (b) temperature during 2000–2015 in Southwest China.
Sustainability 15 01095 g002
Figure 3. The regional mean of SPEI from autumn 2009 to spring 2010 was compared with the multi-year mean from 2001 to 2015. The duration of the drought event was determined, and the dry period was from September 2009 to March 2010.
Sustainability 15 01095 g003
Figure 4. Spatial distribution of standardized anomalies of temperature and precipitation during the extreme drought period from September 2009 to March 2010 in the Southwest region.
Sustainability 15 01095 g004
Figure 5. (a) The trends under the long-term change period in southwest China from 2001 to 2015 (results obtained from the M–K test; greater than 0 indicate an increasing trend, and less than 0 represents decreasing trend); (b) Trend distribution area map of PEI throughout the study area.
Sustainability 15 01095 g005
Figure 6. Trends in the nine-month mean of PEI between 2001 and 2015. (The seven months is the dry period determined by the SPEI.).
Sustainability 15 01095 g006
Figure 7. Spatial distribution of the PEI normalized anomalies during drought (plots are showing a more significant PEI decline in northern grassland from September 2009 to March 2010).
Sustainability 15 01095 g007
Figure 8. Comparison of PEI regional mean values across different ecosystems during drought (including farmland, forestland, grassland, and shrubland).
Sustainability 15 01095 g008
Figure 9. The q value of the individual factors on the cropland and grassland ecosystem during the extreme drought in Southwest China. (These meteorological factors include the following: T: temperature, VPD: vapor pressure deficit, PAR: photosynthetically active radiation, RH: relative humidity, P: precipitation, SM: soil moisture).
Sustainability 15 01095 g009
Figure 10. The q value of the interaction effects for two different influencing factors on photosynthetic efficiency distribution of two ecosystems (cropland and grassland) in southwest China.
Sustainability 15 01095 g010
Table 1. SPEI classification standard.
SPEIDrought Level
≤−2.00Extreme drought
−2.00~−1.50Severe drought
−1.50~−1.00Moderate drought
−1.00~−0.50Mild drought
≥−0.50Non-Drought
Disclaimer/Publisher’s Note: The statements, opinions and data contained in all publications are solely those of the individual author(s) and contributor(s) and not of MDPI and/or the editor(s). MDPI and/or the editor(s) disclaim responsibility for any injury to people or property resulting from any ideas, methods, instructions or products referred to in the content.