


A Comparative Study of Factors Influencing Hydration Stoppage of Hardened Cement Paste


Abstract
1. Introduction
1.1. Direct Drying Method
1.2. Solvent Exchange Method
2. Materials and Methods
2.1. Materials
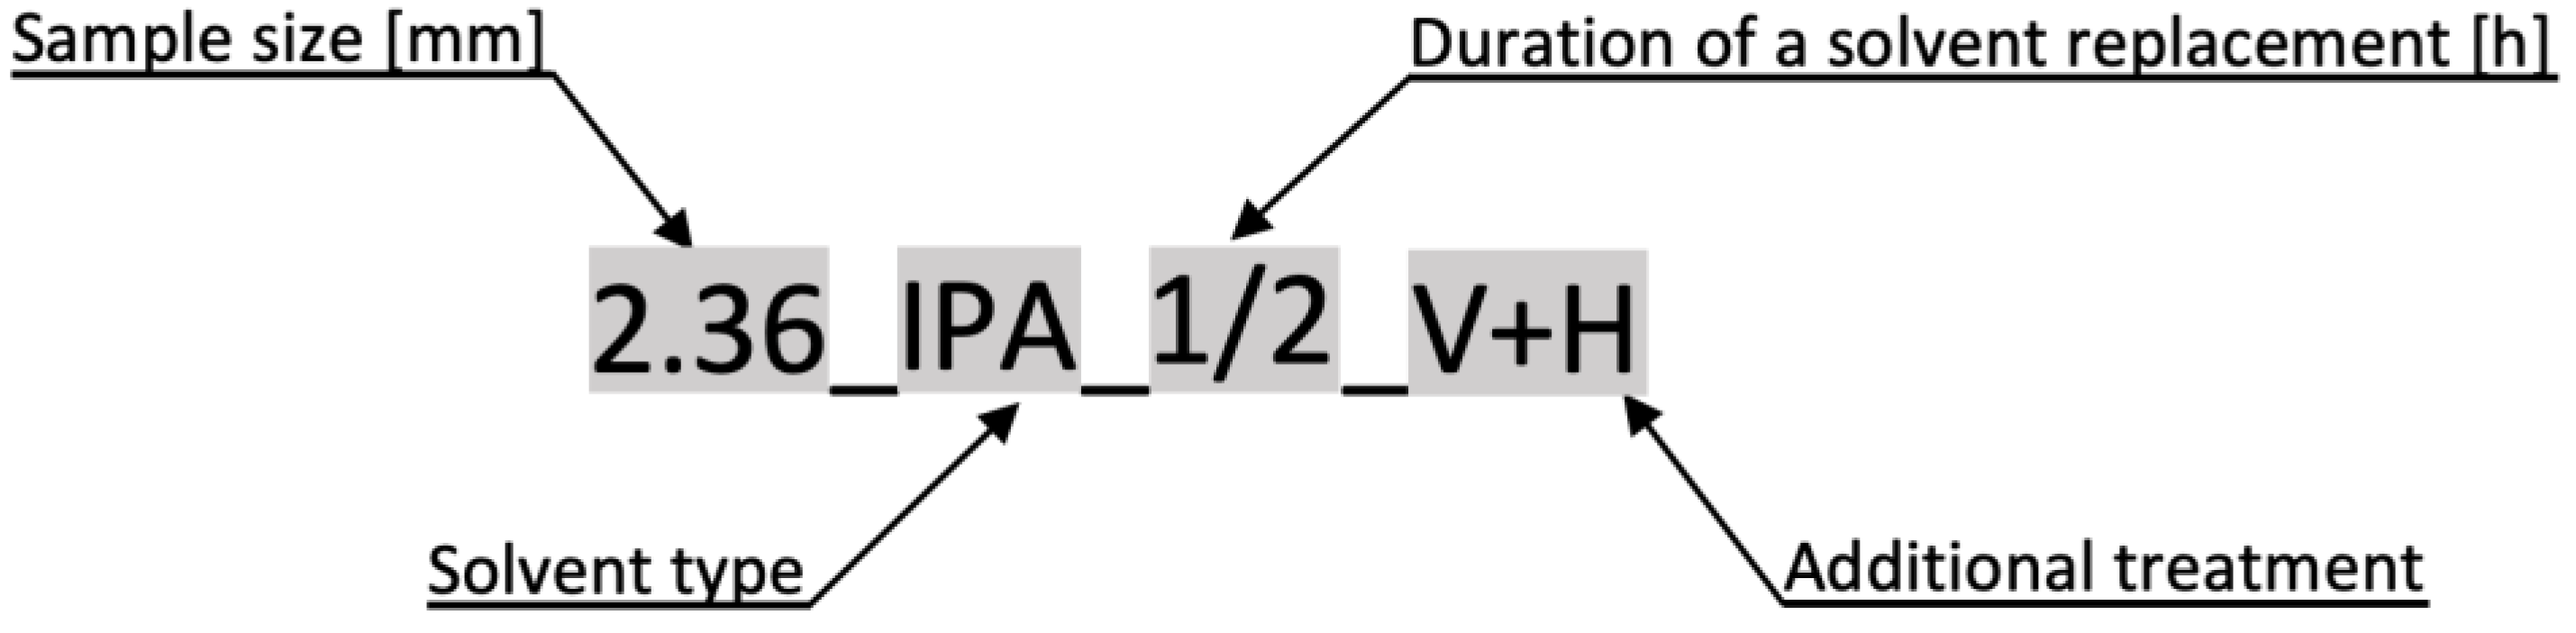
2.2. Preparation of Samples
- Duration of solvent replacement
- Solvent type
- Sample piece size
- Drying and freezing
2.3. Experimental Methods
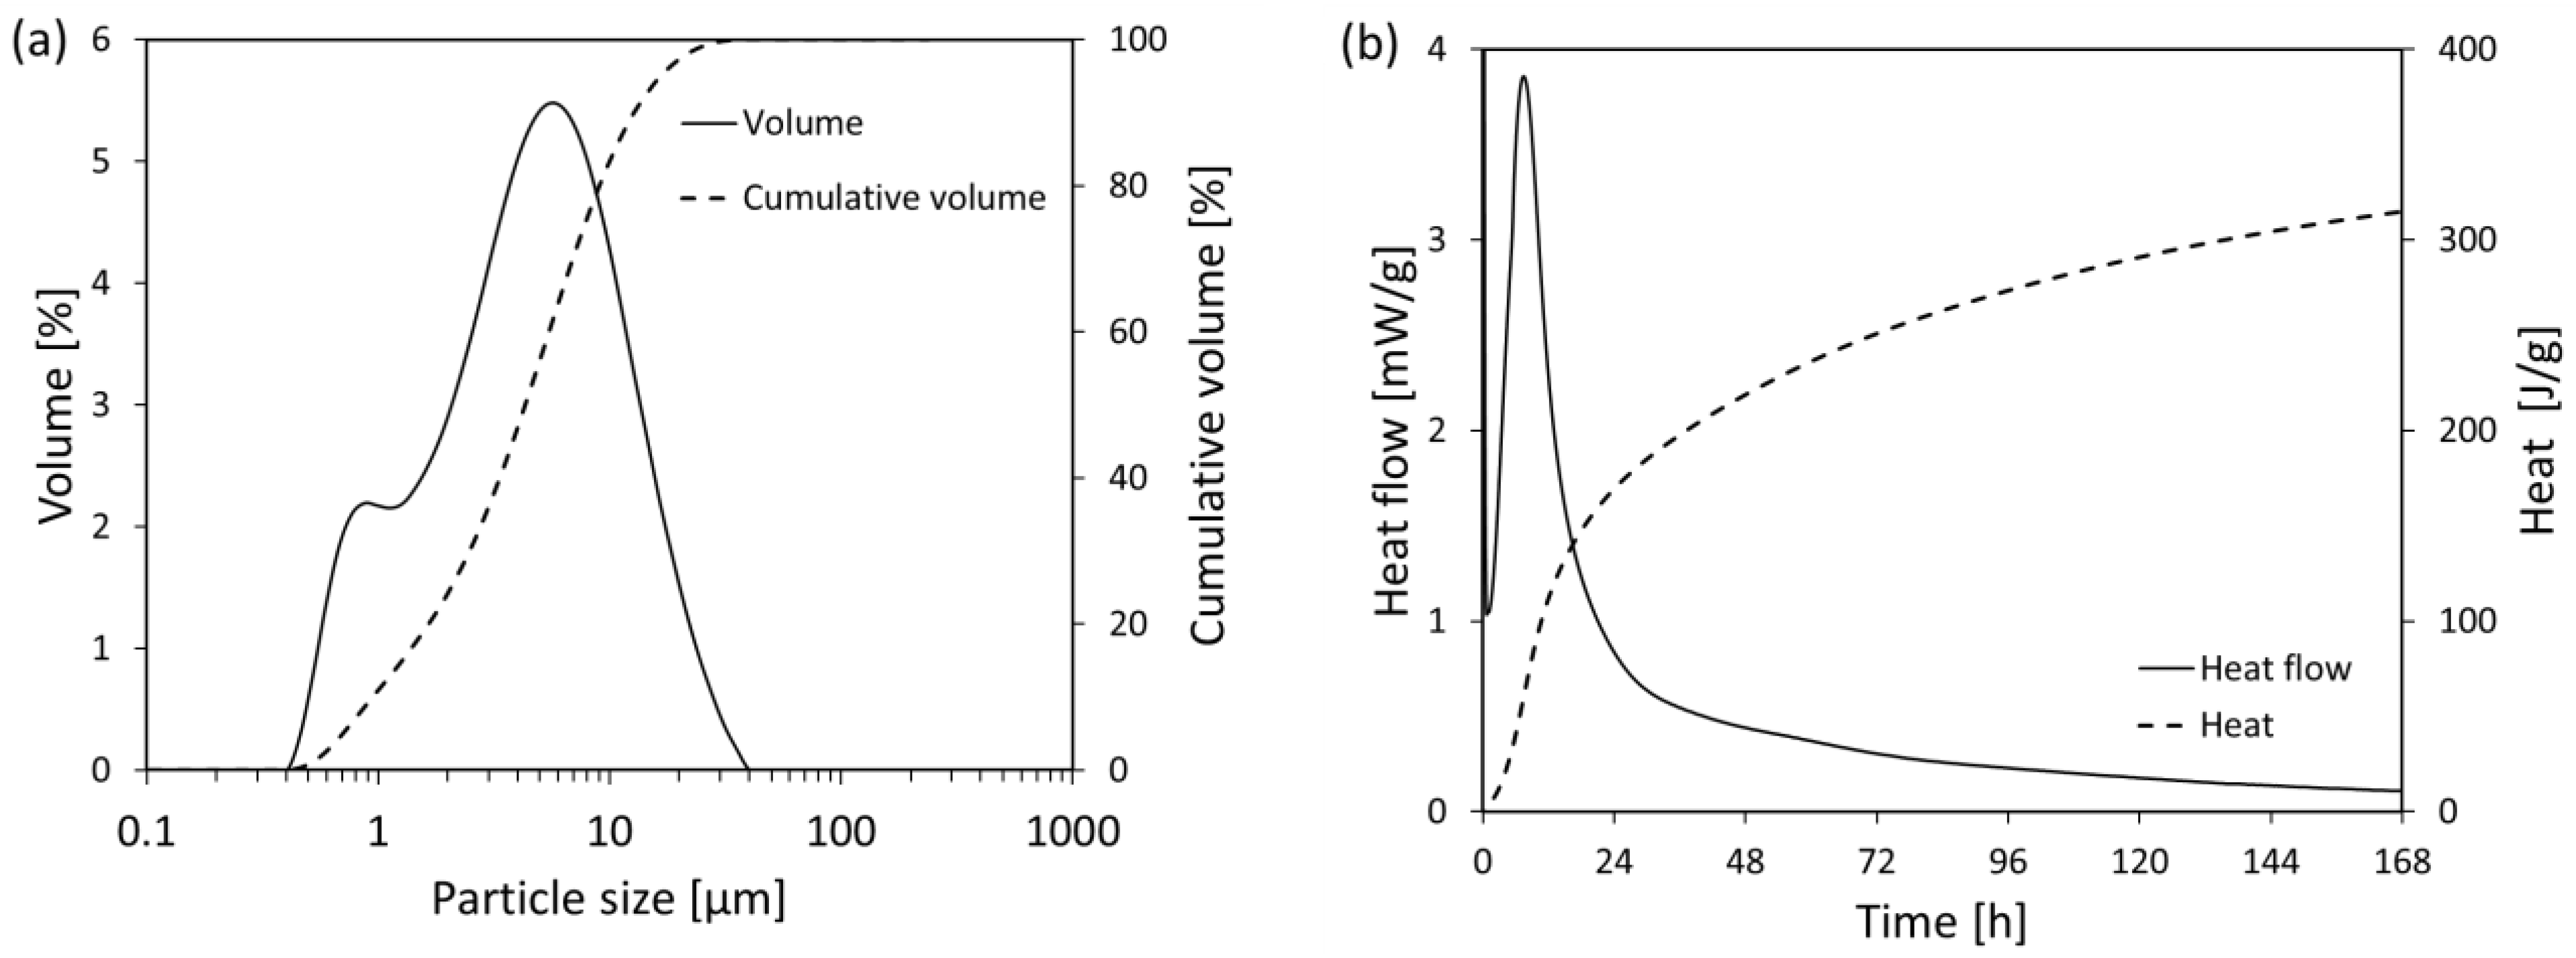
2.3.1. Particles Size Distribution
2.3.2. Thermo-Gravimetric Analysis
2.3.3. X-ray Diffraction
2.3.4. Isothermal Calorimetry
2.3.5. Mercury Intrusion Porosimetry (MIP)
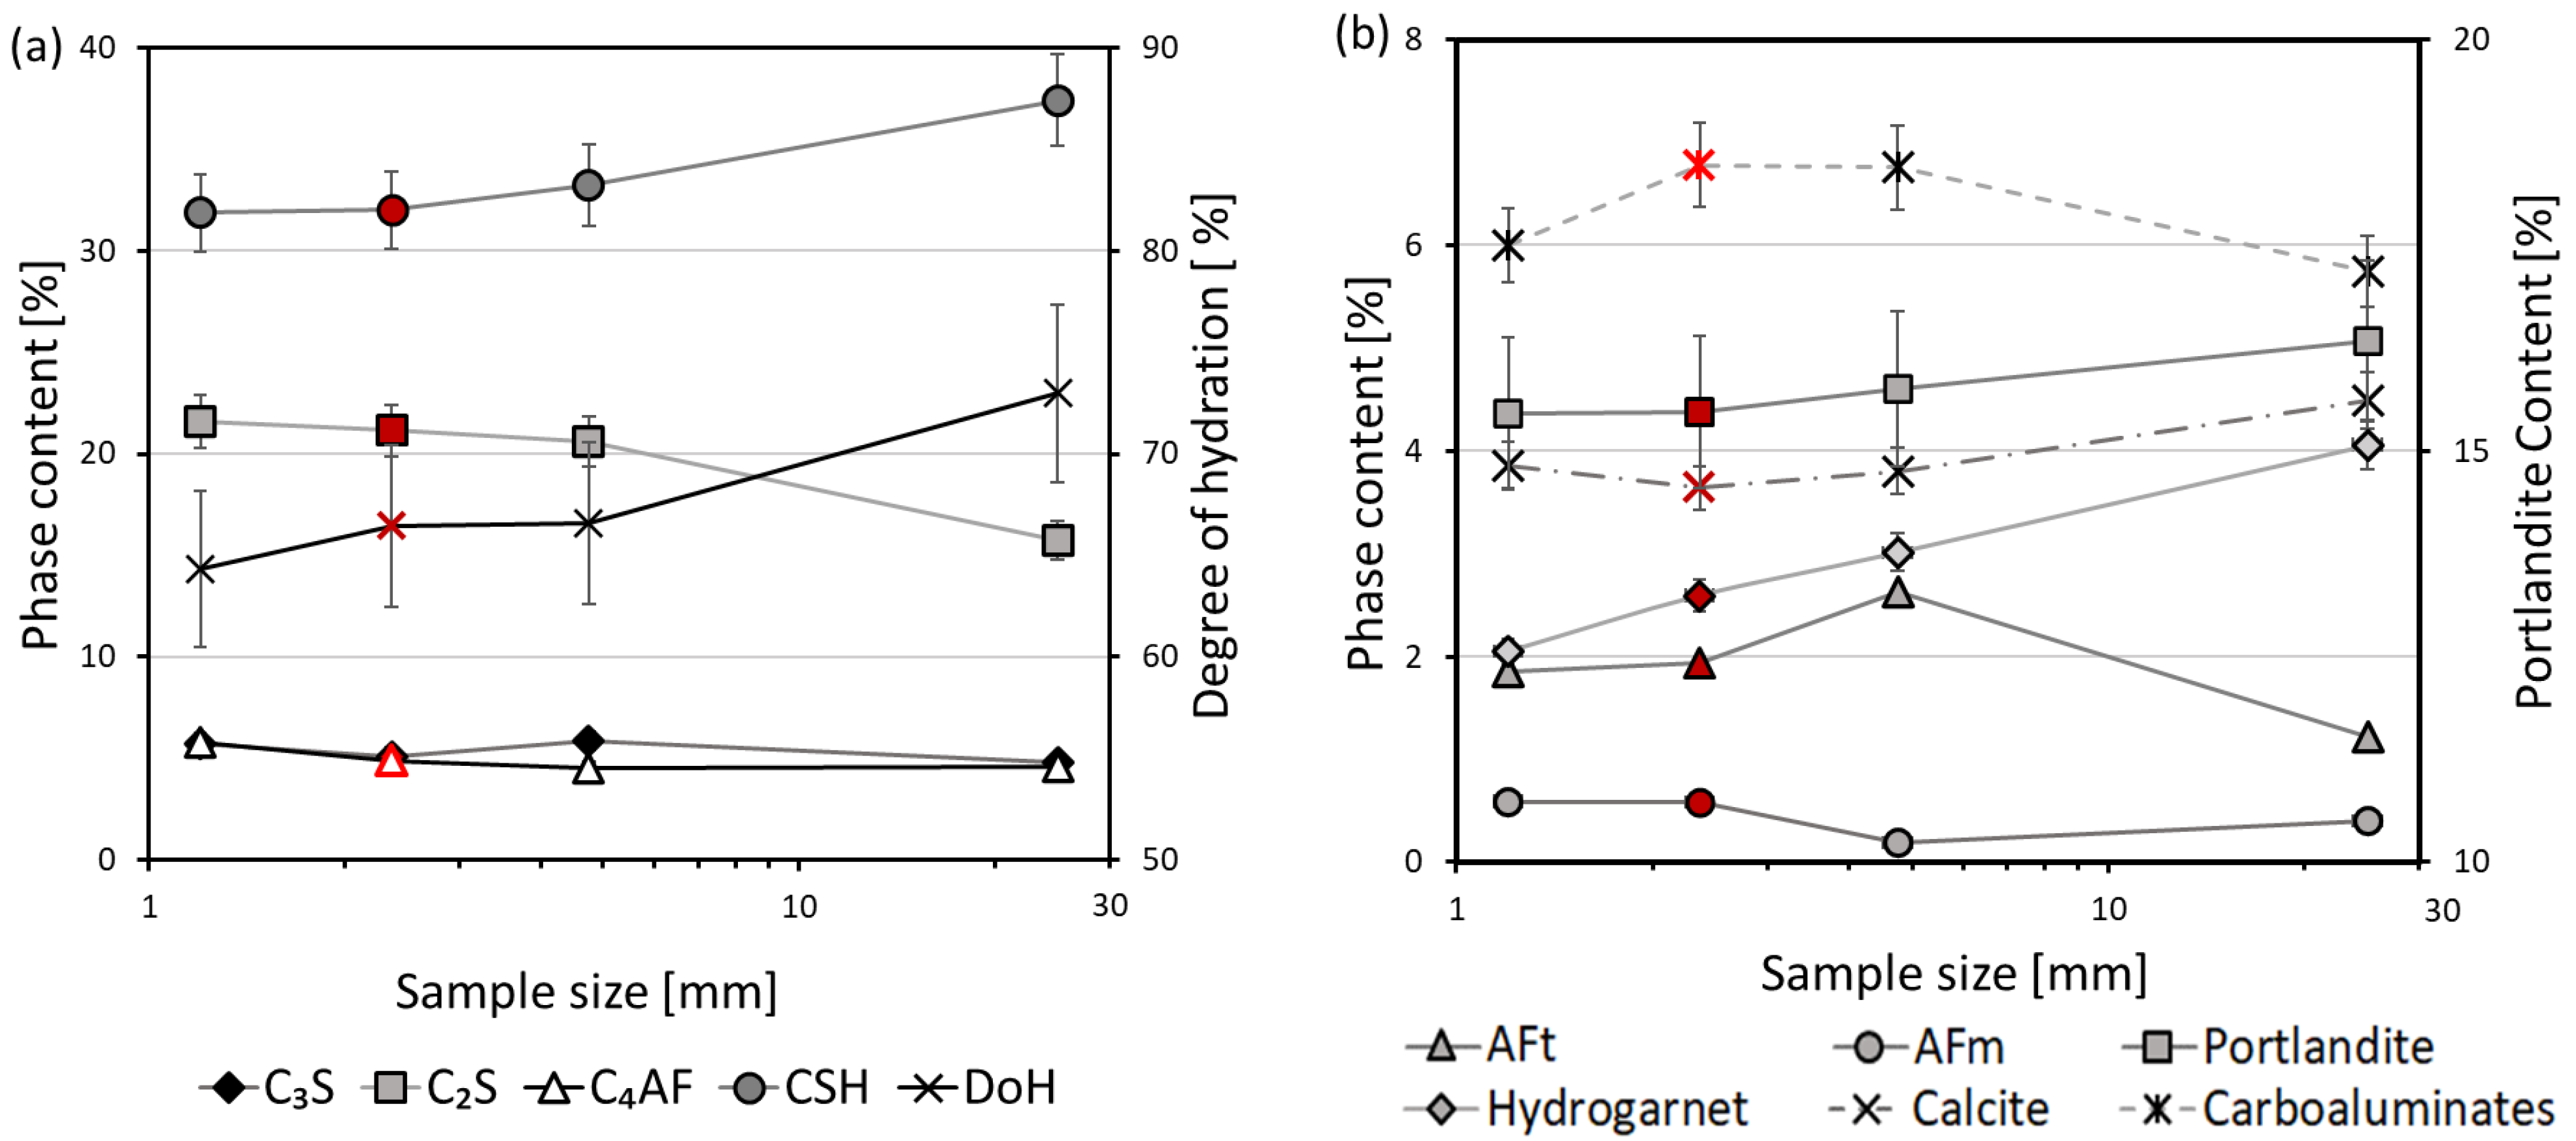
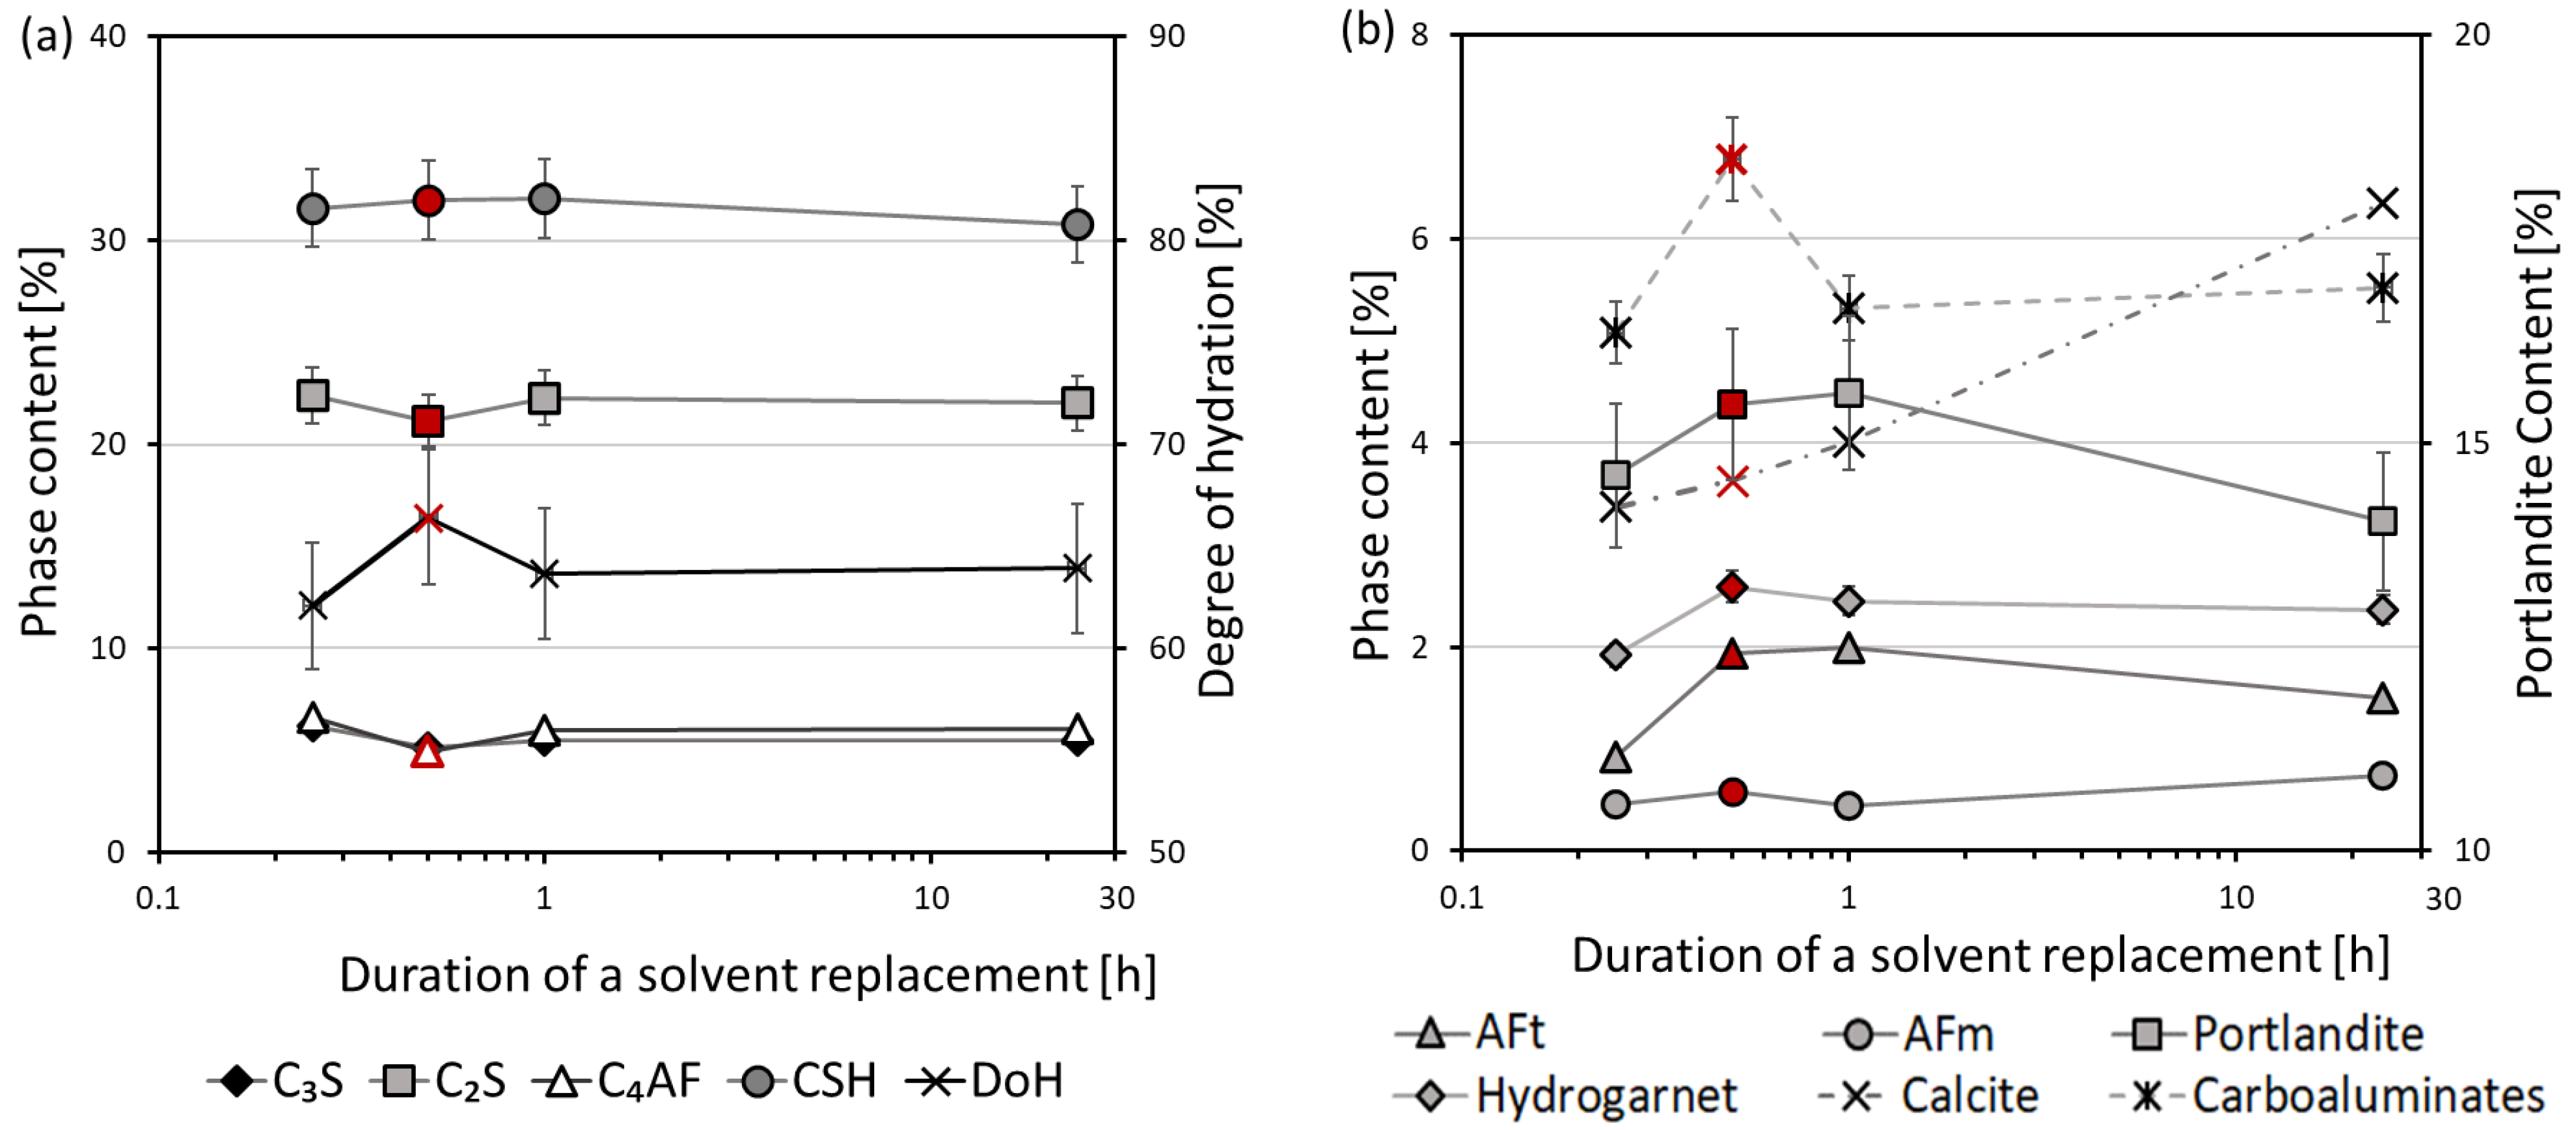
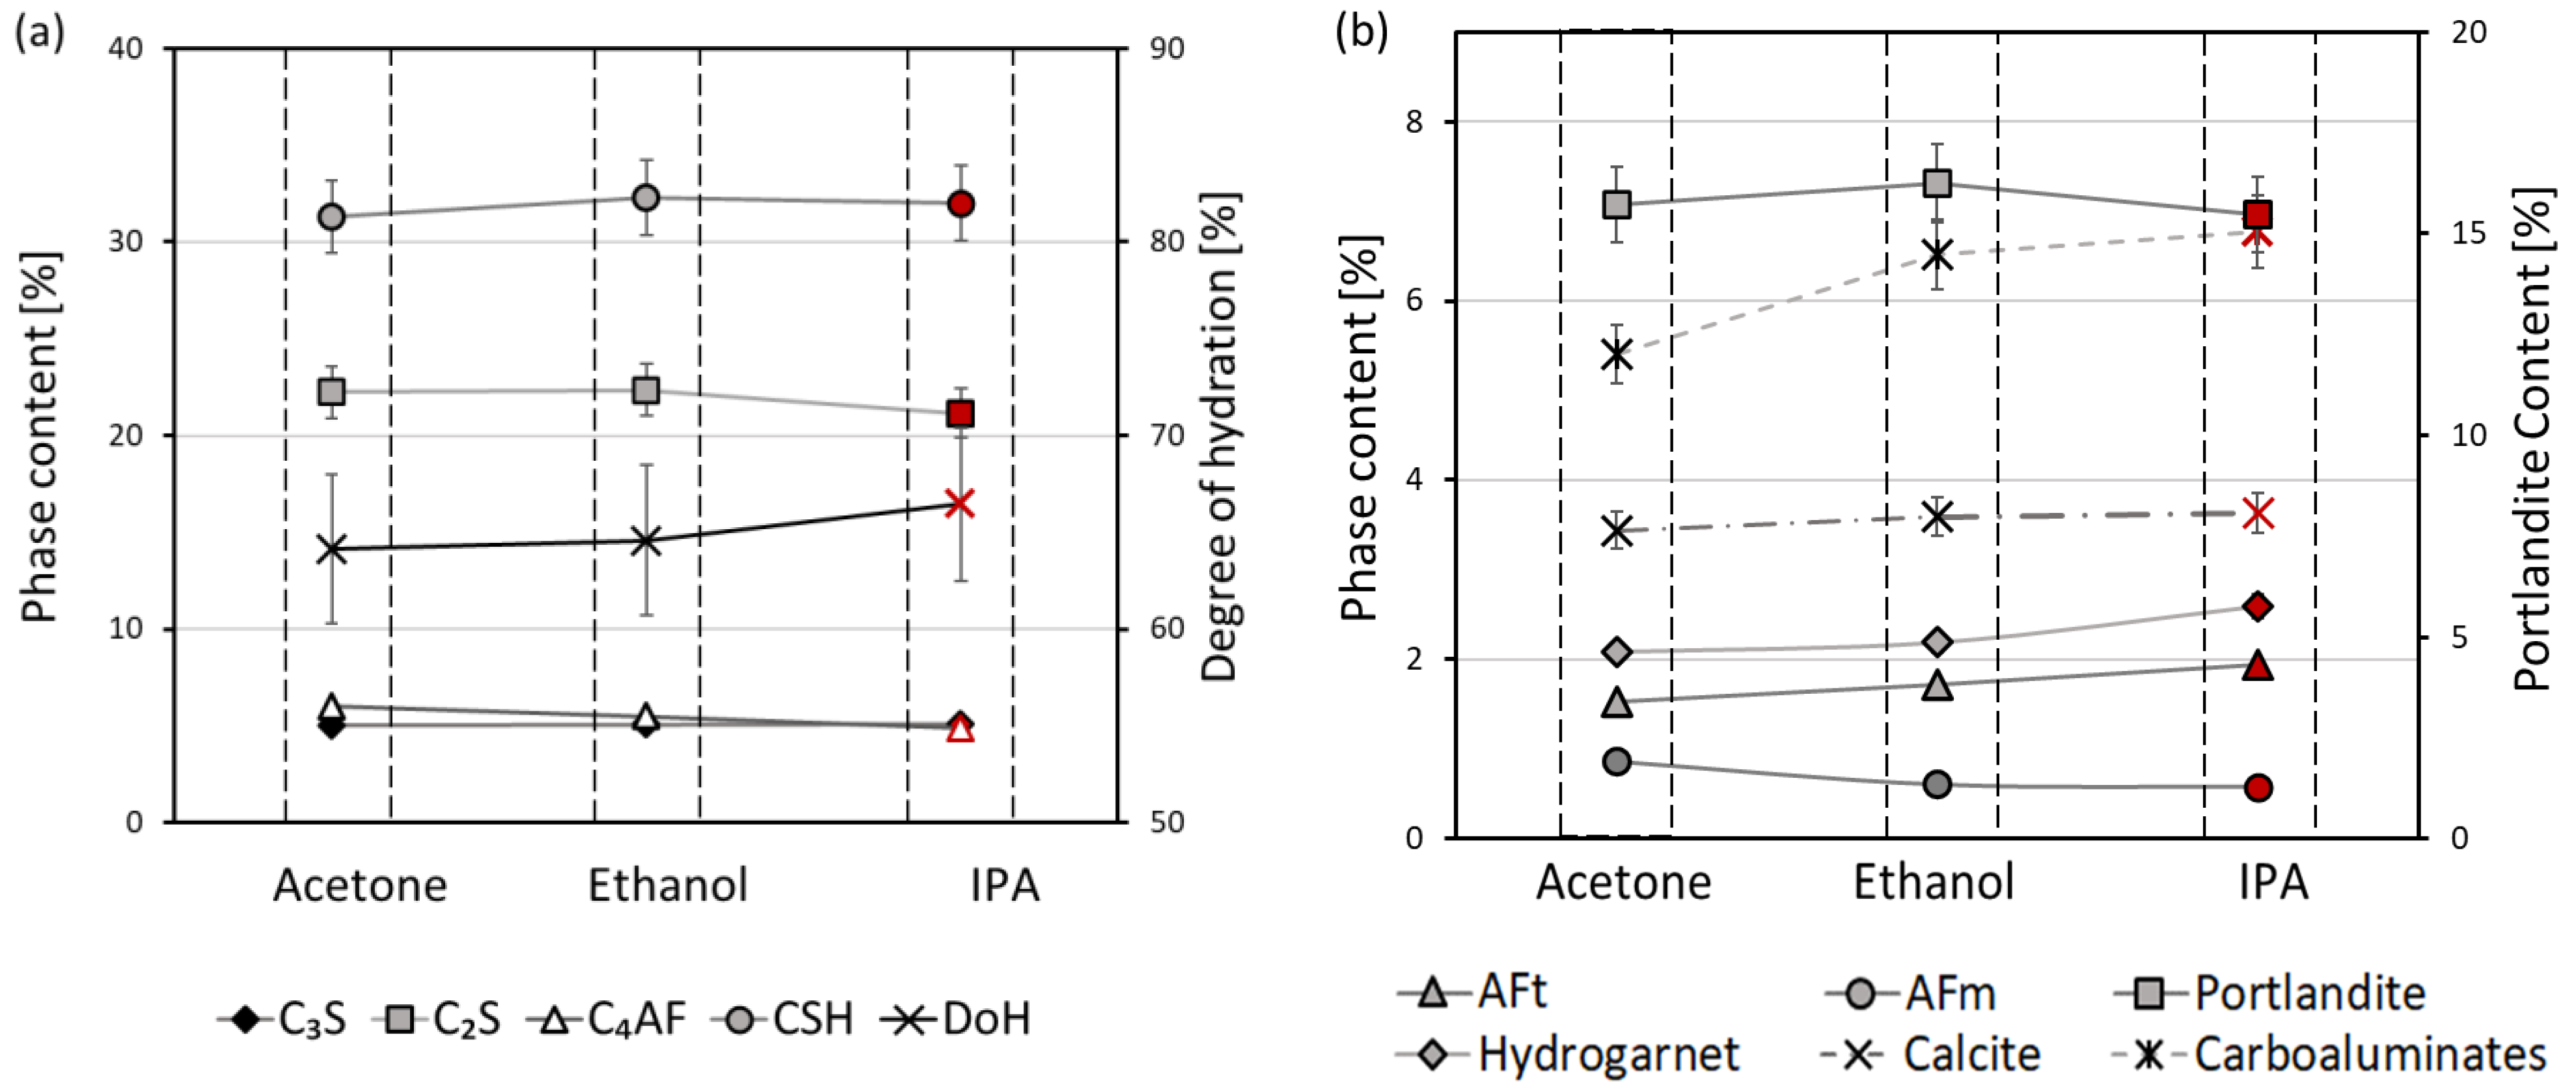
3. Results and Discussion
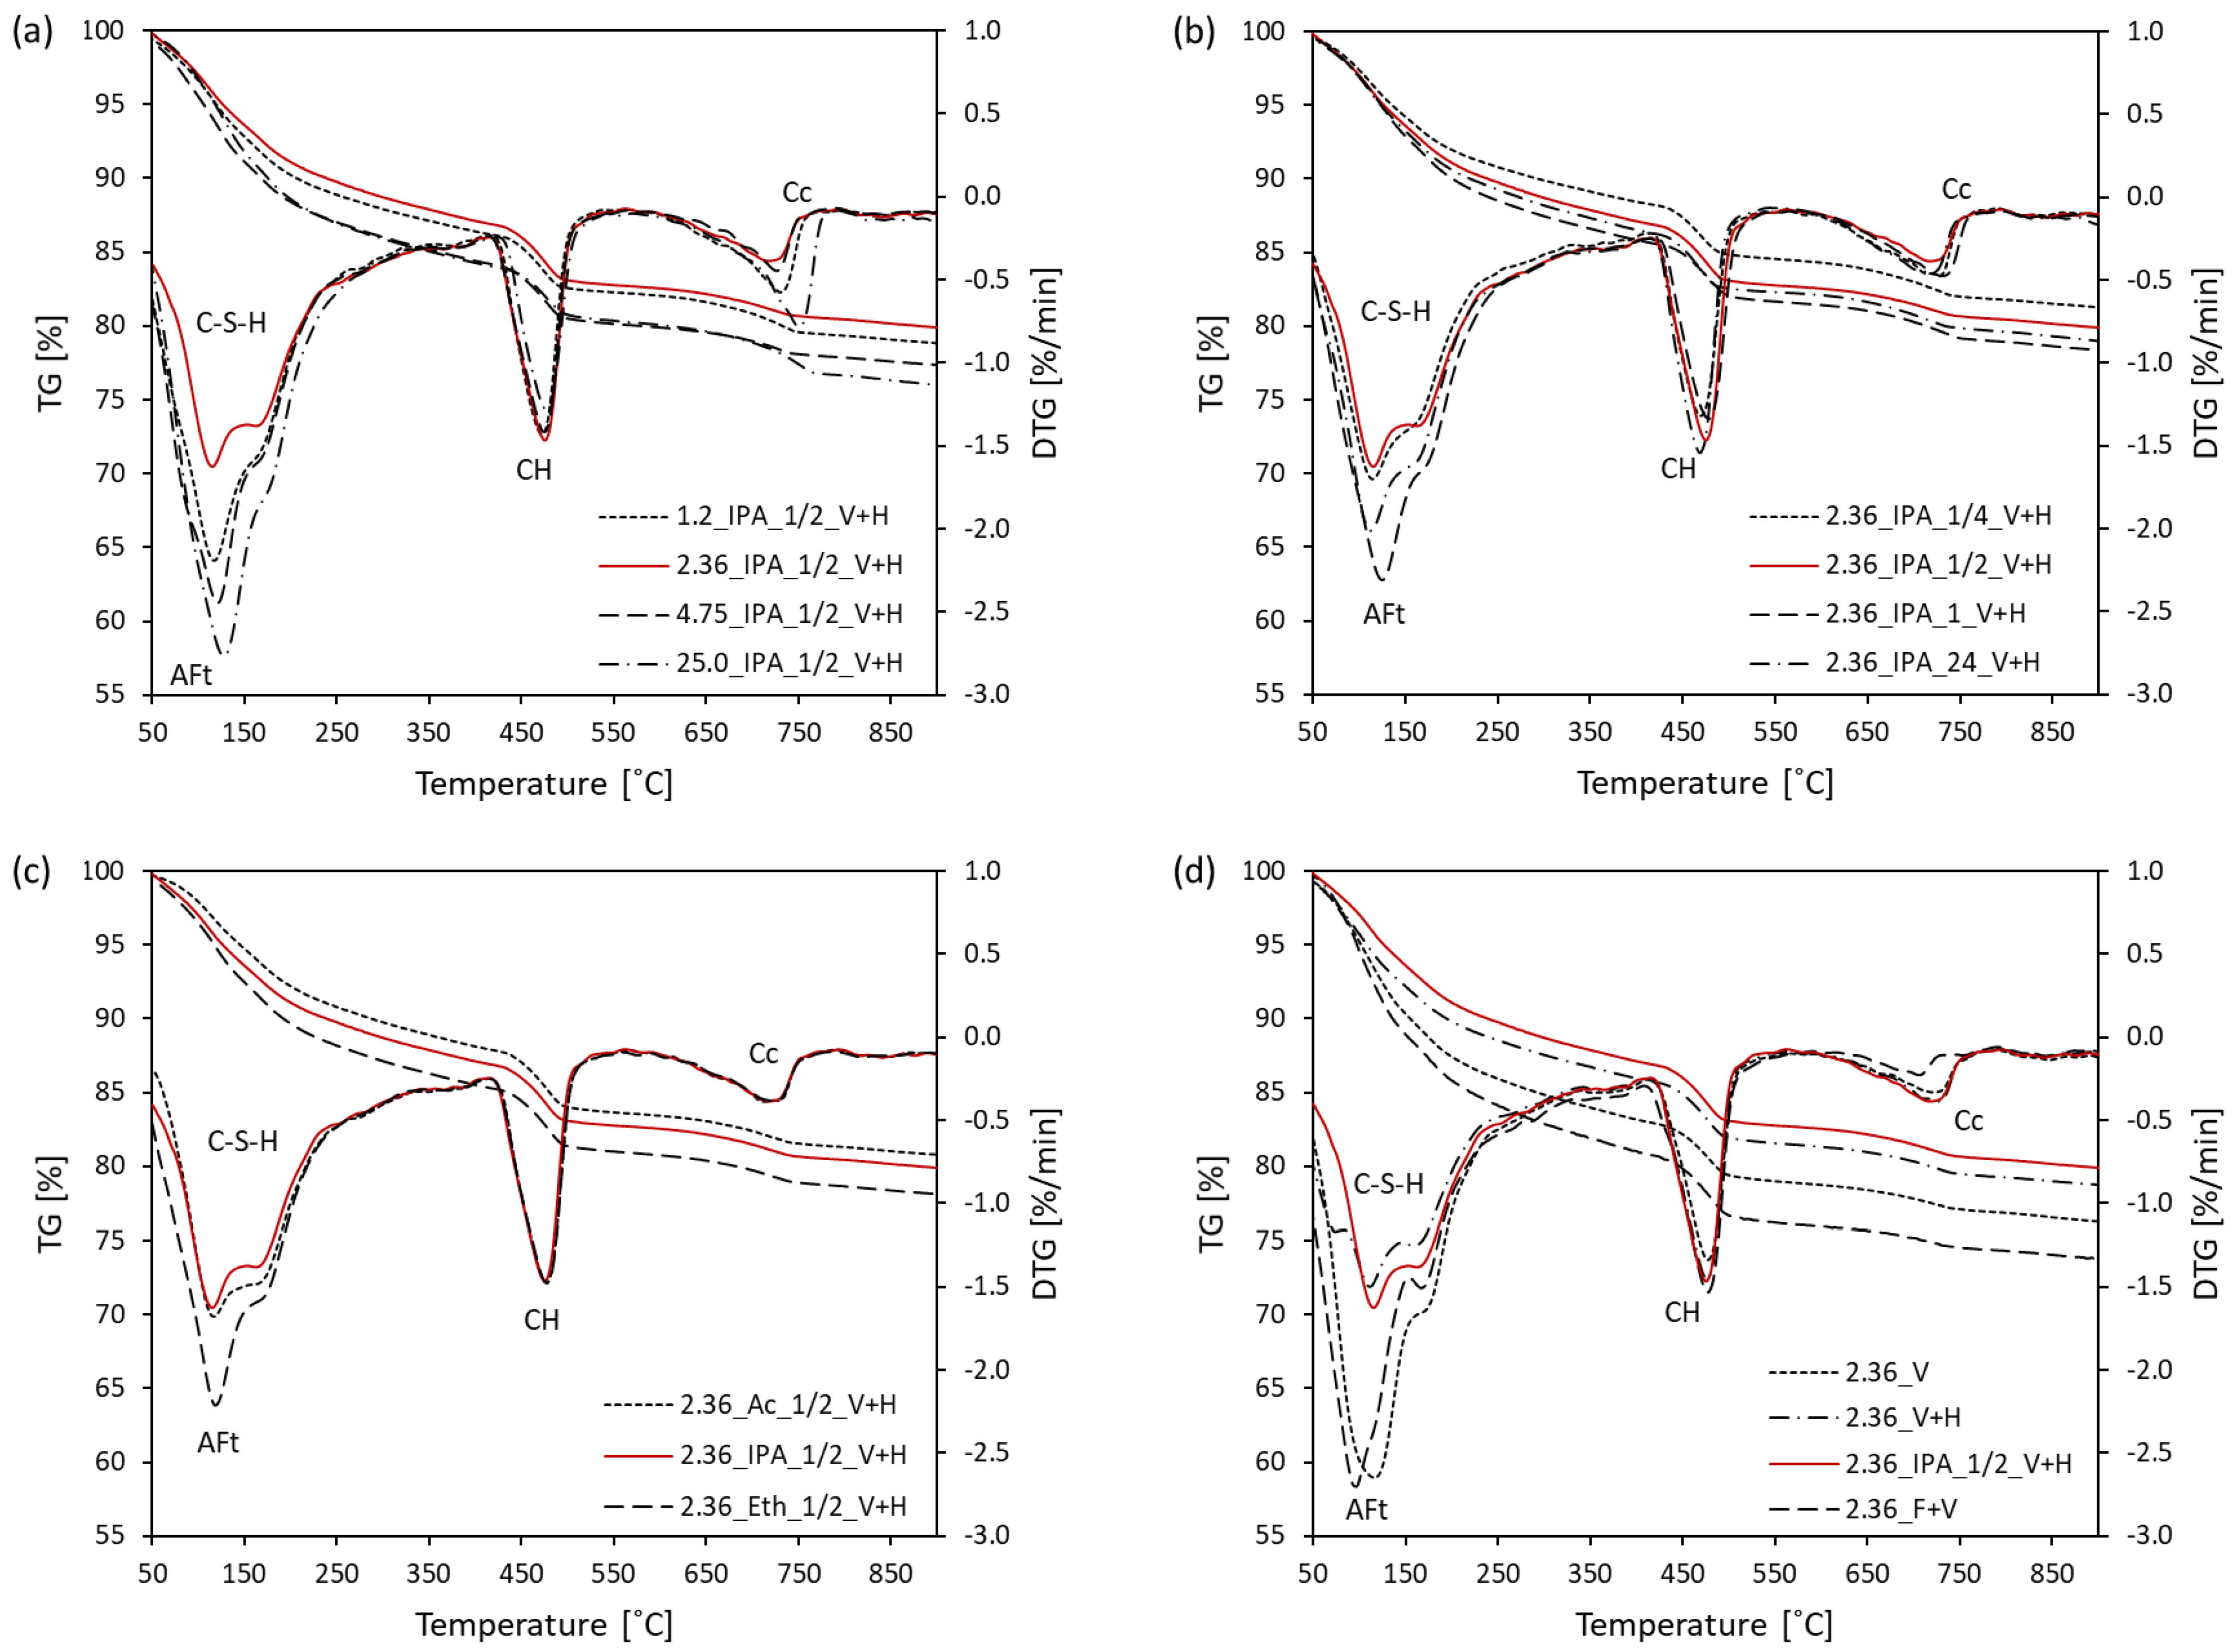
3.1. Thermal Analysis
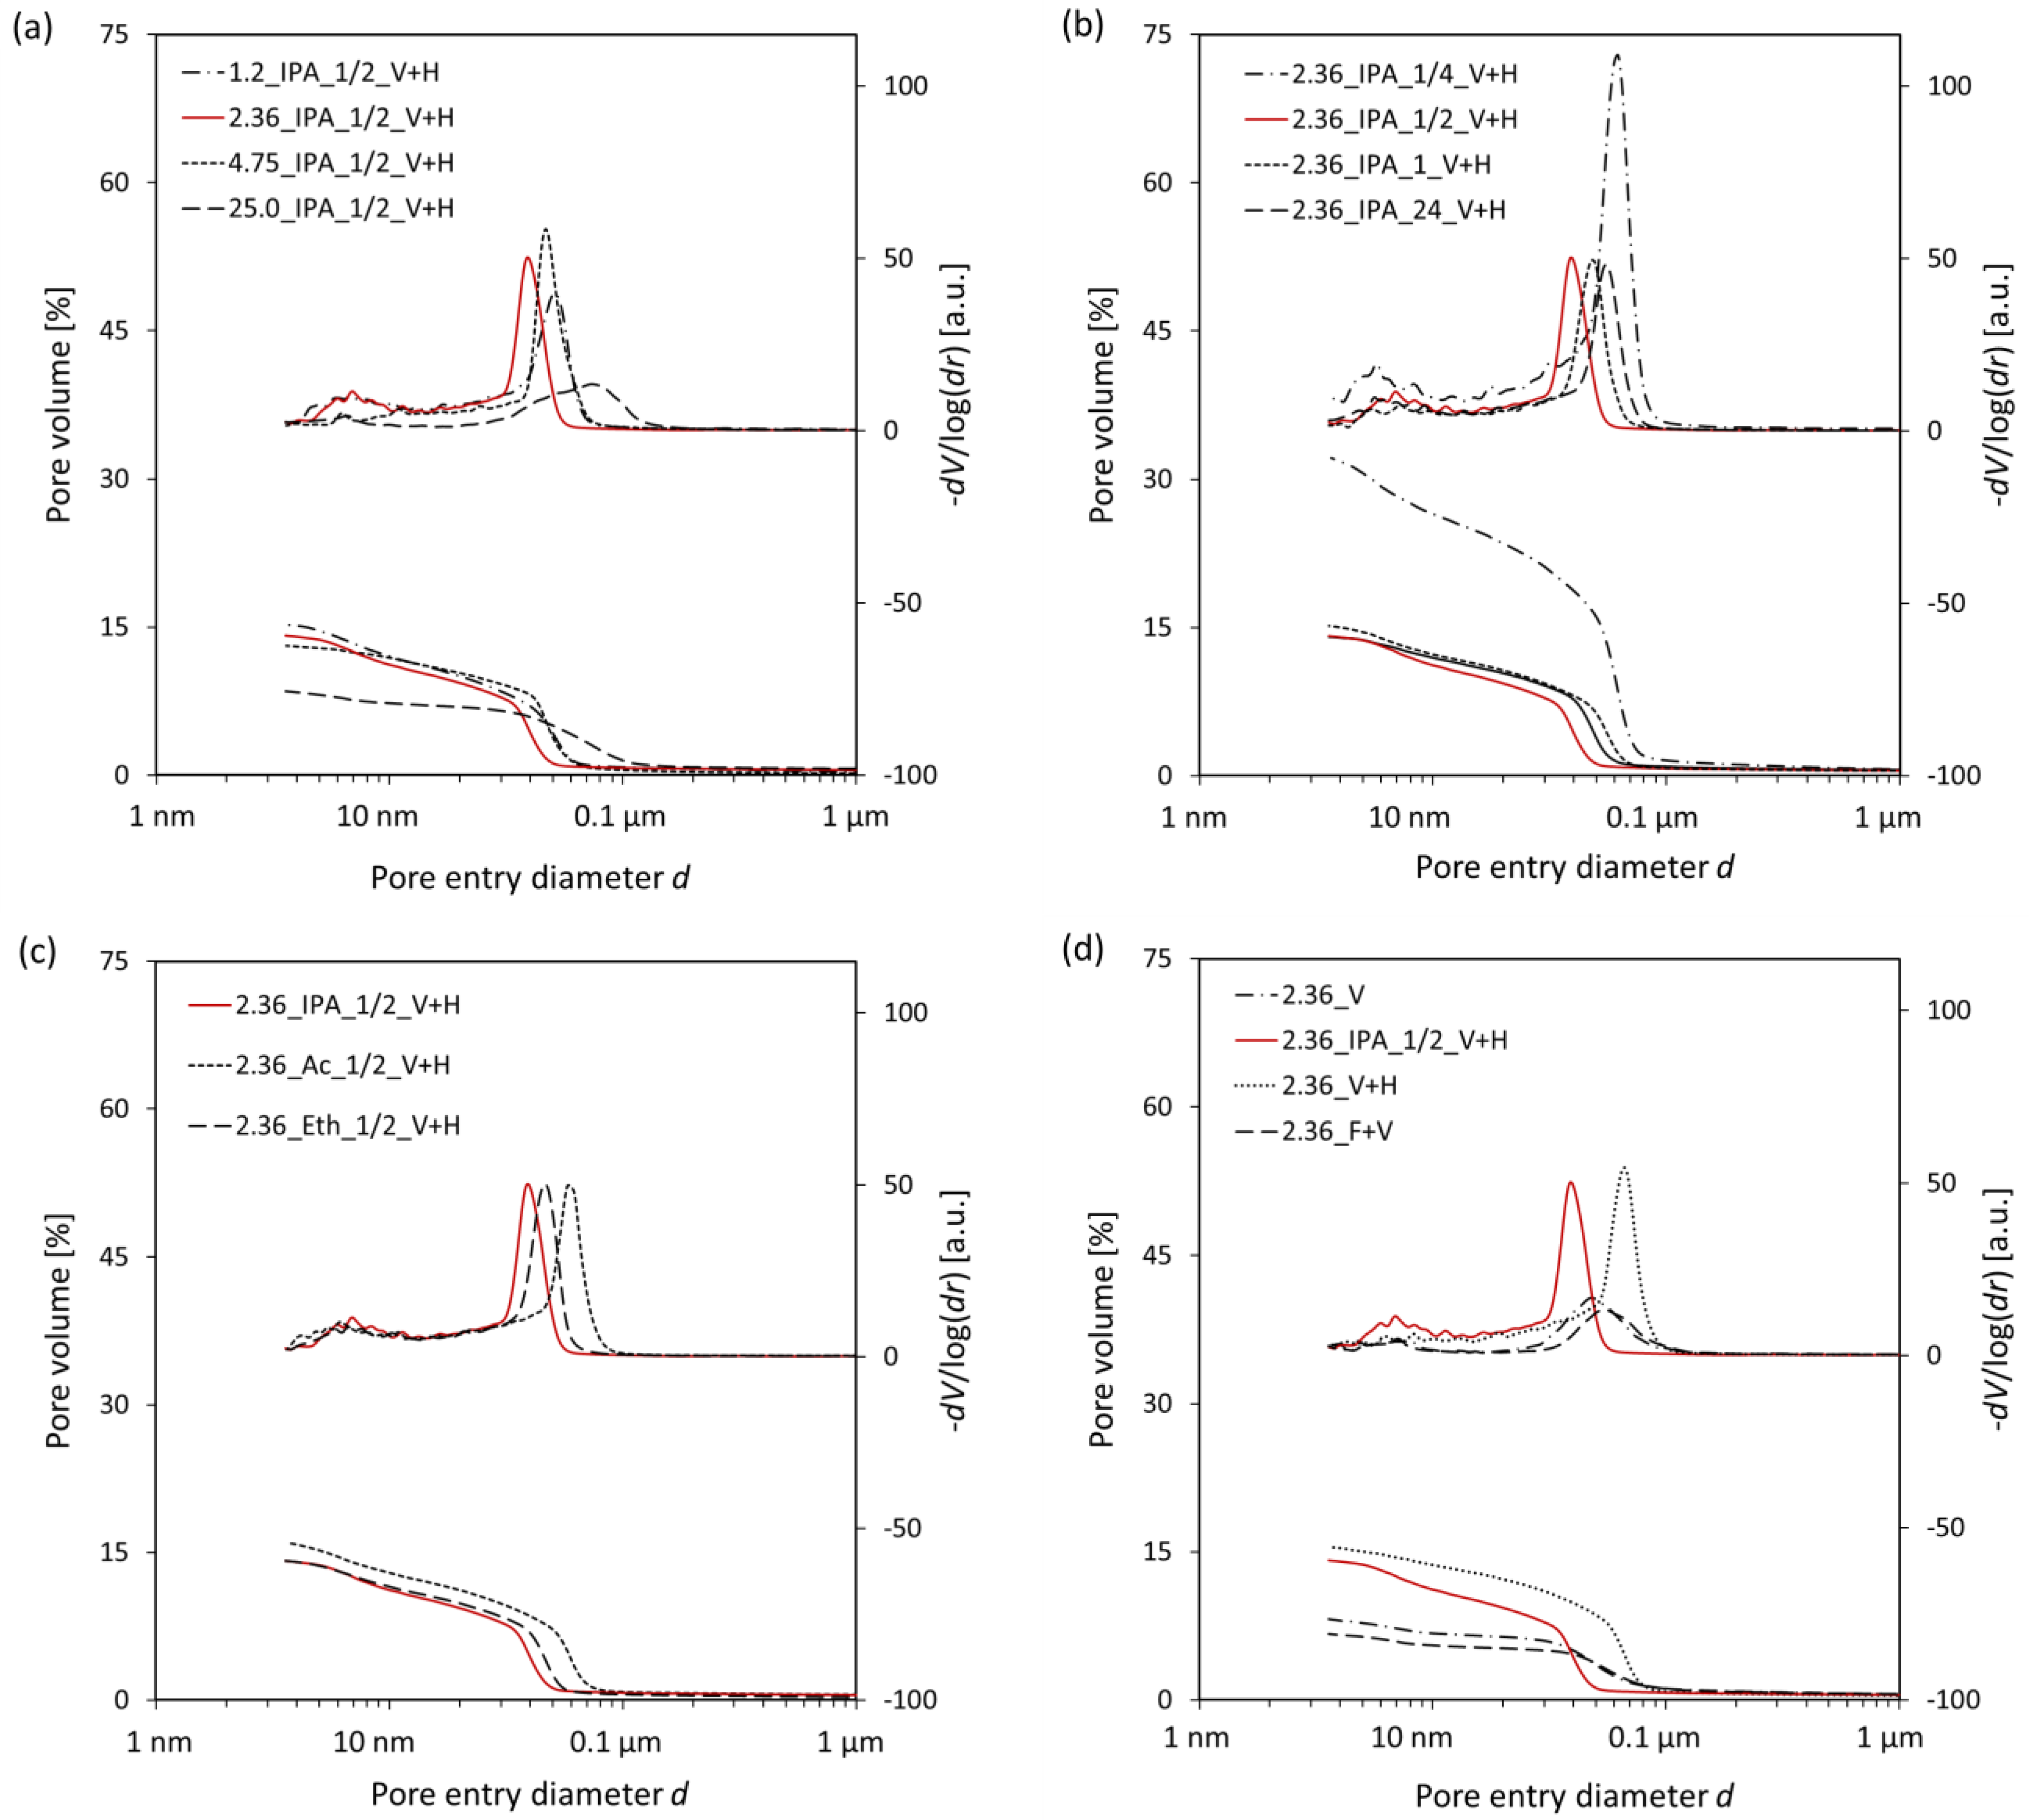
3.2. Mercury Intrusion Porosimetry
3.3. X-ray Diffraction
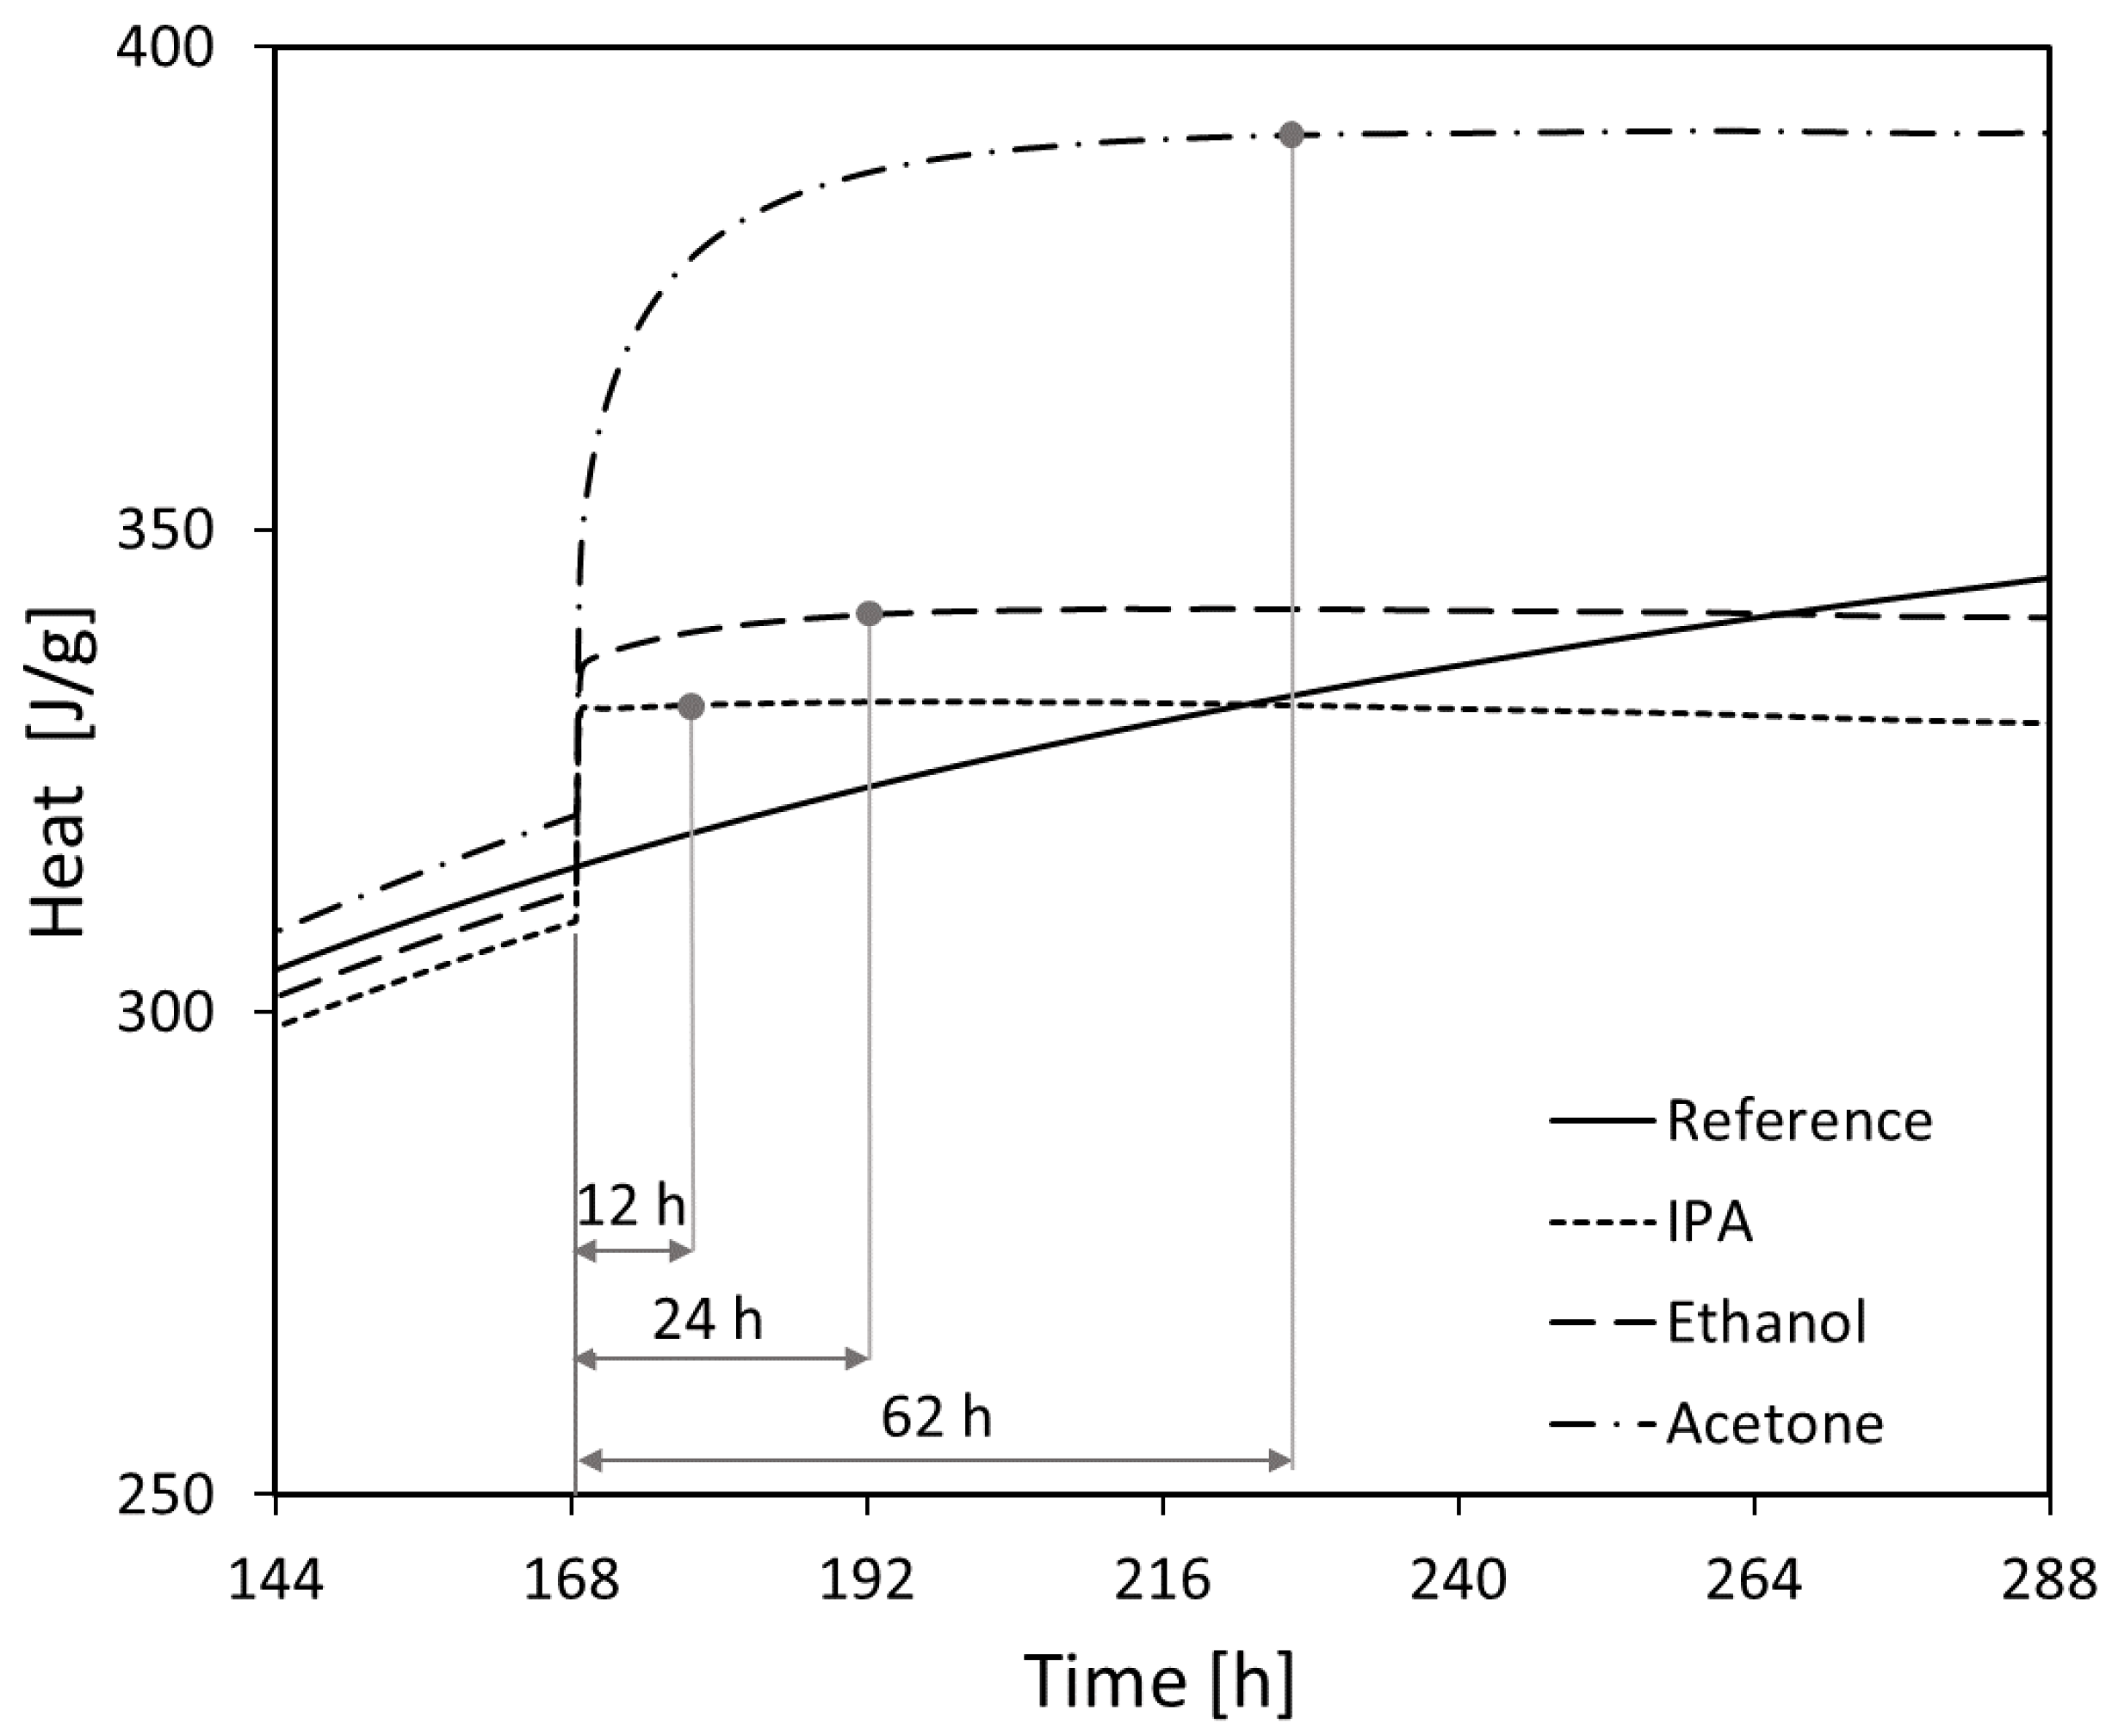
3.4. Isothermal Calorimetry
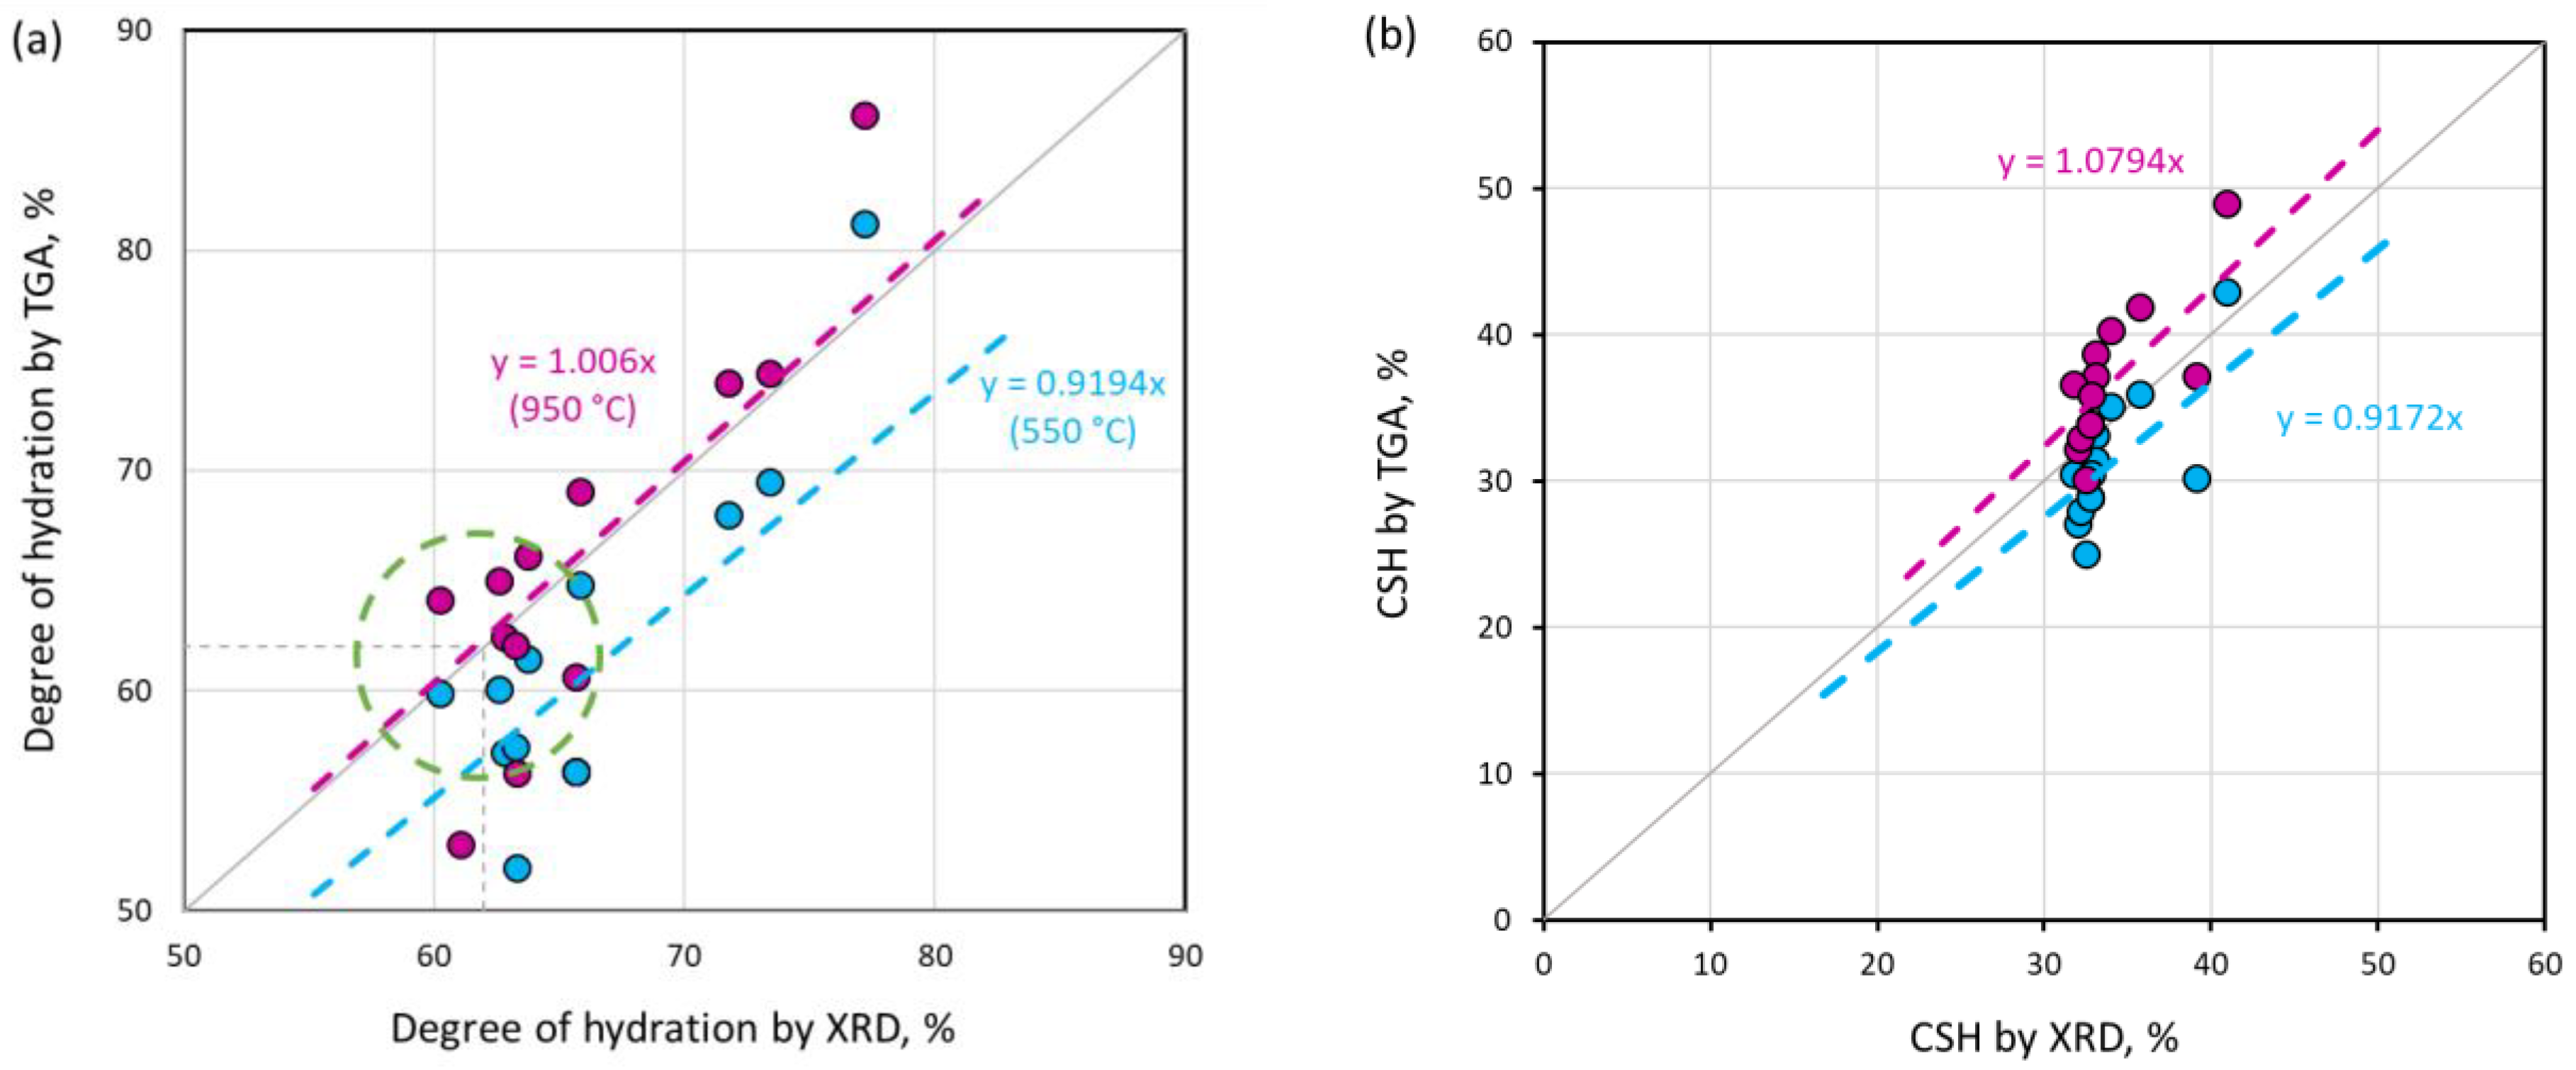
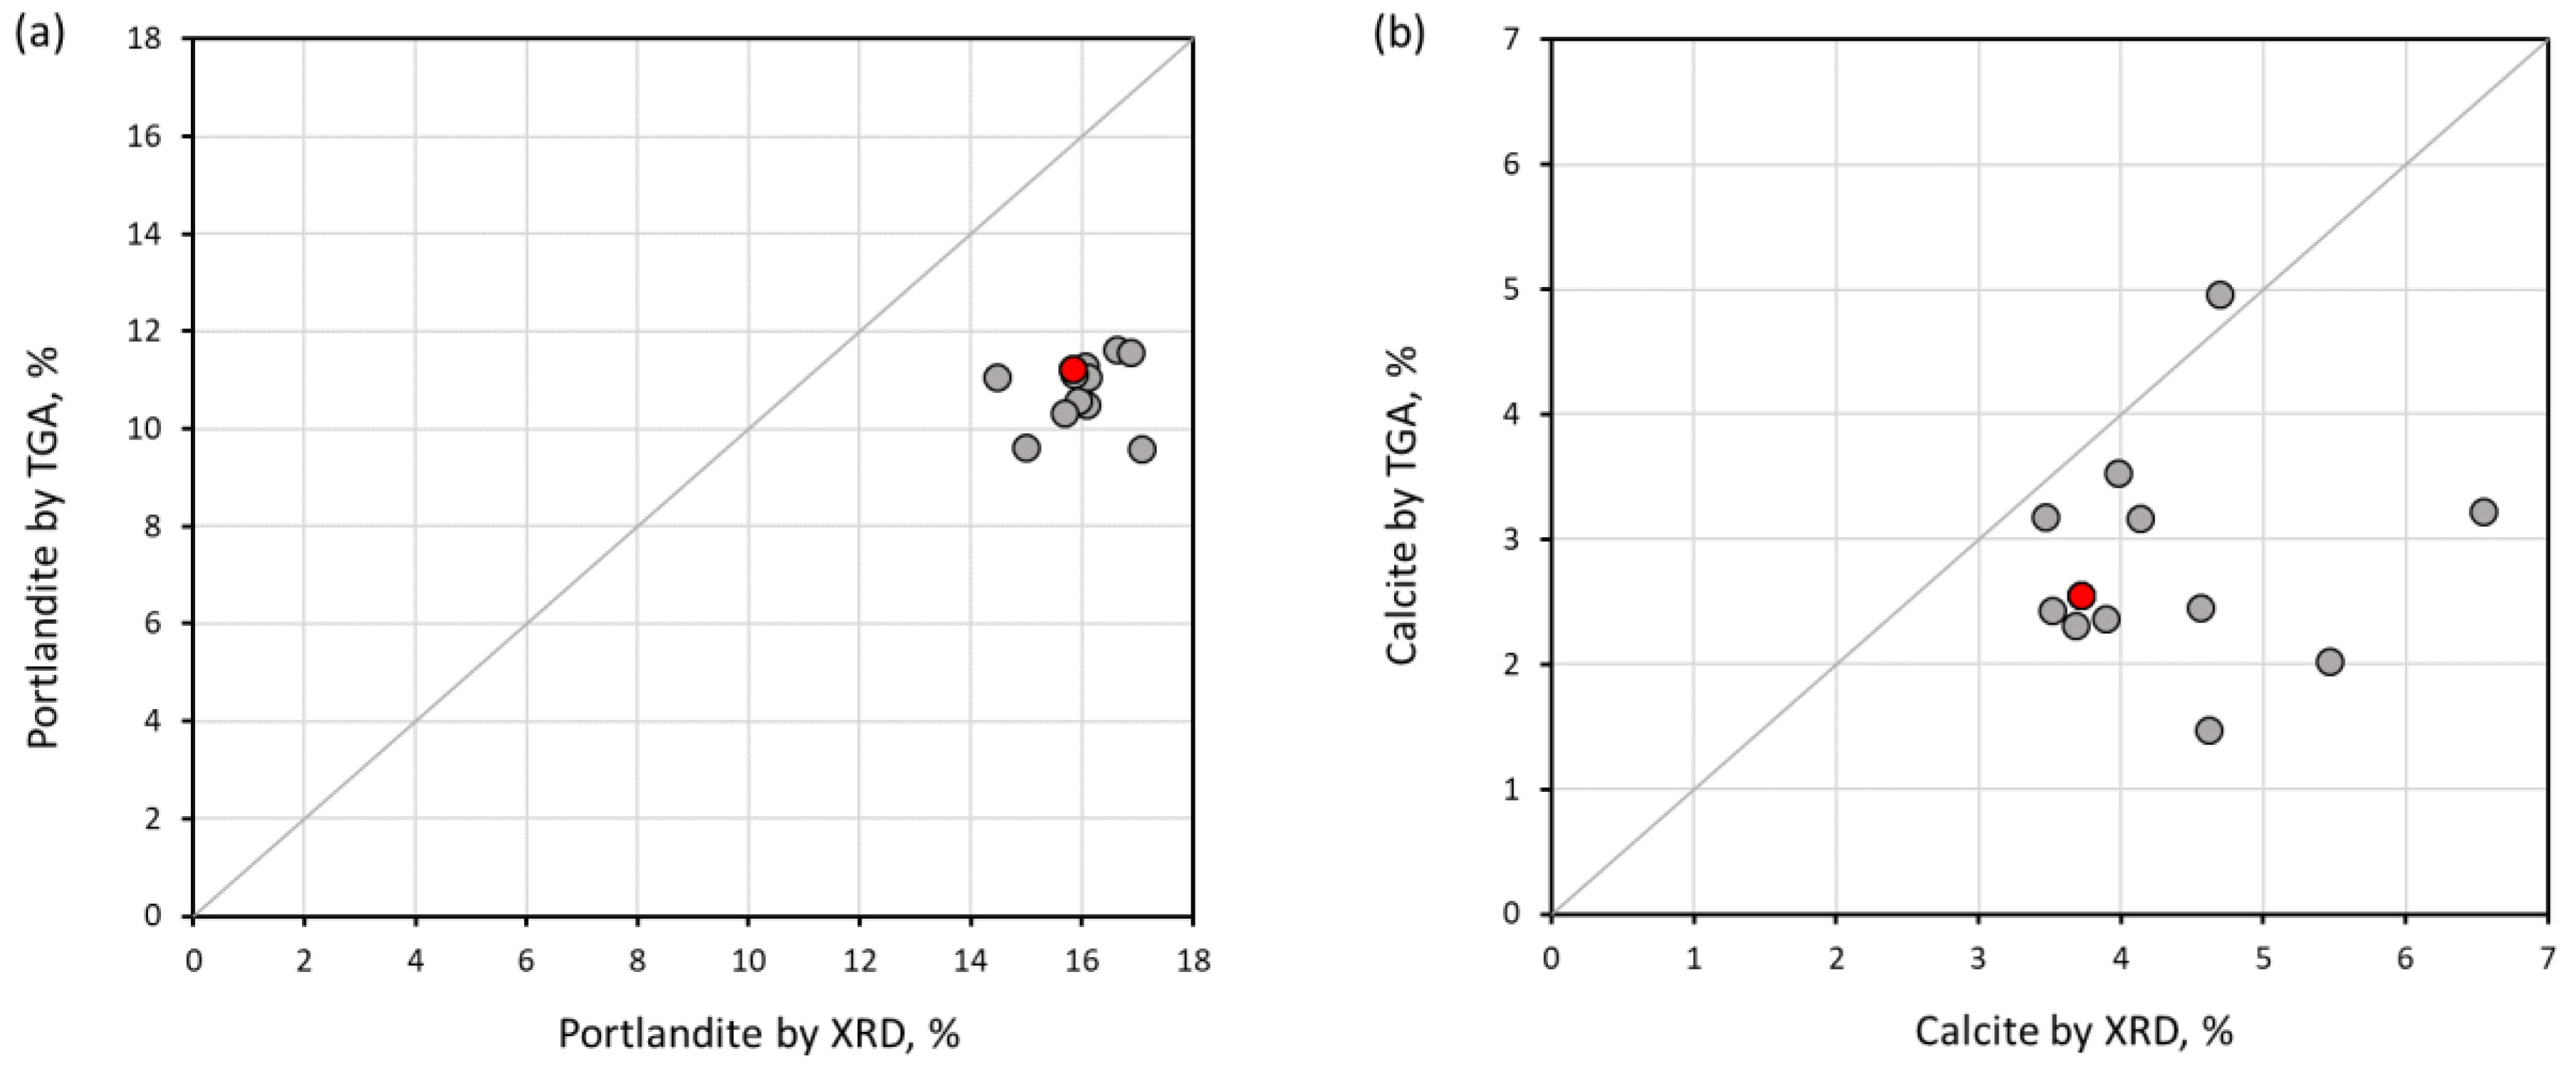
3.5. Comparison of Results
4. Conclusions
- The optimal sample piece size required for hydration stoppage is ca. 2–4 mm. Pieces of smaller and larger sizes exhibit a higher content of calcium carbonate. Additionally, larger sizes of samples prevent the complete removal of free water.
- The optimal soaking time of a solvent replacement is considered to be between 30 min and 1 h. A faster solvent replacement, such as 15 min, may leave free water in the sample, which will cause capillary stresses during drying, dramatically increasing the total pore volume and decreasing the amount of ettringite. However, soaking times longer than a few hours evidently promote the carbonation of the samples.
- Ettringite is considered the most sensitive phase for the different methods of hydration stoppage.
- Direct freezing with a vacuum treatment and direct placement under a vacuum affect the pore structure of the sample the least, whereas the mineral composition is heavily affected. Solvent replacement combined with a vacuum and heating at 40 °C and direct placement under a vacuum and heating at 40 °C provide comparable and reproducible results.
- The degree of hydration and the amount of C-S-H and portlandite calculated using TGA at 950 °C have a better agreement with the XRD result, due to the remaining bound water, which is still preserved at 550 °C
- The efficiency of the different solvents employed for hydration stoppage was assessed using isothermal calorimetry. In terms of the time needed for complete hydration stoppage, the solvents are ordered from most to least effective as follows: isopropyl alcohol > ethanol > acetone.
Author Contributions
Funding
Acknowledgments
Conflicts of Interest
References
- Collier, N.C.; Sharp, J.H.; Milestone, N.B.; Hill, J.; Godfrey, I.H. The Influence of Water Removal Techniques on the Composition and Microstructure of Hardened Cement Pastes. Cem. Concr. Res. 2008, 38, 737–744. [Google Scholar] [CrossRef]
- Scrivener, K.; Snellings, R.; Lothenbach, B. (Eds.) A Practical Guide to Microstructural Analysis of Cementitious Materials; CRC Press: Boca Raton, FL, USA, 2016; ISBN 9781498738675. [Google Scholar]
- Zhang, J.; Scherer, G.W. Comparison of Methods for Arresting Hydration of Cement. Cem. Concr. Res. 2011, 41, 1024–1036. [Google Scholar] [CrossRef]
- Snellings, R.; Chwast, J.; Cizer, Ö.; De Belie, N.; Dhandapani, Y.; Durdzinski, P.; Elsen, J.; Haufe, J.; Hooton, D.; Patapy, C.; et al. Report of TC 238-SCM: Hydration Stoppage Methods for Phase Assemblage Studies of Blended Cements—Results of a Round Robin Test. Mater. Struct. Constr. 2018, 51, 111. [Google Scholar] [CrossRef]
- Gallé, C. Effect of Drying on Cement-Based Materials Pore Structure as Identified by Mercury Intrusion Porosimetry—A Comparative Study between Oven-, Vacuum-, and Freeze-Drying. Cem. Concr. Res. 2001, 31, 1467–1477. [Google Scholar] [CrossRef]
- Snoeck, D.; Velasco, L.F.; Mignon, A.; Van Vlierberghe, S.; Dubruel, P.; Lodewyckx, P.; De Belie, N. The Influence of Different Drying Techniques on the Water Sorption Properties of Cement-Based Materials. Cem. Concr. Res. 2014, 64, 54–62. [Google Scholar] [CrossRef]
- Zeng, Q.; Li, K.; Fen-Chong, T.; Dangla, P. Water Removal by Freeze-Drying of Hardened Cement Paste. Dry. Technol. 2013, 31, 67–71. [Google Scholar] [CrossRef]
- Moukwa, M.; Aïtcin, P.C. The effect of drying on cement pastes pore structure as determined by mercury porosimetry. Cem. Concr. Res. 1988, 18, 745–752. [Google Scholar] [CrossRef]
- Knapen, E.; Cizer, O.; Van Balen, K.; Van Gemert, D. Effect of Free Water Removal from Early-Age Hydrated Cement Pastes on Thermal Analysis. Constr. Build. Mater. 2009, 23, 3431–3438. [Google Scholar] [CrossRef]
- Korpa, A.; Trettin, R. The Influence of Different Drying Methods on Cement Paste Microstructures as Reflected by Gas Adsorption: Comparison between Freeze-Drying (F-Drying), D-Drying, P-Drying and Oven-Drying Methods. Cem. Concr. Res. 2006, 36, 634–649. [Google Scholar] [CrossRef]
- Konecny, L.; Naqvi, S.J. The Effect of Different Drying Techniques on the Pore Size Distribution of Blended Cement Mortars. Cem. Concr. Res. 1993, 23, 1223–1228. [Google Scholar] [CrossRef]
- Luo, S.; Liu, M.; Yang, L.; Chang, J. Effects of Drying Techniques on the Crystal Structure and Morphology of Ettringite. Constr. Build. Mater. 2019, 195, 305–311. [Google Scholar] [CrossRef]
- Espinosa, R.M.; Franke, L. Influence of the Age and Drying Process on Pore Structure and Sorption Isotherms of Hardened Cement Paste. Cem. Concr. Res. 2006, 36, 1969–1984. [Google Scholar] [CrossRef]
- Zhang, Z.; Scherer, G.W. Evaluation of Drying Methods by Nitrogen Adsorption. Cem. Concr. Res. 2019, 120, 13–26. [Google Scholar] [CrossRef]
- Maciel, M.H.; Simõ Es Soares, G.; Cesar, R.; Romano, O.; Cincotto, M.A. Monitoring of Portland Cement Chemical Reaction and Quantification of the Hydrated Products by XRD and TG in Function of the Stoppage Hydration Technique. J. Therm. Anal. Calorim. 2019, 136, 1269–1284. [Google Scholar] [CrossRef]
- Zhang, Z.; Scherer, G.W. Supercritical Drying of Cementitious Materials. Cem. Concr. Res. 2017, 99, 137–154. [Google Scholar] [CrossRef]
- Zhang, Z.; Scherer, G.W.; Bauer, A. Morphology of Cementitious Material during Early Hydration. Cem. Concr. Res. 2018, 107, 85–100. [Google Scholar] [CrossRef]
- Beaudoin, J.J.; Tamtsia, B.; Marchand, J.; Myers, H.R. Solvent Exchange in Partially Saturated and Saturated Microporous Systems Length Change Anomalies. Cem. Concr. Res. 2000, 30, 359–370. [Google Scholar] [CrossRef]
- Beaudoin, J.J.; Tamtsia, B.T. Effect of Drying Methods on Microstructural Changes in Hardened Cement Paste: An AC Impedance Spectroscopy Evaluation. J. Adv. Concr. Technol. 2004, 2, 113–120. [Google Scholar] [CrossRef]
- Hou, P.; Kawashima, S.; Kong, D.; Corr, D.J.; Qian, J.; Shah, S.P. Modification Effects of Colloidal NanoSiO2 on Cement Hydration and Its Gel Property. Compos. B Eng. 2013, 45, 440–448. [Google Scholar] [CrossRef]
- Dhandapani, Y.; Santhanam, M. Assessment of Pore Structure Evolution in the Limestone Calcined Clay Cementitious System and Its Implications for Performance. Cem. Concr. Compos. 2017, 84, 36–47. [Google Scholar] [CrossRef]
- Hamami, A.A.; Turcry, P.; Aït-Mokhtar, A. Influence of Mix Proportions on Microstructure and Gas Permeability of Cement Pastes and Mortars. Cem. Concr. Res. 2012, 42, 490–498. [Google Scholar] [CrossRef]
- Taylor, H.F.W.; Turner, A.B. Reactions of Tricalcium Silicate Paste with Organic Liquids. Cem. Concr. Res. 1987, 17, 613–623. [Google Scholar] [CrossRef]
- Feldman, R.F. Diffusion Measurements in Cement Paste by Water Replacement Using Propan-2-OL. Cem. Concr. Res. 1987, 17, 602–612. [Google Scholar] [CrossRef]
- Mezhov, A.; Kulisch, D.; Goncharov, A.; Zhutovsky, S. Effect of Soaking Time in a Solvent on Hydration Stoppage of Cement. In Concrete Durability and Service Life Planning—ConcreteLife; RILEM Bookseries; Springer: Cham, Switzerland, 2020; Volume 26, pp. 23–27. [Google Scholar] [CrossRef]
- Zhang, Z.; Scherer, G.W. Physical and Chemical Effects of Isopropanol Exchange in Cement-Based Materials. Cem. Concr. Res. 2021, 145, 106461. [Google Scholar] [CrossRef]
- Day, R.L. Reactions between Methanol and Portland Cement Paste. Cem. Concr. Res. 1981, 11, 341–349. [Google Scholar] [CrossRef]
- Makar, J.M.; Sato, T. The Effect of Drying Method on Ordinary Portland Cement Surfaces during the Early Stages of Hydration. Mater. Struct. Constr. 2013, 46, 1–12. [Google Scholar] [CrossRef]
- Mitchell, L.D.; Margeson, J.C. The Effects of Solvents on C-S-H as Determined by Thermal Analysis. J. Therm. Anal. Calorim. 2006, 86, 591–594. [Google Scholar] [CrossRef]
- Berodier, E.; Scrivener, K. Evolution of Pore Structure in Blended Systems. Cem. Concr. Res. 2015, 73, 25–35. [Google Scholar] [CrossRef]
- Snellings, R.; Chwast, J.; Cizer, Ö.; De Belie, N.; Dhandapani, Y.; Durdzinski, P.; Elsen, J.; Haufe, J.; Hooton, D.; Patapy, C.; et al. RILEM TC-238 SCM Recommendation on Hydration Stoppage by Solvent Exchange for the Study of Hydrate Assemblages. Mater. Struct. 2018, 51, 172. [Google Scholar] [CrossRef]
- Soroka, I. Portland Cement Paste & Concrete; Macmillan International Higher Education: London, UK, 1979; Volume 53, ISBN 9788578110796. [Google Scholar]
- Copeland, L.E.; Kantro, D.L.; Verbeck, G. Chemistry of Hydration of Portland Cement. In Proceedings of the 4th International Symposium on Chemistry of Cement, Washington, DC, USA, 2–7 October 1960; Volume I, pp. 429–468. [Google Scholar]
- Taylor, H.F.W. Cement Chemistry, 2nd ed.; Thomas Telford Publishing: London, UK, 1997; ISBN 0-7277-3945-X. [Google Scholar]
- Hewlett, P.C. Lea’s Chemistry of Cement and Concrete; Elsevier Ltd.: Amsterdam, The Netherlands, 2003; ISBN 9780750662567. [Google Scholar]
- Brouwers, H.J.H. A Hydration Model of Portland Cement; Eindhoven University of Technology: Eindhoven, The Netherlands, 2011; p. 170. [Google Scholar]
- Skibsted, J. High-Resolution Solid-State Nuclear Magnetic Resonance Spectroscopy of Portland Cement-Based Systems. In A Practical Guide to Microstructural Analysis of Cementitious Materials; Scrivener, K., Snellings, R., Lothenbach, B., Eds.; Taylor & Francis Group: Boca Raton, FL, USA, 2016; pp. 213–286. [Google Scholar]
- Lothenbach, B.; Durdziński, P.; De Weerdt, K. Thermogravimetric Analysis. In A Practical Guide to Microstructural Analysis of Cementitious Materials; Scrivener, K., Sneelings, R., Lothenbach, B., Eds.; Taylor & Francis Group: Boca Raton, FL, USA, 2016; pp. 177–211. [Google Scholar]
- Khoshnazar, A.; Khoshnazar, R.; Beaudoin, J.; Raki, L. Solvent Exchange in Sulphoaluminate Phases. Part I: Ettringite. Adv. Cem. Res. 2013, 25, 314–321. [Google Scholar] [CrossRef]
- Snellings, R. X-ray Powder Diffraction Applied to Cement. In A Practical Guide to Microstructural Analysis of Cementitious Materials; Scrivener, K., Snellings, R., Lothenbach, B., Eds.; Taylor & Francis Group: Boca Raton, FL, USA, 2016; pp. 107–176. [Google Scholar]
- De Matos, P.R.; Andrade Neto, J.S.; Campos, C.E.M. Is the R Index Accurate to Assess the Preferred Orientation of Portlandite in Cement Pastes? Constr. Build. Mater. 2021, 292, 123471. [Google Scholar] [CrossRef]


| CaO | SiO2 | Al2O3 | Fe2O3 | MgO | TiO2 | K2O | Na2O | P2O5 | Mn2O3 | SO3 | IR | FL | LOI |
|---|---|---|---|---|---|---|---|---|---|---|---|---|---|
| 62.16 | 19.02 | 5.42 | 3.82 | 1.31 | 0.53 | 0.37 | 0.22 | 0.40 | 0.05 | 2.48 | 0.76 | 2.80 | 2.93 |
| Phase | Formula | Database | Code | wt.% Dry Cement |
|---|---|---|---|---|
| Alite | C3S | ICDD | 04-011-1393 | 62.00 |
| Belite | C2S | ICDD | 04-007-9746 | 14.16 |
| Aluminate cubic | C3A | ICSD | 98-000-1841 | 5.86 |
| Ferrite | C4AF | ICDD | 04-007-5261 | 12.14 |
| Calcite | ICSD | 98-019-1857 | 1.96 | |
| Bassanite | CH0.5 | ICSD | 98-038-0286 | 2.80 |
| Portlandite | CH | ICDD | 04-006-9147 | 1.65 |
| Arcanite | K | ICDD | 00-024-0703 | 1.23 |
| Aphthitalite | K3Na4 | ICDD | 00-020-0928 | 0.56 |
| Ettringite | C6A3H32 | ICDD | 01-073-6239 | – |
| Monosulfate | C4AH12 | ICDD | 04-013-3303 | – |
| Hydrogarnet | C3AH6 | ICDD | 04-017-1504 | – |
| Hemicarbonate | ICSD | 98-026-3124 | – |
| Sample Name | Sample Piece Size (mm) | Solvent Type | Duration of a Solvent Replacement (h) | Additional Treatment |
|---|---|---|---|---|
| Influence of the sample piece size | ||||
| 1.20_IPA_1/2_V+H | 1.2 | IPA | 1/2 | vacuum for 3 h at 40 °C |
| 4.75_IPA_1/2_V+H | 4.75 | IPA | 1/2 | vacuum for 3 h at 40 °C |
| 25.0_IPA_1/2_V+H | 25 | IPA | 1/2 | vacuum for 3 h at 40 °C |
| Influence of the duration of a solvent replacement | ||||
| 2.36_IPA_1/4_V+H | 2.36 | IPA | 1/4 | vacuum for 3 h at 40 °C |
| 2.36_IPA_1_V+H | 2.36 | IPA | 1 | vacuum for 3 h at 40 °C |
| 2.36_IPA_24_V+H | 2.36 | IPA | 24 | vacuum for 3 h at 40 °C |
| Influence of the solvent type | ||||
| 2.36_IPA_1/2_V+H * | 2.36 | IPA | 1/2 | vacuum for 3 h at 40 °C |
| 2.36_Ac_1/2_V+H | 2.36 | acetone | 1/2 | vacuum for 3 h at 40 °C |
| 2.36_Eth_1/2_V+H | 2.36 | ethanol | 1/2 | vacuum for 3 h at 40 °C |
| Influence of drying and freezing | ||||
| 2.36_V | 2.36 | – | – | vacuum for 3 h at 21 °C |
| 2.36_V+H | 2.36 | – | – | vacuum for 3 h at 40 °C |
| 2.36_F+V | 2.36 | – | – | freezing with liquid nitrogen for 5 min and vacuum for 3 h at 21 °C |
| Factor | Criteria | ||||
|---|---|---|---|---|---|
| Thermo-Gravimetric Analysis | X-ray Diffraction | Mercury Intrusion Porosimetry | Degree of Hydration Calculated by XRD | Agreement between Calorimetry, XRD, and TGA | |
| Sample piece size: 1.2 mm; 2.36 mm; 4.75 mm; 25 mm | Samples of 1.2 mm and 25 mm exhibited increased calcite content. | Sample of 25 mm exhibits a notable increase in the content of C-S-H and Ca(OH)2 and a strong reduction in AFt phase | Sample of 25 mm exhibited a notable reduction in total pore volume and augmentation of the pore entry diameter | Sample of 25 mm exhibited a notable increase in DoH | Samples of 2.36 mm and 4.75 mm |
| Duration of a solvent replacement in IPA: 15 min, 30 min, 60 min, 24 h | Immersion longer than 30 min notably increased AFt content | Immersion for 15 min reduced the amount of AFt and hydrogarnet; immersion for 24 h reduced Ca(OH)2 | Immersion for 15 min drastically increased pore volume and pore entry diameter | No significant influence | Samples immersed for 30 min, 60 min, and 24 h |
| Solvent type: IPA, acetone, ethanol | Ethanol benefited augmentation of AFt peak | Ethanol and IPA increased the amount of carboaluminates | Acetone exhibited the biggest total pore volume and the pore entry diameter | No significant influence | Sample immersed in ethanol and IPA |
Influence of drying and freezing:
| Drying under a vacuum and freezing with drying under a vacuum notably increased AFt peak | Freezing and drying under a vacuum significantly increased the amount of C-S-H, calcite, Ca(OH)2, and AFt; drying under a vacuum resulted in a higher amount of calcite and AFt | Freezing and drying under a vacuum and drying under a vacuum significantly reduced total pore volume, while heating under a vacuum showed the biggest pore entry diameter | Freezing and drying under a vacuum significantly increased DoH | Heating under a vacuum and immersion in IPA and heating under a vacuum |
Disclaimer/Publisher’s Note: The statements, opinions and data contained in all publications are solely those of the individual author(s) and contributor(s) and not of MDPI and/or the editor(s). MDPI and/or the editor(s) disclaim responsibility for any injury to people or property resulting from any ideas, methods, instructions or products referred to in the content. |
© 2023 by the authors. Licensee MDPI, Basel, Switzerland. This article is an open access article distributed under the terms and conditions of the Creative Commons Attribution (CC BY) license (https://creativecommons.org/licenses/by/4.0/).
Share and Cite
Mezhov, A.; Kulisch, D.; Goncharov, A.; Zhutovsky, S. A Comparative Study of Factors Influencing Hydration Stoppage of Hardened Cement Paste. Sustainability 2023, 15, 1080. https://doi.org/10.3390/su15021080
Mezhov A, Kulisch D, Goncharov A, Zhutovsky S. A Comparative Study of Factors Influencing Hydration Stoppage of Hardened Cement Paste. Sustainability. 2023; 15(2):1080. https://doi.org/10.3390/su15021080
Chicago/Turabian StyleMezhov, Alexander, Daniele Kulisch, Antonina Goncharov, and Semion Zhutovsky. 2023. "A Comparative Study of Factors Influencing Hydration Stoppage of Hardened Cement Paste" Sustainability 15, no. 2: 1080. https://doi.org/10.3390/su15021080
APA StyleMezhov, A., Kulisch, D., Goncharov, A., & Zhutovsky, S. (2023). A Comparative Study of Factors Influencing Hydration Stoppage of Hardened Cement Paste. Sustainability, 15(2), 1080. https://doi.org/10.3390/su15021080