
Quantification of Residual Unhydrated Cement Content in Cement Pastes as a Potential for Recovery


Abstract
1. Introduction
2. Scientific Background
3. Materials and Methods
3.1. Materials
3.2. Sample Preparation
3.2.1. Parent Cement Paste
3.2.2. Cement Paste Fines
3.3. Experimental Methods
3.3.1. Compressive Strength
3.3.2. Particle Size Distribution
3.3.3. Thermogravimetric Analysis
3.3.4. X-ray Diffraction
3.4. CEMHYD3D Modeling
4. Results
4.1. Compressive Strength
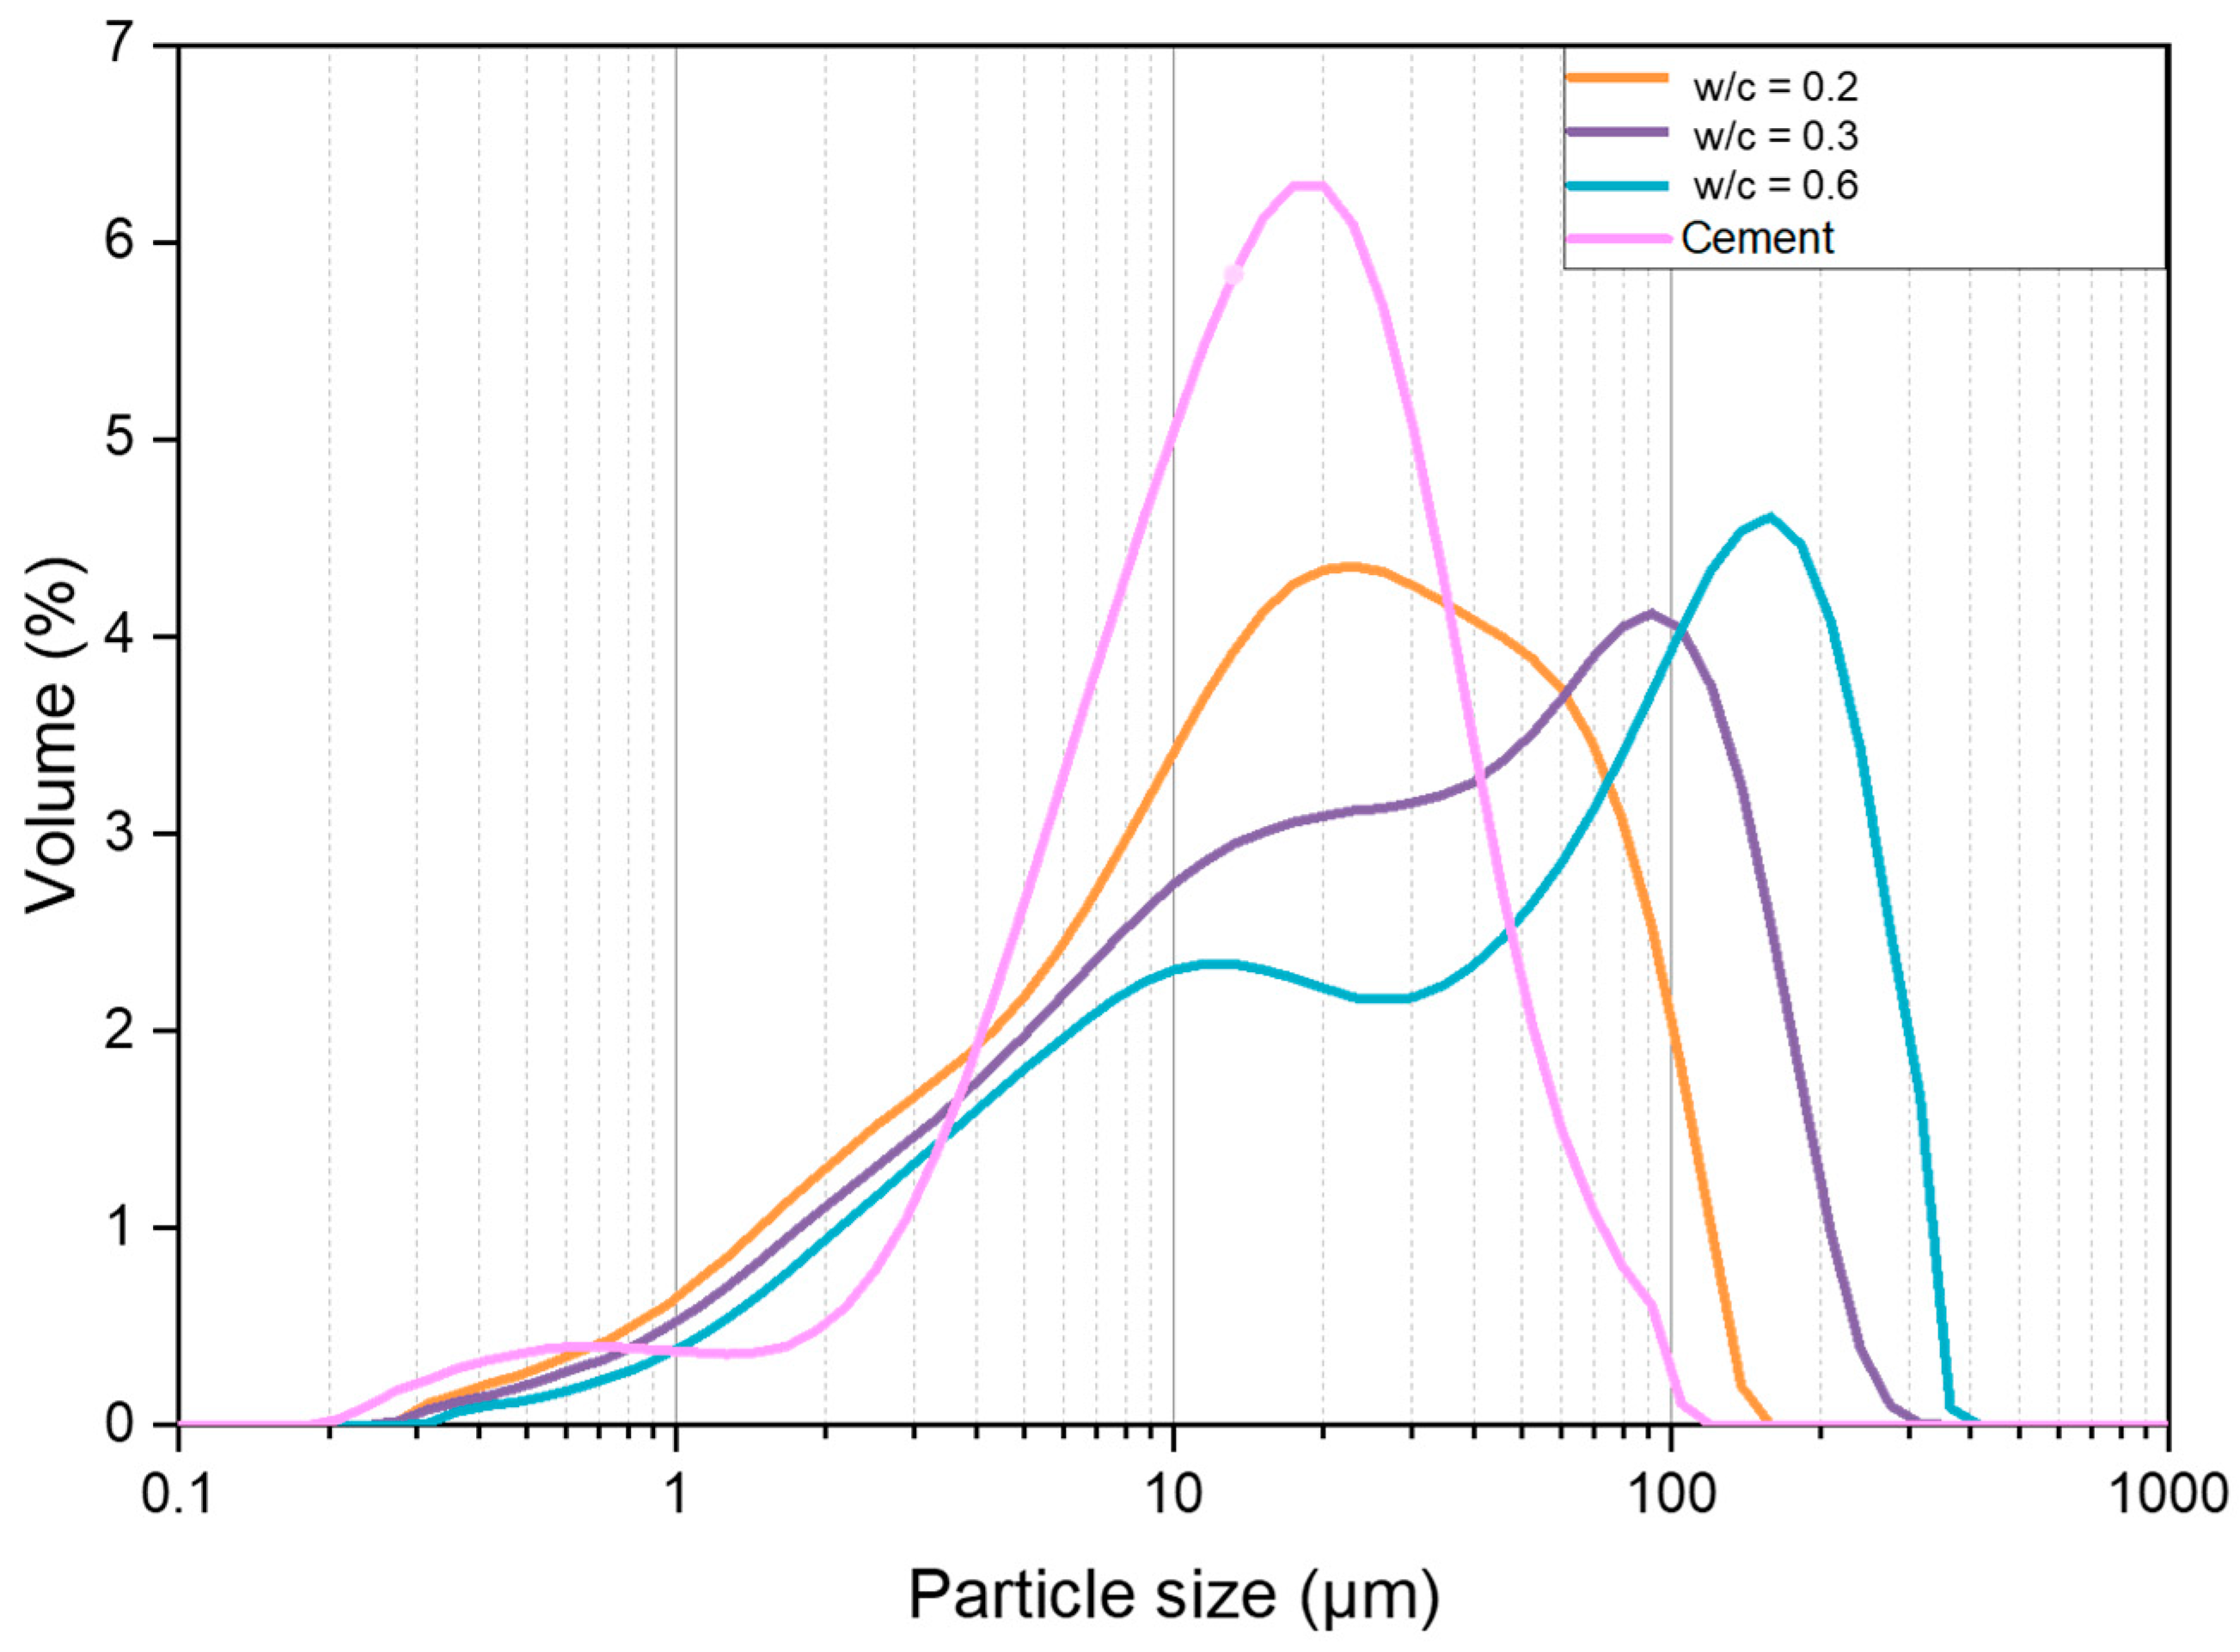
4.2. Particle Size Distribution
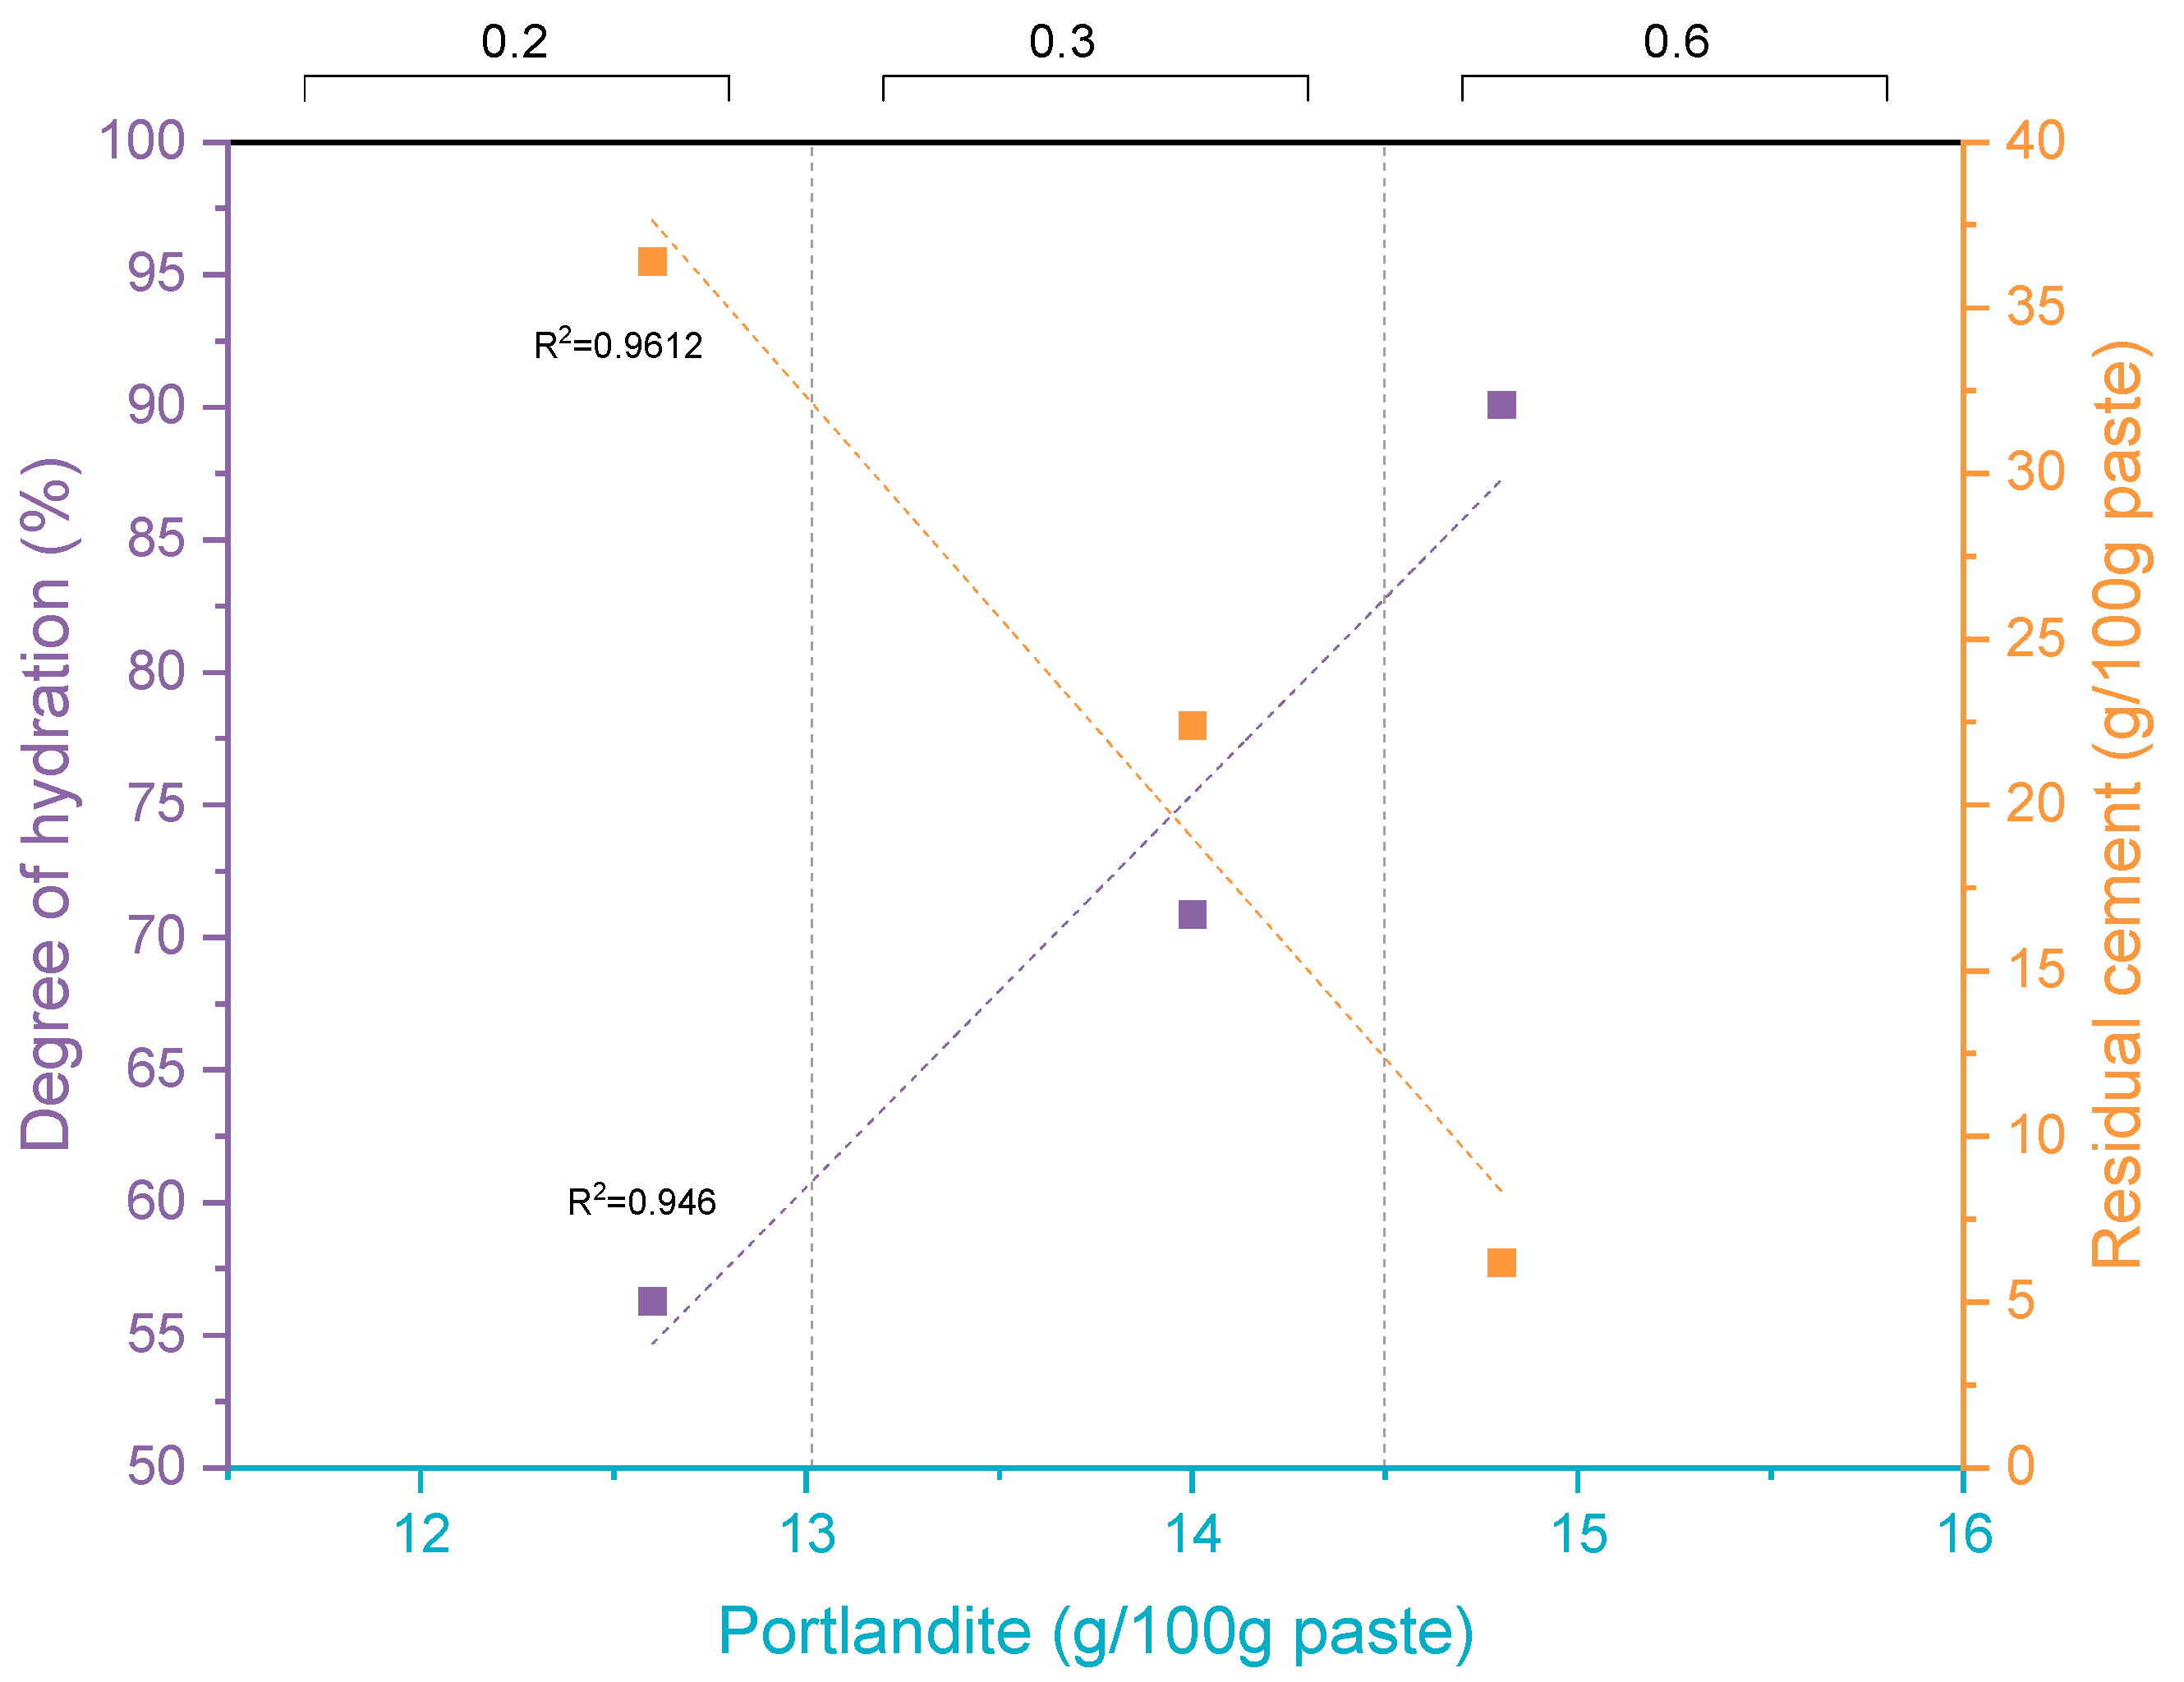
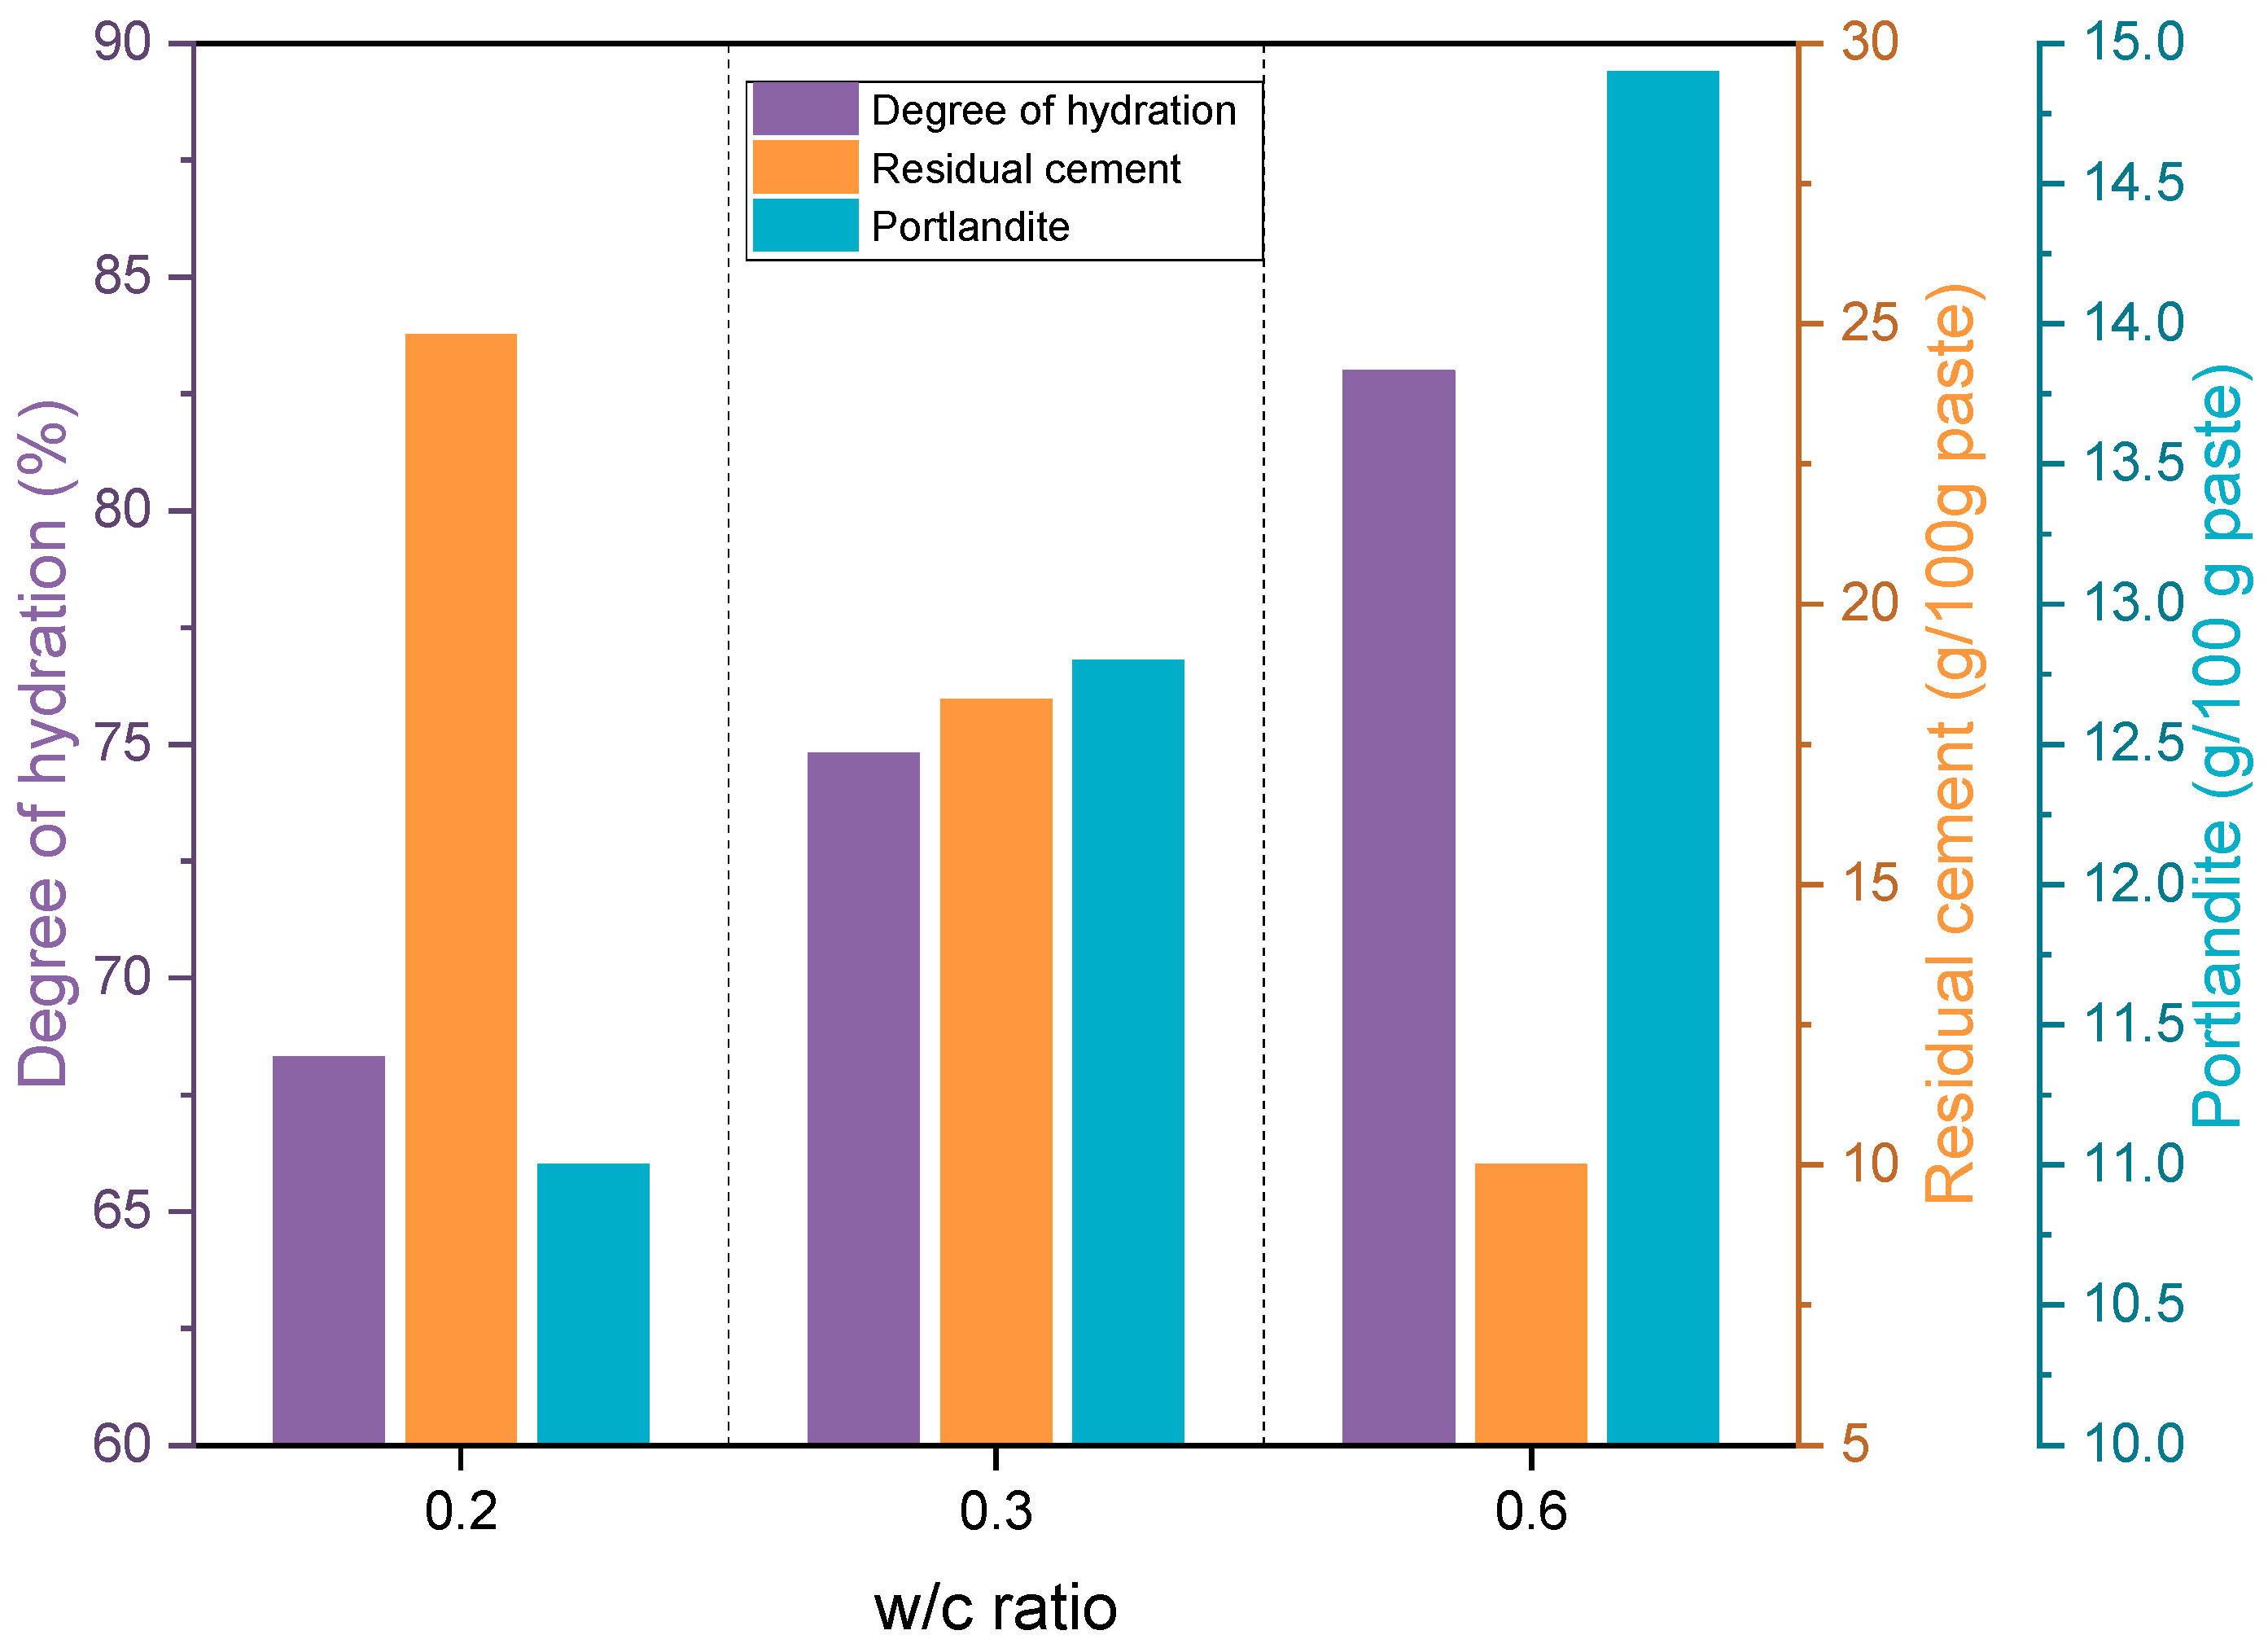
4.3. Thermogravimetric Analysis
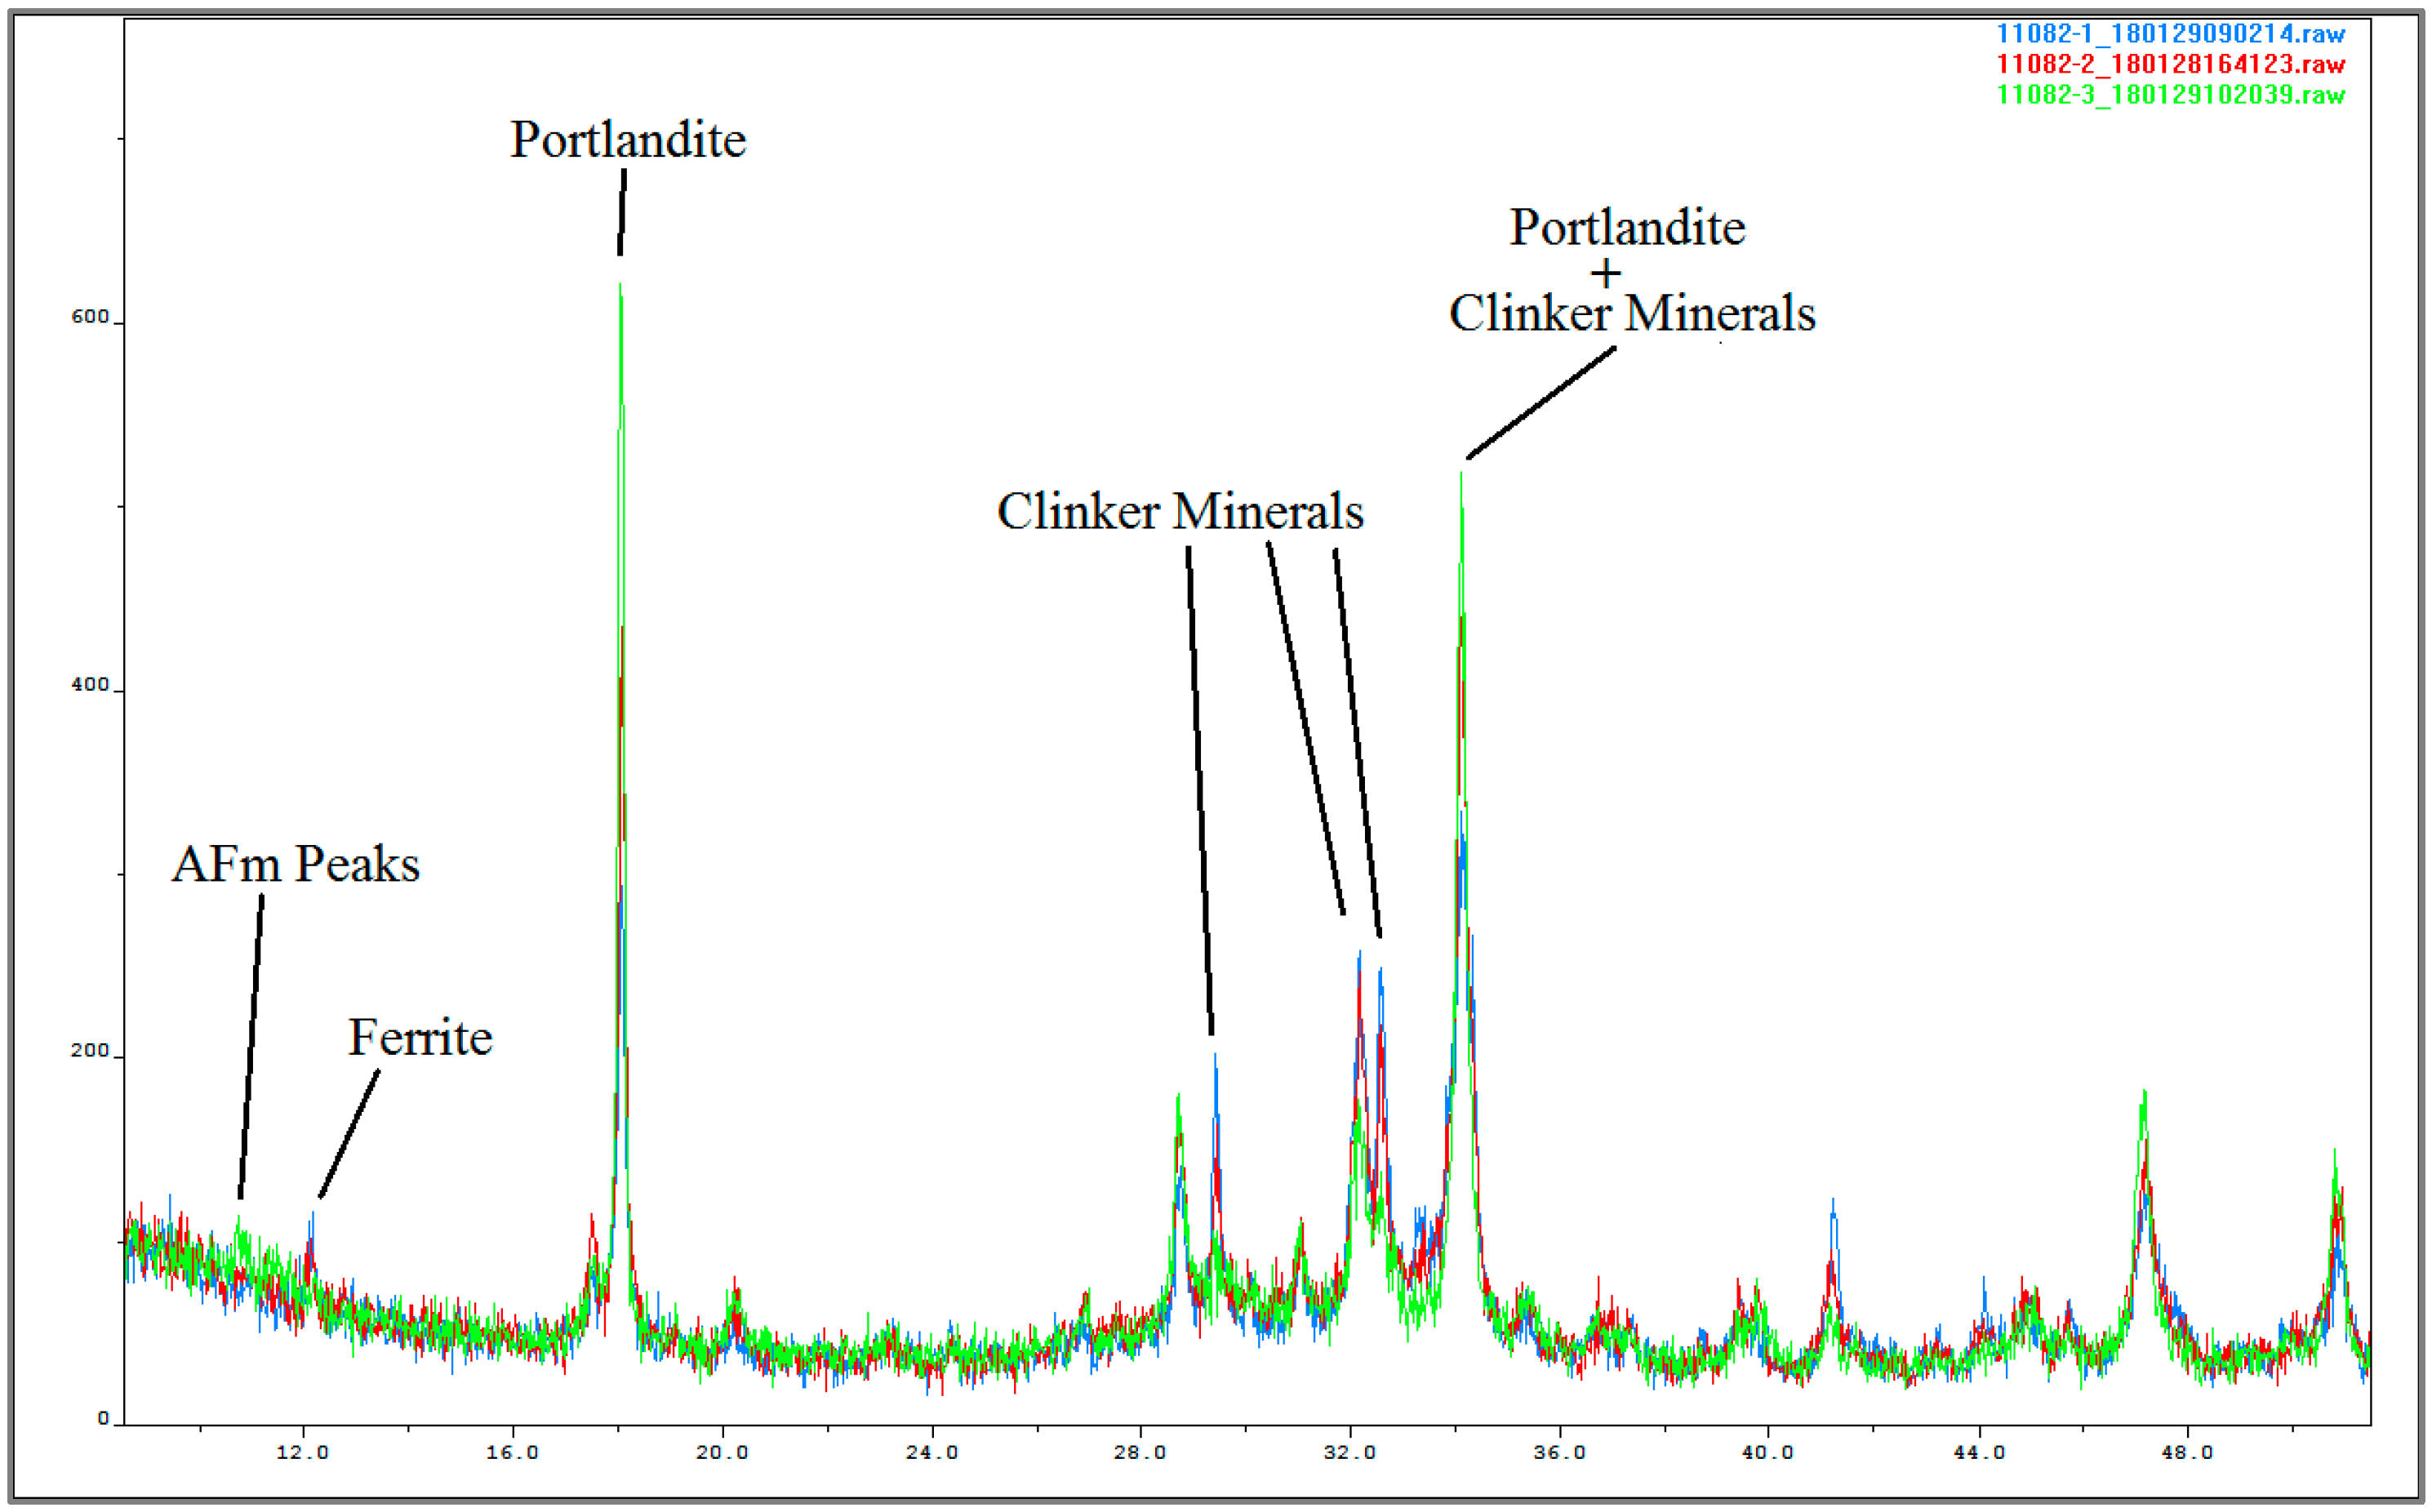
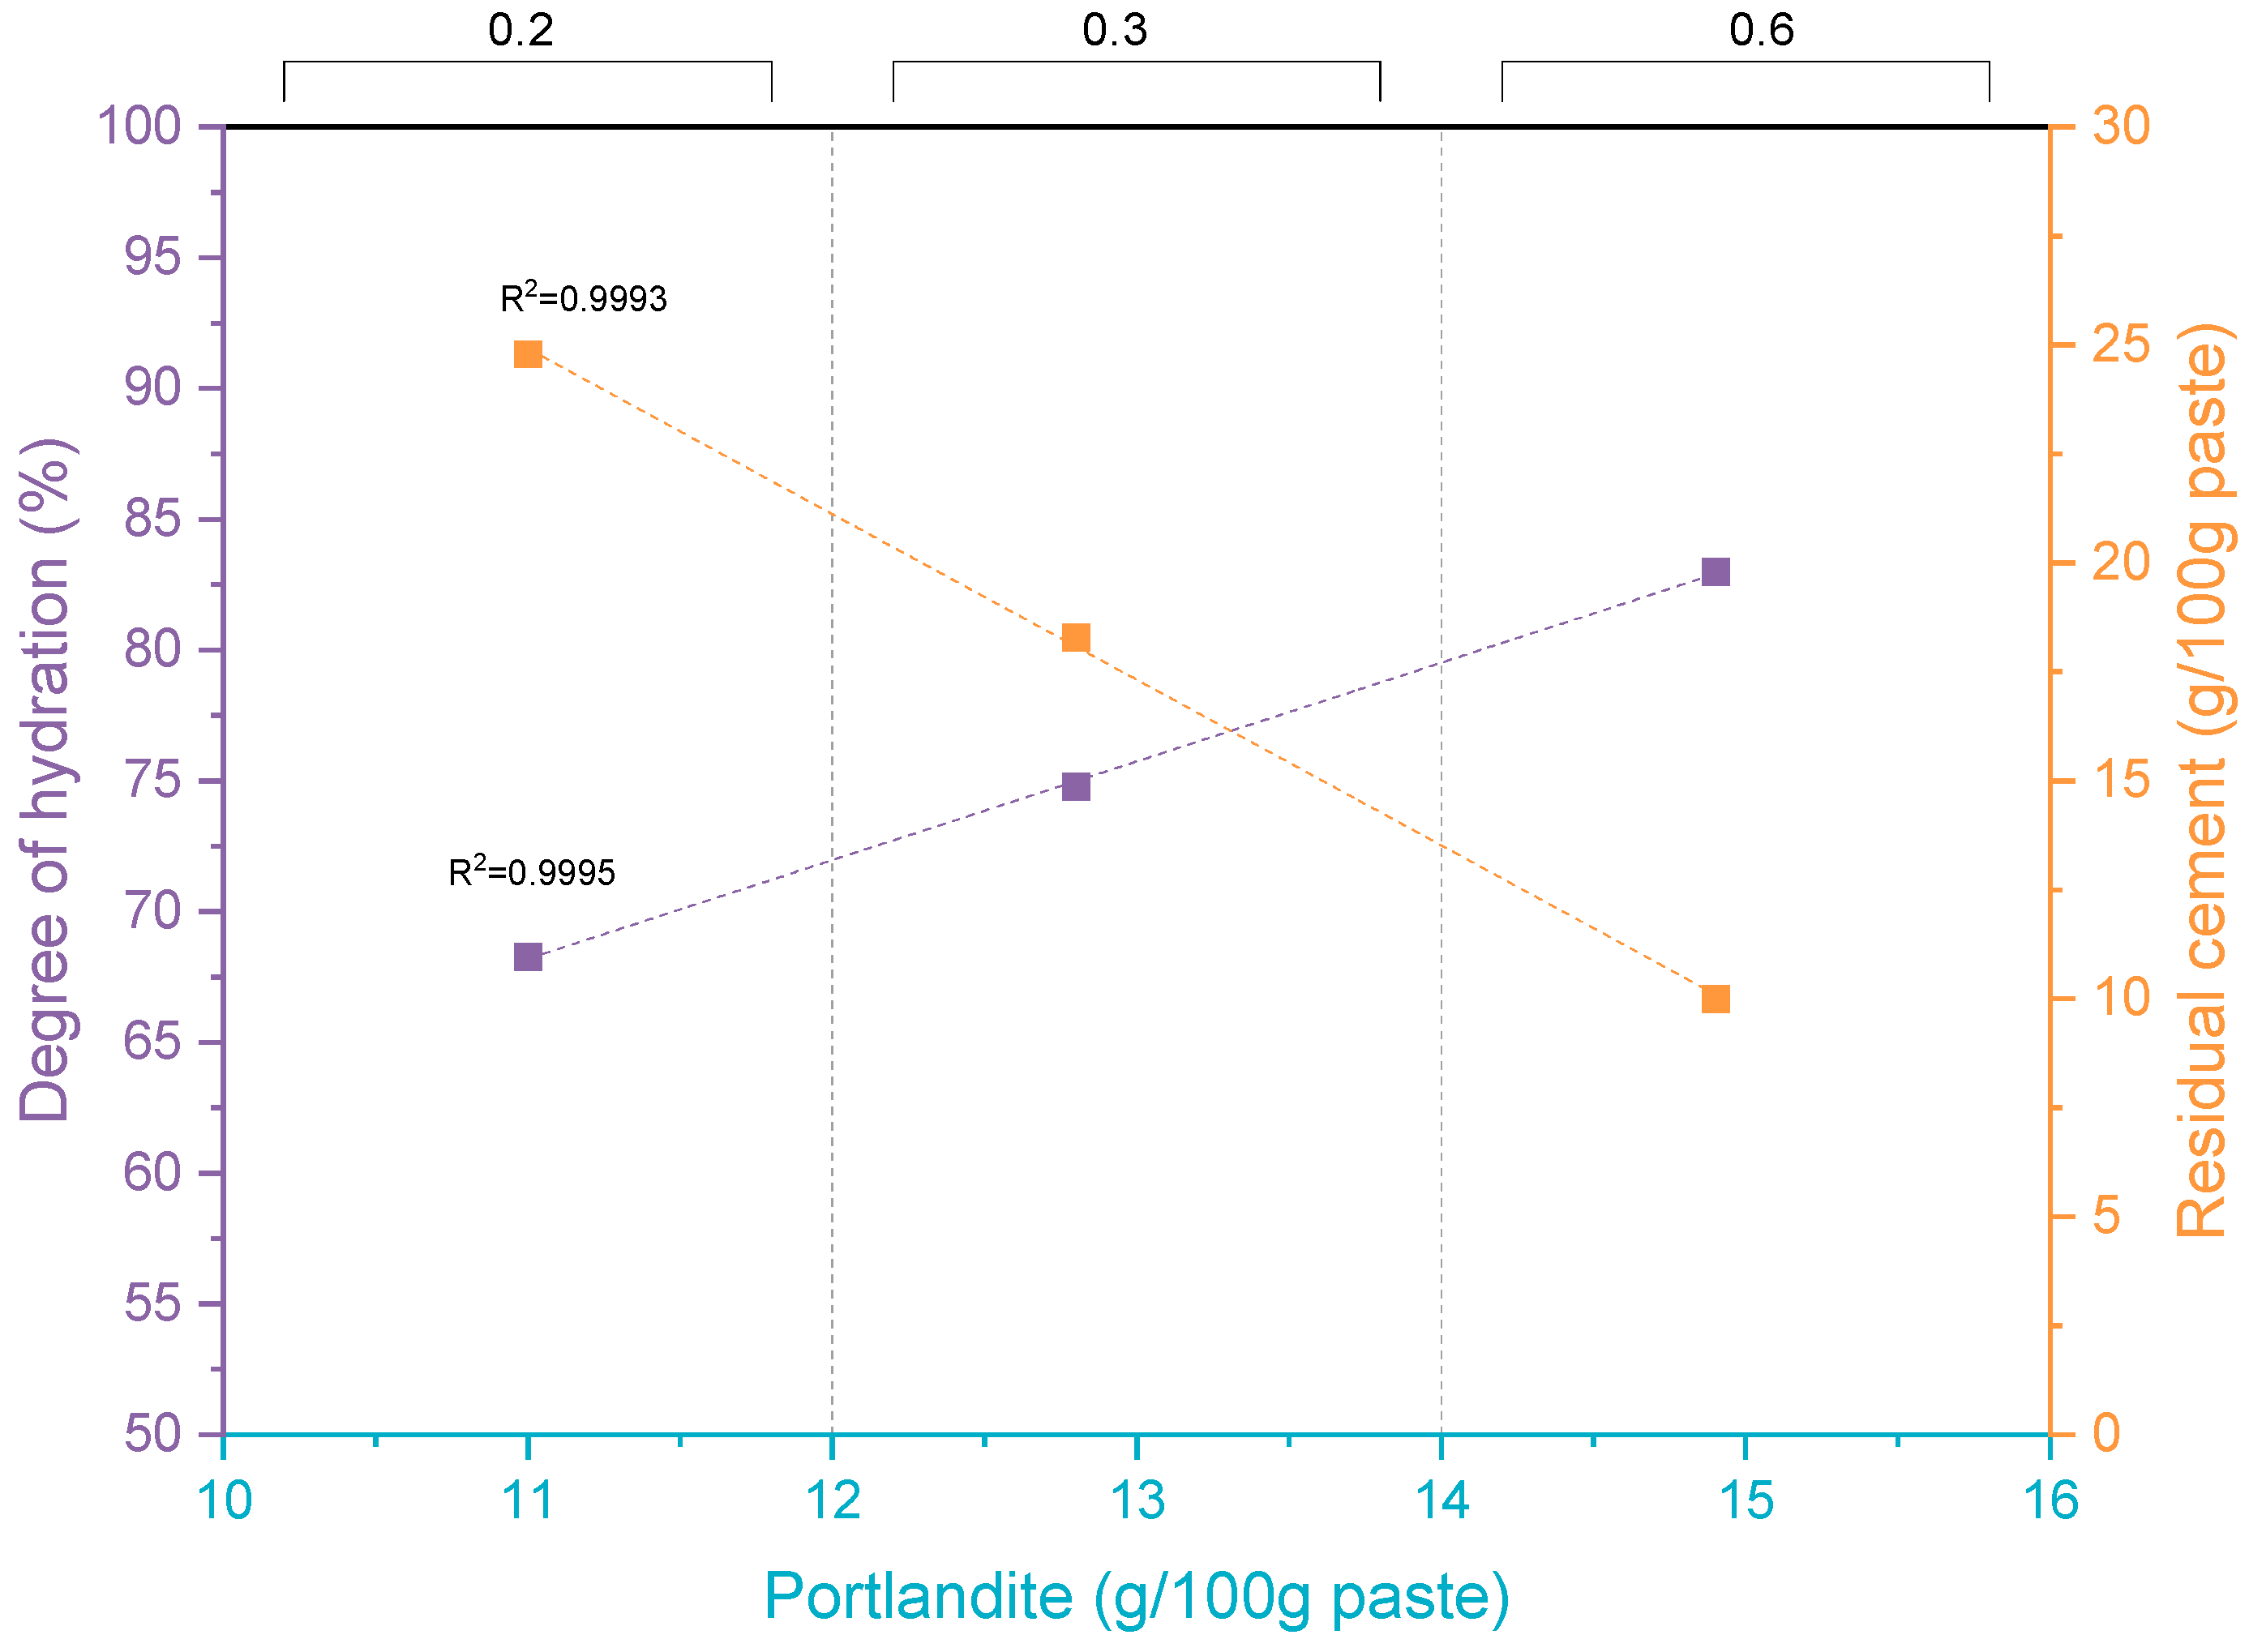
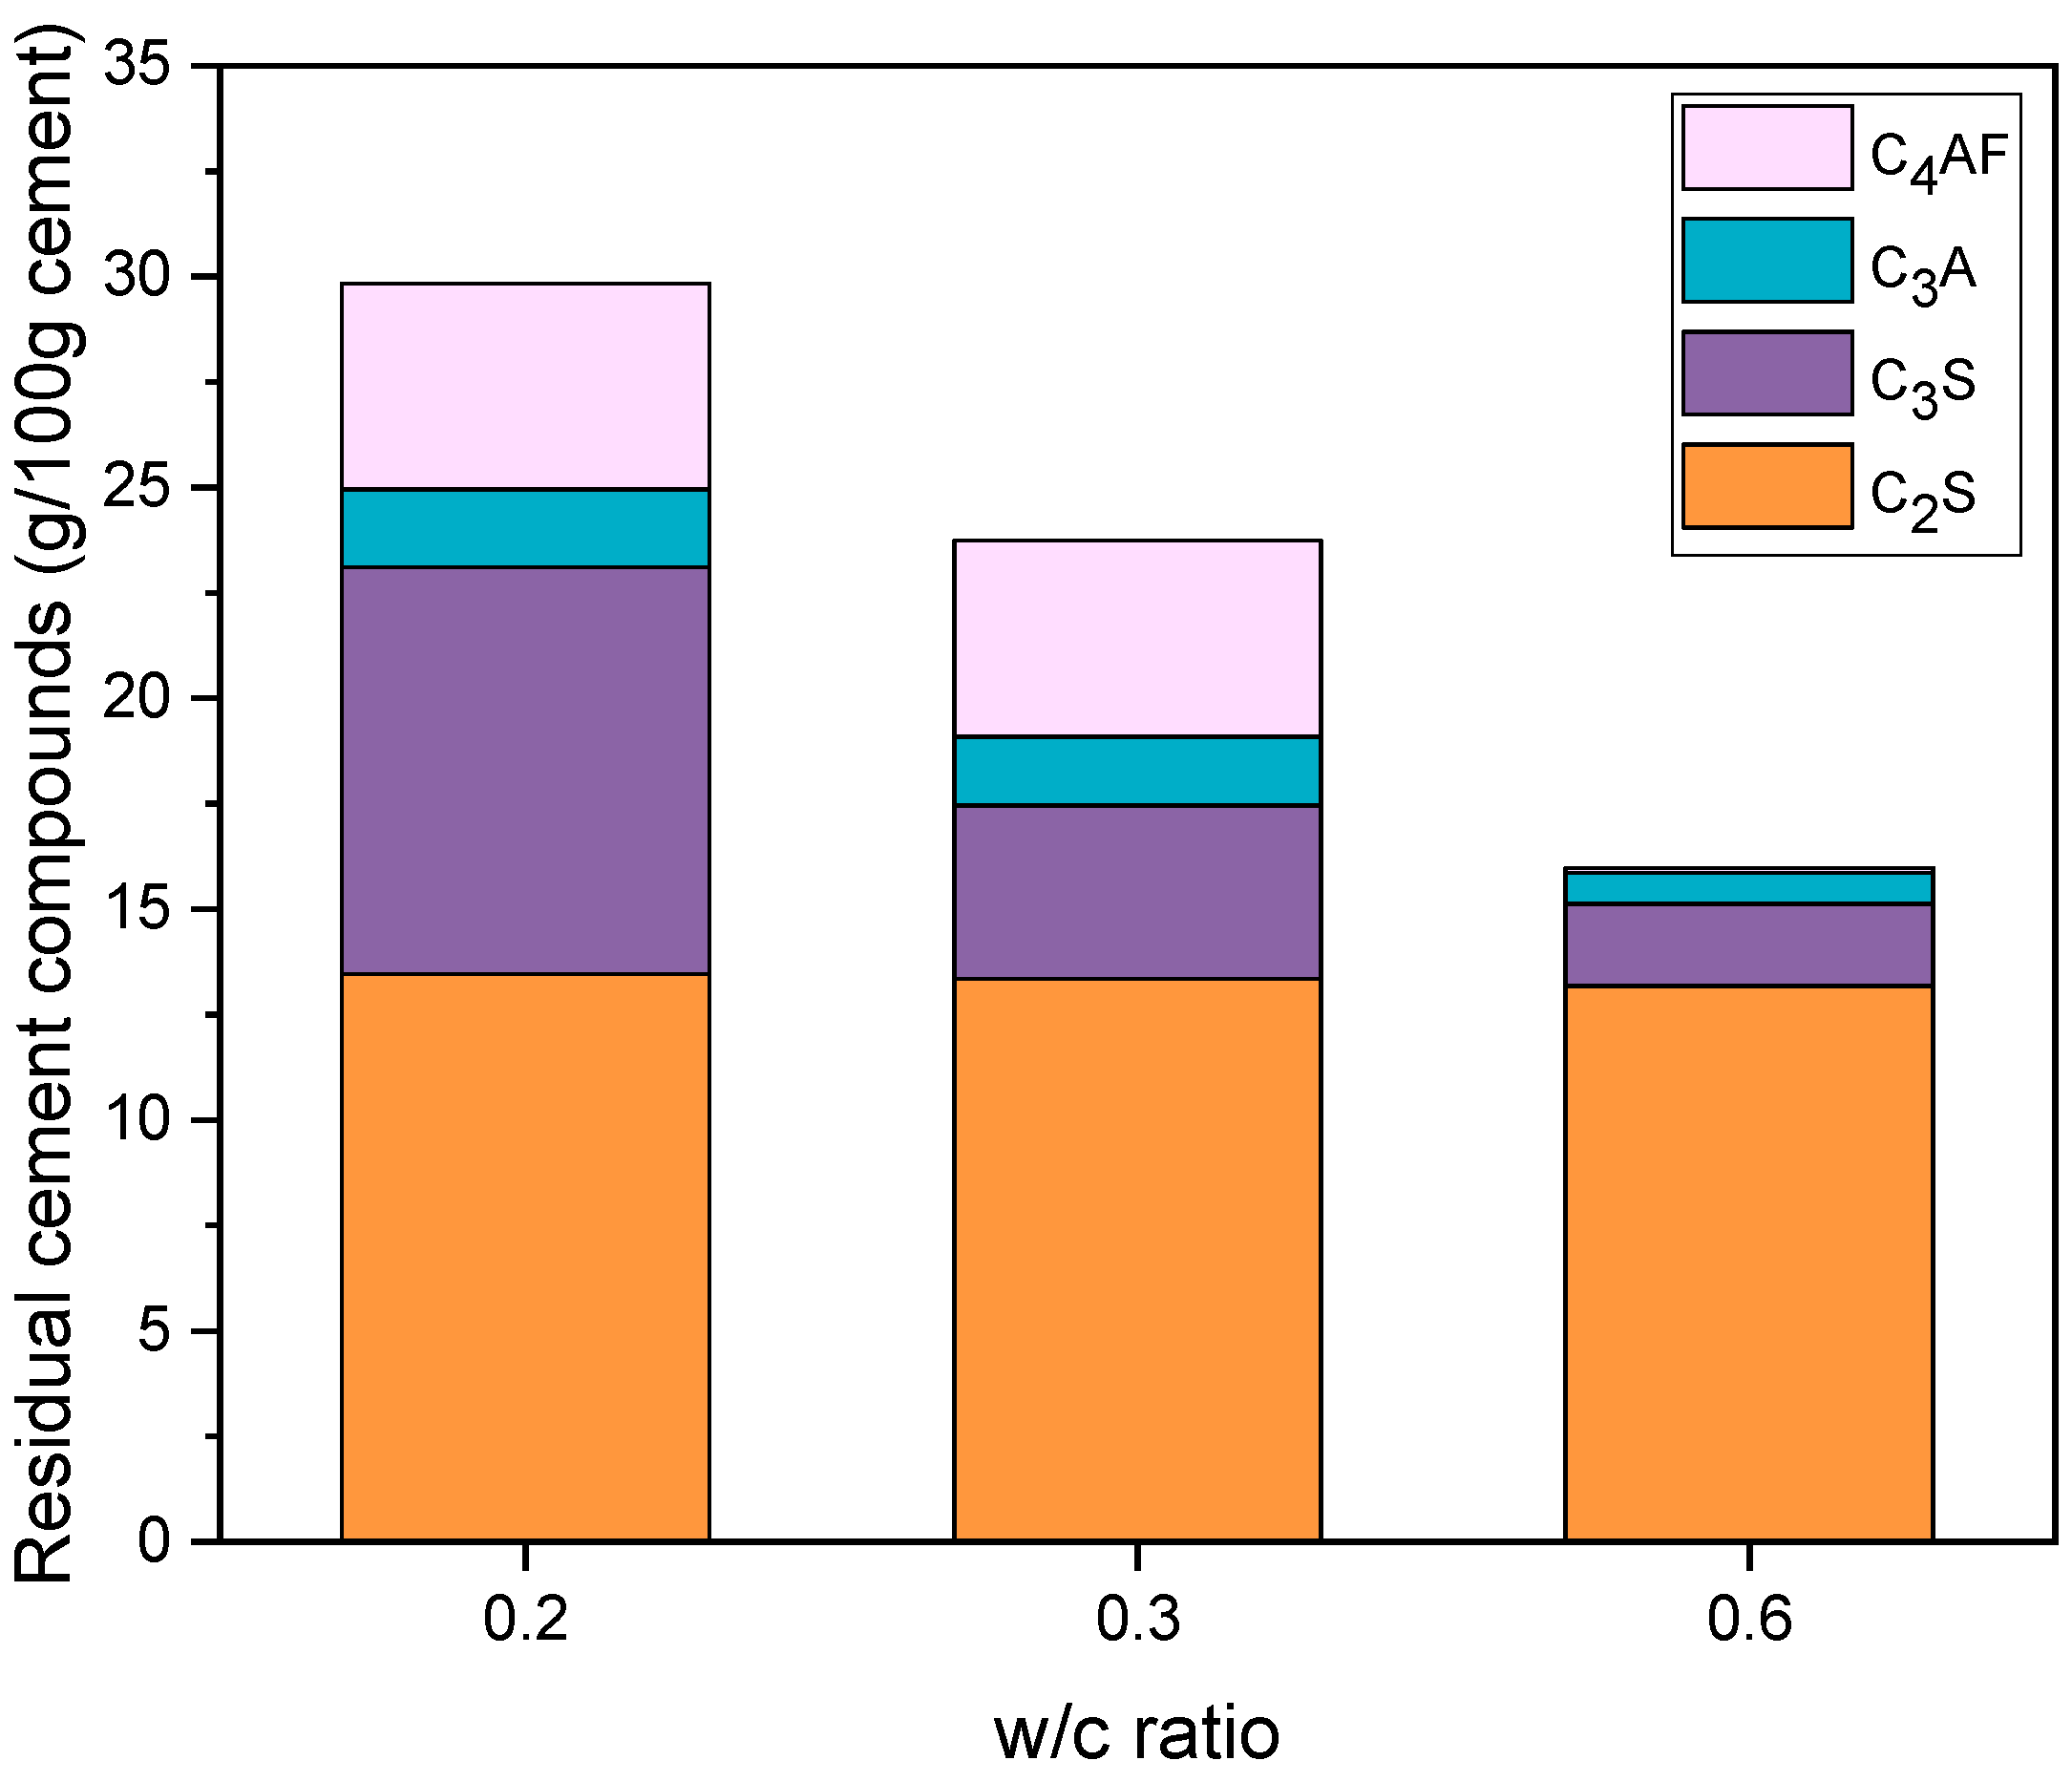
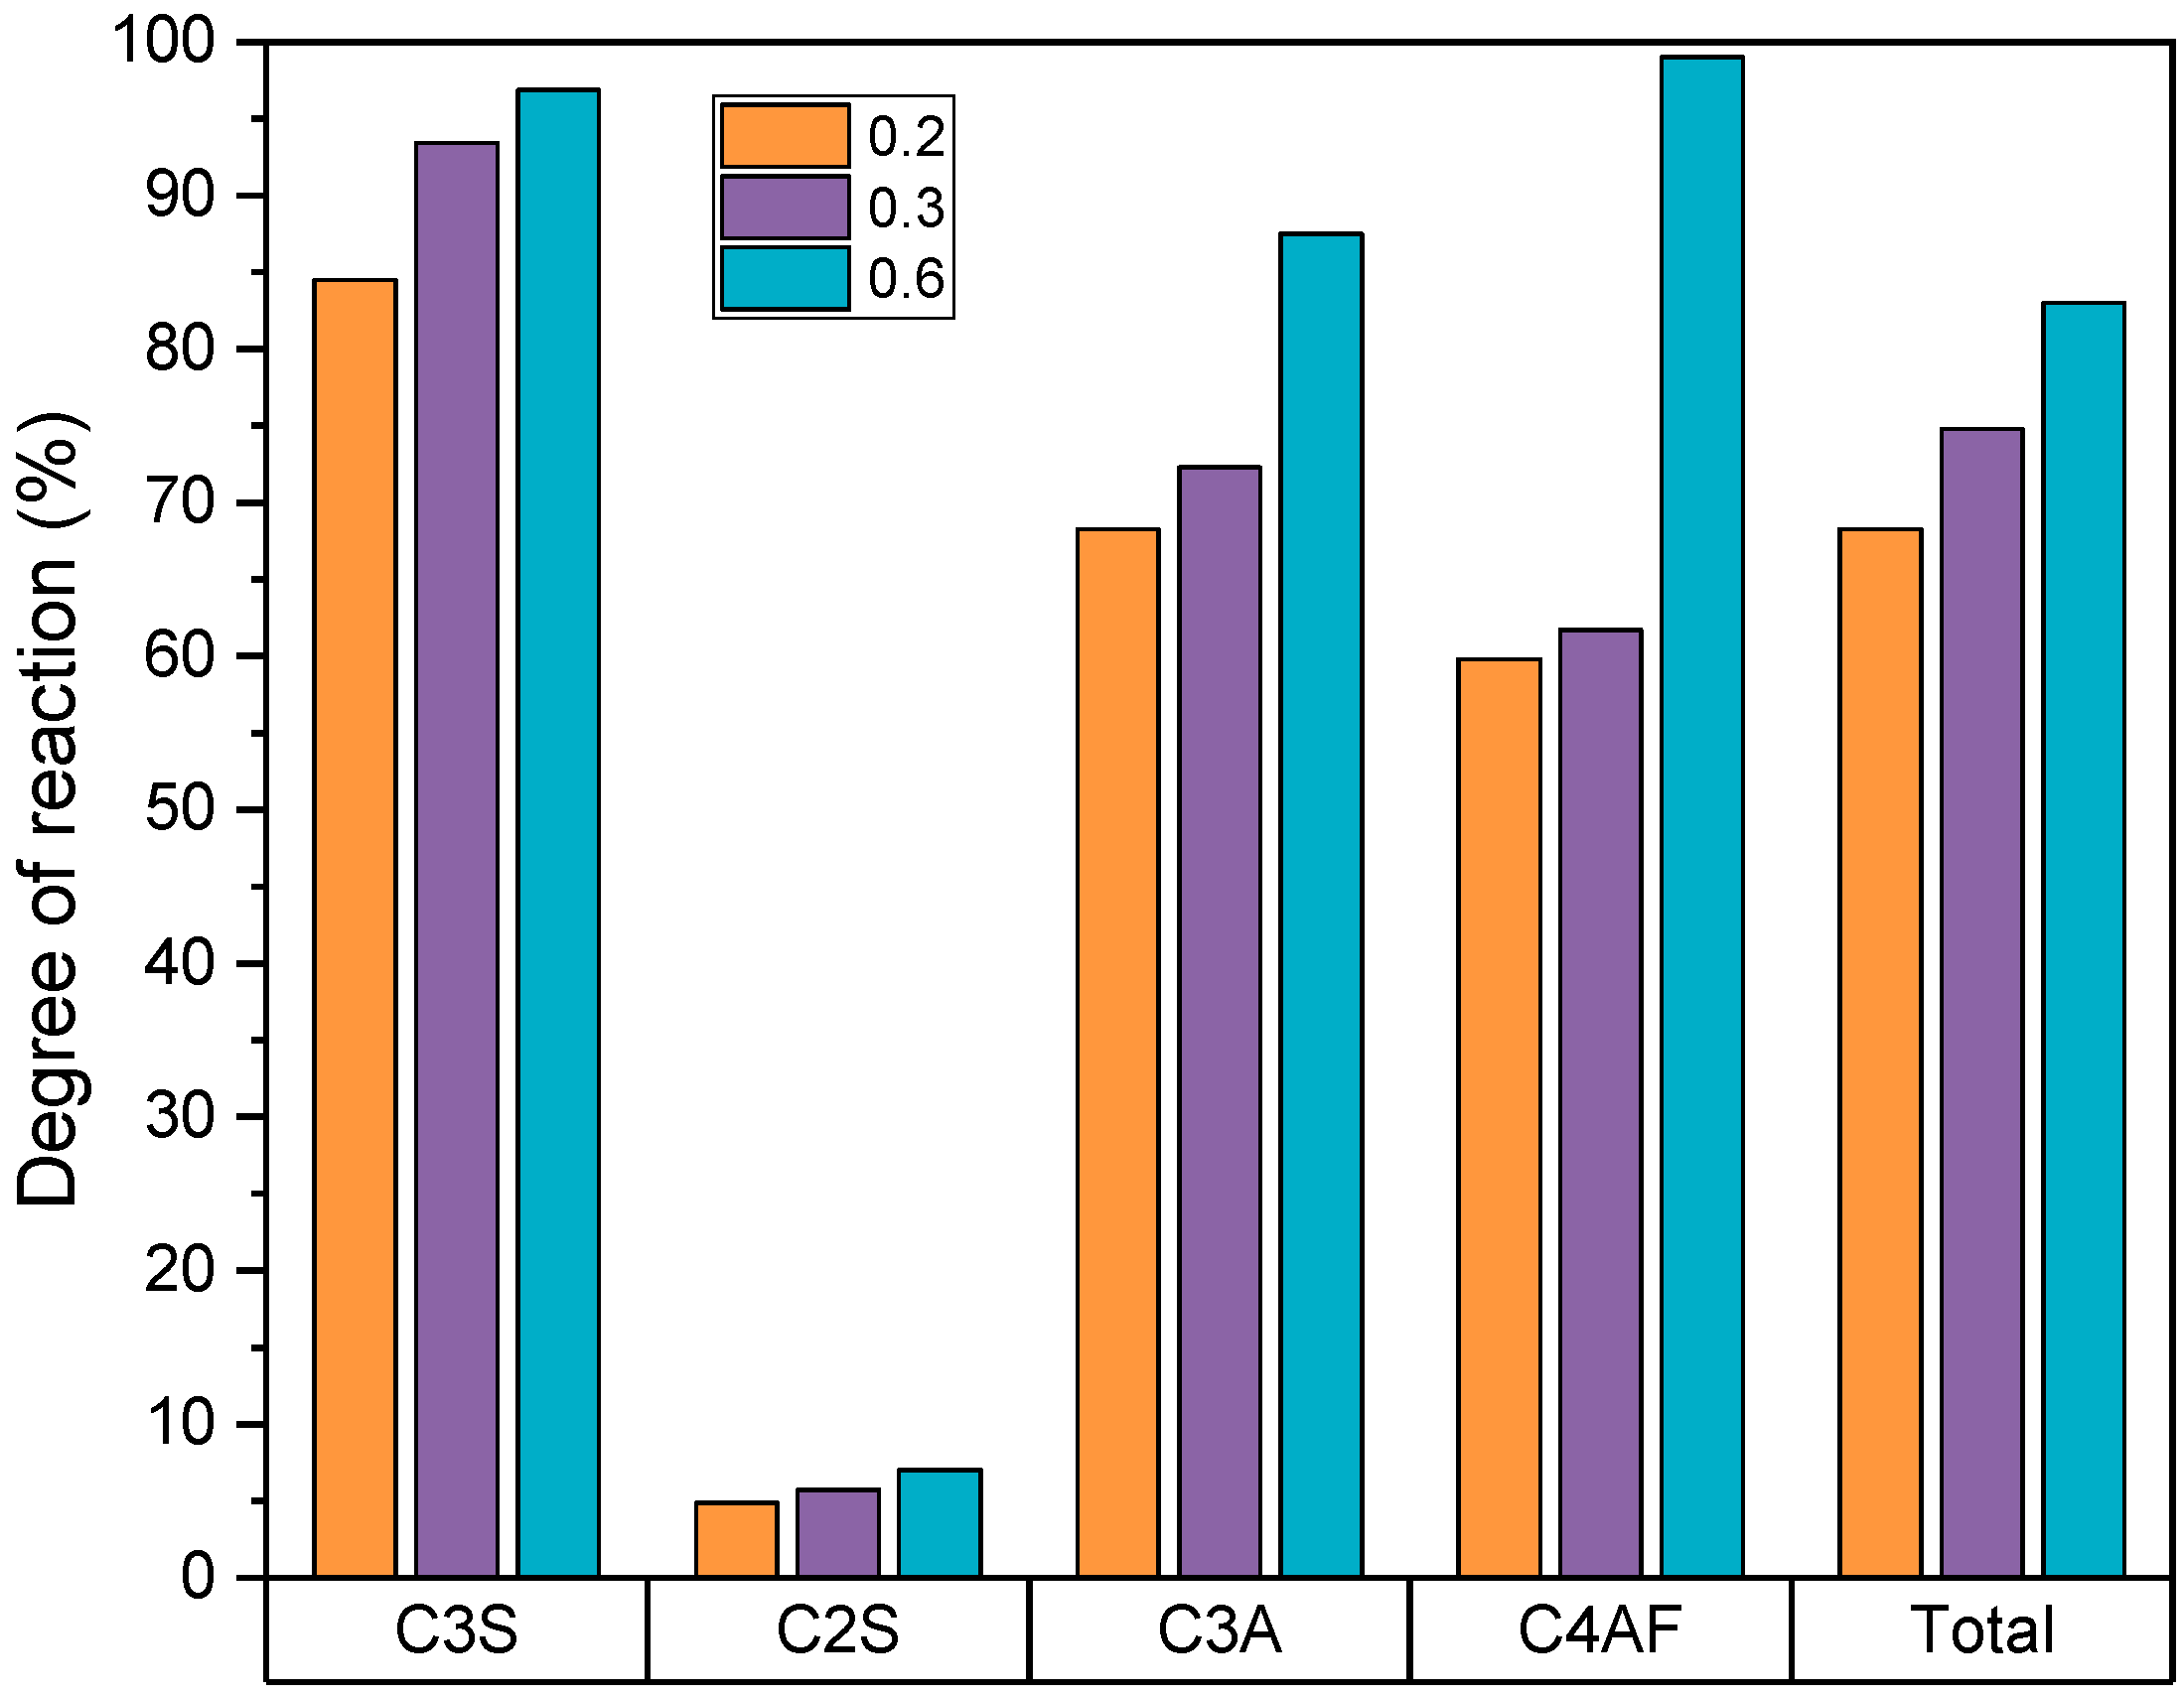
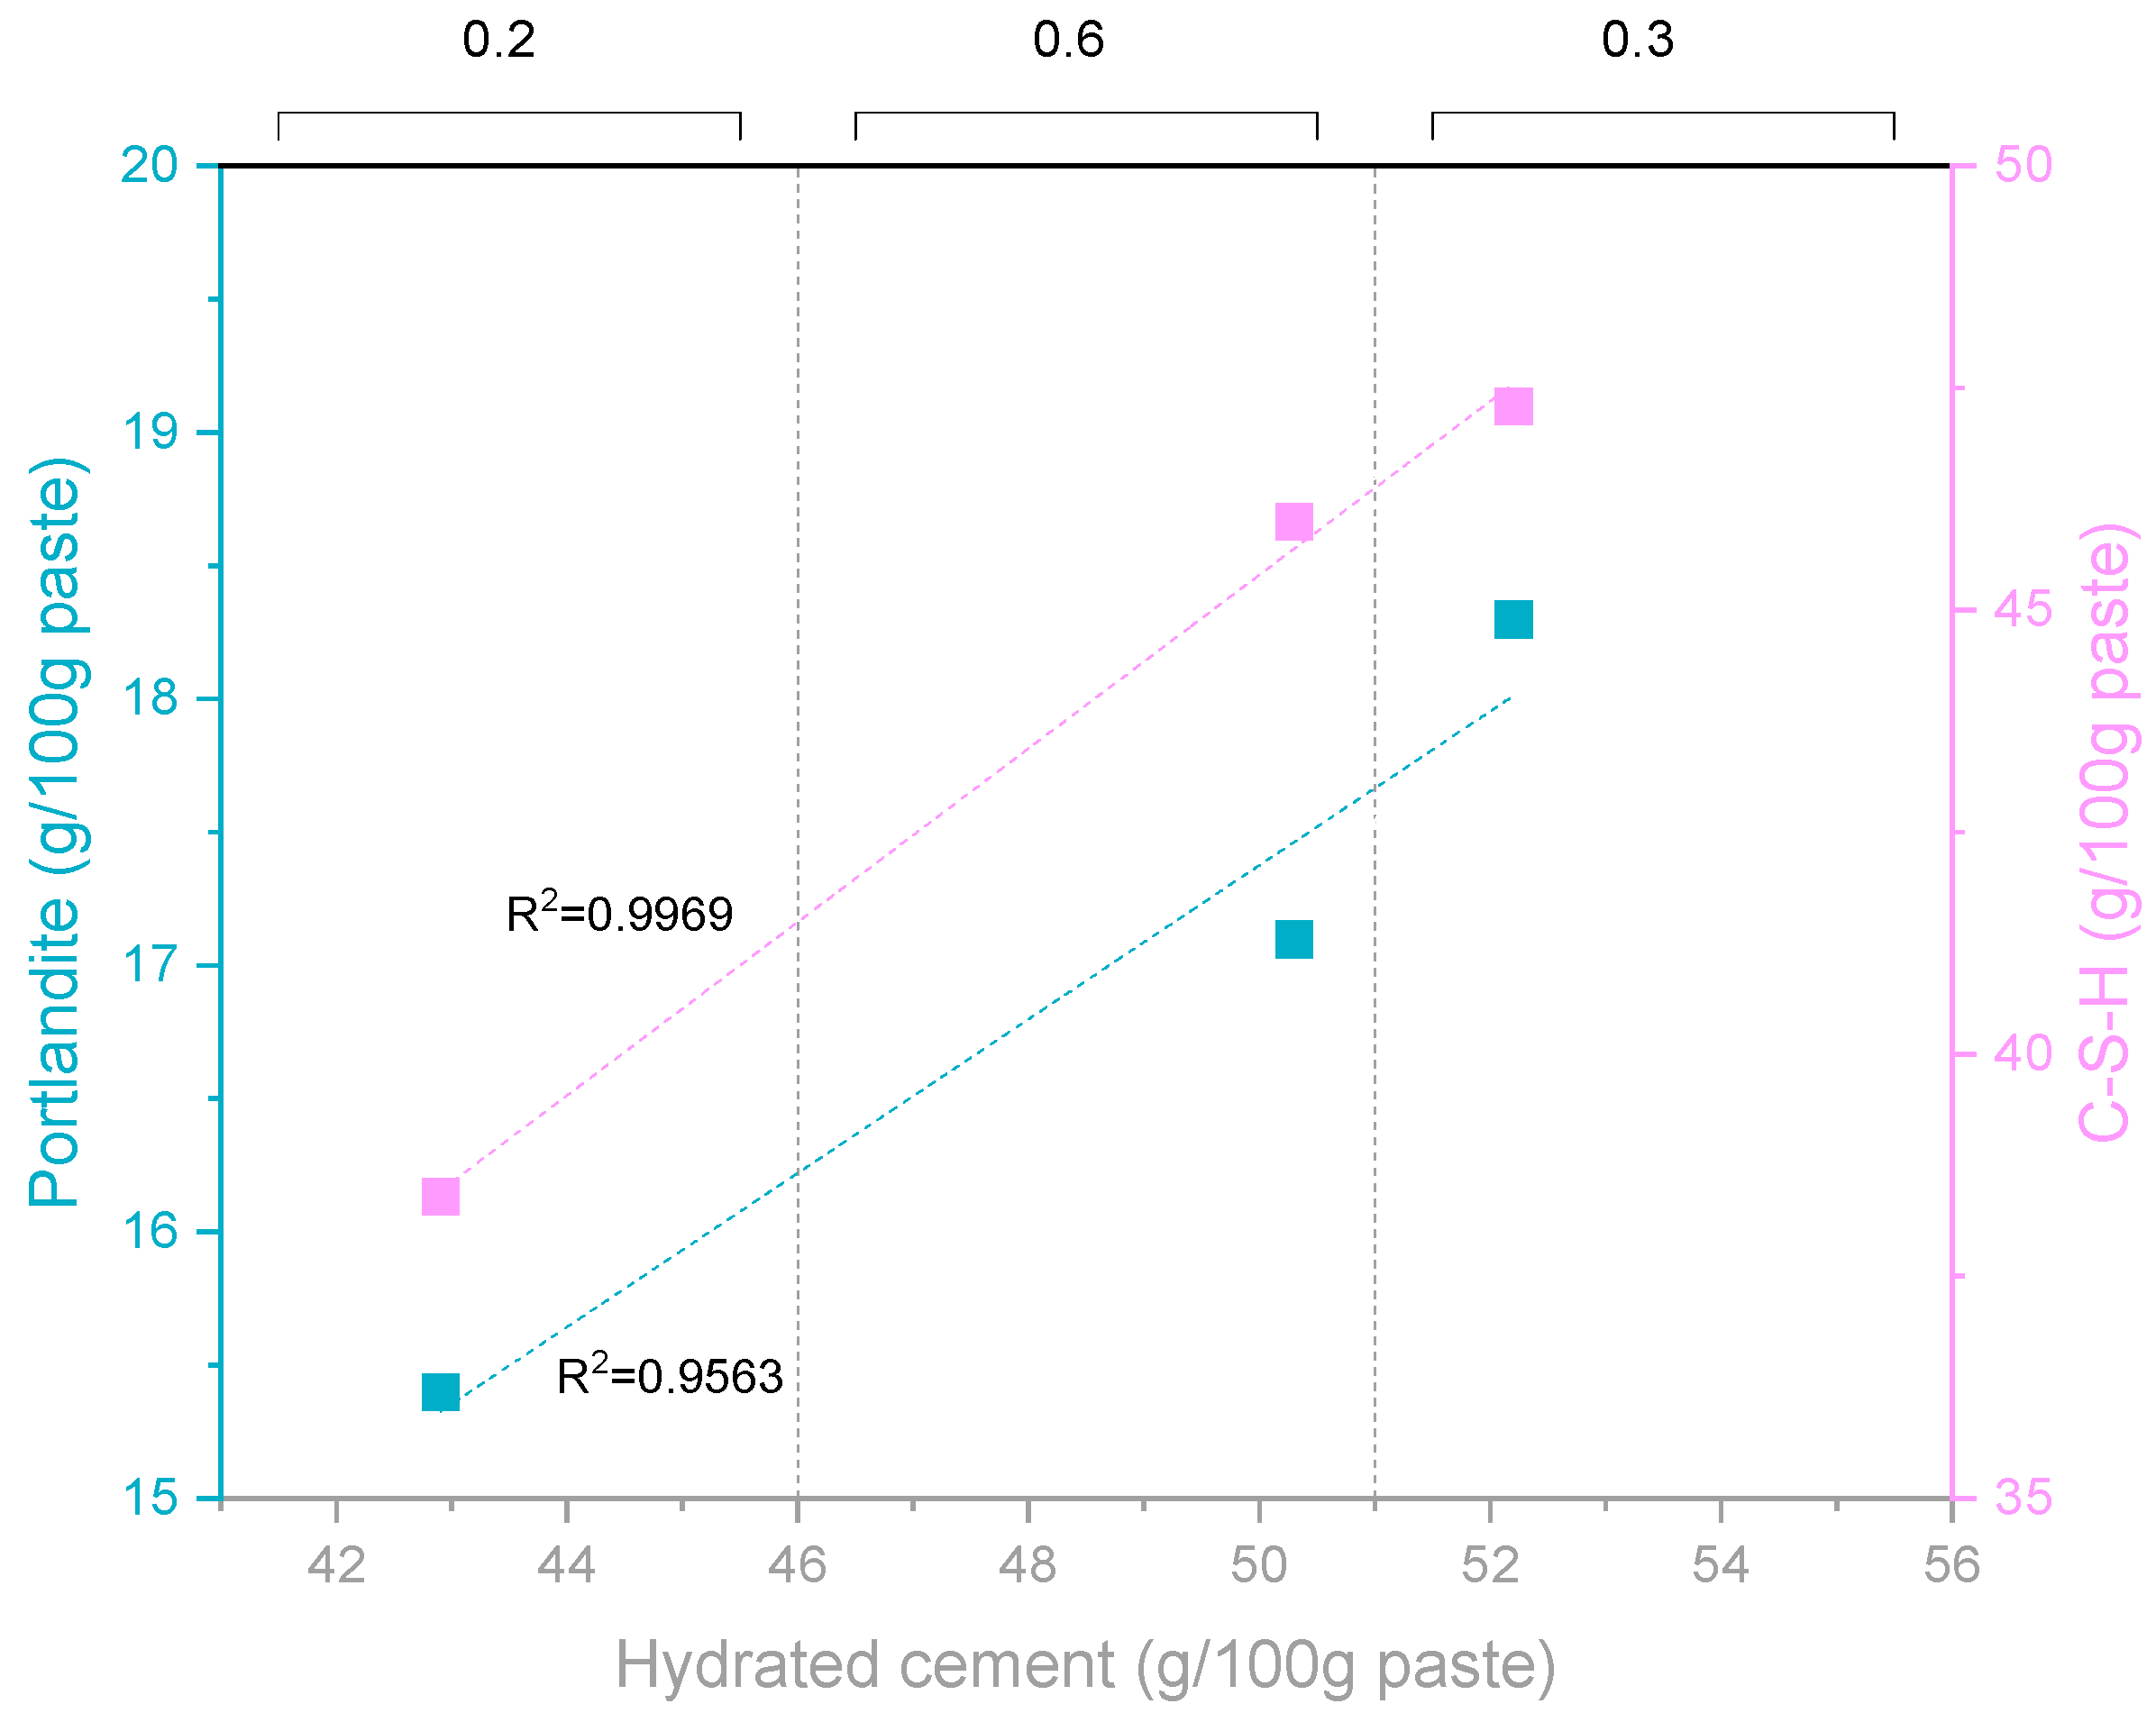
4.4. X-ray Diffraction
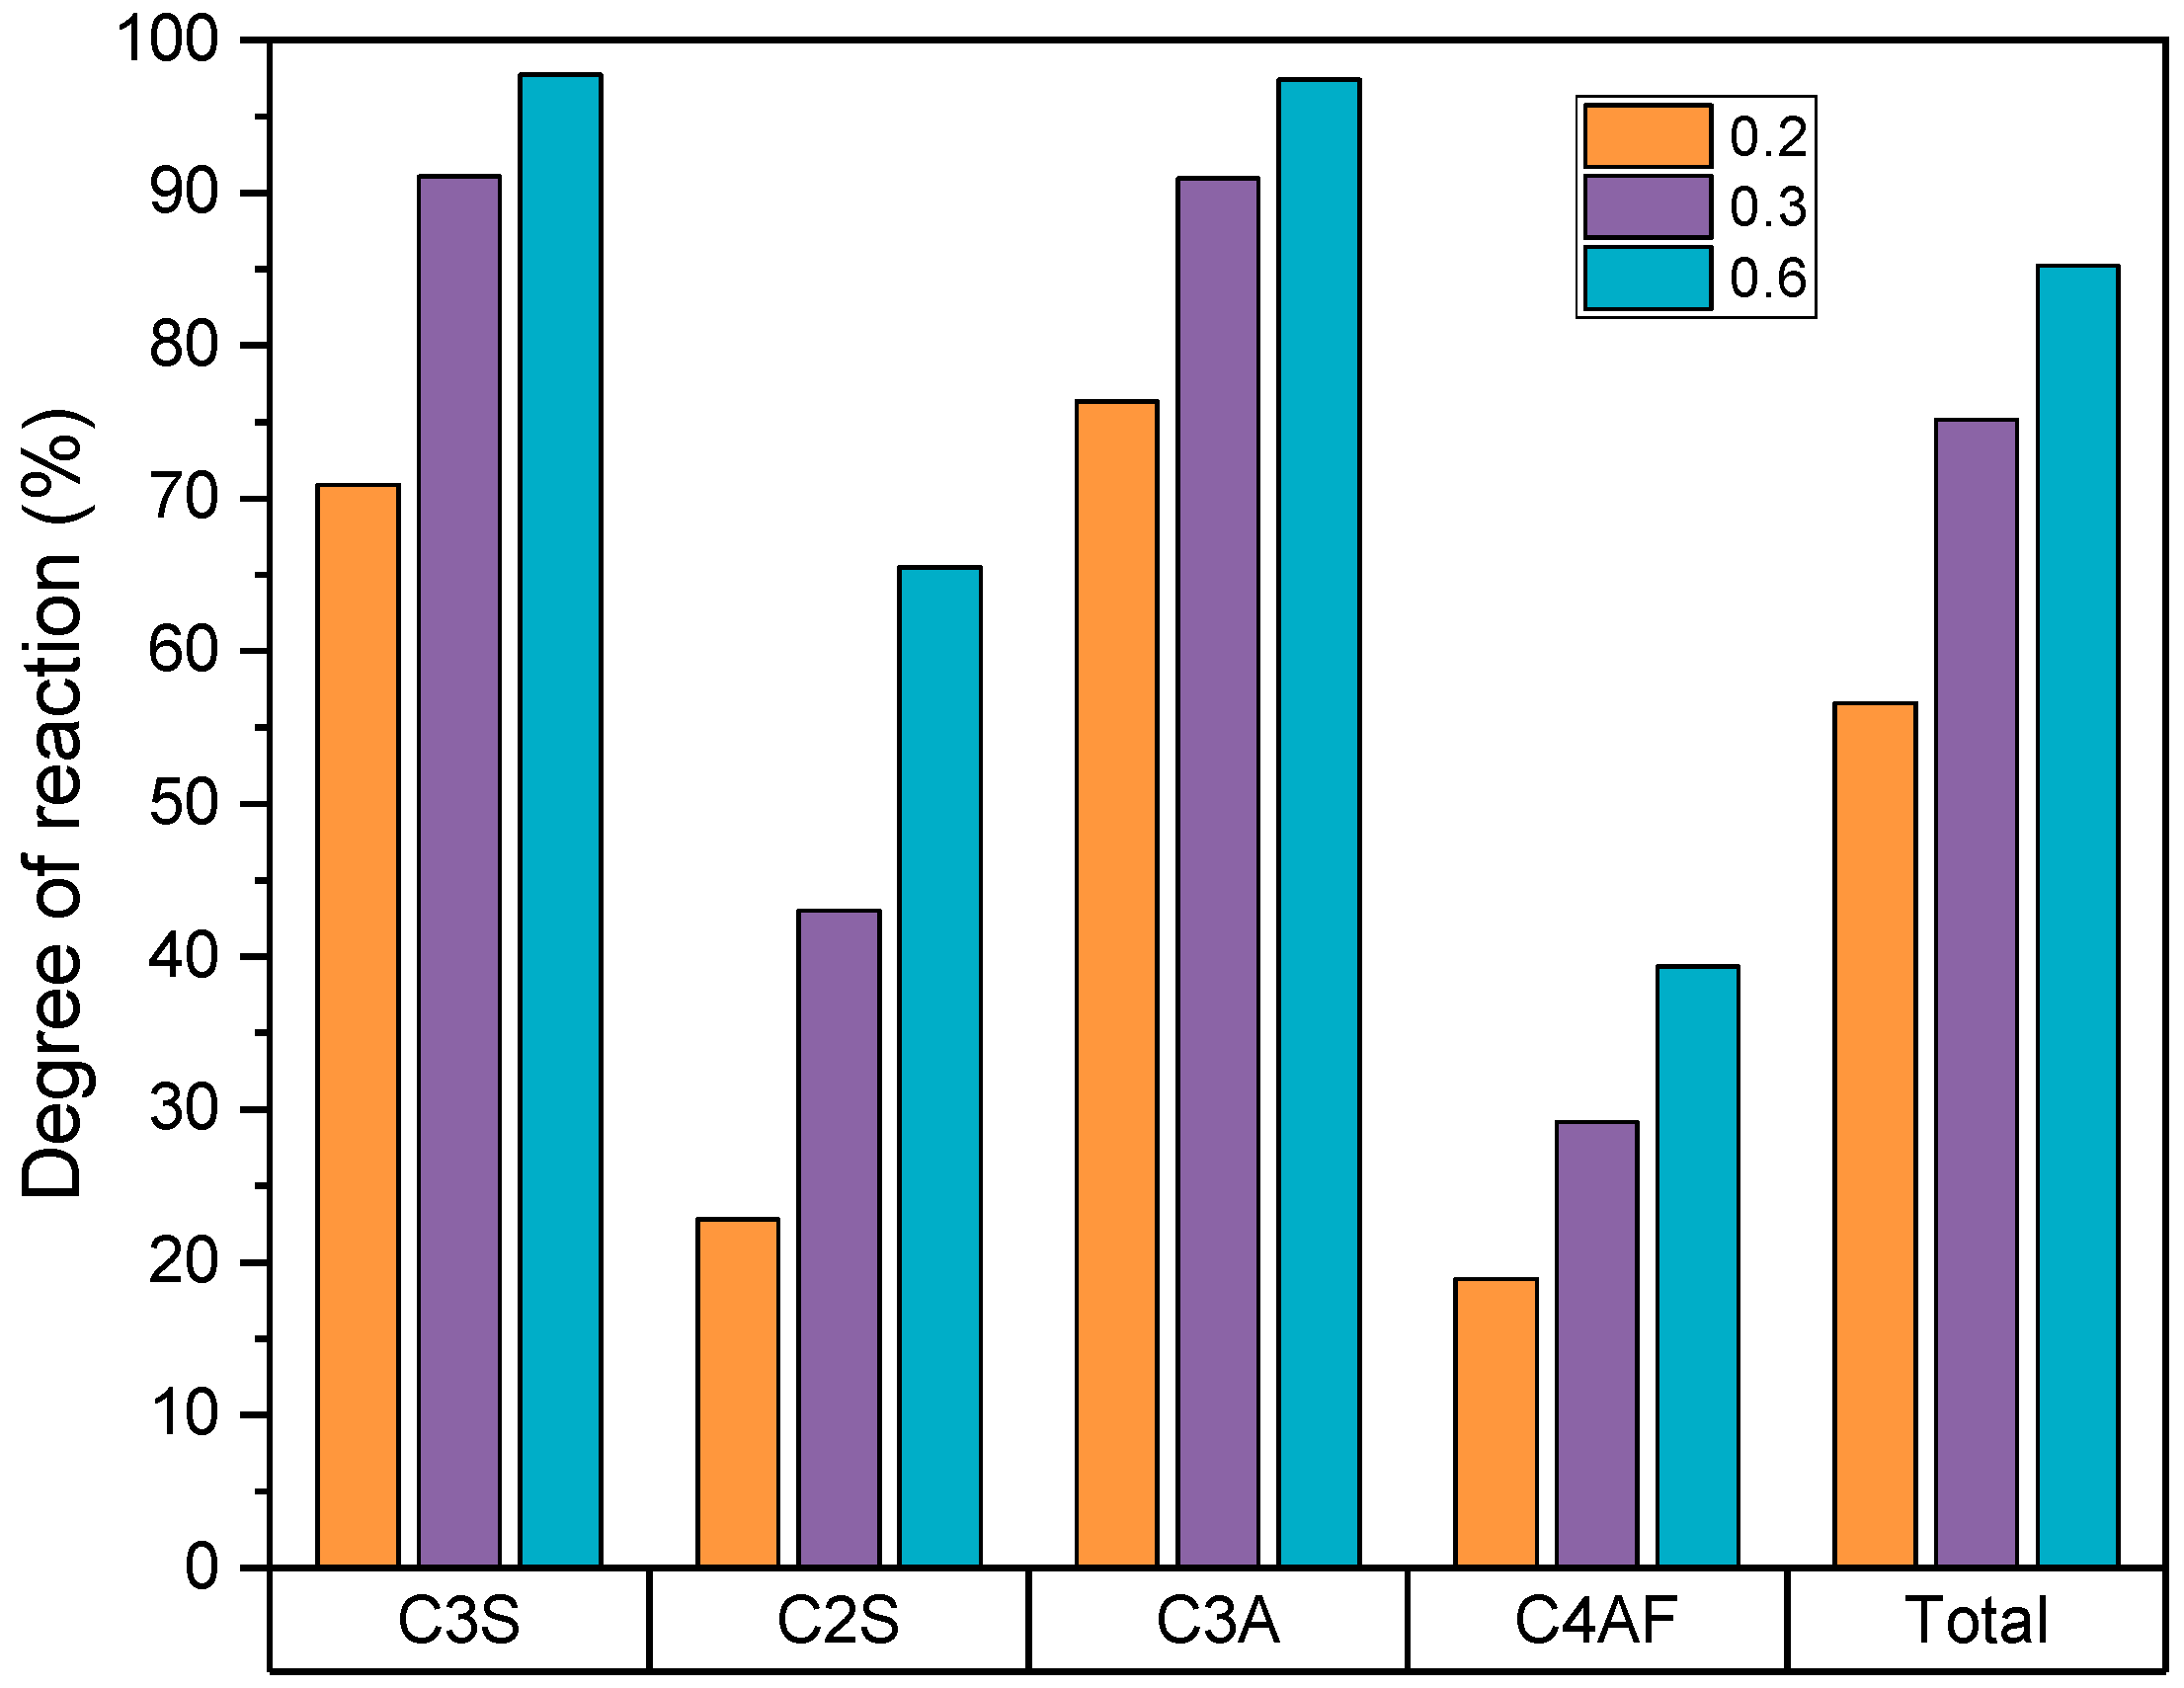
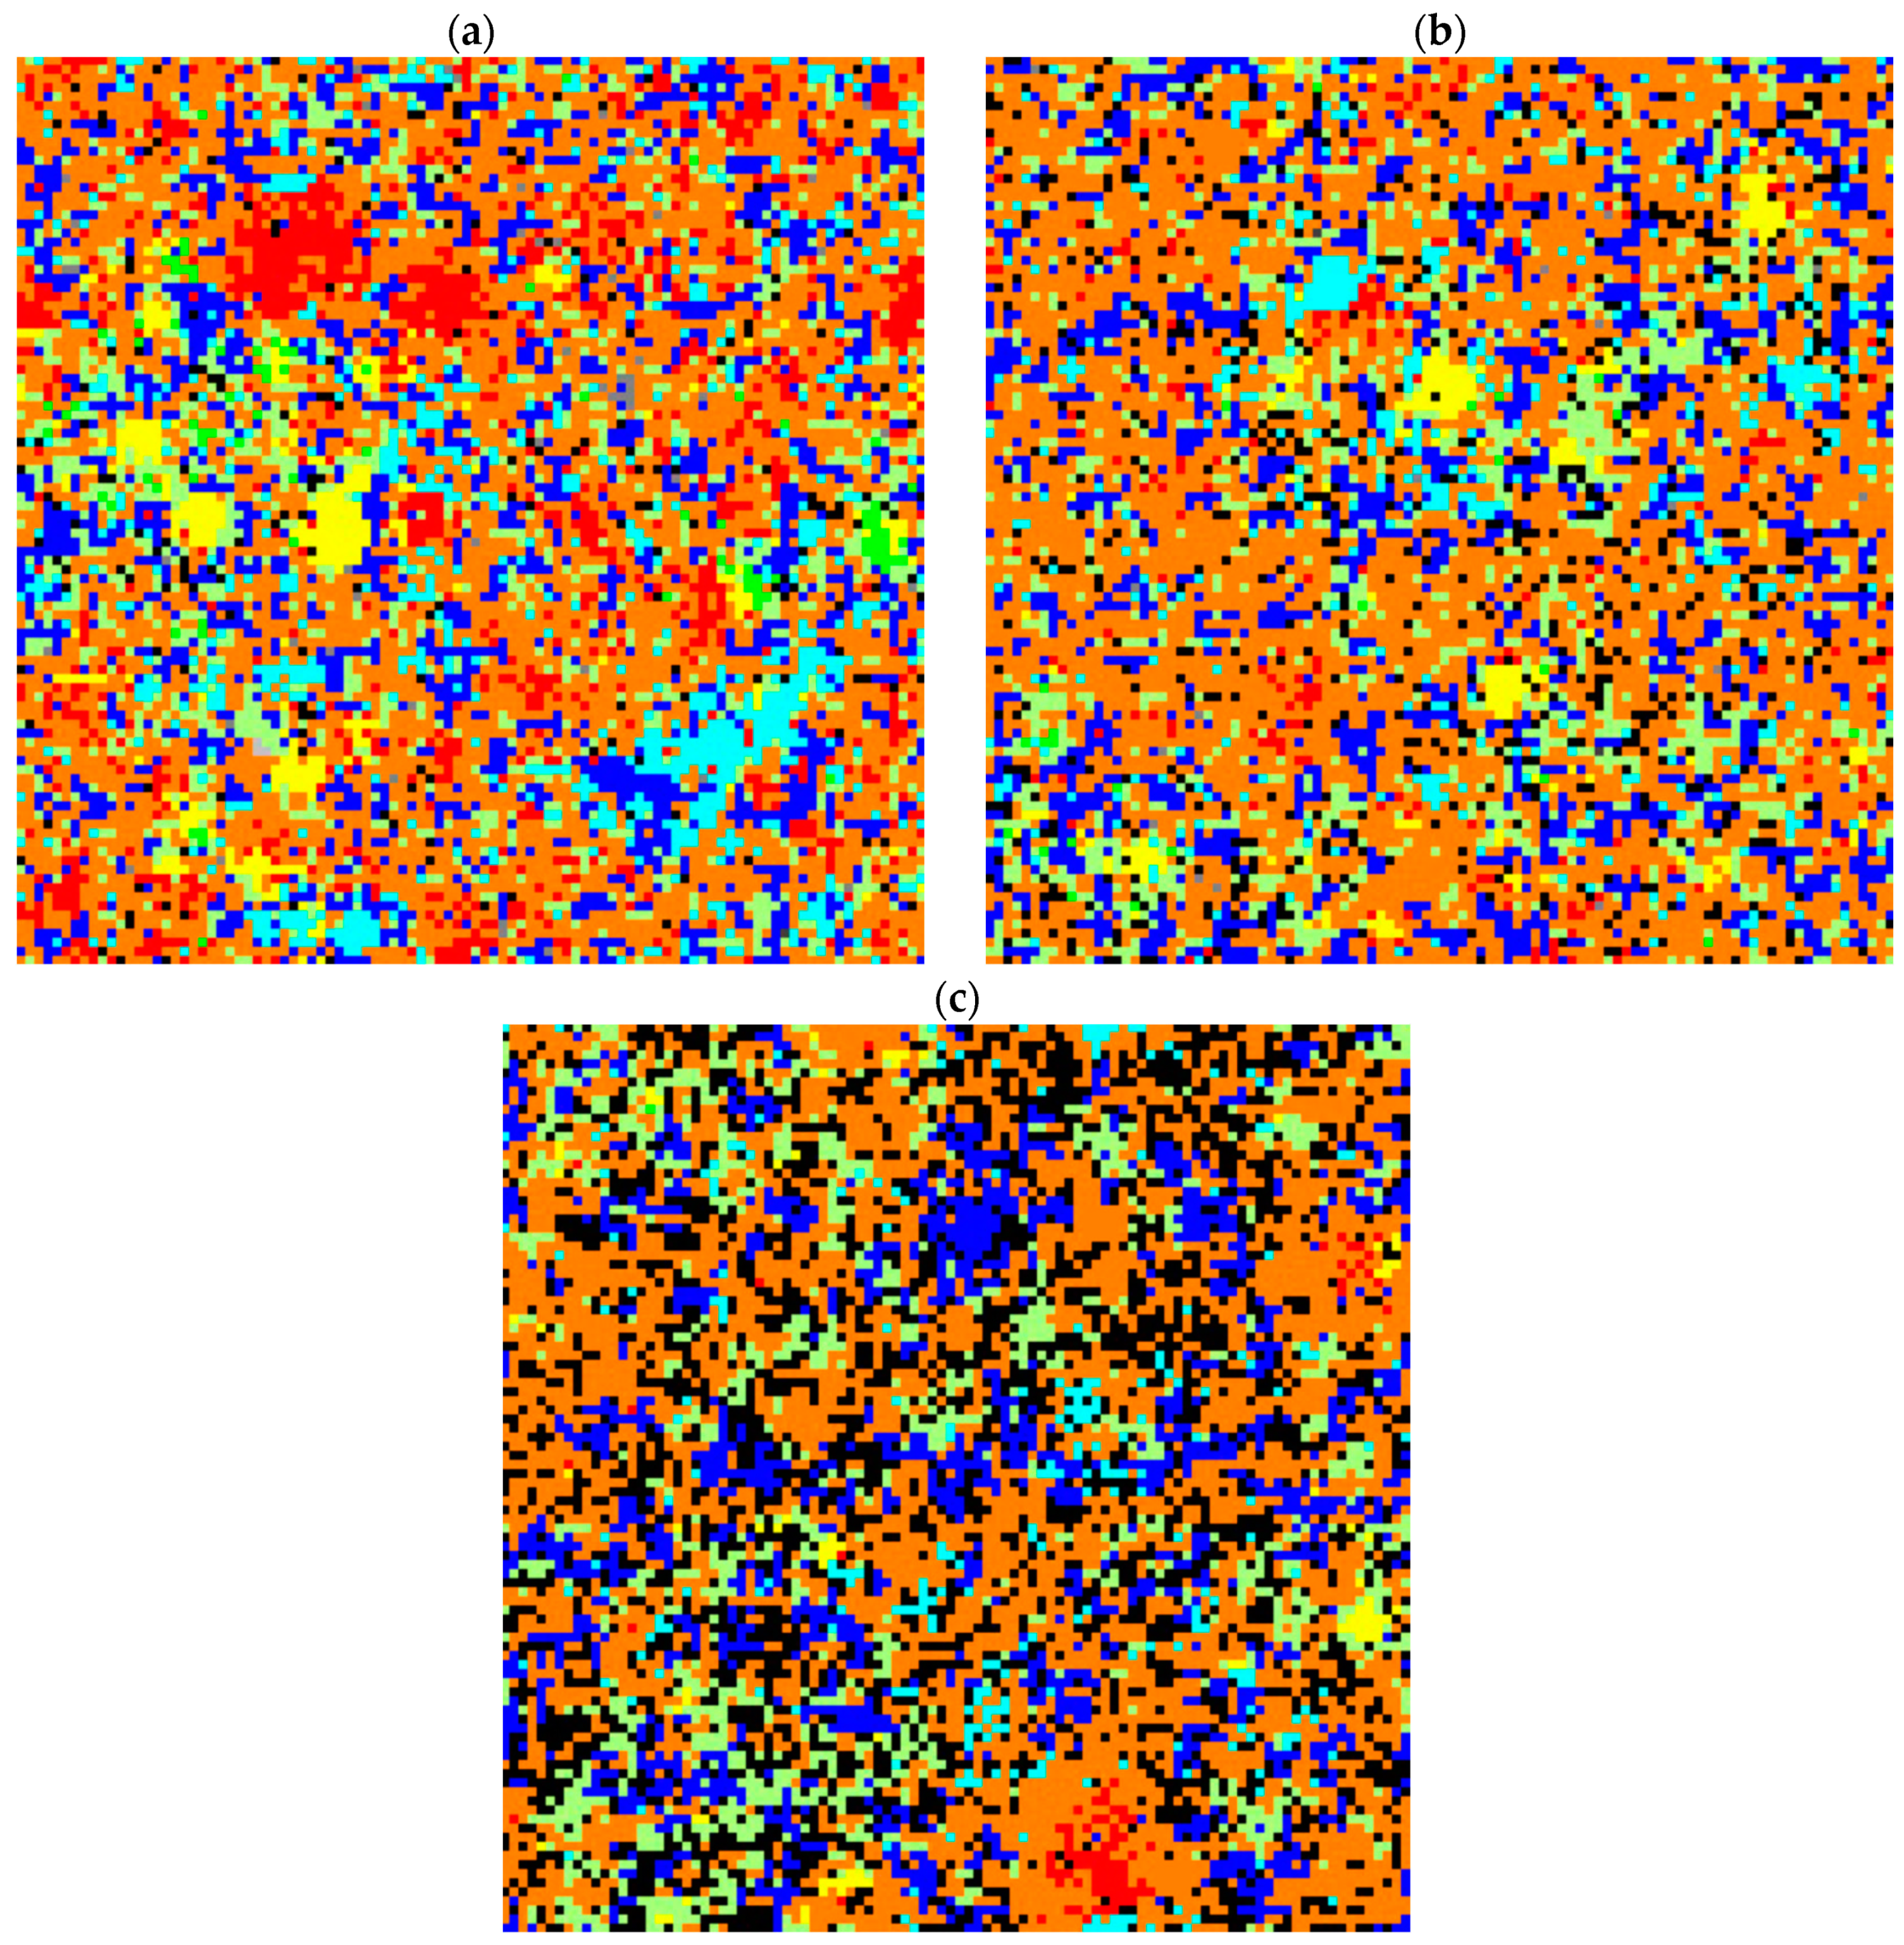
4.5. CEMHYD3D Modeling
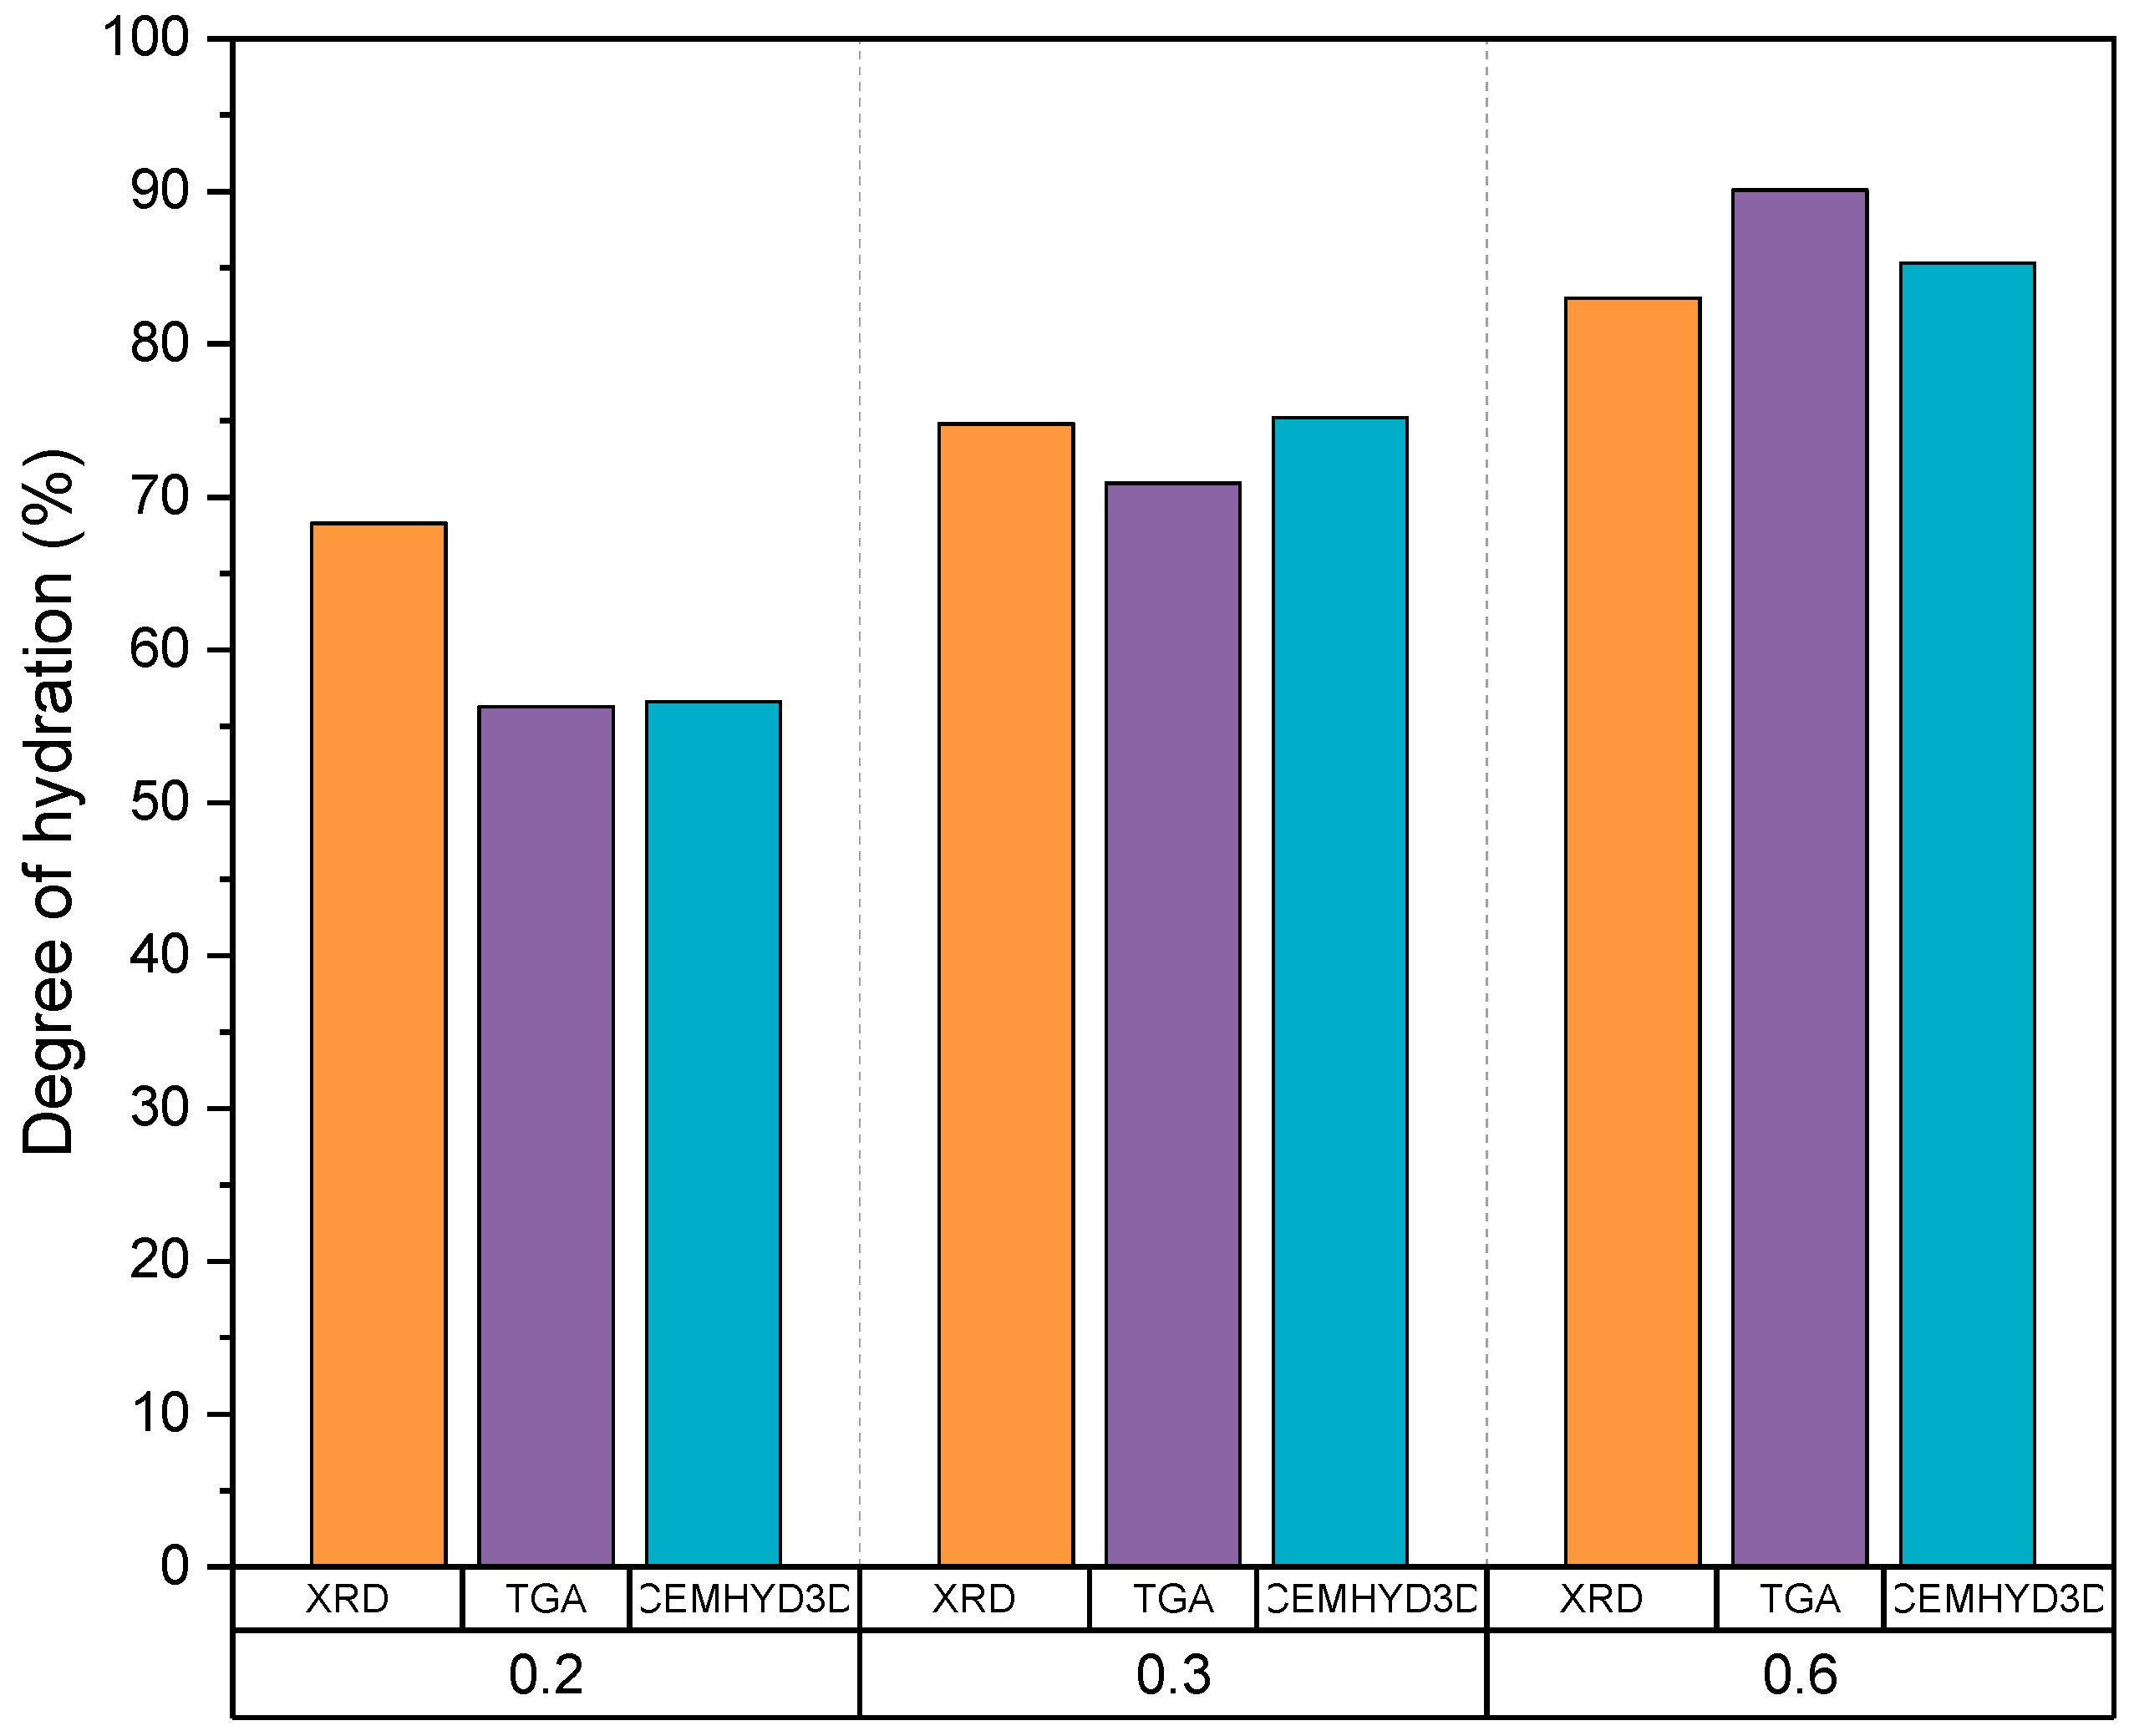
5. Discussion
6. Conclusions
Author Contributions
Funding
Acknowledgments
Conflicts of Interest
References
- Akhtar, A.; Sarmah, A.K. Construction and Demolition Waste Generation and Properties of Recycled Aggregate Concrete: A Global Perspective. J. Clean. Prod. 2018, 186, 262–281. [Google Scholar] [CrossRef]
- Pacheco-Torgal, F. Introduction to the Recycling of Construction and Demolition Waste (CDW). In Handbook of Recycled Concrete and Demolition Waste; Pacheco-Torgal, F., Tam, V.W.Y., Labrincha, J.A., Ding, Y., de Brito, J., Eds.; Woodhead Publishing: Sawston, UK, 2013; pp. 1–8. [Google Scholar]
- Coelho, A.; De Brito, J. Preparation of Concrete Aggregates from Construction and Demolition Waste (CDW). In Handbook of Recycled Concrete and Demolition Waste; Pacheco-Torgal, F., Tam, V.W.Y., Labrincha, J.A., Ding, Y., de Brito, J., Eds.; Woodhead Publishing: Sawston, UK, 2013; pp. 210–245. ISBN 9780857096906. [Google Scholar]
- Akbarnezhad, A. Separation Processes to Improve the Quality of Recycled Concrete Aggregates (RCA). In Handbook of Recycled Concrete and Demolition Waste; Pacheco-Torgal, F., Tam, V.W.Y., Labrincha, J.A., Ding, Y., de Brito, J., Eds.; Woodhead Publishing: Sawston, UK, 2013; pp. 246–269. [Google Scholar]
- De Juan, M.S.; Gutiérrez, P.A. Study on the Influence of Attached Mortar Content on the Properties of Recycled Concrete Aggregate. Constr. Build. Mater. 2009, 23, 872–877. [Google Scholar] [CrossRef]
- Shima, H.; Tateyashiki, H.; Matsuhashi, R.; Yoshida, Y. An Advanced Concrete Recycling Technology and Its Applicability Assessment through Input-Output Analysis. J. Adv. Concr. Technol. 2005, 3, 53–67. [Google Scholar] [CrossRef]
- Akbarnezhad, A.; Ong, K.C.G.; Zhang, M.H.; Tam, C.T.; Foo, T.W.J. Microwave-Assisted Beneficiation of Recycled Concrete Aggregates. Constr. Build. Mater. 2011, 25, 3469–3479. [Google Scholar] [CrossRef]
- Butler, L.; West, J.S.; Tighe, S.L. The Effect of Recycled Concrete Aggregate Properties on the Bond Strength between RCA Concrete and Steel Reinforcement. Cem. Concr. Res. 2011, 41, 1037–1049. [Google Scholar] [CrossRef]
- Katz, A. Treatments for the Improvement of Recycled Aggregate. J. Mater. Civ. Eng. 2004, 16, 597–603. [Google Scholar] [CrossRef]
- Tam, V.W.Y.; Tam, C.M.; Le, K.N. Removal of Cement Mortar Remains from Recycled Aggregate Using Pre-Soaking Approaches. Resour. Conserv. Recycl. 2007, 50, 82–101. [Google Scholar] [CrossRef]
- Spaeth, V.; Djerbi Tegguer, A. Improvement of Recycled Concrete Aggregate Properties by Polymer Treatments. Int. J. Sustain. Built Environ. 2013, 2, 143–152. [Google Scholar] [CrossRef]
- Cyr, M.; Diliberto, C.; Lecomte, A.; Izoret, L. Recycled Concrete as Cement Main Constituent (CMC) or Supplementary Cementitious Materials (SCM). In Concrete Recycling—Research and Practice; de Larrard, F., Colina, H., Eds.; Taylor & Francis Group: Boca Raton, FL, USA, 2019; pp. 83–98. [Google Scholar]
- Zhutovsky, S.; Karinski, Y.S.; Feldgun, V.R.; Yankelevsky, D.Z. Loading Branch of the Barotropic Equation of State for Cementitious Composites under Extremely High Pressures. Int. J. Solids Struct. 2020, 188, 181–188. [Google Scholar] [CrossRef]
- Zhutovsky, S.; Shishkin, A. Recycling of Hydrated Portland Cement Paste into New Clinker. Constr. Build. Mater. 2021, 280, 122510. [Google Scholar] [CrossRef]
- Zhutovsky, S.; Shishkin, A. Recycling of Hydrated Portland Cement Paste for Clinker Production. In Proceedings of the RILEM-SC2020 Ambitioning a Sustainable Future for Built Environment: Comprehensive Strategies for Unprecedented Challenges, Guimarães, Portugal, 9 March 2020. [Google Scholar] [CrossRef]
- Gastaldi, D.; Canonico, F.; Capelli, L.; Buzzi, L.; Boccaleri, E.; Irico, S. An Investigation on the Recycling of Hydrated Cement from Concrete Demolition Waste. Cem. Concr. Compos. 2015, 61, 29–35. [Google Scholar] [CrossRef]
- De Schepper, M.; Snellings, R.; De Buysser, K.; Van Driessche, I.; De Belie, N. The Hydration of Cement Regenerated from Completely Recyclable Concrete. Constr. Build. Mater. 2014, 60, 33–41. [Google Scholar] [CrossRef]
- Snellings, R.; De Schepper, M.; De Buysser, K.; Van Driessche, I.; De Belie, N. Clinkering Reactions during Firing of Recyclable Concrete. J. Am. Ceram. Soc. 2012, 95, 1741–1749. [Google Scholar] [CrossRef]
- Oksri-Nelfia, L.; Mahieux, P.-Y.; Amiri, O.; Turcry, P.; Lux, J. Reuse of Recycled Crushed Concrete Fines as Mineral Addition in Cementitious Materials. Mater. Struct. 2016, 49, 3239–3251. [Google Scholar] [CrossRef]
- Bordy, A.; Younsi, A.; Aggoun, S.; Fiorio, B. Cement Substitution by a Recycled Cement Paste Fine: Role of the Residual Anhydrous Clinker. Constr. Build. Mater. 2017, 132, 1–8. [Google Scholar] [CrossRef]
- Amin, A.F.M.S.; Hasnat, A.; Khan, A.H.; Ashiquzzaman, M. Residual Cementing Property in Recycled Fines and Coarse Aggregates: Occurrence and Quantification. J. Mater. Civ. Eng. 2015, 28, 4015174. [Google Scholar] [CrossRef]
- Topič, J.; Prošek, Z.; Plachý, T. Influence of Increasing Amount of Recycled Concrete Powder on Mechanical Properties of Cement Paste. IOP Conf. Ser. Mater. Sci. Eng. 2017, 236, 012094. [Google Scholar] [CrossRef]
- Grabois, T.M.; Cordeiro, G.C.; Toledo Filho, R.D. The Influence of Recycled Concrete and Clay Brick Particles on the Strength and Porosity of Cement-Based Pastes. In Calcined Clays for Sustainable Concrete; RILEM Bookseries; Martirena, F., Favier, A., Scrivener, K., Eds.; Springer: Dordrecht, The Netherlands, 2017; pp. 189–194. ISBN 978-94-024-1207-9. [Google Scholar]
- Mehta, P.K. Concrete: Structure, Properties, and Materials; Prentice-Hall, Ed.: Hoboken, NJ, USA, 1986. [Google Scholar]
- Neville, A.M. Properties of Concrete; Longman: London, UK, 2012; ISBN 9780889867178. [Google Scholar]
- Mills, R.H. Factors Influencing Cessation of Hydration in Water-Cured Cement Pastes. Highw. Res. Board Spec. Rep. 1966, 90, 406–424. [Google Scholar]
- Scrivener, K.L.; Nonat, A. Hydration of Cementitious Materials, Present and Future. Cem. Concr. Res. 2011, 41, 651–665. [Google Scholar] [CrossRef]
- Pommersheim, J.M.; Clifton, J.R. Mathematical Modeling of Tricalcium Silicate Hydration. Cem. Concr. Res. 1979, 9, 765–770. [Google Scholar] [CrossRef]
- Pommersheim, J.M.; Clifton, J.R.; Frohnsdorff, G. Conceptual and Mathematical Models for Tricalcium Silicate Hydration. In Proceedings of the 7th International Congress on Chemistry of Cement, Subtheme VII, Paris, France, 7 July 1980; pp. 195–200. [Google Scholar]
- Beaudoin, J.; Odler, I. Hydration, Setting and Hardening of Portland Cement. In Lea’s Chemistry of Cement and Concrete; Hewlett, P.C., Liska, M., Eds.; Elsevier: Amsterdam, The Netherlands, 2019; pp. 157–250. ISBN 978-0-08-100773-0. [Google Scholar]
- Taylor, H.F.W. Cement Chemistry, 2nd ed.; Thomas Telford Publishing: London, UK, 1997; ISBN 0-7277-3945-X. [Google Scholar]
- Garrault, S.; Behr, T.; Nonat, A. Formation of the C–S–H Layer during Early Hydration of Tricalcium Silicate Grains with Different Sizes. J. Phys. Chem. B 2006, 110, 270–275. [Google Scholar] [CrossRef] [PubMed]
- Scrivener, K.L. Backscattered Electron Imaging of Cementitious Microstructures: Understanding and Quantification. Cem. Concr. Compos. 2004, 26, 935–945. [Google Scholar] [CrossRef]
- Soroka, I. Portland Cement Paste and Concrete; The Macmillan Press Ltd.: London, UK, 1979; ISBN 978-1-349-03996-8. [Google Scholar] [CrossRef]
- Gambhir, M.L. Concrete Technology: Theory and Practice, 5th ed.; MHE Rentals India Pvt. Ltd.: New Delhi, India, 2013. [Google Scholar]
- Bullard, J.W.; Jennings, H.M.; Livingston, R.A.; Nonat, A.; Scherer, G.W.; Schweitzer, J.S.; Scrivener, K.L.; Thomas, J.J. Mechanisms of Cement Hydration. Cem. Concr. Res. 2011, 41, 1208–1223. [Google Scholar] [CrossRef]
- Diamond, S. The Microstructure of Cement Paste and Concrete—A Visual Primer. Cem. Concr. Compos. 2004, 26, 919–933. [Google Scholar] [CrossRef]
- Powers, T.C.; Brownyard, T.L. Studies of the Physical Properties of Hardened Portland Cement Paste—Part 5. J. Proc. 1947, 43, 669–712. [Google Scholar]
- Brouwers, H.J.H. A Hydration Model of Portland Cement Using the Work of Powers and Brownyard; Eindhoven University of Technology: Skokie, IL, USA, 2011; ISBN 978-90-6814-184-9. [Google Scholar]
- Copeland, L.E.; Kantro, D.L.; Verbeck, G. Chemistry of Hydration of Portland Cement. In Proceedings of the 4th International Symposium on Chemistry of Cement, Washington, DC, USA, 2–7 October 1960; Volume 1, pp. 429–468. [Google Scholar]
- Powers, T.C. Physical Properties of Cement Paste. In Proceedings of the Fourth International Symposium on the Chemistry of Cement, Washington, DC, USA, 2–7 October 1960; Volume 5, pp. 577–613. [Google Scholar]
- Mather, B.; Hime, W.G. Amount of Water Required for Complete Hydration of Portland Cement. Concr. Int. 2002, 24, 56–58. [Google Scholar]
- American Concrete Institute. ACI Committee 308 Guide to External Curing of Concrete; American Concrete Institute: Farmington Hills, MI, USA, 2016; pp. 1–36. [Google Scholar]
- Jensen, O.M. Thermodynamic Limitation of Self-Desiccation. Cem. Concr. Res. 1995, 25, 157–164. [Google Scholar] [CrossRef]
- Igarashi, S.; Kawamura, M.; Watanabe, A. Analysis of Cement Pastes and Mortars by a Combination of Backscatter-Based SEM Image Analysis and Calculations Based on the Powers Model. Cem. Concr. Compos. 2004, 26, 977–985. [Google Scholar] [CrossRef]
- Gaël, B.; Christelle, T.; Gilles, E.; Sandrine, G.; Tristan, S.F. Determination of the Proportion of Anhydrous Cement Using SEM Image Analysis. Constr. Build. Mater. 2016, 126, 157–164. [Google Scholar] [CrossRef]
- Feng, X.; Garboczi, E.J.; Bentz, D.P.; Stutzman, P.E.; Mason, T.O. Estimation of the Degree of Hydration of Blended Cement Pastes by a Scanning Electron Microscope Point-Counting Procedure. Cem. Concr. Res. 2004, 34, 1787–1793. [Google Scholar] [CrossRef]
- EN197-1; Cement. Part 1: Composition, Specifications and Conformity Criteria for Common Cements. CEN—European Committee for Standardisation: Brussels, Belgium, 2011.
- EN196-6; Method of Testing Cement. Part 6: Determination of Fineness. CEN—European Committee for Standardisation: Brussels, Belgium, 2018.
- Bogue, R.H. Calculation of the Compounds in Portland Cement. Ind. Eng. Chem. 1929, 1, 192–197. [Google Scholar] [CrossRef]
- Taylor, H.F.W. Modification of the Bogue Calculation. Adv. Cem. Res. 1989, 2, 73–77. [Google Scholar] [CrossRef]
- EN480-8; Admixtures for Concrete, Mortar and Grout—Test Methods. Part 8: Determination of the Conventional Dry Material Content. CEN—European Committee for Standardisation: Brussels, Belgium, 2012.
- BS EN 196-1; Methods of Testing Cement Part 1: Determination of Strength. CEN—European Committee for Standardisation: Brussels, Belgium, 2016. [CrossRef]
- EN12390-3; Testing Hardened Concrete. Part 3: Compressive Strength of Test Specimens. CEN—European Committee for Standardisation: Brussels, Belgium, 2019.
- Lothenbach, B.; Durdziński, P.; De Weerdt, K. Thermogravimetric Analysis. In A Practical Guide to Microstructural Analysis of Cementitious Materials; Scrivener, K., Sneelings, R., Lothenbach, B., Eds.; Taylor & Francis Group: Boca Raton, Fl, USA, 2016; pp. 177–211. [Google Scholar]
- Bhatty, J.I. Hydration versus Strength in a Portland Cement Developed from Domestic Mineral Wastes—A Comparative Study. Thermochim. Acta 1986, 106, 93–103. [Google Scholar] [CrossRef]
- Wong, H.S.; Buenfeld, N.R. Determining the Water-Cement Ratio, Cement Content, Water Content and Degree of Hydration of Hardened Cement Paste: Method Development and Validation on Paste Samples. Cem. Concr. Res. 2009, 39, 957–965. [Google Scholar] [CrossRef]
- Shui, Z.; Xuan, D.; Chen, W.; Yu, R.; Zhang, R. Cementitious Characteristics of Hydrated Cement Paste Subjected to Various Dehydration Temperatures. Constr. Build. Mater. 2009, 23, 531–537. [Google Scholar] [CrossRef]
- Monteagudo, S.M.; Moragues, A.; Gálvez, J.C.; Casati, M.J.; Reyes, E. The Degree of Hydration Assessment of Blended Cement Pastes by Differential Thermal and Thermogravimetric Analysis. Morphological Evolution of the Solid Phases. Thermochim. Acta 2014, 592, 37–51. [Google Scholar] [CrossRef]
- Deboucha, W.; Leklou, N.; Khelidj, A.; Oudjit, M.N. Hydration Development of Mineral Additives Blended Cement Using Thermogravimetric Analysis (TGA): Methodology of Calculating the Degree of Hydration. Constr. Build. Mater. 2017, 146, 687–701. [Google Scholar] [CrossRef]
- Meziani, M.; Chelouah, N.; Amiri, O.; Leklou, N. Blended Cement Hydration Assessment by Thermogravimetric Analysis and Isothermal Calorimetry. MATEC Web Conf. 2018, 149, 01062. [Google Scholar] [CrossRef][Green Version]
- Lam, L.; Wong, Y.L.; Poon, C.S. Degree of Hydration and Gel/Space Ratio of High-Volume Fly Ash/Cement Systems. Cem. Concr. Res. 2000, 30, 747–756. [Google Scholar] [CrossRef]
- Pane, I.; Hansen, W. Investigation of Blended Cement Hydration by Isothermal Calorimetry and Thermal Analysis. Cem. Concr. Res. 2005, 35, 1155–1164. [Google Scholar] [CrossRef]
- Snellings, R. X-ray Powder Diffraction Applied to Cement. In A Practical Guide to Microstructural Analysis of Cementitious Materials; Scrivener, K., Snellings, R., Lothenbach, B., Eds.; Taylor & Francis Group: Boca Raton, FL, USA, 2016; pp. 107–176. [Google Scholar]
- Garboczi, E.J.; Bentz, D.P.; Snyder, K.A.; Martys, N.S.; Stutzman, P.E.; Ferraris, C.F.; Bullard, J.W. Modeling and Measuring the Structure and Properties of Cement-Based Materials; National Institute of Standards and Technology: Gaithersburg, MD, USA, 2014. [Google Scholar]
- Bentz, D.P. NISTIR 7232. CEMHYD3D: A Three-Dimensional Cement Hydration and Microstructure Development Modeling Package, Version 3.0; NIST—National Institute of Standards and Technology: Gaithersburg, MD, USA, 2005. [Google Scholar]
- Sun, J.; Huang, Y. Modeling the Simultaneous Effects of Particle Size and Porosity in Simulating Geo-Materials. Materials 2022, 15, 1576. [Google Scholar] [CrossRef]
- Liao, W.; Sun, X.; Kumar, A.; Sun, H.; Ma, H. Hydration of Binary Portland Cement Blends Containing Silica Fume: A Decoupling Method to Estimate Degrees of Hydration and Pozzolanic Reaction. Front. Mater. 2019, 6, 78. [Google Scholar] [CrossRef]
- Liu, Z.; Xu, D.; Zhang, Y. Experimental Investigation and Quantitative Calculation of the Degree of Hydration and Products in Fly Ash-Cement Mixtures. Adv. Mater. Sci. Eng. 2017, 2017, 2437270. [Google Scholar] [CrossRef]
- Powers, T.C.C. Structure and Physical Properties of Hardened Portland Cement Paste. J. Am. Ceram. Soc. 1958, 41, 1–6. [Google Scholar] [CrossRef]
- Schiller, K.K. Strength of Porous Materials. Cem. Concr. Res. 1971, 1, 419–422. [Google Scholar] [CrossRef]
- Odler, I.; Rößler, M. Investigations on the Relationship between Porosity, Structure and Strength of Hydrated Portland Cement Pastes. II. Effect of Pore Structure and of Degree of Hydration. Cem. Concr. Res. 1985, 15, 401–410. [Google Scholar] [CrossRef]


| Parameter | Mass (%) | Parameter | Mass (%) |
|---|---|---|---|
| CaO | 62.16 | P2O5 | 0.4 |
| SiO2 | 19.02 | Mn2O3 | 0.05 |
| Al2O3 | 5.42 | SO3 | 2.48 |
| Fe2O3 | 3.82 | IR | 0.76 |
| MgO | 1.31 | FL | 2.8 |
| TiO2 | 0.53 | LOI250 | 0.41 |
| K2O | 0.37 | LOI950 | 2.52 |
| Na2O5 | 0.22 | LOItotal | 2.93 |
| C3S | C2S | C3A | C4AF | |
|---|---|---|---|---|
| Bogue calculation modified by Taylor | 62.61 | 6.58 | 4.48 | 13.71 |
| XRD | 60.93 | 12.93 | 5.85 | 12.4 |
| CP0.2 | CP0.3 | CP0.6 | |
|---|---|---|---|
| Cement CEM I 52.5N | 1779.6 | 1572.9 | 1056.3 |
| Total water * | 355.9 | 471.9 | 633.8 |
| SP dosage (%) ** | 2.5 | 0.4 | - |
| w/c ratio | 0.20 | 0.30 | 0.60 |
| CP0.2 | CP0.3 | CP0.6 | ||||
|---|---|---|---|---|---|---|
| Per 100 g initial cement | Per 100 g paste | Per 100 g initial cement | Per 100 g paste | Per 100 g initial cement | Per 100 g paste | |
| CH (g) | 15.1 (8.1) | 12.6 (6.7) | 18.2 (16.0) | 14.0 (12.3) | 23.6 (21.8) | 14.8 (13.6) |
| (g) | 43.7 | 36.4 | 29.1 | 22.4 | 9.9 | 6.2 |
| α (%) | 56.3 | 70.9 | 90.1 | |||
| CP0.2 | CP0.3 | CP0.6 | ||||
|---|---|---|---|---|---|---|
| Per 100 g initial cement | Per 100 g paste | Per 100 g initial cement | Per 100 g paste | Per 100 g initial cement | Per 100 g paste | |
| C3S (g) | 9.6 | 8.0 | 4.1 | 3.2 | 2.0 | 1.2 |
| C2S (g) | 13.5 | 11.2 | 13.4 | 10.3 | 13.2 | 8.2 |
| C3A (g) | 1.9 | 1.5 | 1.6 | 1.2 | 0.7 | 0.5 |
| C4AF (g) | 4.9 | 4.1 | 4.7 | 3.6 | 0.1 | 0.1 |
| (g) | 29.9 | 24.8 | 23.8 | 18.3 | 16.0 | 10.0 |
| CH (g) | 13.2 (11.7) | 11.0 (9.8) | 16.6 (15.3) | 12.8 (11.8) | 23.9 (22.7) | 14.9 (14.2) |
| (g) | 2.0 | 1.6 | 1.8 | 1.4 | 1.6 | 1.0 |
| Amorphous (g) | 72.7 | 60.6 | 76.8 | 59.0 | 81.7 | 51.1 |
| α (%) | 68.3 | - | 74.8 | - | 83.0 | - |
| CP0.2 | CP0.3 | CP0.6 | ||||
|---|---|---|---|---|---|---|
| Per 100 g initial cement | Per 100 g paste | Per 100 g initial cement | Per 100 g paste | Per 100 g initial cement | Per 100 g paste | |
| C3S (g) | 18.7 | 14.2 | 5.7 | 4.0 | 1.4 | 0.9 |
| C2S (g) | 14.0 | 10.7 | 10.4 | 7.2 | 6.2 | 3.7 |
| C3A (g) | 1.5 | 1.1 | 0.6 | 0.4 | 0.2 | 0.1 |
| C4AF (g) | 9.2 | 7.0 | 8.1 | 5.7 | 6.9 | 4.1 |
| (g) | 43.4 | 33.0 | 24.8 | 17.3 | 14.7 | 8.8 |
| , (g) | 2.5 | 1.9 | 1.1 | 0.8 | 0.8 | 0.4 |
| CH (g) | 20.3 | 15.4 | 26.3 | 18.3 | 29.0 | 17.1 |
| C-S-H (g) | 50.7 | 38.4 | 68.1 | 47.3 | 78.0 | 46.0 |
| C3AH6(g) | 6.4 | 4.8 | 6.0 | 4.2 | 8.0 | 4.7 |
| AFt (g) | 6.6 | 5.1 | 6.9 | 4.8 | 9.6 | 5.6 |
| AFm (g) | 0.0 | 0.0 | 4.5 | 3.1 | 2.2 | 1.3 |
| FH3 (g) | 1.0 | 0.7 | 1.5 | 1.0 | 2.0 | 1.2 |
| α (%) | 56.6 | 75.2 | 85.3 | |||
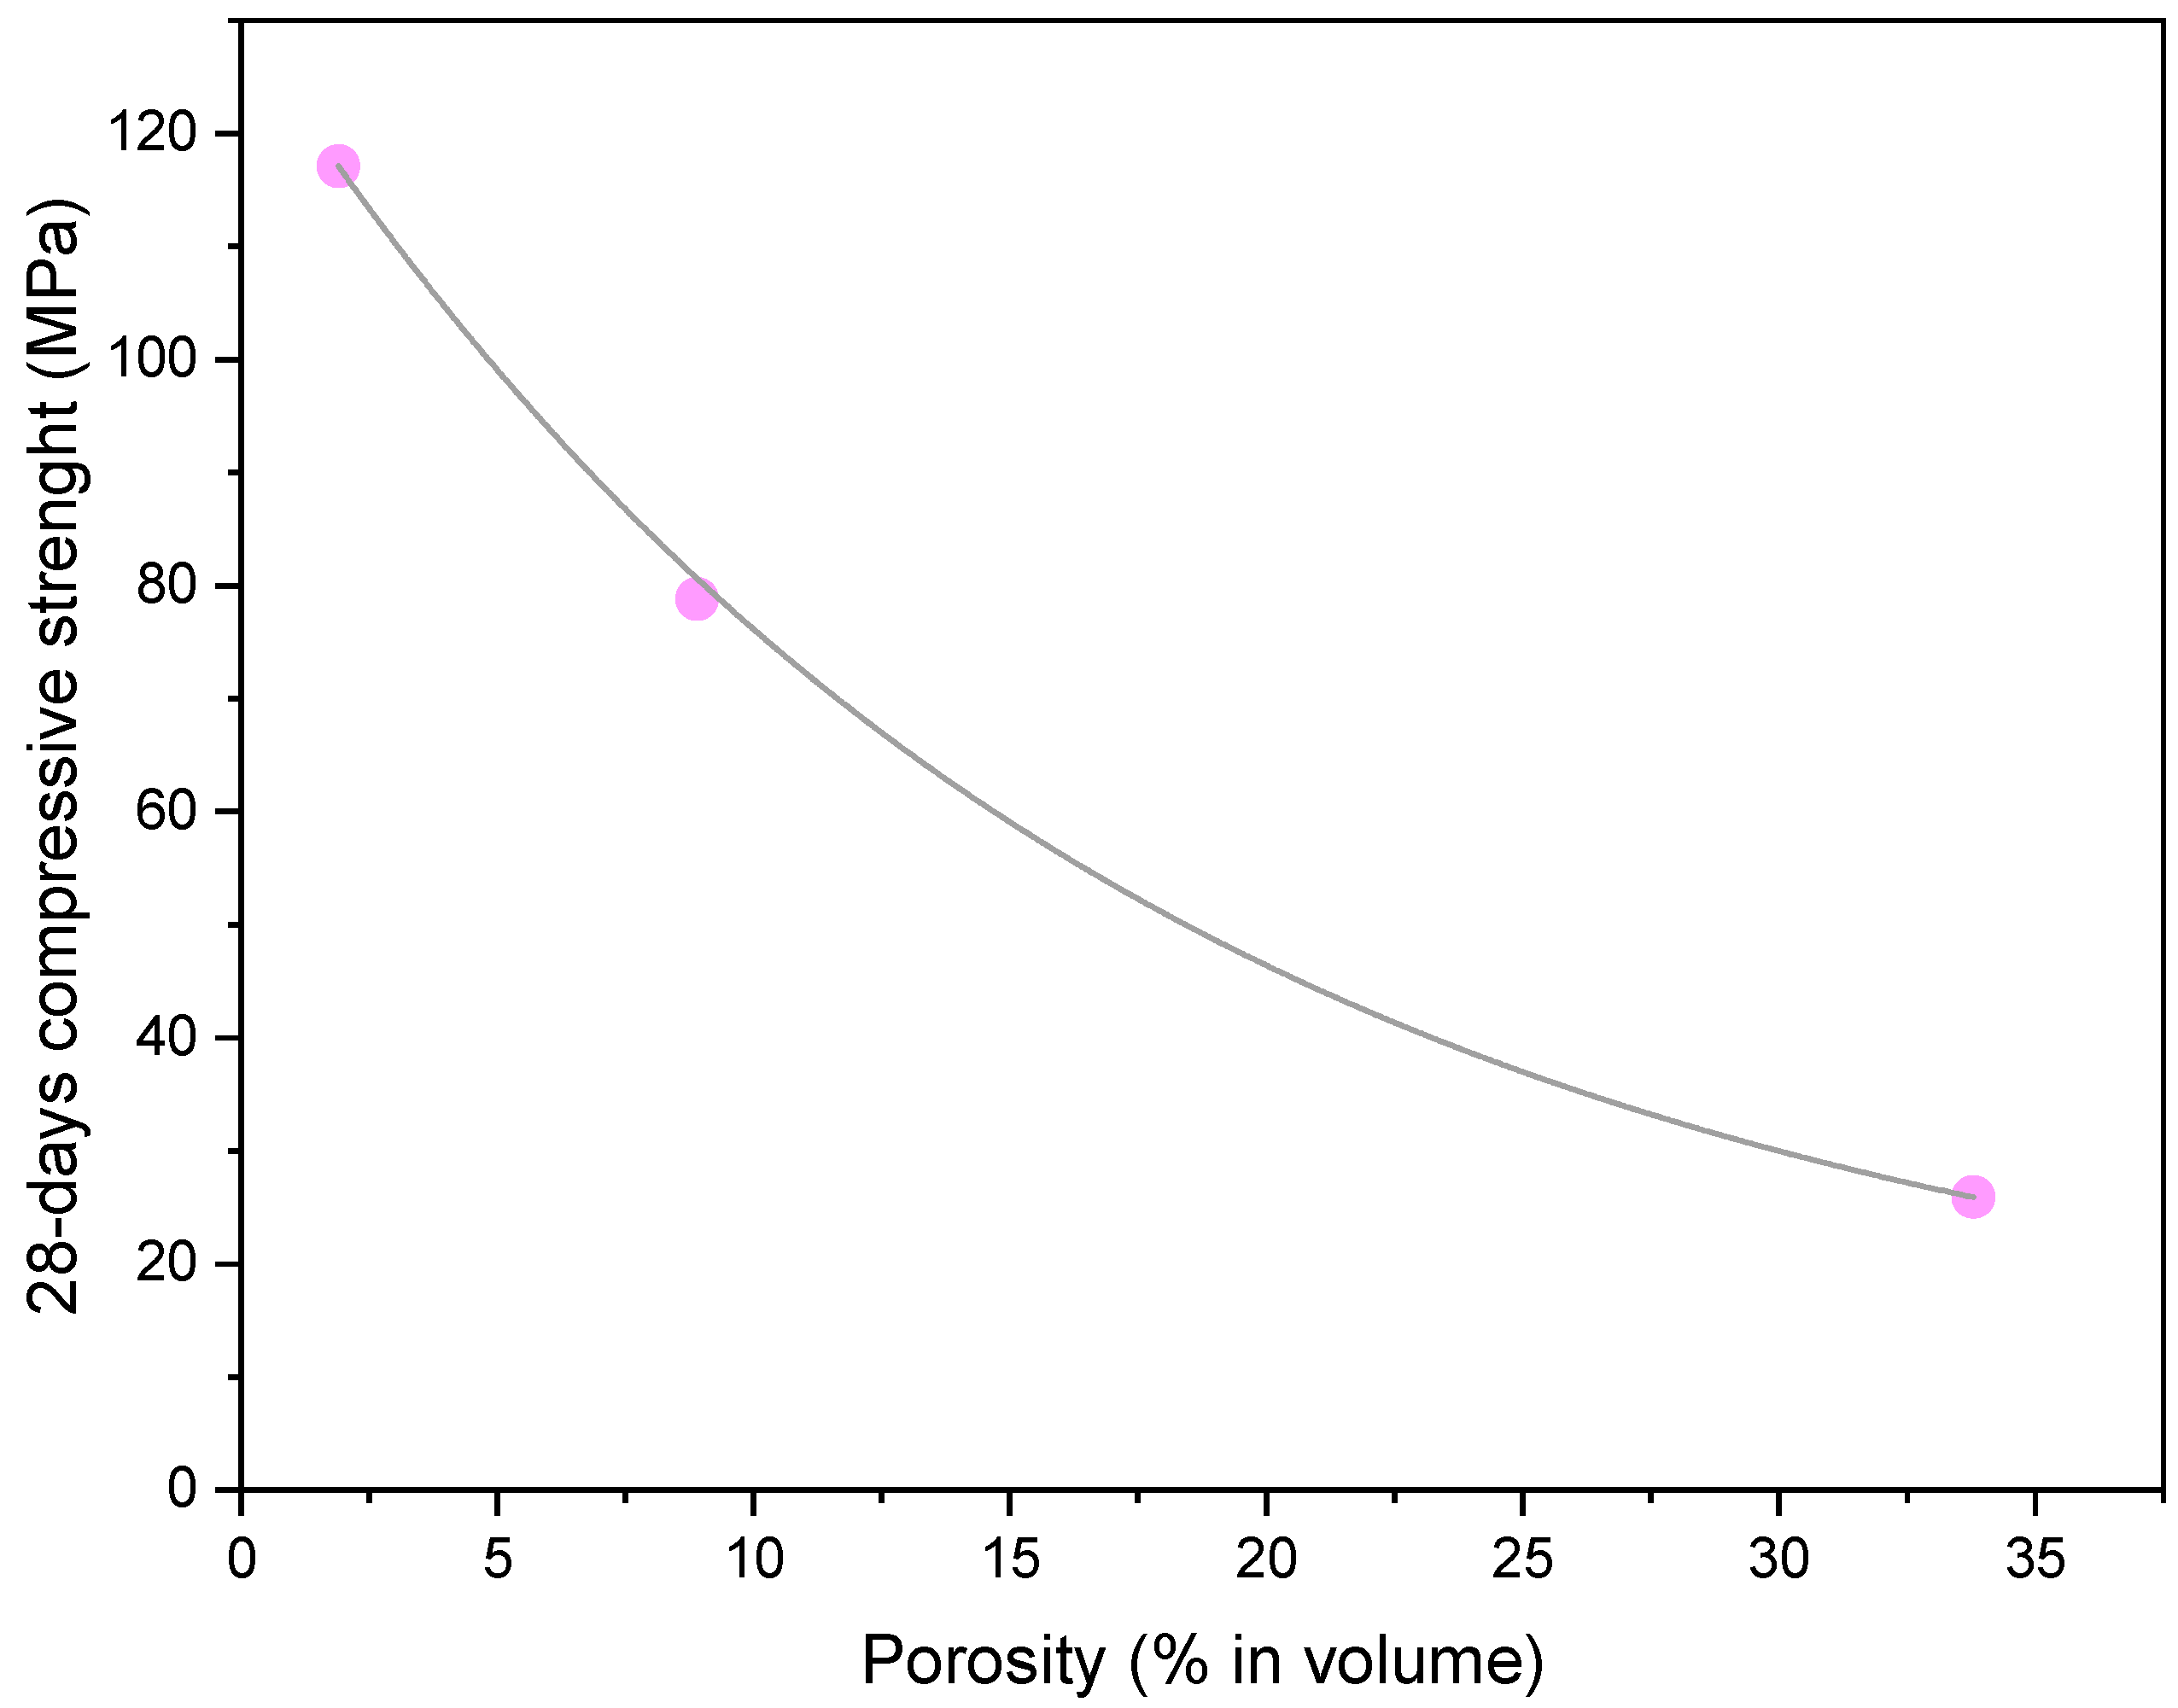
| Porosity (volume %) | 1.9 | 8.9 | 33.8 | |||
| pH | 13.09 | 13.47 | 13.28 | |||
| Chemical shrinkage (mm3/g cement) | 41.5 | 53.8 | 61.2 | |||
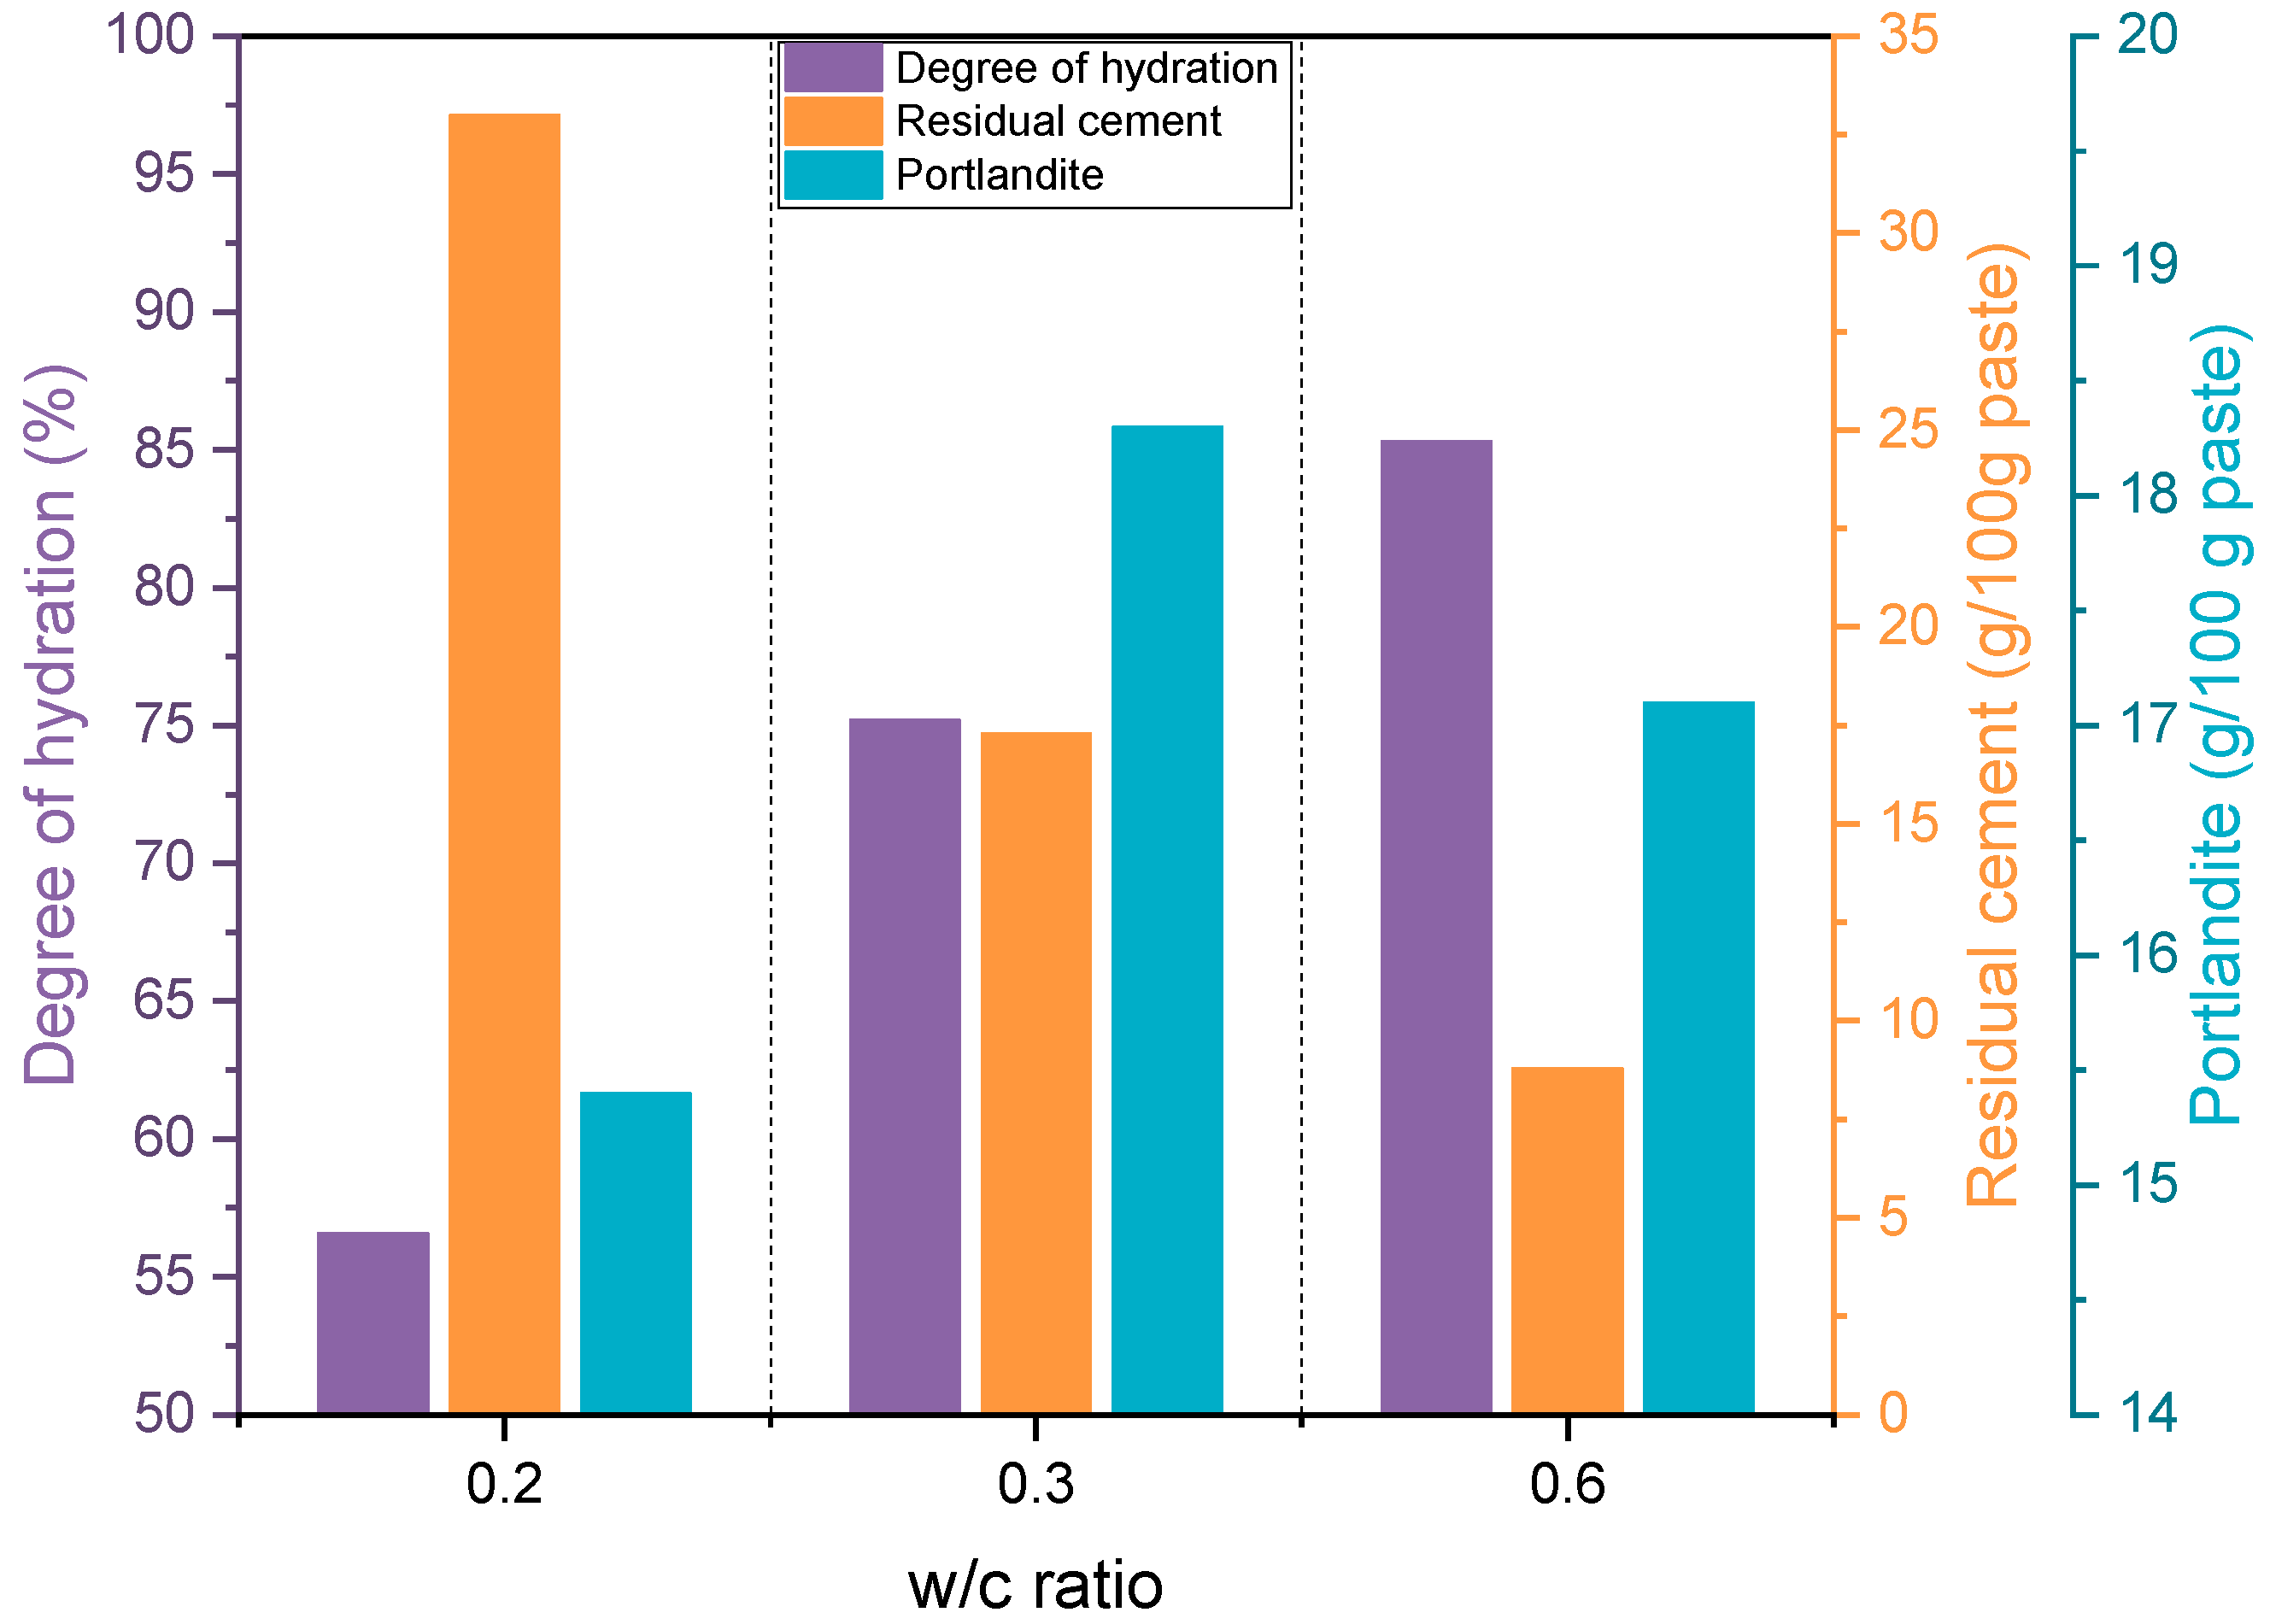
| CP0.2 | CP0.3 | CP0.6 | ||
|---|---|---|---|---|
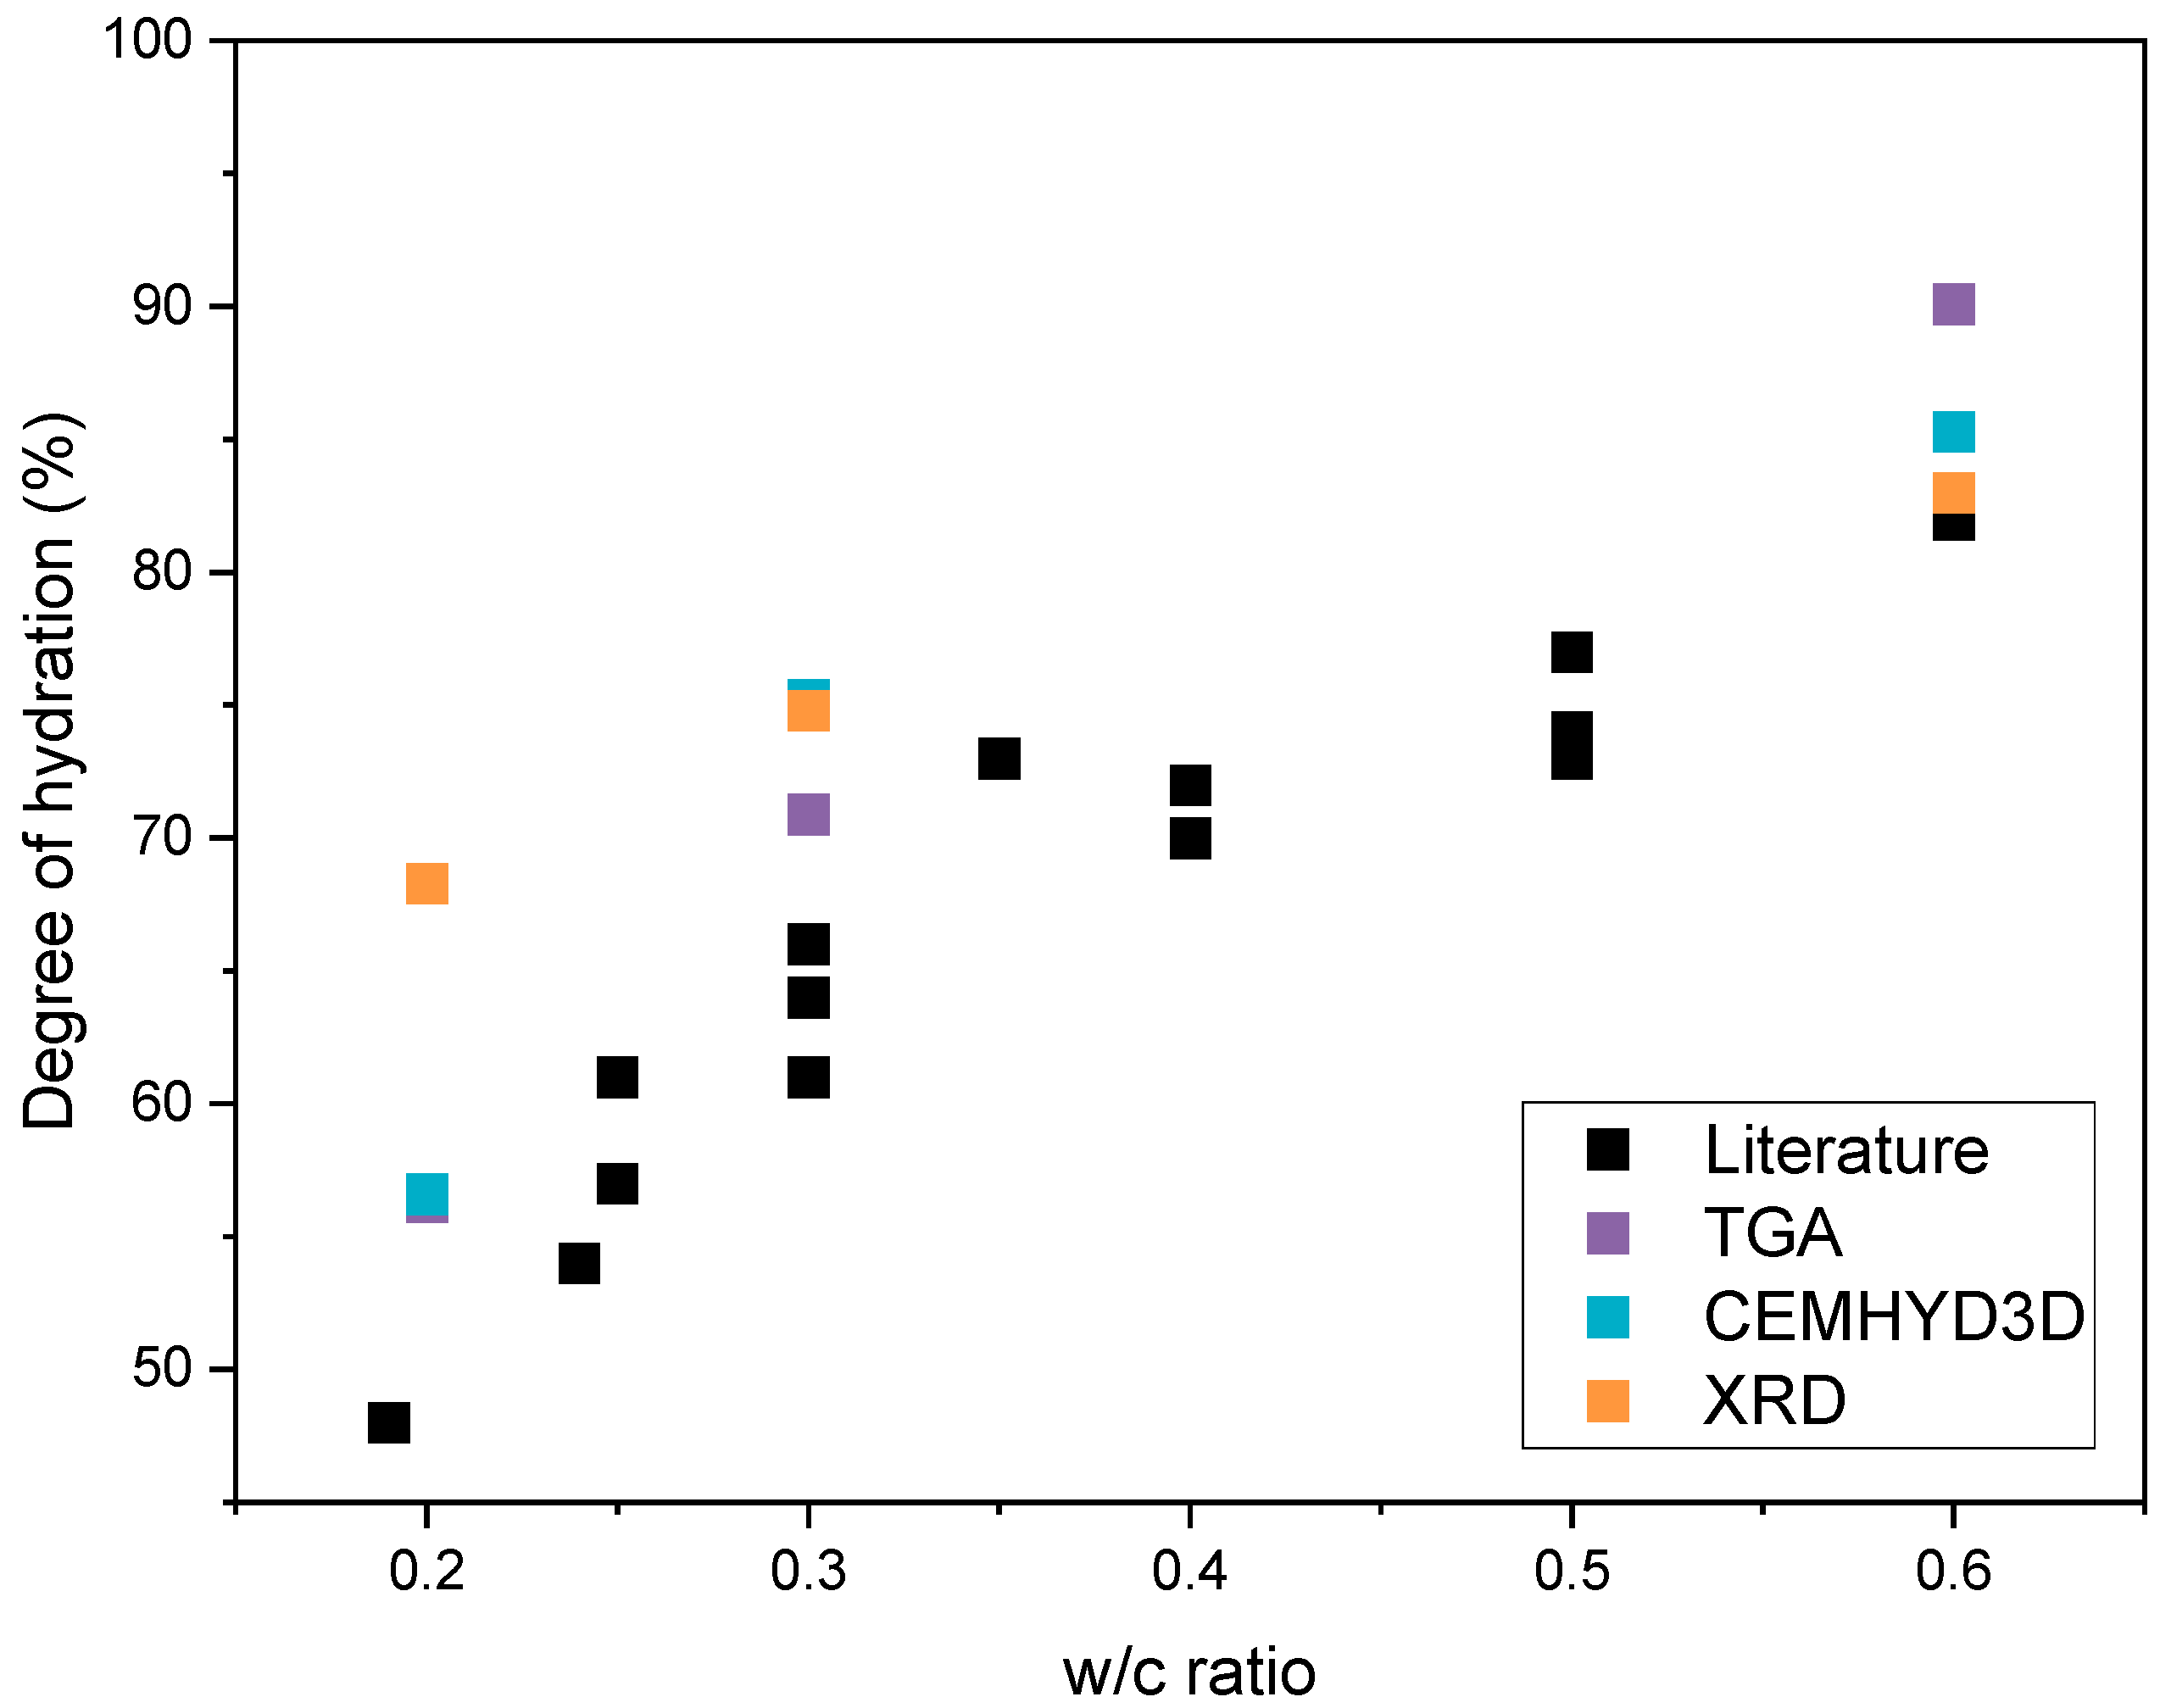
| Degree of hydration (%) | CEMHYD3D | 56.6 | 75.2 | 85.3 |
| TGA | 56.3 | 70.9 | 90.1 | |
| XRD | 68.3 | 74.8 | 83.0 | |
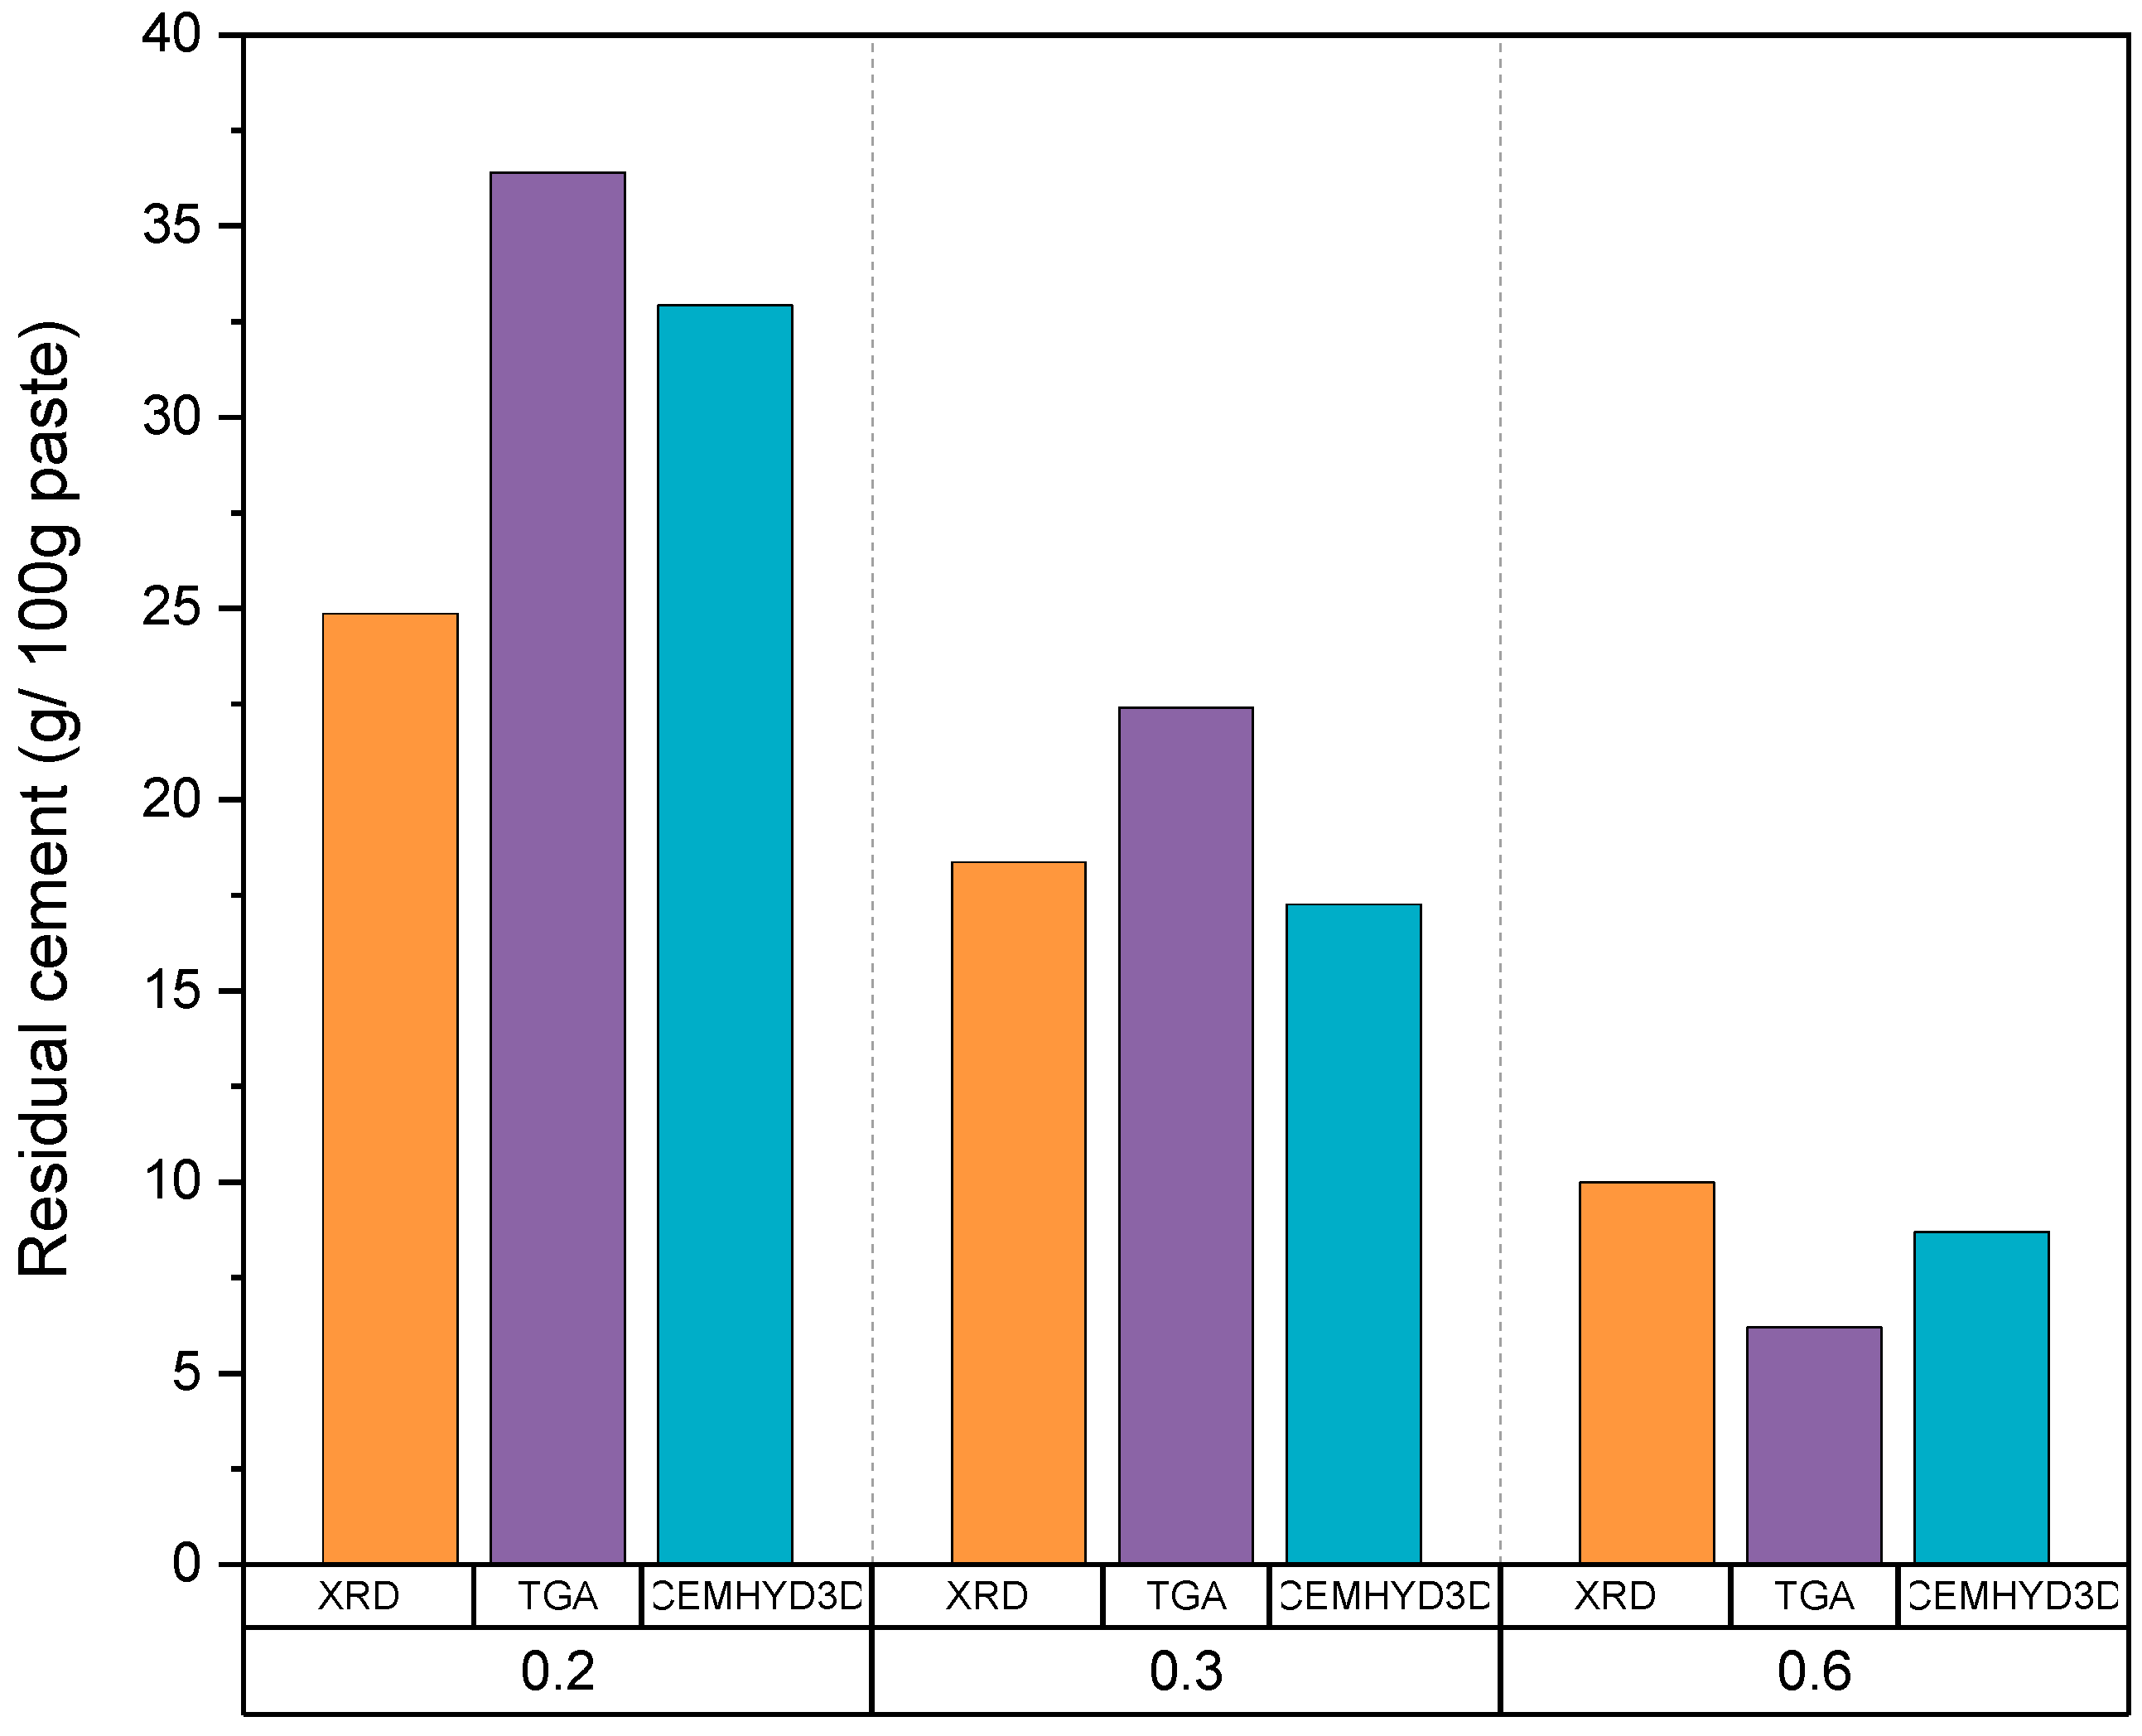
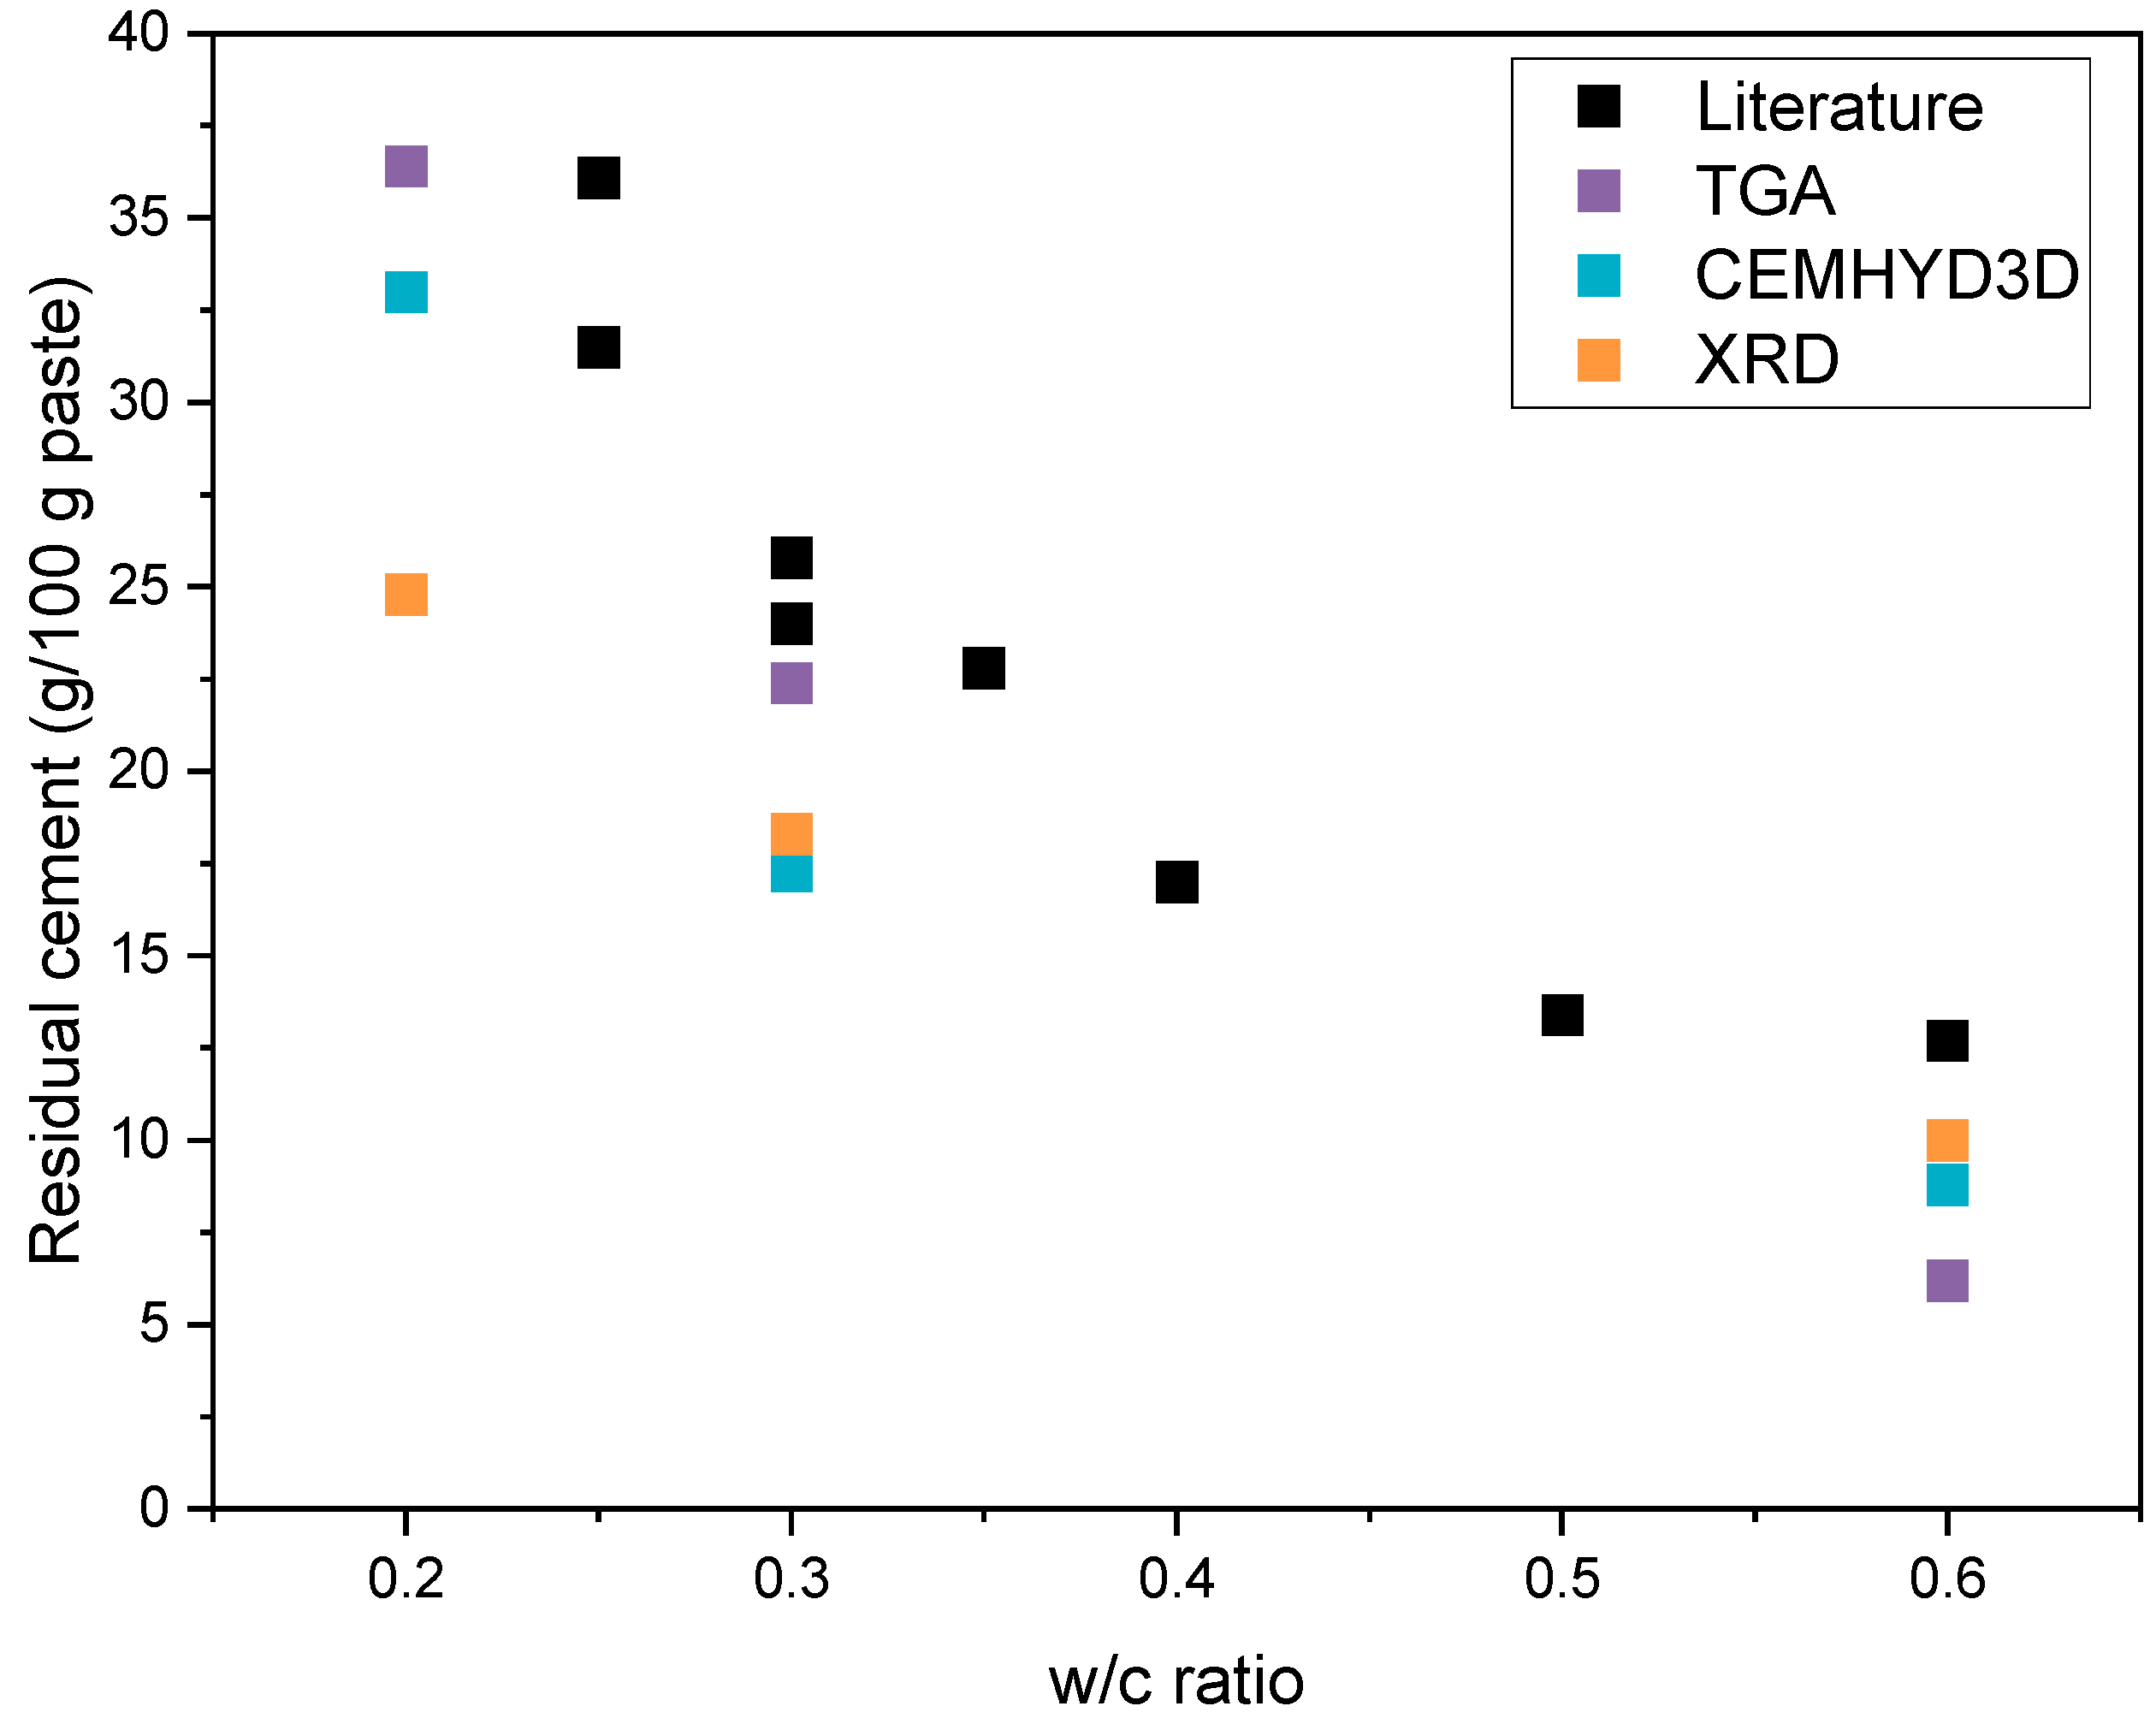
| Residual cement (g/100 g paste) | CEMHYD3D | 33.0 | 17.3 | 8.8 |
| TGA | 36.4 | 22.4 | 6.2 | |
| XRD | 24.8 | 18.3 | 10.0 |
Disclaimer/Publisher’s Note: The statements, opinions and data contained in all publications are solely those of the individual author(s) and contributor(s) and not of MDPI and/or the editor(s). MDPI and/or the editor(s) disclaim responsibility for any injury to people or property resulting from any ideas, methods, instructions or products referred to in the content. |
© 2022 by the authors. Licensee MDPI, Basel, Switzerland. This article is an open access article distributed under the terms and conditions of the Creative Commons Attribution (CC BY) license (https://creativecommons.org/licenses/by/4.0/).
Share and Cite
Kulisch, D.; Katz, A.; Zhutovsky, S. Quantification of Residual Unhydrated Cement Content in Cement Pastes as a Potential for Recovery. Sustainability 2023, 15, 263. https://doi.org/10.3390/su15010263
Kulisch D, Katz A, Zhutovsky S. Quantification of Residual Unhydrated Cement Content in Cement Pastes as a Potential for Recovery. Sustainability. 2023; 15(1):263. https://doi.org/10.3390/su15010263
Chicago/Turabian StyleKulisch, Daniele, Amnon Katz, and Semion Zhutovsky. 2023. "Quantification of Residual Unhydrated Cement Content in Cement Pastes as a Potential for Recovery" Sustainability 15, no. 1: 263. https://doi.org/10.3390/su15010263
APA StyleKulisch, D., Katz, A., & Zhutovsky, S. (2023). Quantification of Residual Unhydrated Cement Content in Cement Pastes as a Potential for Recovery. Sustainability, 15(1), 263. https://doi.org/10.3390/su15010263