Article

Distribution Channel Selection Using FUCOM-ADAM: A Novel Approach

Faculty of Transport and Traffic Engineering, University of Belgrade, Vojvode Stepe 305, 11000 Belgrade, Serbia
*
Author to whom correspondence should be addressed.
Sustainability 2023, 15(19), 14527; https://doi.org/10.3390/su151914527
Submission received: 29 August 2023 / Revised: 21 September 2023 / Accepted: 5 October 2023 / Published: 6 October 2023

Abstract

:
The selection of the appropriate distribution channel is crucial for the success of any business dealing with physical goods. When dealing with this selection, it is crucial to have an effective decision support system (DSS) that can assist with such decisions. While various DSS approaches exist in the literature, not all are suitable for real-world applications. This research aims to address this gap by developing practical DSS tools that can aid decision-makers in making optimal decisions even in situations of uncertainty. The paper explores six different distribution channels (retailer’s warehouse, wholesaler’s warehouse, manufacturer’s warehouse, cross-dock, 3PL services, and direct delivery) in order to select the optimal one based on nine established criteria (inventory costs, distribution costs, delivery speed, service level, market coverage, product availability, order consolidation capability, reverse logistics, and order tracking) by using the FUCOM (Full Consistency Method) and ADAM (Axial-Distance-Based Aggregated Measurement) methods. After applying the FUCOM method, C1 (inventory costs) had the highest value when observing criteria weights, whereas C9 (order tracking) had the lowest. The results of the ADAM method showed that A5 (3PL services) was the best-ranked alternative, whereas A4 (cross-dock) was ranked as the worst. Based on the results, a model validation, and sensitivity analysis was conducted to determine whether the final ranking of the alternatives will change. This research provides decision makers with the necessary tools for better decision making, leading to improved distribution operations and increased profitability for the business.

1. Introduction

Distribution channels are an essential part of any business operation that deals with the distribution of physical goods. They represent a complex network of entities responsible for facilitating the flow of products from producers to consumers. However, the selection of the appropriate distribution channel is critical for the success of a business, as it directly impacts the efficiency of delivering products to the end consumer and ultimately affects profitability and customer satisfaction [1,2].
Effective decision-making in distribution is becoming increasingly important in today’s fast-paced business environment. To ensure the success of any business, it is crucial to make timely decisions based on information that leads to the efficient flow of goods from producers to consumers. Therefore, there is a growing need for DSS that can provide decision makers with the necessary tools to make quick, efficient, and accurate decisions. This is even more pronounced in situations of uncertainty that are always present in distribution channels because of sudden changes in the demand, quantities, delivery addresses, etc. Although there are various approaches to DSS in the literature, not all of them are practical for real-world applications [3]. As such, this research aims to fill this gap by developing practical DSS tools that can assist decision makers in making optimal decisions for their distribution operations. By doing so, this research will contribute to the advancement of distribution management practices and provide valuable insights to businesses seeking to improve their decision-making processes. Using the appropriate DSS tools, decision makers can have access to real-time data and insights, allowing them to make decisions based on information that can have a significant impact on their business’s success [4]. Thus, the main motive of this research is to provide decision makers with the necessary tools to make better decisions, leading to improved distribution processes and increased profitability for the business. This paper aims to explore the process of selecting the optimal distribution channel based on observed criteria, using the FUCOM and ADAM methods. The FUCOM method reduces the subjectivity of decision makers, which leads to consistency in the criteria weights. In other methods, the redundancy of the pairwise comparison appears, which makes them less vulnerable to errors in judgment, whereas the FUCOM methodological procedure eliminates this problem [5]. The implementation of a fuzzy AHP (Analytic Hierarchy Process) for determining criteria weights was also considered but the obtained results were not in accordance with the real situation (certain criteria had negligible weights). After consulting with the experts who performed the evaluation, it was established that the results were not correct. For these reasons, the FUCOM was applied in this paper to determine the criteria weights. The ADAM method ranks the alternatives using the volumes (aggregated measurement) of complex polyhedra that are defined by points (vertices) in a three-dimensional coordinate system. The main advantages of this method are reflected in the fact that it is simple, easily understandable, insensitive to the increase in the number of criteria, very intuitive, and has a very low risk of rank reversal [6]. These were the main reasons why this method was combined with the FUCOM in this paper. By applying these methods, decision makers can evaluate and compare different distribution channels based on factors such as cost-effectiveness, reach, and reliability.
The main contributions of this paper are the development of a new methodology for evaluating and ranking distribution channels, closing the established gap since there is a lack of papers in the literature regarding the issue of distribution channel selection, as well as the proposal of a practical model that can be used by the managers in order to facilitate the decision-making process.
The paper is organized as follows. After the introduction, in Section 2, a problem description and literature review are presented. In Section 3, a proposed methodology is described along with the implementation steps of the methods used in this paper. The obtained results after the implementation of the proposed methodology are presented in Section 4. In Section 5, a discussion is presented alongside model validation, sensitivity analysis, and theoretical and managerial implications. Finally, in Section 6 of the paper, concluding remarks are presented.

2. Problem Description and Literature Review

Distribution is a concept that refers to the efficient transfer of goods from production to consumption with minimal costs and a satisfactory level of service. It includes all methods by which goods are shipped from the manufacturer to the end consumer. Without the distribution process, people would not have a way to obtain desired services and products, such as food, clothing, footwear, etc. Distribution can be direct (products are shipped directly from the manufacturer to the end-user), indirect (through the distribution centers (DC) of the manufacturer), or via intermediaries (distributors or logistics providers, trade companies (wholesalers and retailers), agents, etc.).
The selection of a distribution channel is a crucial decision that directly affects a company’s ability to achieve its goals. Management must carefully consider the company’s goals when selecting a distribution channel. This decision has a significant impact on the overall business success as it determines how the products will be placed and sold in the market. Choosing the right distribution channel can help a company achieve its targets, such as increased market share, improved profitability, and customer satisfaction. On the other hand, selecting the inappropriate distribution channel can lead to inefficiencies, increased costs, and a negative impact on the company’s bottom line. Therefore, it is essential for management to take a strategic approach when selecting a distribution channel and consider the company’s goals, market conditions, and customer needs to ensure the most effective and efficient product distribution to the end consumer.
A distribution strategy is a strategy or plan that determines how a company intends to enable end-users to use its products or services through the supply chain. The goal of a distribution strategy is to maximize product sales and minimize distribution costs. A production company can distribute through its own distribution channels or the distribution channels of companies with which it collaborates [7].
In order to survive in the market and be competitive, a production company must have an appropriate distribution channel. The distribution channel can be defined as the path through which the products are transferred from the manufacturer to the end consumer, and it includes various activities and decisions. Choosing the appropriate distribution channel is not an easy task and there is no unique solution that every company can use, as it varies from case to case. Many factors can influence whether a particular distribution channel is the right choice for the manufacturer, and the most common ones are product availability, customer satisfaction, order consolidation, order tracking, supply reliability, delivery speed, reverse logistics, etc. By choosing the appropriate distribution channel, a company can achieve many advantages, such as significant cost savings while maintaining a high level of service for customers [8].
Distribution channels can be physical and trading (also known as transactional) [9]. The physical distribution channel represents a set of methods and means by which a product or group of products are physically transported from the place of production to the point where they are made available to the end customer. This endpoint can be a factory, a retail store, or the customer’s place of residence. The trade or transactional channel deals with non-physical aspects of product distribution from the manufacturer to the end consumer, and these aspects relate to the negotiations, purchase, and sale of products, as well as ownership of the goods in the process of their transfer through various distribution systems [9].
Distribution channels can be seen as a way to overcome differences in time, quality, place, quantity, and space between production and consumption. Distribution channels provide the following, among other things:
  • availability of products on the market;
  • cooperation and collaboration in the chain;
  • concentration of companies on the core business;
  • a certain service level;
  • minimal logistics and total costs;
  • exchange of accurate and reliable information in direct and reverse flows;
  • transactional efficiency resulting from reducing the number of connections and activities.
Having all previously said in mind, it is necessary to choose an appropriate distribution channel to ensure profit, reduce costs, increase customer satisfaction, and even create loyal customers. In this paper, physical distribution channels will be discussed in more detail. There are different alternatives when considering physical distribution channels, from direct delivery of the goods to the end-user, via indirect distribution, to the use of the Internet and home shopping [9].
The importance of selecting the appropriate distribution channel has been widely recognized both in practice and literature. Fu et al. [10] considered agency, reselling, and hybrid channel types for green supply chains. Xie et al. [11] examined equilibrium pricing and ordering decisions in the hybrid channel for a capacity-constrained supplier facing a retail platform, and further analyzed the impact of limited capacity on the supplier’s distribution channel selection. Bian et al. [12] investigated distribution channel selection under environmental taxation. Luo et al. [2] addressed the problem of distribution channel selection on a hybrid platform for a supply chain with a manufacturer selling a product to consumers. Serbest and Vayvay [13] used the Fuzzy AHP for the selection of the most suitable distribution channel, whereas Zhao et al. [14] employed a game-theoretic-based model for a comparative study of the environmental impacts of single-channel and dual-channel supply chains. Đalić et al. [15] proposed the FUCOM-MARCOS (Measurement of Alternatives and Ranking according to the Compromise Solution) model for selecting a distribution channel, whereas [1] used the PCA (Principal Component Analysis)—DEA (Data Envelopment Analysis) approach. Galkin [16] developed a model for calculating distribution channel functioning efficiency in different regions. Hatami et al. [17] proposed an MCDM (Multi Criteria Decision-Making) approach for the evaluation and selection of distribution channels in the FMCG (Fast-Moving Consumer Goods) industry. Kabiesz and Kuboń [18] evaluated distribution channels in a selected meat processing company. Mikušova et al. [8] proposed an ANP-based (Analytic Network Process) model for selecting an appropriate distribution channel for high-value stones. A combination of FMEA (Failure Mode and Effects Analysis) and QFD (Quality Function Deployment) methods was applied by Pajić et al. [19] for risk assessment in distribution processes. Risk analysis was performed for warehousing and transportation processes, and based on the obtained results, corrective—preventive actions were defined. Pant et al. [20] applied the AHP method to determine the best way to monitor health management practices. Prabhuram et al. [21] evaluated four distribution network configurations of Omni-channel using MCDM methods. On the other hand, Ampountolas et al. [22] examined the influence of social media (SM) on demand, where SM was observed as a distribution channel. The selection of the distribution channel for a closed-loop supply chain was addressed by Jia and Li [23]. Similarly, Modak et al. [24] analyzed a closed-loop distribution channel including recycling facilities. In their case, the channel consisted of manufacturers, retailers, and third-party collectors. Zhu [25] examined the problem of designing a distribution channel strategy by simultaneously providing a product quality control strategy. Three types of distribution channels were taken into account (direct channel, retail channel, and mixed channel).
The FUCOM method is often used for determining criteria weights. For example, Fazlollahtabar et al. [26] used it in their paper to determine the criteria weights used in forklift selection in a warehouse. Khan et al. [27] used a combination of FUCOM-fuzzy QFD for evaluating strategies to enhance the resilience of the healthcare sector to combat the COVID-19 pandemic. Type-2 fuzzy development of the FUCOM with the combination of MARCOS was used in [28] for the evaluation of facilities layout. On the other hand, the ADAM method is a novel MCDM method proposed by Krstić et al. [6]. In their paper, the authors implemented this method for the evaluation of agri-food circular-economy-based business models. Agnusdei et al. [3] implemented the ADAM method in combination with a SWOT (Strengths, Weaknesses, Opportunities, and Threats) and ANP methods in order to determine the role of digitalization in serving as a driver to achieve circularity in the agroindustry.

3. Methodology

For solving the multi-criteria problem in this paper, an approach using the FUCOM-ADAM methods is proposed (Figure 1). The FUCOM method is used to obtain the criteria weights, which are then used in the ADAM method for ranking the alternatives. The FUCOM method was developed in [29] to improve the process of determining criteria weights. The AHP method is often used for determining criteria weights or for ranking the alternatives. The ranking is performed based on pairwise comparisons. On the other hand, the BWM is used for determining criteria weights where it is first necessary to determine the best and the worst criteria before conducting pairwise comparisons. The main advantages of FUCOM over AHP and BWM (Best-Worst Method) are as follows [29]:
  • Significantly fewer pairwise comparisons (only n − 1);
  • Consistent pairwise comparison of criteria;
  • Calculation of reliable values of criteria weights, which contribute to rational decision-making.

3.1. FUCOM Method

The implementation steps for the FUCOM method are presented below [5,29,30,31]:
Step 1—All evaluation criteria are ranked from the most significant to the least significant by decision makers.
Cj(1) > Cj(2) > … > Cj(k)
where k represents the rank of the observed criterion.
Step 2—In this step, ranked criteria are compared in order to determine the comparative priority φk/(k+1), where k represents the rank of the criteria.
Φ = (φ1/2, φ2/3, , φk/(k + 1))
where φk/(k+1) represents the significance that the criterion of the Cj(k) rank has compared to the criterion of the Cj(k+1) rank.
Step 3—In order to determine the final values of the criteria weights, two conditions must be met as follows:
w k w k + 1 = φ k / ( k + 1 )
w k w k + 2 = φ k / ( k + 1 ) φ ( k + 1 ) / ( k + 2 )
After these two conditions are met, the final model for determining the criteria weights can be defined as follows:
Min χ
s.t.
w j k w j k + 1 φ k k + 1 χ ,   j
w j ( k ) w j ( k + 2 ) φ k / ( k + 1 ) φ ( k + 1 ) / ( k + 2 ) χ ,   j
j = 1 n w j = 1
w j 0 ,   j
After solving this model, the final values of the evaluation criteria weights are determined (w1, w2, …, wn)T as well as the degree of DFC (χ).

3.2. ADAM Method

In order to determine the final rank of the alternatives, the ADAM method was used, which includes the following steps [6]:
Step 1: Formation of an initial decision-making matrix E including n criteria and m alternatives.
E = e i j m × n
Step 2: Formation of a sorted decision matrix (S).
S = s i j m × n
Step 3: Defining the normalized matrix (N) using Equation (12).
n i j = s i j max i s i j ,   f o r   j   ϵ   B min i s i j s i j ,   f o r   j   ϵ   C
where B represents the set of benefit criteria, whereas C represents the set of cost criteria.
Step 4: Finding the coordinates (x, y, z) of the reference (Rij) and weighted reference points (Pij) that define the complex polyhedron using Equations (13)–(15).
x i j = n i j × sin α j ,   j = 1 , , n ;   i = 1 , , m
y i j = n i j × cos α j ,   j = 1 , , n ;   i = 1 , , m
z i j = 0 , f o r   R i j w j ,   f o r   P i j ,   j = 1 , , n ;   i = 1 , , m
where αj is the angle that determines the direction of the vector that defines the value of the alternative, which is obtained using Equation (16):
α j = j 1 90 ° n 1 ,   j = 1 ,   ,   n
Step 5: Determining the volumes of complex polyhedra V i C as the sum of the volumes of the pyramids of which it is composed using Equation (17).
V i C = k = 1 n 1 V k ,   i = 1 , , m
where Vk is the volume of the pyramid obtained by applying Equation (18):
V k = 1 3 B k × h k ,   k = 1 , , n 1
where Bk is the surface of the base of the pyramid and is calculated based on the reference and weighted reference points of two consecutive criteria by applying Equation (19):
B k = c k × a k + a k × b k c k 2
where ak represents the Euclidean distance between the reference points of two consecutive criteria, which is obtained by applying Equation (20):
a k = x j + 1 x j 2 + y j + 1 y j 2
bk and ck are the magnitudes of the vectors corresponding to the weights of two consecutive criteria:
b k = z j
c k = z j + 1
h is the height of the pyramid from the defined base to the top of the pyramid located in the coordinate origin (O) and is obtained by applying Equation (23):
h k = 2 s k s k a k s k d k s k e k a k
where sk is the semicircumference of the triangle defined by the x and y coordinates of two consecutive criteria and the coordinate origin and is obtained using Equation (24):
s k = a k + d k + e k 2
where dk and ek are the Euclidean distances of the reference points of two consecutive criteria from the coordinate origin and are obtained using the following Equations:
d k = x j 2 + y j 2
e k = x j + 1 2 + y j + 1 2
Step 6: Ranking the alternatives according to the decreasing values of the complex polyhedral volumes V i C   ( i = 1 ,   ,   m ) , where the best-ranked alternative is the one with the highest volume value.

4. Distribution Channel Selection—Practical Example

4.1. Defining Alternatives and Criteria

Generally speaking, there are four basic types of distribution channels [8]: direct distribution, distribution via cross-dock centers, distribution from distribution centers, and customer pickup. In direct distribution, products are stored in a central warehouse or directly with the manufacturer, without distribution centers and when orders are processed, and the manufacturer delivers them directly to the customer. When distributing via a cross-dock center, after the products are manufactured, they are assembled, and adjusted to the customers’ requirements, or certain value-added logistics (VAL) services are provided. The characteristic of this distribution channel type is the absence of warehousing. When a distribution is performed from distribution centers, the aim is to cover the market in order to achieve a strategic position for the customer. Finally, the characteristic of the customer pickup type is reflected in the fact that the products are stored in warehouses or directly with the manufacturer, but unlike direct distribution, the customer picks up the goods themselves. In this paper, a case when goods need to be shipped from the manufacturer to a retail store was observed. In accordance with this, the aim of this paper was to select the most appropriate distribution channel. However, this paper considered and evaluated the following distribution channels (Figure 2) (adapted from [9]):
  • Retailer’s warehouse (Alternative A1)—This channel consists of manufacturers who deliver their products to national distribution centers (NDCs) or regional distribution centers (RDCs), which are locations owned by retail organizations. These centers act as consolidation points, as the goods from different manufacturers and suppliers are consolidated there. Retailers then use their own vehicles to deliver all products from different manufacturers to their own stores.
  • Wholesaler’s warehouse (Alternative A2)—Wholesalers have acted as intermediaries in distribution chains for many years, providing a link between manufacturers and smaller retail stores. However, this physical distribution channel has changed with the development of wholesale organizations. These organizations have largely started by providing price advantages by buying in bulk from manufacturers or suppliers. One consequence of this is the development of an important physical distribution channel as wholesalers use their own distribution centers and fleets.
  • Manufacturer’s warehouse (Alternative A3)—This was one of the classic physical distribution channels, and the most common channel for many years. The manufacturer or supplier holds its products in a finished goods warehouse, a central distribution center (CDC), or a series of RDCs. Products are transported by large vehicles to where they are stored and then divided into individual orders that are delivered to retail stores on the supplier’s retail delivery vehicles. This type of channel is still widely used in the brewing industry.
  • Cross-dock (Alternative A4)—This method of distribution allows the company to become more competitive in various ways. One is the reduction of the necessary warehouse space. Since products are stored for a shorter period of time or not stored at all, costs associated with warehousing are also reduced or eliminated. In addition, cross-docking makes delivery easier as fewer parties are involved. The customer receives all their orders in one package, which is beneficial to them, while the company benefits from cost savings.
  • 3PL services (Alternative A5)—Distribution by third-party logistics providers or the logistics services industry experienced its expansion in the 1990s for numerous reasons, including the extensive growth of distribution costs and the constantly changing and more restrictive legislation on distribution that emerged at the time. As a result, many companies have developed specialized expertise in storage and distribution. These companies consist of those that offer general distribution services as well as those that focus on providing ‘specialized’ services for a particular type of product (e.g., frozen products) or for a single client company. In this paper, only storage and transportation services are considered.
  • Direct delivery (Alternative A6)—The manufacturer or supplier delivers directly from the production site to the retailer. The general rule is that this channel is only used when delivering vehicles with a full load capacity.
A case study of a retailer was observed in this paper. In order to evaluate distribution channels for the purpose of selecting the most appropriate one, it is necessary to determine the criteria by which they will be evaluated. There are a large number of criteria present in the literature that are applied for this purpose, and those that were used in this paper are presented in Table 1.

4.2. Results

In Table 2, the priorities of the criteria are shown, which were obtained by comparing all the criteria to the first-ranked (most significant one). The first criterion, inventory costs, was highlighted as the most important criterion, and all other criteria were compared to it. These values were obtained as an average based on the evaluations of five logistics experts. The significance of the first criterion is 1 since it is compared to itself.
The FUCOM model in this paper has the following formulation.
Min χ
s.t.
ω 1 ω 2 1.50   χ ,   ω 2 ω 3 1.27   χ ,   ω 3 ω 4 1.47   χ ,   ω 4 ω 5 1.46   χ ,   ω 5 ω 6 1.29   χ ,   ω 6 ω 7 1.21   χ ,   ω 7 ω 8 1.09   χ ,   ω 8 ω 9 1.27   χ   ω 1 ω 3 1.90   χ , ω 2 ω 4 1.87   χ ,   ω 3 ω 5 2.16   χ , ω 4 ω 6 1.89   χ , ω 5 ω 7 1.56   χ ,   ω 6 ω 8 1.32   χ ,   ω 7 ω 9 1.39   χ , j = 1 9 w j = 1 ,   w j     0 ,   j
Using the Lingo Solver program and solving this model, the following weight coefficients (0.294, 0.196, 0.155, 0.105, 0.072, 0.056, 0.046, 0.042, and 0.033)T were obtained and used further to obtain the final rank of alternatives using the ADAM method.
In Table 3, the alternative ratings for all criteria are shown. These values were obtained as an average based on the evaluations of five logistics experts. When evaluating, experts used a 1–10 scale. The first two criteria should be minimized, whereas the remaining criteria should be maximized.
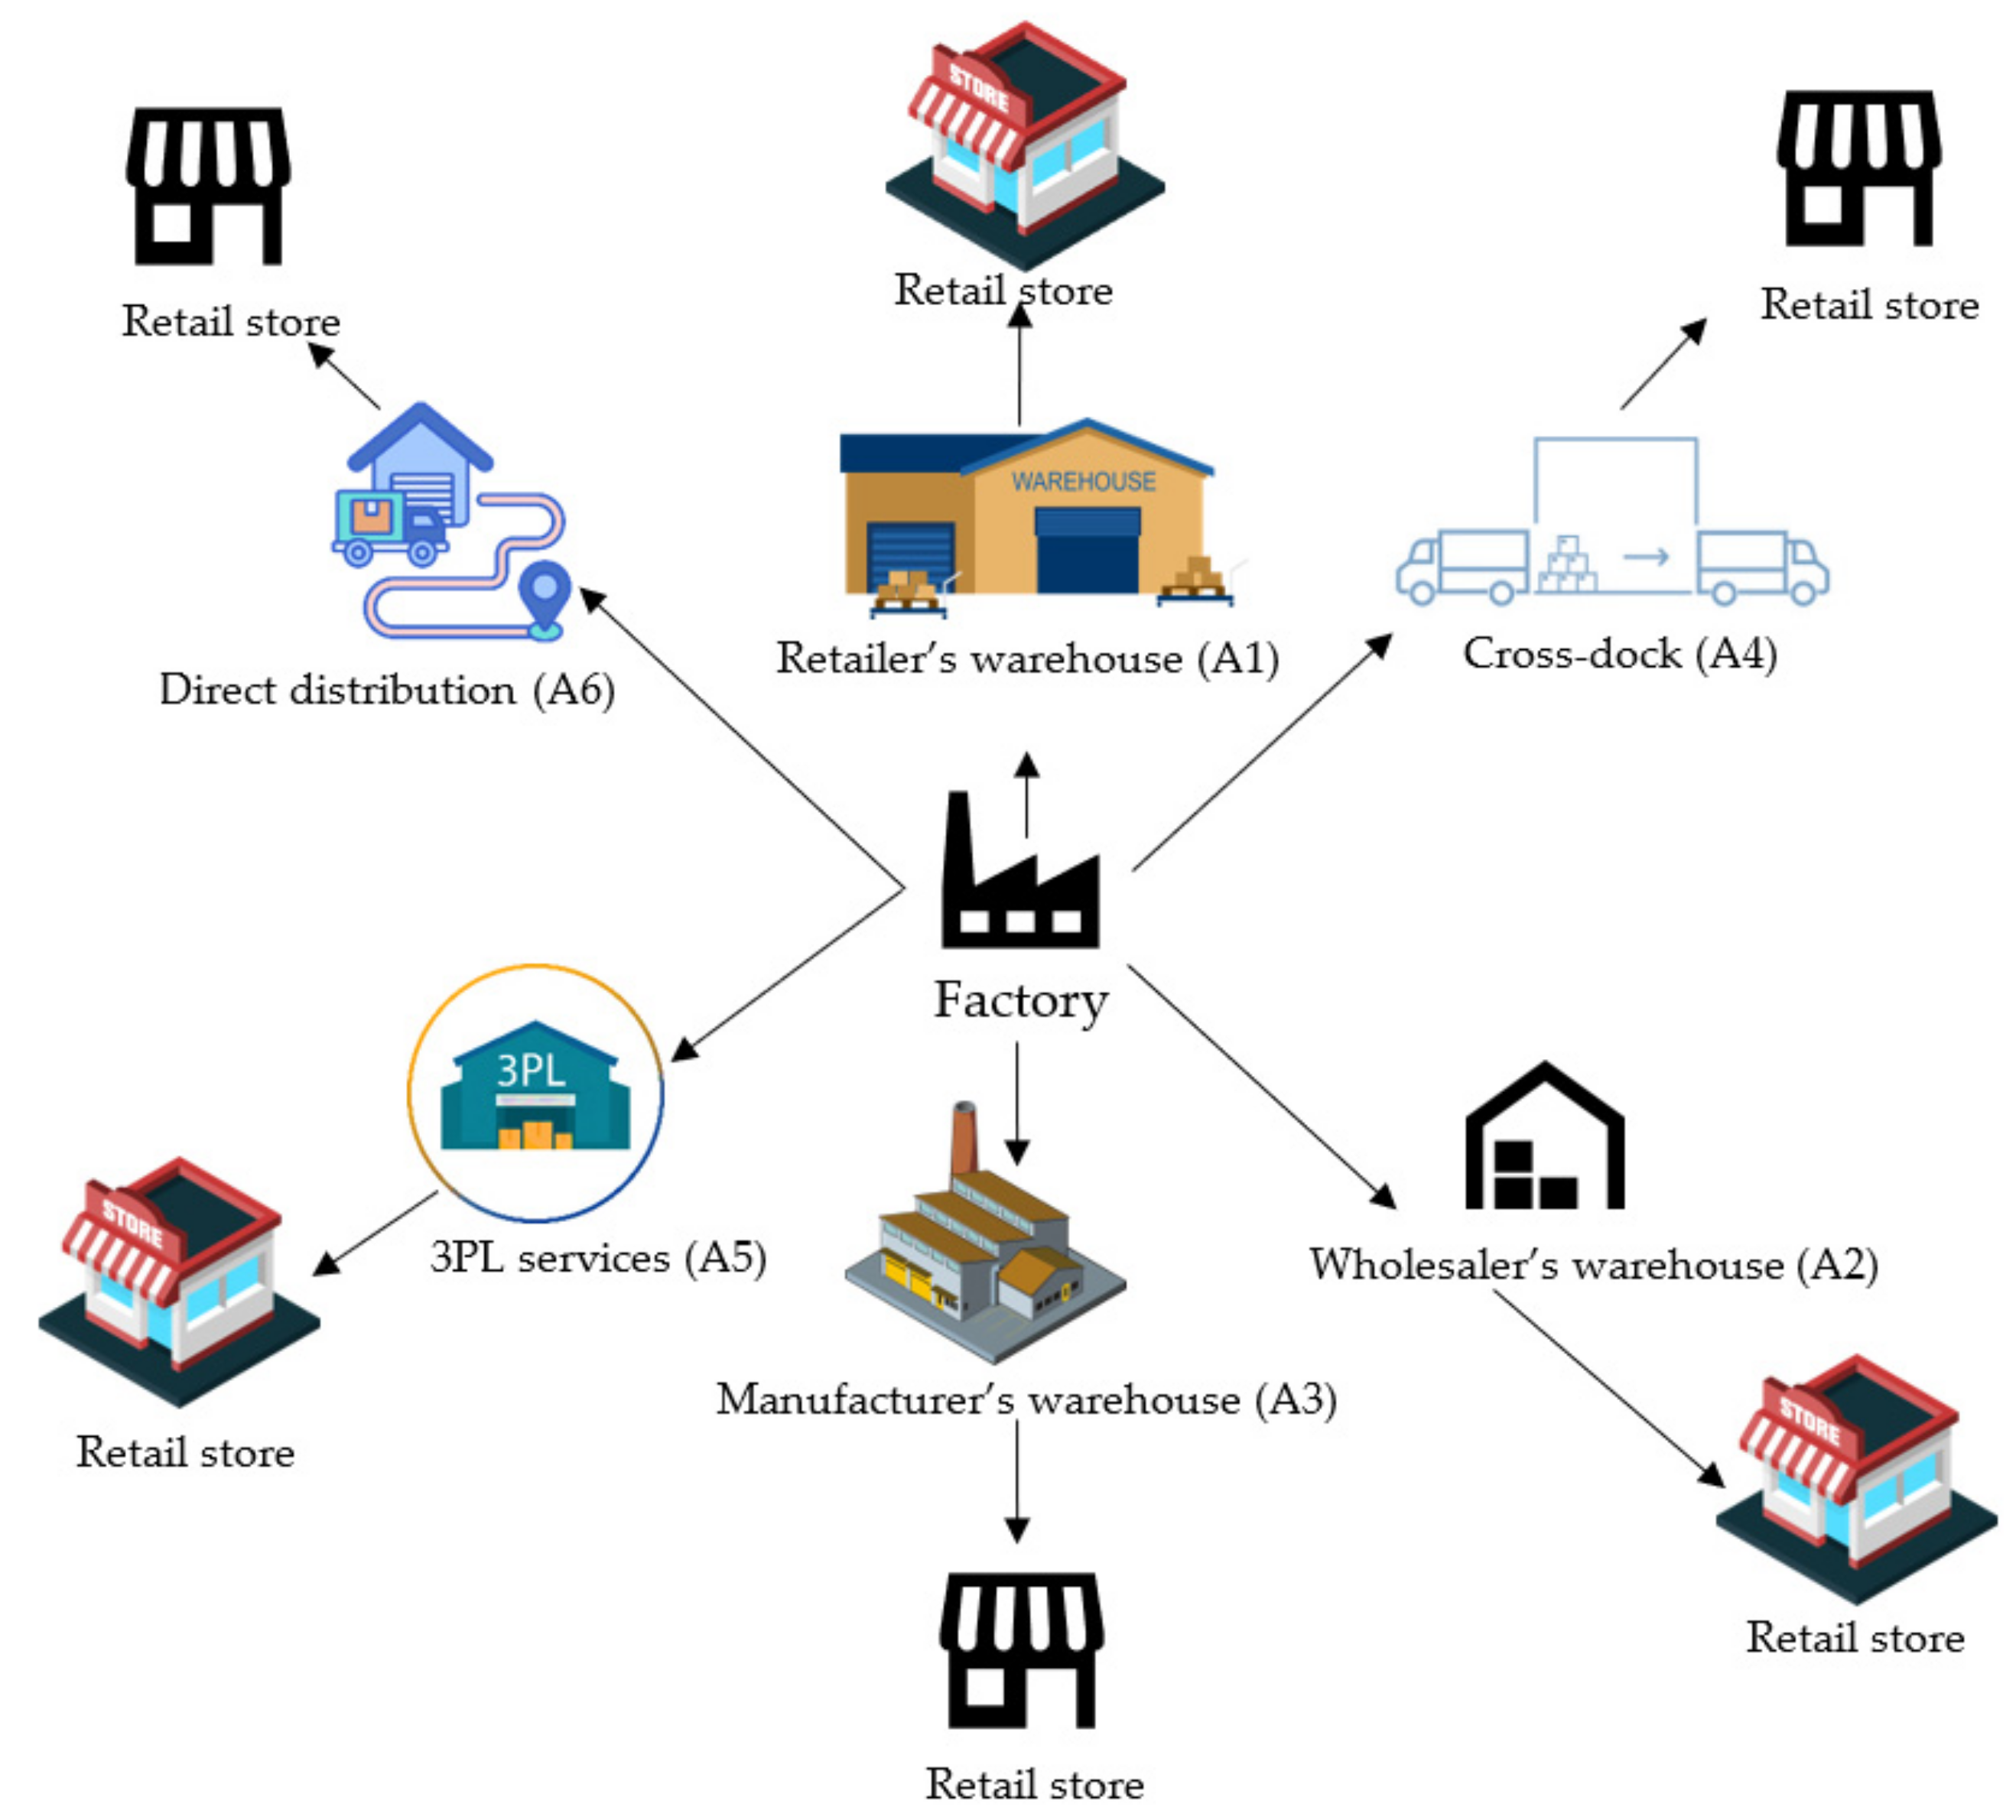
According to criterion C1, alternative A3 has the best rating as there are no or only short-term inventory holdings of goods on the cross-docking platform. However, at the manufacturer’s warehouse and in the channel with the 3PL provider, there must always be a large amount of inventory to ensure that there is no shortage of products, and for these reasons, these alternatives have the worst rating. Direct delivery has a similar rating, while the inventory costs in alternative A1 are lower than those in alternative A2 because there is a wider range of products in wholesale warehouses.
When it comes to the second criterion, i.e., distribution costs (C2), the best-rated alternative is A6, as the goods move directly from the manufacturer to the retailer without any intermediate stops or transshipments. The alternative A4 has the worst rating for this criterion, given the numerous transshipment manipulations of goods from one transport vehicle to another. Alternative A5 is the second-worst due to the costs of engaging a 3PL provider, as well as the transportation of goods to their warehouse, transshipment, and final distribution to the retailer. Distribution costs at the retailer’s warehouse (A1) are slightly lower than those at the wholesaler’s warehouse (A2) but higher than those at the manufacturer’s warehouse, as it is considered that this warehouse is located near the production site.
According to the third criterion, i.e., delivery speed (C3), the logical sequence is that direct delivery (A6) has the best rank, followed by the 3PL service (A5), given that 3PL providers perform transportation services in the most efficient way for their clients, and delivery is direct without any additional activities. Then, in the third place, is the retailer’s warehouse (A1), as their goal is to deliver goods to their retail stores as soon as possible, which is not the case with wholesaler’s (A2) and manufacturer’s (A3) warehouses, so they received lower ratings. The worst-ranked alternative in accordance with this criterion is undoubtedly the cross-dock (A4) due to numerous transshipments of goods.
Criterion C4 refers to the service level, which is based on product availability, delivery speed, reliability, and many other factors. According to this criterion, the best-ranked alternatives are A5 and A6, i.e., 3PL service and direct delivery, given the high delivery speed and product availability, so in those cases, products will be in retail stores shortly after the order is placed. In third place is the alternative A1, as the goal is to provide excellent service to its customers, whereas wholesaler’s (A2) and manufacturer’s (A3) warehouses received lower ratings. The cross-dock (A4) is the worst-rated alternative in accordance with this criterion given the very high possibility of errors during consolidation and deconsolidation.
Market coverage (C5) is very important since the amount of income and costs, as well as customer satisfaction, depend on it. According to this criterion, the best alternative is A5 because 3PL providers specialize in providing transportation services, and they can cover the requirements in different geographical areas in the easiest way. In second place is alternative A2, because wholesaler’s warehouses can be found anywhere, followed by the retailer’s warehouses (A1), which cover a smaller geographical area compared to wholesalers. The cross-dock alternative (A4) came in fourth place with a score of 5, because it does not cover larger geographical areas, but it is significantly better than the manufacturer’s warehouse (A3) and direct delivery (A6), which are limited to smaller coverage.
When ranking in accordance with the product availability (C6), the best alternatives are direct delivery and the retailer’s warehouse, taking into account that the endpoint is a retail store, so in those cases, there is the greatest possibility of fast delivery of the requested products. As the 3PL provider covers a large geographical area and has a high delivery speed, it can also have a high product availability, only if the manufacturer has ensured that the product is in the provider’s warehouse, therefore this alternative (A5) has a score of 8. For similar reasons, the second alternative (A2) has a score of 7, while the alternatives A3 and A4 are significantly worse. Cross-dock is the least reliable of the observed alternatives, and according to this criterion, it received the lowest rating.
The order consolidation capability (C7) is certainly the greatest with the cross-dock (A4). However, alternative retailer’s and wholesaler’s warehouses, as well as 3PL services, also have a high possibility of consolidation, and accordingly, they received the highest rating as well. Retailer’s warehouse, as well as wholesalers, deliver fully consolidated goods to retail stores, whereas 3PL providers specialize in this type of service. A manufacturer in his warehouse, in which there are several types of products, can perform consolidation, but this is a rare case. In the case of direct delivery, the only thing that matters is that the entire cargo space is filled because otherwise such delivery cannot be realized, so the consolidation of the goods, in this case, is not a priority.
According to criterion C8, i.e., reverse logistics, the alternatives related to the retailer’s warehouse and direct delivery are the best rated. The retailer’s warehouse will collect waste and returnable goods from its own retail stores, whereas direct delivery, as a rule, should also have a reverse flow, and such goods can also be transported in it. The 3PL service provider can also transport waste or goods that must be withdrawn from sale for some reason on the return trip, and for these reasons, alternative A5 received a score of 9. If the manufacturers distribute to retail stores through their own warehouse, they can also collect the goods that need to be returned, so alternative A3 was in third place. A somewhat worse alternative is distribution through wholesaler’s warehouses, whereas the worst alternative, due to its complexity, is A4 (cross-dock), where it is practically impossible to carry out these flows.
Order tracking is the ninth criterion and in relation to it, the best alternatives are definitely direct delivery and 3PL services because they are very reliable and accompanied by accurate and timely information. As the end-user, in this case, is a retailer’s store; the alternative related to the retailer’s warehouse is ranked second according to this criterion, considering the close connection of these participants in the distribution channel. The wholesaler’s warehouse has a slightly lower rating, but in principle, they also provide great opportunities for tracking the goods they ship to retail stores. The ability to provide order tracking is not too important for the manufacturer, whereas cross-dock tracking is practically at a very low level and even impossible; therefore, this alternative has the lowest score according to this criterion (Table 3).
In the second phase, the ADAM method was applied in order to obtain the final ranking of the alternatives. A software [37] was used to obtain the results. In other words, after determining the alternatives, criteria used in this paper, and initial decision-making matrix, the results were obtained by using Equations (10)–(26) (
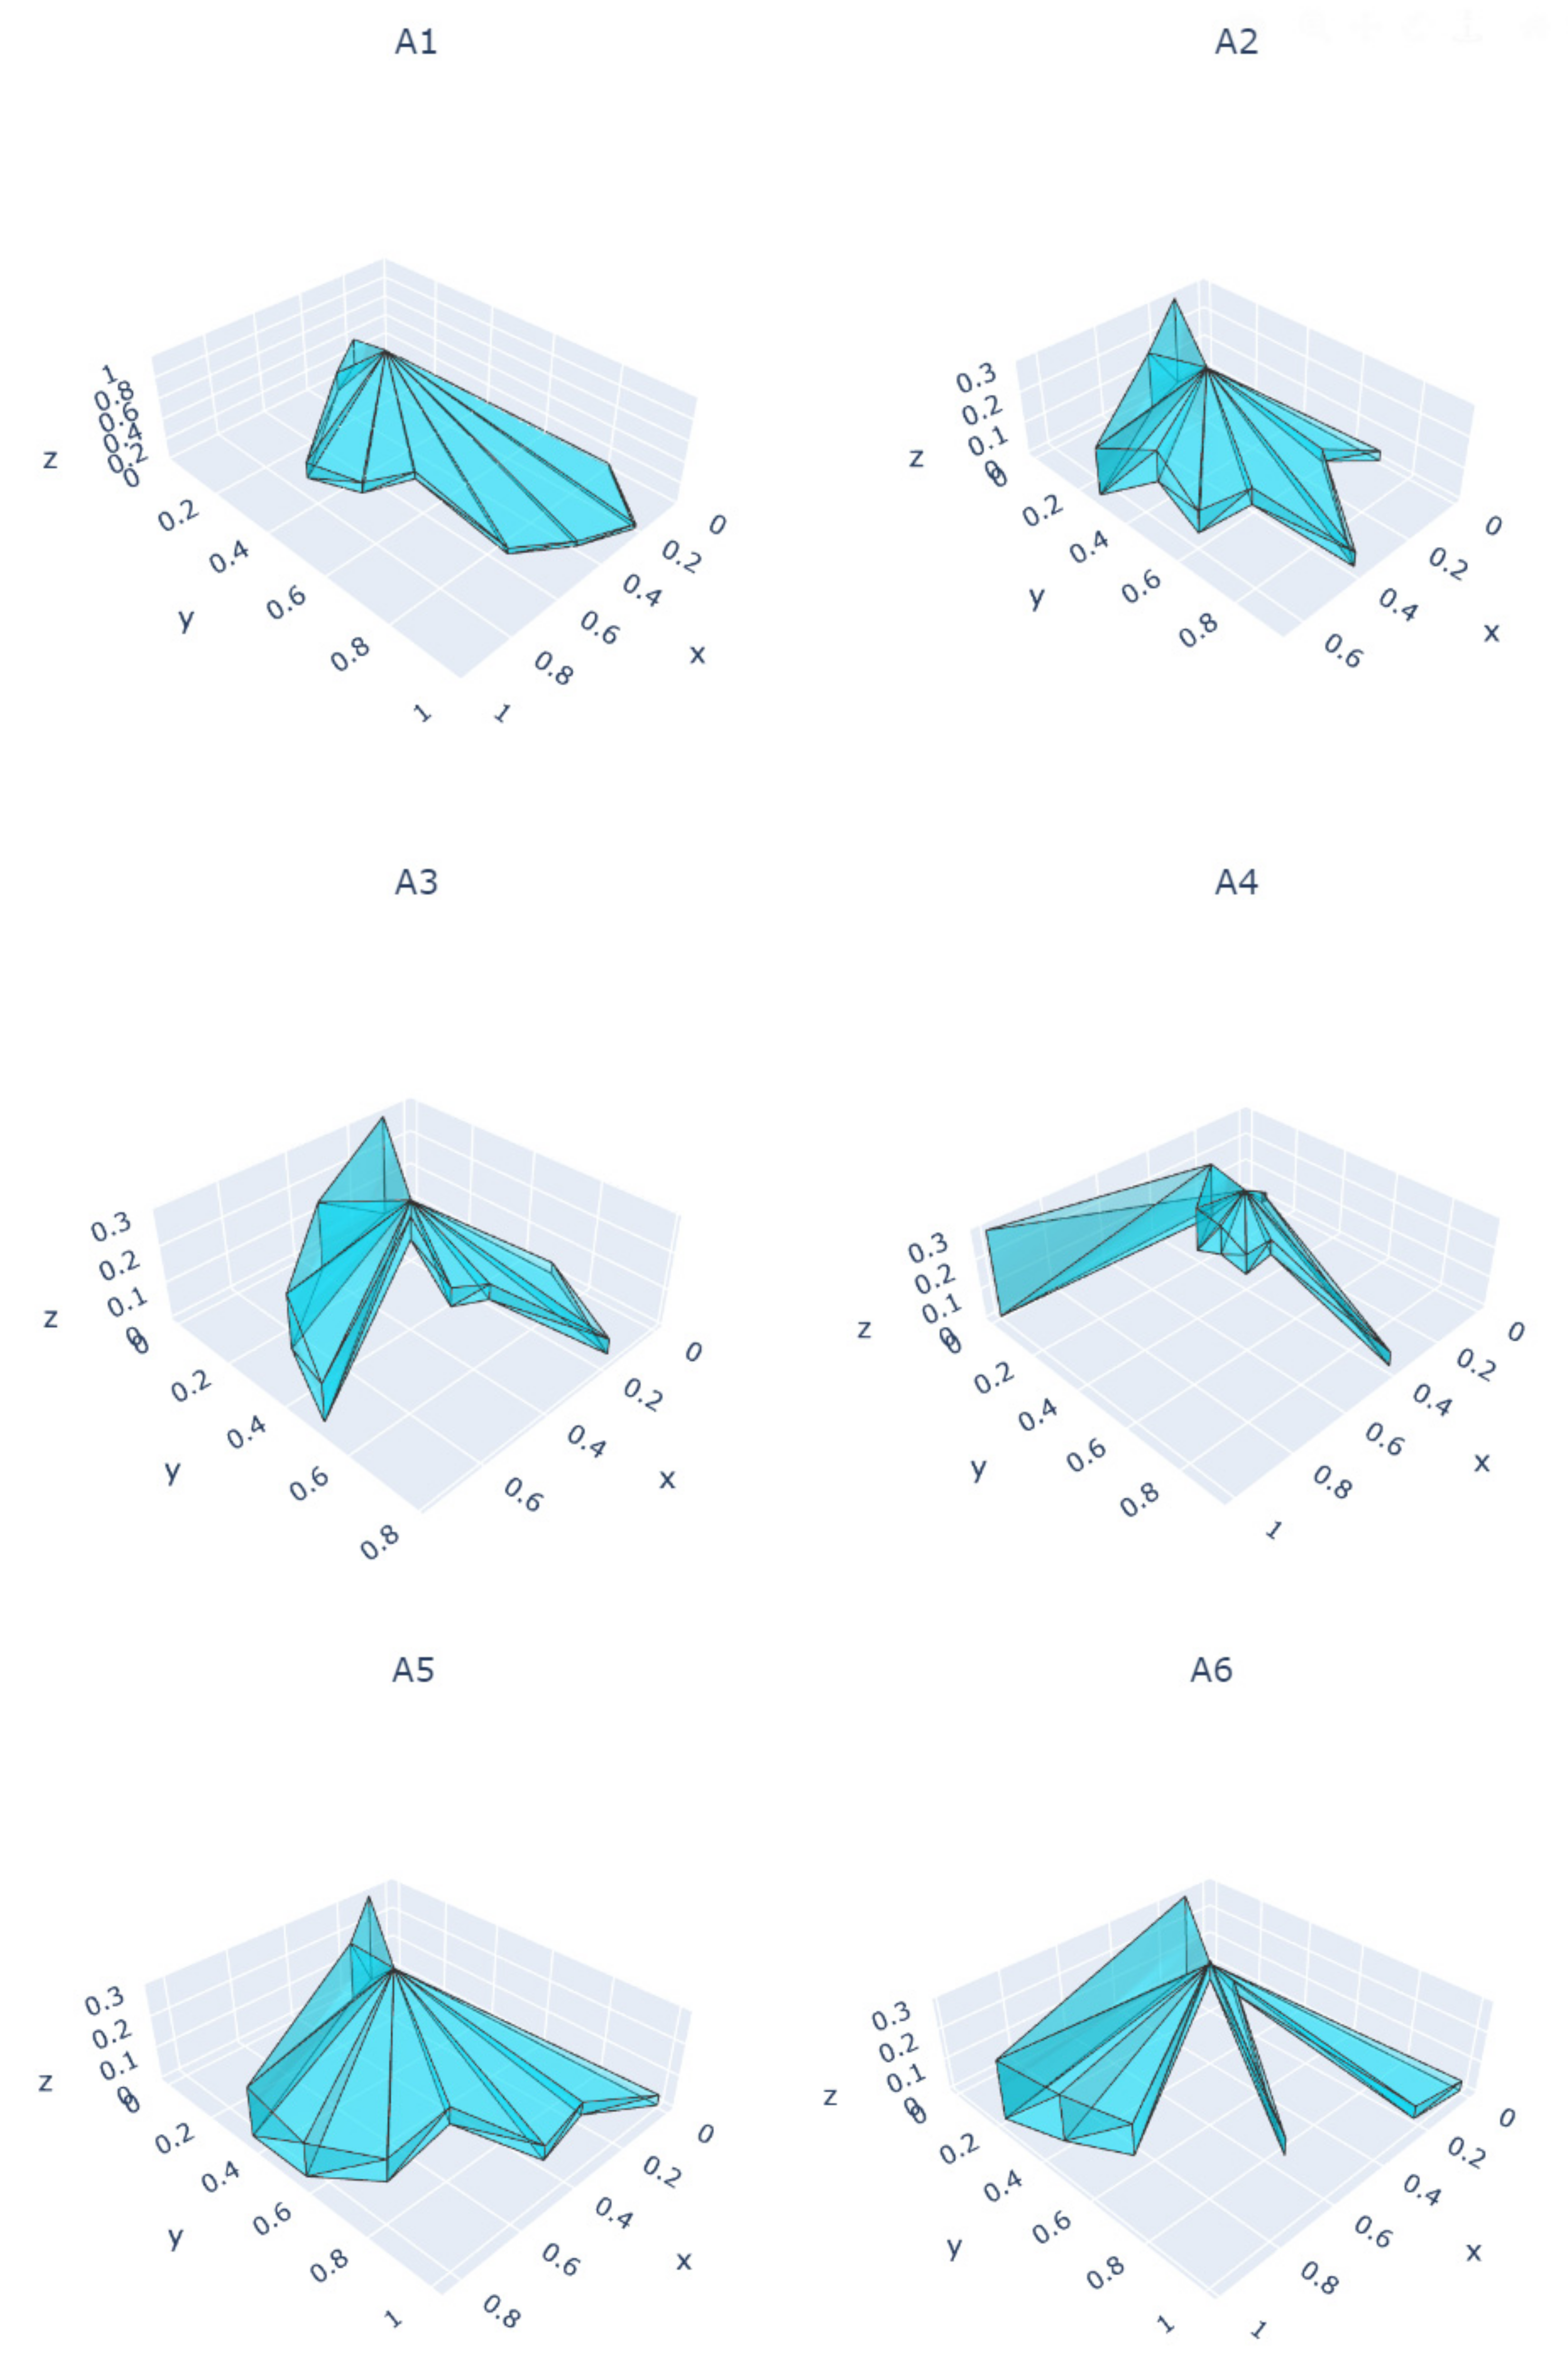
Table 4). In order to rank the alternatives, the complex polyhedra defined by the reference and weighted reference points need to be obtained. Figure 3 represents the complex polyhedral volumes that are used for alternative ranking, and, as can be seen, the best-ranked alternative is A5 followed by A6, A1, A2, A3, and A4. Based on these results, distribution using 3PL services is ranked as the best alternative, whereas cross-dock was determined to be the worst-ranked alternative. Also, alternative A5 has only a slightly higher value in volume when compared with A6. The final ranking of the alternatives can be shown as A5 > A6 > A1 > A2 > A3 > A4.

5. Model Validation, Sensitivity Analysis, and Discussion

5.1. Model Validation

In order to validate the obtained results, the same problem (with the same alternatives, criteria, and values) was solved using the combination of FUCOM-MARCOS methods. The formulation and implementation steps for the MARCOS method implemented in this paper are the same as in [38]. After implementing this methodology, it was concluded that there is a difference in the final ranking of the alternatives when compared with the methodology proposed in this paper (FUCOM-ADAM). Namely, alternatives A5 and A6 changed places, where it can be seen that alternative A6, which is direct delivery, is the best-ranked, whereas A3, which represents distribution through the manufacturer’s warehouse, is determined to be the worst-ranked alternative (Table 5). The final ranking of the alternatives can be shown as A6 > A5 > A4 > A1 > A2 > A3.
In addition to that, a combination of BWM with ADAM was also applied where BWM was used to determine the criteria weights, whereas ADAM was used for the ranking. The BWM formulation was the same as in [39]. After the implementation, criteria weights were obtained (Table 6). These weights were then used in the ADAM method, and based on the results (Table 7), it can be concluded that the final ranking is the same as the rank obtained after implementing the methodology proposed in this paper. Based on the model validation it can be concluded that when the ADAM method is combined with different methods for determining criteria weights, there is no difference in the final ranking of the alternatives. The ranking slightly changed only when another MCDM method (in this case MARCOS) was applied.

5.2. Sensitivity Analysis

In order to determine whether the change in the criteria weights affected the obtained results, a sensitivity analysis was carried out. On that occasion, four scenarios were defined, namely service-related, sales-related, logistics-related, and a scenario in which the weights of all criteria are equal (Table 8). In the first scenario (service-related), it was defined that criteria C3 and C4 had the highest values of the weights. For this reason, the weights of criteria C1 and C2 were replaced with the weights of criteria C3 and C4, respectively. In the second scenario (sales-related), it was assumed that the most important criteria were those related to the sale of the product/service (criteria C5 and C6). For this reason, the weights of criteria C1 and C2 replaced the values with criteria C5 and C6, respectively. In the third scenario, it was assumed that logistics-related criteria (C7, C8, and C9) were the most important. For this reason, the weight values of these criteria were replaced by the values of criteria C1, C2, and C3, respectively. Finally, in the last scenario, it was assumed that all criteria have the same weight.
Based on the results of the sensitivity analysis, it can be concluded that the order of alternatives slightly changed when compared to the results obtained in the previous section (Table 9). Namely, only alternatives A1 and A6 changed places, whereas the rest of the alternatives did not change their rank. The order of alternatives according to these scenarios can be shown as A5 > A1 > A6 > A2 > A3 > A4.

5.3. Theoretical and Practical Implications

Based on the presented results, it can be concluded that the proposed approach can provide significant support for multi-criteria decision making. If real data were available and used instead of expert estimates, even more, realistic results would be obtained. This approach significantly contributes to the field of multi-criteria decision making as it considers all aspects of the real problem that needs to be solved.
The paper represents an excellent basis for future research. It is particularly significant in today’s era of small shipments with high frequency. In the current market, we are witnessing an increasing demand for the delivery of smaller shipments with higher frequency. This shift is largely driven by the rise of e-commerce and the growth of online shopping. As a result, logistics companies are facing new challenges in terms of optimizing their operations and ensuring timely and cost-effective deliveries. The paper provides valuable insights into how multi-criteria decision making can be used to address these challenges. By considering multiple factors such as cost, speed, and reliability, decision-makers can make decisions based on information about the most efficient and effective ways of transporting goods.
Furthermore, the paper’s findings can be applied to a range of other industries beyond logistics. For example, in healthcare, multi-criteria decision making can be used to optimize patient care, while in finance, it can be applied to investment decisions. Overall, this paper offers an excellent framework for future research in the field of multi-criteria decision making. Its insights into the challenges of small shipments with high frequency make it particularly relevant in today’s market. As such, it is an area of research that is worth exploring further.
In addition, the proposed approach is fully applicable in practice and suitable for solving problems in real time. It is only necessary to determine the criteria by which alternatives will be evaluated and then either make an expert assessment or evaluate them in some other way. The advantage of these two methods lies in their applicability in logistics, regardless of the goods type, the type, and size of the company, etc.
Systematizing and selecting criteria, as well as identifying the most significant distribution channels, enables practitioners to quickly and easily identify problems and solve them. By streamlining the decision-making process, the model helps practitioners make decisions based on information about the most efficient and cost-effective ways of transporting goods. This is achieved through the identification of key criteria and distribution channels, which enables practitioners to quickly identify the best options available. Furthermore, the proposed model’s ability to be transformed into an application (software) has the potential to revolutionize the way that logistics companies approach decision making. With a user-friendly interface and simplified processes, the application would provide a more accessible solution than the Excel templates that are currently in use. In addition, the application’s accessibility would also make it easier for smaller logistics companies to adopt more sophisticated decision-making processes. This would enable them to compete with larger companies in terms of efficiency and cost-effectiveness, leveling and promoting greater competition. Overall, the proposed model and application have the potential to significantly improve the efficiency and cost-effectiveness of logistics operations. By simplifying the decision-making process and making it more accessible to a wider range of companies, these tools represent a valuable resource for practitioners.
The results obtained in this paper are in contrast to the results obtained in [15], where the authors in that paper found that the best distribution channel (ranked alternative) is manufacturer–wholesaler–retailer–consumer whereas the worst-ranked alternative is manufacturer–consumer. These results are not surprising, given that the authors in that paper observed completely different criteria and alternatives compared to those presented in this paper. Also, the results of this paper showed that the best solution depends on the weights of the criteria based on which the alternatives are evaluated.
When comparing the obtained results with the results from [8], it can be concluded that there is a difference in the obtained results as well. Namely, in that paper, the best-ranked alternative was the cross-dock center, whereas local warehouses were rated as the worst-ranked alternative. Based on this, it can be concluded that the application of the proposed methodology also depends on the type of goods, given that the mentioned authors dealt with the selection of distribution channels for high-value stones.

6. Conclusions

Distribution is one of the seven elements of the marketing mix, and the decision about the distribution channel is equally important as the decisions about services, price, promotion, service processes, physical environment, and human resources. The aim of this paper was to choose an appropriate distribution channel based on observed criteria, using the methods and approaches of multi-criteria decision making. The choice of a distribution channel can be made using various multi-criteria decision-making methods such as TOPSIS, AHP, fuzzy methods, mathematical programming, and others, as well as their combinations. In this study, a combination of FUCOM and ADAM methods was applied, where FUCOM was used to obtain the criteria weights, whereas the ADAM method was used to obtain the final ranking of alternatives. Six distribution channels (retailer’s warehouse, wholesaler’s warehouse, manufacturer’s warehouse, cross-dock, 3PL services, and direct delivery) were ranked in this paper using nine criteria (inventory costs, distribution costs, delivery speed, service level, market coverage, product availability, order consolidation capability, reverse logistics, and order tracking). Based on the results, the distribution channel with 3PL services was the best-ranked alternative while inventory costs stood out as the most important criterion. Since the ADAM method is a novel MCDM method, a model validation was conducted and the obtained results were compared with the combination of two methodologies (FUCOM-MARCOS, and BWM-ADAM). The results of this research were also compared with the results obtained from the previous research, and it was concluded that there are certain factors (such as goods type, distribution channel type, etc.) that can affect the selection of distribution channel. The obtained results showed the great applicability of the proposed methodology in this paper. After consulting experts, it was concluded that the results matched the real situation. The only limitation of this paper in this term is the relatively small number of experts that estimated alternatives in accordance with the observed criteria. Since there are a large number of decisions that need to be made on a daily basis in the logistics sector, the importance of these methods lies precisely in the easier decision-making process. The decision-making process is facilitated because management only has to evaluate alternatives according to criteria and determine the importance of each criterion in relation to the top-ranked one, whereas the other steps of the method can be easily carried out using Excel and Lingo or some other solver. The only problem with the implementation can occur if managers are not familiar with the application of the previously mentioned software. In these situations, the development of an application would be a better choice.
Another limitation of the paper is reflected in the fact that e-commerce, as well as omnichannel, were not considered as a sales channel, as well as the lack of data based on which more accurate conclusions could be drawn. Future research could focus on including a larger number of criteria, as well as other types of distribution channels, especially omnichannel, testing on real-life cases, and involving more experts in assessing weights. Also, future research could focus more on the different types of costs that exist in distribution, considering their importance, and show how they could be reduced or increased by switching to another type of distribution channel. Overall, future research should also focus on the development and refinement of hybrid models that combine the proposed approach with other techniques and approaches. This will enable practitioners to make even more precise and effective decisions, ultimately leading to improved efficiency and cost-effectiveness in logistics operations even in situations of uncertainty.

Author Contributions

Conceptualization, M.A., V.P. and M.K.; methodology, M.A., V.P. and M.K.; software, M.A. and V.P.; validation, M.A., V.P. and M.K.; formal analysis, M.A., V.P. and M.K.; writing—original draft preparation, M.A., V.P. and M.K.; writing—review and editing, M.A., V.P. and M.K. All authors have read and agreed to the published version of the manuscript.

Funding

This research received no external funding.

Institutional Review Board Statement

Not applicable.

Informed Consent Statement

Not applicable.

Data Availability Statement

Not applicable.

Conflicts of Interest

The authors declare no conflict of interest.

References

  1. Andrejić, M.; Kilibarda, M. Distribution channels selection using PCA-DEA approach. Int. J. Traffic Transp. Eng. 2015, 5, 74–81. [Google Scholar] [CrossRef] [PubMed]
  2. Luo, H.; Zhong, L.; Nie, J. Quality and distribution channel selection on a hybrid platform. Transp. Res. E Logist. Transp. Rev. 2022, 163, 102750. [Google Scholar] [CrossRef]
  3. Agnusdei, L.; Krstić, M.; Palmi, P.; Miglietta, P.P. Digitalization as driver to achieve circularity in the agroindustry: A SWOT-ANP-ADAM approach. Sci. Total Environ. 2023, 882, 163441. [Google Scholar] [CrossRef] [PubMed]
  4. Khadivr, A.; Mojibian, F.; Jafari, S.G. Optimal distribution channel selection in electronic supply chain of fast moving consumer goods. Iran. J. Manag. Sci. 2022, 17, 135–164. [Google Scholar]
  5. Pajić, V.; Andrejić, M.; Kilibarda, M. Procurement optimization by selecting efficient suppliers using DEA-FUCOM-CoCoSo approach and solving order allocation problem. In Facta Universitatis; Series: Mechanical Engineering; University of Niš: Niš, Serbia, 2022. [Google Scholar]
  6. Krstić, M.; Agnusdei, G.P.; Tadić, S.; Kovač, M.; Miglietta, P.P. A Novel Axial-Distance-Based Aggregated Measurement (ADAM) Method for the Evaluation of Agri-Food Circular-Economy-Based Business Models. Mathematics 2023, 11, 1334. [Google Scholar] [CrossRef]
  7. MBA Skool Team. Distribution Strategy Meaning, Importance, Types, Factors & Example. Available online: https://www.mbaskool.com/business-concepts/marketing-and-strategy-terms/7048-distribution-strategy.html (accessed on 20 March 2023).
  8. Mikušová, N.; Tomková, E.; Hrdlý, D.; Průša, P.; Kampf, R. Selection of an appropriate distribution channel for high-value stone. Adv. Sci. Technol. Res. J. 2018, 12, 298–306. [Google Scholar] [CrossRef] [PubMed]
  9. Rushton, A.; Croucher, P.; Baker, P. Channels of distribution. In The Handbook of Logistics and Distribution Management, 5th ed.; KoganPage: London, UK, 2010; pp. 56–84. [Google Scholar]
  10. Fu, Y.; Wu, J.; Ma, C.; Fu, X. Agency, Reselling, or Hybrid: Strategic Channel Selection in a Green Supply Chain. Sustainability 2023, 15, 2016. [Google Scholar] [CrossRef]
  11. Xie, X.; Hu, P.; Yu, J.; Dai, B. Impact of capacity on the supplier’s distribution channel selection in facing a retail platform. Nav. Res. Logist. 2021, 68, 837–854. [Google Scholar] [CrossRef]
  12. Bian, J.; Guo, X.; Li, K.W. Decentralization or integration: Distribution channel selection under environmental taxation. Transp. Res. E Logist. Transp. Rev. 2018, 113, 170–193. [Google Scholar] [CrossRef]
  13. Serbest, G.N.; Vayvay, O. Selection of the most suitable distribution channel using fuzzy Analytic Hierarchy Process in Turkey. Int. J. Logist. Syst. Manag. 2008, 4, 487–505. [Google Scholar] [CrossRef]
  14. Zhao, Q.; Jin, J.; Deng, X.; Wang, D. Considering environmental implications of distribution channel choices: A comparative study based on game theory. J. Clean. Prod. 2017, 167, 1155–1164. [Google Scholar] [CrossRef]
  15. Đalić, I.; Stević, Ž.; Erceg, Ž.; Macura, P.; Terzić, S. Selection of a distribution channel using the integrated FUCOM—MARCOS model. Int. Rev. 2020, 3–4, 80–96. [Google Scholar] [CrossRef]
  16. Galkin, A. Distribution Channels Management in Different Regions. Am. J. Econ. Financ. Manag. 2015, 1, 92–96. [Google Scholar]
  17. Hatami, K.; Kheiri, B.; Heydari, S.A. A MCDM approach for evaluation and selection of distribution channels in FMCG industry. Int. J. Manag. 2020, 11, 404–414. [Google Scholar] [CrossRef]
  18. Kabiesz, P.; Kubon, M. Evaluation of distribution channels in a selected meat processing company. Sci. Pap. Silesian Univ. Technol. Organ. Manag. Ser. 2019, 134, 63–70. [Google Scholar] [CrossRef]
  19. Pajić, V.; Andrejić, M.; Sternad, M. FMEA-QFD approach for effective risk assessment in distribution processes. J. Intell. Manag. Decis. 2023, 2, 46–56. [Google Scholar] [CrossRef]
  20. Pant, S.; Garg, P.; Kumar, A.; Ram, M.; Kumar, A.; Sharma, H.K.; Klochkov, Y. AHP-based multi-criteria decision-making approach for monitoring health management practices in smart healthcare system. Int. J. Syst. Assur. Eng. Manag. 2023. [Google Scholar] [CrossRef]
  21. Prabhuram, T.; Rajmohan, M.; Tan, Y.; Robert Johnson, R. Performance evaluation of Omni channel distribution network configurations using multi criteria decision making techniques. Ann. Oper. Res. 2020, 288, 435–456. [Google Scholar] [CrossRef]
  22. Ampountolas, A.; Shaw, G.; James, S. The role of social media as a distribution channel for promoting pricing strategies. J. Hosp. Tour. Insights 2019, 2, 75–91. [Google Scholar] [CrossRef]
  23. Jia, D.; Li, S. Optimal decisions and distribution channel choice of closed-loop supply chain when e-retailer offers online marketplace. J. Clean. Prod. 2020, 265, 121767. [Google Scholar] [CrossRef]
  24. Modak, N.M.; Sinha, S.; Panda, S.; Kazemi, N. Analyzing a socially responsible closed-loop distribution channel with recycling facility. SN Appl. Sci. 2019, 1, 1189. [Google Scholar] [CrossRef]
  25. Zhu, L. Supply chain product quality control strategy in three types of distribution channels. PLoS ONE 2020, 15, e0231699. [Google Scholar] [CrossRef] [PubMed]
  26. Fazlollahtabar, H.; Smailbašić, A.; Stević, Ž. FUCOM method in group decision-making: Selection of forklift in a warehouse. Decis. Mak. Appl. Manag. Eng. 2019, 2, 49–65. [Google Scholar] [CrossRef]
  27. Khan, F.; Ali, Y.; Pamucar, D. A new fuzzy FUCOM-QFD approach for evaluating strategies to enhance the resilience of the healthcare sector to combat the COVID-19 pandemic. Kybernetes 2022, 51, 1429–1451. [Google Scholar] [CrossRef]
  28. Golcuk, I.; Durmaz, E.D.; Sahin, R. Interval type-2 fuzzy development of FUCOM and activity relationship charts along with MARCOS for facilities layout evaluation. Appl. Soft Comput. 2022, 128, 109414. [Google Scholar] [CrossRef]
  29. Pamučar, D.; Stević, Ž.; Sremac, S. A New Model for Determining Weight Coefficients of Criteria in MCDM Models: Full Consistency Method (FUCOM). Symmetry 2018, 10, 393. [Google Scholar] [CrossRef]
  30. Nunić, Z. Evaluation and selection of the PVC carpentry manufacturer using the FUCOM-MABAC model. Oper. Res. Eng. Sci. Theor. Appl. 2018, 1, 13–28. [Google Scholar] [CrossRef]
  31. Zavadskas, E.K.; Nunić, Z.; Stjepanović, Ž.; Prentkovskis, O. A novel rough range of value method (R-ROV) for selecting automatically guided vehicles (AGVs). Stud. Inform. Control 2018, 27, 385–394. [Google Scholar] [CrossRef]
  32. Gupta, N.; Vaidya, D. Distribution Cost. Available online: https://www.wallstreetmojo.com/distribution-cost/ (accessed on 20 March 2023).
  33. Oriat, A.; Khabiri, N.; Kazemi, A. Ranking factors affecting the selection of customer preferences distribution channels based on fuzzy hierarchical analysis (F-AHP) and topsis (TOPSIS). In Proceedings of the Iran I World New Researches in Management, Economics, Accounting and Humanities, Shiraz, Iran, 18 May 2017; pp. 1–20. [Google Scholar]
  34. Vasiliauskas, A.V.; Vilkelis, A.; Zinkevičiūtė, V.; Batarlienė, N. Development of automobile distribution networks on the basis of multi-criteria evaluation of distribution channels. Transport 2010, 25, 361–367. [Google Scholar] [CrossRef]
  35. Schalit, S.; Vermorel, J. Service Level. Available online: https://www.lokad.com/service-level-definition (accessed on 15 March 2023).
  36. Irani, H.R.; Shahanaghi, K.; Jandaghi, G. Develop A Framework for Selection of Intermediary in Marketing Channel. Iran. J. Manag. Stud. 2011, 4, 25–42. [Google Scholar]
  37. ADAM METHOD. Available online: https://adam-mcdm.com (accessed on 1 June 2023).
  38. Stević, Ž.; Pamučar, D.; Puška, A.; Chatterjee, P. Sustainable supplier selection in healthcare industries using a new MCDM method: Measurement Alternatives and Ranking according to COmpromise Solution (MARCOS). Comput. Ind. Eng. 2020, 140, 106231. [Google Scholar] [CrossRef]
  39. Rezaei, J. Best-worst multi-criteria decision-making method. Omega 2015, 53, 49–57. [Google Scholar] [CrossRef]
Figure 1. Methodology for distribution channel selection.
Sustainability 15 14527 g001
Figure 2. Distribution channels.
Sustainability 15 14527 g002
Figure 3. Complex polyhedral for the alternatives.
Sustainability 15 14527 g003
Table 1. Description of the observed criteria.
Cr. Nm.CriteriaDescriptionReferences
C1Inventory costsThe criterion that companies strive to minimize. The best distribution channel is the one that has the lowest value according to this criterion.[8]
C2Distribution costsThe criterion represents the sum of all those costs incurred by the manufacturer to enable the delivery of the product from its location to the end customer’s location. Therefore, for the manufacturer, this includes all costs that arise to enable the delivery of the product from its production location to the customer’s location, whether it is a retailer, wholesaler, or end customer. The goal is also to minimize this criterion.[1,17,32]
C3Delivery speedThe criterion that is significant for the customer, the faster the delivery speed of the product, the better the distribution channel is rated.[8]
C4Service levelThe criterion can be defined as the expected probability of not hitting a stock-out during the next replenishment cycle, and thus, it is also the probability of not losing sales. It can also be defined as the probability of being able to service the customers’ demand ever facing any backorder or lost sale. Also, this criterion represents OTIF (On Time In Full)[1,33,34,35]
C5Market coverageRefers to geographical coverage: stores per market area, industry coverage, call frequency, or coverage intensity.[36]
C6Product availabilityDoes not refer to the availability of products at all times, but rather to their availability at the moment of customer demand. It is a unit of time, and the goal is to maximize the availability of the system. Also, this criterion includes OSA (On-Shelf Availability)[8]
C7Order consolidation capabilityNot all types of distribution channels are suitable for order consolidation. The goal is to combine multiple potential orders so that the customer receives only one complete order.[8]
C8Reverse logisticsDifferent types of distribution channels have different difficulties in the process of reverse logistics. The reverse logistics process refers to closing the circular structure of the distribution chain, where waste, as well as all other products that are withdrawn from the market for some reason (malfunction, defect, expiration date, etc.), are returned to the manufacturer.[8,17]
C9Order trackingAn important criterion that guarantees the possibility of accurate tracking of orders throughout the entire ordering process. For customers, it is important to have information about where their order is, which increases their satisfaction.[8]
Table 2. Priorities of criteria.
CriteriaC1C2C3C4C5C6C7C8C9
ωCj(k)11.51.92.84.15.36.478.9
Table 3. Initial decision-making matrix.
C1C2C3C4C5C6C7C8C9
A1668871010108
A28776871067
A31057925585
A411044541011
A510991010810910
A692101011021010
Table 4. Final ranking of the alternatives.
AlternativesVolumeRank
A10.023604053
A20.0165579664
A30.0135600785
A40.0090726756
A50.0267530251
A60.0263028722
Table 5. Final ranking of the alternatives after implementing FUCOM-MARCOS methodology.
SiKiKi+f(Ki)f(Ki+)f(Ki)Rank
AAI0.2189
A10.5431332.4811940.5436770.1797360.820264390.523076434
A20.455352.0801740.4558060.1797360.820264390.438534775
A30.42631.9474650.4267270.1797360.820264390.410557536
A40.54912.5084510.549650.1797360.820264390.528822753
A50.5510562.5173850.5516070.1797360.820264390.530706092
A60.6360672.9057410.6367030.1797360.820264390.61257791
AI0.999
Table 6. Criteria weights obtained by the BWM method.
CriteriaC1C2C3C4C5C6C7C8C9
Weight0.30800.19410.12940.09700.07760.06470.05540.04850.0253
Table 7. Final ranking of the alternatives after implementing BWM-ADAM methodology.
AlternativesVolumeRank
A10.0240599113
A20.0168755924
A30.013002775
A40.0092713426
A50.0268169711
A60.0245611492
Table 8. Criteria weights in different scenarios.
CriteriaCriteria Weights (Scenario 1)Criteria Weights (Scenario 2)Criteria Weights (Scenario 3)Criteria Weights (Scenario 4)
C10.1550.0720.0460.111
C20.1050.0560.0420.111
C30.2940.1550.0330.111
C40.1960.1050.1050.111
C50.0730.2940.0720.111
C60.0560.1960.0560.111
C70.0460.0460.2940.111
C80.0420.0420.1960.111
C90.0330.0330.1550.111
Table 9. Ranking of the alternatives in different scenarios.
Scenario 1AlternativesVolumeRankScenario 2AlternativesVolumeRank
A10.0245730712A10.0326097092
A20.0165582214A20.0223339174
A30.0152284255A30.0143814085
A40.0118501116A40.0104734246
A50.0276999351A50.0347465981
A60.0228056973A60.0262360363
Scenario 3AlternativesVolumeRankScenario 4AlternativesVolumeRank
A10.0379713692A10.0362521172
A20.023876714A20.0246557944
A30.0171575445A30.016457825
A40.006122916A40.0097447626
A50.0429658981A50.0398612881
A60.027169943A60.0267880693
Disclaimer/Publisher’s Note: The statements, opinions and data contained in all publications are solely those of the individual author(s) and contributor(s) and not of MDPI and/or the editor(s). MDPI and/or the editor(s) disclaim responsibility for any injury to people or property resulting from any ideas, methods, instructions or products referred to in the content.

