Abstract
This study focuses on the riverbed sediments in the Changsha-Zhuzhou-Xiangtan (CS-ZZ-XT) section of the lower reaches of the Xiangjiang River. Principal element analysis, ecological risk analysis, and early warning methods were used to explore the distribution pattern and risk assessment of various chemical elements in the sediments. The results indicated that the vertical distributions of Sc, Co, Th, and U were more homogeneous, while Cr, V, Cu, and Ni distributed heterogeneously with significant changes. Risk assessment of heavy metals was explored by using the Geoaccumulation index, potential ecological risk index, and ecological risk index, suggesting that the contamination levels followed: ZZ > XT > CS. ZU and ZX points in the ZZ section exhibited the higher ecological risk. The ecological risk of heavy metals followed the order of: Pb > Cu > Zn > Ni > Co > Mn > V > Cr, and the contamination of Cd and Mn was located at the severe warning condition. Additionally, it was suggested that Th, U, Pb, Zn, Cu, and Mn mostly originated from both anthropogenic activities and natural processes, while Ni, Cr, Co, V, Sc, and Ba were derived from natural processes. Therefore, the contamination of Cd, Th, U, Pb, Zn, Cu, and Mn, especially Cd and Mn, should be considered by the environmental protection strategies in the studied watershed.
1. Introduction
Riverbed sediments are loose deposits widely distributed in different parts of riverbeds, floodplains, and other watersheds after the transport, migration, and sedimentation of rock (soil) weathering products [1]. As an important environmental medium, sediment geochemical analysis has always been the focus of research on environmental geochemistry [2]. Geochemical elemental analysis of riverbed sediments can not only reveal the law of element migration during epigenesis but also help to deeply analyze and determine the influence of natural and anthropogenic processes on the distribution of heavy metals in riverbed sediments in the watershed and reduce the regional geochemical process of heavy metal pollution formation in sediments [3,4,5].
Hunan Province is a famous “hometown of non-ferrous metals” in China. The Xiangjiang River basin covers an area accounting for 40% of the total area of Hunan Province, 60% of the total population of Hunan Province, and large and medium-sized enterprises accounting for more than 70%. The upper reaches of the Xiangjiang River are the metallogenic concentration areas of non-ferrous metal deposits such as W, Sn, Nb, Ta, Cu, Pb, and Zn [6]. The middle and lower reaches of the Xiangjiang River (Hengyang, Zhuzhou, Xiangtan, and other cities along the river) are the industrial distribution areas of non-ferrous metal mineral processing and utilization. These industrial and mining enterprises frequent and long-standing mining and industrial activities are not only an important industrial economic pillar industry in Hunan Province but also the key object of environmental protection in Hunan. However, the discharge of heavy metals has also led to serious pollution of the Xiangjiang River at the same time [7]. Therefore, the Xiang River has also become one of the most polluted rivers with heavy metals in China.
The Zhuzhou (ZZ) and Xiangtan (XT) sections of the lower reaches of the Xiangjiang River are some of the most seriously polluted areas by heavy metals in the entire Xiangjiang River basin [8]. Among them, the types of industrial enterprises in ZZ City are mainly nonferrous smelting, building materials, the chemical industry, thermal power generation, and other heavy chemicals [2]. The industrial wastewater in the ZZ Qingshuitang Industrial Park is mainly discharged into Xiawan Port and eventually into the Xiangjiang River. Since the 1950s of the 20th century, heavy metals such as Hg, Cd, As, and other heavy metals in the sediment of Xiawan Port in ZZ City have accumulated and precipitated for a long time, and their content far exceeds the limit value in China’s soil environmental quality standards, becoming the most serious and harmful heavy metal pollution area in Hunan Province [9]. In the plan for the prevention and control of heavy metal pollution in the Xiangjiang River Basin, the problem of heavy metal pollution in Zhubu Port and Xiagensi in XT has been listed as a key target for rectification [8]. Therefore, it is necessary to further strengthen the basic research on sediment heavy metal pollution in the lower reaches of the Xiangjiang River.
On the basis of analyzing the distribution characteristics [10] of heavy metals in sediments and the influence of landscape structures [11], the evaluation of the heavy metal pollution degree [12] and corresponding environmental effects [13,14], and the analysis of heavy metal sources and their pollution formation mechanisms, it has been understood that various industrial emissions in the Xiangjiang River basin are the direct causes of sediment heavy metal pollution. Moreover, the enrichment degree [15,16], migration transformation, and enrichment mechanism [17,18] of heavy metals in sediments have been discussed by analyzing the background values of environmental media elements such as rocks (soil) [19], sediments [17], and water bodies [20] in the region. It is realized that in the Xiangjiang River Basin, heavy metals such as Cd, Pb, Zn, Hg, As, etc., have high environmental background values, and thus it is inferred that rock weathering in the source area may also be an important cause of heavy metal accumulation in sediments [16]. However, there are still the following limitations due to the limited experimental analysis techniques: (1) a lack of clear understanding of which types of elements are polluted and the degree of heavy metal pollution in sediments; (2) the unclear issues related to ecological security, such as the development and change trend of heavy metal pollution, making it difficult to obtain corresponding effective measures to prevent and control heavy metal pollution in the lower reaches of the Xiangjiang River.
Therefore, environmental geochemical analysis of heavy metal pollution elements in riverbed sediments in the Changsha, Zhuzhou, and Xiangtan (CS-ZZ-XT) sections of the Xiangjiang River was conducted in this study. The specific objectives of this study were to: (1) explore the enrichment and spatial distribution of chemical elements in sediments by conducting comprehensive environmental geochemical analysis of major and trace elements; (2) evaluate the ecological risk of heavy metal pollution in the Xiangjiang River riverbed sediments by using the Geoaccumulation index, potential ecological risk index, and ecological risk early warning methods; (3) identify the main sources of heavy metals on the basis of principal component analysis; and (4) propose strategies and measures for the prevention and control of sediment heavy metal pollution.
2. Materials and Methods
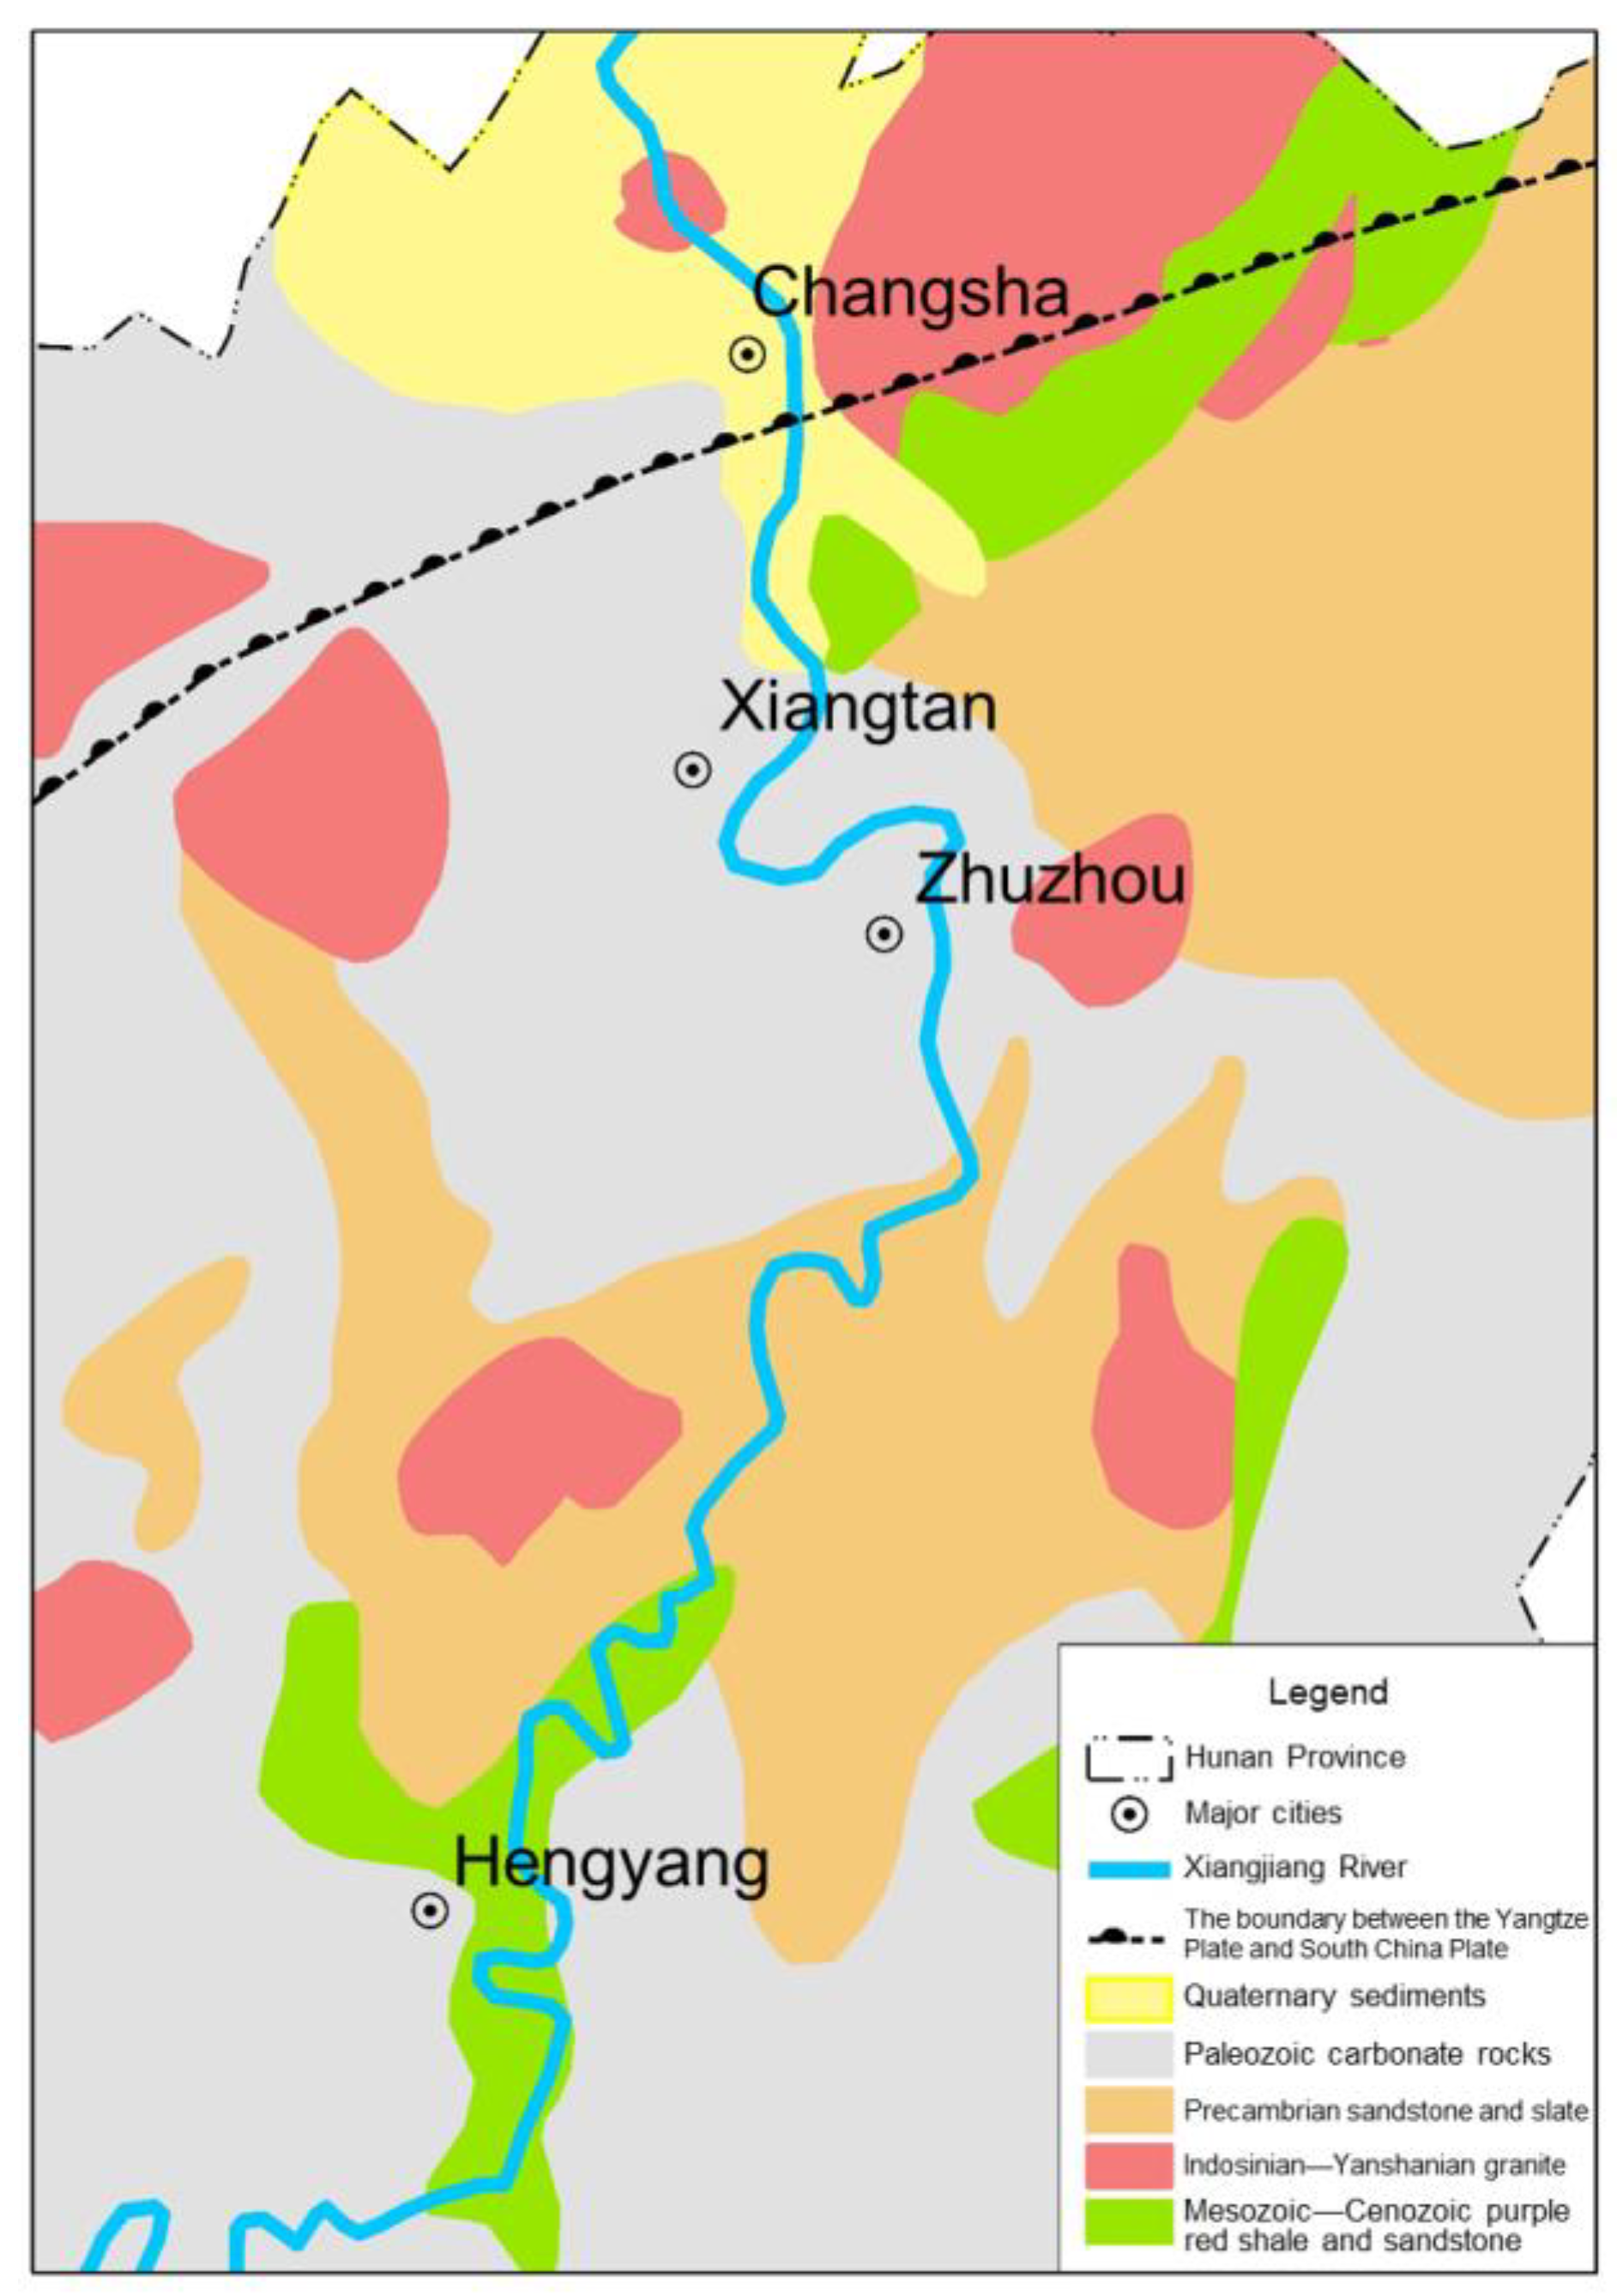
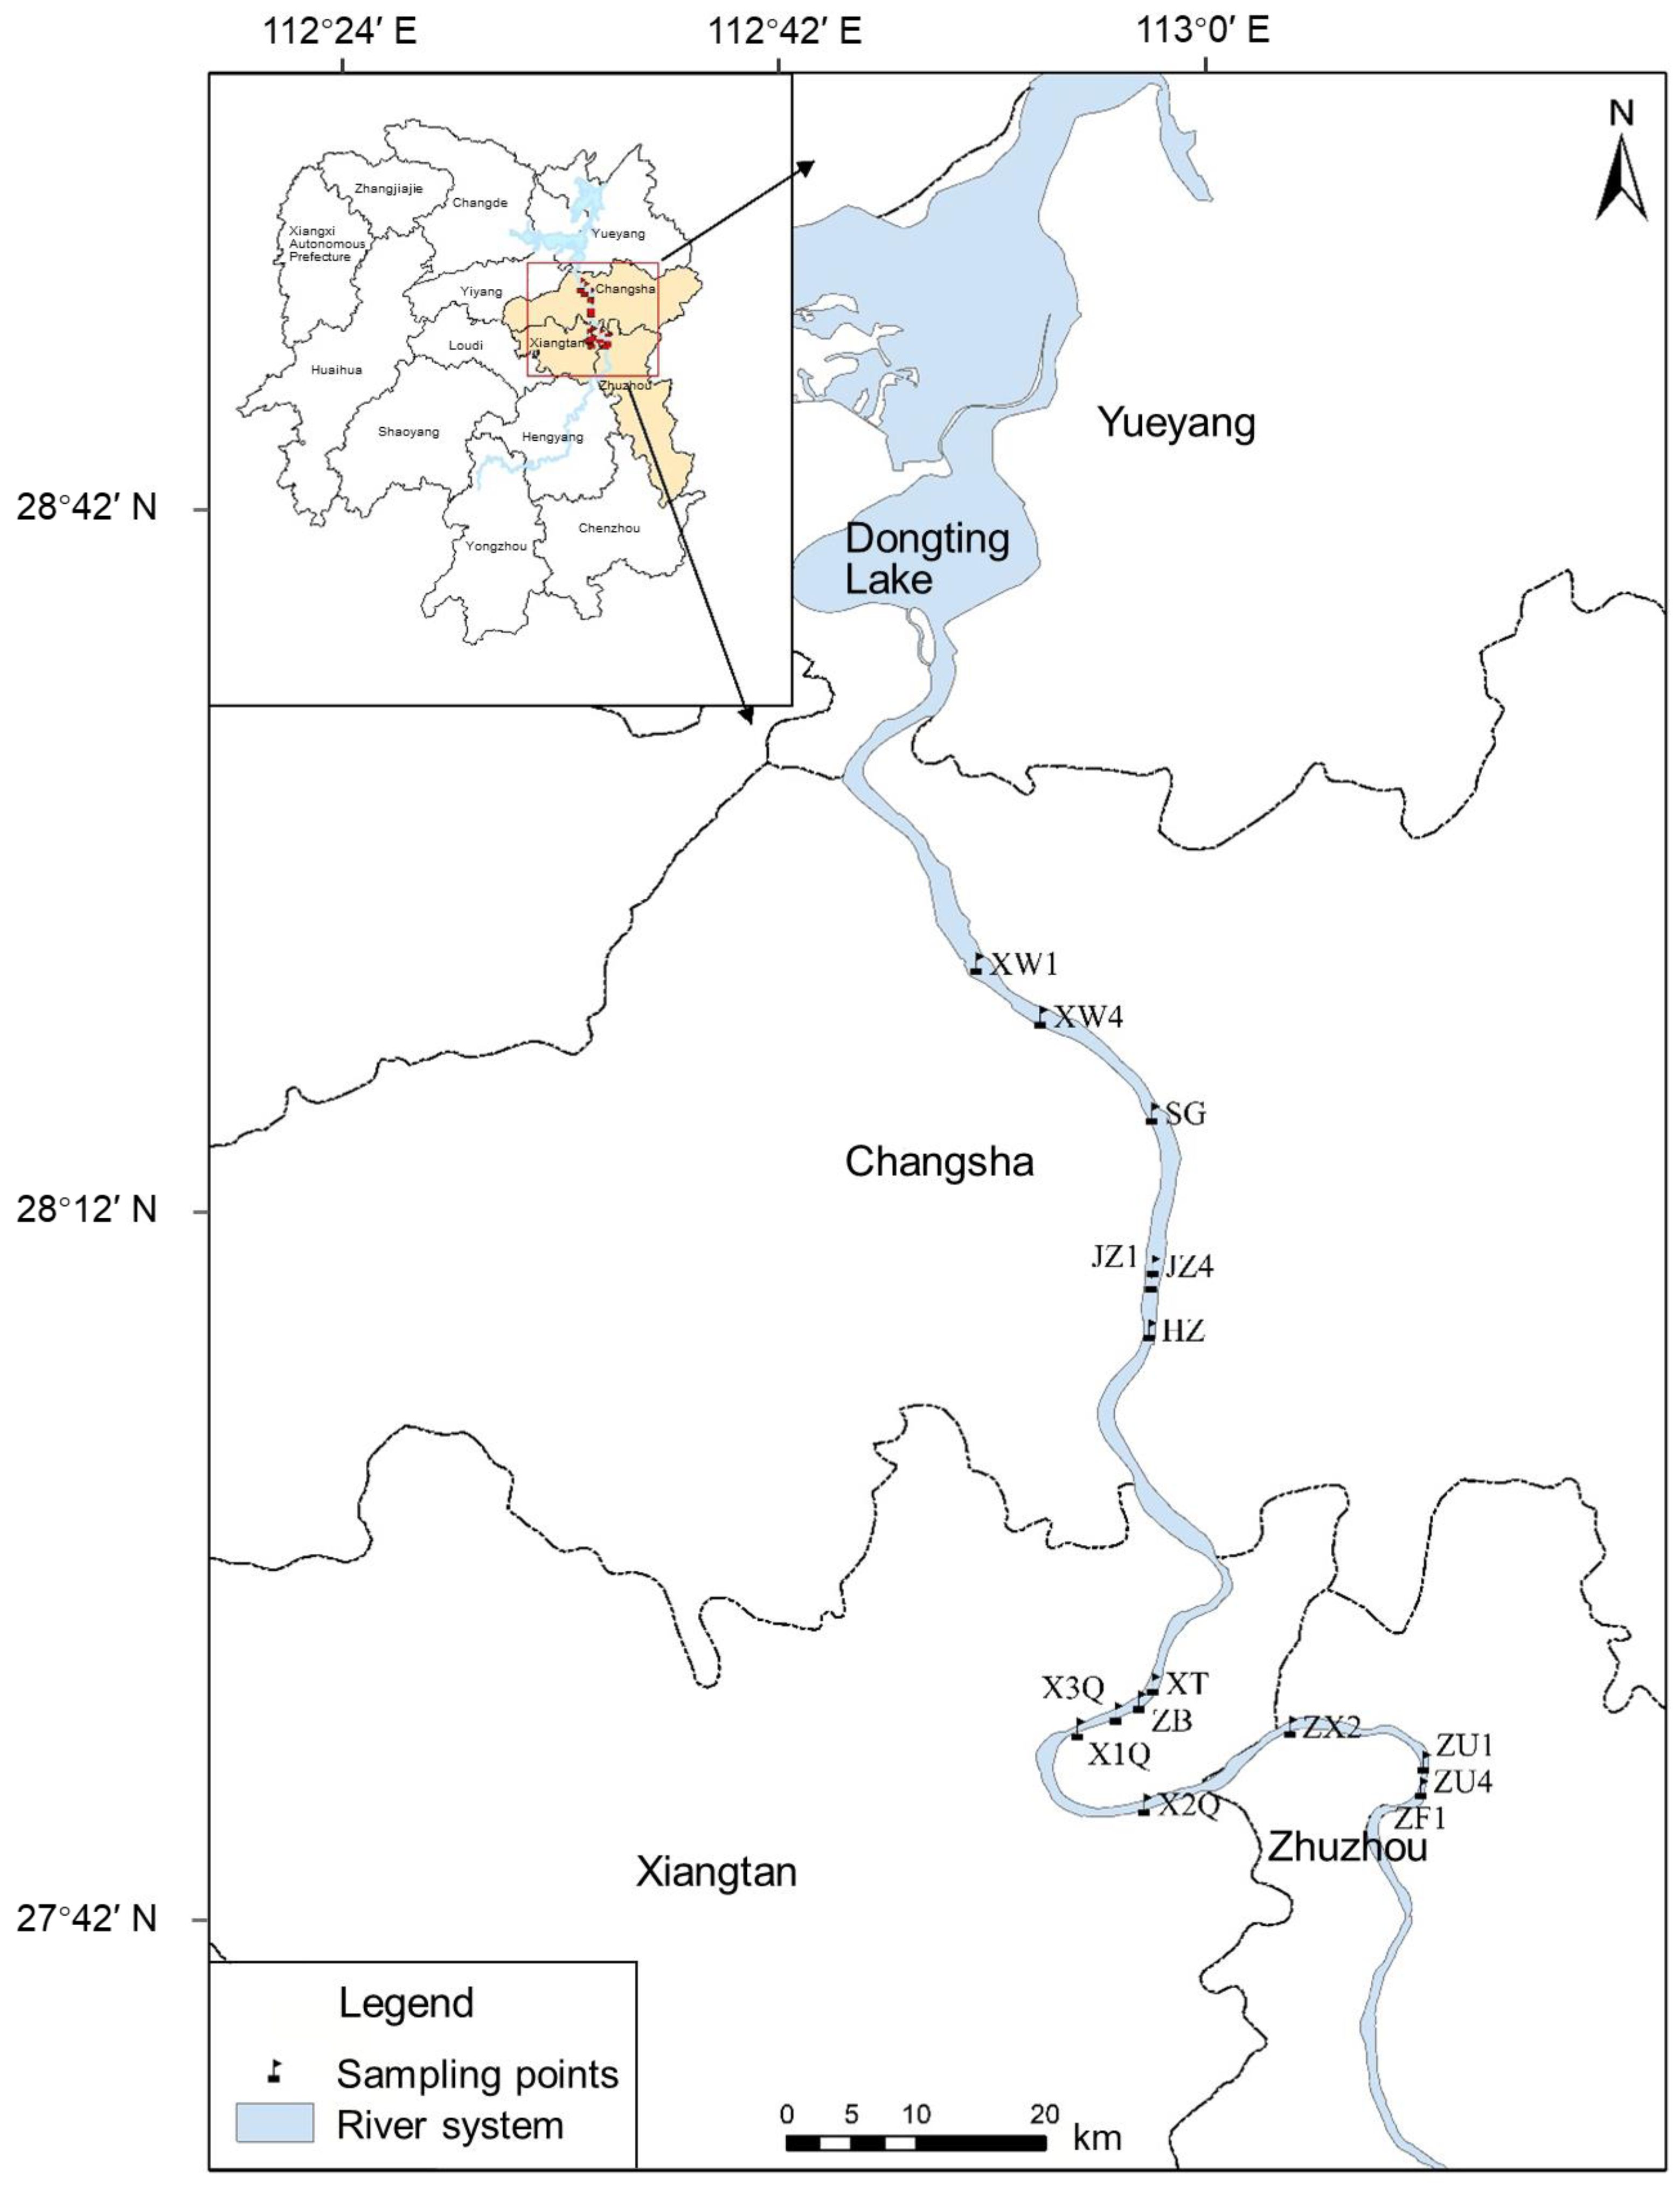
2.1. Study Area
The Xiang River is one of the most important tributaries of the middle reaches of the Yangtze River, with a basin area of 85,383 km2. The basin is dominated by mountains and hills, and the landforms are complex and diverse. Nonferrous metal deposits such as Precambrian metamorphic sand slate, Indosinian Yanshanian granite, Paleozoic carbonate rock, Mesozoic Cenozoic red clastic rock, Quaternary sediments, and Pb-Zn are widely distributed [21,22,23]. In the middle and lower reaches of the Xiangjiang River, the red rock system of the Tertiary period is mainly distributed, which belongs to continental sedimentation. There are more than ten kinds of proven minerals in the basin, such as lead, zinc, sulfur, gold, and silver. Figure 1 shows the simplified geological and geomorphological map of the middle and lower reaches of the Xiangjiang River.
Figure 1.
Simplified geological and geomorphological map of the middle and lower reaches of the Xiangjiang River.
2.2. Sampling, Analysis, and Quality Control
In this study, sediment cores, as sediment samples, were collected by drilling into bed sediments of the Xiangjiang River channel according to the sampling method in our previous study [15]. Sedimentary columns were sampled using plexiglass tubes (with an inner diameter of 65 mm) to collect riverbed sediment samples. Among them, a total of five effective sedimentary columns were obtained from three sampling points in the ZZ River section. A total of seven effective sedimentary columns were collected from five sampling points in the XT River section. A total of six effective sedimentary columns were collected from four sampling points in the CS section. The sampling points from upstream to downstream are shown in Figure 2:
Figure 2.
Locations for sediment cores collected from Zhuzhou (ZZ), Xiangtan (XT), and Changsha (CS) sections from the lower reaches of the Xiangjiang River for this study.
- (1)
- ZZ River section: including three sampling points, namely Glass Factory (ZF), Shifeng Bridge (ZU), and Xiawan (ZX).
- (2)
- XT River section: including five sampling points, namely Xiangtan Second Bridge (X2Q), Xiangtan First Bridge (X1Q), Xiangtan Three Bridges (X3Q), Zhubu Port (ZB), and Fengtan Bridge (XT).
- (3)
- CS River Section: including four sampling points, namely Monkey Stone (HZ1), Orange Island (JZ), Sanchaji (SG), and Xia Ning (XW).
The pretreatment measures for sediment samples were performed according to our previous studies [15,24]. Sediment samples collected in the field were pretreated in the laboratory, first naturally air-dried, then dried in an oven at 40 °C until the weight of the sample did not change. Moreover, the color and composition of the dried sediment samples were observed and recorded again, and the large gravel particles, branches, and debris in the samples were removed. Finally, the odd samples were screened through 300 mesh according to the number, and the even samples were bagged after passing through 200 mesh sieves for later use.
The LOI (loss of ignition) of sediment mainly includes organic matter, sulfide, and moisture. LOI has a significant linear correlation with the sample total organic carbon (TOC); therefore, it was used instead of TOC in the following study [25]. The potassium dichromate (K2Cr2O7)-sulfuric acid (H2SO4) nitrification method was used to determine the value of the LOI. A PW2404 sequential scanning X-ray fluorescence spectrometer (XRF) was used to determine major element concentrations by fusing 0.5 g of powder sample and 4.0 g of LiB4O7 (8 times higher than the sample) under 1150 °C as a glass-disk sample [24]. The precision and accuracy of sample preparation and instruments were checked by the international reference standards for soil (GSS-5 and GSS-7). Trace elements were measured by an inductively coupled plasma mass spectrometry (ICP-MS, Perkin-Elmer Elan 6000, Perkin-Elmer, Norwalk, CT, USA) under the working conditions of: RF 1000~1100 W; the nebulizer adopted a 1.14 L/min flow rate; automatic focusing lens voltage; peak hopping scanning; and 100 ms of integration time, as follows:
- (1)
- Forty milligrams of powdered sample were added into a Teflon container with the addition of a 1:1 HNO3 (0.8 mL) and HF (0.8 mL) mixture and three times HClO4 (about 2.4 mL), followed by a seal and shake ultrasonic for 60 s, and heated at a constant 100 °C temperature for 48 h and then evaporated.
- (2)
- Furthermore, 0.8 mL of HNO3 was added, followed by heating at 100 °C for 24 h and evaporating. Furthermore, after the addition of HF (0.8 mL) and HClO4 (0.8 mL), the treated samples were sealed in an autoclave and put into an oven set to 170 °C for 48 h, where they evaporated to dry.
- (3)
- Finally, the treated samples were put into the oven at 170 °C for 4 h after adding 4 mL of 4N HNO3. After that, the mixture was diluted with HNO3 (3%), transferred into a 50 mL volumetric flask, and then used as an internal standard solution for Rh-Re, diluted with 1% HNO3 to 40 g, and reserved for the following ICP-MS analysis.
The precision and accuracy of sample preparation and instruments for trace element determination were determined by seven repeated parallel tests using the national standard sample GSR-3 with a detection limit of 10 × 10−9 [26]. Results showed that the relative standard deviation of all trace elements was significantly less than 5.00% [15].
2.3. Enrichment of Heavy Metals
The Enrichment Factor (EF) can be used to evaluate the source of heavy metals and the degree of heavy metal pollution in sediments. The EF was originally used to identify the source of chemical element pollution in Antarctic atmospheric particulate matter [27] and was later also used to evaluate the degree of heavy metal pollution. The evaluation objects include the atmosphere, soil, ice and snow, river sediments (sediment), plants, etc. The EF can be calculated according to Equation (1).
where Ci represents the calculated content of heavy metal element i and Xj represents the content of reference element j. s represents the ratio of heavy metal elements to reference elements in the sediment, and b represents their reference background values. Although Al2O3 exhibited obvious (fine-grained clay mineral) particle size effects, according to the study area, which spans three long river sections of CS-ZZ-XT, in the entire study area, affected by the uncertainty of natural sources and man-made sources, the linear correlation with the obvious particle size effects of SiO2 (coarse-grained clastic mineral) is not obvious; therefore, Al was not selected as the reference element. Element Y (yttrium, a rare earth metal element) is chemically stable, has no obvious particle size effect, and is more suitable as a reference element, so Y was selected as the reference element. Since the Xiang River is a tributary of the Yangtze River, the sediment element content value of the Yangtze River was selected as the background value. In general, EF < 1 is non-polluting, 1 ≤ EF < 2 is mildly polluted, 2 ≤ EF < 5 is moderately polluted, 5 ≤ EF < 20 is significant pollution, 20 ≤ EF < 40 is strongly polluted, and EF ≥ 40 is extremely strong [28].
2.4. Ecological Assessment of Heavy Metals
2.4.1. Geoaccumulation Index
The Geoaccumulation index (Igeo) is a method first proposed by Muller in 1969 for evaluating the pollution of heavy metals. It can quantitatively evaluate the degree of heavy metal pollution in sediments of the water environment and can also consider the background value changes caused by natural diagenesis, human factors, and geochemical background values [29]. The Geoaccumulation index can be calculated according to Equation (2).
where Ci is the content of the evaluated element i in the sediment and Bi is the environmental background value of the evaluated element. K is a factor taken to account for changes in background values that may be caused by differences in rocks in different places (generally 1.5). According to the value of Igeo, the sediment heavy metal pollution level was identified as having different degrees (Table S1).
2.4.2. Potential Ecological Risk Index
Hakanson [30] proposed the ecological risk index in 1980, which can assess the enrichment degree of heavy metals in sediments relative to background values, and the weighted sum with ecotoxicity coefficients, which was used to evaluate the ecological risk of heavy metals in sediments (Equations (3)–(5)).
where represents the ecological hazard index of the ith heavy metal, is the measurement value of the ith heavy metal, is the background value of the ith heavy metal, is the potential ecological risk coefficient of the ith heavy metal, is the toxicity coefficient of the ith heavy metal (Table S2), and RI is the potential ecological risk index of a variety of heavy metals. The division criteria for and RI are shown in Table S3 [30].
2.4.3. Ecological Risk Index
Ecological risk early warning based on the ecological risk early warning index method [31] is an effective way to warn about the ecological risk of heavy metals in sediments in a certain region. The ecological risk index (IER) can be calculated by Equation 6, after which the risk warning can be carried out based on its corresponding risk category and impact degree (Table S4).
where IER represents the ecological risk warning index after heavy metal i exceeds the local critical limit. CAi and CRi represent the actual measured mass fraction of heavy metal i and the local background reference ratio (mg/kg), respectively. In this study, the corresponding background values in the Yangtze River sediment (Table S2) were used for calculation and analysis. By summing the IERi of n heavy metals, the IER of the heavy metals in the region can be obtained.
3. Results and Discussion
3.1. Physical and Chemical Properties of Sediments
According to Table 1, it was found that three elements (SiO2, Al2O3, and Fe2O3) accounted for about 82~86% of the total number of main elements. The percentage of major elements and the ratio of Na2O/K2O, SiO2/Al2O3, Fe2O3/K2O revealed that the content of TiO2, K2O, MgO, Fe2O3, and SiO2 in the sediment of the Changsha (CS) section of the Xiangjiang River was relatively stable (CV < 0.20), while the content of P2O5, MnO, Na2O, CaO, and LOI changed significantly (CV > 0.20). The changes in elemental content of riverbed sediments in the XT section were similar to those in the CS section; except for the relatively stable content of MgO (CV < 0.20), the content of other elements varies greatly, including CaO (CV = 1.104) and Fe2O3 (CV = 1.0). Compared to the average upper continental crust from eastern China (UCC) [32] (Table 1), the sediments of the CS-ZZ-XT sections exhibited the enrichment of TiO2, Fe2O3, MnO, P2O5, and LOI and the loss of MgO, CaO, and Na2O. Additionally, the ZX point data had the largest variation of all the sampling points.
Table 1.
The analysis results of the major element contents (%) of riverbed sediments in CS-ZZ-XT sections of the Xiangjiang River.
Specifically, as shown in Table S5, in the ZZ section, the largest change in SiO2 content was in ZX sedimentary column samples (CV = 0.23). The largest change in TiO2 content was also in the ZX sedimentary column samples (CV = 0.49), and it was also the highest among all sedimentary column samples in the ZZ section. The largest changes in Al2O3 (CV = 0.28) and Fe2O3 (CV = 0.51) and MnO, MgO, CaO, K2O, Na2O, P2O5, and LOI contents were also observed in ZX column samples. In the XT section, the largest change in SiO2 (CV = 0.09), Al2O3 (CV = 0.24), and Fe2O3 (CV = 0.16) content was observed in X1Q column samples, while the largest change in TiO2 content (CV = 0.12) was in ZB sedimentary column samples. In the CS section, the largest changes in SiO2 (CV = 0.11), Al2O3 (CV = 0.24), and Fe2O3 (CV = 0.17) were observed in SG, where the content of SiO2 was also the highest among all sedimentary column samples in ZZ deposition column samples, with the change interval between [57.8, 78.07]. Additionally, the largest change in TiO2 content was in XW sedimentary column samples (CV = 0.10).
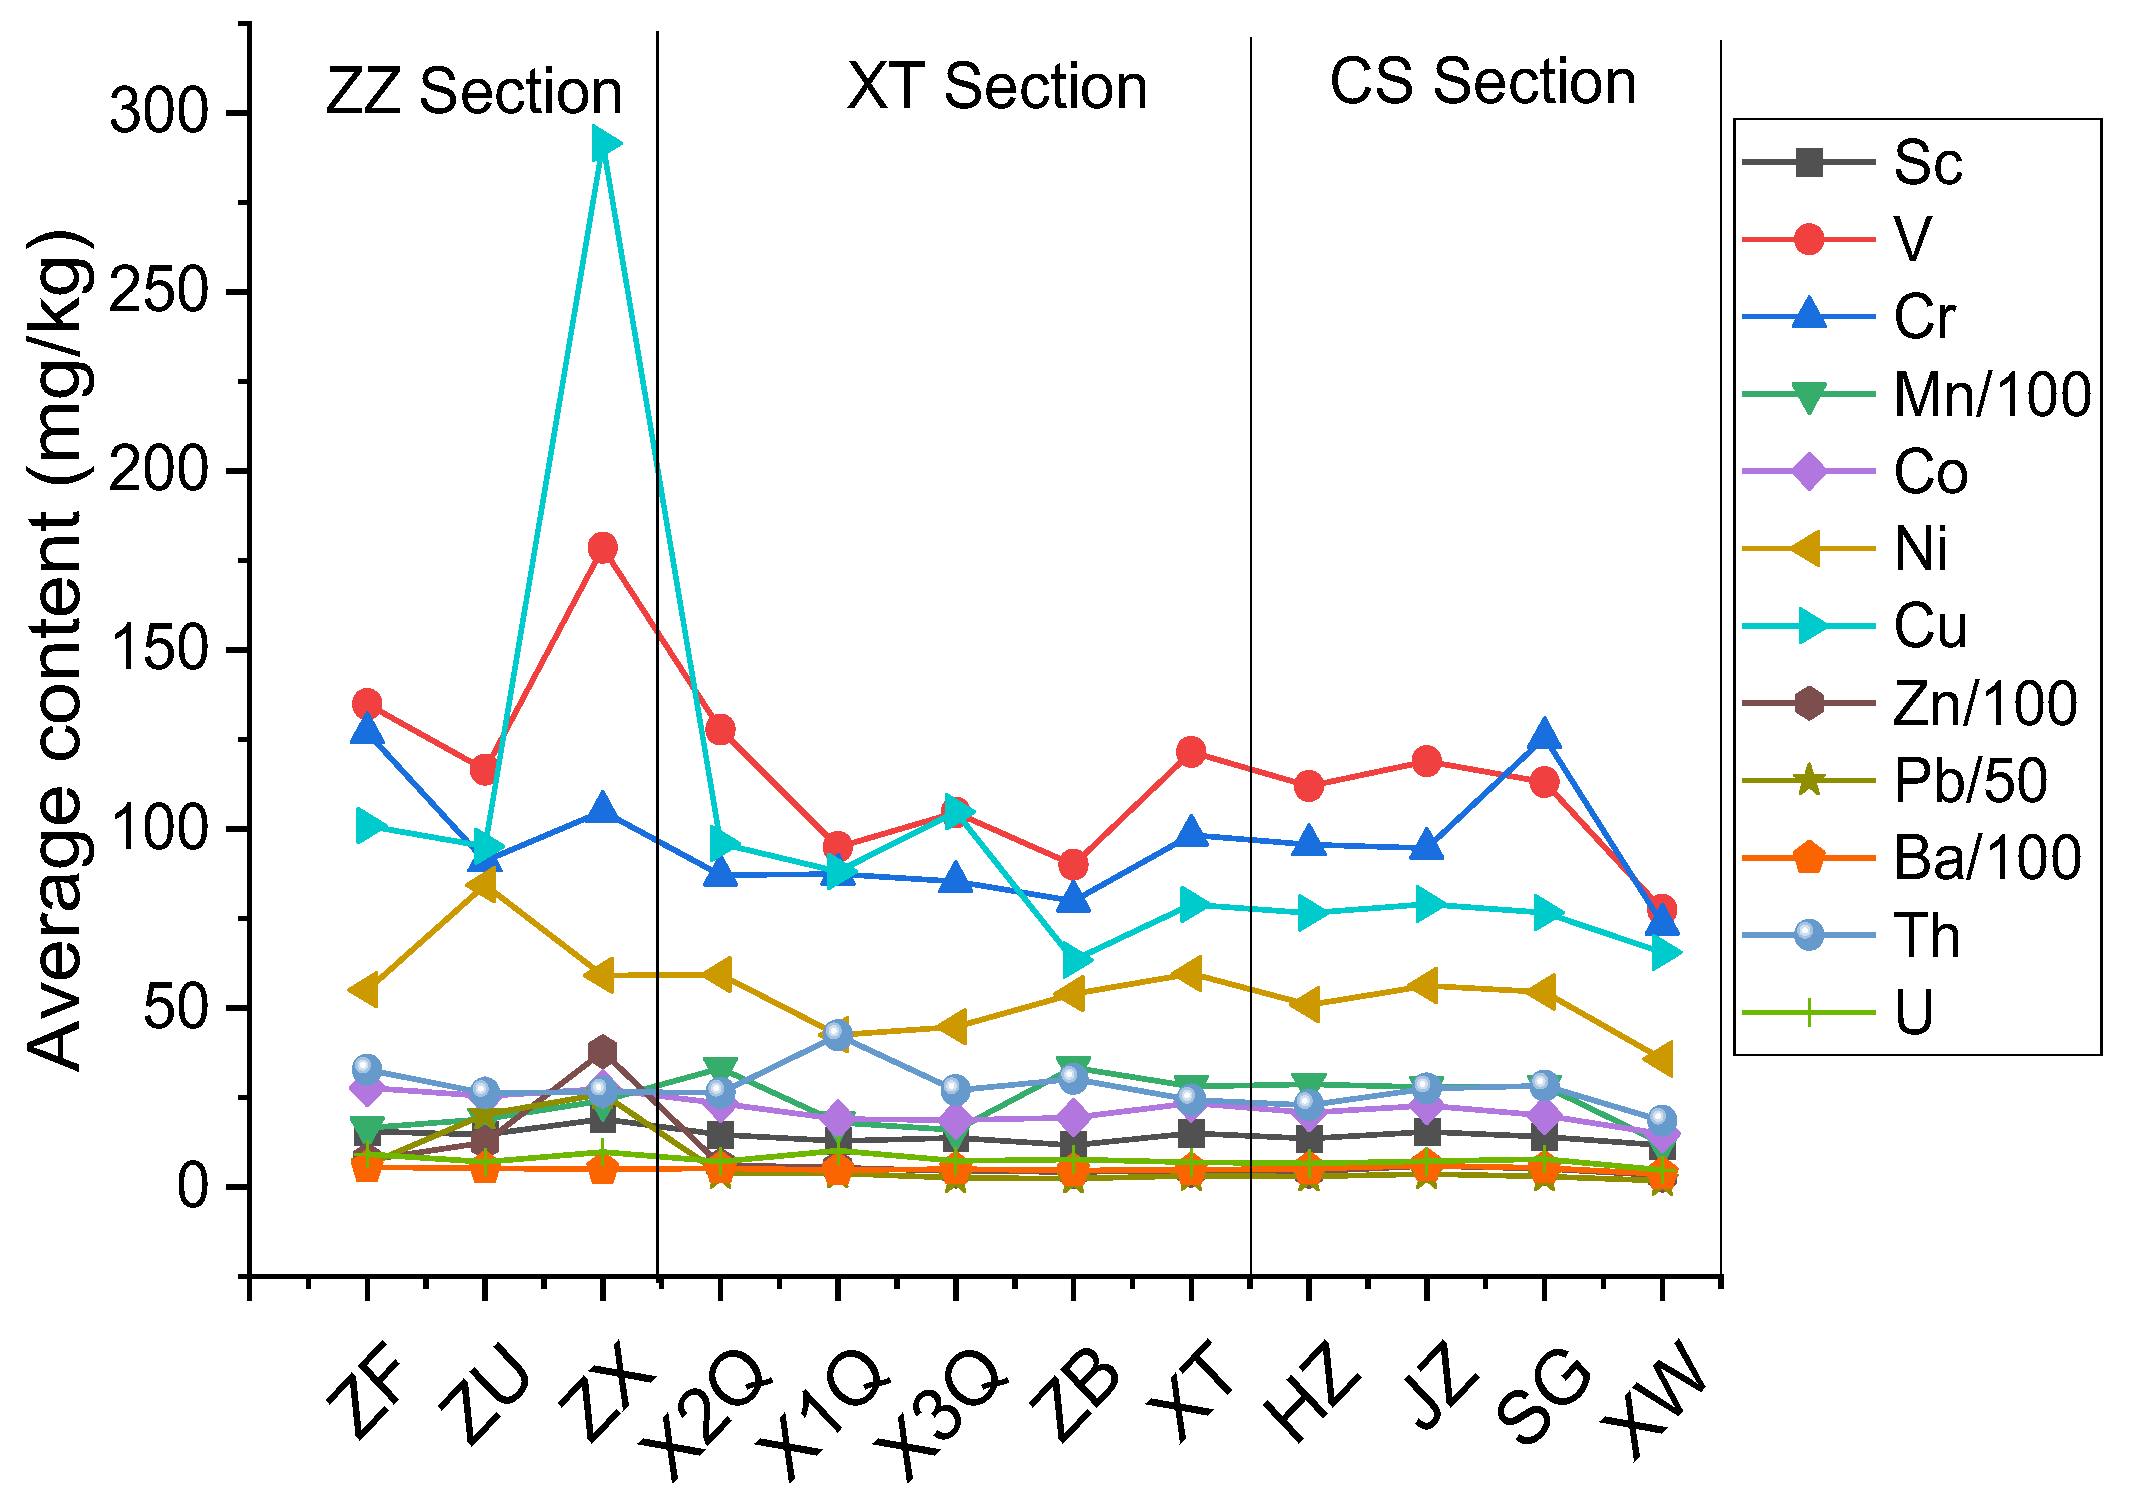
3.2. Distribution of Heavy Metals
Heavy metal elements are generally referred to as metal (including semi-metal) elements with an elemental density of >4.5 g/cm3 under standard conditions (another is a metal element with a density of >5 g/cm3 in geological bodies, which is mentioned here to distinguish it from light metals such as Al and Mg). According to the elemental density, various natural metal elements and semi-metal elements from 23 V to 94 Pu are in the category of heavy metals. Due to classification differences and differences in physiological toxicity, about 54 kinds of heavy metal elements exist in nature and are classified as rare earth metals (discussed in the following special chapter) or transition metals (also known as poor metals or semimetals). However, the heavy metals that are really of interest in environmental science are mainly scandium (Sc), vanadium (V), chromium (Cr), cobalt (Co), manganese (Mn), copper (Cu), lead (Pb), zinc (Zn), cadmium (Cd), thallium (Tl), thorium (Th), bismuth (Bi), uranium (U), and mercury (Hg) [33]. Alkaline earth metal barium (Ba) belongs to group IIA elements in the periodic table, which can cause chemical activity and make it easy for other substances to produce toxic and harmful compounds and harm the ecosystem. Therefore, in the present study, Ba was also considered in the category of heavy metal elements in the following heavy metal pollution evaluation. The sources of heavy metal pollution in the sediments of rivers and lakes are mainly divided into two categories: natural sources and anthropogenic sources. Natural sources mainly refer to the sediments receiving heavy metals released from rocks in the source area under various epigenetic effects without being disturbed by human factors. Anthropogenic sources refer to the accumulation of heavy metal elements in sediments caused by various anthropogenic activities, which generally include production pollution sources from industrial and mining enterprises, urban life pollution sources, and fuel combustion pollution sources.
Restricted by the collected samples and experimental conditions, heavy metal elements such as Sc, V, Cr, Mn, Co, Ni, Cu, Zn, Pb, Ba, Th, and U were mainly discussed in this study, and their contents were shown in Table 2. The content of heavy metal elements in the ZZ section was as follows: Sc (8.52~33.980 mg/kg), V (28.72~591.3 mg/kg), Cr (12.87~300.2 mg/kg), Mn (670.5~4560 mg/kg), Co (11.39~94.72 mg/kg), Ni (28.66~521.2 mg/kg), Cu (55.95~751.8 mg/kg), Zn (244.6~8172 mg/kg), Pb (131.6~7186 mg/kg), Ba (221.2~829 mg/kg), Th (16.51~48.46 mg/kg), and U (5.534~22.01 mg/kg). The content of heavy metal elements in the XT section was: Sc (10.09~18.51 mg/kg), V (71.26~162.5 mg/kg), Cr (59.19~116.1 mg/kg), Mn (539.2~6736 mg/kg), Co (14.05~28.06 mg/kg), Ni (30.81~76.44 mg/kg), Cu (45.16~394.6 mg/kg), Zn (187.2~882.5 mg/kg), Pb (71.71~415.5 mg/kg), Ba (385.2~707.6 mg/kg), Th (19.66~54.64 mg/kg) and U (5.462~12.5 mg/kg). The content of heavy metal elements in the CS section was as follows: Sc (8.556~17.77 mg/kg), V (55.8~184.1 mg/kg), Cr (44.5~212.7 mg/kg), Mn (809.4~5251 mg/kg), Co (10.72~26.79 mg/kg), Ni (25.55~93.45 mg/kg), Cu (44.23~205.2 mg/kg), Zn (212~1121 mg/kg), Pb (64.98~306.1 mg/kg), Ba (272.4~752.9 mg/kg), Th (11.51~49.7 mg/kg), and U (3.241~10.81mg/kg).
Table 2.
Statistical results of heavy metals (mg/kg) in the riverbed sediments in the CS, XT, and ZZ sections of the Xiangjiang River.
The heavy metal content of each sedimentary column in CS-ZZ-XT sections of the Xiangjiang River was analyzed, as shown in Table 2. The significant variations in heavy metal content in the ZZ section included Co (CV = 0.70), Ni (CV = 1.33), Zn (CV = 1.36), and Pb (CV = 1.85) in the ZU sedimentary column, and V (CV = 0.72), Cr (CV = 0.72), Cu (CV = 0.79), and Pb (CV = 1.07) in the ZX sedimentary column. The variation of Cu (CV = 0.84) content in the X3Q sedimentary column of the Xiangtan River section was abnormally significant. The significant variation contents were observed in: Cu (CV = 0.62) in the ZU sedimentary column; Mn (CV = 0.48) and U (CV = 0.40) in the ZX sedimentary column of the ZZ section; Pb (CV = 0.56) in the X1Q sedimentary column; Mn (CV = 0.56) and Zn (CV = 0.53) in the X3Q sedimentary column of the XT section; Mn in the ZB sedimentary column (CV = 0.43) of the XT section; Zn (CV = 0.43) in the SG column of the CS section.
From the overall situation of CS-ZZ-XT sections (Figure 3), the heavy metal elements of each sedimentary column in the ZZ section had significant variation, and the content of some heavy metals was much higher than that of other sedimentary columns in other river sections (such as Zn content: Zn content values of ZU and ZX columns were 1244.52 and 3781.01 mg/kg, respectively, while in comparison, the Zn content of each column in XT and CS sections was less than 650 mg/kg), followed by the XT section. The heavy metal content in the sediment column of the CS section was generally the lowest. The result implied the obvious effects of anthropogenic activities (metal mineral processing, metal product smelting, wastewater discharge in industrial parks, etc.) on the content of heavy metal elements in the ZZ section. According to the average content of heavy metals in each sedimentary column in the CS, ZZ, and XT sections of the Xiangjiang River (Figure 3), the average content of heavy metals in the ZZ section was significantly higher than that in the XT section and the CS section. The Cr content of the SG sedimentary column (Hexi Sanchaji Bridge) in the CS section was abnormally high, which may be related to the discharge of the former Changsha Chromium Salt Plant (Hexi Sanchaji Industrial Zone).
Figure 3.
Average content of heavy metals in the riverbed sediments in the CS, ZZ, and XT sections of the Xiangjiang river.
The vertical distribution of heavy metal elements in sedimentary columns can reflect the history of river pollution and is also an important study for analyzing watershed pollution. The vertical distribution of heavy metals in 12 sedimentary columns in the CS-ZZ-XT sections of the Xiangjiang River is shown in Figure S1. Considering the high contents of Mn, Zn, Pb, and Ba elements in each sedimentary column, they were drawn by Mn/100, Zn/100, Pb/50, and Ba/100 values in Figure S1, respectively, to significantly show the difference and facilitate comparison. In the ZZ section, the significantly vertical change of heavy metal content included: Cr, V, Cu, and Ni of the ZF sedimentary column; Ni, Cu, V, and Cr of the ZU sedimentary column; and Cu, V, and Cr of the ZX sedimentary column. In the XT section, the significantly vertical change of heavy metal content included: V, Cu, Cr, and Ni of the X2Q sedimentary column; V, Cu, and Cr of the X1Q sedimentary column; Cu, V, Cr, and Ni of the X3Q column; V, Cr, Cu, and Ni of the ZB column; and V, Cr, Cu, and Ni of the XT column. In the CS section, the significantly vertical change of heavy metal content included: Cu, V, Cr, and Ni of the HZ column; V, Cr, Cu, and Ni of the JZ column; Cr, V, Cu, and Ni of the SG column; and Cr, V, Cu, and Ni of the XW column. In summary, in the sediment of CS-ZZ-XT sections, the vertical distribution of heavy metal contents of Sc, Co, Th, and U was relatively uniform, and the heavy metal elements with significant vertical distribution changes mainly included Cr, V, Cu, and Ni.
The enrichment factor (EF) is commonly used to evaluate the source and degree of heavy metal contamination in sediments. The EF value of heavy metals in each sedimentary column of the ZZ section has been shown in Figure 4a and Figure S2. For the ZX column, Zn (EF = 26.64) and Pb (EF = 23.29) reached strong pollution, Cu (EF = 4.05) reached moderate pollution, and Mn (EF = 1.73), Th (EF = 1.16), and U (EF = 1.93) reached mild pollution. For the ZU column, the Zn (EF = 10.91) and Pb (EF = 25.78) reached significant pollution, and the Mn (EF = 1.61), Ni (EF = 1.64), Cu (EF = 1.84), Th (EF = 1.43), and U (EF = 1.82) reached mild pollution. For the ZF column, Zn (EF = 5.85) and Pb (EF = 7.02) reached significant pollution, U (EF = 2.17) reached moderate pollution, and Mn (EF = 1.26), Co (EF = 1.00), Ni (EF = 1.03), Cu (EF = 1.77), and Th (EF = 1.62) reached mild pollution.
Figure 4.
Box plot of enrichment coefficient of heavy metal in the riverbed sediments in (a) Zhuzhou, (b) Xiangtan, (c) Changsha sections, and (d) the stacked map in sediments of the Xiangjiang River.
The EF value of the XT section is shown in Figure 4b and Figure S3. For the XT column, Mn (EF = 2.49), Zn (EF = 4.20), and Pb (EF = 4.11) reached moderate pollution, and Co (EF = 1.00), Ni (EF = 1.31), Cu (EF = 1.62), Th (EF = 1.41), and U (EF = 1.91) reached mild pollution. For the ZB column, Mn (EF = 2.58), Zn (EF = 3.53), and Pb (EF = 2.86) reached moderate pollution, and Ni (EF = 1.07), Cu (EF = 1.19), Th (EF = 1.49), and U (EF = 1.83) reached mild pollution. For the X3Q column, the Zn (EF = 3.66) and Pb (EF = 3.08) reached moderate pollution, while the Mn (EF = 1.27), Cu (EF = 1.97), Th (EF = 1.41), and U (EF = 1.82) reached mild pollution. For the X1Q column, the Zn (EF = 3.40) and Pb (EF = 3.57) reached moderate pollution, and the Mn (EF = 1.06), Cu (EF = 1.24), Th (EF = 1.60), and U (EF = 1.83) reached mild pollution. For the X2Q column, only Zn (EF = 5.19) reached significant pollution, followed by the moderate pollution of Mn (EF = 2.68) and Pb (EF = 4.48), and the mild pollution of Ni (EF = 1.18), Cu (EF = 1.80), Th (EF = 1.40), and U (EF = 1.80).
The EF value of heavy metals in each sedimentary column of the CS section was shown in Figure 4c and Figure S4. For the deposited core XW, Zn (EF = 4.08) and Pb (EF = 3.14) reached moderate pollution, and Mn (EF = 1.45), Ni (EF = 1.06), Cu (EF = 1.82), Th (EF = 1.45), and U (EF = 1.77) reached mild pollution. For the SG column, Mn (EF = 2.25), Cu (EF = 4.24), Pb (EF = 3.54) reached moderate pollution, and Ni (EF = 1.07), Cu (EF = 1.43), Th (EF = 1.47), and U (EF = 1.94) reached mild pollution. For the JZ column, only Zn (EF = 5.08) reached significant pollution, with the moderate pollution of Mn (EF = 2.31) and Pb (EF = 4.49), and the mild pollution of Ni (EF = 1.15), Cu (EF = 1.52), Th (EF = 1.47), and U (EF = 1.82). For the HZ column, moderate pollution was observed for Mn (EF = 2.63), Zn (EF = 4.14), and Pb (EF = 3.94), while mild pollution was observed for Ni (EF = 1.14), Cu (EF = 1.60), Th (EF = 1.36), and U (EF = 1.86).
From the overall heavy metal contamination of the studied sections (CS-ZZ-XT) of the Xiangjiang River (Figure 4d), the concentration of heavy metal elements in sediments in the ZZ section was significantly higher than that in the XT and CS river sections, and the concentration of heavy metals in the ZU and ZX sedimentary columns in the ZZ section was abnormal, which deserved further attention.
3.3. Assessment of Heavy Metal Pollution and Potential Ecological Risk
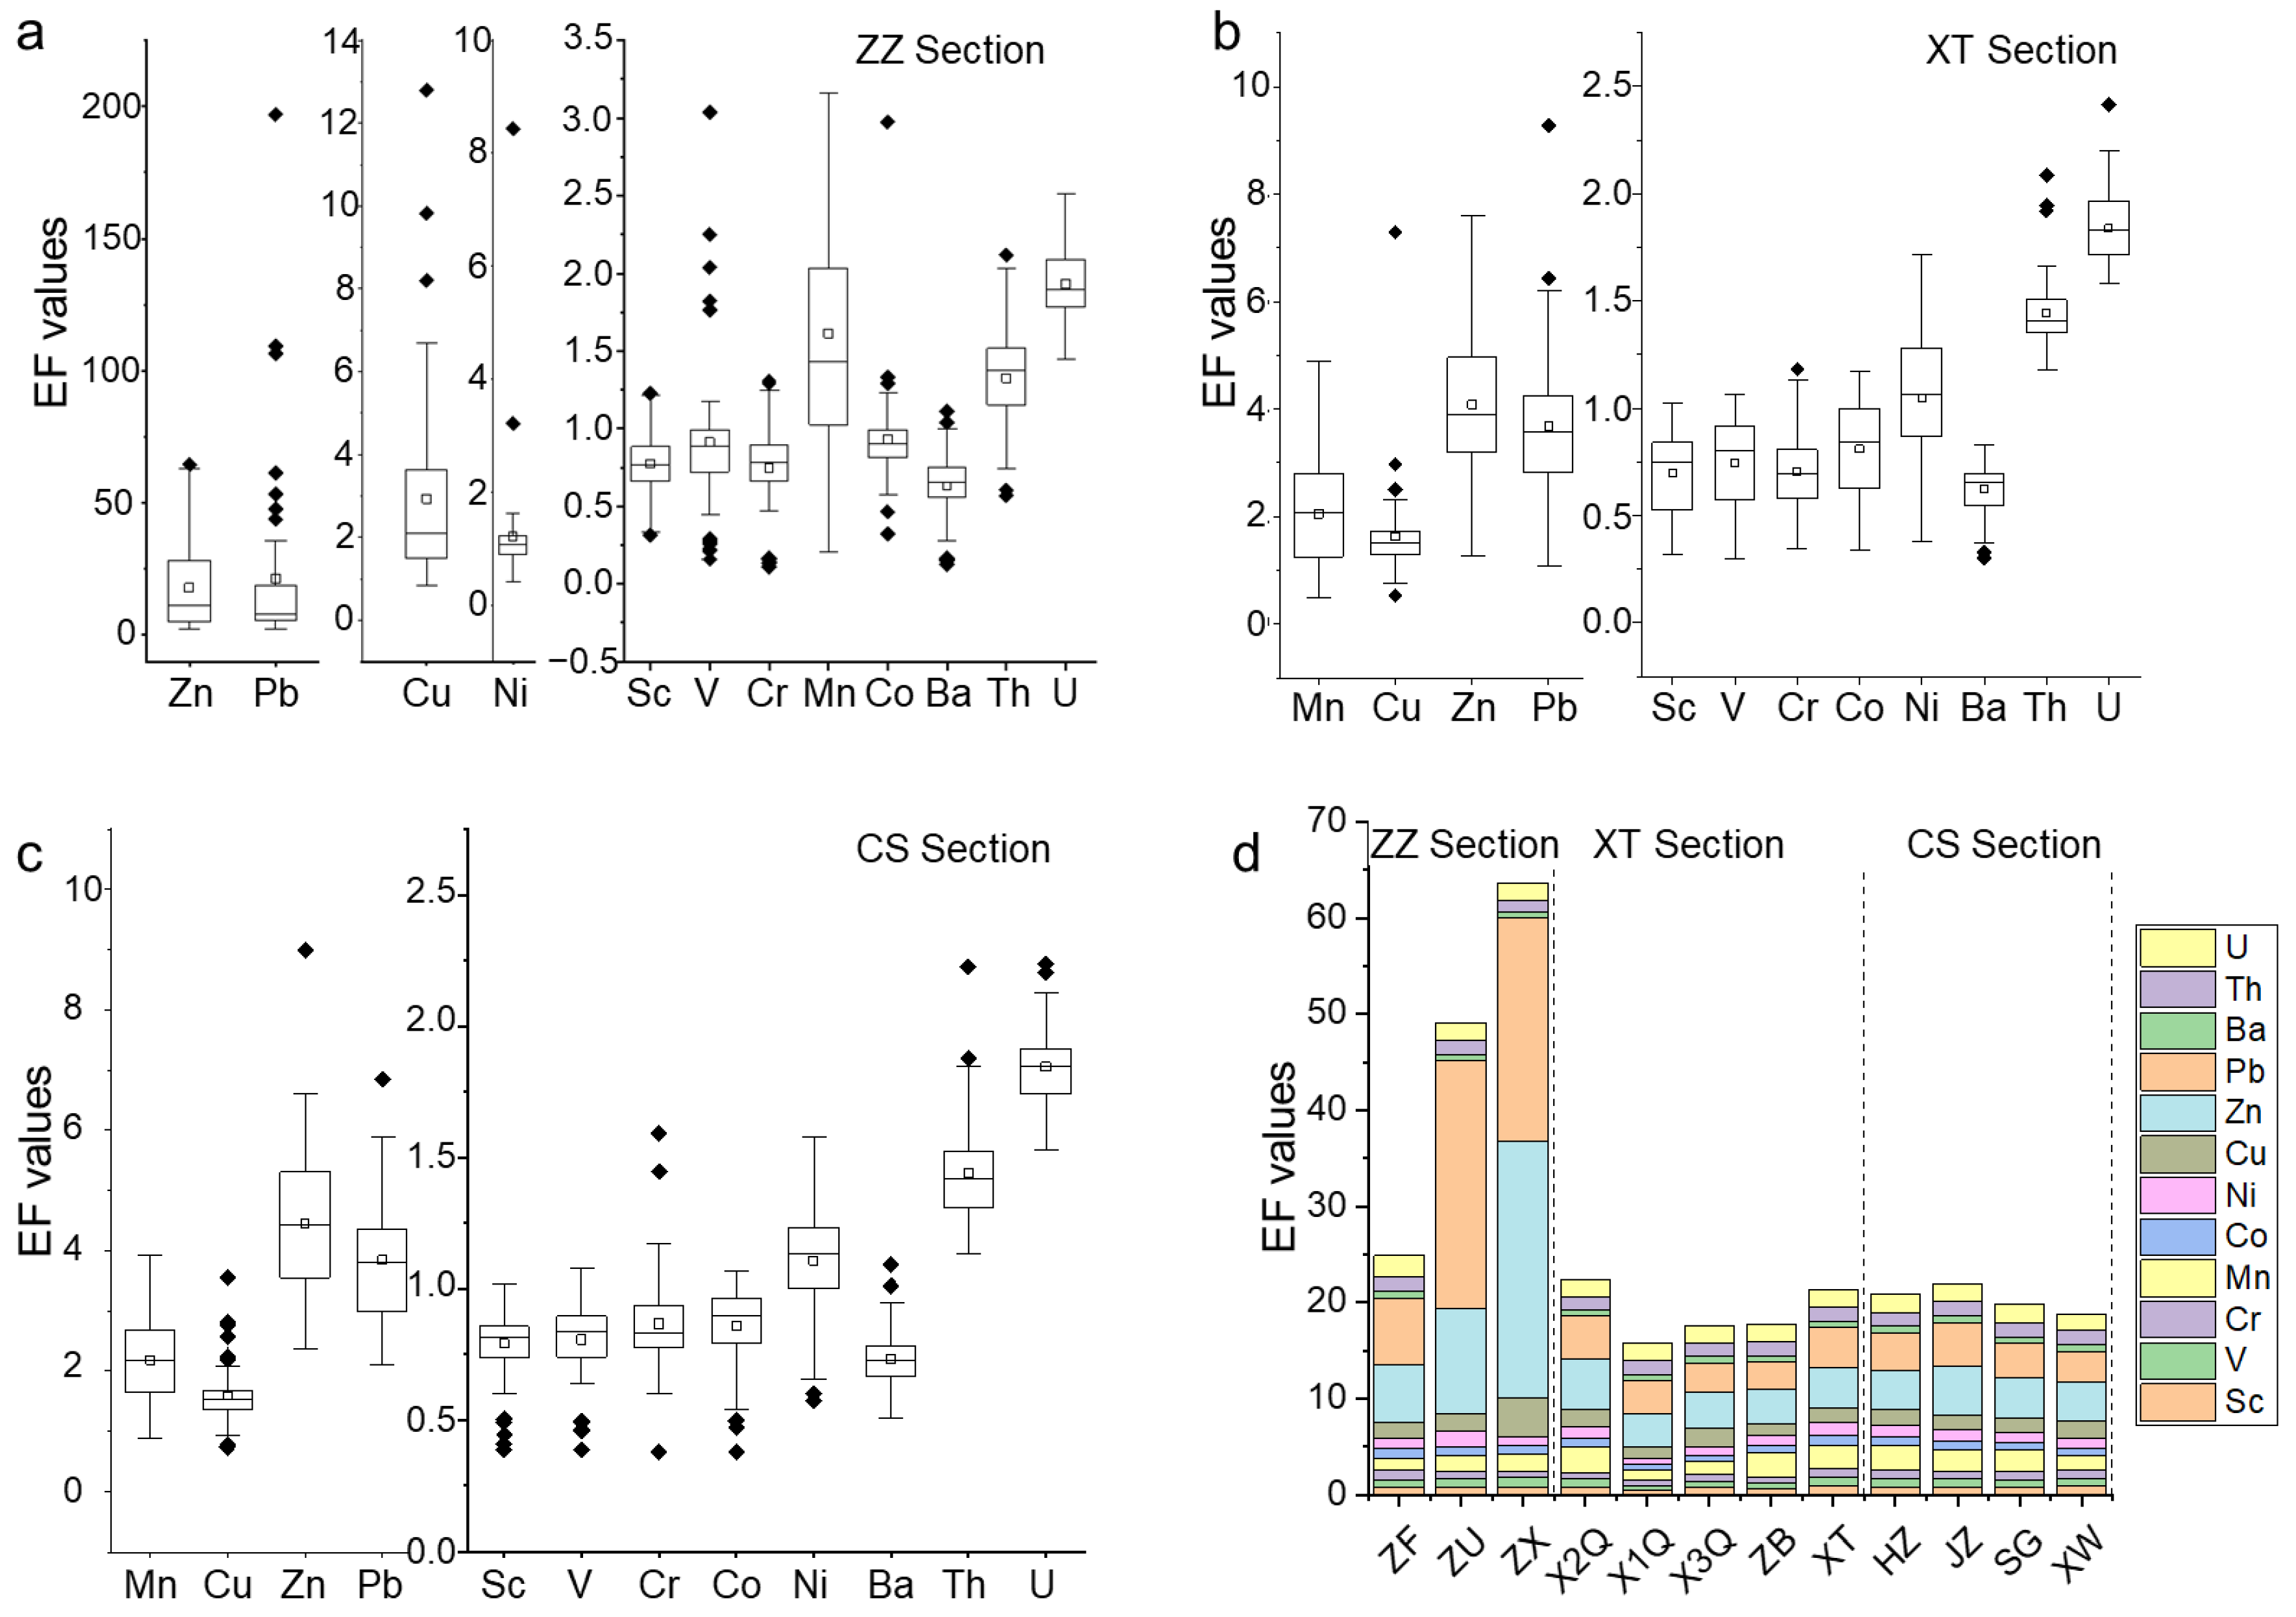
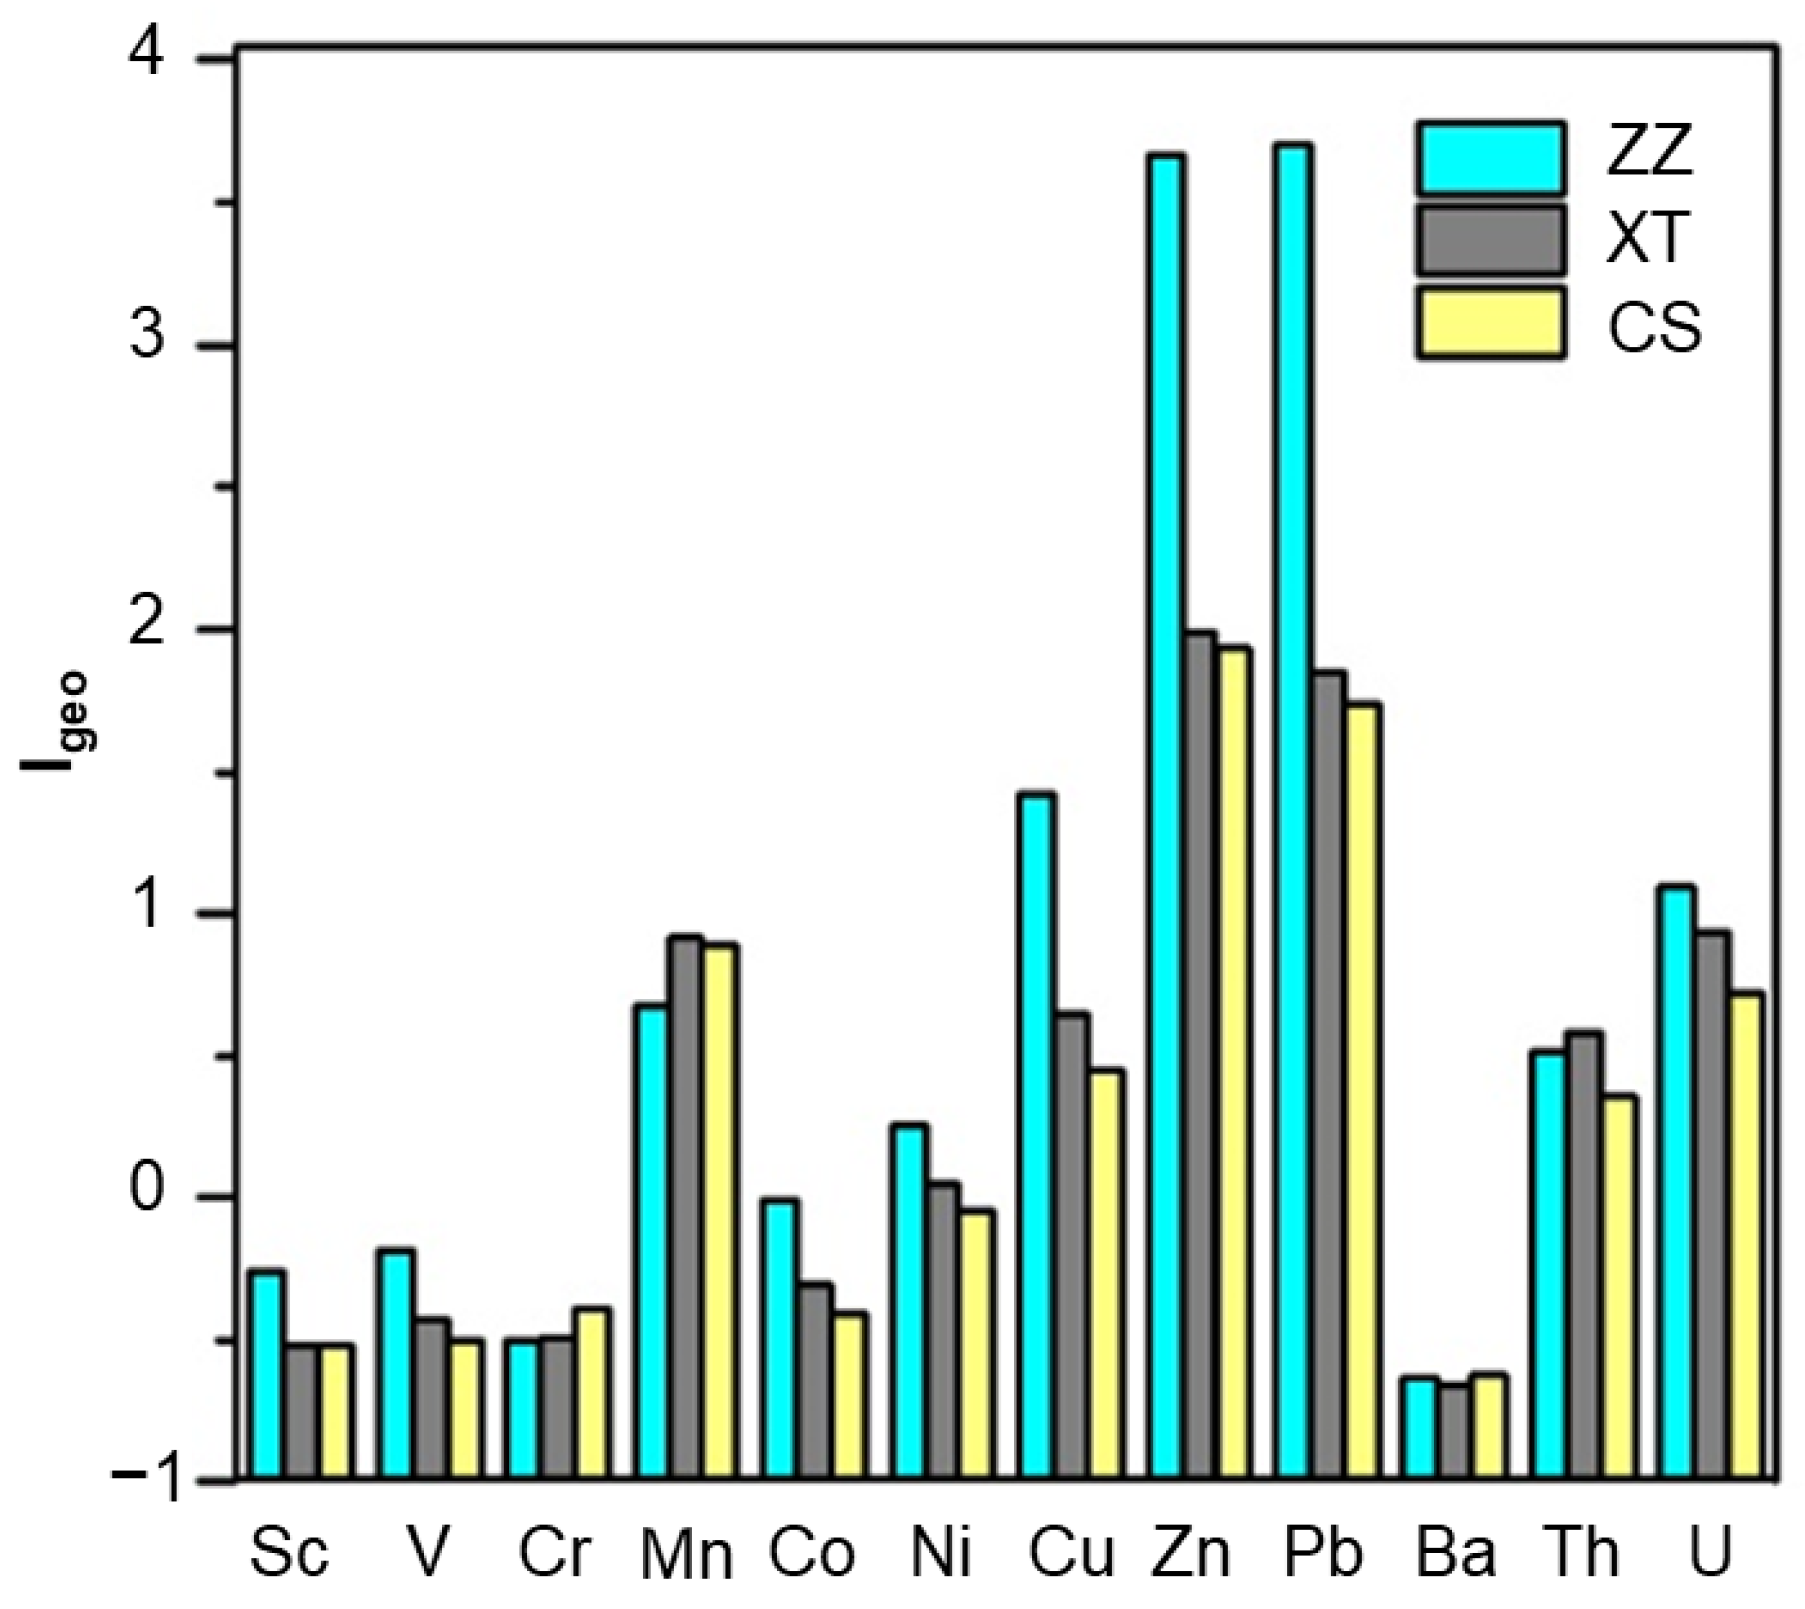
3.3.1. Assessment of Heavy Metal Pollution
The Geoaccumulation index (Igeo) was used to evaluate the pollution degree of heavy metals, according to Section 2.4.1. The results of Igeo were calculated in Figure 5 and Table 3. As can be seen from Figure 5, there is combined heavy metal pollution such as Cu-Zn-Pb-U in the sediment of the ZZ section and combined pollution such as Zn-Pb in the sediment of the XT and CS sections. Furthermore, the most elemental types and strongest degree of heavy metal pollution were observed in the ZZ section, followed by the XT section, while the CS section exhibited relatively light pollution. This result is consistent with the results of heavy metal enrichment characteristics reflected by EF values in Section 3.2.
Figure 5.
Geoaccumulation index of heavy metals in sediment.
Table 3.
Statistical results of the Geoaccumulation index (Igeo) for heavy metals in sediment.
Specifically (Table 3), in the sediment of the ZZ section, the Zn and Pb in the ZX column reached heavy pollution, with the Igeo values at 4.735 and 4.230, respectively, while Cu was moderate pollution (Igeo = 2.085). For the ZU column, Pb (Igeo = 3.317) also reached heavy pollution, with moderate pollution from Zn (Igeo = 2.576). Furthermore, the Zn and Pb in the ZF column were also moderately polluted, and the U in the ZX and ZF columns were slightly moderately polluted. The XT section was similar to the ZZ section; Zn and Pb had moderate or slightly moderate pollution, and the average values of Igeo for U in all other sediment columns were less than 1, except for the slightly moderate pollution of the X1Q column. The heavy metal Mn was moderately contaminated in the sedimentary columns X2Q, ZB, and XT, and the average value of the remaining sedimentary columns Igeo was less than 1. In the CS section, the Zn and Pb of the sedimentary column JZ were moderately polluted, with the Igeo values at 2.295 and 2.135, respectively. The Zn in the SG column was also moderately polluted, while the Zn and Pb in the remaining sedimentary columns were slightly moderately polluted. The Mn for all of the columns in the CS section was slightly moderate pollution, except for the XW column, i.e., the average value of Igeo was >1. Other heavy metals (except for Th and U) in the sediment of the CS section were in a clean state.
3.3.2. Assessment of Potential Ecological Risk
The potential ecological risk of heavy metals in sediments was evaluated by the Hakanson potential ecological risk index method [30], which was widely used for accessing the heavy metal ecological influence in sediments by distinguishing potential ecological hazards [39,40]. Considering the toxicity response parameters of Sc, Ba, Th, and U were not yet available, these elements did not participate in the potential ecological risk assessment. The calculated results of the potential ecological risk coefficient () and potential ecological risk index (RI) are shown in Table 4. It can be seen that a strong ecological risk of heavy metals was observed in the sediments at ZU and ZX points in the ZZ section, i.e., RI > 600, of which Pb had the greatest impact on ecological risk, followed by Cu and Zn. Heavy metals in sediments at the ZF point were a slight risk, which was consistent with the calculation of the enrichment factor (EF) and the Geoaccumulation index (Igeo). The potential ecological risk of heavy metals in sediments at five points in the XT section and four points in the CS section was mild (RI > 150). Furthermore, similar to the ZZ section, the Pb values of the XT and CS sections also had the greatest impact on ecological risk.
Table 4.
Potential ecological risk coefficient and hazard index of heavy metals in sediments.
Results of the potential ecological risk coefficients of eight heavy metals revealed that Pb had the greatest harm, among which the ecological risk of sediments at ZU and ZX points in the ZZ section reaches a very strong level, with an as high as 1330.741 (ZU point) and 988.889 (ZX point), and the level of strong ecological risk was reached at the ZF point. The remaining points had medium ecological risks except X3Q, SG, and XW. In addition to Pb, Zn and Cu were the next most harmful. Among them, the Zn at the ZU and ZX points and the Cu at the ZX point in the ZZ section reached the level of strong ecological risk, that is, > 80. For the other five heavy metals, except for the medium ecological risk of Ni at the ZU point, the ecological risk degree of the remaining four heavy metals was mild. Results of RI values of eight heavy metals at all points implied that the risk degree was followed in the order of: Pb > Cu > Zn > Ni > Co > Mn > V > Cr. The trend of heavy metal concentrations changed over time due to anthropogenic activities, such as environmental backgrounds and industrial and agricultural production with metals or metalloids [41]. The higher concentration of Pb and Zn might be attributed to the Pb-Zn mine in Hunan Province.
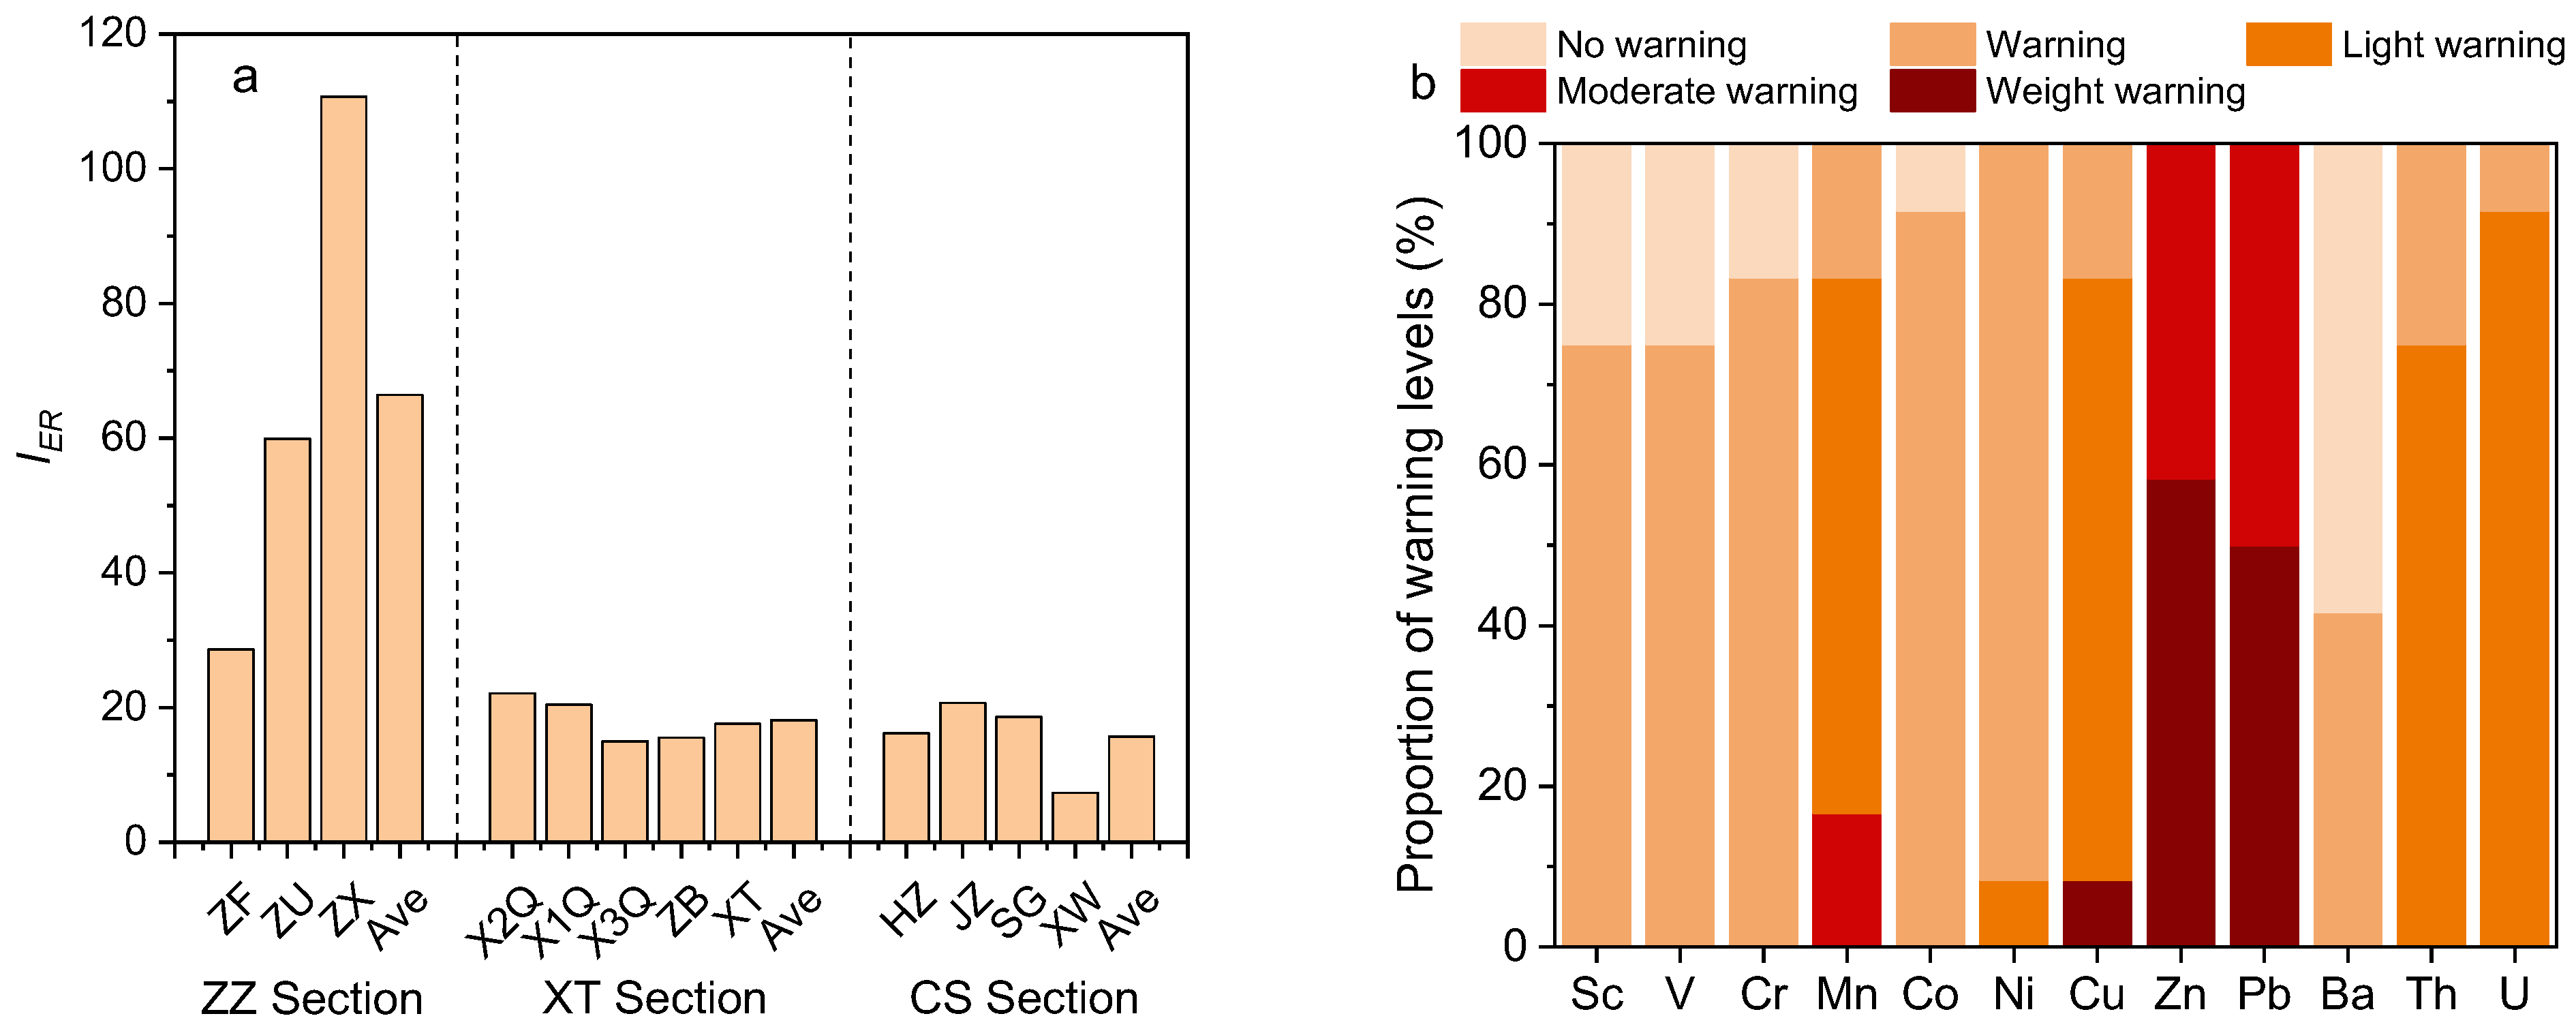
3.3.3. Ecological Risk Early Warning
Ecological risk early warning of heavy metal pollution in the studied sections was analyzed using the ecological risk early warning index (IER) method [31]. Results of IER (Figure 6a) showed that CS-ZZ-XT sections were all severe warning with IER > 7, and the XW point in the CS had the lowest IER value (7.3). Additionally, the average IER value of each river section suggested the following warning levels of heavy metals in sediment: ZZ section > XT section > CS section, with the average IER at 66.4, 18.1, and 15.7, respectively. In the ZZ section, the IER showed an increasing trend from upstream to downstream, with the highest IER value at the ZX point (110.7) and the lowest IER value at the ZF point, which was also as high as 28.6. In the XT section, the IER values at different points were relatively close, located in the range of 15.0–22.1. In the CS section, in addition to the XW point with the lowest IER value (7.3), the IER of other points was also relatively close, between 16.1 and 20.7. The above results showed that the pollution degree of heavy metals in the sediments of the ZZ section was the highest and most uneven, while that of the XT and CS sections was relatively low.
Figure 6.
Ecological risk early warning (a) and proportion of different early warning levels (b) of heavy metals in sediments from the ZZ-XT-CS sections of the Xiangjiang River.
In order to further clarify the early warning degree of different heavy metals, the IER of each heavy metal, including Sc, V, Cr, Mn, Co, Ni, Cu, Zn, Pb, Ba, Th, and U, was calculated and analyzed, and the results are shown in Figure 6b. Among the sediments detected in the CS-ZZ-XT sections of the Xiangjiang River, Ba had the lowest warning level, with more than 50% at the level of no warning and the remaining 41.7% at the level of early warning. Zn and Pb had the highest degree of warning, with ≥50 accounting for the severe warning, with IER higher than 3.2% and 2.2%, respectively, and an average IER of 9.8% and 11.2%, respectively. In addition, Cu also had a level of severe warning (8.3%). Among the remaining Sc, V, Cr, Mn, Co, Ni, Th, and U, the warning level of Mn was relatively high, consisting of early warning (16.7%), light warning (66.7%), and moderate warning (16.7%). It was followed by Ni, Th, and U, which were composed of early warning and light warning. In contrast, Sc, V, Cr, and Co had the lowest warning levels, consisting of no warning (25.0%, 25.0%, 16.7%, and 8.3%, respectively) and early warning (75.0%, 75.0%, 83.3%, and 91.7%, respectively).
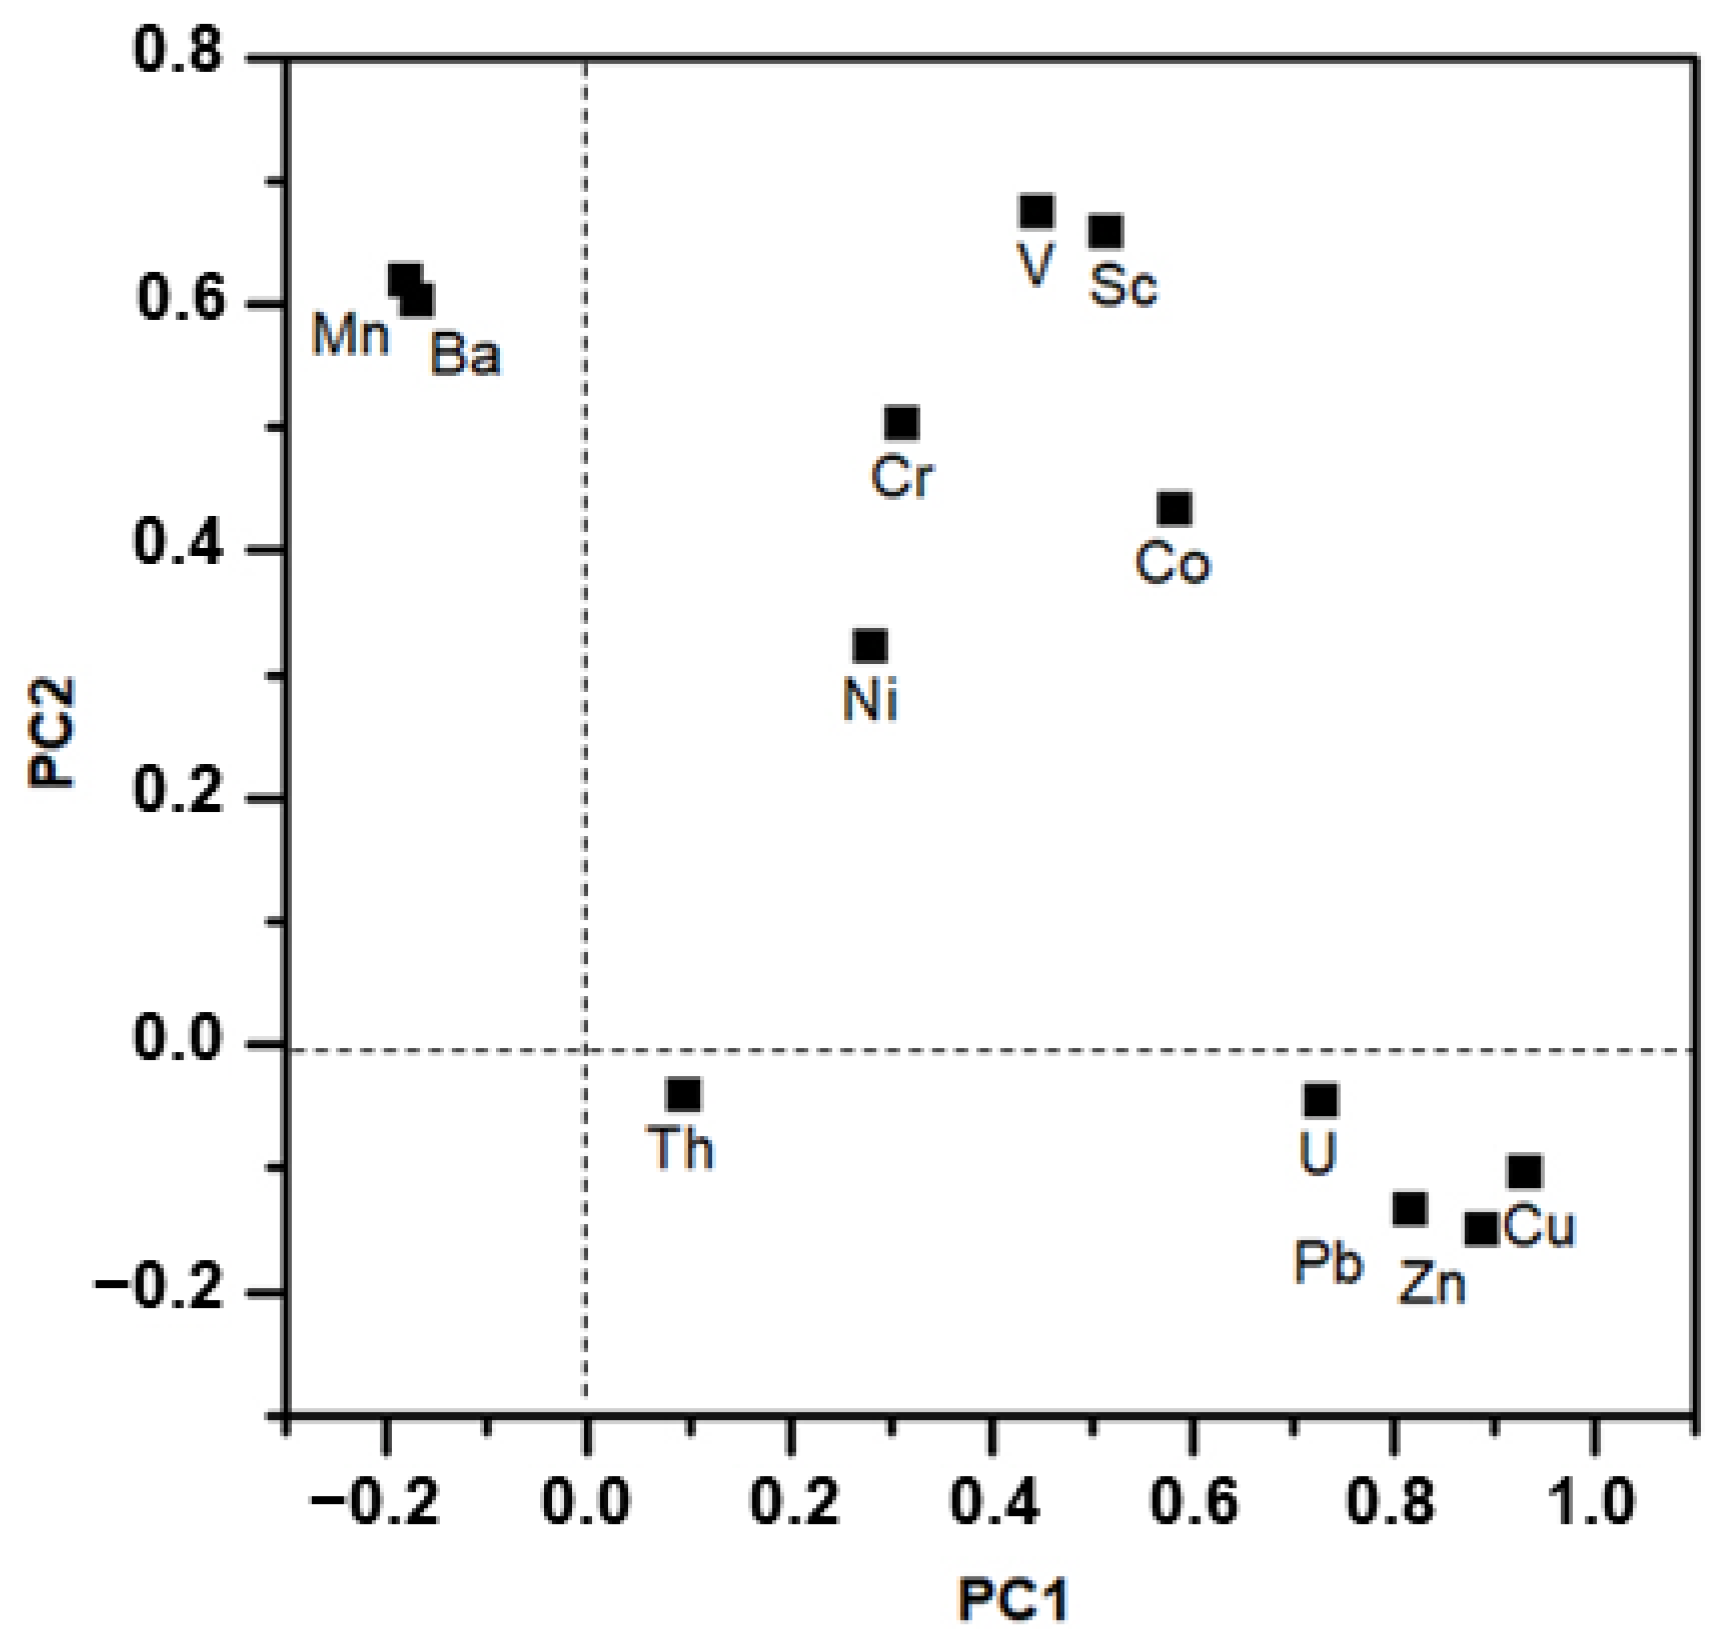
3.4. Analysis of Heavy Metal Sources
The elements in the sediment can be divided into natural and anthropogenic sources [37]. Previous studies suggested that natural source elements mainly included Al, Rb, Ca, Sr, Ti, Si, K, Zr, etc.; this type of element was mainly deposited due to rock weathering. while anthropogenic source elements mainly included Pb, Bi, Cu, Hg, Zn, Ag, Cd, Ni, Cr, Co, etc., which were significantly affected by human action, from mining, fertilizer, industrial activities, etc., discharged into rivers and lakes and then into sediments [37,42,43]. Additionally, natural sources of elements also contributed to the anthropogenic source. Therefore, elucidating the origin of elements in sediments is an important part of sediment environmental geochemical studies [37,44].
Elements of the same origin and properties in sediments showed similar distribution characteristics. The principal component analysis of sediment trace elements was combined with enrichment characteristics to identify the natural and anthropogenic sources. The results revealed that the principal components PC1 and PC2 could extract 33.768% and 22.516% of all information, respectively. The total contribution rate was 56.28%, which could effectively explain 12 variables (7.767 + 5.179 eigenvalues). A projection map of the principal components of heavy metal elements is shown in Figure 7. It can be seen that all elements were obviously concentrated in three load regions: Zone I with negative load (PC2 < 0) on PC2 included Th, U, Pb, Zn, and Cu. Combined with the statistical results of the enrichment coefficient, it was found that the average EF of these elements was greater than 1 (Figure 4), especially Cu and Zn (EF > 20 in some sediment samples). It was suggested that these heavy metals were enriched in the sediment, obviously, according to the EF value of the source characteristics of trace elements [45,46]. In addition to their natural sources, these elements also had contributions from anthropogenic sources [15].
Figure 7.
Principal components 1 (PC1) vs. PC2 for the principal component analysis of heavy metals in sediment samples.
In region II, with a positive load (PC2 > 0) on PC2 and a positive load (PC1 > 0) on PC1, mainly Ni, Cr, Co, V, and Sc. Among them, the EF value of these elements was mostly between 0.5 and 1.5, and no obvious enrichment was observed in the sediment. The content and changes were very close to the background value of the Yangtze River sediment, and thus the Ba element should be a natural source. In region III, with a positive load (PC2 > 0) on PC2 and a negative load (PC1 < 0) on PC1, there are mainly two heavy metal elements (Mn and Ba). Among them, the EF value of the Mn element was mostly greater than 1.5, which belongs to the element with obvious enrichment, similar to the elements in region I, and should contain two types of sources: natural and anthropogenic. While the EF value of the Ba element was mostly between 0.5 and 1, i.e., the enrichment of the sediment was not obvious, it can also be classified as a region II element. The above principal component analysis results and element enrichment characteristics (EF values) showed that sediment trace elements can be divided into two categories: the first category was clearly enriched elements, including Th, U, Pb, Zn, Cu, and Mn, and the second category was elements without obvious enrichment characteristics, including Ni, Cr, Co, V, Sc, and Ba. The first type of element was mainly controlled by natural and anthropogenic sources. The second type of element was mainly based on natural sources.
3.5. Prevention and Control Measures for Heavy Metal Pollution
- (1)
- Establish a dynamic monitoring and warning system for long-term sediment risk sources.
To build an integrated environmental monitoring system for water environment sediments in the Xiangjiang River Basin, we need to establish a unified and dynamic monitoring system of water and soil environment quality, key industrial discharge point sources, and key pollution sources with full coverage. We need to promote integrated construction based on data networking and sharing, as well as improve the early warning system for heavy metal prevention and control of water and soil integration in the Xiangjiang River Basin. Furthermore, we need to establish a big data management platform for water and soil in the Xiangjiang River Basin and support the assessment, admission control, and risk warning of heavy metal pollution in the water and soil environment.
- (2)
- Improve the source control of industrial enterprises involved in heavy metal emissions.
Industrial enterprises involved in heavy metal emissions actively seek alternative use spaces for clean energy and reduce pollution emissions in energy use, such as the gradual introduction of wind power and photovoltaic power sources. They introduce advanced clean production technologies and environmental protection equipment, reducing pollution generation and improving energy efficiency by making full use of energy and resources. Ultimately, achieving prevention, control, and even reduction of pollution throughout the entire production process can not only help to achieve emission reduction and environmental protection but also reduce the cost of subsequent pollution treatment.
- (3)
- Pollution source treatment of industrial enterprises involved in heavy metal emissions.
We are improving the existing wastewater treatment technologies by recovering and treating the heavy metal elements in the generated heavy metal wastewater, achieving the recycling and utilization of these heavy metals, and appropriately recycling the treated wastewater that meets the standards. This measure can not only improve the efficient utilization of water resources and heavy metals but also greatly reduce heavy metal pollution in water and achieve the control of heavy metal pollutants at the discharge source.
- (4)
- Dredging of heavily polluted river sections.
River dredging is one of the most effective methods for treating sediment in polluted river sections and ensuring water quality in river sections. The section of the Xiangjiang River with severe heavy metal pollution can be normalized dredged, but special attention should be paid to the reasonable disposal of heavy metal pollution in sediment, orderly treatment and reuse of heavy metals in sediment, and the introduction of in-situ resource utilization of dredging sediment, which can effectively purify and block the erosion of heavy metal pollution into the river section and help restore the water quality of the river section and the ecological environment along the Xiangjiang River as soon as possible.
4. Conclusions
The exploration of heavy metals in sediments from the CS, ZZ, and XT sections (lower reaches) of the Xiangjiang River supported the following conclusions:
- (1)
- The heavy metal element contents of each sedimentary column in the ZZ section exhibited significant variation with a high degree of enrichment, some of which were much higher than those of other columns in the CS and XT sections. The influence of anthropogenic activities (metal mineral processing, metal product smelting, wastewater discharge in industrial parks, etc.) on the heavy metal element content was obvious.
- (2)
- Results of the Geoaccumulation index indicated that the ZZ section had the largest number of heavy metal pollution elements and the strongest degree of pollution, followed by the XT section and the CS section. Potential ecological risk index results suggested strong ecological risks of heavy metals in sediments at ZU and ZX points in the ZZ section, and the risk degree of heavy metals was Pb > Cu > Zn > Ni > Co > Mn > V > Cr.
- (3)
- The ecological risk early warning levels of heavy metal in sediments followed: ZZ section (IER = 66.4) > XT section (IER = 18.1) > CS section (IER = 15.7). Zn and Pb exhibited the highest early warning degree (severe warning proportion ≥ 50%), and thus special attention should be paid to the prevention and control of heavy metal pollution in the ZZ section, especially the pollution of Zn and Pb.
- (4)
- The distribution of studied elements in sediment included: Th, U, Pb, Zn, Cu, and Mn were obviously enriched, which were mainly controlled by natural and anthropogenic sources, while Ni, Cr, Co, V, Sc, and B had no obvious enrichment characteristics, mainly from natural sources.
- (5)
- Strategies and measures for the prevention and control of sediment heavy metal pollution, including the establishment of a dynamic monitoring and warning system, source control and pollution source treatment improvements, and suitable dredging, were proposed based on the characteristics of the heavy metal pollution.
Even though only the CS-ZZ-XT sections of the Xiangjiang River were investigated due to restrictions in natural conditions, time, and experimental techniques, the results of this study have important practical guidance for the analysis of natural processes such as rock weathering and climate change in the source area. Furthermore, the results can further promote the generalizable identification of the development trend and harm degree of heavy metal pollution in the Xiangjiang River Basin, as well as the accumulation and decision-making support of heavy metal pollution prevention and control technologies. The expanded study area and its combination with relevant studies on the evolution of the Xiangjiang River Basin and the history of human activities may be more supportive of the systematic study of the Xiangjiang River Basin in the future.
Supplementary Materials
The following supporting information can be downloaded at: https://www.mdpi.com/article/10.3390/su151914239/s1, Table S1: Classification of heavy metal pollution in sediment; Table S2: Toxicity coefficient of heavy metals; Table S3: The dividing standard of ecological risk of heavy metals; Table S4: Proportion of different ecological risk early warning levels of heavy metals in sediments; Table S5: Content and standard deviation rate of each major element and organic matter of riverbed sediments in CS-ZZ-XT sections of the Xiangjiang River; Figure S1: Vertical distribution of heavy metals in the riverbed sediments in CS-ZZ-XT sections of the Xiangjiang River; Figure S2: Vertical distribution of heavy metal content in the riverbed sediments in ZZ section and X2Q sediment column in XT section of the Xiangjiang River; Figure S3: Vertical distribution of heavy metal content in the riverbed sediments in XT section; Figure S4: Vertical distribution of heavy metal content in the riverbed sediments in CS section.
Author Contributions
Conceptualization, K.Z. and B.P.; methodology, K.Z.; investigation, K.Z. and X.Y.; writing—original draft preparation, K.Z.; writing—review and editing, B.P. and X.Y.; supervision, B.P. All authors have read and agreed to the published version of the manuscript.
Funding
This research was funded by the Aid Program for Science and Technology Innovative Research Team in Higher Educational Institutions of Hunan Province (Grant No. CX2014B225) and the Construction Program for the First-Class Disciplines (Grant No. Geography-5010002) of Hunan Province, China.
Institutional Review Board Statement
Not applicable.
Informed Consent Statement
Not applicable.
Data Availability Statement
The data that support the findings of this study are available from the corresponding author upon reasonable request.
Acknowledgments
The authors would like to sincerely thank Xianglin Tu from the Guangzhou Institute of Geochemistry, Chinese Academy of Sciences, for the help on ICP-MS analysis.
Conflicts of Interest
The authors declare no conflict of interest.
References
- Song, J.; Chen, X.; Cheng, C.; Wang, D.; Wang, W. Variability of streambed vertical hydraulic conductivity with depth along the Elkhorn River, Nebraska, USA. Chin. Sci. Bull. 2009, 54, 3892–3899. (In Chinese) [Google Scholar] [CrossRef]
- Lei, M.; Qin, P.; Tie, B. Current situation and analysis of heavy metal pollution in the Xiangjiang River basin of Hunan province. J. Agric. Resour. Environ. 2010, 27, 62–65. (In Chinese) [Google Scholar]
- Wayne Nesbitt, H.; Markovics, G. Weathering of granodioritic crust, long-term storage of elements in weathering profiles, and petrogenesis of siliciclastic sediments. Geochim. Cosmochim. Acta. 1997, 61, 1653–1670. [Google Scholar] [CrossRef]
- Sun, G.X.; Wang, X.J.; Hu, Q.H. Using stable lead isotopes to trace heavy metal contamination sources in sediments of Xiangjiang and Lishui Rivers in China. Environ. Pollut. 2011, 159, 3406–3410. [Google Scholar] [CrossRef]
- García-Pereira, F.J.; Giménez, R.G.; Villa, R.V.D.L.; Procopio, J.R. Heavy metal fractionation in sediments from the Jarama River (central Spain). Environ. Earth Sci. 2015, 73, 2385–2396. [Google Scholar] [CrossRef]
- Mao, M.; Liu, Z.; Wei, J. Study on the chemical morphology of heavy metals in the surface sediment of the Xiangjiang River. Environ. Sci. 1987, 5, 35–41. (In Chinese) [Google Scholar]
- Guo, Z.-H.; Song, J.; Xiao, X.-Y.; Ming, H.; Miao, X.-F.; Wang, F.-Y. Spatial distribution and environmental characterization of sediment-associated metals from middle-downstream of Xiangjiang River, southern China. J. Cent. South Univ. Technol. 2010, 17, 68–78. [Google Scholar] [CrossRef]
- Bao, Z.; Bo, P.; Xu, J.; Tan, C.; Quan, M. Geochemical study on the relation of chemical compositions to heavy metal contamination of sedimens from the lowermost Xiangjiang River, Hunan Province, China. Ceochimica 2012, 41, 545–558. (In Chinese) [Google Scholar]
- Guo, L. The Research on the Teatment of Water Pollutions and the Water Resoures Proteetion in the Urbanization Process of Changsha—Zhuzhou—Xiangtan Urban Group. Master’s Thesis, Hunan University, Changsha, China, 2004. (In Chinese). [Google Scholar]
- Huang, Z.; Zheng, S.; Liu, Y.; Zhao, X.; Qiao, X.; Liu, C.; Zheng, B.; Yin, D. Distribution, toxicity load, and risk assessment of dissolved metal in surface and overlying water at the Xiangjiang River in southern China. Sci. Rep. 2021, 11, 109. [Google Scholar] [CrossRef]
- Lu, J.; Cai, H.; Fu, Y.; Zhang, X.; Zhang, W. A study on the impacts of landscape structures on water quality under different spatial scales in the Xiangjiang River Basin. Water Air Soil Pol. 2022, 233, 164. [Google Scholar] [CrossRef]
- Wen, T.; Zhong, H.; Fu, G.; Zhong, Y. Effects of environmental factors on release amount of heavy metal and structure of microbial community in sediments. Int. J. Environ. Sci. Technol. 2022, 19, 4007–4018. [Google Scholar] [CrossRef]
- Yu, Y.; Liu, W.; Luo, H.; He, L.; Liu, H.; Xu, R.; Zhang, L.; Wang, Y.; Wu, G.; Wei, F. Assessing the risk of total and available potentially toxic elements in agricultural soil in typical mining areas in Xiangjiang River basin, Hunan Province. Minerals 2021, 11, 953. [Google Scholar] [CrossRef]
- Wang, Q.; Xu, Y.; Liu, L.; Li, L.; Lin, H.; Wu, X.; Bi, W.; Wang, L.; Mao, D.; Luo, Y. The prevalence of ampicillin-resistant opportunistic pathogenic bacteria undergoing selective stress of heavy metal pollutants in the Xiangjiang River, China. Environ. Pollut. 2021, 268, 115362. [Google Scholar] [CrossRef] [PubMed]
- Fang, X.; Peng, B.; Wang, X.; Song, Z.; Zhou, D.; Wang, Q.; Qin, Z.; Tan, C. Distribution, contamination and source identification of heavy metals in bed sediments from the lower reaches of the Xiangjiang River in Hunan province, China. Sci. Total Environ. 2019, 689, 557–570. [Google Scholar] [CrossRef] [PubMed]
- Liu, H.; Li, Y. Background values of some metals in rocks, soil and water in Xiangjiang basin. Acta Sci. Circumstantiae 1984, 4, 17–32. (In Chinese) [Google Scholar]
- Huang, Z.; Liu, C.; Zhao, X.; Dong, J.; Zheng, B. Risk assessment of heavy metals in the surface sediment at the drinking water source of the Xiangjiang River in South China. Environ. Sci. Eur. 2020, 32, 23. [Google Scholar] [CrossRef]
- Liang, J.; Liu, J.; Xu, G.; Chen, B. Distribution and transport of heavy metals in surface sediments of the Zhejiang nearshore area, East China Sea: Sedimentary environmental effects. Mar. Pollut. Bull. 2019, 146, 542–551. [Google Scholar] [CrossRef]
- Wang, L.; Guo, Z.; Xiao, X.; Chen, T.; Liao, X.; Song, J.; Wu, B. Heavy metal pollution of soils and vegetables in the midstream and downstream of the Xiangjiang River, Hunan Province. J. Geogr. Sci. 2008, 18, 353–362. [Google Scholar] [CrossRef]
- Qu, C.; Li, B.; Wu, H.; Wang, S.; Li, F. Probabilistic ecological risk assessment of heavy metals in sediments from China’s major aquatic bodies. Stoch. Environ. Res. Risk Assess. 2016, 30, 271–282. [Google Scholar] [CrossRef]
- Zhang, Z.; Tao, F.; Du, J.; Shi, P.; Yu, D.; Meng, Y.; Sun, Y. Surface water quality and its control in a river with intensive human impacts–A case study of the Xiangjiang River, China. J. Environ. Manag. 2010, 91, 2483–2490. [Google Scholar] [CrossRef]
- Sun, W.; Sang, L.; Jiang, B. Trace metals in sediments and aquatic plants from the Xiangjiang River, China. J. Soils Sed. 2012, 12, 1649–1657. [Google Scholar] [CrossRef]
- Li, J.; Zeng, B.; Yao, Y.; Zhang, L.; Qiu, C. Study on the environmental background value of the Dongting Lake water system. J. Environ. Sci. 1986, 7, 62–68. (In Chinese) [Google Scholar]
- Wu, S.; Peng, B.; Fang, X.; Xie, S.; Li, X.; Jiang, C.; Dai, Y. Distribution and assessment of cadmium contamination in sediments from the Four River inlets to Dongting Lake, China. Environ. Sci. Pollut. Res. 2021, 286, 6072–6085. [Google Scholar] [CrossRef]
- Hoogsteen, M.J.J.; Lantinga, E.A.; Bakker, E.J.; Tittonell, P.A. An Evaluation of the Loss-on-Ignition Method for Determining the Soil Organic Matter Content of Calcareous Soils. Commun. Soil Sci. Plant Anal. 2018, 49, 1541–1552. [Google Scholar] [CrossRef]
- Ying, L.; Haichen, L.; Xianhua, L. Simultaneous and precise determination of 40 trace elements in rock samples using ICP-MS. Geochimica 1996, 25, 552–558. (In Chinese) [Google Scholar]
- Duzgoren-Aydin, N.S. Sources and characteristics of lead pollution in the urban environment of Guangzhou. Sci. Total Environ. 2007, 385, 182–195. [Google Scholar] [CrossRef]
- Kuang, Y.; Zhu, X.; Xi, D.; Li, J. Distribution of anthropogenic lead estimated by Pb isotopic composition in the upper layers of soil from a mixed forest at Dinghushan, southern China. J. Soils Sed. 2013, 13, 394–402. [Google Scholar] [CrossRef]
- Müller, G. Index of geoaccumulation in sediments of the Rhine River. GeoJournal 1969, 2, 108–118. [Google Scholar]
- Hakanson, L. An ecological risk index for aquatic pollution control.a sedimentological approach. Water Res. 1980, 14, 975–1001. [Google Scholar] [CrossRef]
- Rapant, S.; Kordík, J. An environmental risk assessment map of the Slovak Republic: Application of data from geochemical atlases. Environ. Geol. 2003, 44, 400–407. [Google Scholar] [CrossRef]
- Gao, S.; Luo, T.; Zhang, B.; Zhang, H.; Han, Y.; Zhao, Z. The Structure and Composition of the Crust in Eastern China. Sci. China Ser. D 1999, 29, 204–213. (In Chinese) [Google Scholar]
- Yao, Z.; Bao, Z.; Gao, P. Environmental geochemistry of heavy metals in the Dongting Lake sediments. Geochimica 2006, 35, 629–638. (In Chinese) [Google Scholar]
- Shi, C.; Yan, M.; Chi, Q. Abundances of chemical elements of granitoids in different geotectonic units of China and their characteristics. Acta Geol. Sin. 2007, 81, 47–59. (In Chinese) [Google Scholar] [CrossRef]
- Yan, M.; Gu, T.; Chi, Q.; Wang, C. Abundances of elements of China soils and surface geochemical properties of elements. Inst. Geophys. Geochem. Explor. 1997, 21, 161–167. (In Chinese) [Google Scholar]
- Bayon, G.; Toucanne, S.; Skonieczny, C.; André, L.; Bermell, S.; Cheron, S.; Dennielou, B.; Etoubleau, J.; Freslon, N.; Gauchery, T.; et al. Rare earth elements and neodymium isotopes in world river sediments revisited. Geochim. Cosmochim. Acta 2015, 170, 17–38. [Google Scholar] [CrossRef]
- Hinrichs, J.; Dellwig, O.; Brumsack, H.J. Lead in sediments and suspended particulate matter of the German Bight: Natural versus anthropogenic origin. Appl. Geochem. 2002, 17, 621–632. [Google Scholar] [CrossRef]
- Peng, B.; Tang, X.; Yu, C.; Tan, C.; Tu, X.; Liu, Q.; Yang, K.; Xiao, M.; Xu, J. Heavy metal contamination of inlet sediments of the Xiangjiang River and Pb isotopic geochemical implication. Acta Geol. Sin. 2011, 85, 282–299. (In Chinese) [Google Scholar]
- Song, J.; Yang, X.; Zhang, J.; Long, Y.; Zhang, Y.; Zhang, T. Assessing the variability of heavy metal concentrations in liquid-solid two-phase and related environmental risks in the Weihe River of Shaanxi Province, China. Int. J. Environ. Res. Public Health 2015, 12, 8243–8262. [Google Scholar] [CrossRef]
- Ahamad, M.I.; Song, J.; Sun, H.; Wang, X.; Mehmood, M.S.; Sajid, M.; Su, P.; Khan, A.J. Contamination level, ecological risk, and source identification of heavy metals in the hyporheic zone of the Weihe River, China. Int. J. Environ. Res. Public Health. 2020, 17, 1070. [Google Scholar] [CrossRef]
- Wang, X.; Su, P.; Lin, Q.; Song, J.; Sun, H.; Cheng, D.; Wang, S.; Peng, J.; Fu, J. Distribution, assessment and coupling relationship of heavy metals and macroinvertebrates in sediments of the Weihe River Basin. Sustain. Cities Soc. 2019, 50, 101665. [Google Scholar] [CrossRef]
- Viers, J.; Dupré, B.; Gaillardet, J. Chemical composition of suspended sediments in World Rivers: New insights from a new database. Sci. Total Environ. 2009, 407, 853–868. [Google Scholar] [CrossRef] [PubMed]
- Shi, X.; Chen, L.; Ma, J.; Cai, Z. Ree Geochemistry of Sediments from West Philippine Sea. Acta Geol. Sin. 1996, 16, 260–267. (In Chinese) [Google Scholar]
- Singh, P. Major, trace and REE geochemistry of the Ganga River sediments: Influence of provenance and sedimentary processes. Chem. Geol. 2009, 266, 242–255. [Google Scholar] [CrossRef]
- Rousseau, T.C.C.; Roddaz, M.; Moquet, J.-S.; Handt Delgado, H.; Calves, G.; Bayon, G. Controls on the geochemistry of suspended sediments from large tropical South American rivers (Amazon, Orinoco and Maroni). Chem. Geol. 2019, 522, 38–54. [Google Scholar] [CrossRef]
- Lin, S.; Hsieh, I.J.; Huang, K.M.; Wang, C.H. Influence of the Yangtze River and grain size on the spatial variations of heavy metals and organic carbon in the East China Sea continental shelf sediments. Chem. Geol. 2002, 182, 377–394. [Google Scholar] [CrossRef]
Disclaimer/Publisher’s Note: The statements, opinions and data contained in all publications are solely those of the individual author(s) and contributor(s) and not of MDPI and/or the editor(s). MDPI and/or the editor(s) disclaim responsibility for any injury to people or property resulting from any ideas, methods, instructions or products referred to in the content. |
© 2023 by the authors. Licensee MDPI, Basel, Switzerland. This article is an open access article distributed under the terms and conditions of the Creative Commons Attribution (CC BY) license (https://creativecommons.org/licenses/by/4.0/).