Article

The Role of the Government in Green Finance, Foreign Direct Investment, Technological Innovation, and Industrial Structure Upgrading: Evidence from China

1
Business School, Shandong University of Technology, Zibo 255000, China
2
MEU Research Unit, Middle East University, Amman 541350, Jordan
3
Adnan Kassar School of Business, Lebanese American University, Beirut 1102-2801, Lebanon
4
Department of Business Administration, Faculty of Economics, Administrative and Social Sciences, Bahçeşehir Cyprus University, Nicosia 99010, Türkiye
*
Author to whom correspondence should be addressed.
Sustainability 2023, 15(19), 14069; https://doi.org/10.3390/su151914069
Submission received: 15 August 2023 / Revised: 7 September 2023 / Accepted: 18 September 2023 / Published: 22 September 2023

Abstract

:
This study utilizes data from China’s 31 provinces, collected from 2007 to 2021, to establish a green finance (GF) index and investigate its impact on industrial structure upgrading (IS). In addition to the direct impact, this study investigates the indirect influence of GF on industrial structure upgrading through technological innovation (Tech) and foreign direct investment (FDI). Furthermore, this study analyzes the moderating role of environmental regulation intensity (ERI) and government intervention on the relationship between GF and industrial structure upgrading. The empirical findings demonstrate a positive relationship between GF and industrial structure upgrading, which remains robust after conducting a robustness analysis and stability tests. Moreover, GF positively impacts industrial structure upgrading by stimulating Tech and attracting FDI. Furthermore, the ERI is observed to positively and significantly moderate the impact of GF on industrial structure upgrading, while high levels of government intervention hinder the promoting effect of GF on industrial structure upgrading. Lastly, the association between GF development and industrial structure upgrading exhibits regional and market heterogeneity, with the most notable impact observed in coastal areas and regions with higher levels of market orientation. This study presents comprehensive suggestions for facilitating the improvement of GF and the upgrading of industrial structures.

1. Introduction

The rapid economic growth experienced by China following the introduction of economic reforms and liberalization has been instrumental in harnessing its population and resource advantages [1]. However, this extensive economic development has also yielded ecological degradation and multifaceted challenges that intersect with the goal of achieving sustainable development. One prominent challenge resides within China’s prevailing industrial structure, characterized by industries exhibiting low value-added characteristics and high energy consumption patterns, which pose a formidable obstacle to the realization of sustainable economic progress [2]. It is crucial to emphasize that the predominant developmental paradigm, predominantly fixated on gross domestic product (GDP) growth, has incentivized local governments to rely heavily on inefficient and environmentally detrimental industrial systems [3]. Consequently, this has caused a misallocation of production factors, diminished industrial innovation capacity, triggered concerns of overcapacity, and incrementally approached the ecological carrying capacity limit. These multifaceted challenges significantly endanger China’s prospects for long-term economic sustainability and, by extension, its overarching well-being, thereby underscoring the imperative of addressing the structural inefficiencies within its industrial landscape in the pursuit of sustainable development objectives [4].
Consequently, the promotion of green finance has become a key focus in pursuing sustainable development in China [5]. There is a consensus on leveraging financial mechanisms to channel funds toward industries that promote energy efficiency. Green finance plays a crucial role in facilitating green economic growth and supporting industrial structure upgrading. The introduction of the “five development concepts” at the Fifth Plenary Session of the 18th CPC Central Committee has paved the way for the establishment of a green finance system, marking a new direction in financial reforms. Green finance encompasses a range of financial services aimed at supporting activities that yield environmental benefits, such as improving environmental conditions, addressing climate change, and optimizing resource allocation. Its development is centered around achieving a harmonious balance between environmental advantages and economic gains, ensuring effective financial support for initiatives promoting a green economy [6].
GF is widely considered a prerequisite for ecological civilization, providing new avenues for financing green projects and extending financial support for technological innovation and talent acquisition [7]. Secondly, green industries have become a significant impetus for high-quality economic development. GF plays a crucial role in fostering the coordinated growth of the green industry and guiding various stakeholders’ participation in environmental industries. The development of the GF system in China is exemplified by initiatives like green credit, green bonds, and green insurance, and the scale of this development is expanding annually, accompanied by the diversification of GF instruments [8]. The progression of GF in the country is shifting from decentralized and experimental exploration towards systematization and widespread implementation.
Simultaneously, a new wave of industrial revolution is unfolding in Western countries. Rapid advancements in research, innovation, and the adoption of green and clean technologies, such as solar power generation, chip technology, and green infrastructure, are taking place. International organizations like the G20 and TPP (Trans-Pacific Partnership Agreement) are increasingly focusing on green energy innovation and sustainable industrial transformation [9]. Therefore, promoting industrial transformation and optimization are key to achieving high-quality economic development, driven by both domestic structural optimization trends and the global green industry’s technological innovation advancements.
Industrial structure optimization and upgrading involve a dynamic process of redistributing production factors. As industries undergo transformation and upgrading, production resources naturally shift from sectors with low input–output rates or sluggish input–output growth to those with higher rates, thereby enhancing resource allocation efficiency and overall societal productivity. This process promotes industrial survival of the fittest and fosters sustainable economic development [10]. In the current context, with China actively promoting industrial structural transformation, green economy development, achieving industry transformation, and upgrading through green finance hold immense practical significance [11]. While numerous governments worldwide have committed to or are engaged in providing green financial incentives, academic research on the potential economic consequences remains limited due to endogenous challenges. This study mainly investigates the role of GF in upgrading the IS. By conducting theoretical and empirical analyses, this article presents policy suggestions to facilitate China’s development. Feasible measures to strengthen green finance are proposed, providing valuable insights for policymakers.
This study makes a valuablecontribution to the existing academic literature in several key dimensions. Firstly, it investigates the role of green finance (GF) in driving advancements in industrial structure upgrading across 31 provinces of China. This research delves into the mechanisms underlying this phenomenon, with a particular focus on the influences of technological innovation and foreign direct investment. This scholarly endeavor enriches the literature surrounding the development of GF and its interconnectedness with the factors shaping industrial structure (IS). Secondly, this paper explores the regulatory effects of environmental regulatory intervention (ERI) and the level of government intervention in facilitating the promotion of IS upgrading through GF. Given the unique national conditions in China, government intervention assumes a pivotal role in this context. The findings of this study provide valuable insights into the formulation of policy guidance and the direction of government intervention strategies. Thirdly, taking into account the prevailing disparities in regional development and varying degrees of market orientation within China, this article scrutinizes the heterogeneity of GF’s impact on industrial structure. It offers tailored development recommendations customized to regions characterized by economic underdevelopment and a limited degree of market orientation. The insights derived from this research are instrumental in formulating policy guidance and recommendations aimed at achieving sustainable development.
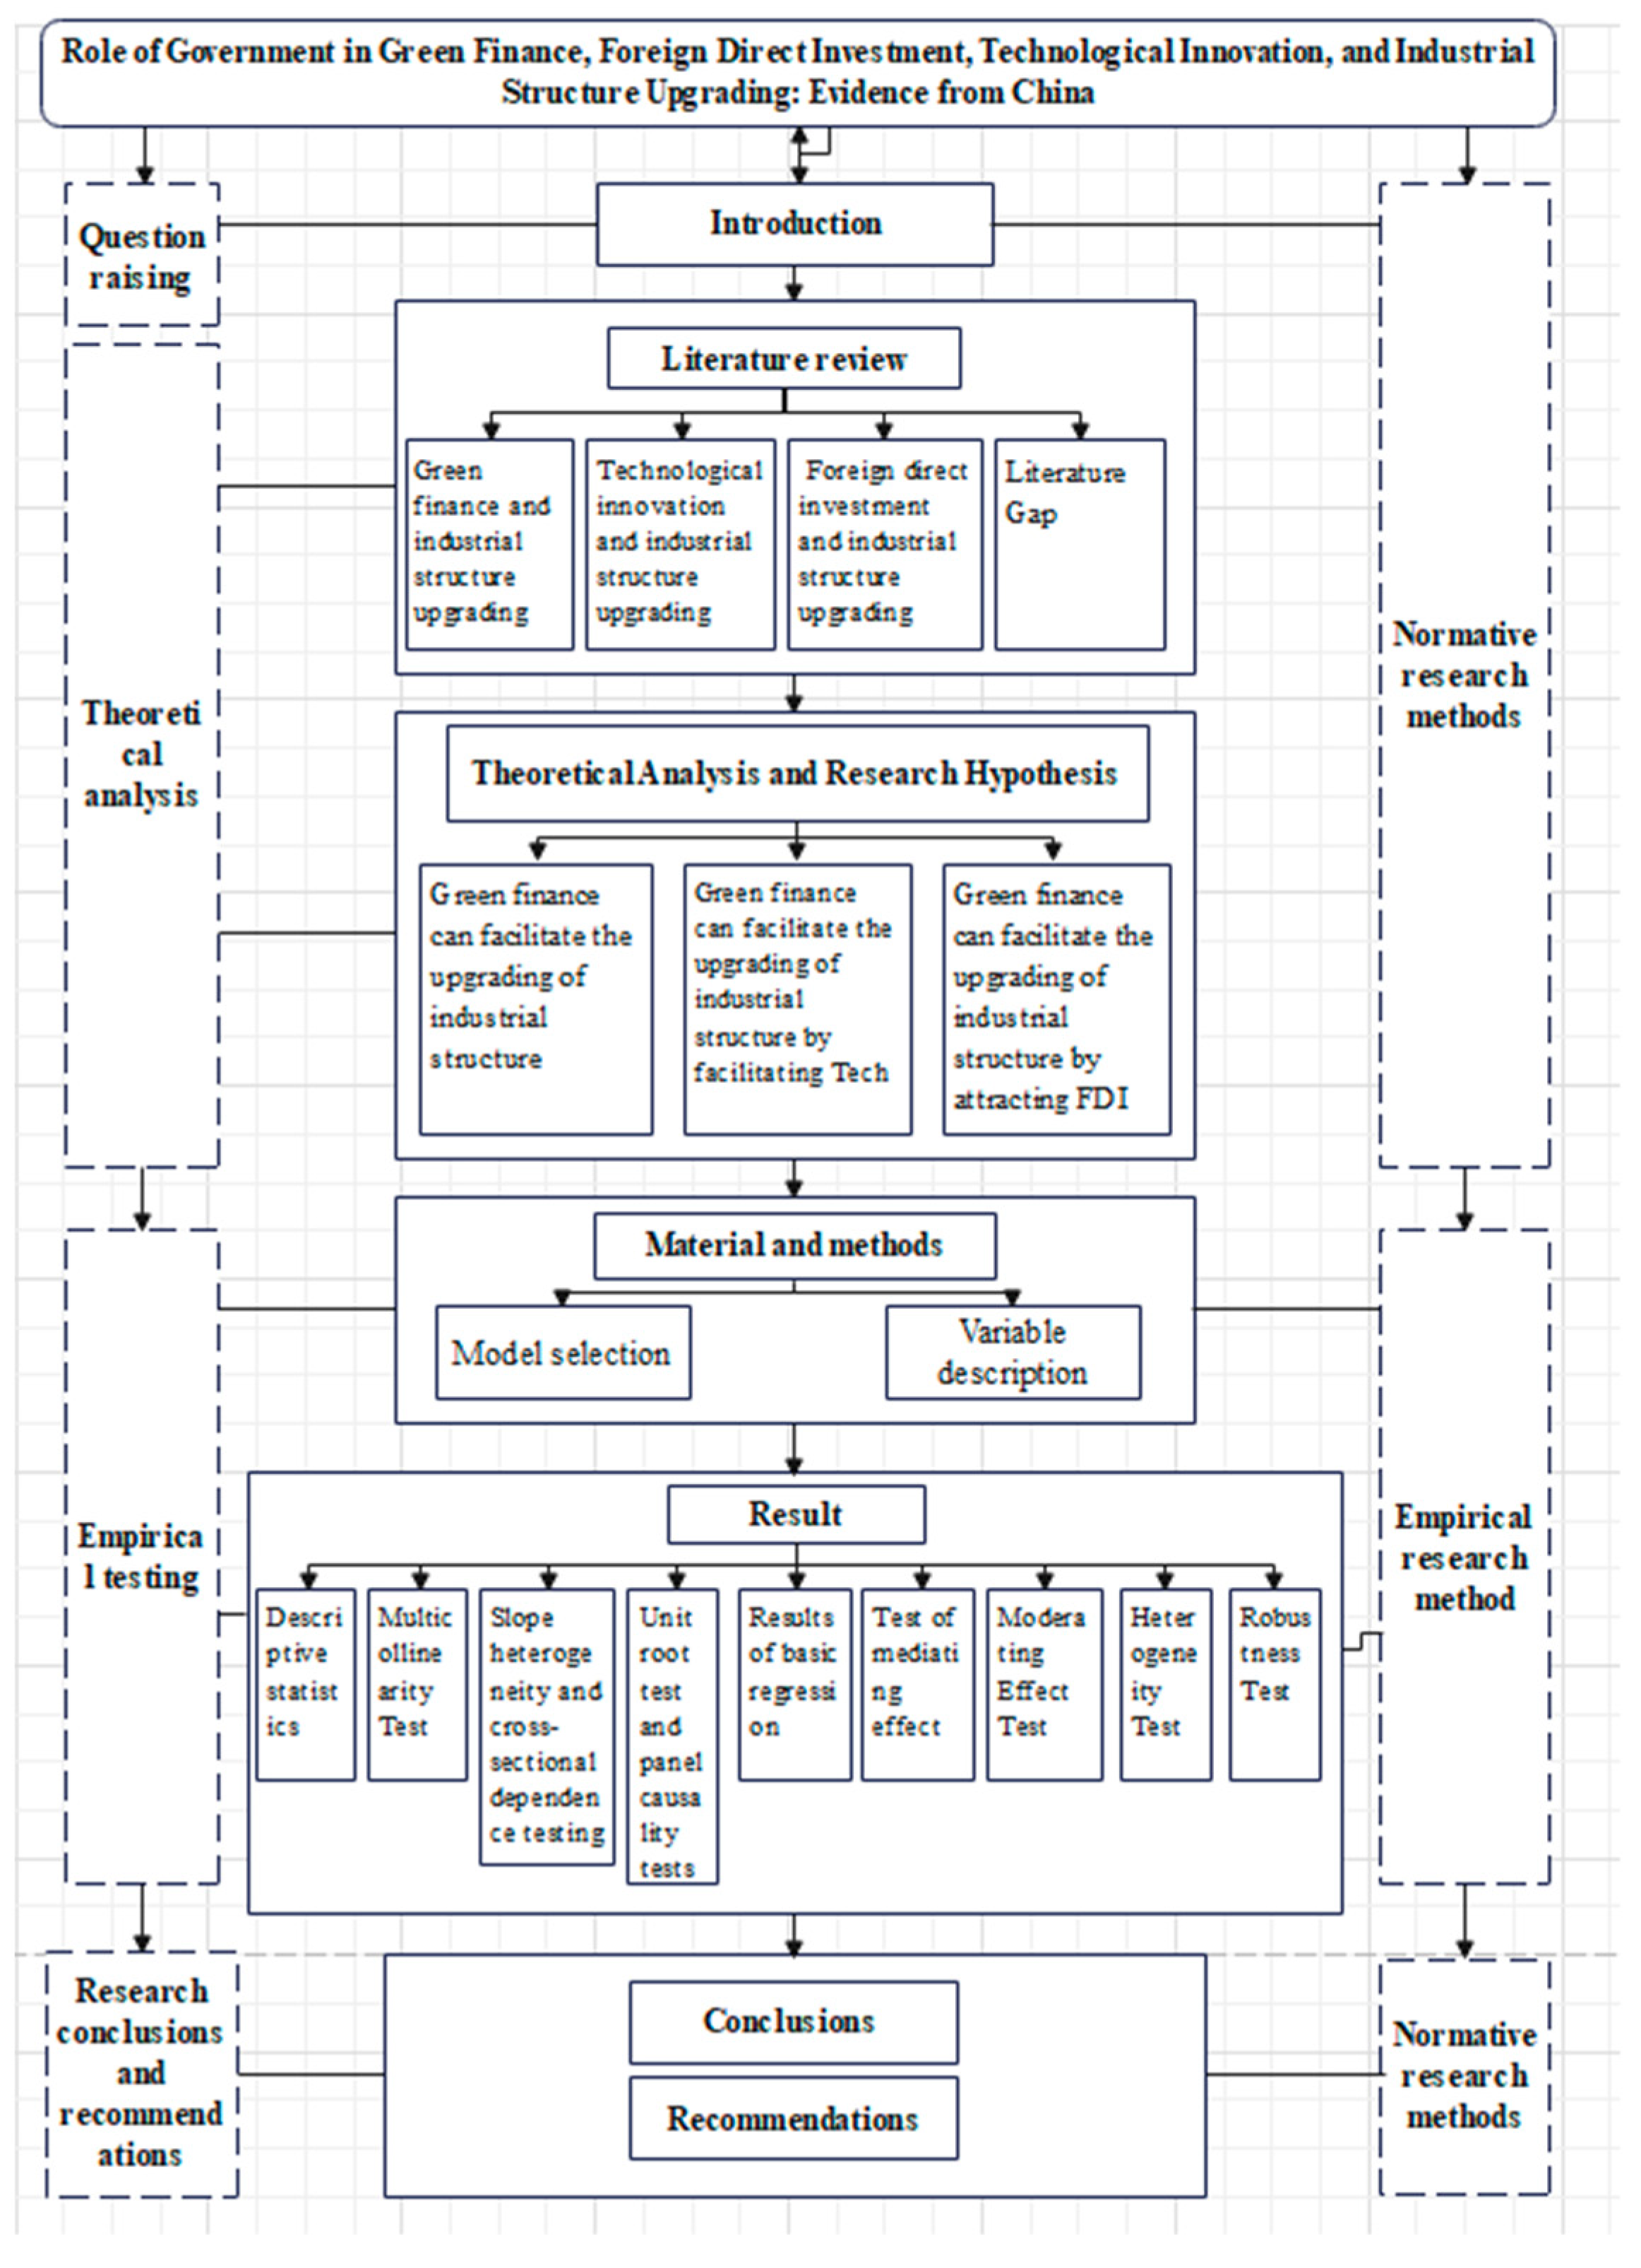
The structure of this article is organized as follows: Section 2 offers an extensive review of the relevant literature. Subsequently, Section 3 provides a comprehensive theoretical analysis and outlines the research hypotheses. In Section 4, the materials and methods employed in the study are described. Section 5 is dedicated to presenting the research findings and results. Lastly, in Section 6, the article culminates by drawing conclusions and presenting recommendations. The layout of this manuscript is also presented visually in the Figure 1.

2. Literature Review

2.1. Green Finance and Industrial Structure Upgrading

With the improvement of financial development, the financial industry is playing a crucial role in the real economy. Many scholars have conducted relevant studies on the effect of finance on economic development, IS, and ecological management. Rajan et al. made pioneering contributions to studying the effect of financial development on IS [12]. They believe that under the condition of a developed financial system, the degree of financial dependence is positively related to industrial development, and the more dependent the real economy is on finance, the easier it is for new industries to emerge. King and Levine found that the financial sector improves the output efficiency of the production sector by accelerating capital accumulation and optimizing capital allocation, and then promoting the upgrading of IS [13]. Patrick suggested that developing countries should give priority to the policy of capital provision to effectively facilitate economic development [14]. Moreover, the law of development also appears between and within industries. Hellman et al. proposed that the Government should actively conduct the flow and creation of capital in various industries by formulating financial policies [15]. Compared with traditional finance, GF tends to concentrate on the environmental effects and requires financial institutions to take the environment and sustainability into consideration in the process of business.
Salazar proposed the concept of environmental finance [11]. He deemed that GF could effectively link the environment and economy, achieve economic growth while balancing environmental protection, lead the flow of money market funds to environmental industries, and thus upgrade the IS. Jeucken discovered that the development of GF in banks plays a crucial role in facilitating resource conservation and sustainable economic development [16]. Labatt proposed that GF is a valid means to facilitate sustainable development and optimize the environment, which can diminish the risks caused by environmental disruption and help reduce environmental costs [17]. The innovation and application of GF instruments like green funds, green credit, green bonds, and green insurance can effectively promote economic development and regional IS upgrading [18]. Anderson pointed out that environmental finance can lead the development of new energy, resist the expansion of environmental pollution industries by innovating GF instruments, and then optimize and upgrade the industrial structure [19]. Scholtens believes that financial institutions should take the initiative to establish a financial market more conducive to environmental protection, reduce environmental pressure, and promote sustainable development [20].
In addition, new GF instruments and policies can also open new doors for green projects to achieve sustainable development and optimize industrial structure [21]. Falcone found that GF policies can accelerate the evolution of production and consumption patterns and ensure fair competition between traditional and green economies [22]. Muganyi et al. also proposed that GF policies and fintech development would help decrease sulfur dioxide emissions and be instrumental in investment plans for environmental protection [23]. Moreover, it is thought that GF development impacts the agricultural environmental protection industry and energy-intensive industry from different industrial levels [19,24]. GF can guide resources to the environmental industry, and it has restricted the capital lending of “two high and leftover” industries. GF promotes the industrial upgrading of the region by encouraging clean industries and restricting the development of highly polluting industries.
Furthermore, research by Dwivedi et al. shows that fintech significantly enhances the competitiveness of the banking industry in the United Arab Emirates. The combination of fintech and technology management directly affects the competitiveness of bank performance, which brings great flexibility to environmental protection work [25]. Many scholars have also conducted relevant research based on Chinese data. For example, the development of financial technology has reduced bank liquidity and increased diversity; promoted the transformation of banks into non-traditional industries [26]; promoted the development of emerging economies [27]; suppressed the financialization of physical enterprises [28]; promoted green environmental development; and achieved coordinated development of environment, resources, and economy [29].

2.2. Technological Innovation and Industrial Structure Upgrading

Technological innovation (Tech) plays a fundamental role in upgrading modern industrial structures and is a key factor in achieving high-quality economic development [30,31,32]. Numerous scholars have researched the influence of Tech on IS upgrading. Romer and Robert et al. put forward the endogenous economic growth theory [33,34], highlighting the role of technological progress in promoting IS adjustment. Tech leads to the emergence of new industries, and the agglomeration of these industries and the recombination of production factors accelerate the transformation of industrial structures [35]. Jin et al. argues that local governments, in their pursuit of improved regional environmental quality, increase investments in environmental governance and enhance environmental regulation [36]. This compels enterprises to engage in green production and green tech, thereby promoting IS upgrading.
Hu emphasizes the significance of human capital in green tech as it facilitates the integration of human resources and original enterprise resources, promotes the development of green tech, accelerates the dissemination and sharing of information and knowledge among innovation actors, and drives the transformation and development of the economy and IS [37]. However, green innovation is characterized by long cycles, high risks, and uncertain returns. Local governments often prioritize short-term and fast-paced projects, diverting science and technology expenditures to innovation projects that are perceived as “more, faster, better, and more efficient”, which can limit the investment in green technology innovation. This, in turn, hampers IS upgrading [38]. Knight and Wojcik suggest that the emergence of financial technology channels financial resources towards scientific and technological information fields [39]. This convergence enhances the production efficiency of other industrial sectors through industrial correlation effects, ultimately upgrading the region’s IS.

2.3. Foreign Direct Investment and Industrial Structure Upgrading

FDI has provided significant assistance in economic development [40]. Numerous studies have highlighted the significance of foreign capital in driving China’s economic growth [41]. FDI, as a combination of capital, technology, marketing, and management [42], fills the capital gap in regional economic development and facilitates technology transfer and management expertise to local enterprises. This technology transfer effect contributes to the continuous optimization of industrial structure [43]. Furthermore, the “pollution refuge” hypothesis emphasizes the need for ecological environment construction in developing countries [44]. Therefore, in its pursuit of high-quality development, China needs to transition towards green innovation.
Blalock and Gertler found that FDI can provide host countries with advanced innovative technologies, improve their technical levels through “learning by doing”, foster closer cooperation between industries, and consequently promote economic growth and optimize industrial structure [45]. Zhang also suggested that FDI breaks geographical limitations and transfers technology to other countries [46]. Host countries can imitate and learn from high-tech enterprises, introduce equipment or intermediate inputs biased toward technological progress for production, and assimilate and absorb technology. The combination of imitation, research, development, and production factors enhances the host country’s technical level and core competitiveness, promotes resource allocation, and further facilitates the upgrading of industrial structure.
Tanna conducted an empirical analysis on international samples of 566 listed commercial banks, collected from 2000 to 2004, and argued that the total influx of FDI improves the productivity of the banking sector, indirectly promoting industrial structure upgrading [47]. However, Tian et al. suggested that FDI may rely on the advantages of the industrial chain to acquire core technical talent from host countries through market mechanisms, while local enterprises may lack the impetus for innovation [48].

2.4. The Literature Gap

In summary, although there have been many studies on GF and industrial structure upgrading, there are still gaps in the following aspects. Firstly, previous research did not consider the mediating role of technological innovation and foreign direct investment between GF and industrial structure upgrading. Secondly, scholars have hardly studied the incentive effects of environmental regulation levels and government intervention levels. Finally, most of the literature only focused on the regional heterogeneity of GF, while this study simultaneously focuses on the regional and market heterogeneity of GF. Overall, this study fills this research gap and expands the research scope of GF.

3. Theoretical Analysis and Research Hypothesis

Some scholars investigated the relationship between GF and the upgrading of IS and found that GF is crucial for optimizing industrial structure [49]. Firstly, GF is a financial investment activity. Through the Government or financial institutions, GF ushers the transfer of funds from industries with overcapacity to those with low pollution or environmental protection, diminishes the financing cost of environmental industries, and optimizes resources to facilitate IS upgrading [11]. Moreover, the steady flow of capital into green industries leads to the transfer of intangible assets, such as brands and creativity. This facilitates the integration of industries and fosters a synergistic effect between intangible assets, ultimately contributing to the transformation of IS. Simultaneously, GF contributes to risk reduction by providing insurance for emerging industries or innovative projects characterized by high risks and potentially high yields. Therefore, it realizes the objectives of optimizing the IS and promoting sustainable development. Additionally, financial development endeavors to address environmental degradation and can be employed to adjust economic and industrial structures [10]. In light of these insights, we propose Hypothesis 1:
Hypothesis 1. 
Green finance can facilitate the upgrading of industrial structure.
Technological innovation (Tech) serves as a significant catalyst for the upgrading of IS and is a crucial factor in achieving sustainable development [32]. The implementation of a GF system effectively influences the level of scientific and technological innovation by utilizing its functions of resource allocation, capital provision, and risk diversification. This, in turn, promotes IS upgrading and the modernization of the industrial chain. First, green credit and other financial services encourage banks and insurance companies to offer low-cost and stable financial support for green products. This support extends to upstream and downstream enterprises within the green industry chain, thereby alleviating financing constraints and providing additional financing channels for enterprises. The diversification function of financial institutions helps mitigate technological innovation risks and optimize resource allocation, ultimately fostering technological progress. Furthermore, the advancement of green securities enables the issuance of securities to clean research and development enterprises, thereby increasing environmental premiums and reducing their financing costs. Simultaneously, the issuance of securities for financing by polluting enterprises can be restrained, compelling them to engage in green technology innovation activities. Additionally, green insurance, as an institutional arrangement, provides diversified protection and compensation for business risks faced by insured entities. A well-established insurance product system can effectively safeguard risks associated with Tech and stimulate the innovation vitality of companies.
Tech stimulates enterprise product upgrading, enhances production efficiency, improves production modes, stimulates demand structure, and facilitates technology diffusion, thereby providing an impetus for upgrading industrial structure [31,32]. Technological innovation leads to the widespread application of new technologies, equipment, and processes, creating new production environments and prospects. This impacts and eliminates outdated industries characterized by outdated technology, low efficiency, and poor quality, thus promoting industrial structure transformation and upgrading [30]. Secondly, scientific and technological innovation drives advancements in machinery and equipment, thereby promoting upgrading industrial production technology. This, in turn, enhances allocation efficiency, production efficiency, and product added value. The large-scale production facilitated by Tech also benefits the formation and accumulation of human capital, which aids in upgrading industrial structure [50]. Thirdly, technological innovation guides the direction of demand development and stimulates changes in demand structure, thereby facilitating IS upgrading. Finally, technological innovation strengthens the technological interconnection between different industries and departments in social production, facilitating the upgrading of IS through the diffusion effect of technology. Based on these insights, we propose the following hypothesis:
Hypothesis 2. 
Green finance can facilitate the upgrading of industrial structure by facilitating Tech.
GF supports environmental protection and sustainable development projects through capital markets and financial instruments. The development and implementation of GF policies provide financial support and a policy guarantee for green industries, create a good development environment, and attract FDI. The inflow of foreign capital improves economic benefits while realizing environmental protection and IS change [51]. It is worth noting that FDI can facilitate the upgrading of regional IS through direct and indirect effects. Direct effects refer to the influence of FDI on optimizing regional IS through capital input. FDI directly or indirectly entering the production field can improve the current situation of facing capital and technology constraints, and thus facilitate the upgrading of IS.
Indirect effects means that FDI can facilitate the optimization of regional IS through knowledge and technology spillover. FDI provides the Chinese economy with a number of advanced equipment, beneficial knowledge, advanced management experience, and excellent production technology [52]. FDI also upgrades the technical knowledge of the host country through training programs or technical assistance [46]. The technology spillover effect significantly improves the innovation ability of enterprises, improves the efficiency and output of sustainable projects, and then facilitates the upgrading of IS [45].
Additionally, the new FDI also puts pressure on domestic companies to act at a higher level of technical efficiency, and at the same time, leverages the global perspectives of foreign companies to broaden international channels for green finance and explore overseas markets, thus further promoting sustainable development and the upgrading of regional IS [43,53]. According to this, we put forward the following hypothesis:
Hypothesis 3. 
Green finance can facilitate the upgrading of industrial structure by attracting FDI.
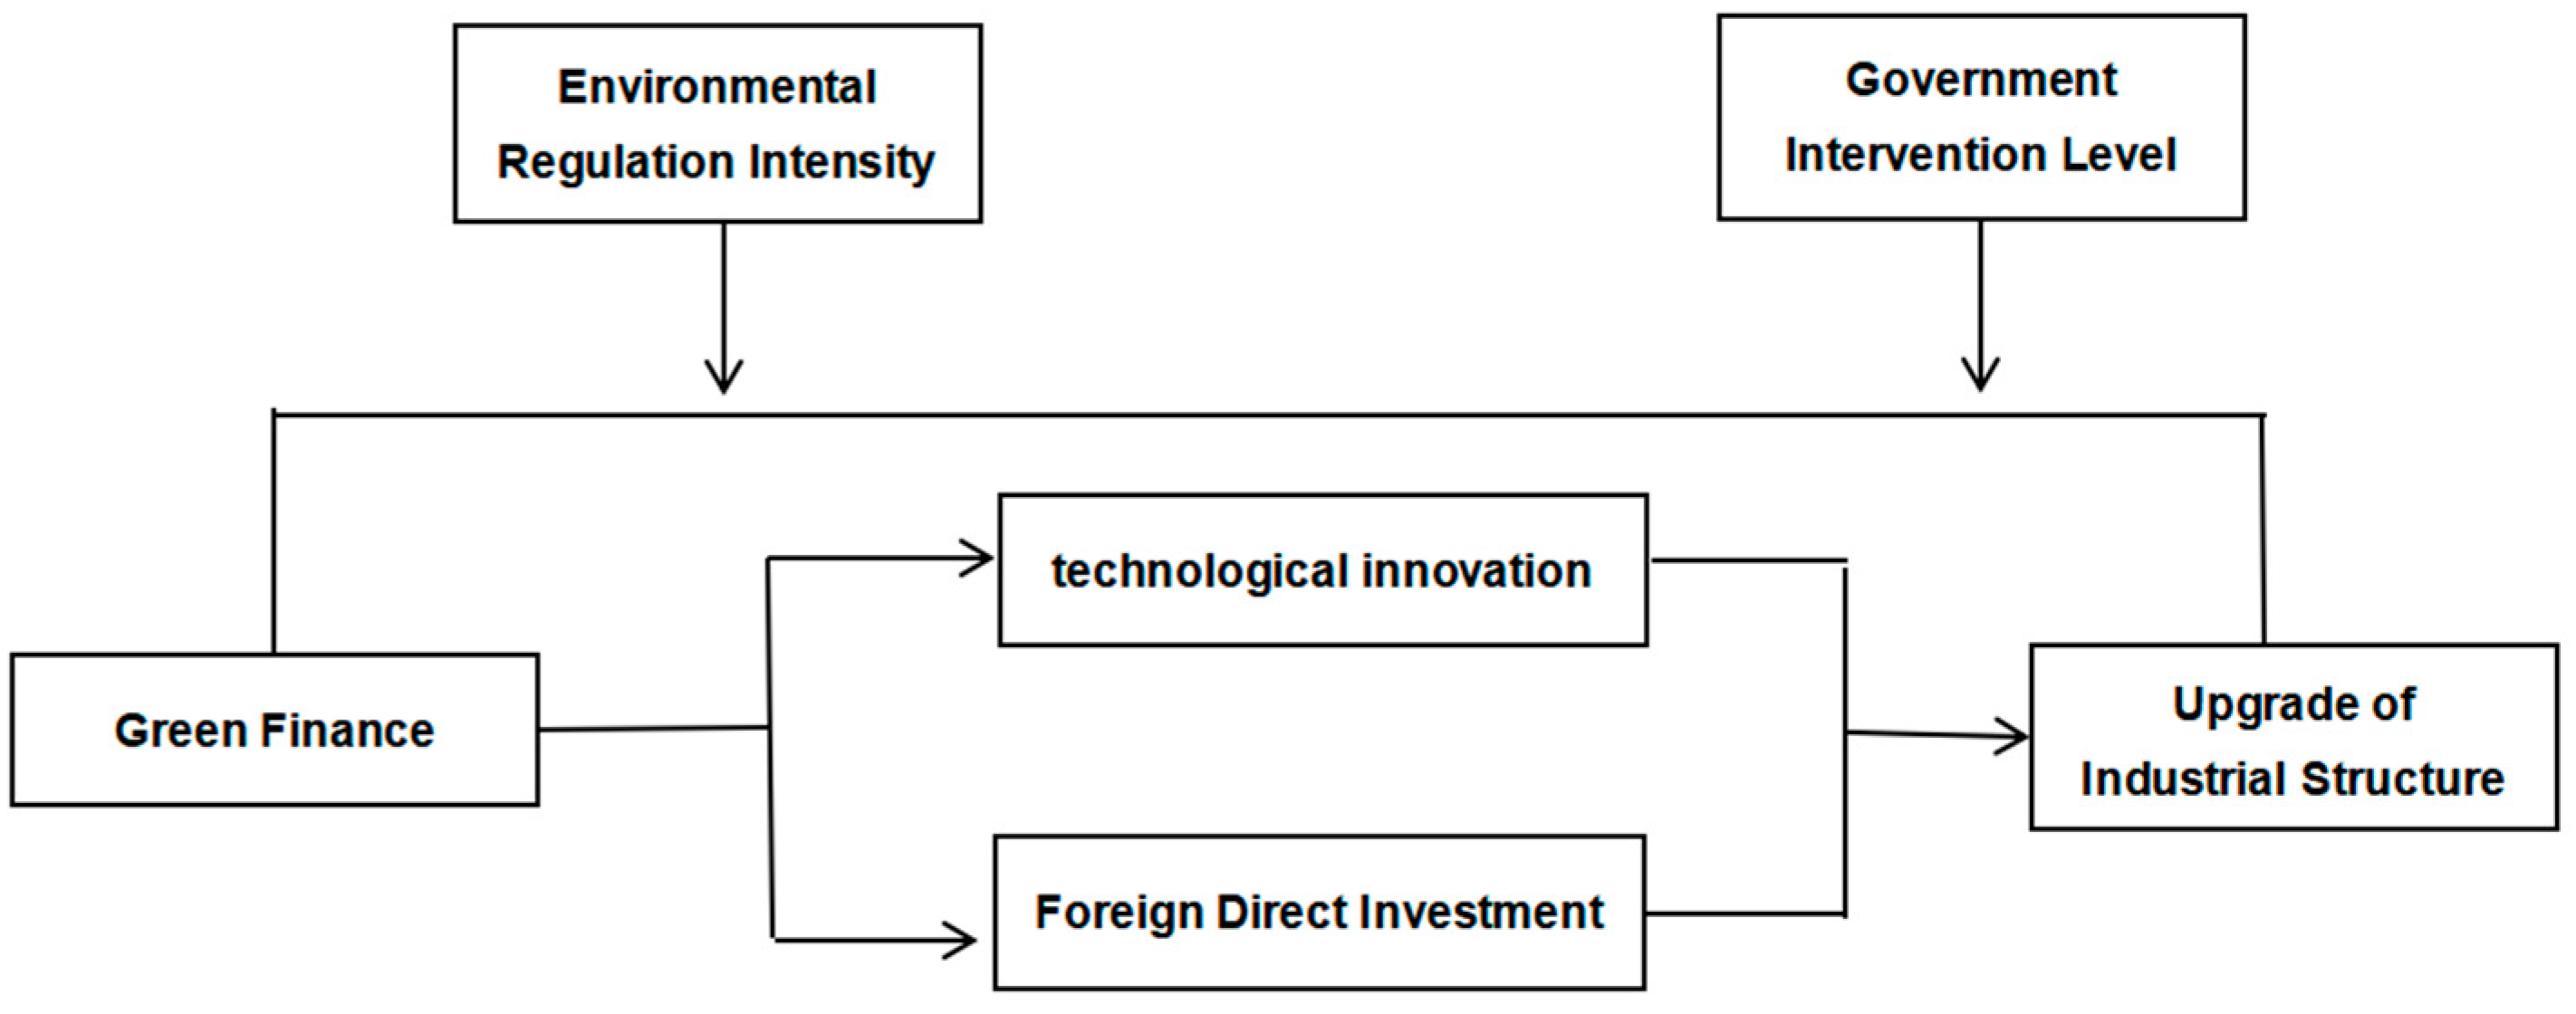
The theoretical model is shown in Figure 2.

4. Material and Methods

4.1. Model Selection

According to the above theoretical analysis, this study used the following basic regression model to investigate the effect of GF on the upgrading of IS. The basic regression model is as follows:
Isi,t = α + β1GFi,t + β2Urbani,t + β3PGDPi,t + β4HUMi,t + β5GTSi,t + ui + vt + εi,t
where i represents the province, t represents the year, ISit refers to the explained variable (industrial structure upgrading), and GFi,t represents the core independent variable (green finance). Urbani,t is the level of urbanization, PGDPi,t is the per capita GDP, HUMi,t is the level of human capital, GTSi,t is the Government’s scientific and technological support, ui stands for the fixed-effect of the province, vt represents the fixed-effect of the year, and εi,t represents the random component.
According to the above studies, green finance not only directly affects the upgrading of the industrial structure, but also indirectly affects it through Tech and FDI, as displayed in Figure 3.
In this study, Tech and FDI are mediating variables. According to the experiment by Baron and Kenny [54], we establish the following model for mediation testing. The mediation model is as follows:
Medi,t = ω1 + ω2GFi,t + ω3Urbani,t + ω4PGDPi,t + ω5HUMi,t + ω6GTSi,t + ui + vt + εi,t
Isi,t = ω1 + φ1GFi,t + φ2Medi,t + φ3Urbani,t + φ4PGDPi,t + φ5HUMi,t + φ6GTSi,t + ui + vt + εi,t
Among them, Med represents the two intermediary variables of scientific and technological innovation (Tech) and foreign direct investment (FDI). Model (2) tests the influence of GF on the two intermediary variables, and Model (3) tests the role of intermediary variables on the upgrading of IS.
Finally, so as to examine the regulatory effects of ERI, government intervention degree, and market orientation level on GF and IS upgrading, this research tested the regulatory effects of ERI, government intervention degree and market orientation level on GF and industrial structure upgrading utilize grouping regression.

4.2. Variable Description

4.2.1. Explanatory Variables

Green Finance (GF). The development level of GF can symbolize the support of the regional financial department for local green industries. Many scholars divided the GF index system into five parts: green credit, green securities, green insurance, green investment, and carbon finance. Zeng et al. studied green credit, which is represented by the ratio of high-energy-consuming industrial interest expenditure to the total industrial interest expenses using a reverse indicator [55]. Green securities are represented by the ratio of the A-share market value of green industry to the total A-share market value. The ratio of income from agricultural insurance expenses to gross agricultural product represents green insurance. Green investment is represented by the ratio of regional environmental governance investment to regional gross domestic product. Carbon finance is represented as a proportion of a region’s carbon dioxide emissions to its gross regional product. Since GF started late in China, there is no consistent approach to evaluating the GF index. This study chooses the approach of entropy weight, which can compute the weight of indicators according to the data of quotas. The smaller the difference between indicators, the greater the entropy value. By computing entropy, the evaluation index system can ultimately be comprehensively restructured [56]. At the same time, the entropy weight method does not consider subjective injection, and can show the mutual influence of quotas. Therefore, it is feasible to utilize the entropy weight approach to compute the GF indicators of each province. In this study, an entropy method is adopted to fit the above five indicators into the GF index, which symbolizes GF in each province. The computational procedure is as follows:
First, perform range standard method dimensionless processing.
For the positive indicator:
Z λ i j = ( X λ i j X min ) / ( X max X min )
For the inverse indicator:
Z λ i j = ( X max X λ i j ) / ( X max X min )
Second, perform normalization processing.
P λ i j = Z λ i j / λ = 1 h i = 1 m Z λ i j
The third step is to calculate the entropy of each index.
E j = K λ = 1 h i = 1 m P λ i j ln P λ i j
where
K = 1 ln ( h · m )
The fourth step is to calculate the redundancy of the entropy of each index.
D j = 1 E j
The fifth step is to calculate the weight of each index.
W j = D j / j = 1 n D j
Sixth, calculate the green finance development index.
G F ij = j = 1 30 W j · x λ i j

4.2.2. Explained Variables

Industrial structure upgrading (IS) refers to the process or trend of industrial structure transformation from a low-level to high-level form; it is the change of the situation of economic development and the transformation of the economic development pattern. With information technology and intelligent manufacturing, modern agriculture, manufacturing and service industries are integrated in the industry chain. With the high degree of industrial integration, the industrial boundary gradually blurs. New models will continue to emerge, and the reconstruction of modern industrial systems will continue to advance. Therefore, the proportion of modern agriculture and industry with high technology content is also a major criterion for measuring IS. According to the features of the IS, this study measures the upgrading of our IS using an advanced industrial structure. The advanced industrial structure is computed as follows:
ISi,t = T1i,t × 1 + T2i,t × 2 + T3i,t × 3
where, T1, T2 and T3 symbolize the ratio of added value of the three major industries to the regional GDP of i province in t year, respectively. The higher the IS value, the higher the level of industrial structure.

4.2.3. Intermediary Variables

Combined with the above analysis, this study selects technological innovation (Tech) and FDI as the intermediary variables. Tech is the foundation and driving force of IS. This study symbolizes the degree of Tech with the amount of scientific research funding invested by provinces. In order to avoid domestic environmental regulations, foreign capital will often transfer industries to countries with low environmental regulations. Foreign direct investment (FDI) has a significant effect on economic development and industrial transformation. This article uses the actual amount of foreign investment to represent the level of FDI.

4.2.4. Adjust Variables

Environmental regulatory intensity (ERI) reflects society’s tolerance for high-pollution and high-emission enterprises. The greater the ERI, the stricter the law enforcement will be, and the more detrimental it will be to the development of “two-high-high-leftover” enterprises. In this study, the entropy method was used to compute the overall index of ERI in each province by using the relevant data for industrial wastewater discharge, industrial sulfur dioxide discharge, and industrial soot discharge. Government intervention (Gov). Under the special national conditions of China, as the main bearer of public affairs, the Government’s participation in economic activities will have a series of impacts on economic development. Therefore, the ratio of fiscal expenditure in GDP was used in this study to reflect intervention level of the Government.

4.2.5. Control Variables

In order to investigate other influencing factors of IS, we selected the urbanization process, economic development level, human capital level, and government scientific and technological support as control variables. The identification of control variables is shown in Table 1. The urbanization process (Urban), which can facilitate the redistribution of social resources, is one of the significant influencing factors of each province’s IS. In this study, the proportion of urban population in the total population is logarithmic to symbolize the urbanization level. The economic development level (PGDP) can be regarded as the basis of industrial development. This variable is measured using per capita GDP. Human capital level (HUM) indicates that labor structure has a substantial influence on IS change, and high-quality talent can help promote each province’s IS. This article uses the logarithm of the proportion of the number of college students to the total population of the region to represent the human capital level of each province. Government technology support (GTS) is a significant influencing factor in promoting technological innovation, which helps to facilitate IS upgrading. This variable symbolizes the Government’s support for technology by taking the logarithm of the ratio of government expenditure in the field of technology to total fiscal expenditure.

4.2.6. Data Sources

In an effort to investigate the function of GF in the upgrading of IS, we selected data from 31 provinces, collected from 2007 to 2021, as samples. The original data of IS are from the Provincial Statistical Yearbook and the China Statistical Yearbook. The original data of GF development index and other variable data are from the websites of authoritative institutions such as the Bureau of Statistics and various authoritative statistical yearbooks, such as the China Industrial Statistical Yearbook and the China Financial Statistical Yearbook. These variables are described in Table 1.

5. Results

5.1. Descriptive Statistics

Table 2 presents the descriptive statistical outcomes of the research variables. The industrial structure status of different provinces is dissimilar, as shown in Table 3, where the mean value of IS is 2.306, the minimum value is 2.15, the maximum value is 2.80, and the standard deviation is 0.131. A large standard deviation indicates that the IS of each province needs to be upgraded. The mean value of the explanatory variable GF is 0.715, and the standard deviation is 0.093, indicating that different degrees of GF development in different provinces will have influence on the upgrading of IS. In addition, Urban, PGDP, HUM and GTS showed different degrees of differences among provinces.

5.2. Pairwise Correlation Test/Multicollinearity Test

Table 3 displays the relevance between the variables. The relevance between GF and industrial structure upgrading is prominent at the 1% level. The related coefficient can only reflect the same or reverse change relationship between the two. To uncover the influence of GF on the IS, multiple regression analysis must be conducted under further control of other variables. Moreover, the absolute value of the correlation coefficient between other variables is essentially lower than 0.6, implying that there is no weighty multicollinearity problem. Combined with the variance expansion factor index after regression, the adverse effect of multicollinearity on the regression results is effectively eliminated.

5.3. Slope Heterogeneity and Cross-Sectional Dependence Testing

After descriptive analysis, slope heterogeneity and cross-sectional dependence tests were conducted on the variables. When examining the relationships between all selected variables in the panel data model, cross-sectional dependency is a key issue, and ignoring it may lead to severe estimation bias and size distortion [57]. Therefore, before the estimation process begins, slope heterogeneity and cross-sectional dependence tests should be conducted first. Firstly, using Zheng’s research for slope heterogeneity testing [58], the results of the slope heterogeneity test are shown in Table 4. The statistical values of the slope coefficient test are significant at the 1% level, rejecting the original assumption of homogeneity and indicating the existence of heterogeneity between variables. Therefore, further testing was conducted on the cross-sectional dependence of variables.
Table 5 shows the results of cross-sectional dependency testing , all of which are significant at the 1% significance level, indicating that the null hypothesis of non-interdependence is rejected, and all variables are interrelated and dependent on each other at the cross-sectional level. In addition, this test used a Pesaran CD test, as shown in Table 6, leading to conclusions consistent with those of Shahbaz, M. et al. [59].

5.4. Unit Root Test

Given the cross-sectional dependence of panel data, the first-generation traditional panel unit root test is no longer applicable. Therefore, we draw inspiration from the second-generation panel unit root test proposed by Pesaran [60], which considers cross-sectional correlation, and the Pesaran cross-sectional enhanced IPS (CIPS) test. The stationarity results are shown in Table 6. IS, PGDP, HUM, and GTS showed significant differences at the first difference, while GF and Urban were significantly negative at the 1% significance level. The significance of the results negates the null hypothesis of stationarity, indicating that the variable is stationary.
Through the unit root test, it was observed that the data are stable, so we conducted a causal relationship test to examine the relationships between variables. The results show a significant correlation between variables.

5.5. Results of Basic Regression

In this study, we took GF as an explanatory variable and empirically studied its impact on IS upgrading using the OLS model. Table 7 displays the results of the primary result test. When the annual and provincial fixed results are not controlled, the coefficient of GF on the overall industrial structure is significantly positive at a 1% level. On the basis of control year and fixed results for provinces, column (3) displays that the coefficient of GF is prominent. The results in column (4) show that even after adding additional control indicators, the coefficient of GF is still prominent, and the coefficient is 0.166. This indicates that the development of GF is instrumental in the upgrading of IS, which proves Hypothesis 1.
In addition, considering that the development of GF in that year may be affected by the development of GF in the previous year, the IS of that year may also be affected by the IS of the previous year. Therefore, this study also uses the dynamic panel data model (GMM) to retest the relationship between GF and IS. Columns (5) and (6) report the regression results of the system generalized moment estimation and differential generalized moment estimation, respectively. Moreover, the GF coefficient is still significantly positive, indicating that the development of GF significantly promotes the upgrading of IS, which is consistent with the OLS regression results and Hypothesis 1.
Our results are consistent with those of previous research, including those of Rajan et al., King and Levine, Patrick, and Hellman et al., who all concluded that the development of GF can promote IS upgrading [12,13,14,15]. In addition, this conclusion is consistent with Sun’s results on the development of GF in five Asian countries, and both confirm the positive role of GF [61]. Panagariya’s study, taking India as an example, also proposed that the development of the financial sector promotes the rise of high-tech industries, greatly promoting the upgrading of industrial structure [62].

5.6. Test of Mediating Effect

5.6.1. Mediating Effect of Tech

In Table 8, columns (1) and (2) illustrate the results of the intermediary role of Tech. The estimated result of GF is significantly increased in column (1), indicating that GF supports Tech. Column (2) indicates that when the intermediate variable Tech is joined to the primary regression, the GF coefficient becomes significant, as does the Tech coefficient. Furthermore, the Z-value of the Sobel test is significant, that is, GF can facilitate the upgrading of IS by promoting Tech, which verifies Hypothesis 2. At the same time, this coincides with the research conclusions made by some scholars based on empirical evidence from other Asian countries, such as the study of the six ASEAN countries and South Asian countries [63,64].

5.6.2. Mediating Effect of Foreign Direct Investment

Columns (3) and (4) in Table 8 show the test outcomes of the intermediary effect of FDI. In the light of the outcomes shown in column (1), GF has a increased and prominent influence on FDI at the 5% level, implying that GF can attract FDI. Column (2) shows that when FDI is an intermediary variable, the coefficient of FDI is prominent, and the coefficient of GF on the upgrading of IS is also positively significant at the 5% level. Moreover, the Z-measure of Sobel test is also prominent, implying that FDI plays an intermediary role between GF and the upgrading of IS. In summary, GF plays an intermediary role in upgrading industrial structure, which can be further promoted by accelerating Tech and attracting FDI.
Overall, the mediating effects of technological innovation and foreign direct investment obtained in this study are consistent with the conclusions obtained in previous research. Green finance can promote industrial structure upgrading by accelerating technological innovation and attracting foreign direct investment. This conclusion coincides with the research findings of scholars such as Romer and Robert et al. and Blalock and Gertler [33,34,45].

5.7. Moderating Effect Test

5.7.1. Moderating Effect Test of Environmental Regulation Intensity

The intensity of ERI is one of the most important factors for adjusting the impact of GF on the upgrading of IS. Porter and Linde believe that reasonable environmental regulation can motivate firms to further optimize resource allocation and elevate their technical level [65], so as to incite the “innovation compensation” effect of firms, improve production efficiency, and further facilitate the upgrading of IS in various provinces. The existence of environmental regulations causes local governments and firms to emphasize green governance. The development of GF offers more financial support for green innovation, increases research and development investment, stimulates innovation investment, stimulates the innovation motivation of enterprises, and drives enterprise innovation [66,67,68,69], thus promoting enterprise technology diffusion and IS upgrading.
This research tests the regulatory effect of ERI on the industrial structure of GF. The regression outcomes are displayed in column (1) of Table 9. The cross-multiplication coefficient of GF and ERI significantly increases at the 5% level, and the coefficient of GF development is also prominent, with an intensity effect of 2.295. This indicates that every 1% increase in the interaction term of GF and ERI (GF × ERI) increases the average industrial structure upgrading index by 2.295%. This means that ERI has a forward moderating effect on the relationship between GF and IS upgrading. This conclusion is consistent with the results of Porter and Linde, as well as those of Ford et al. [65,69], who believe that ERI strengthens this promoting effect.

5.7.2. Moderating Effect Test of Government Intervention Level

Given the basic national conditions of China, it is essential to add the impact of China’s special institutional background. The most evident performance of this institutional background is government intervention. Most studies have explored the influence of interventionism on enterprise performance, financing path, or resource allocation, and thus innovation input, which will influence the upgrading of IS. To maximize short-term benefits, the Government usually intervenes in the direction of capital flow and investment field [70] due to the financial pressure of the Government and political promotion. As a result, the financial support provided by GF is difficult to apply to innovative projects. The distorted allocation of financial resources causes long-term innovation input to lag behind productive input, and innovation cannot be rationally allocated resources, which hinders the upgrading of IS. The greater the degree of local government intervention, the more distorted the investment in technological innovation, thus limiting the upgrading of IS.
In addition, government intervention will have an impact on talent allocation, resulting in the process of talent allocation optimization blocked, excessive government intervention will encourage rent-seeking activities, resulting in human capital mismatch [71], the lack of high-tech talents indirectly leads to the lack of enterprises’ ability to absorb and transform new technologies. Hinder the upgrading of IS [72].
This study tests the regulatory effect of the Government’s intervention level on the IS upgrading of GF, and the regression outcomes are displayed in column (2) of Table 9. The cross-multiplier coefficient between GF and government intervention level is significant at the 1% level, the coefficient is −0.170, and the development of the coefficient of GF is positive and significant. This reveals that excessive government intervention inhibits the facilitating effect of GF development on industrial structure upgrading. This coincides with the conclusions of Vollrath and Glaeser and Scheinkman [70,71], which all affirm the positive effect of intervention levels on outcomes.

5.8. Heterogeneity Test

5.8.1. Regional Heterogeneity

Regional disparity has an important influence on industrial structure adjustment. Due to different natural resources and factor endowments in different regions, different modes of production and living habits form. These regional heterogeneities will significantly affect industrial upgrading and structural adjustment in terms of technological innovation and GF development. At present, the development of GF in various regions can facilitate the upgrading of IS, but the effect is significantly different between provinces. For a long time, coastal and inland areas has been divided, and their regional natural differences and policy differences have deeply influenced the role of technological innovation on industrial upgrading and transformation.
This article divides the province into coastal and inland regions. First, descriptive statistics of GF and IS in different regions are presented, and the research conclusions are displayed in Table 10. Coastal areas are the best for the development level of GF, while inland areas are the worst. The major reason for this is that coastal areas have a high level of economic development and a relatively good environment for GF development. For industrial structures—from the average, median, minimum, and maximum—the development degree of coastal areas is better, while that of inland areas is relatively poor. Previously developed coastal areas have a comparatively comprehensive infrastructure and high level of technological innovation, which are conducive to the overall upgrading of industrial structure. These outcomes offer a basis for further study of regional differences regarding the influence of green finance on the upgrading of industrial structure.
The regression results for coastal and inland areas are displayed in Table 11. According to the regression outcomes, GF prominently promoted the upgrading of IS in the eastern region, while the regression coefficient in the western region was not prominent. The major reason for this is that, compared with inland areas, coastal areas have an earlier start time in economic development, a higher level of development, a more complete economic development system, and a fuller use of green finance. Therefore, these areas have the “first-mover advantage”. In addition, coastal areas have abundant resources, a more advanced level of Internet development, a prosperous environment, adequate capital and high-level talents to make full use of the advantages brought by green finance. The economic development level in inland regions is relatively low, the development mode is more traditional, and the lack of elite talents and platforms is not conducive to green finance playing a positive role.

5.8.2. Market Heterogeneity

The crux to the upgrading of IS lies in the optimal allocation of resources and technological innovation, but it is also affected by the market environment. Therefore, the degree of market orientation is an essential element when investigating the function of GF on IS upgrading. In [73], the degree of market orientation is obtained from the “China Province Index Report”, edited by Wang Xiaolu and Fan Gang. Additionally, according to the median of market orientation indicators, the whole study specimen is divided into either a high market orientation sample and low market orientation sample, and the market heterogeneity is investigated by group regression.
The outcomes are displayed in Table 12. In the sample group with a high market orientation, the coefficient of GF is prominent, while in the sample group with a high market orientation, the coefficient of GF is not prominent, implying that in regions with a high market orientation degree, GF has a better facilitating function on the upgrading of IS. Market-oriented development can facilitate the improvement of market resource allocation ability and innovation level. A higher degree of market orientation contributes to the free development of GF, and the busy market environment makes it easy for GF to play a role in the upgrading of IS. In short, a higher degree of market orientation strengthens the role of GF in facilitating the upgrading of IS.

5.9. Robustness Test

5.9.1. Replace Explained Variables

In this study, industrial structure rationalization (AIS) was used to replace the explanatory variable. AIS is represented by the ratio of added value of tertiary industry in the GDP of each province. The study outcomes are displayed in Table 13. Despite the inclusion of control variables, the coefficient of GF is still prominent and significant. This again shows that GF can significantly facilitate the upgrading of IS, the same result as previous conclusions.

5.9.2. Endogenous Testing

This study utilizes the instrumental variable (IV) method to execute an endogenous trial to remove the endogeneity generated by bidirectional causality and other elements. In general, the structure of the industry next year will be influenced by the development of GF this year. Therefore, this study chooses the first-order lag term of GF as the instrumental variable. On the other hand, the development of GF last year may affect the development of GF next year. The rapid development of GF in the previous year will actively facilitate the development of GF projects in the next year. Therefore, the first-order lag term meets the relevant requirements for instrumental variables. The outcomes are displayed in Table 14. Column (1) shows the first phase outcomes. As the IV has successfully passed the trials of independence, weak instrumental variables, and identification, the first-order lag term of GF is prominent, expressing that there is a high correlation between instrumental elements and GF. The instrumental elements chosen in this research are valid. Column (2) displays the results for the second stage. GF still plays an extremely important role in facilitating the upgrading of IS, which shows that the inference is sure-footed even when endogenous problems are considered.

6. Conclusions and Recommendations

6.1. Conclusions

This research uses data from 31 Chinese provinces, spanning the period from 2007 to 2021, to investigate the direct and indirect impacts of GF on IS upgrading through the channel of FDI and technological innovation. Moreover, the study analyzed the moderating role of the intensity of regulations and government intervention in the relationship between GF and IS upgrading.
The study yields the following conclusions: Firstly, the results demonstrate that the development of GF positively influences the upgrading of IS, and these results withstand a series of stability tests. Secondly, green finance facilitates the upgrading of IS by advancing Tech. It serves as a catalyst for innovation, driving the adoption of new technologies, processes, and equipment, and then facilitating the upgrading of IS. Thirdly, green finance attracts FDI and facilitates the transfer of advanced technology and capital. This inflow of FDI and technological advancements further accelerates innovation within industries, consequently promoting the upgrading of IS.
Fourthly, ERI exhibits a forward moderating function on the relationship between GF and the upgrading of IS. Specifically, as the intensity of ERI increases, the promoting effect of GF on industrial structure upgrading strengthens. Fifthly, excessive government intervention impedes the promoting function of GF on the upgrading of IS. With an increase in government intervention, the positive influence of GF on industrial structure upgrading diminishes. Sixthly, the facilitating effect of GF on the upgrading of IS demonstrates regional heterogeneity. In coastal provinces with a high level of economic development, GF plays a pivotal role in facilitating the upgrading of IS, whereas in inland areas, the promoting effect is negligible. Lastly, the promoting function of GF on the upgrading of IS exhibits market heterogeneity. In regions characterized by a higher level of market-oriented, the effect of GF on IS upgrading is prominent. Conversely, in regions with a lower level of market-oriented, the effect is not prominent.

6.2. Suggestions

Based on the above conclusion, this study offers the following suggestions: Firstly, it is essential to facilitate the innovation of GF instruments and enhance the overall GF system. To achieve this, China should increase the innovation of GF instruments, strengthen the capacity of GF to allocate factor resources and support the green industry. Additionally, there should be efforts to raise awareness and facilitate the concept of GF both domestically and internationally. This will help improve the recognition of China’s GF policies, standards, and products within the global community, particularly in the context of favorable industrial green transformation development.
Secondly, there should be strong support for scientific and technological innovation. Green finance can play a crucial role by offering adequate and stable funding, alleviating financing constraints, optimizing resource allocation, and dispersing operational risks. These measures will accelerate technological innovation and enhance resource utilization efficiency.
Thirdly, efforts should be made to intensify opening-up initiatives to attract FDI and fully leverage foreign capital. This can be achieved by improving the preferential policies for green finance, creating a favorable business environment, and attracting foreign investment that brings valuable knowledge, advanced management experience, and excellent production technology. This will significantly contribute to the upgrading of the IS.
Fourthly, it is crucial to strengthen the construction of policy channels for environmental regulation and enhance the efficiency of their implementation. The influence of ERI on the upgrading of IS should be fully utilized, and tailored encouragement and regulation measures should be implemented based on the specific features of different industries. Each province should adopt appropriate environmental regulation measures aligned with its unique industrial structure and resource endowment conditions. By effectively leveraging the influence of ERI on IS optimization, regional industrial transformation and high-quality economic development can be promoted.
Fifthly, there is a need to reduce the level of government intervention and allow the market to play a critical role in resource allocation. Vertical management and law enforcement should be implemented to minimize local interference. Lastly, considering the unbalanced development levels of GF within China, the Government should offer targeted policy support to inland regions and areas with a low degree of market orientation. This support will help improve their industrial structure and contribute to their overall development. By implementing these recommendations, China can facilitate the effective upgrading of IS, foster sustainable economic development, and capitalize on the potential of GF to drive positive change.

Author Contributions

This study is the result of a collaboration between the three authors. C.W.: conceptualization, methodology, software, data curation, formal analysis, writing—original draft. G.Q. and Z.A.: writing, review and editing, supervision. M.A.: writing—original draft, writing, review and editing. All authors have read and agreed to the published version of the manuscript.

Funding

This research was funded by National Social Science Foundation of China (grant number 20BJY031; 21BJY077); Shandong Province Natural Science Foundation Project (ZR2019MG034).

Institutional Review Board Statement

Not applicable.

Informed Consent Statement

Not applicable.

Data Availability Statement

Some or all data and models that support the findings of this study are available from the corresponding author upon reasonable request.

Conflicts of Interest

The authors declare no conflict of interest.

References

  1. He, J.; Lau, W.T.; Liu, Y. Innovative Production Efficiency in Chinese High-Tech Industries during the 13th Five-Year Plan: Evidence from a Three-Stage DEA Model. Green Low Carbon Econ. 2023, 1–12. [Google Scholar] [CrossRef]
  2. Ma, X. Environmental Regulation and Public Environmental Concerns in China: A New Insight from the Difference in Dif-ference Approach. Green Low Carbon Econ. 2023, 1, 60–67. [Google Scholar] [CrossRef]
  3. Song, R. Digital finance, Green Innovation and environmental pollution. BCP Bus. Manag. 2022, 19, 526–541. [Google Scholar] [CrossRef]
  4. Yang, W.; Zhang, N. Does the Carbon Emissions Trading Scheme Improve Carbon Total Factor Productivity? Evidence from Chinese Cities. Green Low Carbon Econ. 2023, 1–10. [Google Scholar] [CrossRef]
  5. Gong, Q.; Ying, L.; Dai, J. Green finance and energy natural resources nexus with economic performance: A novel evidence from China. Resour. Policy 2023, 84, 103765. [Google Scholar] [CrossRef]
  6. Xiang-Chao, P. In Research on Ecological Civilization Construction and Environmental Sustainable Development in the New Era. IOP Conf. Ser. Earth Environ. Sci. 2018, 152, 062080. [Google Scholar] [CrossRef]
  7. Liu, D. Does green finance and natural resources agglomeration have potential for green economic growth? Evidence from Asian perspective. Resour. Policy 2023, 84, 103720. [Google Scholar] [CrossRef]
  8. Chi, Y.; Yang, Y. Green finance and green transition by enterprises: An exploration of market-oriented governance mechanisms. Borsa Istanb. Rev. 2023, 23, 628–646. [Google Scholar] [CrossRef]
  9. Cui, M.; Han, L. Research on the Current Situation, Challenges and Path of Green Finance Development in China under the Background of “Double Carbon”. Highlights in Business. Econ. Manag. 2023, 6, 15–23. [Google Scholar] [CrossRef]
  10. Gao, L.; Tian, Q.; Meng, F. The impact of green finance on industrial reasonability in China: Empirical research based on the spatial panel Durbin model. Environ. Sci. Pollut. Res. 2023, 30, 61394–61410. [Google Scholar] [CrossRef]
  11. Salazar, J. Environmental finance: Linking two world. In Proceedings of the Workshop on Finance Innovations for Biodiversity Bratislava, Bratislava, Slovakia, 1–3 May 1998. [Google Scholar]
  12. Rajan, R.; Zingales, L. Financial Dependence and Growth. Soc. Sci. Electron. Publ. 1998, 88, 559–586. [Google Scholar]
  13. King, R.G.; Levine, R. Finance, entrepreneurship, and growth: Theory and evidence. J. Monet. Econ. 1993, 32, 513–542. [Google Scholar] [CrossRef]
  14. Patrick, H.T. Dollar, Dollar, Who Has the Dollar?--Relationship between the Japanese and American Balance of Payments. Asian Surv. 1966, 6, 434–447. [Google Scholar] [CrossRef]
  15. Hellmann, T.; Murdock, K.; Stiglitz, J. Financial Restraint: Toward a New. In The Role of Government in East Asian Economic Development: Comparative Institutional Analysis; Clarendon Press Oxford: Oxford, UK, 1998. [Google Scholar]
  16. Jeucken, M. Sustainable Finance and Banking: The Financial Sector and the Future of the Planet. In Sustainable Finance and Banking: The Financial Sector and the Future of the Planet; Earthscan Publication Ltd.: London, UK, 2010. [Google Scholar]
  17. Labatt, S.; White, R.R. Environmental Finance: A Guide to Environmental Risk Assessment and Financial Products; John Wiley & Sons: Hoboken, NJ, USA, 2002; Volume 98. [Google Scholar]
  18. Climent, F.; Soriano, P. Green and good? The investment performance of US environmental mutual funds. J. Bus. Ethics 2011, 103, 275–287. [Google Scholar] [CrossRef]
  19. Anderson, J. Environmental Finance. In Handbook of Environmental and Sustainable Finance; Elsevier: Amsterdam, The Netherlands, 2016; pp. 307–333. [Google Scholar]
  20. Scholtens, B. Why Finance Should Care about Ecology. Trends Ecol. Evol. 2017, 32, 500–505. [Google Scholar] [CrossRef] [PubMed]
  21. Sachs, J.D.; Woo, W.T.; Yoshino, N.; Taghizadeh-Hesary, F. Importance of green finance for achieving sustainable development goals and energy security. Handb. Green Financ. Energy Secur. Sustain. Dev. 2019, 10, 1–10. [Google Scholar]
  22. Falcone, P.M. Environmental regulation and green investments: The role of green finance. Int. J. Green Econ. 2020, 14, 159–173. [Google Scholar] [CrossRef]
  23. Muganyi, T.; Yan, L.; Sun, H.P. Green finance, fintech and environmental protection: Evidence from China. Environ. Sci. Ecotechnol. 2021, 7, 100107. [Google Scholar] [CrossRef]
  24. Wang, E.; Liu, X.; Wu, J.; Cai, D. Green Credit, Debt Maturity, and Corporate Investment—Evidence from China. Sustainability 2019, 11, 583. [Google Scholar] [CrossRef]
  25. Dwivedi, P.; Alabdooli, J.I.; Dwivedi, R. Role of FinTech adoption for competitiveness and performance of the bank: A study of banking industry in UAE. Int. J. Glob. Bus. Compet. 2021, 16, 130–138. [Google Scholar] [CrossRef]
  26. Tang, M.; Hu, Y.; Corbet, S.; Hou, Y.; Oxley, L. Fintech, bank diversification and liquidity: Evidence from China. Res. Int. Bus. Financ. 2023, 67, 102082. [Google Scholar] [CrossRef]
  27. Yáñez-Valdés, C.; Guerrero, M. Assessing the organizational and ecosystem factors driving the impact of transformative FinTech platforms in emerging economies. Int. J. Inf. Manag. 2023, 102689. [Google Scholar] [CrossRef]
  28. Wang, Q.; Hu, C. Fintech, Financial Regulation and Corporate Financialization: Evidence from China. Financ. Res. Lett. 2023, 58, 104378. [Google Scholar] [CrossRef]
  29. Dong, X.; Yu, M. Does FinTech development facilitate firms’ innovation? Evidence from China. Int. Rev. Financ. Anal. 2023, 89, 102805. [Google Scholar] [CrossRef]
  30. Acemoglu, D.; Akcigit, U.; Bloom, N.; Kerr, W.R. Innovation, Reallocation and Growth. PIER Work. Pap. Arch. 2013, 108, 3450–3491. [Google Scholar]
  31. Pipkin, S.; Fuentes, A. Spurred to Upgrade: A Review of Triggers and Consequences of Industrial Upgrading in the Global Value Chain Literature. World Dev. 2017, 98, 536–554. [Google Scholar] [CrossRef]
  32. Han, K.; Cheng, L.; Tang, H. Analysis Model and Application of China’s Industrial Innovation Competition Situation from the Perspective of Patent Quality. Eur. Bus. Manag. 2018, 4, 119–125. [Google Scholar]
  33. Romer, P.M. Increasing returns and long-run growth. J. Political Econ. 1986, 94, 1002–1037. [Google Scholar] [CrossRef]
  34. Lucas, R.E., Jr. On the mechanics of economic development. J. Monet. Econ. 1988, 22, 3–42. [Google Scholar] [CrossRef]
  35. Metcalf, C.J. Persistence of technological leadership: Emerging technologies and incremental innovation. J. Ind. Econ. 2011, 59, 199–224. [Google Scholar] [CrossRef]
  36. Jin, W.; Zhang, H.Q.; Liu, S.S.; Zhang, H.B. Technological innovation, environmental regulation, and green total factor efficiency of industrial water resources. J. Clean. Prod. 2019, 211, 61–69. [Google Scholar] [CrossRef]
  37. Hu, G.G. Is knowledge spillover from human capital investment a catalyst for technological innovation? The curious case of fourth industrial revolution in BRICS economies. Technol. Forecast. Soc. Chang. 2021, 162, 120327. [Google Scholar] [CrossRef]
  38. Hsu, G.J.Y.; Lin, Y.H.; Wei, Z.Y. Competition policy for technological innovation in an era of knowledge-based economy. Knowl. -Based Syst. 2008, 21, 826–832. [Google Scholar] [CrossRef]
  39. Knight, E.; Wjcik, D. FinTech, economy and space: Introduction to the special issue. Environ. Plan. A 2020, 52, 1490–1497. [Google Scholar] [CrossRef]
  40. Hu, C.; Yong, T. Export spillovers and export performance in China. China Econ. Rev. 2016, 41, 75–89. [Google Scholar] [CrossRef]
  41. Jiang, L.; Zhou, H.F.; Bai, L.; Zhou, P. Does Foreign Direct Investment Drive Environmental Degradation in China? An Empirical Study Based on Air Quality Index from a Spatial Perspective. J. Clean. Prod. 2018, 176, 864–872. [Google Scholar] [CrossRef]
  42. Cheng, L.K.; Kwan, Y.K. What are the determinants of the location of foreign direct investment? The Chinese experience. J. Int. Econ. 2000, 51, 379–400. [Google Scholar] [CrossRef]
  43. Chen, V.Z.; Li, J.; Shapiro, D.M. International reverse spillover effects on parent firms: Evidences from emerging-market MNEs in developed markets. Eur. Manag. J. 2012, 30, 204–218. [Google Scholar] [CrossRef]
  44. List, J.A.; Co, C.Y. The Effects of Environmental Regulations on Foreign Direct Investment. J. Environ. Econ. Manag. 2000, 40, 1–20. [Google Scholar] [CrossRef]
  45. Blalock, G.; Gertler, P.J. Welfare gains from Foreign Direct Investment through technology transfer to local suppliers. J. Int. Econ. 2008, 74, 402–421. [Google Scholar] [CrossRef]
  46. Zhang, L. The knowledge spillover effects of FDI on the productivity and efficiency of research activities in China. China Econ. Rev. 2017, 42, 1–14. [Google Scholar] [CrossRef]
  47. Tanna, S. The impact of foreign direct investment on total factor productivity growth: International evidence from the banking industry. Manag. Financ. 2009, 35, 297–311. [Google Scholar]
  48. Tian, X.; Lo, V.I.; Song, M. The ‘insider’ and ‘outsider’ effects of FDI technology spillovers: Some evidence. J. Dev. Area 2016, 50, 1–12. [Google Scholar] [CrossRef]
  49. Wang, X.; Song, J.; Duan, H.; Wang, X.E. Coupling between energy efficiency and industrial structure: An urban agglomeration case. Energy 2021, 234, 121304. [Google Scholar] [CrossRef]
  50. Akbar, Y.H.; Ferencikova, S. Industrial Clustering and Global Value Chains in Central and Eastern Europe: Role of Multinational Enterprises in Industrial Upgrading. Prague Econ. Pap. 2007, 2007, 237–251. [Google Scholar] [CrossRef]
  51. Rubashkina, Y.; Galeotti, M.; Verdolini, E. Environmental regulation and competitiveness: Empirical evidence on the Porter Hypothesis from European manufacturing sectors. Energy Policy 2015, 83, 288–300. [Google Scholar] [CrossRef]
  52. Kokko, A.; Tingvall, P.G. Distance, Transaction Costs, and Preferences in European Trade. Int. Trade J. 2014, 28, 87–120. [Google Scholar] [CrossRef]
  53. Esquivias, M.A.; Harianto, S.K. Does competition and foreign investment spur industrial efficiency? Firm-level evidence from Indonesia. Heliyon 2020, 6, e04494. [Google Scholar] [CrossRef]
  54. Baron, R.M.; Kenny, D.A. The moderator–mediator variable distinction in social psychological research: Conceptual, strategic, and statistical considerations. J. Personal. Soc. Psychol. 1986, 51, 1173–1182. [Google Scholar] [CrossRef]
  55. Zeng, X.W.; Liu, Y.Q.; Man, M.J.; Shen, Q.L. Measurement Analysis of the Development Level of China’s Green Finance. J. China Exec. Leadersh. Acad. Yan’an 2014, 7, 112–121. [Google Scholar]
  56. Wang, X.; Zhao, H.; Bi, K. The measurement of green finance index and the development forecast of green finance in China. Environ. Ecol. Stat. 2021, 28, 263–285. [Google Scholar] [CrossRef]
  57. Pesaran, M.H. Estimation and inference in large heterogeneous panels with a multifactor error structure. Econometrica 2006, 74, 967–1012. [Google Scholar] [CrossRef]
  58. Zheng, L.; Yuan, L.; Khan, Z.; Badeeb, R.A.; Zhang, L. How G-7 countries are paving the way for net-zero emissions through energy efficient ecosystem? Energy Econ. 2023, 117, 106428. [Google Scholar] [CrossRef]
  59. Shahbaz, M.; Li, J.; Dong, X.; Dong, K. How financial inclusion affects the collaborative reduction of pollutant and carbon emissions: The case of China. Energy Econ. 2022, 107, 105847. [Google Scholar] [CrossRef]
  60. Pesaran, M.H. A simple panel unit root test in the presence of cross-section dependence. J. Appl. Econom. 2007, 22, 265–312. [Google Scholar] [CrossRef]
  61. Sun, C. How are green finance, carbon emissions, and energy resources related in Asian sub-regions? Resour. Policy 2023, 83, 103648. [Google Scholar] [CrossRef]
  62. Panagariya, A. Digital revolution, financial infrastructure and entrepreneurship: The case of India. Asia Glob. Econ. 2022, 2, 100027. [Google Scholar] [CrossRef]
  63. Fang, W.; Liu, Z.; Surya Putra, A.R. Role of research and development in green economic growth through renewable energy development: Empirical evidence from South Asia. Renew. Energy 2022, 194, 1142–1152. [Google Scholar] [CrossRef]
  64. Sharif, A.; Kocak, S.; Khan, H.H.A.; Uzuner, G.; Tiwari, S. Demystifying the links between green technology innovation, economic growth, and environmental tax in ASEAN-6 countries: The dynamic role of green energy and green investment. Gondwana Res. 2023, 115, 98–106. [Google Scholar] [CrossRef]
  65. Porter, M.E.; Linde, C.V.D. Toward a new conception of the environment-competitiveness relationship. J. Econ. Perspect. 1995, 9, 97–118. [Google Scholar] [CrossRef]
  66. Porter, M. America’s green strategy. Bus. Environ. Read. 1996, 33, 1072. [Google Scholar]
  67. Xepapadeas, A.; Zeeuw, A.D. Environmental Policy and Competitiveness: The Porter Hypothesis and the Composition of Capital. J. Environ. Econ. Manag. 1999, 37, 165–182. [Google Scholar] [CrossRef]
  68. Hartl, M.G.J.; Hutchinson, S.; Hawkins, L.E. Organotin and osmoregulation: Quantifying the effects of environmental concentrations of sediment-associated TBT and TPhT on the freshwater-adapted European flounder, Platichthys flesus (L.)—ScienceDirect. J. Exp. Mar. Biol. Ecol. 2001, 256, 267–278. [Google Scholar] [CrossRef]
  69. Ford, J.A.; Steen, J.; Verreynne, M.L. How environmental regulations affect innovation in the Australian oil and gas industry: Going beyond the Porter Hypothesis. J. Clean. Prod. 2014, 84, 204–213. [Google Scholar] [CrossRef]
  70. Vollrath, D. How Important are Dual Economy Effects for Aggregate Productivity? J. Dev. Econ. 2009, 88, 325–334. [Google Scholar] [CrossRef]
  71. Glaeser, E.L.; Scheinkman, J.A. Economic Growth in a Cross-Section of Cities. Harv. Inst. Econ. Res. Work. Pap. 1995, 36, 117–143. [Google Scholar]
  72. Nelson, R.R.; Phelps, E.S. Investment in Humans, Technological Diffusion, and Economic Growth. Cowles Found. Discuss. Pap. 1966, 56, 69–75. [Google Scholar]
  73. Bailey, E.E.; Panzar, J.C. The contestability of airline markets during the transition to deregulation. In Air Transport; Classics in Transport Analysis; Duke University School of Law: Durham, NC, USA, 2002. [Google Scholar]
Figure 1. Research method flowchart.
Sustainability 15 14069 g001
Figure 2. Theoretical model.
Sustainability 15 14069 g002
Figure 3. Mediation effect model.
Sustainability 15 14069 g003
Table 1. Variable definitions.
Variable TypeVariable NameMeasurement Method
Explained variableGreen finance (GF)The correlation index is weighted using the entropy method
Explanatory variableOverall upgrading of industrial structure (IS)Weighted average of the added value of the three industries
Mediating variableScience and technology innovation (Tech)Proportion of research expenses of the province in the GDP of the region
Foreign direct investment (FDI)Actual utilization of foreign direct investment
Moderating variableEnvironmental regulatory intensity (ERI)The entropy method is used to compute the comprehensive index of environmental regulation in each region
Government intervention level (Gov)Government public expenditure as a proportion of the region’s gross domestic product
Control variableUrbanization level (Urban)The proportion of urban population to total population is logarithm
Economic development level (PGDP)Per capita GDP
Human capital level (HUM)The logarithmic ratio of the number of college students to the total ratio of the region
Government technology support (GTS)The proportion of government expenditure on science and technology a logarithm
Table 2. Descriptive statistical results.
VariablesNMeanSDMinMedianMax
IS4652.360.132.152.342.80
GF4650.720.090.560.720.89
Tech4651.551.110.221.266.01
FDI465473.78500.700.34264.401929.16
ERI46532.3228.430.8923.72161.69
Gov4650.260.190.100.221.29
Market4657.602.091.127.6611.67
Urban465−0.610.26−1.48−0.59−0.11
PGDP46512,166.717664.175080.309410.6142,212.60
HUM465−4.010.32−4.88−3.98−3.31
GTS465−4.120.64−5.54−4.32−2.77
Table 3. Pairwise correlation test.
VariablesISGFTechFDIERIGovMarketUrbanPGDPHUMGTS
IS1
GF0.47 ***1
Tech0.50 ***0.21 ***1
FDI0.40 ***0.16 ***0.57 ***1
ERI−0.21 ***−0.27 ***−0.30 ***−0.34 ***1
Gov0.0340.13 **−0.35 ***−0.42 ***0.17 ***1
Market0.47 ***0.28 ***0.57 ***0.53 ***−0.43 ***−0.50 ***1
Urban0.58 ***0.42 ***0.51 ***0.51 ***−0.31 ***−0.48 ***0.56 ***1
PGDP0.59 ***0.0760.55 ***0.49 ***−0.20 ***−0.24 ***0.55 ***0.43 ***1
HUM0.49 ***0.44 ***0.59 ***0.33 ***−0.33 ***−0.42 ***0.62 ***0.53 ***0.41 ***1
GTS0.58 ***0.093 *0.57 ***0.53 ***−0.29 ***−0.56 ***0.51 ***0.59 ***0.53 ***0.47 ***1
Note: The symbols ***, **, and * represent the significance levels at 1%, 5%, and 10%, respectively. Bold emphasis on variable names.
Table 4. Slope heterogeneity.
Homogenous/Heterogeneous Slope Coefficient Testing
TestStatistic
Δ ˜ 8.675 ***
Δ ˜ adjusted 11.879 ***
Note: The symbol *** represent the significance levels at 1%.
Table 5. Cross-sectional dependence.
VariableTest StatProbCorrAbs(Corr)
IS71.567 ***0.0000.860.86
GF79.692 ***0.0000.960.96
Urban79.025 ***0.0000.950.95
PGDP36.988 ***0.0000.440.63
HUM60.31 ***0.0000.720.88
GTS6.9 ***0.0000.080.43
Note: The symbol *** represent the significance levels at 1%.
Table 6. Unit root tests.
Pesaran (2007) [60] CIPS
VariableI (0)I (1)Level of Integration
IS−1.819−2.735 ***I (1)
GF−3.752 *** I (0)
Urban−2.710 *** I (0)
PGDP−1.252−3.530 ***I (1)
HUM−1.181−2.354 **I (1)
GTS−1.644−3.427 ***I (1)
Note: The symbols *** and ** represent the significance levels at 1% and 5% respectively.
Table 7. Regression results.
Variables(1)(2)(3)(4)(5)(6)
OLSOLSOLSOLSGMMGMM
ISISISISISIS
L.IS 0.645 ***0.541 ***
(29.95)(30.97)
GF0.665 ***0.688 ***0.142 *0.166 **0.134 ***0.098 ***
(12.04)(14.62)(1.92)(2.28)(14.33)(5.72)
Urban −0.092 *** −0.123 ***0.192 ***0.181 ***
(−2.72) (−2.69)(9.93)(14.67)
PGDP 0.000 *** −0.000 *0.000 ***0.000 ***
(14.98) (−1.70)(−3.49)(4.39)
HUM 0.026 ** 0.0170.063 ***0.000 ***
(1.98) (0.81)(−7.99)(−7.50)
GTS 0.005 0.029 ***0.0010.077 ***
(0.92) (4.20)(0.35)(−10.93)
Constant1.880 ***1.760 ***2.249 ***2.858 ***0.639 ***0.011 ***
(46.59)(28.69)(49.97)(26.32)(14.24)(−2.73)
Year and ProvinceNONOYESYESYESYES
AR (1) −3.989 ***3.961 ***
AR (2) 0.6941.035
Hansen test p-value 0.7520.584
N464464464464464464
r20.2190.8000.9500.954
Note: The symbols ***, **, and * represent the significance levels at 1%, 5%, and 10%, respectively.
Table 8. Test of the mediating effect.
Variables(1)(2)(3)(4)
TechISFDIIS
GF0.011 ***0.148 **893.361 **0.146 **
(2.86)(2.00)(2.03)(2.02)
Urban−0.008 ***−0.104 **351.432−0.150 ***
(−2.78)(−2.28)(1.39)(−3.26)
PGDP−0.000 ***−0.0000.047 ***−0.000 **
(−4.21)(−0.83)(2.82)(−2.41)
HUM−0.002 *0.025−437.786 ***0.027
(−1.90)(1.20)(−3.74)(1.37)
GTS0.003 ***0.021 ***399.375 ***0.018 **
(9.50)(2.92)(8.78)(2.48)
Tech 2.387 ***
(2.74)
FDI 0.000 ***
(3.71)
Constant0.061 ***2.798 ***−1372.165 *2.815 ***
(9.02)(26.92)(−1.90)(22.66)
Year and ProvinceYESYESYESYES
N464464464464
r20.9800.9540.8590.953
Note: The symbols ***, **, and * represent the significance levels at 1%, 5%, and 10%, respectively.
Table 9. Moderating effect test.
Variables(1)(2)
ISIS
GF0.143 **0.204 ***
(1.99)(2.79)
GF × ERI2.295 **
(2.45)
GF × Gov −0.170 ***
(−3.76)
Urban−0.078 *−0.050
(−1.75)(−1.17)
PGDP−0.000 ***−0.000 ***
(−4.50)(−5.65)
HUM0.0230.009
(1.05)(0.44)
GTS0.026 ***0.015 **
(3.63)(2.13)
Constant3.099 ***2.437 ***
(27.05)(23.77)
Year and ProvinceYESYES
N464464
r20.9540.955
Note: The symbols ***, **, and * represent the significance levels at 1%, 5%, and 10%, respectively.
Table 10. Descriptive statistics of regional heterogeneity.
Green Finance (GF)
RegionNMeanSDMinMedianMax
coastal1650.71560.0950.560.720.90
landlocked3000.71500.0920.560.710.89
Industrial Structure (IS)
RegionNMeanSDMinMedianMax
coastal1652.38880.1312.112.392.73
landlocked3002.33680.1292.152.322.81
Table 11. Regional heterogeneity.
VariablesISIS
LandlockedCoastal
GF0.1631.181 **
(1.53)(2.01)
Urban−0.125 **−0.063
(−2.02)(−1.07)
PGDP−0.000 *0.000
(−1.65)(0.67)
HUM0.033−0.043
(1.24)(−1.40)
GTS0.030 ***0.006
(3.79)(0.47)
Constant2.415 ***2.202 ***
(14.22)(16.92)
Year and ProvinceYESYES
N299165
r20.9380.978
Note: The symbols ***, **, and * represent the significance levels at 1%, 5%, and 10%, respectively.
Table 12. Market-oriented heterogeneity.
VariablesISIS
Low Market OrientationHigh Market Orientation
GF0.0700.122 *
(0.56)(1.82)
Urban−0.306 ***0.159 ***
(−4.54)(2.82)
PGDP−0.000 ***−0.000 *
(−2.81)(−1.96)
PGDP0.000 ***−0.000 **
(3.06)(−2.02)
HUM0.055 **−0.047 *
(2.11)(−1.76)
GTS−0.0140.029 ***
(−1.13)(3.14)
Constant1.985 ***2.176 ***
(10.84)(19.29)
Year and ProvinceYESYES
N232232
r20.8810.978
Note: The symbols ***, **, and * represent the significance levels at 1%, 5%, and 10%, respectively.
Table 13. Replaced explained variables.
VariablesAISAIS
GF0.098 *0.215 **
(1.68)(2.45)
Urban −0.226 ***
(−5.16)
PGDP −0.000 ***
(−3.07)
HUM 0.035
(1.59)
GTS 0.013 **
(2.13)
Constant0.426 ***0.993 ***
(10.34)(9.29)
Year and ProvinceYESYES
N464464
r20.9230.938
Note: The symbols ***, **, and * represent the significance levels at 1%, 5%, and 10%, respectively.
Table 14. Endogenous examination.
Variables(1)(2)
GFIS
L.GF0.094 *
(1.75)
GF 0.166 **
(2.28)
Urban0.006−0.123 ***
(0.20)(−2.69)
PGDP0.000−0.000 *
(0.26)(−1.70)
HUM0.0160.017
(1.03)(0.81)
GTS−0.0010.029 ***
(−0.18)(4.20)
Constant0.709 ***2.858 ***
(8.90)(26.32)
Year and ProvinceYESYES
N432464
r20.9420.954
Note: The symbols ***, **, and * represent the significance levels at 1%, 5%, and 10%, respectively.
Disclaimer/Publisher’s Note: The statements, opinions and data contained in all publications are solely those of the individual author(s) and contributor(s) and not of MDPI and/or the editor(s). MDPI and/or the editor(s) disclaim responsibility for any injury to people or property resulting from any ideas, methods, instructions or products referred to in the content.

