Article

Distribution Pattern of Urban Street Trees in Rome (Italy): A Multifactorial Evaluation of Selection Criteria

1
Department of Science, University of Roma Tre, Viale Marconi 446, 00146 Rome, Italy
2
Institute of Heritage Science, National Research Council, ISPC-CNR, SP35d 9, 00010 Rome, Italy
3
Department of Education Science, University of Roma Tre, Via Principe Amedeo 184, 00185 Rome, Italy
4
Garden Service of Rome Municipality, Piazza di Porta Metronia 2, 00183 Rome, Italy
5
National Biodiversity Future Center (NBFC), Università di Palermo, Piazza Marina 61, 90133 Palermo, Italy
*
Author to whom correspondence should be addressed.
Sustainability 2023, 15(19), 14065; https://doi.org/10.3390/su151914065
Submission received: 28 August 2023 / Revised: 18 September 2023 / Accepted: 19 September 2023 / Published: 22 September 2023
(This article belongs to the Special Issue Sustainable Urban Planning: Biodiversity, Greening, and Forestry)

Abstract

:
Street trees play a significant ecological role in modern urban ecosystems, but usually the selection criteria follow pragmatic reasons rather than bio-ecological suitability. Understanding the influence of such factors can be relevant, especially in cities having a certain complexity and area. This paper aims to analyze the variation in the distribution of street tree species within the city’s municipia of Rome to determine the influence of some factors in the selection process. Here, we have described the species of street trees in fourteen municipia of Rome, and we created five clusters of factors (bio-ecological, aesthetic, historical–cultural, health, and economic) that could constitute selection criteria for street trees. From our data analysis, the municipia of Rome were grouped into four main groups and the choice of trees was based on multiple selection criteria. Foliage type, longevity, fruit type, autochthony, and economic value were the primary criteria. In 90–100% of municipia, deciduous species dominate, with 50–150 years longevity, dry fruits, exotic species, and prices of <€500 per tree. Additionally, the flower type, allergenicity, size class, and cultural value were the secondary criteria. The biological and ecological characteristics of trees are key factors to consider in order to reduce the management of street trees and relative costs.

1. Introduction

Various types of urban green spaces exist within cities, such as public and private parks, urban forests, green roofs, and street trees [1,2], playing a significant functional and ecological role in the urban ecosystem [1,3,4]. It is now known that cities significantly impact climate change as they are the main ones responsible for greenhouse gas emissions producing up to 70% of emissions caused by fossil fuel consumption [5]. Urban green and specifically street trees are becoming of great importance nowadays due to the increasing size of the cities and to the loss of nature within them [4], but also due to the increasing warming due to cities’ heat island effect and climate change [6,7]. Urban trees can have a relevant role in climate mitigation [8], which explains the politics of improving urban forests [4,9,10] to realize nature-based solutions (NBSs) [11], which can bring countless benefits in terms of a circular economy.
In the past, the settlement of urban street trees has been driven by their potential practical use, dimensions, aesthetic appeal, and historical and cultural values, rather than ecological reasons [12]. Today, research suggests the importance of considering a high plant biodiversity, especially of native species, since they contribute to preserving the local fauna, and to avoid possible disease resistance due to monoculture overexpression [13]. The 10/20/30 rule, which states that there should not be more than 10 percent of any species, 20 percent of any genus, and 30 percent of any family, proposed by Santamour [14] seems fundamental in the planning and management of plant diversity and safeguarding plant health [15]. However, recent studies have shown that the rule could be even more stringent by proposing a 5/10/15 ratio [15], which could be difficult to implement, especially in cities with cold climates compared to cities with warmer climates [16].
As street trees provide innumerable ecosystem services (ESs) [17,18,19,20,21], albeit also disservices (EDSs) [22], there should be a careful evaluation of the traits of street trees as they can influence the provision of benefits and nuisances [23]. In fact, each tree species has some biological (e.g., size, flower type, foliage type), ecological, and biogeographical traits that can be selected before plantation to influence such services. Some biological factors also have an impact on human health (i.e., allergenicity due to abundant pollen production), or on ecosystem maintenance, in the case of alien trees with potential risks of invasiveness.
Such factors, together with cultural and economic ones (costs and maintenance requirements), are usually considered by the Garden Services. Sometimes, just the market supply can influence the selection (the availability of species from the floriculture sector).
In Italy, previous works have provided a historical overview of street trees in different cities, considering abundance, diversity, and some suggestions for species selection criteria [12]. Later, a more comprehensive and analytical analysis of the floristic diversity of street trees in Italian cities was carried out, considering the bioclimatic influence, and the taxonomic, chorological, and structural features of the trees [24]. Rome, which is the capital and the largest metropolis in Italy, showed the most relevant street tree richness among other Italian cities [24]. The city also has a great historical relevance as it is the city where street trees were first planted, during the Jubilee of Pope Sixtus V, in the XVI Century, to protect the pilgrims from solar radiation and heating [12]. A previous work on the street trees of Rome also explained some political and cultural relationships and influences in the choice of street tree species for about one century (from 1898 to 1998) [25]. That paper highlighted the fact that the selection of street trees shifted from large trees (>20 m) in 1899 to smaller trees (<10 m) in 1998. Moreover, concerning the tiny space along the streets or the need for a “fast effect”, the initial choice for historical, aesthetical, and/or ecological criteria shifted to more pragmatic criteria. Considering the change that has occurred in the last decades, both for renewal and changes of trees [24] and for administrative reasons (creation of municipia in 2001), an update and a more comprehensive evaluation of the street trees of Rome is needed. As such, this paper aims to analyze the variation in the species distribution in the municipia of Rome at the present time to: (1) assess whether the diversity of street trees respects the “rule of thumb” suggested by Santamour [14]; (2) define which cluster of factors (biological, aesthetic/cultural, health, or economic) is more relevant to explain the present diversity of street trees in Rome; and (3) hypothesize which part of “the case or/and the necessity” (e.g., beneficial aims) influenced the tree selection.

2. Materials and Methods

2.1. Study Area and Creation of the Dataset of Street Trees

The city of Rome covers an area of 1286.8 km² and its territory is divided into fifteen municipia (city districts). Rome (41°55′19″ N, 12°27′8″ E) is located on a hilly area in central Italy along the Tyrrhenian belt, in the southern area of the Tiber River valley, about 20 km from the sea. Rome has a Mediterranean climate even though the city is in an area of transition to the temperate zone [26], and there are differences within the city as rainfall and temperature values vary across the city area. We obtained data on the surface area of the city and municipia (km²), population, and density per km² from the Roma Capitale Statistics Office (31 December 2022), while we obtained general data (species, number of individuals) on street trees from the Garden Services of Roma Capitale.
We created a list of street trees in Rome [12,24,25], which was enriched by adding data on the number of trees for the fourteen analyzed municipia of the city (we excluded municipium X, corresponding to Ostia, because it was decentralized from the Garden Services in 2011). We also carried out field surveys during the spring and fall of 2022 to collect some data that we could then compare with the data provided by the Garden Services.
We created a floristic list for each municipium by selecting only tree species growing along roads and streets [27] and including palms and Yucca species because they are used as street trees even though conventionally they are not trees [12,24]. We created a dataset of frequencies and recurrences per street of each species in the various municipia. Finally, we updated the nomenclature of the species according to national and international databases [28,29].

2.2. Evaluation of the Biodiversity of Street Trees

To evaluate the biodiversity of the street trees of Rome, we calculated the Shannon index of diversity at the species level for all municipia. The Shannon index of diversity (1) or SHDI is one of the most popular indices used in community ecology to quantify biodiversity and is defined as follows [30]:
HDI = i = 0 N p i    l n p i
where N is the total number of species and p is the proportional abundance of the ith species. This index, ranging in theory from 0 to infinity, combines aspects of species richness and evenness; its value increases when either the number of species or the equitability of distribution of individuals belonging to different species increases, or when both factors increase [30].
To analyze the distribution of biodiversity we also calculated the evenness index (2) for each municipia [31]. Evenness is the equilibration (equitability) of a community. It expresses the degree of homogeneity with which individuals are distributed among the various species that make up a community [32].
E H H / l n S
where H is the diversity index and S is the number of the species found. This index ranges from 0 to 1.
Finally, we calculated the frequencies for families (<30%), genera (<20%), and species (<10%) of all tree species; these frequencies were calculated for the whole city and for each municipium to understand whether the diversity pattern of street trees falls within the limits defined by Santamour [14].

2.3. Evaluation of Bio-Ecological, Aesthetic/Cultural, Health, and Economic Factors Related to Street Trees

For each tree species, we considered five main clusters of factors possibly used for the selection. According to the experience and customs of garden services, the most relevant are based on the following nine descriptive elements that are summarized in Table 1 and described below.
As regards the bio-ecological cluster, we classified the parameters of the size factor according to the SIA (Italian Arboriculture Society) [33]. We followed the classification of the UFEI for the factors of foliage type and longevity [34]. For the autochthony factor, we classified the species as native or exotic according to the Acta Plantarum website [35] and Flora d’Italia [28]. For the aesthetic cluster (flower showiness and fruit type) we used the classification information from the UFEI, with a simplification of the fruit types as dry or fleshy. For the cultural cluster, we based our classification using bibliographic sources and historical references [12,36,37]. For the health cluster, we considered the degree of allergenicity (value of potential allergenicity, VPA), which was extrapolated from the dataset provided by Cariñanos [38,39], which provides an assessment of the VPA of Mediterranean species. Regarding the economic cluster, we relied on the “July 2022 edition” price list from the “Ministry of Infrastructures and Sustainable Mobility, Lazio region, and Roma Capitale”, which hereafter we refer to as the price list of Roma Capitale. We also consulted the price list of “Asso Verde” [40]. Since the price list of Roma Capitale, in addition to the price of the plant, includes the costs of planting and management (irrigation) for two years, we calculated the above expenses manually from the price list of “Asso Verde” considering an average species diameter of 16 cm.
After we had defined the clusters and their nine related parameters (size class, foliage type, autochthony, longevity, flower showiness, fruit type, cultural value, allergenicity, and economic value), we calculated the frequencies of the respective parameters, which we used for the statistical analyses, and we also mapped the dominant characteristics of trees for each municipium. We used the online platform Google my Maps [41] to create the distribution maps.

2.4. Statistical Analysis and Interpretation of the Results of Detecting the Influencing Factors of Tree Selection

To understand the similarity and the differences among the municipia, we performed a cluster analysis. We calculated the respective frequencies concerning species for each of the nine previously considered factors. We developed the cluster analysis through the program R 4.2.2 and we calculated the dissimilarity matrix of the data using the Ward.D2 dissimilarity index. We performed an indicator species analysis of the individual clusters, which identifies associations between species or combinations of them, using the Indval index, which considers the indices of fidelity and specificity [42]. We also performed a PCA (principal component analysis) [43] on the frequencies of the selection criteria (biological, cultural, and health factors) in relation to the geographical distribution of data.

3. Results

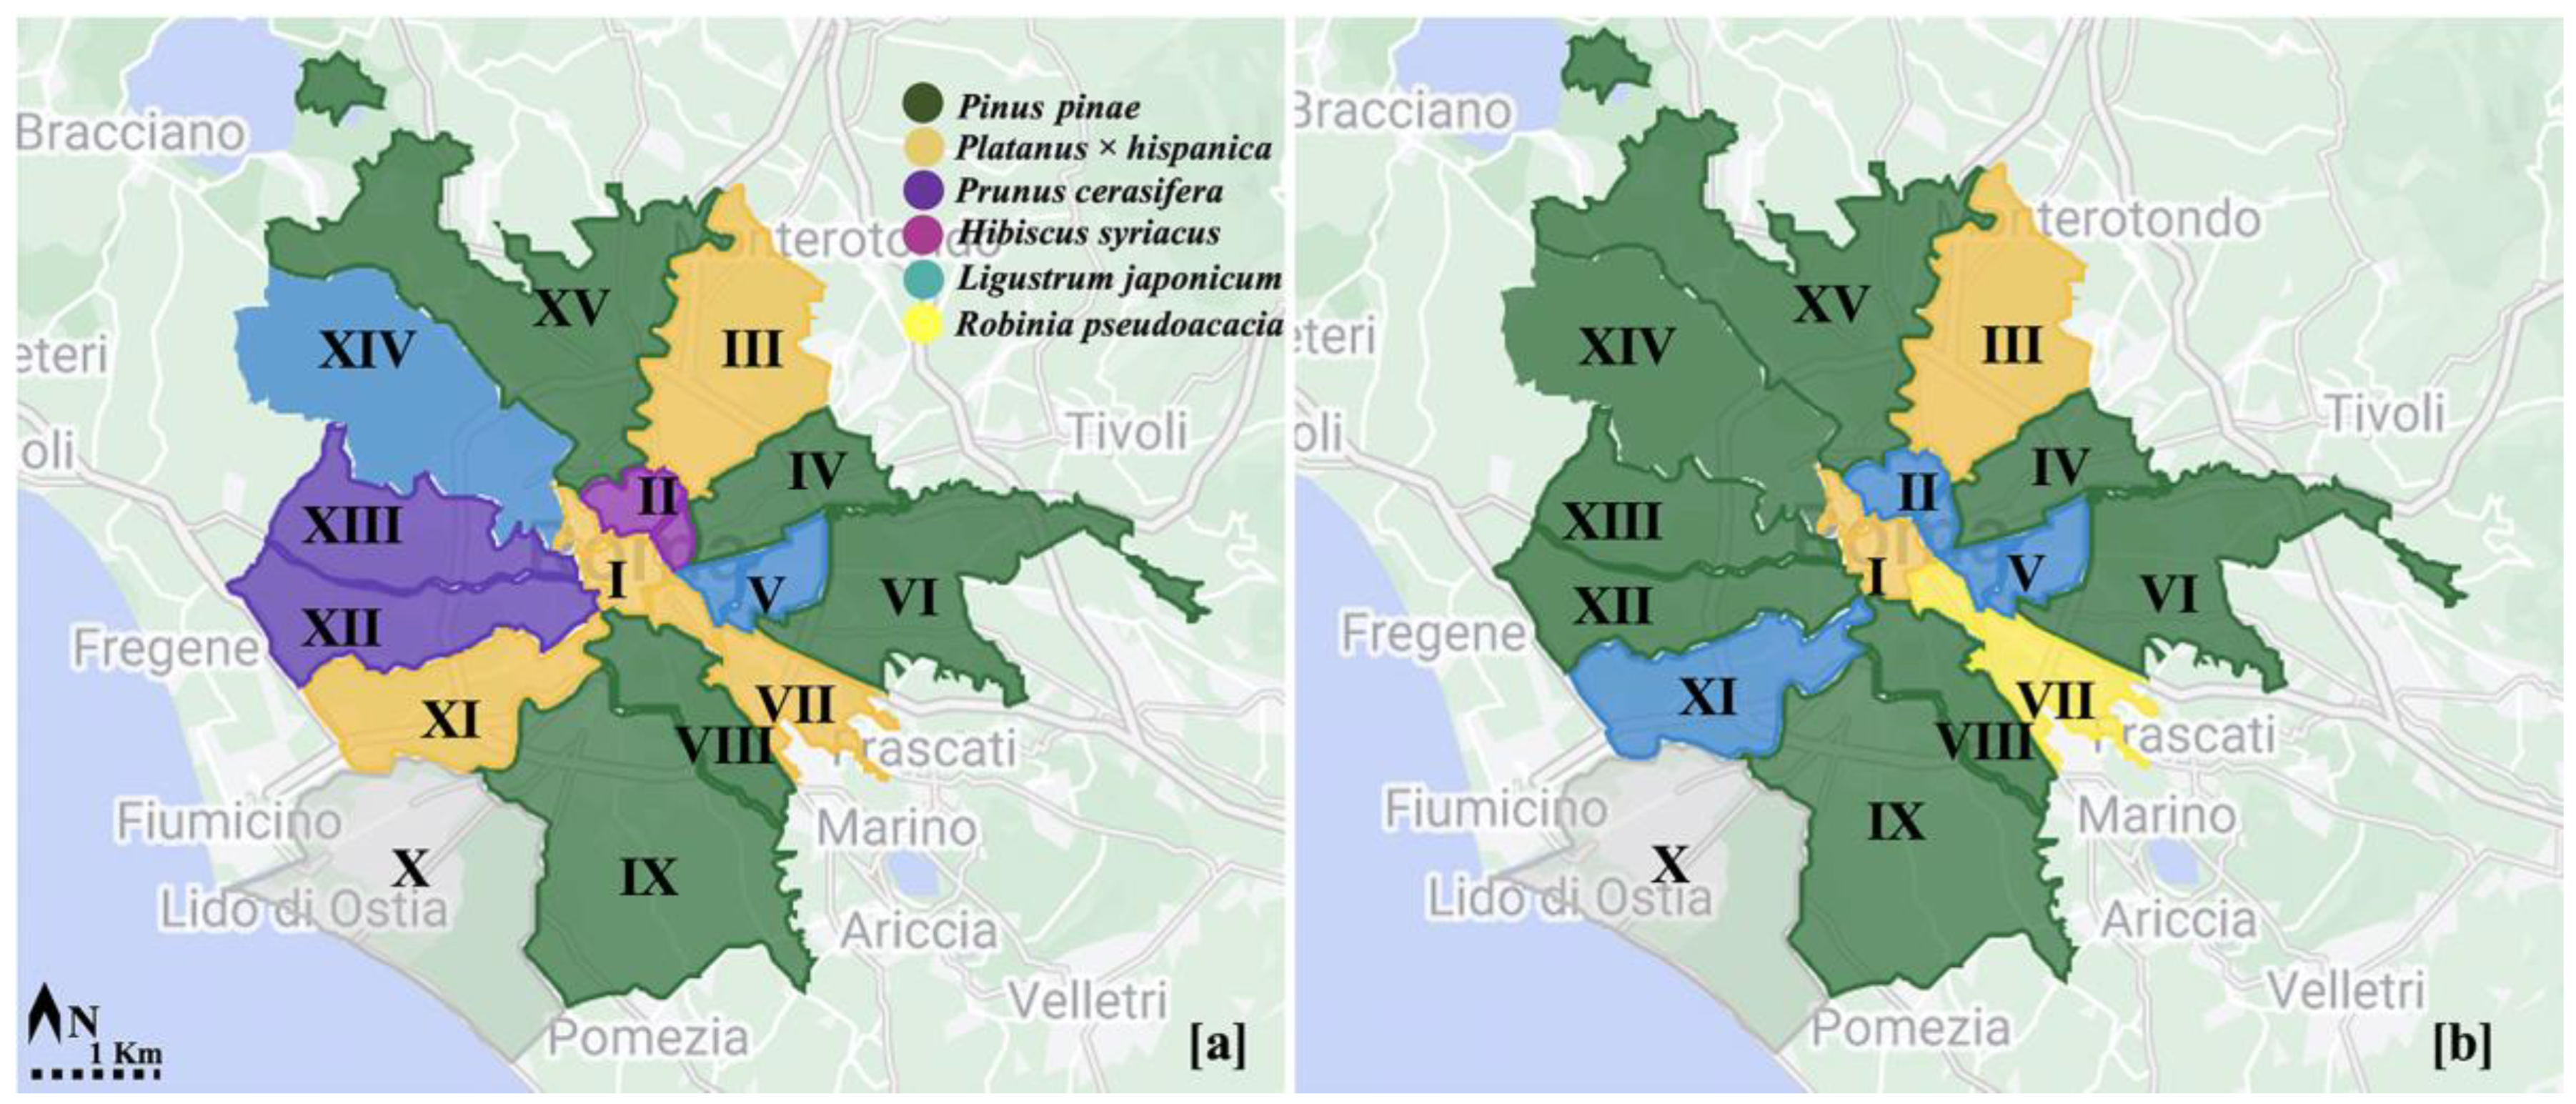
3.1. Evaluation of Biodiversity of Street Trees

We calculated a total of 132 species and 41 families of street trees in the city of Rome, an increase of a few units compared to the number from the previous lists [12,24,25]. Among the 41 families, the Rosaceae is the most represented with numerous genera (15) confirming the results of [15] for Rome. Additionally, in relation to the number of individual belongings to certain taxa, the Malvaceae family (15.30% of species) was the most common one due to the relevant contribution of Tilia sppl. and Hibiscus syriacus, followed by Platanaceae (14.36%), Pinaceae (13.92%), Oleaceae (12.01%), and Rosaceae (11.34%).
As regards the genera, the most recurrent ones were Platanus (13.3% of individuals), Pinus (11.8%), Ligustrum (9.7%), Tilia (7.5%), and Quercus (7.1). Following a similar trend, the first top five species were Platanus × hispanica (12.51% of the total species), followed by Pinus pinea (11.76%), Ligustrum japonicum (9.48%), Hibiscus syriacus (6.63%), and Quercus ilex (6.6%), confirming our previous evaluations [12].
We detected differences among municipia (Table 2). For instance, Pinus pinea was the most frequent species in four municipia, with frequencies over 30% in two of them (VI and IX); Platanus × hispanica was the most frequent in four municipia, with a frequency over 20% in two municipia (I and III); Ligustrum japonicum was the most frequent tree in two (V, XIV), as well as Prunus cerasifera (XII, XIII) (Figure 1a). The considerable differences in the species representativeness, with more than 50% of the species with frequencies lower than 1% for at least one municipium, are evident from Table 2, highlighting how numerous the species with a limited number of individuals were.
Considering the ratio between the number of individuals and the recurrence of the tree-lined streets, P. pinea is in the first position in eight municipia (IV, VI, VIII, IX, XI, XIII, XIV, XV); R. pseudoacacia in two municipia (II, VII); L. japonicum in two municipia (V and VII); and Platanus × hispanica also in two (I and III) (Figure 1b).
The relation between individual street trees and the area of the municipia highlights that municipium II, followed by municipium I, has the highest ratio of street trees/municipium area. On the contrary, municipium XV, despite its considerable area (187.2 square kilometers) has a low presence of individuals (3959) (Figure 2a). The ratio of population density to the number of street tree individuals (Figure 2b) shows that municipium V has the worst ratio since it is densely populated but with a low number of trees. Municipia I and II, on the other hand, have a high population density but also a high number of tree individuals, while municipium XV has more individual street trees than human population. Municipium IX has the highest number of tree-lined streets (792.936 m2) in the widest area; a high ratio is also shown for municipia II, IV, and VI. Additionally, the worst ratio is reported for municipium XV and XIV (Figure 2c). The Shannon_H index (SHDI), considering the areas of the various municipia (Figure 2d), highlights that municipium I has the highest biodiversity value. On the other hand, municipium XV has the lowest SHDI n value. The number of individuals of street trees is low in the municipia XIII and VI, with 3008 and 3468 individuals, respectively. However, municipium XIII has a higher Eveness than VI, even though their Eveness index is the lowest in general (0.32). Municipium I has the highest Evenness index, but not the highest number of individuals, even though it is rather high. The highest number of individuals has been registered for the municipium II with 19,687 street trees.
The diversity of families and genera of street trees complies with the limit suggested by Santamour [14], even if four species, Platanus × hispanica (13%), Pinus pinea (12%), and Quercus ilex (14%), exceed the proposed limit. At the municipium level, the situation changes. The limits for the family that correspond to 30% are exceeded in municipium VI (Pinaceae), municipium IX (Pinaceae), and municipium XIV (Malvaceae). As regards the genera limits, these are exceeded by Pinus in five municipia (IV, VI, IX, and XV), including Platanus in municipia I and III, Tilia in municipia IX and XIV, and Ligustrum in municipia III and IV. As regards the limits for the species, they are exceeded in all municipia; for instance, in municipium XII, there is an excess of 10% over the limit for seven species (Table 3). Regarding the autochthony of species, in all municipia, exotics clearly predominate over native species.

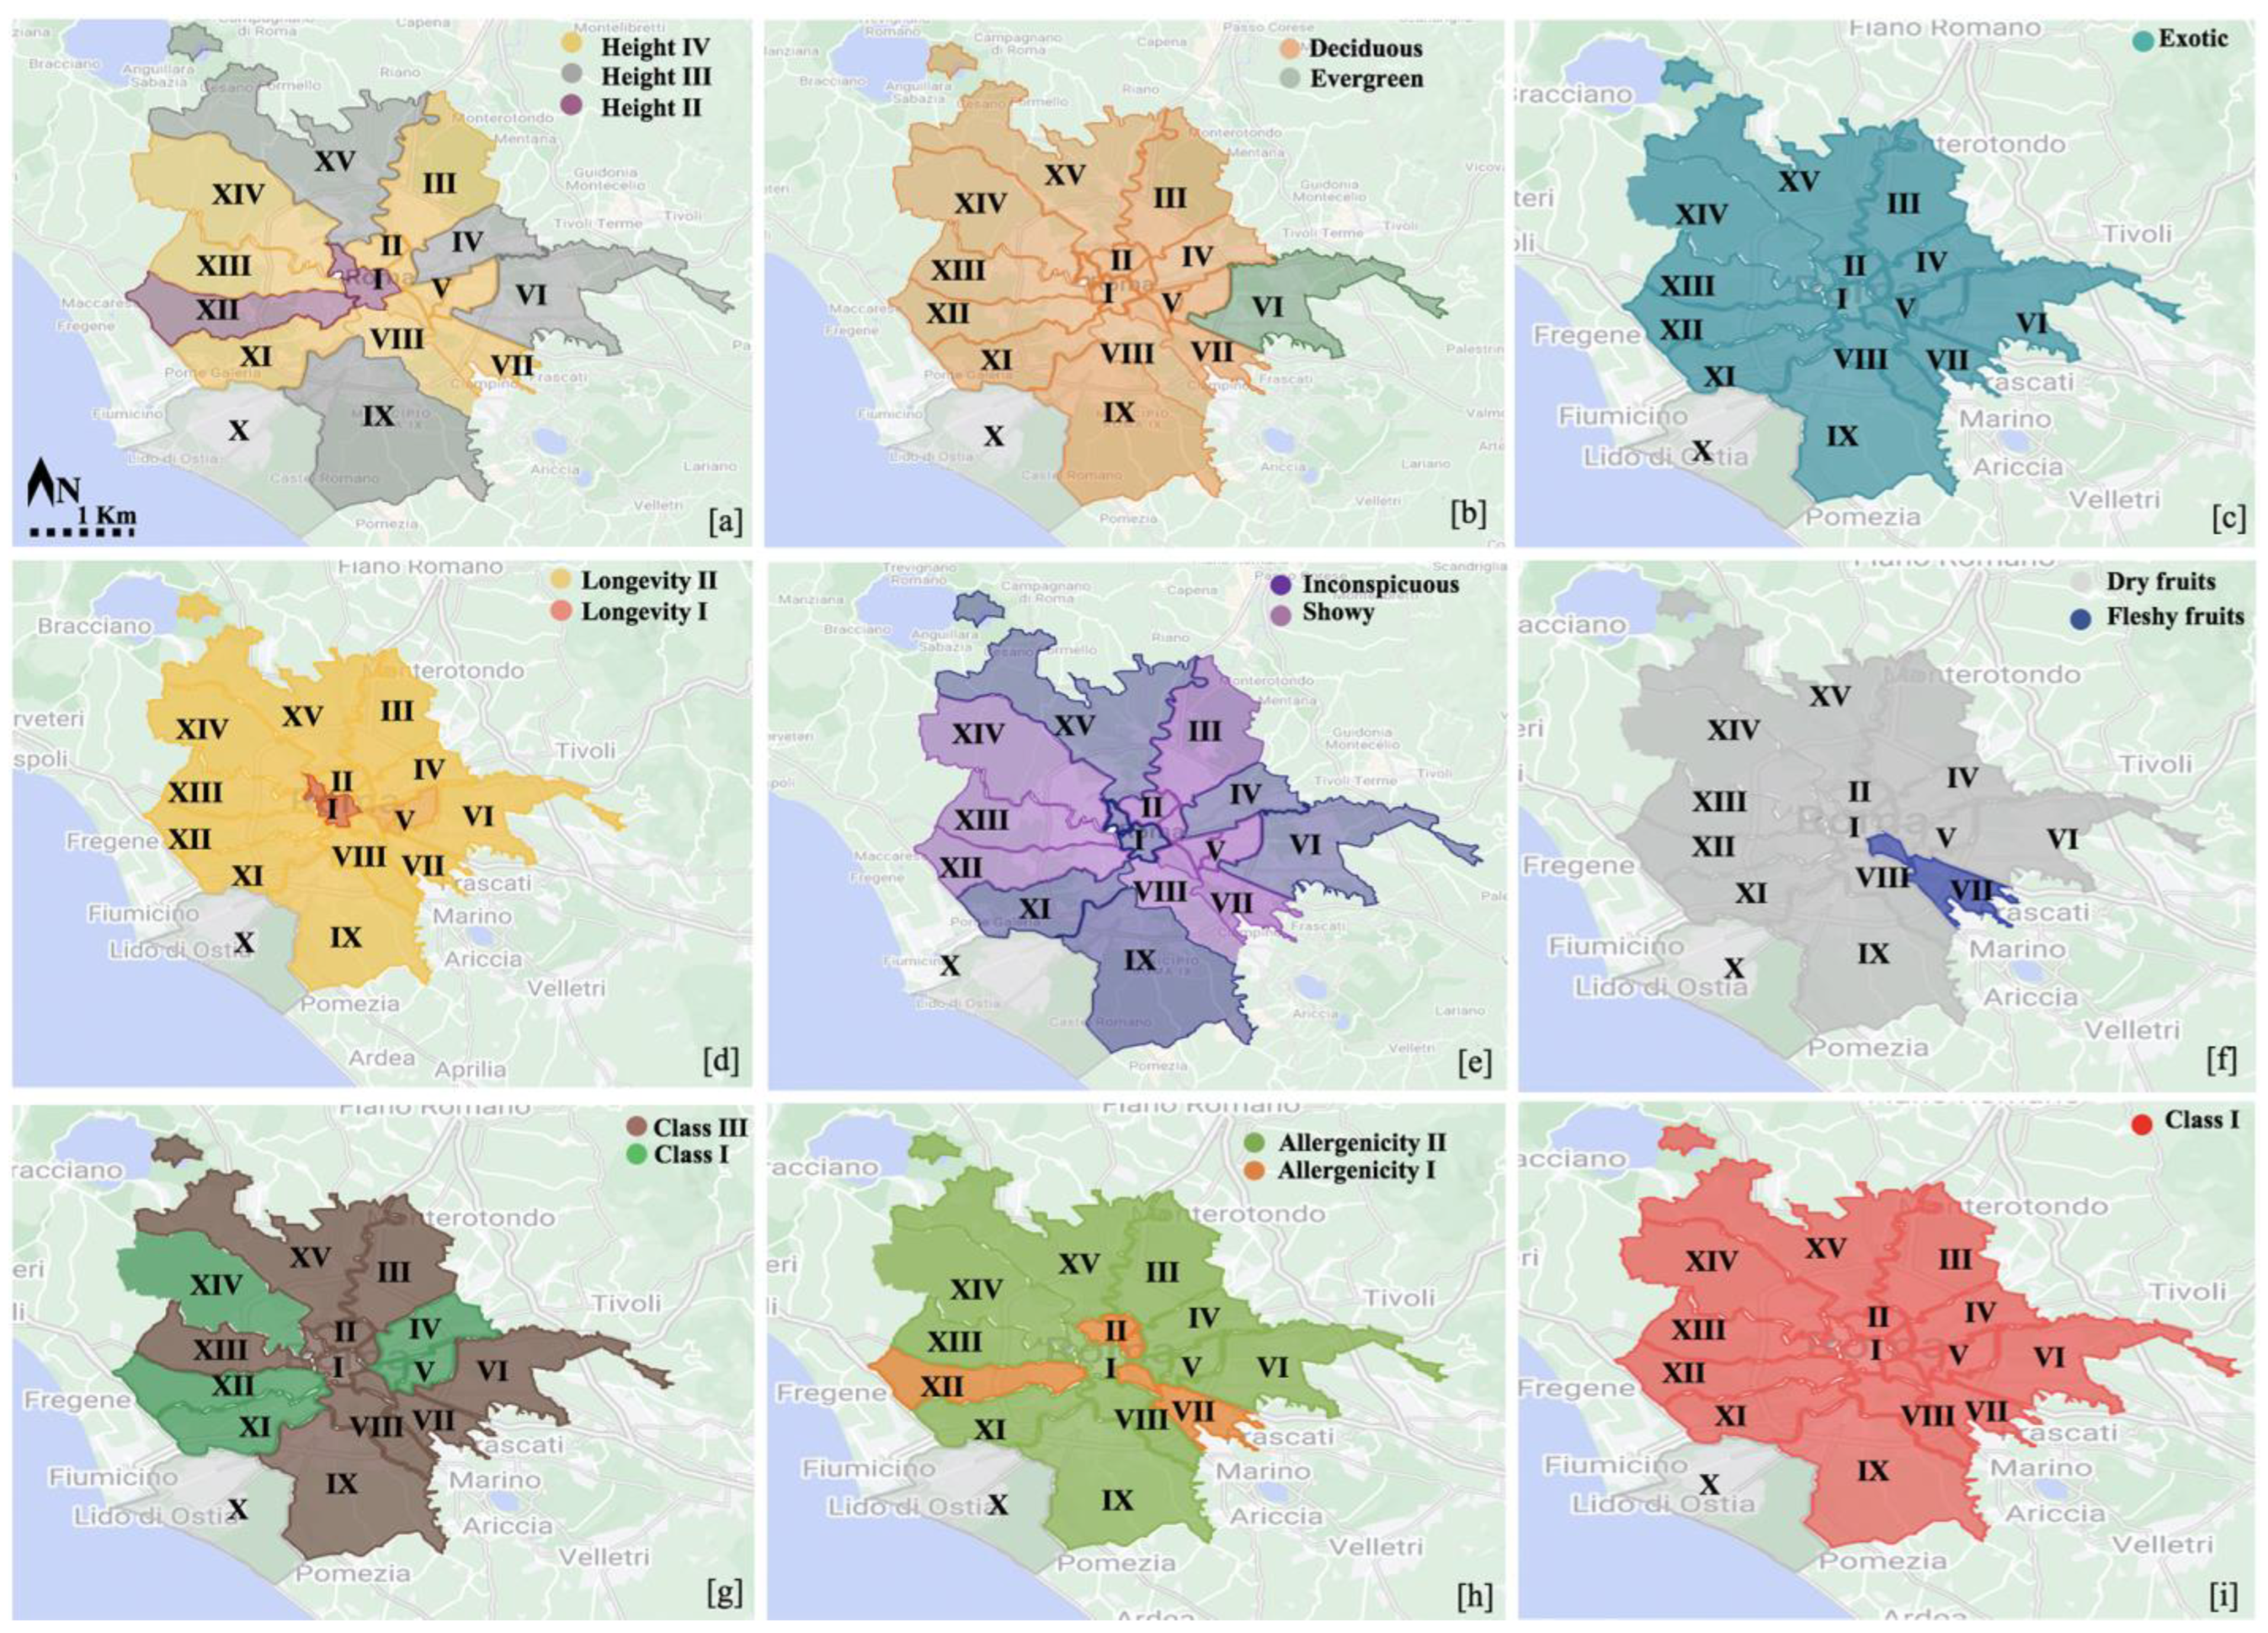
3.2. Evaluation and Mapping of Factors Potentially Related to Tree Selection

There are differences in the distribution of factors that potentially affect tree selection. For instance, as regards the size class, class IV (i.e., trees smaller than 10 m) dominates in eight municipia (II, III, V, VII, VIII, XI, XIII, and XIV), class III (species between 10 and 20 m in height) in four municipia (XV, IV, VI, and IX), and class II (20–30 m) in two municipia (I and XII) (Figure 3a). Concerning the foliage type, deciduous species dominate in all municipia except for municipium VI, where evergreen species dominate (Figure 3b). As regards the fruit type, there is only one municipium (VII) with a clear dominance, specifically of species with dry fruits (Figure 3f). Exotic species (autochthony factor) dominate in all municipia with the highest frequency in municipia V and XIV (Figure 3c). As regards the longevity factor (Figure 3d), it can be seen from the map that only municipium I has trees with a higher longevity (class I), while for the others, class II is the most represented. The distribution of inconspicuous and showy flowers (flower showiness) is quite variable among the various municipia (Figure 3e). Concerning the cultural value, most of the municipia have a prevalence of class III (Figure 3g). Allergenicity value II dominates in all municipia except for municipia II, VII, and XII, which have trees with allergenicity I (Figure 3h). Finally, regarding the economic value factor, there is a general uniformity among all municipia with Price 1 (Figure 3i).

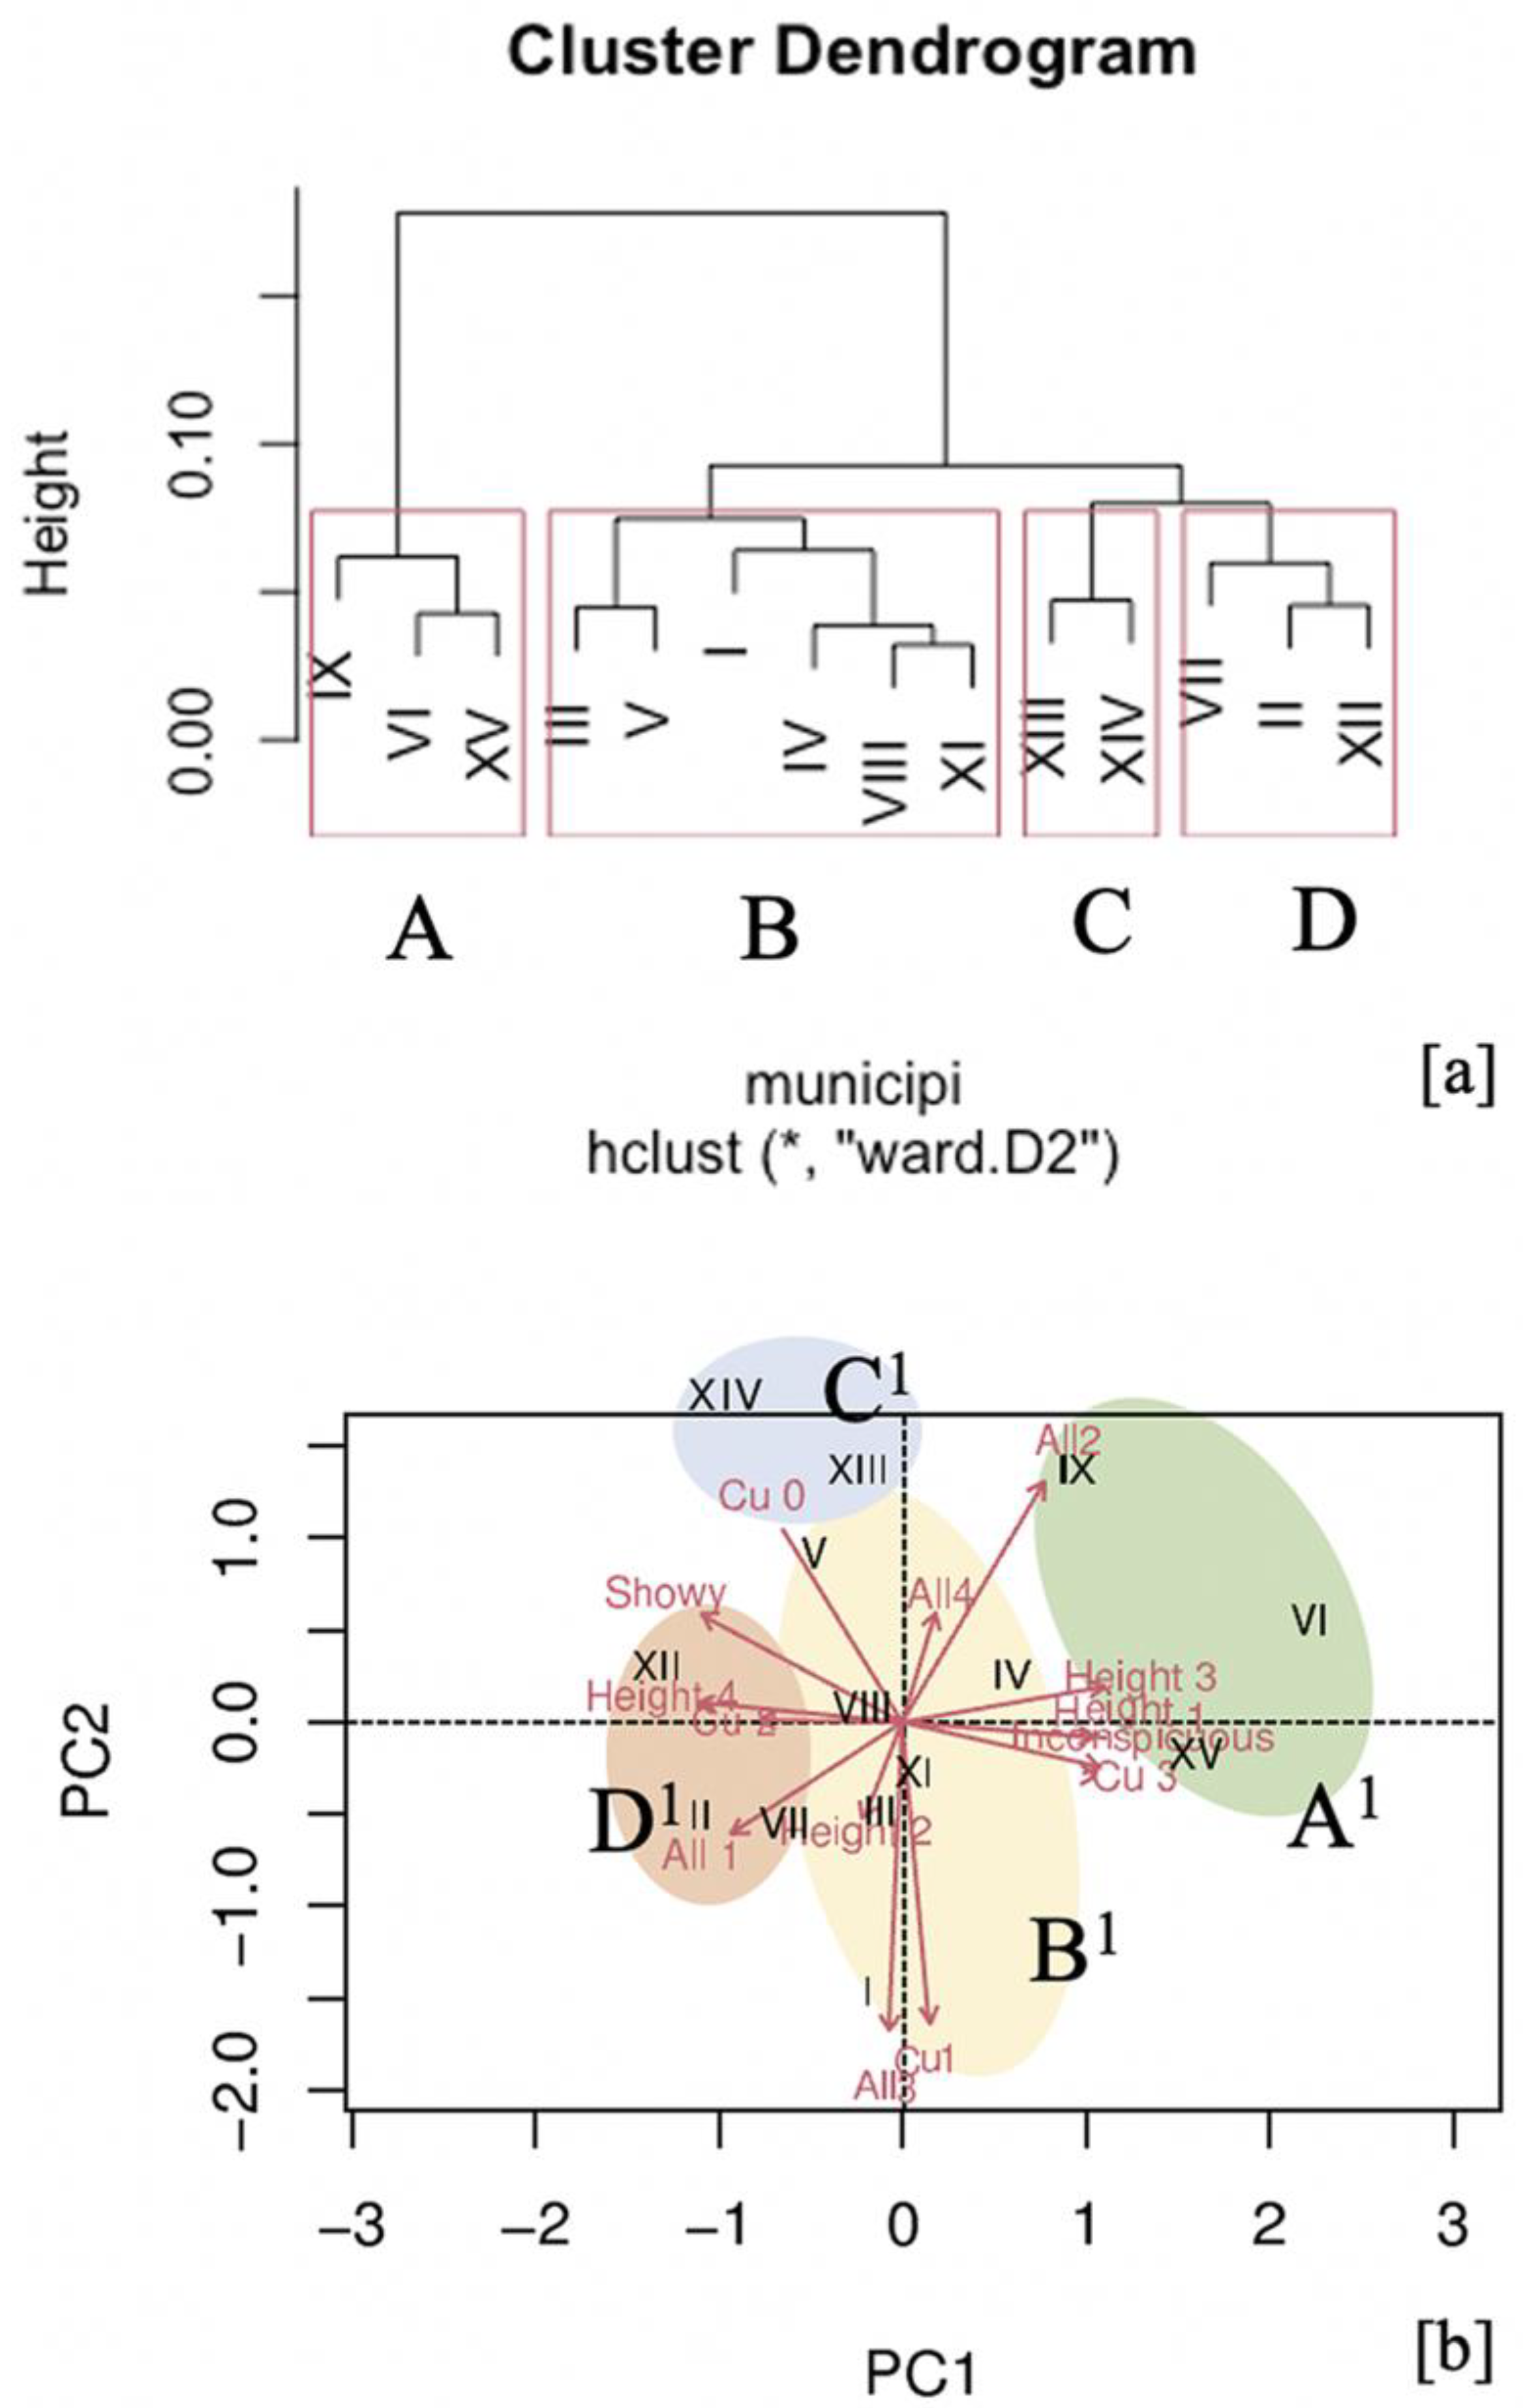
3.3. Statistical Analysis and Interpretation of the Results of Detecting the Influencing Factors of Tree Selection

The cluster analysis (Figure 4a) shows the aggregation of four groups. The first knot discriminates Group A (IX, VI, and XV) from the others in relation to a difference in the dominance of the size class. Overall, these municipia are the only ones that present class III as dominant. The second knot discriminates Group B from the others (IV, XI, I, V, III, and VIII); this clustering seems related to flower showiness as the municipia of this group present a similarity as regards the presence of trees with showy flowers. The last knot detects the last two, Group C (XIII and XIV) and Group D (VII, II, and XII), where the last one is mainly characterized by species with allergenicity class 1. The PCA (principal component analysis) (Figure 4b) also enhances a separation into four groups (A1, B1, C1, D1), following the subdivision identified by the cluster analysis. The PCA explains an x-axis incidence of 0.5% and a y-axis incidence of 0.17%. Thus, considering the gradient of the x-axis, the most distant groups are Group A1 and Group D1, confirming the results of the cluster analysis. The PCA highlights the detached position of municipium I, included in Group B1, but with several differences compared to the other municipia of the same group, with a dominance of Height 1, Longevity 3, and Price 1.

4. Discussion

Our results partially confirmed the trend related to the size class assessed for Rome by Attorre [25]. Specifically, nowadays there is an evident preference for smaller tree species. In fact, the dominant species (total of individuals) belong to size classes III and IV, and their planting density reflects the relation between tree height and pavement space. Indeed, although Platanus × hispanica, class II, is the most frequent species present in almost all municipia, Pinus pinea, size class III, has the highest planting density, leading to a higher percentage of tree-lined streets in the municipia. Two exotic species, L. japonicum and H. syriacus, follow with a decreasing number of individuals. They were planted for their small size (class IV), aesthetic appearance, and easy management [25,44]. However, the distribution of size classes is not homogeneous among the municipia. For example, municipium I, as evident from the distribution maps of bio-ecological characteristics, has a prevalence of trees of class II (medium to large trees). It represents one of the oldest neighborhoods, so it still maintains a conformation that reflects the preferences of the past, when large species were favored (Garden Services note).
Regarding the biodiversity indices concerning the various municipia, several interesting data emerge. Our results highlighted a relationship between the municipium area, the population density, and biodiversity. This relationship changes concerning municipium history, sociality, and economic wealth [45,46]. Indeed, the central municipia I and II show the highest number of trees in relation to their area and the highest Shannon index. This result deserves a separate study, but in the meantime, we can say that the urban milieu is positively correlated with the richness and management of public greenery compared to the more peripheral areas of the city [47,48,49].
In cities, urban environments are often harsh, with few species performing well; about 55% of street tree species have a frequency lower than 1%. However, in planning and managing the plant distribution and safeguarding plant health, it is fundamental to respect the diversity ratio of species, genera, and families, as proposed by Santamour [14]. Indeed, it is well known that the Cancer Oak caused by Ceratocystis fimbriata has affected Platanus × hispanica since the 1940s in Italy, while nowadays Toumeyella parvicornis and Heterobasidion spp. affect P. pinea individuals [50]. This species was extensively planted especially between the 1920s and 1950s [51], so many trees are now old or senescent [52]. Higher levels of diversity reduce the chances of infection, provide some adaptive capacity, increasing the likelihood that urban ecosystems will host trees adapted to future climates. Biodiversity also provides for a diversity of ecosystem services supplied by street trees.
The greater prevalence of deciduous species can undoubtedly be traced to positive aspects such as the greater incidence of the evapotranspiration process of deciduous species compared to evergreen species and, consequently, greater efficiency in summer cooling [23,53]. Moreover, deciduous species are able to cope with high levels of air pollution as they shed their leaves annually and are also functional in pollutant dispersion during the winter, especially along particularly polluted roads [23].
In the same way, the apparent dominance of dry fruits over fleshy fruits is related to the potential disservice of litter formation [22]. On the other hand, the not homogeneous distribution of species in relation to flower showiness suggests that this factor is not accounted for in the selection of the species. In the same way, however, we want to highlight how this factor correlates with the species’ allergenicity rate: species with showy flowers prefer pollination by insects and have a low rate of allergenicity compared to inconspicuous species that instead often involve anemophilous pollination [54]. The distribution map highlighted this aspect: only municipia III, V, and XIV have an allergenicity level of 2 in the classification of [39] but have a more significant presence of showy flowers. The high presence of L. japonicum justified these results due to its dual pollination mode [55]. In this sense, therefore, flower showiness should be a relevant factor in the selection process of the species in order to reduce the allergenicity rates within the city.
As far as cultural values are concerned, although their distribution is not homogeneous, we can state that the highest class is prevalent in the historical municipia (such as I and II), demonstrating that in the oldest municipia there is a potential cultural–historical valuation of the tree species. Previous studies demonstrated that some species are related to historical periods and important events for the city [12]. For example, Pinus pinea is the second most frequently found species in Rome, and this is due to historical and cultural reasons. Such a species was common in Roman gardens (more than two millennia ago), being a symbol of the “Great Mother” and fertility [56], but it has always been popular in the city, especially in the new arboreal planning of Mussolini, through the projects of the architect Raffaele De Vico. Indeed, this tree was massively planted for its symbolic value along the new roads in Rome, such as those in the area that today we know as EUR in the occasion of the Universal Exposition (1942).
Some species should be considered as heritage trees that bring notable botanical, ecological, cultural, and historical values to urban society and contribute significantly to urban resilience and sustainability [57,58,59,60,61,62,63,64,65,66,67]. Previous studies highlighted how these heritage trees are key components of local communities’ sense of place and place attachment [66,67], and reflect both synchronic and diachronic cultural features [62,66,68]. Therefore, these bio-cultural assets contribute to urban citizens’ well-being by assuring ecological and social resilience in the face of climate change, and a stock of natural resources on the doorstep to be appreciated for their exceptional aesthetic, cultural, and historical values [66].
The topic of the occurrence of exotic species is also very relevant and discussed in urban regulations and the scientific literature. In fact, despite several studies showing that native trees should be encouraged over exotic species because they are already integrated into local ecosystems [69], often non-native species are predominant (more than half of the species biodiversity of street trees) at the national [24] and international level. The dominance of exotic species over native species throughout the city is consistent with other studies regarding the biodiversity of street trees in some European, North American, and Australian cities [70]. In some cases, exotic species have been preferred for their aesthetic appearance and economic value, but mostly for their higher resistance than native species in the restrictive street habitat [71,72,73,74]. However, using native species as street trees offers social, economic, and ecological benefits. As far as economic aspects are concerned, the prevalence of class I, which corresponds to the most inexpensive, can certainly be justified by special market requirements, but also by the greater prevalence of size class IV trees and exotic species falling into class I (economic parameters).
Finally, in the whole selection criteria, some factors seem to dominate over others, highlighting that there are primary and derived selection criteria. The foliage type, longevity, fruit type, autochthony, and economic value are the primary criteria; additionally, flower showiness, allergenicity, and size class are secondary.

5. Conclusions

Although it is indisputable that Rome has a very rich biodiversity of street trees, it can be said that diversity limits are often exceeded, neglecting the rules of biodiversity that represent a valid criterion for safeguarding tree heritage. Our work underlines that the primary selection criteria are not casual and highlights how the biological and ecological aspects are secondary or even neglected. The prerequisite for the proper design of tree-lined streets should involve a multidisciplinary approach that pays attention to ecosystem efficiency, biodiversity, and sustainable management of the urban green.

Author Contributions

Conceptualization, G.C., F.B. and L.D.; methodology, G.C., F.B. and L.D.; validation, G.C. and F.B.; formal analysis, L.D. and F.B.; investigation, F.B.; resources, F.M.; data curation, L.D. and F.B.; writing—original draft preparation, L.D.; writing—review and editing, F.B.; V.S., P.A.P., F.M. and G.C.; visualization, L.D. and F.B.; supervision, G.C.; project administration, G.C.; funding acquisition, G.C. All authors have read and agreed to the published version of the manuscript.

Funding

Grant of Excellence Departments, MIUR-Italy Italian Ministry of University and Research, National Operational Program “Research and Innovation” 2014–2020 (PON), CUP ECCELLENZA_2023-27_BMCAE. National Biodiversity Future Center (NBFC), Università di Palermo, Piazza Marina 61, 90133 Palermo, Italy.

Institutional Review Board Statement

Not applicable.

Informed Consent Statement

Not applicable.

Data Availability Statement

Not applicable.

Acknowledgments

We thanks the Garden Service of Rome who collected the floristic data and also Yingxin Wei and Sara Barboni of the Department of Science of the University Roma Tre who helped authors with the field data.

Conflicts of Interest

The authors declare no conflict of interest.

References

  1. Roy, S.; Byrne, J.; Pickering, C. A systematic quantitative review of urban tree benefits, costs, and assessment methods across cities in different climatic zones. Urban For. Urban Green. 2012, 11, 351–363. [Google Scholar] [CrossRef]
  2. Aronson, M.F.; Lepczyk, C.A.; Evans, K.L.; Goddard, M.A.; Lerman, S.B.; MacIvor, J.S.; Nilon, C.H.; Vargo, T. Biodiversity in the city: Key challenges for urban green space management. Front. Ecol. Environ. 2017, 15, 189–196. [Google Scholar] [CrossRef]
  3. Anguluri, R.; Narayanan, P. Role of green space in urban planning: Outlook towards smart cities. Urban For. Urban Green. 2017, 25, 58–65. [Google Scholar] [CrossRef]
  4. Capotorti, G.; Bonacquisti, S.; Abis, L.; Aloisi, I.; Attorre, F.; Bacaro, G.; Balleto, G.; Banfi, E.; Barni, E.; Bartoli, F.; et al. More nature in the city. Plant Biosyst.-Int. J. Deal. All Asp. Plant Biol. 2020, 154, 1003–1006. [Google Scholar] [CrossRef]
  5. Yue, X.L.; Gao, Q.-X. Contributions of natural systems and human activity to greenhouse gas emissions. Adv. Clim. Change Res. 2018, 9, 243–252. [Google Scholar] [CrossRef]
  6. David, A.J.A.; Boura, A.; Lata, J.C.; Rankovic, A.; Kraepiel, Y.; Charlot, C.; Barot, S.; Abbadie, L.; Ngao, J. Street trees in Paris are sensitive to spring and autumn precipitation and recent climate changes. Urban Ecosyst. 2018, 21, 133–145. [Google Scholar] [CrossRef]
  7. Marando, F.; Salvatori, E.; Sebastiani, A.; Fusaro, L.; Manes, F. Regulating ecosystem services and green infrastructure: Assessment of urban heat island effect mitigation in the municipality of Rome, Italy. Ecol. Model. 2019, 392, 92–102. [Google Scholar] [CrossRef]
  8. Carter, J.G. Climate change adaptation in European cities. Curr. Opin. Environ. Sustain. 2011, 3, 193–198. [Google Scholar] [CrossRef]
  9. Appleyard, D. Urban trees, urban forests: What do they mean. In Proceedings of the National Urban Forestry Conference, Washington, DC, USA, 13–16 November 1979; pp. 138–155. [Google Scholar]
  10. Dwyer, J.F.; Schroeder, H.W.; Gobster, P.H. The significance of urban trees and forests: Toward a deeper understanding of values. J. Arboric. 1991, 17, 276–284. [Google Scholar] [CrossRef]
  11. Balzan, M.V.; Geneletti, D.; Grace, M.; De Santis, L.; Tomaskinova, J.; Reddington, H.; Sapundzhieva, A.; Dicks, L.V.; Collier, M. Assessing nature-based solutions uptake in a Mediterranean climate: Insights from the case-study of Malta. Nat.-Based Solut. 2022, 2, 100029. [Google Scholar] [CrossRef]
  12. Caneva, G.; Bartoli, F.; Zappitelli, I.; Savo, V. Street trees in italian cities: Story, biodiversity and integration within the urban environment. Rend. Lincei. Sci. Fis. Nat. 2020, 31, 411–417. [Google Scholar] [CrossRef]
  13. Liu, J.; Slik, F. Are street trees friendly to biodiversity? Landsc. Urban Plan. 2022, 218, 104304. [Google Scholar] [CrossRef]
  14. Santamour, F.S., Jr. Trees for urban planting: Diversity uniformity, and common sense. In The Overstory Book: Cultivating Connections with Trees; Elevitch, C., Ed.; Permanent Agriculture Resources: Holuoloa, HI, USA, 2004; pp. 396–399. [Google Scholar]
  15. Kendal, D.; Dobbs, C.; Lohr, V.I. Global patterns of diversity in the urban forest: Is there evidence to support the 10/20/30 rule? Urban For. Urban Green. 2014, 13, 411–417. [Google Scholar] [CrossRef]
  16. Galle, N.J.; Halpern, D.; Nitoslawski, S.; Duarte, F.; Ratti, C.; Pilla, F. Mapping the diversity of street tree inventories across eight cities internationally using open data. Urban For. Urban Green. 2021, 61, 127099. [Google Scholar] [CrossRef]
  17. Escobedo, F.J.; Wagner, J.E.; Nowak, D.J.; De la Maza, C.L.; Rodriguez, M.; Crane, D.E. Analyzing the cost effectiveness of Santiago, Chile’s policy of using urban forests to improve air quality. J. Environ. Manag. 2008, 86, 148–157. [Google Scholar] [CrossRef]
  18. Seamans, G.S. Mainstreaming the environmental benefits of street trees. Urban For. Urban Green. 2013, 12, 2–11. [Google Scholar] [CrossRef]
  19. Mullaney, J.; Lucke, T.; Trueman, S.J. A review of benefits and challenges in growing street trees in paved urban environments. Landsc. Urban Plan. 2015, 134, 157–166. [Google Scholar] [CrossRef]
  20. Nowak, D.J.; Coville, R.; Endreny, T.; Abdi, R.; Van Stan, J.T., II. Valuing urban tree impacts on precipitation partitioning. In Precipitation Partitioning by Vegetation: A Global Synthesis; Springer: Cham, Switzerland, 2020; pp. 253–268. [Google Scholar] [CrossRef]
  21. Orlandi, F.; Fornaciari, M.; Ranfa, A.; Proietti, C.; Ruga, L.; Meloni, G.; Burnelli, M.; Ventura, F. LIFE-CLIVUT, ecosystem benefits of urban green areas: A pilot case study in Perugia (Italy). Iforest-Biogeosci. For. 2022, 15, 133. [Google Scholar] [CrossRef]
  22. Von Döhren, P.; Haase, D. Ecosystem disservices research: A review of the state of the art with a focus on cities. Ecol. Indic. 2015, 52, 490–497. [Google Scholar] [CrossRef]
  23. Savo, V.; D’Amato, L.; Bartoli, F.; Zappitelli, I.; Caneva, G. Trees are Not All the Same: Evaluation of Main Regulating, Provision, and Supporting Ecosystem Services of Urban Street Trees. Provis. Support. Ecosyst. Serv. Urban Str. Trees 2023. submitted. [Google Scholar]
  24. Bartoli, F.; Savo, V.; Caneva, G. Biodiversity of urban street trees in Italian cities: A comparative analysis. Plant Biosyst.-Int. J. Deal. All Asp. Plant Biol. 2022, 156, 649–662. [Google Scholar] [CrossRef]
  25. Attorre, F.; Bruno, M.; Francesconi, F.; Valenti, R.; Bruno, F. Landscape changes of Rome through tree-lined roads. Landsc. Urban Plan. 2000, 49, 115–128. [Google Scholar] [CrossRef]
  26. Blasi, C. Fitoclimatologia Del Lazio; University La Sapienza, Assessorato Agricultura-Foreste, Caccia e Pesca: Rome, Italy, 1994. [Google Scholar]
  27. Thomsen, P.; Bühler, O.; Kristoffersen, P. Diversity of street tree populations in larger Danish municipalities. Urban For. Urban Green. 2016, 15, 200–210. [Google Scholar] [CrossRef]
  28. Pignatti, S.; Guarino, R.; La Rosa, M. Flora d’Italia; Edagricole di New Business Media: Bologna, Italy, 2017; Volume 1. [Google Scholar]
  29. WFO. World Flora Online. 2023. Available online: http://www.worldfloraonline.org (accessed on 23 August 2023).
  30. Stohlgren, T.J. Measuring Plant Diversity: Lessons from the Field; Oxford University Press: New York, NY, USA, 2007. [Google Scholar]
  31. Peet, R.K. The measurement of species diversity. Annu. Rev. Ecol. Syst. 1974, 5, 285–307. [Google Scholar] [CrossRef]
  32. Krebs, C.J. Ecological Methodology, 2nd ed.; Addison Wesley Longman: Menlo Park, CA, USA, 1999. [Google Scholar]
  33. Sezione Italiana dell’ International Society of Arboriculture. Available online: https://www.isaitalia.org (accessed on 23 August 2023).
  34. Urban Forest Ecosystems Institute at Cal Poly. Available online: https://selectree.calpoly.edu/tree-characteristics-glossary (accessed on 23 August 2023).
  35. Acta Plantarum. Available online: https://actaplantarum.org (accessed on 23 August 2023).
  36. Bubani, P. Flora Virgiliana; Edizioni Forni: Bologna, Italy, 1870. [Google Scholar]
  37. Maniero, F. Cronologia della Flora Esotica Italiana; Leo, S., Ed.; Olschki: Florence, Italy, 2015. [Google Scholar]
  38. Cariñanos, P.; Casares-Porcel, M. Urban green zones and related pollen allergy: A review. Some guidelines for designing spaces with low allergy impact. Landsc. Urban Plan. 2011, 101, 205–214. [Google Scholar] [CrossRef]
  39. Cariñanos, P.; Marinangeli, F. An updated proposal of the Potential Allergenicity of 150 ornamental Trees and shrubs in Mediterranean Cities. Urban For. Urban Green. 2021, 63, 127218. [Google Scholar] [CrossRef]
  40. Asso Verde: Associazione Italiana Costruttori del Verde. Available online: https://assoverde.it (accessed on 7 August 2023).
  41. Google My Maps. Available online: https://www.google.com/maps/d/u/0/ (accessed on 20 July 2023).
  42. De Cáceres, M.; Legendre, P.; Moretti, M. Improving indicator species analysis by combining groups of sites. Oikos 2010, 119, 1674–1684. [Google Scholar] [CrossRef]
  43. Oksanen, J.; Blanchet, F.G.; Friendly, M.; Kindt, R.; Legendre, P.; McGlinn, D.; Minchin, P.R.; O’Hara, R.B.; Simpson, G.L.; Solymons, P.; et al. Package ‘Vegan’. Community Ecology Package; Version 2; R Core Team: Vienna, Austria, 2019. [Google Scholar]
  44. Kim, Y.; Cho, Y.; Kang, Y.K.; Choi, M.; Nam, S.H. A study of the major insect pest communities associated with Hibiscus syriacus (Columniferae, Malvaceae). J. Ecol. Environ. 2013, 36, 125–129. [Google Scholar] [CrossRef]
  45. Lelo, K.; Monni, S.; Tomassi, F. Urban inequalities in Italy: A comparison between Rome, Milan and Naples. Entrep. Sustain. Issues 2018, 6, 939. [Google Scholar] [CrossRef]
  46. Lelo, K.; Monni, S.; Tomassi, F. Socio-spatial inequalities and urban transformation. The case of Rome districts. Socio-Econ. Plan. Sci. 2019, 68, 100696. [Google Scholar] [CrossRef]
  47. Neckerman, K.M.; Lovasi, G.S.; Davies, S.; Purciel, M.; Quinn, J.; Feder, E.; Raghunath, N.; Wasserman, B.; Rundle, A. Disparities in urban neighborhood conditions: Evidence from GIS measures and field observation in New York City. J. Public Health Policy 2009, 30, S264–S285. [Google Scholar] [CrossRef] [PubMed]
  48. Kirkpatrick, J.B.; Daniels, G.D.; Davison, A. Temporal and spatial variation in garden and street trees in six eastern Australian cities. Landsc. Urban Plan. 2011, 101, 244–252. [Google Scholar] [CrossRef]
  49. Apparicio, P.; Landry, S.; Lewnard, J. Disentangling the effects of urban form and socio-demographic context on street tree cover: A multi-level analysis from Montréal. Landsc. Urban Plan. 2017, 157, 422–433. [Google Scholar] [CrossRef]
  50. Biocca, M.; Motta, E.; Lucatello, G.; Dallari, D. Aspects of the stability of the Italian Stone Pine (Pinus pinea L.) in Rome, Italy. In Proceedings of the Atti del “Second International Symposium on Plant Health in Urban Horticulture”, Berlin, Germany, 27–29 August 2003; pp. 228–229. [Google Scholar]
  51. Massari, G. L’albero Urbano a Roma; Tomo: Roma, Italy, 1991; 256p. [Google Scholar]
  52. Biocca, M.; Gallo, P.; Sperandio, G. Technical and economic aspects of stone pine (Pinus pinea L.) maintenance in urban environments. Environ. Sci. Proc. 2020, 3, 16. [Google Scholar] [CrossRef]
  53. Givnish, T.J. Adaptive significance of evergreen vs. deciduous leaves: Solving the triple paradox. Silva Fenn. 2002, 36, 703–743. [Google Scholar] [CrossRef]
  54. Cariñanos, P.; Adinolfi, C.; Diaz de la Guardia, C.; De Linares, C.; Casares-Porcel, M. Characterization of allergen emission sources in urban areas. J. Environ. Qual. 2016, 45, 244–252. [Google Scholar] [CrossRef]
  55. D’Amato, G.; Mullins, J.; Nolard, N.; Spieksma, F.T.M.; Wachter, R. City spore concentrations in the European Economic Community (EEC). VII. Oleaceae (Fraxinus, Ligustrum, Olea). Clin. Exp. Allergy 1988, 18, 541–547. [Google Scholar] [CrossRef]
  56. Caneva, G. Il Pino Domestico; La Nazione delle Piante; Laterza: Bari, Italy, 2019. [Google Scholar]
  57. Fay, N. Environmental arboriculture, tree ecology and veteran tree management. Arboric. J. 2002, 26, 213–238. [Google Scholar] [CrossRef]
  58. Jim, C.Y. Outstanding remnants of nature in compact cities: Patterns and preservation of heritage trees in Guangzhou city (China). Geoforum 2005, 36, 371–385. [Google Scholar] [CrossRef]
  59. Hall, C.M.; James, M.; Baird, T. Forests and trees as charismatic mega-flora: Implications for heritage tourism and conservation. J. Herit. Tour. 2011, 6, 309–323. [Google Scholar] [CrossRef]
  60. Abendroth, S.; Kowarik, I.; Müller, N.; Von der Lippe, M. The green colonial heritage: Woody plants in parks of Bandung, Indonesia. Landsc. Urban Plan. 2012, 106, 12–22. [Google Scholar] [CrossRef]
  61. Lonsdale, D. The recognition of functional units as an aid to tree management, with particular reference to veteran trees. Arboric. J. Int. J. Urban For. 2013, 35, 188–201. [Google Scholar] [CrossRef]
  62. Chen, W.Y. Public willingness-to-pay for conserving urban heritage trees in Guangzhou, south China. Urban For. Urban Green. 2015, 14, 796–805. [Google Scholar] [CrossRef]
  63. Shackleton, S.; Chinyimba, A.; Hebinck, P.; Shackleton, C.; Kaoma, H. Multiple benefits and values of trees in urban landscapes in two towns in northern South Africa. Landsc. Urban Plan. 2015, 136, 76–86. [Google Scholar] [CrossRef]
  64. Wyse, S.V.; Beggs, J.R.; Burns, B.R.; Stanley, M.C. Protecting trees at an individual level provides insufficient safeguard for urban forests. Landsc. Urban Plan. 2015, 141, 112–122. [Google Scholar] [CrossRef]
  65. Gerstenberg, T.; Hofmann, M. Perception and preference of trees: A psychological contribution to tree species selection in urban areas. Urban For. Urban Green. 2016, 15, 103–111. [Google Scholar] [CrossRef]
  66. Chen, W.Y.; Hua, J. Heterogeneity in resident perceptions of a bio-cultural heritage in Hong Kong: A latent class factor analysis. Ecosyst. Serv. 2017, 24, 170–179. [Google Scholar] [CrossRef]
  67. Read, H. Veteran Trees: A Guide to Good Management; English Nature: Peterborough, UK, 2000; 176p. [Google Scholar]
  68. Becker, N.; Freeman, S. The economic value of old growth trees in Israel. For. Policy Econ. 2009, 11, 608–615. [Google Scholar] [CrossRef]
  69. Shackleton, C. Do indigenous street trees promote more biodiversity than alien ones? Evidence using mistletoes and birds in South Africa. Forests 2016, 7, 134. [Google Scholar] [CrossRef]
  70. Anderson, E.C.; Locke, D.H.; Pickett, S.T.; LaDeau, S.L. Just street trees? Street trees increase local biodiversity and biomass in higher income, denser neighborhoods. Ecosphere 2023, 14, e4389. [Google Scholar] [CrossRef]
  71. Roloff, A.; Korn, S.; Gillner, S. The Climate-Species-Matrix to select tree species for urban habitats considering climate change. Urban For. Urban Green. 2009, 8, 295–308. [Google Scholar] [CrossRef]
  72. Chalker-Scott, L. Nonnative, noninvasive woody species can enhance urban landscape biodiversity. Arboric. Urban For. 2015, 41, 173–186. [Google Scholar] [CrossRef]
  73. Riley, C.B.; Herms, D.A.; Gardiner, M.M. Exotic trees contribute to urban forest diversity and ecosystem services in inner-city Cleveland, OH. Urban For. Urban Green. 2018, 29, 367–376. [Google Scholar] [CrossRef]
  74. Matter, S.F.; Brzyski, J.R.; Harrison, C.J.; Hyams, S.; Loo, C.; Loomis, J.; Lubbers, H.R.; Seastrum, L.; Stamper, T.I.; Stein, A.M.; et al. Invading from the garden? A comparison of leaf herbivory for exotic and native plants in natural and ornamental settings. Insect Sci. 2012, 19, 677–682. [Google Scholar] [CrossRef]
Figure 1. Distribution maps of the most representative species (a) in all municipia; (b) The most abundant species in relation to the tree-lined streets in the municipia.
Sustainability 15 14065 g001
Figure 2. Distribution and biodiversity of street trees in the different municipia. (a) Street trees in relation to the area of the municipia and (b) in relation to the population density; (c) Tree-lined streets in relation to the area of the municipia; (d) Shannon and Evenness indexes.
Sustainability 15 14065 g002
Figure 3. Distribution of the various clusters and factors related to tree selection across the municipia. (a) Size class, (b) foliage type, (c) autochthony, (d) longevity, (e) flower showiness, (f) fruit type, (g) cultural value, (h) allergenicity, and (i) economic value. Size class: Height 1= trees > 30 m; Height 2 = 30 > trees > 20 m; Height 3 = 20 m > trees > 10 m; Height 4 = trees < 10 m. Foliage type: evergreen, deciduous; autochthony = native, exotic. Longevity: Long 1 = trees < 50 years; Long 2 = 150 > trees > 50 years; Long 3 = trees > 150 years. Flower showiness: inconspicuous; showy; Fruit type: fleshy; dry. Cultural value: class 0 = no cultural link; class 1 = link to contemporary culture; class 2 = link to the modern age; class 3 = link to Roman/Greek culture. Allergenicity: All 0 = nil; All 1 = low; All 2 = moderate; All 3 = high; All 4 = very high. Economic value: Price 1 ≤ €500; €500 < Price 2 < €1000; Price 3 > €1000.
Sustainability 15 14065 g003
Figure 4. Similarity of municipia in relation to the characteristics of tree species. (a) Cluster analysis of municipia (in roman letter); A: group 1; B: group 2; C: group 3; D: group 4 (b) PCA. Size class: Height 1 = trees > 30 m; Height 2 = 30 > trees > 20 m; Height 3 = 20 m > trees > 10 m; Height 4 = trees < 10 m. Cultural value: Cu 0 = no cultural link; Cu 1 = link to contemporary culture; Cu 2 = link to the modern age; Cu 3 = link to Roman/Greek culture. Allergenicity: All 0 = nil; All 1 = low; All 2 = moderate; All 3 = high; All 4 = very high. Economic value: Price 1 < €500; €500 < Price 2 < €1000; Price 3 > €1000. A’: group 1’; B’: group 2’; C’: group 3’; D’: group 4’.
Sustainability 15 14065 g004
Table 1. Description of the clusters of factors potentially used for selecting street trees, with their respective parameters.
Bio-EcologicalAestheticCulturalAllergenicityEconomic
SizeHeight 1 > 30 m
20 m < Height 2< 30 m
10 m < Height 3 < 20 m
10 m < Height 4
Flower showinessInconspicuous, ShowyHistorical backgroundClass 0: No cultural link
Class 1: Link to contemporary culture
Class 2: Link to the modern age
Class 3: Link to Roman/Greek culture
AllergenicityAll 0: Nil
All 1: Low
All 2: Moderate
All 3: High
All 4: Very high
PricePrice 1 < €500
€500 < Price 2 < €1000
Price3 > €1000
Table 2. Checklist of frequencies and total number of the street tree species in each municipium of Rome and in the whole city. The most frequent species in each municipium are highlighted in bold (only species with frequencies >1% in at least one municipium are considered).
SpeciesIIIIIIIVVVIVIIVIIIIXXIXIIXIIIXIVXV%TOT
Acer campestre L.1.21.6000.30.203.60.61.6002.400.95
Acer negundo L. 1.94.78.34.55.954.80.72.412.46.26.18.41.64.6
Acer platanoides L. 00.11.70.90.301.21.40.2000.10.400.49
Acer pseudoplatanus L. 0000000.4000.91.80000.16
Aesculus hippocastanum L. 1.1001.90.90.5000000000.33
Albizia julibrissin Durazz. 1.20.80.110.7300.60.510.40.30.20.20.64
Celtis australis L. 0.31.30.20.40.60.90.40.11.3011.10.21.70.65
Cercis siliquastrum L. 4.7611.31.12.42.810.25.613.55.73.50.43.55
Citrus aurantium L.1.60.302.20.300.10.40.31.50.30100.58
Crataegus lavallei Herincq ex Lavalle00000000002.30000.12
Crataegus rhipidophylla Gand.0.10.801.7201.21.301.20.12.92.700.86
Cupressus arizonica Greene 000.11.20.20.50.30.40.400000.10.2
Cupressus macrocarpa Hartw.00001.30.2000000000.1
Cupressus sempervirens L. 3.410.32.900.50.70.71.21.10.51.61.54.61.37
Eucalyptus camaldulensis Dehnh. 00000.12.1000000.8000.08
Eucalyptus globulus Labill.00.100.200.501.30.62.2000.10.10.3
Fraxinus excelsior L. 00.2001.30000000000.11
Fraxinus ornus L.0.40.30.1000.41.400000000.26
Hibiscus syriacus L. 6.413.51.84.72.60.110.34.32.51.88.34.214.736.63
Koelreuteria paniculata Laxm.00.500.100020000000.23
Lagerstroemia indica L.0.20.90.40.80.400.20.50.30.20.51.50.80.20.47
Ligustrum japonicum Thunb.5.88.317.79.115.81.88.29.84.85.410.913.320.27.49.48
Ligustrum ovalifolium Hassk. 0.300002.70.700000.3000.2
Magnolia grandiflora L. 1.20.501.12.10.40.40.12.900.20.10.400.84
Melia azedarach L. 0.300.70.5000.80.700.510.20.400.35
Morus alba L. 1.10000.20.1000000000.16
Nerium oleander L. 2.110.55.62.30.40.21.81.302.73.305.90.13.35
Photinia × fraseri Dress01.1000.300.60001.70000.35
Pinus pinea L.4.74.29.217.69.735.510.415.130.59.3313.94.419.311.76
Platanus × hispanica Mill. ex Münchh.20.21220.210.611.46.513.112.15.816.69.46.53.815.812.5
Populus alba L. 00.200.40000.30001.403.50.22
Populus nigra L.0.60.10.95.90.20.10.701.71.60.10.103.50.94
Prunus avium (L.) L.001.300.10.40.30.90000.300.40.23
Prunus cerasifera Ehrh.4.941.17.423.34.77.62.312.111.4171.50.94.91
Prunus cerasus L.0.30000001.90.5000000.24
Prunus serrulata Lindl. 21.22.40.6502.21000.90001.38
Pyrus calleryana Decne. 2.80.1007.71.32.10.50.92.30.601.301.5
Quercus ilex L.13.55.847.23.812.93.47.354.17.312.23.45.56.6
Quercus pubescens Willd. 00001.10000000000.07
Quercus robur L.0.700.10.20.10.1000000.20.810.1
Quercus suber L.000.6000.10.200.1000.10.63.10.2
Robinia pseudoacacia L. 3.28.15.14.72.46.812.25.28.94.44.63.94.87.86.32
Styphnolobium japonicum (L.) Schott 2.31.40.100.30.30.500.301.90000.72
Tilia europaea L.00.20.1004.700.700000.112.80.62
Tilia americana L. 1.61.25.33.411.91.11.852297.56.216.906.3
Tilia cordata Mill.2.2000.200.60.21.20000000.4
Tilia tomentosa Moench 00000.101.100000000.13
Ulmus americana L.01.6000000000000.10.25
Ulmus minor Mill.1.400.50.12.11.40.50.30.3000.10.300.52
Ulmus pumila L.3.4302.20.400.91.90.91.97001.51.8
Table 3. Diversity limits of family, genus, and species according to [14] in Rome and its municipia. Percentage of exotic species in Rome and in each municipium.
Rome
Tot.
Municipia
IIIIIIIVVVIVIIVIIIIXXIXIIXIIIXIVXV
Family limit (30%)
Pinaceae 42% 34%
Malvaceae 33%
Genus limit (20%)
Pinus 19% 37% 32% 21%
Platanus 22% 22%
Ligustrum 19% 22%
Tilia 23% 18%
Species limit (10%)
Platanus × hispanica Mill. ex Münchh.13%13%13%20%11%12% 13%13% 17%10% 16%
Ligustrum japonicum Thunb.10%10%9%18%9% 8%10% 12%13%20%8%
Pinus pinea L.12%12% 18% 36%11%16% 10% 14% 20%
Quercus ilex L.14%14% 13% 8% 8%12%
Hibiscus syriacus L. 14% 10% 9% 15%
Tilia americana L. 12% 9%8% 17%
Prunus cerasifera Ehrh. 12%13%17%
Cercis siliquastrum L. 11% 10%
Acer negundo L. 13% 8%
Tilia hybrida Behlan 13%
Robinia pseudoacacia L. 12%
Nerium oleander L. 11%
Autochthony (%)
Native 36%37%34%35%43%24%57%35%40%43%28%23%39%24%47%
Exotic 64%63%66%65%57%76%43%65%60%57%72%72%61%76%53%
Disclaimer/Publisher’s Note: The statements, opinions and data contained in all publications are solely those of the individual author(s) and contributor(s) and not of MDPI and/or the editor(s). MDPI and/or the editor(s) disclaim responsibility for any injury to people or property resulting from any ideas, methods, instructions or products referred to in the content.

