1. Introduction
Due to the evolutionary growth of the modern industrial world, electric motors (EMs) are used extensively, acting as fans, compressors, pumps, mechanical arms, machine tools, and other devices. With the attainment of renewable energy, EMs play a pivotal role in the domain of electric vehicles as well as in wind power generation. In an industrial environment, EMs work under various criteria and different conditions as well [
1,
2]. Nevertheless, machines suffer from emergency faults or errors, which result in malfunctioning of the whole machine and, thus, economic loss [
3]. Moreover, the maintenance and operative costs increase due to the wide range of applications in EMs [
4]. These issues affect the machine’s life during the manufacturing process. Thus, to overcome these defects, a reliable system is developed to maintain the mechatronic system’s economic and operative cost [
5]. Motor Engine Factories (MEFs) are the suppliers and the transport parts are used for manufacturing purposes [
6]. Consequently, many parts are transferred to the manufacturing warehouse via one-time carton-box packing. Contemporary advancements in technology and manufacturing methods, such as additive manufacturing, require changes in the supply chain and logistics management [
7,
8]. Due to such products’ logistic nature, maintenance is critical and results in greater PB operational costs [
9]. Hence, it is necessary to locate PB’s pooling centers and management in such scenarios, and this requires a strong transportation and distribution system [
10].
Many studies explored engine and automobile parts, but they only covered the transportation and allocation of reusable containers. These were then examined using the pooling functionalities of the routing process [
11]. Earlier methods have concentrated on location, vendor managing services, vehicle routing, and algorithm optimization [
12]. High combustion methods can meet the prerequisites, but they have a negative impact, mainly harmful emissions of pollutants such as greenhouse gases (GHG) [
13]. After-treatment systems (ATS) have recently become the most complex issue in pooling management and transportation systems. The system’s efficiency is affected due to the complexity of the low system control [
14]. The emission level cannot be predicted or determined by varying the engine characteristics. Therefore, the cost and size have become increasingly prominent concerns, and the engine struggles to perform as a result [
15].
In the past half-decade, machine learning-based methods have found applications in various fields, and they have been immensely involved in the pooling management of products [
16,
17,
18,
19]. The prime challenge of this method is estimating the optimal parameters that are labeled for training purposes. Also, evaluating the accuracy level is another concern, as higher accuracy will make the system more robust. It is also cumbersome to tackle the smaller as well as larger databases. Hence, such constraints are evaded by tuning the parameters in the classifier network using well-developed heuristic algorithms [
20]. The hybrid structure of EMs makes it hard to implement or utilize them in such applications. However, there have been many successes with mild-hybridized vehicles providing certain advances with less incorporation of pooling management. Some scholars have used fuzzy techniques to apply the model in decision-making, where it inspires less linguistic cost and a higher-quality service [
21]. A Genetic Algorithm (GA) has been developed to facilitate processes such as routing, location, and enhancement [
22]. In [
23], the researchers promote the latest vehicle classification and detection system for smart traffic monitoring with the support of a Convolutional Neural Network (CNN) to fragment aerial imagery. Another study presents an enhanced strategy for a Quantum Key Distribution (QKD) network structure and cost analysis [
24]. In particular, a new Hybridized-QKD-Network-Cost (HQNC) heuristic algorithm is implemented to resolve the cost optimization issue. A particular Supply Chain Network Design (SCND) called the two-stage supply chain network has been analyzed by researchers [
25]. It has been resolved by using an effective GA, and it is also utilized to reduce the optimization issue. In the analysis, pooling management can be difficult when considering the PBs and transportation of full and empty boxes. Thus, based on the pooling centers, the boxes are dispatched. To alleviate such issues, this paper suggests a new approach to pooling management and transport optimization of engine parts.
The objectives of this research paper as a solution to motor engine parts are pointed out below.
- ✓
To design an optimized approach for pooling management and transport optimization of the engine parts using a modified optimization algorithm that helps to locate the pooling centers effectively, allowing the suppliers to supply the products at the right time.
- ✓
To frame the novel modified gannet optimization algorithm (MGOA), which is inherited from the conventional gannet optimization algorithm (GOA), in which the gannets are assumed as the population to deliver the optimum results. This algorithm is developed by deriving a new formulation for delta parameters to obtain higher results in terms of parameters.
- ✓
To derive the objective function with the help of estimated optimized parameters, which are mainly used to reduce the transportation cost.
- ✓
To analyze the system’s efficiency using a cost function; to achieve this, it is compared with divergent algorithms. It also provides a performance evaluation of cost, time, and shortest path in the proposed work.
The upcoming steps of the work are given as follows. The literature works on the existing methodology of pooling management, and its problem description is stated in Module 2. Module 3 discusses the issue of locating the pooling centers. The enhanced MGOA is illustrated with a pseudo-code and flow chart in Module 4. Module 5 elucidates the model structure and objective function of the proposed work. Module 6 explains the simulation outcome and analysis of the model. Finally, the conclusions derived from the research, limitations, and future research directions are presented in Module 7.
2. Literature Review
This section presents the contemporary research on transport pooling management and optimization techniques.
2.1. Review of Existing References
2.1.1. Pooling Management and Transport Optimization-Based Approaches
Wang et al. [
26] have presented a novel system of logistic objectives with which to manage the PBs in the pooling center, including loading of the empty and full PBs. The programming system has been deployed to locate and transport the PBs, where they reduced the costs of transportation and logistics. Hence, the performance was evaluated and measured based on such parameters to illustrate the efficiency of managing the pooling centers.
Trzynadlowski et al. [
27] have explored the Pulse Width Modulation (PWM) methodology for alternating current (AC) drivers to manage the modulation techniques, which were then characterized by a small pool of frequency. The smaller dimension of the pool helped to drive the subsystem with a sampling interval. Then, the efficacy was examined based on the optimal chosen pool frequency. On the contrary, the novel method has achieved a higher performance.
2.1.2. Pooling Management and Transport Optimization-Based Approaches Using Deep Structured Architectures
Chen et al. [
28] have implemented a deep learning approach to detect the faults in EMs based on different scenarios. It has been processed in two phases to extract the EM-related features; thus, the 2D convolution network was employed. Similarly, the Long Short-Term Memory (LSTM) retrieved the fault features. Secondly, Capsule Network (Caps-Net) has been deployed as a routing algorithm for forecasting faults, enhancing the generalization ability. The experimental outcome has illustrated that it has achieved superior performance in terms of accuracy using public data corpora. Based on the accuracy level, the type and size of EM have been altered efficiently.
Senras et al. [
29] have computed the necessary automated Guided Vehicles (AGVs) number for each AGV. Here, mathematical-solution-aided mixed-integer programming was implemented to determine an accurate solution. The effectiveness of the network constraint change on the AGV number was examined using Multiple Linear Regression (MLR), the Response Surface Method (RSM), and Artificial Neural Network (ANN) techniques. Thus, the outcomes have shown that the offered approach effectively predicts the cause of changes in system variables.
2.1.3. Operation Cost in the Engine Parts Industry with Pooling Management and Transport Optimization Approaches
Mohan and Badra [
30] introduced a machine-learning model aimed at improving the efficiency of internal combustion engines. Their enhanced approach incorporates the Super Learner, a method that leverages stacked learners, optimization techniques, and active learning. To optimize the model, they employed an elitist-based genetic algorithm (GA) to fine-tune the parameters for maximum performance. The dataset used in their study had nine features representing engine control constraints and five attributes indicating performance metrics. The cost function was transformed into a single objective aimed at enhancing model performance. To assess their model’s performance, simulations were conducted and evaluated using a merit value. A higher merit value was indicative of optimal values, contributing to improved pooling management.
García et al. [
31] have framed the adaptive Rule-Based Control (RBC) and Equivalent Minimization Control Strategy (ECMS), which acted as an online controller, to optimize the dimension of the power train. They investigated various factors, including the power split device gear ratio, maximum power in electric machines, control parameters, and battery energy content. To develop the optimization function, they took into account both fuel consumption and emissions. As a result, their model yielded improved performance outcomes. Additionally, it demonstrated a reduction in both operation and maintenance costs, further emphasizing its effectiveness.
Zhang et al. [
32] introduced an augmented reality (AR)-based model designed for aero-engine blade code recognition. This method significantly improves the automated recognition of blades during storage and selection processes. Initially, Optical Character Recognition (OCR) was used to capture and retrieve character features. Subsequently, the Bayes error model was employed to fuse the noise channel and achieve the desired value. In the final stage, the AR model computed and analyzed the performance. The proposed method has provided promising results in pool management and PBs transportation.
Moghaddam et al. [
33] have developed a novel multi-level-based application framework with virtual cluster policies. The framework also incorporates mapping features that are integrated with the cluster and match-maker engine to mitigate the impact of insignificant features. This resulted in a model that has not only yielded better results but has also implemented them in a range of applications, including policy definition and mapping procedures.
2.1.4. Pooling Management and Transport Optimization-Based Approaches Using Heuristic Algorithms
Yun et al. [
34] have demonstrated the Multiple Population Genetic Algorithm (MPGA) and Design of Experiment (DOE) for AVL-FIRE application. At the initial stage, the injection and ignition timing were considered for the hydrogen engines, which were also used to experiment with the optimal intervals. Further, the regression function has been employed to indicate hydrogen engines’ power and thermal emission. Finally, the optimum objective has been rectified using the MPGA approach. Unlike the existing GA, the proposed algorithm increased the convergence speed and maximized the convergence accuracy. Hence, the injection timing increased from 0.6 to 1.1%, and the ignition timing reduced from 29.1 to 17.8%, respectively.
Thiruvel et al. [
35] have developed an active power rescheduling of generators that used the Firefly Algorithm (FFA). It was utilized to investigate the congestion. Thus, the evaluation of the designed approach proved that it has improved the network’s performance.
2.2. Problem Identification
The existing literature on pooling management and transport optimization in the engine parts industry has explored various methods and approaches. Still, there is a notable research gap concerning the application of advanced optimization algorithms to address the limitations of current approaches. Specifically, there needs to be more research on utilizing the MGOA to determine optimal pooling center locations and optimize the transportation of packing boxes (PBs) to reduce system operation costs effectively. This research gap presents an opportunity to investigate the potential benefits and efficiency of MGOA compared to traditional solution methodologies, providing valuable insights for enhancing industrial spare parts management and cost optimization processes.
Some of the features and challenges in conventional pooling management and transport optimization over engine parts are listed in
Table 1. The logistics system technique can minimize the transport cost and the packaging for the motor engine factories [
26]. It has also helped construct the green logistics model. However, there needs to be more environmental protection. The space vector PWM technique has provided the most relevant numerical values for determining spectral quality [
27]. It is regarded as the easiest method to compute and maximize. There needs to be a pool of switching frequencies that degrade the model’s performance. Deep-learning-based multi-fault detection methodology can retain the most significant features of electric motors and enhance the accuracy level [
28]. An experimental motor platform needs to be constructed in this model. This model’s automated machine learning-based optimization framework computational training time is better when assimilated over other models [
30]. It has also been utilized to optimize the merit values closer to that of a global optimum. The dataset used in this model is randomly sampled, which may affect the process. The ensemble model has shown a better accuracy rate and usefulness in improving the performance of the given model [
31]. It is also used to minimize the generalization error. It is too expensive in terms of both space and time. The AR model has minimized the cost of fuel, and it also can make the model more intricate [
32]. However, this model has expensive complications during its implementation process. As for the policy definition framework described by [
33], it is worth noting that the model has neglected the unwanted mapping process. It is utilized to prove the reliability and efficiency of the given model. The multi-level policy application for managing the virtual clustering process is limited in this model. The MPGA method has the potential to optimize the continuous as well as discrete functions. It is considered to be the most straightforward process for implementation [
34]. However, this model requires more processing time, which affects the entire performance. All these issues help to motivate the search for effective methods to manage the engine parts.
3. Pooling Management and Transport Optimization for Mechanical Engines Parts
This section explains the problem of pooling management and transportation of mechanical engine parts.
3.1. Problem of Pooling Management and Transport Optimization
The pooling management and transport optimization monitor the mechanical engine parts. The MEFs are the fundamental purchasing parts that need to be supplied and transported to the factories. Conversely, the multiple parts are to be delivered or supplied from or to the factory warehouse; therefore, the parts are packed in carton boxes, termed PBs. This process is also named as a logistic system, which transfers the engine parts from one place to another. However, it possesses specific challenges that affect the managing system. The downside criterion is a low ratio of truck loading, high packing cost, and operation cost. Additionally, the occurrence of complex routes makes the management and transportation system complex. The challenging issues of pooling management and transportation are listed below.
- ❖
Suppliers are grappling with inbound logistics issues related to the procurement of PBs and their delivery. Maintaining cost efficiency in this process has proven to be a significant challenge.
- ❖
Trucks involved in the delivery process also encounter challenges such as a lower loading ratio and the need to navigate complex routes when transporting PBs, including machinery parts.
- ❖
It is also critical to handle the disposable, empty, and loaded PBs.
- ❖
In some systems, locating the pooling centers to manage the reusable boxes and transportation system is complex.
Considering the abovementioned problems, a new method of pooling management and transport optimization is proposed. The prime aim of this model is to reduce the cost of operation. Determining the objective function for providing the best results of transporting the PBs and locating the pooling centers is also helpful [
36,
37]. A novel meta-heuristic algorithm termed MGOA is proposed to achieve this. Finally, the validation of the system is performed via cost function analysis, which exhibits better performance than the conventional methodologies.
3.2. Problem Description
Various issues have arisen in recent years when developing or expanding pool management and transportation.
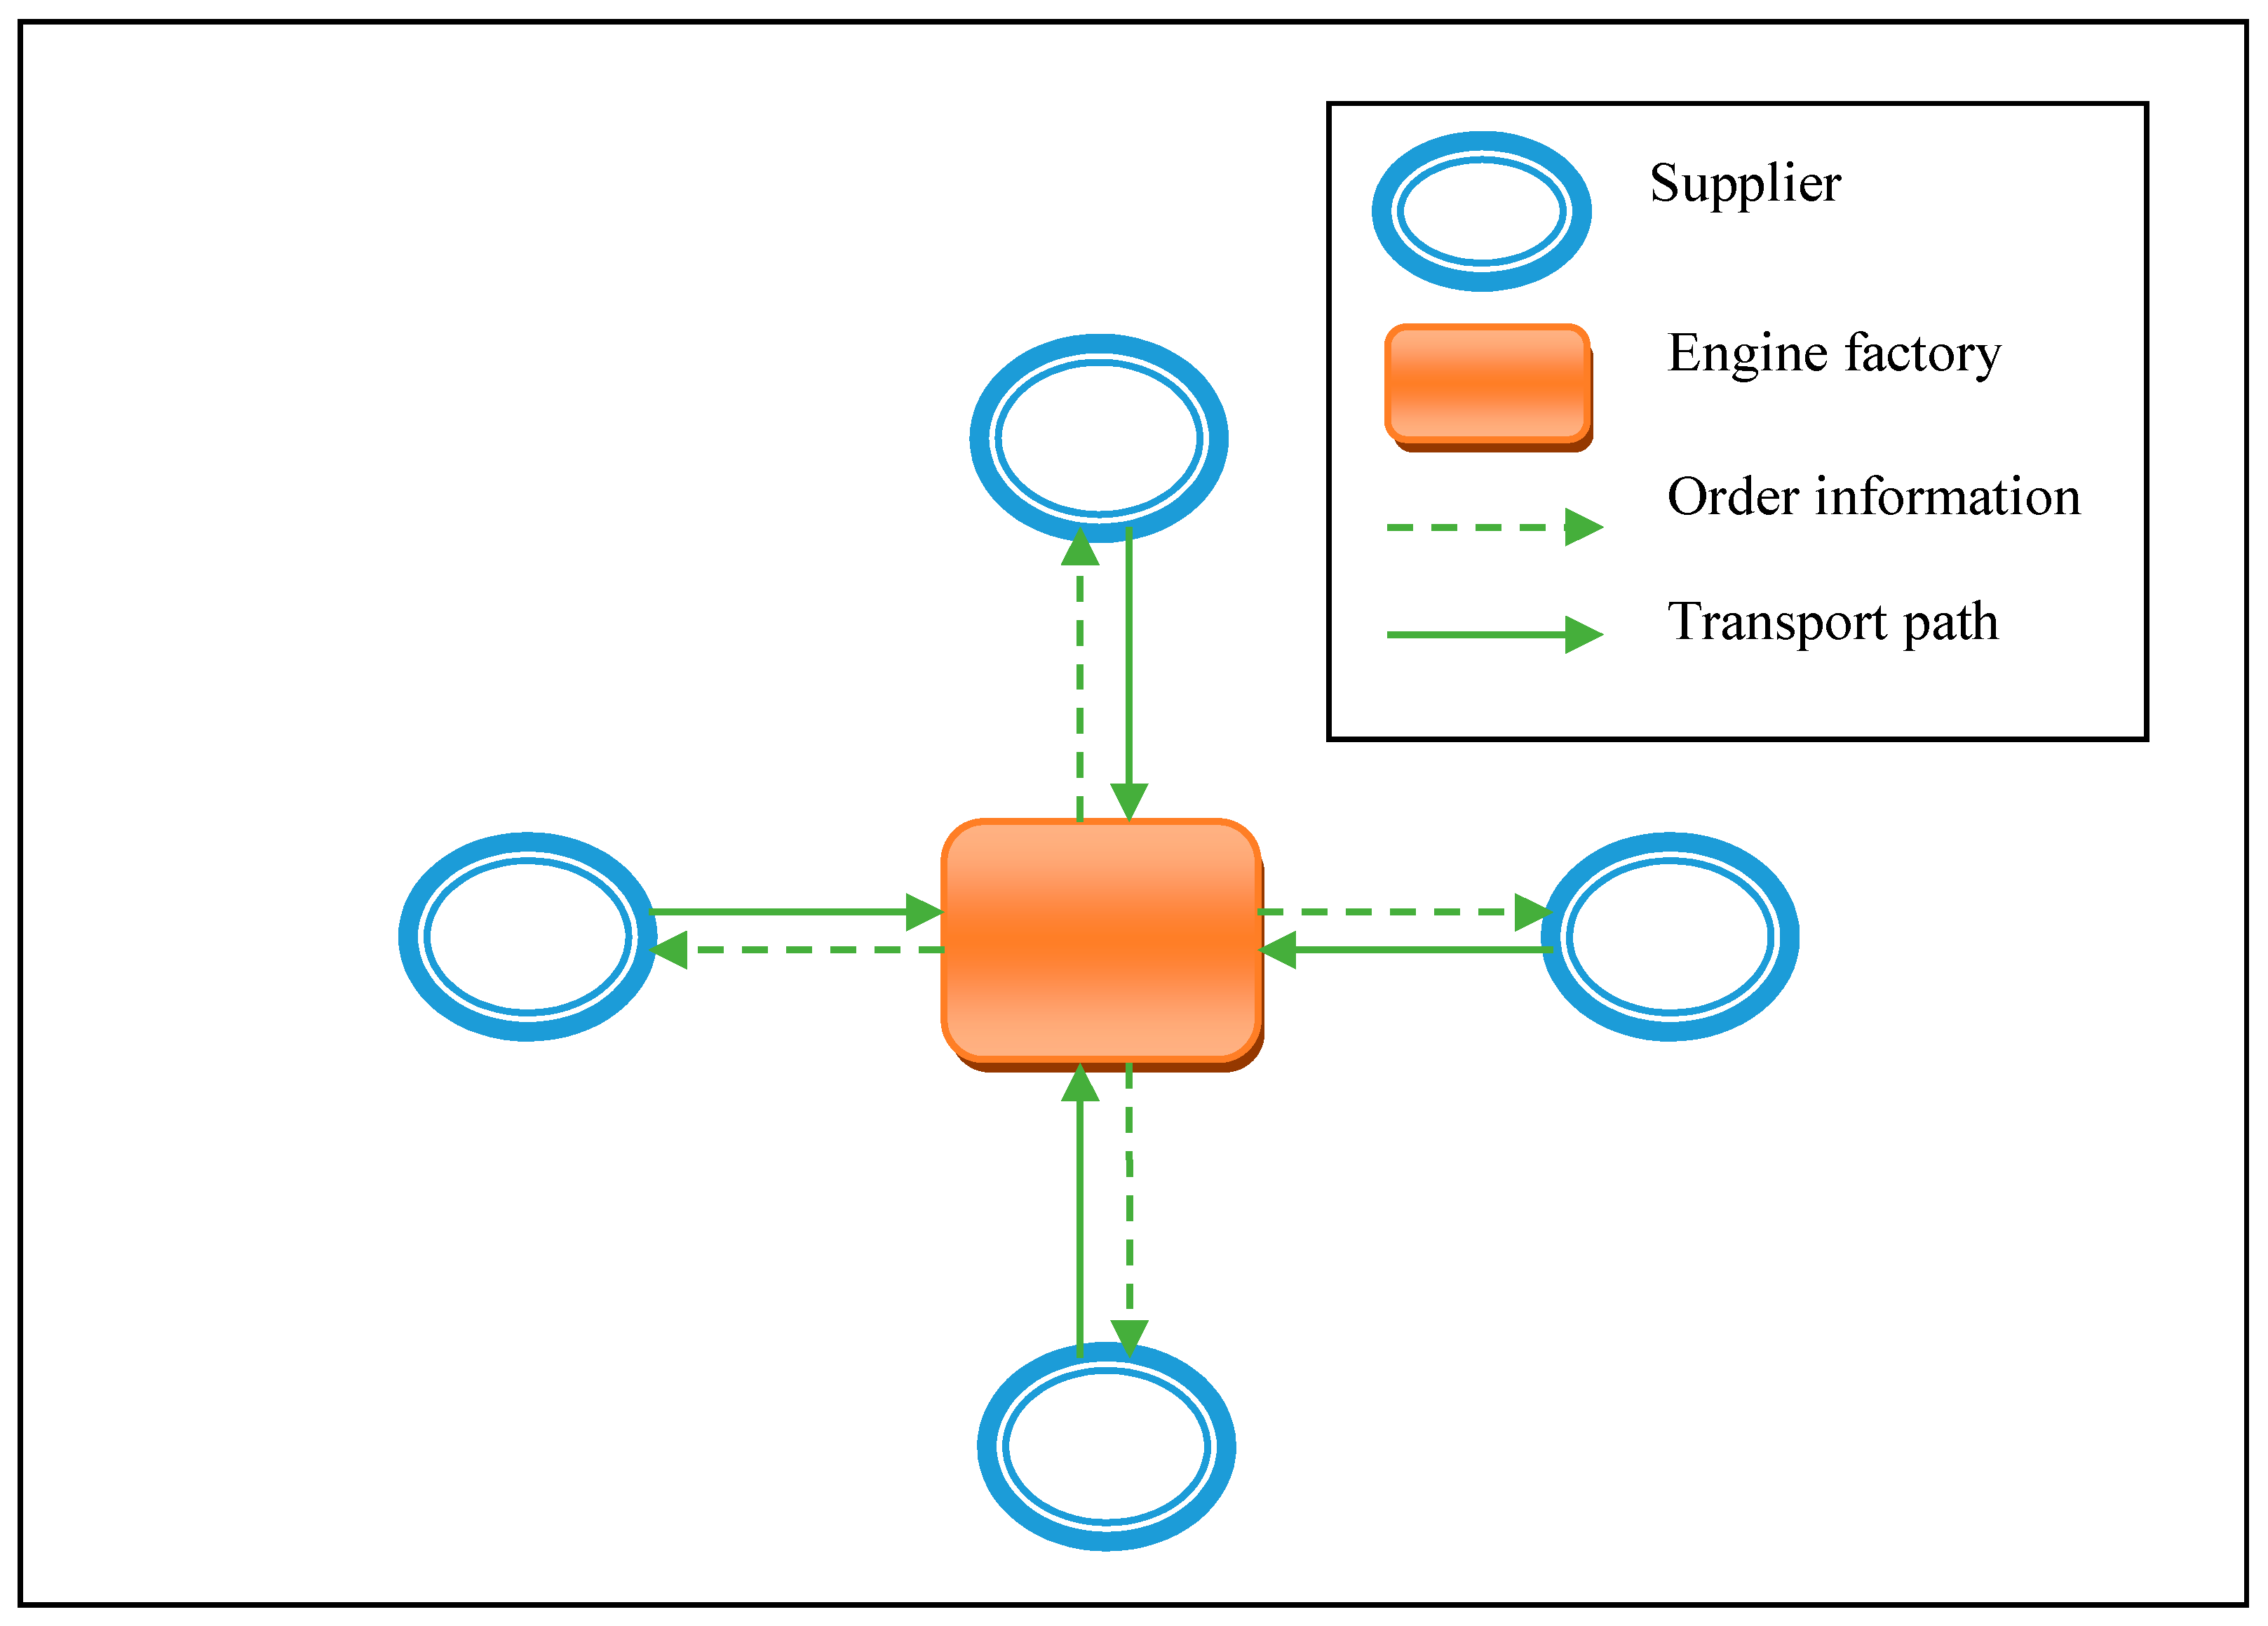
Figure 1 shows the logistic systems that deliver engine parts and pooling management.
Figure 1 represents the MEF and its hexagon parts as their suppliers. The dotted line signifies the orders’ information, whereas the single line seems to be the paths where transport takes place [
1]. Owing to the logistics process, it has the potential to manage the routing of transferring the parts from one place to another. However, it poses specific challenging issues that are pointed out below.
While supplying a vast number of parts at certain times, the trucks also come to the gate for queuing to unload the materials. This leads to higher shipping costs and traffic congestion.
Due to the above reasons, the truck’s loading ratio becomes low, leading to reduced demand.
The lesser demand transports the materials to the Third Logistic Party (TLP), which results in extra charges being applied to a Full Truck Load (FTL).
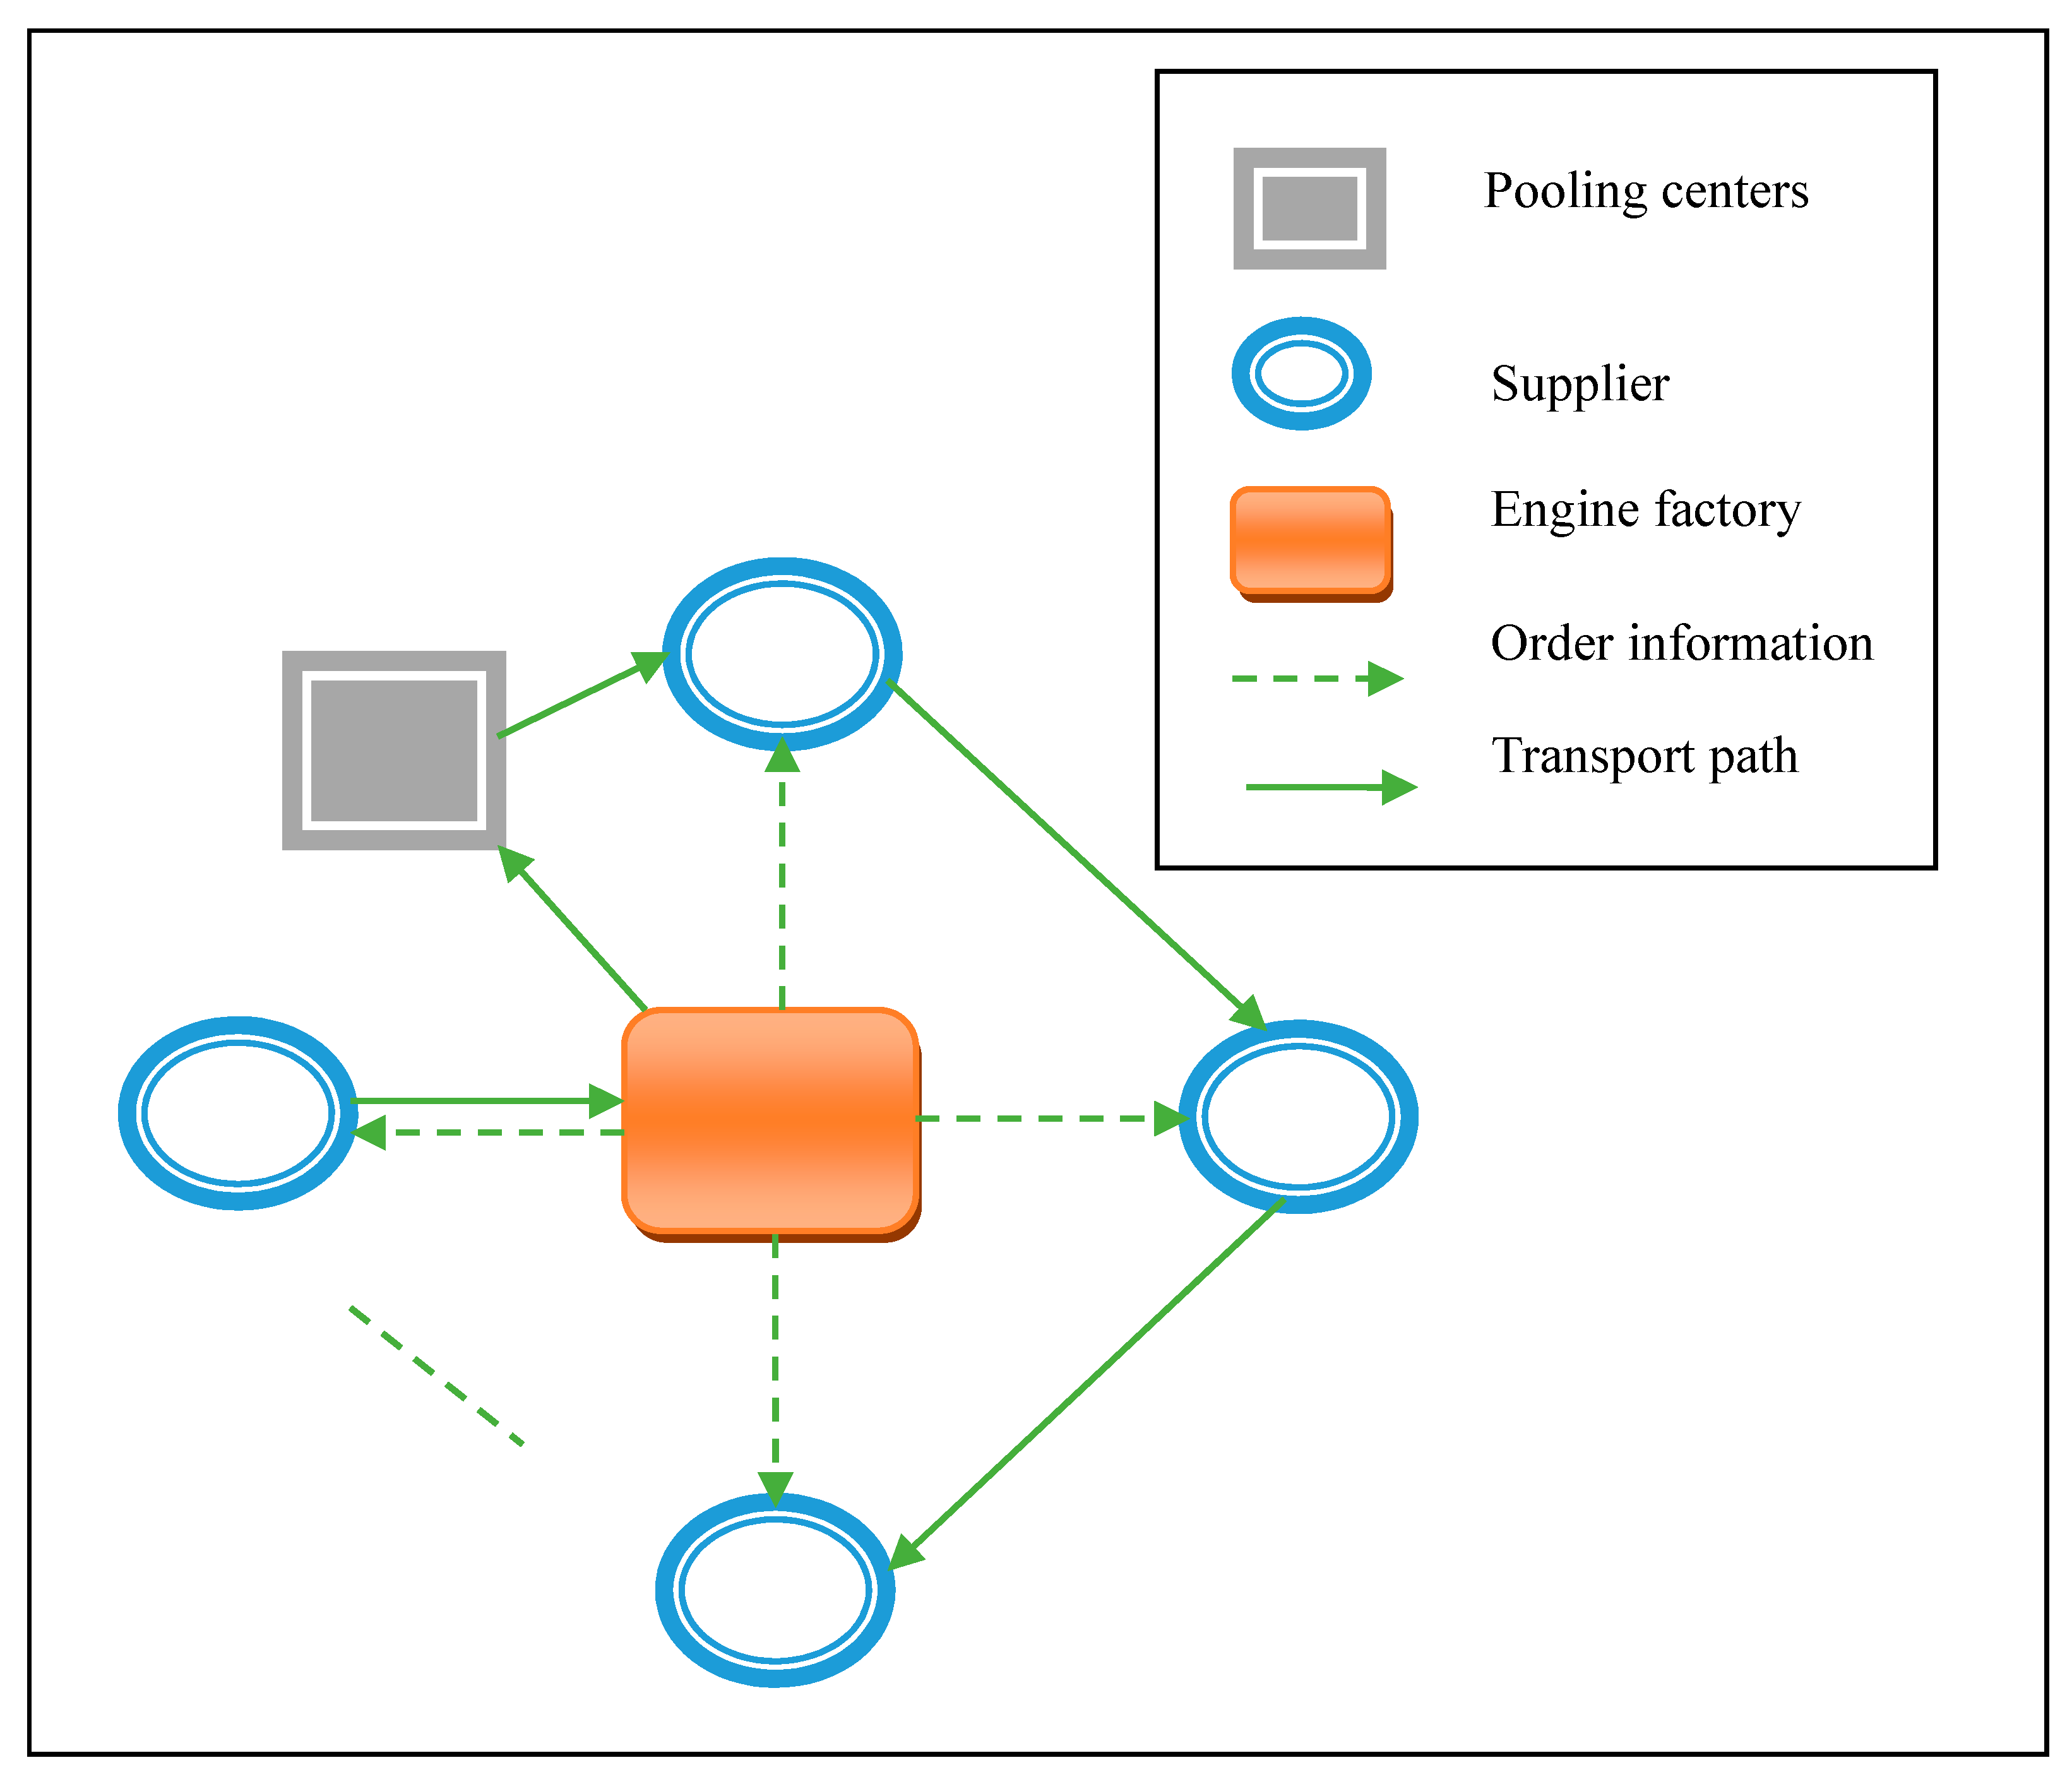
Similarly,
Figure 2 illustrates the process of the inbound logistics system, which comprises pooling centers, PBs, and delivery.
In general, pooling centers are used for storing and emptying the PBs. Further, the truck could carry the empty PBs to receive suppliers’ orders. For every supplier, empty PBs are required for the engine parts; thus, the truck provides the empty PBs and carries the loaded boxes. After delivering the boxes, the pooling center is responsible for managing and cleaning the returned PBs. It also faces the following issues:
Because of all these challenging issues, a new intelligent model is developed to manage the pooling and transportation of PBs.
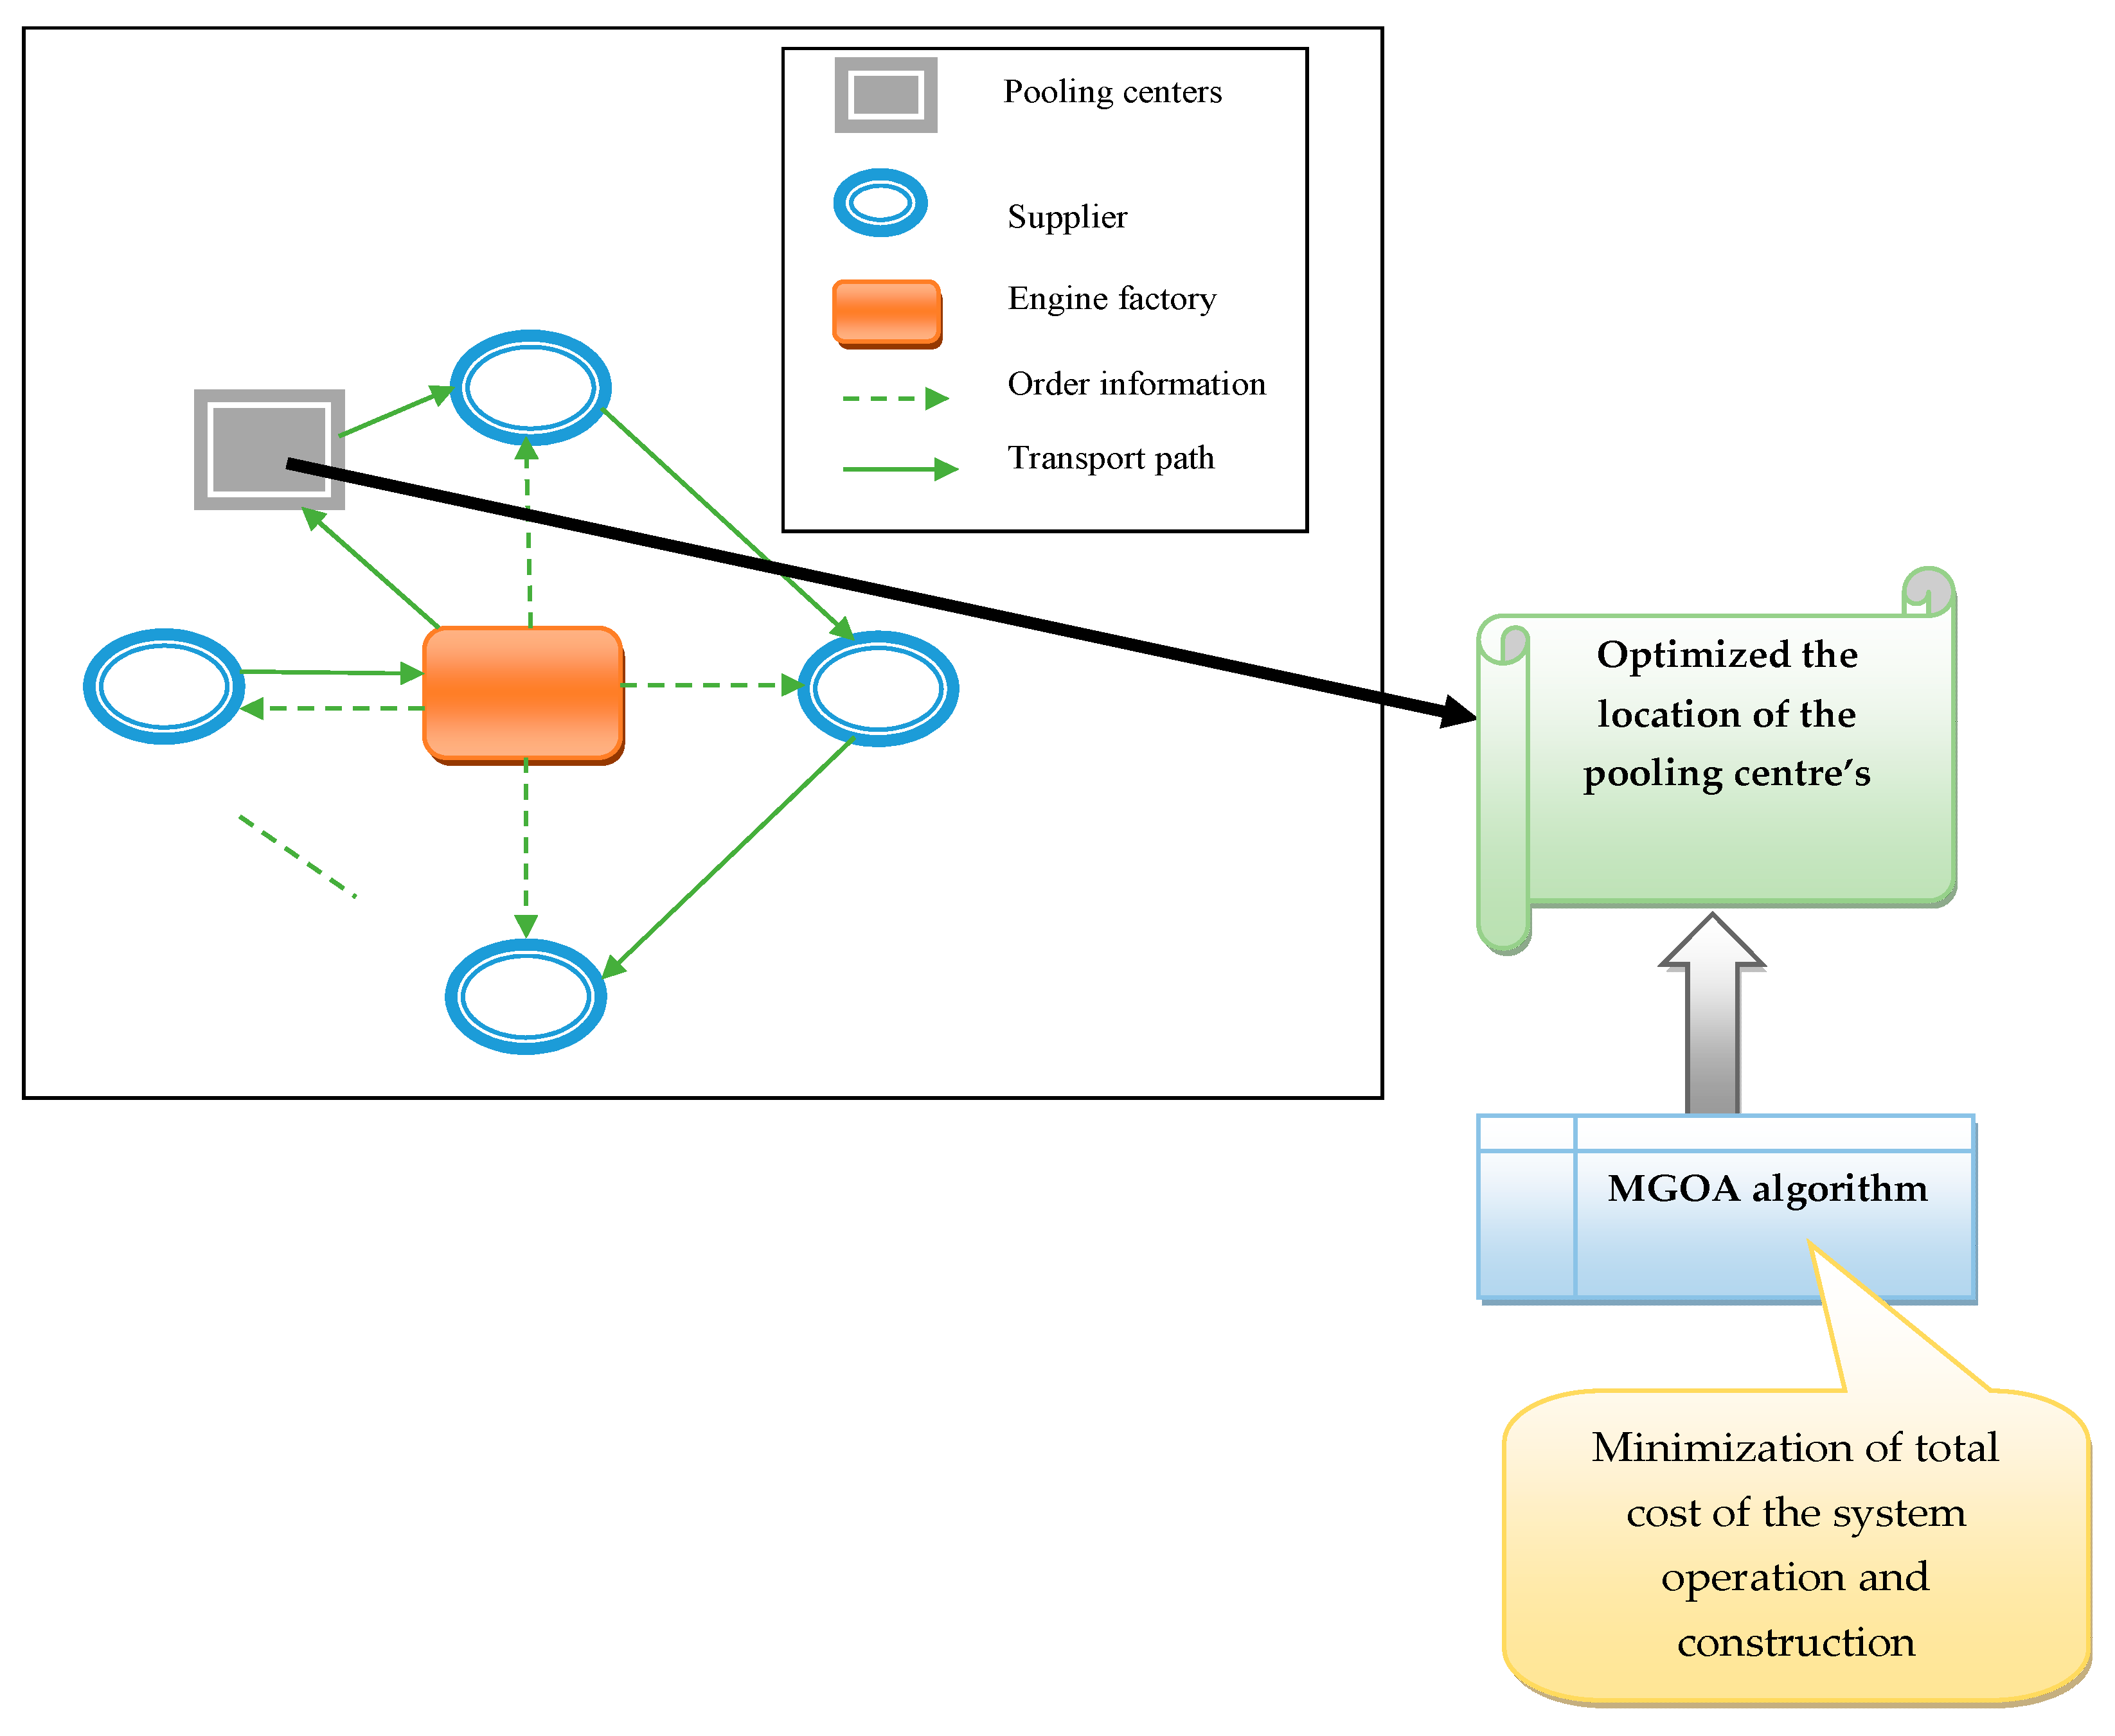
3.3. Proposed Methodology
The primary aim of this research work is to reduce the total cost of the system operation and construction and accurately position the pooling centers. Thus, it promotes the latest ideas for pooling management and transport optimization of the engine parts to resolve the critical issues presented by the existing approaches. Initially, the author introduced an MGOA with the fusion of the GOA algorithm. Here, the pooling centers are located with the support of the multi-objective function [
38,
39]. The pooling center is determined using the objective function. As a result, the system operation and construction costs are reduced with the aid of the MGOA algorithm and objective function. Finally, the simulation results have been conducted to find the shortest path and cost and time reduction.
Figure 3 illustrates the process of the inbound logistics system, with optimization process.
4. A Novel Optimization Algorithm for Pooling Management and Transport Optimization
This section explains the proposed solution methodology step by step. First, the existing GOA is explained, and then its modified version, which is developed and presented in this research work to optimize the pooling and transportation, is discussed in detail.
4.1. Gannet Optimization Algorithm
The GOA is a metaheuristic optimization technique inspired by the natural process of evolution. Mainly, it is motivated by the natural predating characteristics of gannets (one kind of bird) [
40]. It mimics the principles of genetic inheritance and survival of the fittest to iteratively evolve a population of solutions towards optimal or near-optimal solutions. Naturally, the optimization algorithm possesses two stages: exploration and exploitation. Here, the mechanism is accomplished in four phases: V-shaped dive mode, random wandering, U-shaped dive mode, and sudden rotation. The mathematical model of GOA is as follows.
Natural habits of gannet: The gannet looks fat, stubby, and with a slender neck. It lives in lakes or seashores and feeds on fish. Since it possesses sharp eyes, it can determine the whereabouts of prey even in flying conditions. The following stages will help us to obtain the best solution.
Stage 1—Initialization: A population of potential solutions, referred to as individuals, is randomly generated. Each individual represents a possible solution to the optimization problem. Here, the gannets are assumed to be the initial population, and it is randomly initialized with boundary values as shown in Equation (1).
Here, the position of the pth search agent of the qth dimension is marked by np,q. Then, the upper and lower boundary are denoted as upB and lwB, respectively. Finally, the random value lies between 0 and 1, as shown in d1.
In this process, the term YT specifies the memory matrix. Over the iteration, the position of gannets is changed, which is to be reflected in the memory matrix. Based on the fitness measurement, the matrix value is altered.
Stage 2—Exploration: During this process, the gannets search for prey on the water’s surface. After finding the prey, they can adjust their dive patterns based on the depth of the water. Naturally, there are two types of dives: U-shaped and V-shaped, as expressed in Equations (2) and (3).
In Equation (4), the terms
and
annotate the current iteration and maximum iteration count. Further, the random values lie between 0 and 1, as mentioned in
and
, respectively. With the help of these two dive criteria, the new position is updated and derived via Equation (5).
Terms
and
in Equation (6) are shown in the equation below as Equation (7).
In the above equation, the variables
and
are the random values between 0 and 1. The current search agent is identified by
, a random selection of population is signified by
, and the average position is marked by
, correspondingly. Here, the average position is computed using Equation (8).
Stage 3—Exploitation: After the search agents rush into the water’s surface, catching the prey requires even more energy. Hence, the gannets can exhibit tremendous energy when the fish tries to escape from the surface. The gannet has sufficient capacity for capturing when it has adequate energy. The new position is obtained by Equation (9) depending on the capturing strategy.
Here, the constant parameter is signified by
, which is fixed as 0.2. In the above equation, the term
is calculated according to the following equations.
Here, the random value contains the range from 0 to 1, as mentioned in
. Then, the mass and velocity of the gannet are noted as
and
, which are set to be 2.5 Kg and 1.5 m/s. Also, the term
is assessed using Equation (14).
Finally, the best value is obtained, and the pseudo-code of conventional GOA is given in Algorithm 1.
| Algorithm 1: GOA |
| Consider the input search agents and total iteration |
| Calculate memory matrix |
| Determine the fitness value |
| Start the while condition |
| | For every value in the memory matrix
|
| | Upgrade the position of the gannet by Equation (5)
Else |
| | Upgrade the position of the gannet by Equation (5) |
| | End if
Revise the gannet position via Equation (9)
Else |
| | Revise the gannet position via Equation (9) |
| Stop while condition |
| Returns the optimum value |
4.2. Modified Gannet Optimization Algorithm
This research extends and modifies the GOA methodology to address the specific challenges of placing pooling centers and optimizing transportation in the engine parts industry. The modifications include incorporating additional parameters, adjusting the selection process, and refining the genetic operations to suit our problem’s characteristics better. By providing a detailed explanation of the GOA methodology, we aim to enhance readers’ understanding of the underlying optimization approach that forms the basis of our proposed Modified Gannet Optimization Algorithm (MGOA). The newly developed MGOA is employed to find the optimum value that enhances the performance. The MGOA is inherited by the conventional GOA method by formulating a new equation. The GOA exhibits specific critical points such as a higher convergence rate, resolves the local optima issue, and has good processing capability. Yet, it needs to be improved, as using a more significant number of parameters tends to create more complexity when providing the solution. Hence, it suffers from the parameter setting and its adaptation, which are mainly affected by deriving the delta parameter as expressed in Equation (9). To overcome such issues, Equation (9) is replaced by the new formulation, as shown in Equation (16). This is to be accomplished by proposing the new algorithm as MGOA. Therefore, the new mathematical expression in MGOA is as shown from Equation (16) to Equation (19).
In the above equation, the terms
and
are estimated as follows.
The term
annotates the total number of populations that are considered. Hence, the new delta value is used in Equation (9) to obtain the best results. The pseudo-code of the suggested MGOA is illustrated in Algorithm 2.
| Algorithm 2: Modified GOA |
| Consider the input search agents and total iteration |
| Calculate memory matrix |
| Determine the fitness value |
| Start the while condition |
| | For every value in the memory matrix
|
| | Upgrade the position of the gannet by Equation (5)
Else |
| | Upgrade the position of the gannet by Equation (5) |
| | End if
is newly formulated using Equations (16)–(19)
Revise the gannet position via Equation (9)
Else |
| | Revise the gannet position via Equation (9) |
| Stop while condition |
| Returns the optimum value |
The flow chart representation of the suggested MGOA is illustrated in
Figure 4.
5. Model Structure and Objective Function for Pooling Management and Transport Optimization
This section discusses the mathematical formulation of the pooling and transport optimization problem.
5.1. Definition of Variables with Decision Variables
To structure the model, the distinct variables are defined to manage the transportation and locate the pooling centers [
26]. With the help of these variables, pooling management is implemented effectively. Let us consider the number of suppliers as
, where
. Then, the total pooling centers are taken as
, and the feasible circles are identified by
. Further, the set of nodes and MEFs are marked by
and
, respectively. The trucks are mainly used to carry the engine parts from one place to another; this is identified by
, and the links are helped to represent the route where suppliers can supply the materials. Hence, the link is signified by
. Subsequently, the transport demand from node
to node
is marked by
. The set of links is represented by
. While managing all the supplying and pooling systems, the cost function is an essential consideration when determining the amount of consumption, and it is represented by
. The prime objective of this proposed model is reducing the cost of pooling management and transportation. Hence, the construction and management costs of the pooling center are denoted by
and
, correspondingly. Consequently, the additional coefficient for construction cost is mentioned as
, whereas the additional coefficient for management cost is indicated by
.
As stated in
Figure 1 and
Figure 2, the link is used to exhibit the process of supplying the engine parts. Thus, if the link is marked by
which is present in the circle
that passes through node
to
, it is illustrated as
; otherwise, it becomes 0. Simultaneously, if
is involved, then
, otherwise, it is 0. The capacity of each truck is annotated as
Yt. The transportation cost is requisite while supplying the material or parts to another place. On noticing that, the transportation cost of empty as well as loaded PB is identified by
and
, respectively. Finally, the distance of the link is noticed by
and the pairs of origin and destination are denoted as
.
Decision variables: The variables presented below are the most important when it comes to managing and locating the pooling center to obtain the objective function. This function is mathematically modeled using Equations (20)–(22).
The number of loaded PBs are delivered by truck to MEF over the link as , which is termed as , whereas the empty PBs are defined by . Finally, the full PB is transported by the truck in the circle over the node, which is indicated as .
5.2. Define Objective Function
In order to define the objective function, different criteria are considered, which are described as follows.
When a supplier produces one type of part, such as with heavy material like iron, the capacity of the truck and PBs are not considered, whereas the weight limitation is also incurred. This has also included the travel speed and transport frequency of the truck. Here, the utilized PBs are provided and managed by the pooling center. In another scenario, the non-loaded PB does not transit from MEFs to the suppliers. The objective function is expressed through Equation (23) based on the above constraint.
The above equation is used to reduce the system’s total cost with regard to managing and localizing the pooling centers. The former part represents the construction and transportation cost, and the latter part demonstrates the transportation costs of both empty and fully loaded PBs. The weight capacity of the truck is given in Equation (24).
The balancing of the system is ensured via Equation (25).
The relationship between the full PBs and the flow of empty PB is determined in Equation (26).
The rest of the equation below is also used to derive the fitness function to reduce the cost of placing the pooling centers that supply the parts.
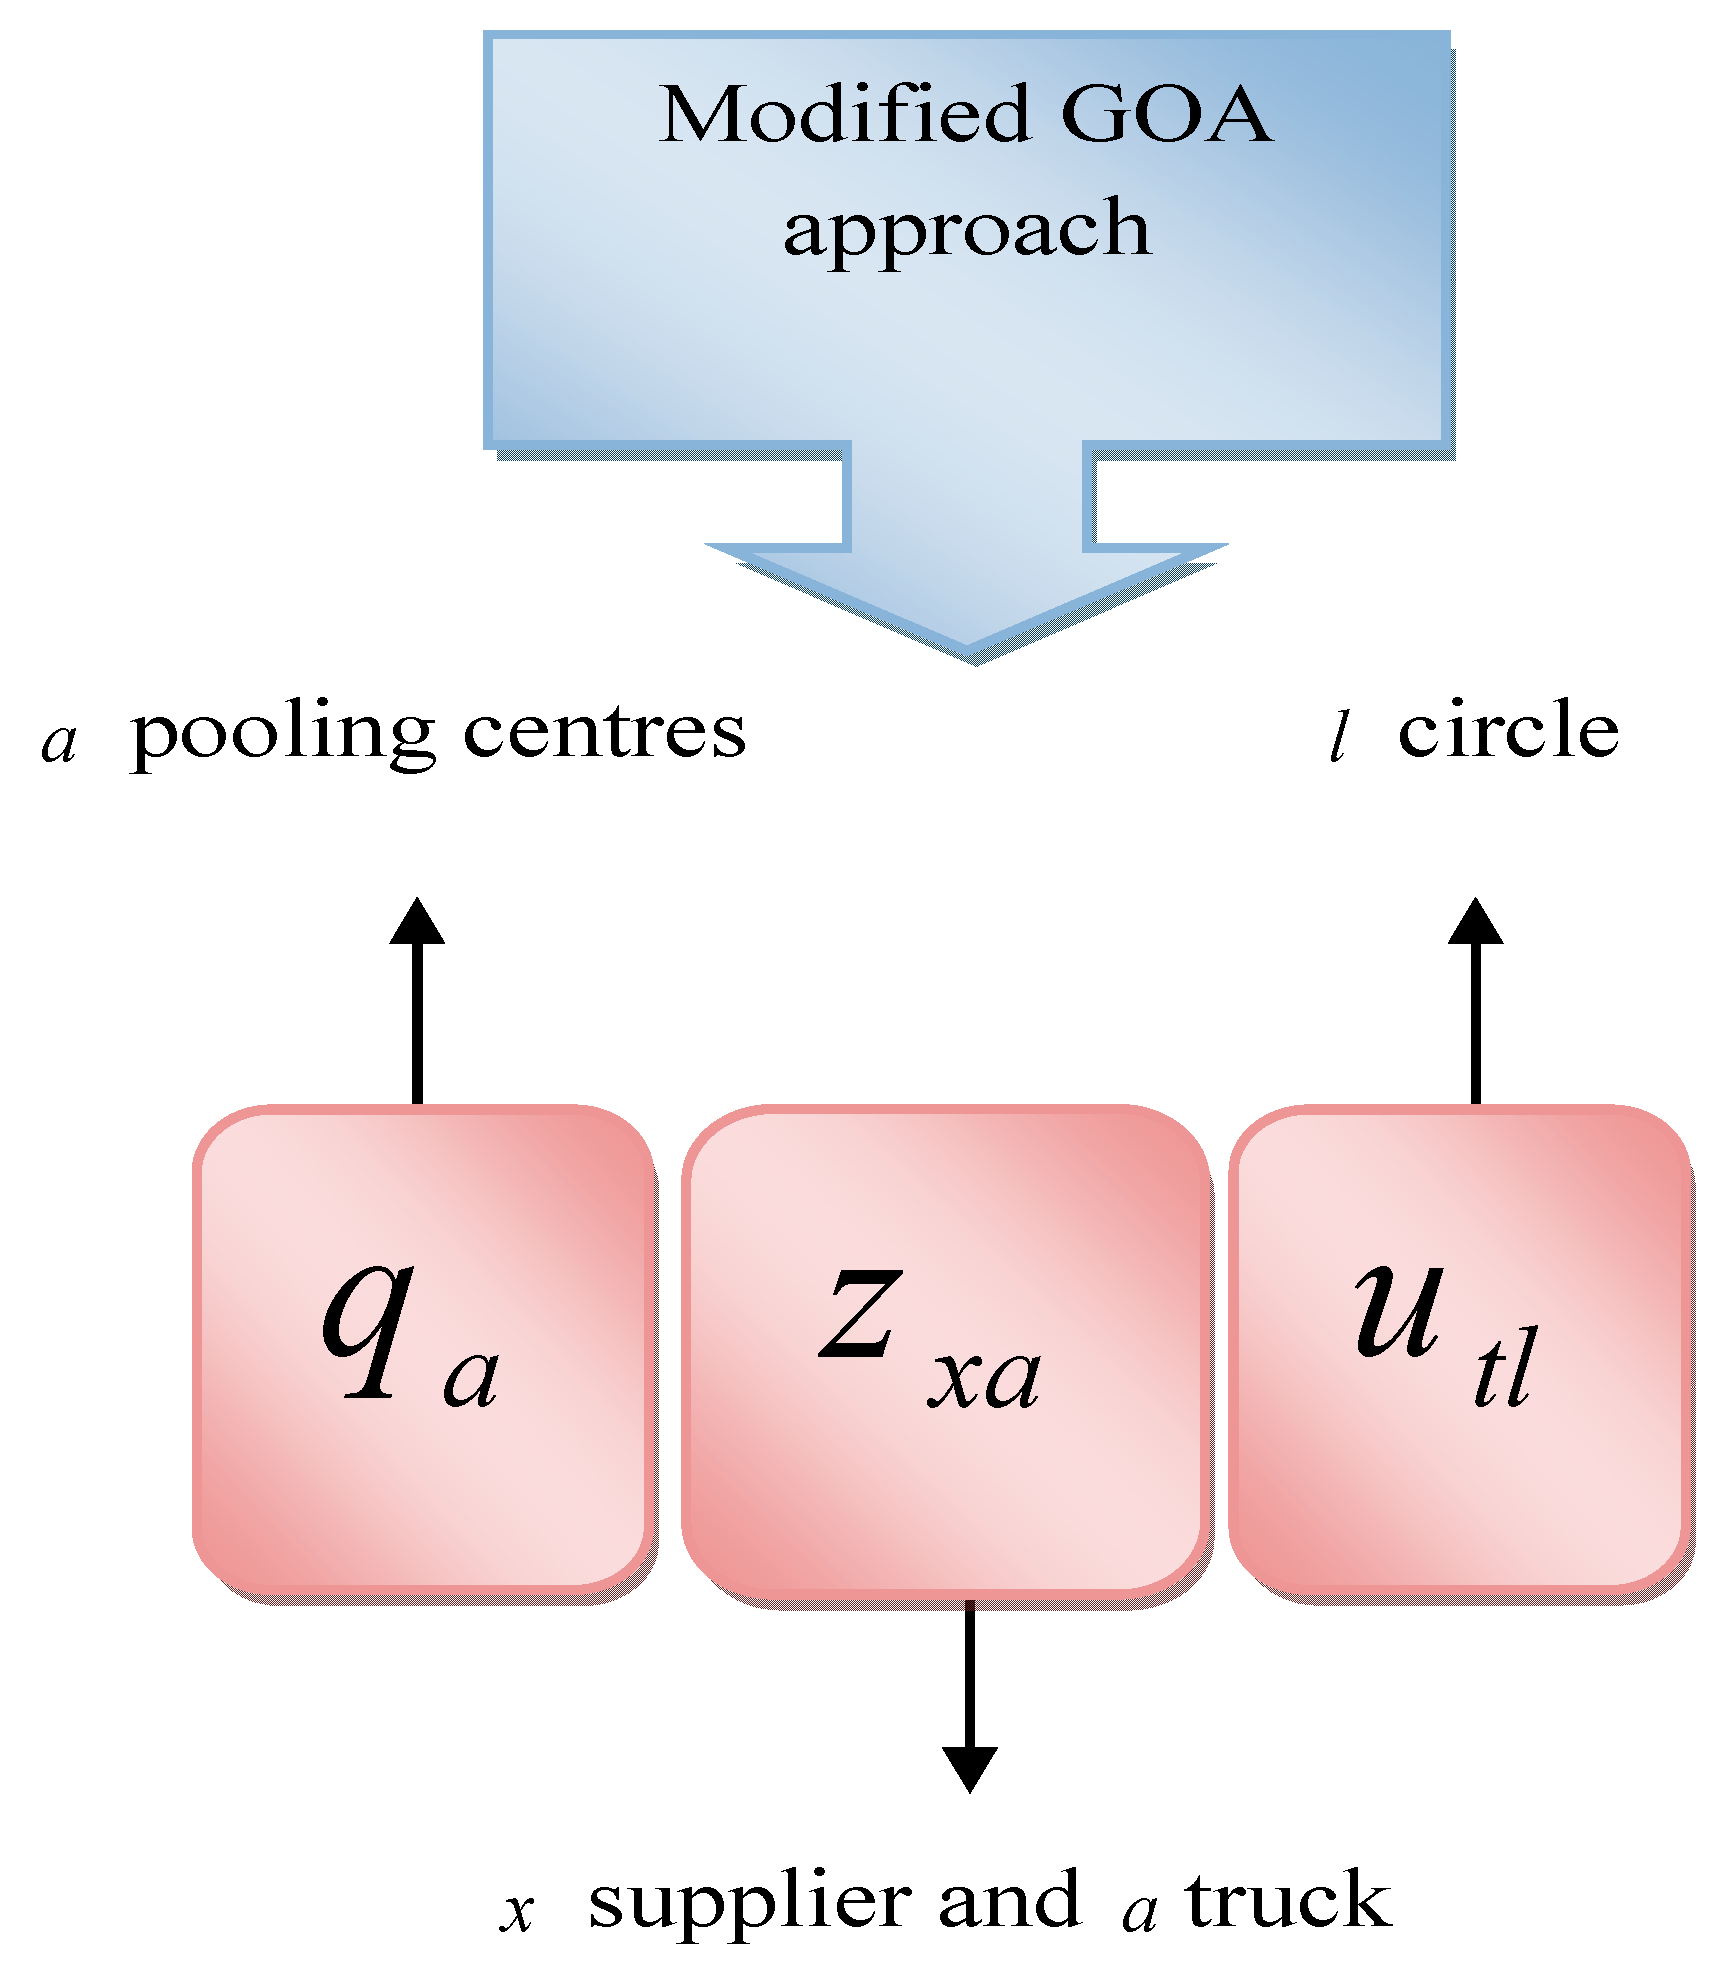
5.3. Solution Encoding
This section helps to describe how the solution is encoded to estimate the best optimum results. The parameters pooling center location, truck path or routing, and supplier allocation must be optimally selected using the proposed MGOA approach. These parameters are signified by
,
, and
, correspondingly. Owing to the tuned parameters, the system can reduce the transportation cost. The required parameters are given as input to the novel MGOA, which exploits the best results. Finally, based on certain conditions, it estimates the value as zero or one, as stated in Equations (20)–(22). The illustration of solution encoding to reduce the cost of the designed model is shown in
Figure 5.
5.4. Simulation Parameters
MATLAB 2020a (MathWorks, Massachusetts, USA) was employed to execute the proposed pooling management and transportation optimization, in which the results were carried out. Here, the suggested method used 10 populations and a total iteration count of 100. To ensure the efficacy of the model, traditional optimization algorithms were assimilated, including the Dingo Optimization Algorithm (DOA) [
41], Harris Hawks Optimizer (HHO) [
42], JAYA [
43], and GOA [
40]. The simulation parameters of the designed pooling management and transport optimization of the engine are shown in
Table 2.
6. Computations of Results
Here, the obtained results are explained and discussed.
6.1. Cost Function Analysis using the Proposed Method for Pooling Management and Transport Optimization
The cost function analysis of the recommended method by varying the iteration count is presented in
Figure 6. This evaluation helps us to determine the reduced cost function compared to other existing approaches.
Figure 6d elucidates the assessment when using the network size of 80. In this graph, iteration is taken as 20; the cost function of the proposed model is reduced in contrast with the higher value of 14% of DOA, 6% of HHO, 1% of JAYA, and 4% of GOA, correspondingly. Therefore, the suggested system provides the desired outcome for managing and locating the pooling centers.
6.2. Performance Analysis of the Proposed Method for Pooling Management and Transport Optimization
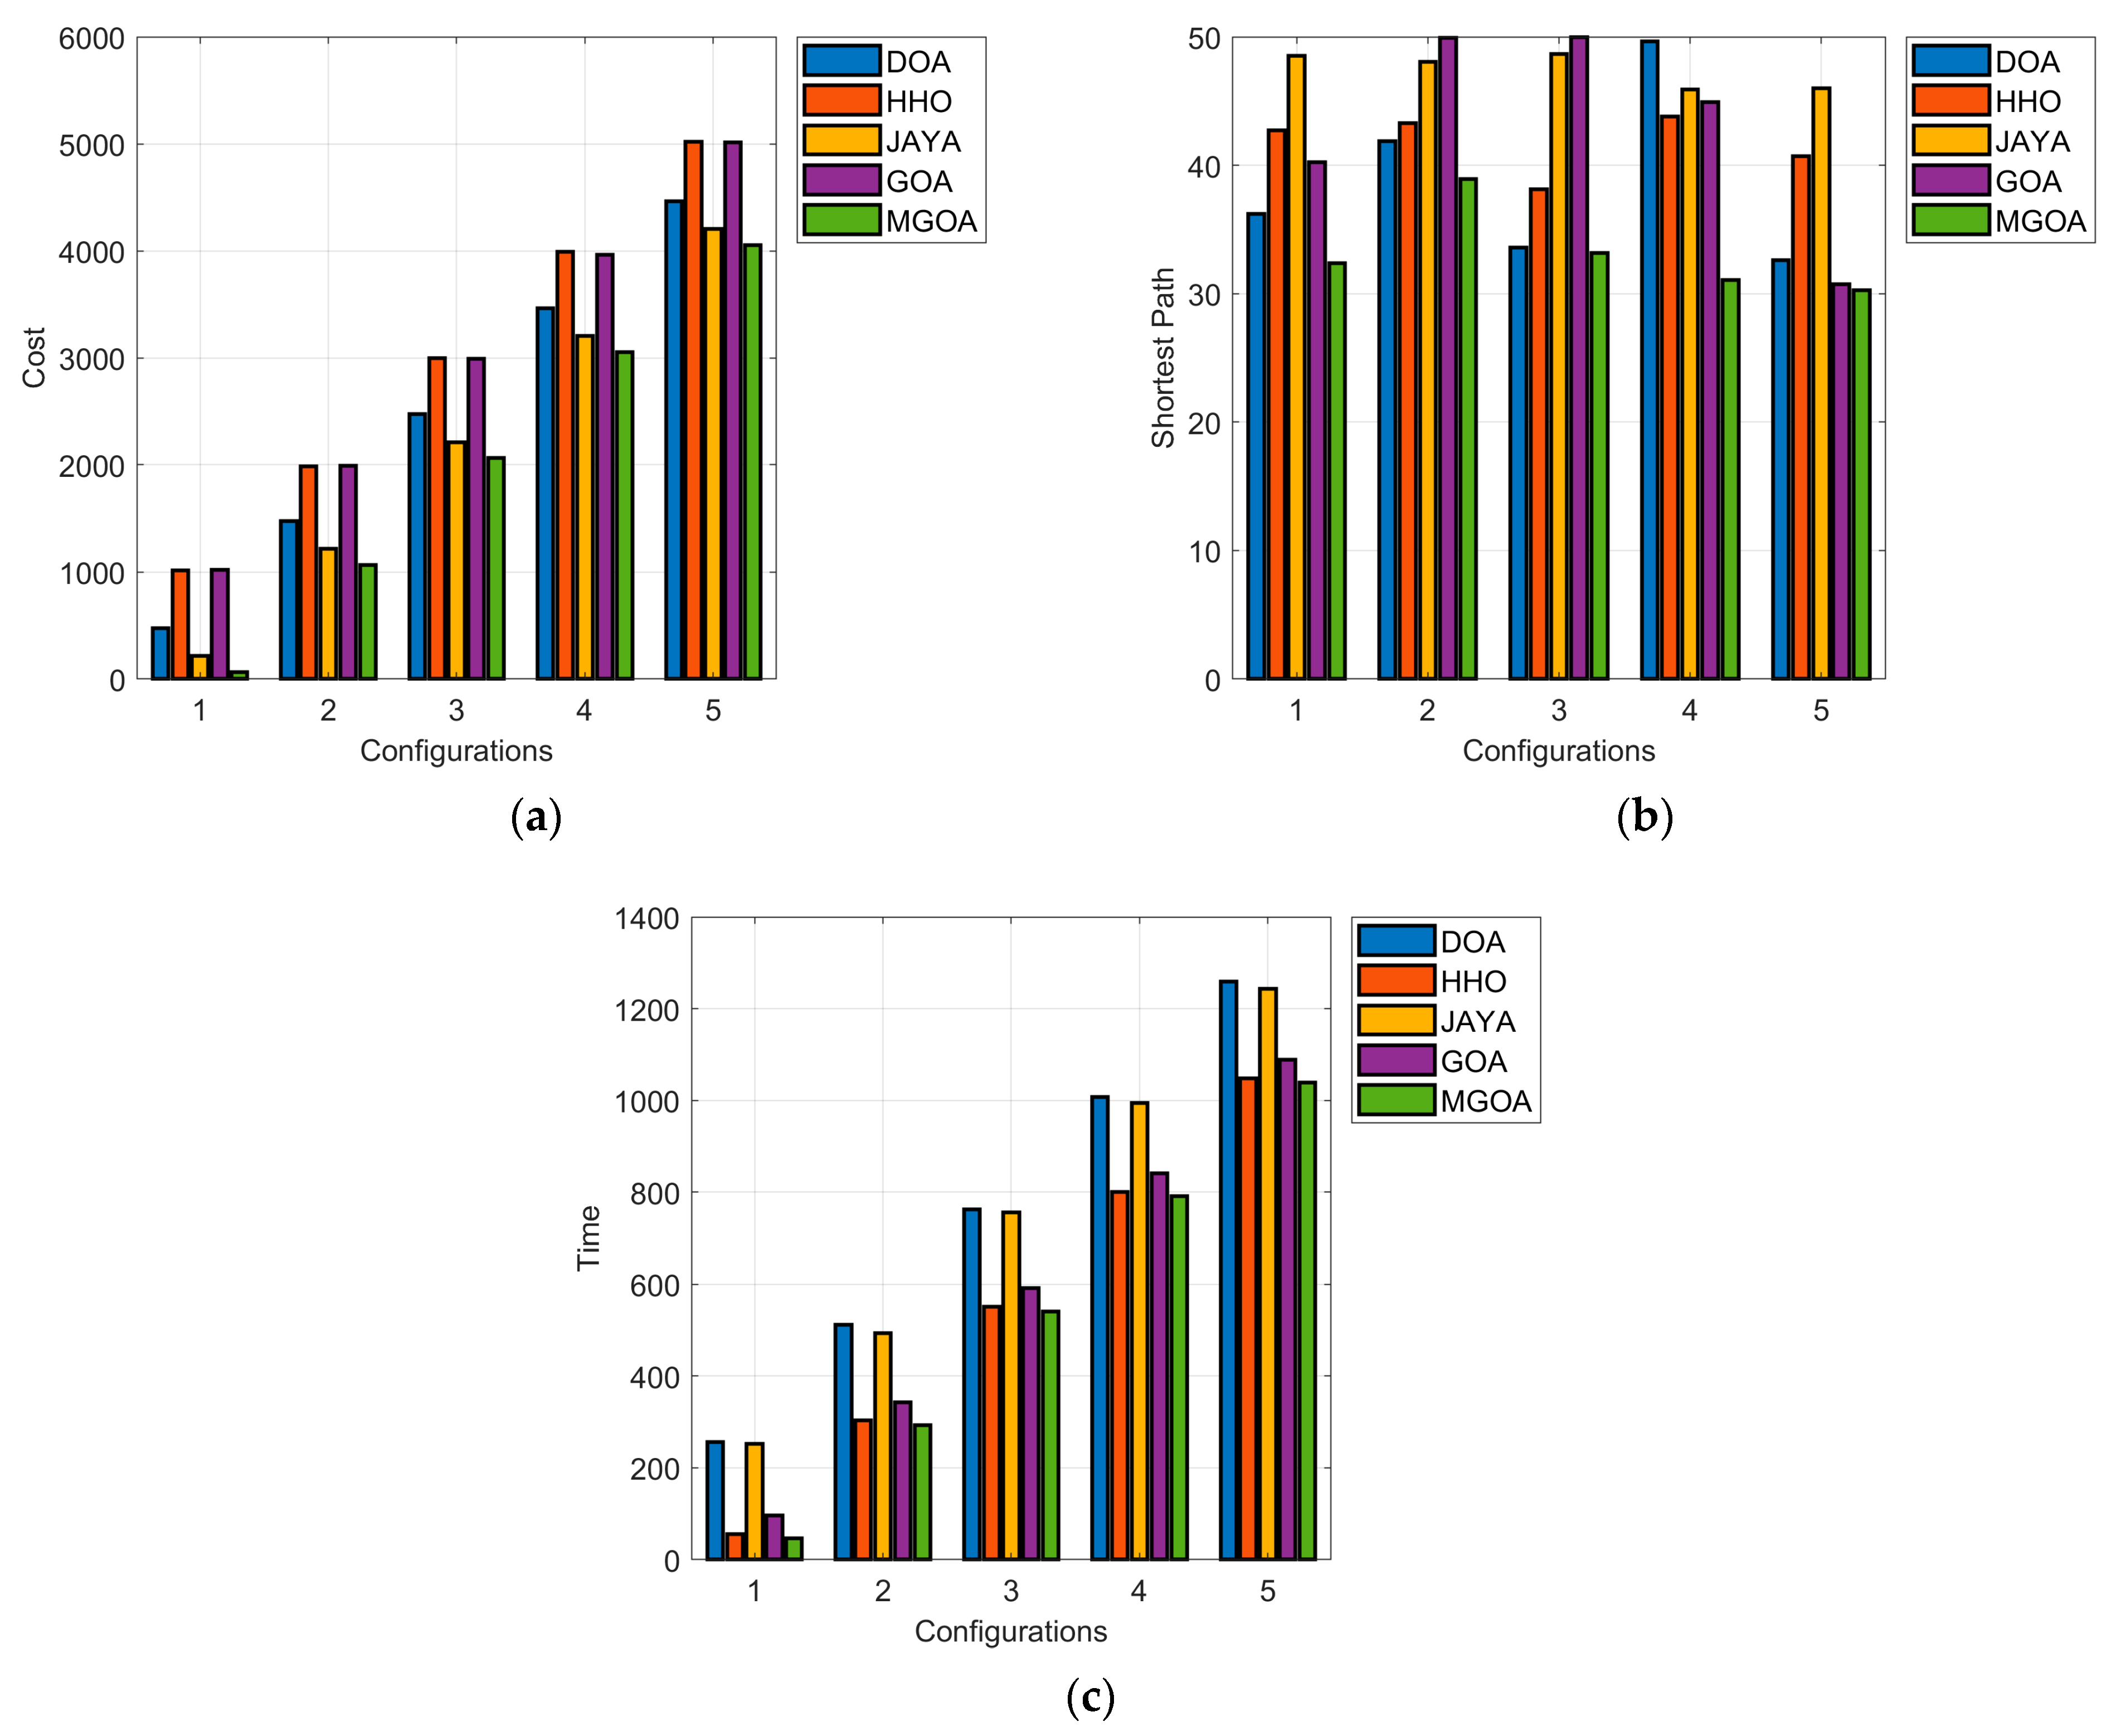
The cost evaluation of the method is demonstrated in
Figure 7 by varying the distinct configuration. The main objective of the model is to minimize the cost, path, and time required to transport the engine parts to the suppliers. Here, the configuration is nothing but the network dimension is 20, 40, 60, 80, and 100.
Figure 7c illustrates the time analysis of the model. While considering the configuration as 2, the time consumption of the enhanced method attains a value of less than 4%, 2%, 1%, and 0.6% of DOA, HHO, JAYA, and GOA, respectively. Thus, the method achieves the appropriate results to improve the performance.
6.3. Statistical Examination of the Proposed Method for Pooling Management and Transport Optimization
The statistical results of the novel approach are shown in
Table 3, which is compared with classical optimization algorithms. Here, the best, median, worst, mean, and standard deviation are assumed to determine the statistical reports. The table findings show that the proposed MGOA obtains the expected outcome over conventional algorithms like DOA, HHO, JAYA, and GOA. Hence, the model proves that it yields a better value in locating the pooling centers and helps minimize the cost.
6.4. Evaluation of Pooling Management and Transport Optimization Approach Using Recent Approaches
An evaluation comparing the recent approaches for the designed pooling management and transport optimization model in terms of the shortest path is shown in
Table 4.
7. Conclusions
In conclusion, this research introduces an innovative approach to optimizing the location of pooling facilities and reducing the operational and transportation costs within the engine components sector. The primary objectives of this study were twofold: first, to develop a novel strategy for placing pooling centers that enhances efficiency and minimizes costs, and second, to address the optimization challenge through the introduction of the MGOA. The research successfully achieves its objectives by systematically exploring the interplay between pooling center placement, transportation optimization, and cost reduction. The MGOA algorithm effectively identifies optimal pooling center locations that yield tangible cost savings and operational enhancements. In brief, this research contributes to the fields of optimization, supply chain management, and cost reduction by addressing the challenges of pooling center placement and transportation optimization.
Thus, the paper has presented a novel approach to placing the pooling centers and reducing costs. It has also considered certain variables and their definitions for locating the pooling centers. Using the proposed MGOA, the pooling centers are optimally located, and the parameters are optimized to resolve the problem of finding the shortest path. As a result, the objective function is formulated to reduce the cost of transportation. Finally, the model’s performance is evaluated and compared with some existing optimization algorithms.
On the contrary, the cost obtained using the proposed method is lower than 4.08%, 3.06%, 1.02%, and 3.06% of DOA, HHO, JAYA, and GOA, respectively. Therefore, the system’s effectiveness was assessed and provided impressive results. In conclusion, this research work has proposed an innovative approach to locating pooling facilities and cutting down operation and transportation costs in the engine components sector. MGOA is shown to be a practical algorithm for optimizing the location of pooling centers. The study’s findings demonstrate that the suggested method is more effective than the available techniques in the literature.
This work primarily focuses on using the MGOA to optimize engine part transport routes and pooling management. Our work’s key finding is that compared to conventional optimization algorithms, MGOA consistently finds optimized pooling center sites and more efficient routes, as evidenced by the significant reduction in the shortest route length. This achievement is paramount for industries reliant on timely and cost-effective delivery of components. Our approach offers potential cost savings, reduced resource consumption, and improved delivery efficiency by minimizing travel distances and streamlining logistical operations. Furthermore, this study contributes to the optimization and supply chain management literature by extending and modifying the GOA methodology to address the challenges of engine parts logistics. These refinements, driven by real-world industrial demands, showcase the adaptability and efficacy of our proposed approach. Overall, our research underscores the practical implications of employing MGOA for optimizing pooling center placement and transportation routes, with potential operational efficiency and cost reduction benefits.
The performance improvements of the given research work can be helpful in real-time applications like airline engineering and maintenance, logistics arrangement, and marketing after slight modifications based on the available data.
This research has some limitations. For instance, this research study only considers the cost of operation and shipping. However, in the real-world scenario, additional expenses such as the cost of goods, lost sales, and other miscellaneous costs must be considered. Moreover, scenarios such as traffic conditions of different routes, other difficulties on the routes, etc., are not considered, and they can affect the output results.
Future research directions can include the following:
Considering other costs, such as the cost of inventory and the cost of lost sales.
Extending the model to consider multiple pooling centers.
Developing a real-time implementation of the model.
Life cycle assessment (LCA) analysis of a given case study to show the environmental benefits.
Author Contributions
Conceptualization, M.A., M.H.A., H.S.B.O. and O.A.; methodology, M.A., M.H.A., H.S.B.O. and O.A.; formal analysis, M.A., M.H.A. and O.A.; resources, M.A. and M.H.A.; data curation, H.S.B.O. and M.H.A.; writing—original draft preparation, M.H.A., H.S.B.O. and O.A.; writing—review and editing, M.A. and M.H.A.; funding acquisition, M.A. All authors have read and agreed to the published version of the manuscript.
Funding
This research is funded by Researchers Supporting Project number (RSP2023R274), King Saud University, Riyadh, Saudi Arabia.
Institutional Review Board Statement
Not applicable.
Informed Consent Statement
Not applicable.
Data Availability Statement
All the data and their sources are available in the manuscript.
Acknowledgments
The authors would like to extend their sincere appreciation to the Researchers Supporting Project number (RSP2023R274), King Saud University, Riyadh, Saudi Arabia.
Conflicts of Interest
The authors declare no conflict of interest.
References
- Guerra-Gómez, R.; Ruiz-Boqué, S.; García-Lozano, M.; Bonafe, J.O. Machine learning adaptive computational capacity prediction for dynamic resource management in c-ran. IEEE Access 2020, 8, 89130–89142. [Google Scholar] [CrossRef]
- Ding, X.; Shan, J.; Jiang, S. A general approach to scalable buffer pool management. IEEE Trans. Parallel Distrib. Syst. 2016, 27, 2182–2195. [Google Scholar] [CrossRef]
- Al-Dulaimi, A.; Al-Rubaye, S.; Ni, Q. Energy efficiency using cloud management of lte networks employing fronthaul and virtualized baseband processing pool. IEEE Trans. Cloud Comput. 2019, 7, 403–414. [Google Scholar] [CrossRef]
- Wood, T.; Ramakrishnan, K.K.; Shenoy, P.; Merwe, J.V.d.; Hwang, J.; Liu, G.; Chaufournier, L. Cloudnet: Dynamic pooling of cloud resources by live wan migration of virtual machines. IEEE/ACM Trans. Netw. 2015, 23, 1568–1583. [Google Scholar] [CrossRef]
- Xiong, R.; Li, X.; Shi, J.; Wu, Z.; Jin, J. Hirepool: Optimizing resource reuse based on a hybrid resource pool in the cloud. IEEE Access 2018, 6, 74376–74388. [Google Scholar] [CrossRef]
- Pande, S.K.; Panda, S.K.; Das, S.; Alazab, M.; Sahoo, K.S.; Luhach, A.K.; Nayyar, A. A smart cloud service management algorithm for vehicular clouds. IEEE Trans. Intell. Transp. Syst. 2021, 22, 5329–5340. [Google Scholar] [CrossRef]
- Alkahtani, M.; Abidi, M.H. Supply chain in the era of additive manufacturing. In Proceedings of the International Conference on Industrial Engineering and Operations Management, Riyadh, Saudi Arabia, 26–28 November 2019; IEOM Society International: Riyadh, Saudi Arabia, 2019; pp. 502–507. [Google Scholar]
- Alkahtani, M.; Abidi, M.H. Supply chain 4.0: A shift in paradigm. In Proceedings of the International Conference on Industrial Engineering and Operations Management, Pilsen, Czech Republic, 23–26 July 2019; IEOM Society International: Pilsen, Czech Republic, 2019; pp. 1698–1705. [Google Scholar]
- Dey, N.S.; Gunasekhar, T. A comprehensive survey of load balancing strategies using hadoop queue scheduling and virtual machine migration. IEEE Access 2019, 7, 92259–92284. [Google Scholar] [CrossRef]
- Cui, B.; Wang, Z.; Feng, Q.; Ren, Y.; Sun, B.; Yang, D.; Qian, C. A heuristic hybrid optimization approach for spare parts and maintenance workers under partial pooling. IEEE Access 2019, 7, 137835–137847. [Google Scholar] [CrossRef]
- Lee, E.K.; Viswanathan, H.; Pompili, D. Proactive thermal-aware resource management in virtualized hpc cloud datacenters. IEEE Trans. Cloud Comput. 2017, 5, 234–248. [Google Scholar] [CrossRef]
- Yang, H.C.; Huang, C.H.; Adnan, M.; Hsu, C.H.; Lin, C.H.; Cheng, F.T. An online am quality estimation architecture from pool to layer. IEEE Trans. Autom. Sci. Eng. 2021, 18, 269–281. [Google Scholar] [CrossRef]
- Lizarribar, B.; Prieto, B.; Martinez-Iturralde, M.; Artetxe, G. Novel topology optimization method for weight reduction in electrical machines. IEEE Access 2022, 10, 67521–67531. [Google Scholar] [CrossRef]
- Golovanov, D.; Papini, L.; Gerada, D.; Xu, Z.; Gerada, C. Multidomain optimization of high-power-density pm electrical machines for system architecture selection. IEEE Trans. Ind. Electron. 2018, 65, 5302–5312. [Google Scholar] [CrossRef]
- Mao, T.; Mihăită, A.S.; Chen, F.; Vu, H.L. Boosted genetic algorithm using machine learning for traffic control optimization. IEEE Trans. Intell. Transp. Syst. 2022, 23, 7112–7141. [Google Scholar] [CrossRef]
- Abidi, M.H.; Mohammed, M.K.; Alkhalefah, H. Predictive maintenance planning for industry 4.0 using machine learning for sustainable manufacturing. Sustainability 2022, 14, 3387. [Google Scholar] [CrossRef]
- Abidi, M.H.; Umer, U.; Mohammed, M.K.; Aboudaif, M.K.; Alkhalefah, H. Automated maintenance data classification using recurrent neural network: Enhancement by spotted hyena-based whale optimization. Mathematics 2020, 8, 2008. [Google Scholar] [CrossRef]
- Abidi, M.H.; Alkhalefah, H.; Mohammed, M.K.; Umer, U.; Qudeiri, J.E.A. Optimal scheduling of flexible manufacturing system using improved lion-based hybrid machine learning approach. IEEE Access 2020, 8, 96088–96114. [Google Scholar] [CrossRef]
- Behrooz, H.; Hayeri, Y.M. Machine learning applications in surface transportation systems: A literature review. Appl. Sci. 2022, 12, 9156. [Google Scholar] [CrossRef]
- Zhou, P.; Yuan, X.T.; Yan, S.; Feng, J. Faster first-order methods for stochastic non-convex optimization on riemannian manifolds. IEEE Trans. Pattern Anal. Mach. Intell. 2021, 43, 459–472. [Google Scholar] [CrossRef] [PubMed]
- Haasler, I.; Singh, R.; Zhang, Q.; Karlsson, J.; Chen, Y. Multi-marginal optimal transport and probabilistic graphical models. IEEE Trans. Inf. Theory 2021, 67, 4647–4668. [Google Scholar] [CrossRef]
- Rafique, D.; Velasco, L. Machine learning for network automation: Overview, architecture, and applications [invited tutorial]. J. Opt. Commun. Netw. 2018, 10, D126–D143. [Google Scholar] [CrossRef]
- Rafique, A.A.; Al-Rasheed, A.; Ksibi, A.; Ayadi, M.; Jalal, A.; Alnowaiser, K.; Meshref, H.; Shorfuzzaman, M.; Gochoo, M.; Park, J. Smart traffic monitoring through pyramid pooling vehicle detection and filter-based tracking on aerial images. IEEE Access 2023, 11, 2993–3007. [Google Scholar] [CrossRef]
- Jia, J.; Dong, B.; Kang, L.; Xie, H.; Guo, B. Cost-optimization-based quantum key distribution over quantum key pool optical networks. Entropy 2023, 25, 661. [Google Scholar] [CrossRef] [PubMed]
- Cosma, O.; Pop, P.; Sabo, C. On the two-stage supply chain network design problem with risk-pooling and lead times. Cybern. Syst. 2023, 54, 321–338. [Google Scholar] [CrossRef]
- Wang, B.; Su, Z.; Wang, A.; Chen, K. Pooling management and transport optimization of packing boxes for motor engine parts. J. Algorithms Comput. Technol. 2019, 13, 1748302619845809. [Google Scholar] [CrossRef]
- Trzynadlowski, A.M.; Bech, M.M.; Blaabjerg, F.; Pedersen, J.K.; Kirlin, R.L.; Zigliotto, M. Optimization of switching frequencies in the limited-pool random space vector pwm strategy for inverter-fed drives. IEEE Trans. Power Electron. 2001, 16, 852–857. [Google Scholar] [CrossRef]
- Chen, J.; Hu, W.; Cao, D.; Zhang, M.; Huang, Q.; Chen, Z.; Blaabjerg, F. Novel data-driven approach based on capsule network for intelligent multi-fault detection in electric motors. IEEE Trans. Energy Convers. 2021, 36, 2173–2184. [Google Scholar] [CrossRef]
- Şenaras, O.M.; Solmaz, E.; Öztürk, N.; Öztürk, F. Determination of the fleet size of agvs with agv pools using a genetic algorithm and artificial intelligence. Appl. Sci. 2023, 13, 7994. [Google Scholar] [CrossRef]
- Mohan, B.; Badra, J. An automated machine learning framework for piston engine optimization. Appl. Energy Combust. Sci. 2023, 13, 100106. [Google Scholar] [CrossRef]
- García, A.; Carlucci, P.; Monsalve-Serrano, J.; Valletta, A.; Martínez-Boggio, S. Energy management optimization for a power-split hybrid in a dual-mode rcci-cdc engine. Appl. Energy 2021, 302, 117525. [Google Scholar] [CrossRef]
- Zhang, J.; Wang, S.; He, W.; Li, J.; Wu, S.; Huang, J.; Zhang, Q.; Wang, M. Augmented reality material management system based on post-processing of aero-engine blade code recognition. J. Manuf. Syst. 2022, 65, 564–578. [Google Scholar] [CrossRef]
- Fatemi Moghaddam, F.; Wieder, P.; Yahyapour, R. A multi-layered policy generation and management engine for semantic policy mapping in clouds. Digit. Commun. Netw. 2020, 6, 38–50. [Google Scholar] [CrossRef]
- Yun, H.; Bu, Z.; Yang, Z.; Wang, L.; Zhang, B. Optimization of fuel injection timing and ignition timing of hydrogen fueled si engine based on doe-mpga. Int. J. Hydrogen Energy 2023, 48, 9462–9473. [Google Scholar] [CrossRef]
- Thiruvel, A.; Thiruppathi, S.; Chidambararaj, N.; Aravindhan, K. Modern power system operations in effective transmission congestion management via optimal dg capacity using firefly algorithms. In Proceedings of the 9th International Conference on Electrical Energy Systems (ICEES), Chennai, India, 23–25 March 2023; pp. 360–365. [Google Scholar]
- Fayed, L.; Nilsson, G.; Geroliminis, N. On the utilization of dedicated bus lanes for pooled ride-hailing services. Transp. Res. Part B Methodol. 2023, 169, 29–52. [Google Scholar] [CrossRef]
- de Ruijter, A.; Cats, O.; Alonso-Mora, J.; Hoogendoorn, S. Ride-pooling adoption, efficiency and level of service under alternative demand, behavioural and pricing settings. Transp. Plan. Technol. 2023, 46, 407–436. [Google Scholar] [CrossRef]
- Fehn, F.; Engelhardt, R.; Dandl, F.; Bogenberger, K.; Busch, F. Integrating parcel deliveries into a ride-pooling service—An agent-based simulation study. Transp. Res. Part A Policy Pract. 2023, 169, 103580. [Google Scholar] [CrossRef]
- Boškov, N.; Simsek, S.; Trachtenberg, A.; Starobinski, D. Srep: Out-of-band sync of transaction pools for large-scale blockchains. In Proceedings of the 2023 IEEE International Conference on Blockchain and Cryptocurrency (ICBC), Dubai, United Arab Emirates, 1–5 May 2023; pp. 1–9. [Google Scholar]
- Pan, J.-S.; Zhang, L.-G.; Wang, R.-B.; Snášel, V.; Chu, S.-C. Gannet optimization algorithm: A new metaheuristic algorithm for solving engineering optimization problems. Math. Comput. Simul. 2022, 202, 343–373. [Google Scholar] [CrossRef]
- Bairwa, A.K.; Joshi, S.; Singh, D. Dingo optimizer: A nature-inspired metaheuristic approach for engineering problems. Math. Probl. Eng. 2021, 2021, 2571863. [Google Scholar] [CrossRef]
- Heidari, A.A.; Mirjalili, S.; Faris, H.; Aljarah, I.; Mafarja, M.; Chen, H. Harris hawks optimization: Algorithm and applications. Future Gener. Comput. Syst. 2019, 97, 849–872. [Google Scholar] [CrossRef]
- Rao, R.V. Jaya: A simple and new optimization algorithm for solving constrained and unconstrained optimization problems. Int. J. Ind. Eng. Comput. 2016, 7, 19–34. [Google Scholar]
| Disclaimer/Publisher’s Note: The statements, opinions and data contained in all publications are solely those of the individual author(s) and contributor(s) and not of MDPI and/or the editor(s). MDPI and/or the editor(s) disclaim responsibility for any injury to people or property resulting from any ideas, methods, instructions or products referred to in the content. |
© 2023 by the authors. Licensee MDPI, Basel, Switzerland. This article is an open access article distributed under the terms and conditions of the Creative Commons Attribution (CC BY) license (https://creativecommons.org/licenses/by/4.0/).


