Article

Modularization Design for Smart Industrial Service Ecosystem: A Framework Based on the Smart Industrial Service Identification Blueprint and Hypergraph Clustering

Department of Industrial Engineering and Management, School of Mechanical Engineering, Shanghai Jiao Tong University, 800 Dongchuan Road, Minhang District, Shanghai 200240, China
*
Author to whom correspondence should be addressed.
Sustainability 2023, 15(11), 8858; https://doi.org/10.3390/su15118858
Submission received: 25 March 2023 / Revised: 15 May 2023 / Accepted: 24 May 2023 / Published: 31 May 2023
(This article belongs to the Special Issue Sustainable Smart Manufacturing and Service)

Abstract

:
Compared with the conventional industrial product–service system, the smart industrial service ecosystem (SISE) mentioned in this study contains more service activity according to the characteristics of the industrial context, participation of various stakeholders and smart interconnected technologies. This study proposes a detailed modularization design framework for SISE, which can be referenced in various industrial contexts. Firstly, the context-based smart industrial service identification blueprint (SISIB) is proposed to describe the operation model of SISE and identify the service components. The SISIB can ensure that the designers understand the service and work process of the system and improve or carry out the smart industrial service (SIS) component identification. In the case of this article, SIS components from different industrial levels can be systematically identified. Secondly, smart collaboration and sustainable development principles are proposed for measuring the correlation degree among the service components. Considering the complexity and multi-level distribution nature of service components, the hyperedge concept is presented to realize the correlation comparison among the service components, and the evaluation linguistics is applied to handle the decision uncertainties. With this method, the effective correlation comparison between service components can be formed with few hyperedges. Thirdly, the hypergraph clustering theory is applied to define the SISE service module partition. The triangular fuzzy number is first used in hyperedge strength evaluation to comply with the vague linguistics from service design experts. The normalized hypergraph cut principle is realized using the K nearest neighbors (kNN) algorithm, and with this method, the new unified hypergraph and related Laplace matrix can be obtained. Then, the relevant eigenvalue of that Laplace matrix is gained, and the component clustering visualization is realized using the k-means algorithm. After the clustering is performed, several modular design schemes can be gained. In order to select the best modularization scheme, we referenced the modularity concept and realized the quality measurement for the modular design using hypergraph modularity criteria. Regarding these three steps, a detailed modularization case study for a renewable electricity service ecosystem design is presented to verify the viability and feasibility of the study in service modular design. The result showed that the framework in this study can realize the visible and clearance service component identification in a smart connected multi-level industrial context. The modular design scheme based on hypergraph can also achieve high modularity with a more convenient correlation evaluation.

1. Introduction

Servitization has been receiving significant attention in various industries to improve competitiveness. Currently, manufacturing companies are adding extra services to their products; this type of strategy is named the product service system (PSS). With increased business competition and sustainable development requirements, current companies need to develop effective industrial service solutions. The PSS for industrial context appeared and is defined as the industrial product–service system (IPS2) [1].
The spread of advanced smart technologies [2], such as smart sensing, interactive connection, and accurate maintenance, has influenced the form of servitization. The smart IPS2 has emerged as the main model for providing smart service in industrial applications. These technologies not only promote the smart IPS2 to a higher level but also provide a path for realizing service in a border context. However, the design and detailed implementation of smart service solutions is still challenging. This calls for the company to have a holistic context or “ecological” level of thinking in providing industrial services and systematically consider the requirements of the stakeholders. In order to handle the service requirements in complicated smart and connected industrial contexts, this study focuses on the detailed modular design of a smart industrial service ecosystem (SISE) [3]. Previous research related to the SISE concept contains several aspects. For example, Anthony, B. et al. [4,5] mentioned the importance of applying a distributed ledger and decentralized technology to form a collaborative digital service ecosystem. Kortum, H. et al. [6] proposed a detailed literature review study and mentioned that lifecycle data management should be applied to realize a smart living service ecosystem. With the wide spread of smart technologies, some studies have focused on creating a smart service ecosystem that is constructed around smart services as (focal) value propositions and is based on the material characteristics of smart products. Beverungen, D. et al. [7] emphasized the importance of platform thinking while transforming into an industrial smart service provider, and their research also emphasized the importance of stakeholder interactions. Herterich, M. et al. [8] empathized that the smart service ecosystem should be widely applied as an important path for socio-technical transformation into collective affordances. Their research also points out that the smart service ecosystem should go beyond just centering a core smart product. Chang et al. [3] systematically elaborated on the concept of SISE, and their research especially emphasized the importance of achieving a detailed service design.
For a complex system such as SISE, various smart industrial service (SIS) components are contained, and the efficiency and convenience of the service delivery can be enhanced by modularity. Numerous studies have recently examined various techniques with an emphasis on modularized service design. Khan et al. [9] mentioned product–service modularization as one of the key steps in the conceptual framework for the design of upgradable PSS. However, most existing studies on the modularization process discussed the service component identification from the product level-related activities. The service blueprint method has been widely applied in smart PSS/IPS2 studies and has been adjusted to become more fixable for smart and interconnection functions. However, the current blueprint adjustment still mainly focuses on the smart service design at the single product/process level and has limitations in systematically identifying service components in a complex context. There are especially few existing approaches that integrate the modular design of a complex industrial smart service solution with the consideration of smart interconnection characteristics, multi-level industrial activities, and sustainability.
Currently, the modularization method is widely acknowledged as an important approach to realize the efficient and flexible design of the product and service to adapt to rapid market change [10,11]. With the increasing requirements for smart service solutions, it is also necessary to explore an effective modularization method in the context of SISE design. Modularization can arrange the closely linked SIS components into modules that can achieve better functions [12]. Hence, it is essential to develop an improved tool to identify SIS components under the SISE context. The identification of SIS components [13] is the first step of service modularization and is the base for functional service modules.
Once the various components are gained, the next step is to analyze the relationship between them. This step can provide a critical reference for SIS components clustering and is the basis to construct service modules [14]. Therefore, it is important to set up an effective standard and measure the correlation degree. However, most existing studies in the correlation criteria set-up are limited to the economic aspect, such as the component’s relationship in flexibility, complexity, and the cost required. Such an evaluation mechanism usually ignores relevant criteria on social benefits and environmental indicators. Moreover, the current scoring mechanism is mainly applied through the traditional graph model, which is relatively easy to understand. However, the edges of the graph model only present pairwise relations, and the model has some limitations in describing the relationship between one-to-many and many-to-many service components. Usually, the service components of a complex service solution such as the SISE are distributed at different activity levels with many-to-many relationships among them. Currently, most of the existing research on service correlation degree evaluation contains a scant study on these two areas.
Moreover, finding the module partition is crucial after determining the correlations between service components. Various partition methods based on the ordinary graph theory have been proposed, including the fuzzy graph [15], the transitive closure method [16], and the design structure matrix (DSM) [17]. These methods are useful in solving service component allocation at the product level and can generate relevant service modules, but they may markedly decrease and have the problem of local optima. In real applications, complex networks (or graphs) [18] are usually used to distribute the service components. Usually, the traditional graph theory is applied to analyze the relationship among service component nodes.
However, no matter how the clustering algorithm is improved, each edge in the traditional graph is limited to linking two components and can mainly handle one-to-one relations. This makes the correlation comparison quite complex as it requires all components to be compared in pairs. Moreover, the SISE is oriented to solving the industrial context level service, and its service components are distributed at different levels. This also motivates the application of the hypergraph theory that can handle the one-to-many, many-to-one, or many-to-many relations between service components. To fix the relevant limitations, the hypergraph theory has gained considerable attention from the research community in many areas, such as image-matching, image categorization, and local grouping [19]. The hypergraph theory has the potential to realize highly modular service design. However, to the best of the authors’ knowledge, no existing study has systematically combined the hypergraph theory in the smart industrial service modular design. It is important to introduce the hypergraph theory in service component relationship analysis and clustering for the detailed smart industrial context service modular design.
To handle these challenges, this study investigates three research questions (RQs) that need to be solved. (1) RQ 1: The SISE is a more holistic and enhanced form of smart IPS2; the system-related levels are more complex and usually contain more domains. However, current studies are mainly focused on implementing SISE qualitative construction from a conceptual perspective, but the specific quantitative design requires an effective tool to identify service requirements as detailed service components. Therefore, how is it possible to develop a method that can accurately and systematically identify the service components in SISE considering the smart interconnection across layers in complex industrial contexts? (2) RQ 2: The SISE contains a wide range of service components distributed at different industrial levels, and they have relatively complex relationships. The conventional graph analysis theory exhibits some limitations. Therefore, how is it possible to develop an effective evaluation method for the correlation degree between service components in cross-level domains? Especially, how is it possible to establish an effective correlation degree standard between service components? (3) RQ 3: How is it possible to compute and demonstrate the clustering results with the consideration of complex relationships between service components at various industrial levels and confirm the hypergraph clustering method’s effectiveness? Especially, how can the hypergraph partition provide a new form of service component clustering and gain effective and visible clustering results? The selection of the best hypergraph clustering scheme also needs to be addressed in this RQ. In general, addressing these three RQs is the main aim of our research.
To solve the above-mentioned RQs, this study proposes a systematic framework for the modular design of SISE. The literature review and analysis of the current research gaps are presented in Section 2. This section addresses RQ1 and describes the service system development trend and emphasizes the necessity of applying SISE modular design. Section 3 introduces the SISE concept and provides a detailed systematic framework for SISE modularization to address RQ 2 and RQ 3. Section 4 applies the proposed framework to a renewable electricity park case in practical applications, realizing the modularization of a complex service ecosystem. The major contributions, containing both theoretical and practical implications, are covered in Section 5. The study is finally concluded in Section 6, which also offers suggestions for future studies.

2. Literature Review

The importance of implementing service modular design is discussed in this section along with aspects related to the smart industrial service ecosystem concept. The relevant aspects are consulted in Figure 1, and the subsections below provide in-depth explanations.

2.1. Smart Industrial Service Ecosystem-Related Concepts

2.1.1. Smart IPS2

Currently, a primary method for companies to provide services in the industry scenario is IPS2 [1,20]. With the assistance of information technology, such as smart communication and smart analysis, traditional industrial services can become smart [21]. This transformation brings the concept of smart IPS2 [22]. The smart and connected industrial products and their generated e-services can be integrated to better satisfy customers, including smart monitoring, smart maintenance, smart diagnosis, and related recycling [23]. Although the previous studies do provide important exploration for the application of industrial service, most of them mainly focus on product-level service. Customers want a systematic, efficient industrial service solution as servitization intensifies [24]. To address greater macro-level industrial situations, this necessitates designing service solutions at an ecosystem level.

2.1.2. Service Ecosystem

The smart IPS2 model has become an important method to solve the service design around industrial products. However, with the deepening of servitization, the customers and related stakeholders in a complex industrial application need more systematic service solutions. This motivates the service designer to have a more ecological level of thinking in applying the industrial service system design, such as the implementation of service ecosystems.
Vargo, S. L. et al. [25] systematically described the approach and the characteristics of the service ecosystem concept. Vargo, S. L. et al. mentioned that the service ecosystem could be considered as a self-adjusting system with various economic and social stakeholders as resource integrators to co-create value through service exchange under shared institutional logic. Ecosystem thinking has been considered an important approach for addressing service design and development in complex contexts [26]. Therefore, it is essential to take the characteristics of the service ecosystem into consideration as an extension of smart IPS2.
Furthermore, the service ecosystem incorporates the mechanism of self-adjusting and service value co-creation into the service system and can simultaneously create service value for different stakeholders. Zheng, M. K. et al. [27] developed a smart product–service ecosystem to maximize the service potential around a smart product. Frow, P. et al. [43] mentioned that the practices and activities in a service ecosystem can be classified into micro, meso, and macro levels. For the detailed service design for more complex service ecosystems, it is essential to connect with their commercial/industrial backgrounds and explore the characteristics of relevant service requirements. The next section further discusses the related literature and the development trend of SISE as an improved model of smart IPS2 under ecological thinking.

2.1.3. SISE: A Smart Service Solution for a Complex Industrial Context

Smart IPS2 is usually considered a smart, individualized, and customer-oriented solution for industrial products. However, in a practical application, the holistic industrial service design may rely on a more complex industrial context. For example, Bake et al. [28] mentioned that the challenges for IPS2 were typical in a related context and the relevant company should provide the available solutions to address that specific issue. A smart industrial context contains the equipment, executive line, and industrial park levels, where each level of the context is intelligently interconnected. From the perspective of manufacturing, Cimini et al. [44] emphasized the importance of providing industrial optimization service at the assembly line and factory levels and depicted the steps needed to build a digital service ecosystem. A digital physical social system was proposed by Yin et al. [45] to characterize the operations of a complex social manufacturing setting. Zhou et al. [46] proposed the Cloud Manufacturing Service Ecosystem (CMSE) concept as a more systematic way of realizing the social network product manufacturing service. Their research emphasized that CSME contains the activities of various stakeholders, and each stakeholder has the opportunity to present its value proposition and gain a corresponding ecological niche. In addition to manufacturing, the secondary industry also includes the energy, mining, and construction industries. Under these circumstances, the customers may face complex situations due to the variety of industries. Data collecting for the physical industrial environment is made possible by the revolutionary potential of smart and linked technologies such as the Internet of Things (IoT) [47]. These smart connected complex industry contexts request smart service for all related stakeholders and the consideration of cross-layer system architectures. For example, Medini, K. et al. [48] applied a solution-oriented industrial PSS offering to an industrial project. Their research explored the importance of the economic benefits of the context located. Radenković, M. et al. [49] proposed a holistic smart electricity service solution covering the various layers of the smart grid. Zhai et al. [50] proposed a smart building information modeling service system for the construction industry. The related literature in the field of industrial service systems shows that developing service solutions for complex industrial contexts has gained attention in both the business and academic areas.
To more systematically describe the service mode under this trend, this study focuses on the concept of a SISE as an extension and improvement of smart IPS2 and smart PSS under ecological thinking. Unlike smart IPS2, which is mainly developed for customers who own industrial products/equipment, SISE is designed around complex industrial contexts [3]. The service components should be identified through business or industrial contexts from economic, social, and environmental perspectives. In the classic smart IPS2, the service is mainly designed for a customer who uses the industrial product. However, SISE is developed for a more complex industrial context and can provide values for more diverse socially and environmentally oriented stakeholders. To achieve a successful service system design, the company needs to consider the requirements of all related stakeholders [51,52] and also consider the data and knowledge flow involved [53].
The increasing requirements for service solutions compel companies to consider industrial activities in multiple layers. The service value co-creation in SISE contains a wider context. The service activities are involved in visible and invisible domains, and more intelligent backstage support is needed. This has brought new challenges to the service designers while applying their SISE in real applications. However, to the best of our knowledge, currently fewer studies have discussed the detailed service component identification and modular design for service ecosystems, and even fewer studies have considered the clustering method rather than the traditional graph network theory. The complex interactions and multiple layers related to the SISE bring new challenges towards service modularization. Therefore, it is important to develop an adaptive modularization method including an improved method for service components identification and an effective clustering method considering the smart and sustainable characteristics of SISE.

2.2. Service Modular Design Methods

In addition to physical products, the modularization approach is also becoming a popular method in intangible service design [54]. Service modularization is considered to be an effective approach for companies to structure service processes and identify detailed service components for each service system [10]. Brusoni, S. et al. [55] mentioned that a complex service system could be decomposed into individual modules through the physical decomposition of the system. Service modularization can improve the design effectiveness of the manufacturer’s service business. Specifically, the service module is defined as [12] “a group of service components that offers an effective functionality via an accurately described interface and with which a modular service is composed, tailored, and personalized.” Nätti et al. [29] indicated that modularization could be used primarily for systematization and identification purposes.
Regardless of the modular design method applied, the main process contains the following two parts: (1) the identification of relevant service components from the background located and relevant customer journey analysis and (2) the detailed formulation of service modules through the clustering of service components. Section 2.2.1 and Section 2.2.2 reviewed the current mainstream studies on these two parts, Table 1 summarizes the existing mainstream product service modularization methods, while Section 2.2.3 illustrated the potential of hypergraph clustering in SISE service modular design.

2.2.1. Service Component Identification Process

Modularization has been widely used in many industries, and the modularization of services is considered to be an effective method in process design and management. The related service component should be identified in the preparation stage of the service modular design [30,31]. Several tools have been proposed for service component identification in various circumstances, including the DSM, quality function deployment (QFD), classic service blueprint, business process model and notation (BPMN), and a product–service blueprint. Sinha, K. et al. [32] applied the DSM method for the initial decomposition and modularization design of an electric train static inverter. From a broader perspective, the module design method relates to the modular structure of the system to which it belongs and is an effective strategy for system life cycle management [33]. Shehab, E. et al. [56] emphasized the importance of generating modularized configurations to develop sustained IPS2 solutions. Peters et al. [57] proposed a framework to modularize the services of telemedicine providers, which include status capturing, a process division, a form correlation matrix, and finally testing processes. Santana F. et al. [58] proposed a BPMN method for the business process design under the sustainable requirement. To better provide a visual display of the interaction between service components, the service blueprint has also been proposed as an important method to realize the PSS and IPS2 modularization. Geum, Y. et al. [30] realized product plus service design in a sustainable manner through a product–service blueprint approach. The service blueprint’s benefits include the demonstration of the value proposition and the clear representation of customer behavior, sequential progress, and dimensional relationship. Recently, researchers have explored the paths for the improvement of the traditional service blueprint. Papazoglou et al. [34] proposed the manufacturing blueprint as a new paradigm to move from a traditional product-centric model to a fully digital service solution, bringing intelligence into the entire manufacturing context. Li, F. et al. [35] proposed a smart mobile service blueprint framework for the customers’ participation in the service design of AI-enabled applications. Chen et al. [13] designed a cyber-physical system-based smart product–service blueprint considering smart flow and cyber activities. The above-mentioned studies show that the conventional service blueprint needs to consider the influence of digital/cyber activities and expand its domains to realize the design of smart functions. Moreover, the multi-level complexity of smart industrial service solutions such as the SISE also imposes requirements on the domain of the design blueprint.

2.2.2. Service Component Cluster Methods

In addition to the identification of related components, the service components should also be clustered into modules with effective clustering methods. The clustering of service components performs a comprehensive evaluation of the correlation degree and defines the mechanism for service module partition.
Compared to studies on modularization processes, the studies that focus on detailed mathematical methods to implement modular ranking and clustering are relatively fewer. The existing studies mainly realize the component comparison from the pairwise correlation degree perspective, and the relevant clustering algorithm is usually formed under the traditional graph relationship. Geng et al. [16] developed the fuzzy DSM with a transition closure method to obtain the service modules for a result-oriented PSS. Fogaça et al. [36] used a graph model of netlist for component relationship comparison and applied the genetic algorithm (GA) to arrange service modules for electric chips. Sun, J. et al. [14] presented the PSS modularization based on functional requirements analysis (FRA) and emphasized the structural similarity principle during modularization. Fender et al. [37] presented a parallel clustering method using the multidimensional k-means algorithm on the obtained eigenvectors based on the graph adjacency matrix. Recently, some improved network community clustering algorithms including the modified Girvan–Newman (GN) algorithm [13] and the Kruskal-affinity propagation (AP) clustering algorithm [10] have been applied for service components clustering. However, these algorithms also merely used the ordinary graph theory for evaluation input. The ordinary graph is relatively easy to understand, but each edge applied can only connect two service components and describe pairwise relations. In reality, there may be more intricate relationships between service components, such as many-to-many relationships in networks [38]. The hypergraph can present the relationship through hyperedge without information loss. Currently, the potential of hypergraph has not been systematically explored in service system modular design.
Table 1. Comparison of existing product service modularization methods with the proposed method.
ReferencesService Process Analysis and Service Component IdentificationCorrelation Evaluation for Service Components IdentifiedService Component Modular Algorithm
MethodService Process Identification VisibilityService System Macro
Levels Consideration
Correlation
Degree Aspect Focus
Linguistic Vagueness
Consideration
MethodModular
Result
Visualization
Smart Learning Algorithm in Partition
[30]Product–service blueprintTBL-sustainabilityN/A
[32]DSMEconomic-
Better maintenance
Idicula-Gutierrez-Thebeau-Algorithm
[16]Fuzzy DSMPartiallyEconomic-Better profitFuzzy
Similar Matrix
[14]FRAEconomic-
Better efficiency
Fuzzy clustering algorithm
[58]BPMNPartiallyTBL-sustainabilityN/A
[34]Manufacturing service blueprintEconomic/
environment
Better maintenance
N/A
[35]Smart service blueprintPartiallyEconomic/
Better competitiveness
N/A
[11]Product–service blueprintEconomic/Better profit + maintenanceMaximum spanning tree
[36]Product operation netlistEconomic/Better profit and fewer costGraph theory and Louvain
[13]Smart product–service blueprintEconomic-Graph theory
This studySISIBTBL-sustainabilityHypergraph
Theory/learning algorithm

2.2.3. Hypergraph Clustering Mechanism and Current Application

The hypergraph modeling theory has many applications in classification, retrieval, and other tasks and has demonstrated superiority in correlation formulation among samples [39]. The hypergraph is composed of a hyperedge set and a vertex set. A hypergraph can be considered as an extension of the ordinary graph, in which a hyperedge contains a certain finite number of nodes or vertices, and each vertex can represent a component in real applications. The hypergraph clustering method has been widely used in many contexts, including image retrieval, object or image categorization, social network analysis, and media recommendation [40].
Currently, the hypergraph theory is mostly applied to handle the recognition and classification of a large number of images. Ma et al. [41] presented a hypergraph p–Laplacian method for the recognition of remote sensing images. Wei et al. [59] presented a local-view-assisted method with hypergraph auto-learning for hyperspectral image classification. Hypergraph learning can be seen as a label propagation process or as a spectral partition in different tasks [60]. Hypergraph clustering or regularization is considered to be more robust to noise and interference than traditional graphs as it can provide higher-order relationships [42]. The advantages of hypergraph clustering can be utilized if it is applied to the modular design of the smart service solution.
Although hypergraph clustering has significant advantages and feasibility, the method is still not fully applied in the service design field. To the best of the authors’ knowledge, few studies have applied the hypergraph theory in the industrial service area, and even fewer studies have considered the detailed service modular partition using hypergraph clustering. Z. Wang et al. [61] conducted several valuable studies on the smart PSS delivery configuration based on hypergraph theory. However, their research still has some limitations on service blueprint improvement [62], as well as service modular clustering and modularity calculation. Moreover, it is noticeable that the application of hypergraph theory for modular service design should consider the characteristics of SISE. Therefore, it is necessary to explore how hypergraph theory can be combined with service component identification and clustering.

2.3. Current Research Gaps

The requirement for industrial solutions promotes service value co-creation from a broader ecosystem perspective. This study proposes the SISE concept as a more holistic and complete form of smart IPS2. Moreover, the detailed design of SISE requires the modularization of the service components identified. Modular architecture can reduce the development time of a product, service, or complex system [33]. The module design is considered an important path in achieving service identification. The service blueprint can provide an accurate description of the activities in each dimension. Although several modularization design methods for various product or service systems have been presented, the current mainstream methods do have some limitations.
Firstly, conventional methods such as QFD and service blueprint have limitations in handling the smart transformation of service. These conventional methods have less focus on the smart data flow and interactions among the various industrial layers during system operation. The existing modularization design studies mainly focus on the lifecycle operation characteristics for products and related services. However, in real circumstances, the multi-level nature of the industrial context requests that the designers consider related activities such as executive line and factory/industrial park collaboration management. Furthermore, the existing methods mainly emphasize the importance of analyzing the actions that are related to the customer, and the activities related to social and environmental stakeholders are less concerned. This study proposes a context-based smart industrial service identification blueprint (SISIB) as an expansion of the traditional service blueprint. The proposed novel method can systematically analyze the activities in SISE and provide more domains for service component identification in a complex industrial context. Secondly, in a real industrial environment, a large variety of service components can be identified, and these components usually belong to different domains. Therefore, it is essential to obtain clustering based on correlation results. There are currently few studies that take evaluation uncertainty into account when making group decisions for service components, and even fewer realized the importance of setting up a sustainable correlation evaluation principle for complex industrial service contexts, which may lead to inaccurate results and make it difficult to systematically consider the social/environmental benefits in further service module clustering. Thirdly, the existing modular clustering methods also have some limitations in dealing with the widely distributed industrial service components. The conventional module partition methods such as the graph theory, mapping matrix, and DSM have limitations in describing the cross-level interactions and are less effective in innovative design. Conventional graph analysis is now widely applied for the network analysis of service modules, and the clustering reference is based on the correlation matrix for ordinary edges. However, in many real-world service design problems such as the SISE, the relationships among the service components are usually more complex than in a single product level. The edges that cover spatial distribution and temporal hierarchies need to be applied. Hence, the concept of a hypergraph that breaks the limitations of traditional graphs is required. Most of the classic clustering algorithms, such as the DSM, fuzzy graph, and mapping matrix, are relatively easy to fall into local optimum. Moreover, selecting the optimal modular plan is also an important challenge.
Therefore, it is important to discover a systematic framework to realize the holistic modular design for complex service ecosystems such as the SISE and verify the design quality. This study introduces a systematic smart industrial service solution modularization method based on SISIB components using a hypergraph clustering algorithm.

3. The Systematic Framework for SISE Modularization and Allocation

3.1. The SISE Model and an Overview of the Proposed Framework

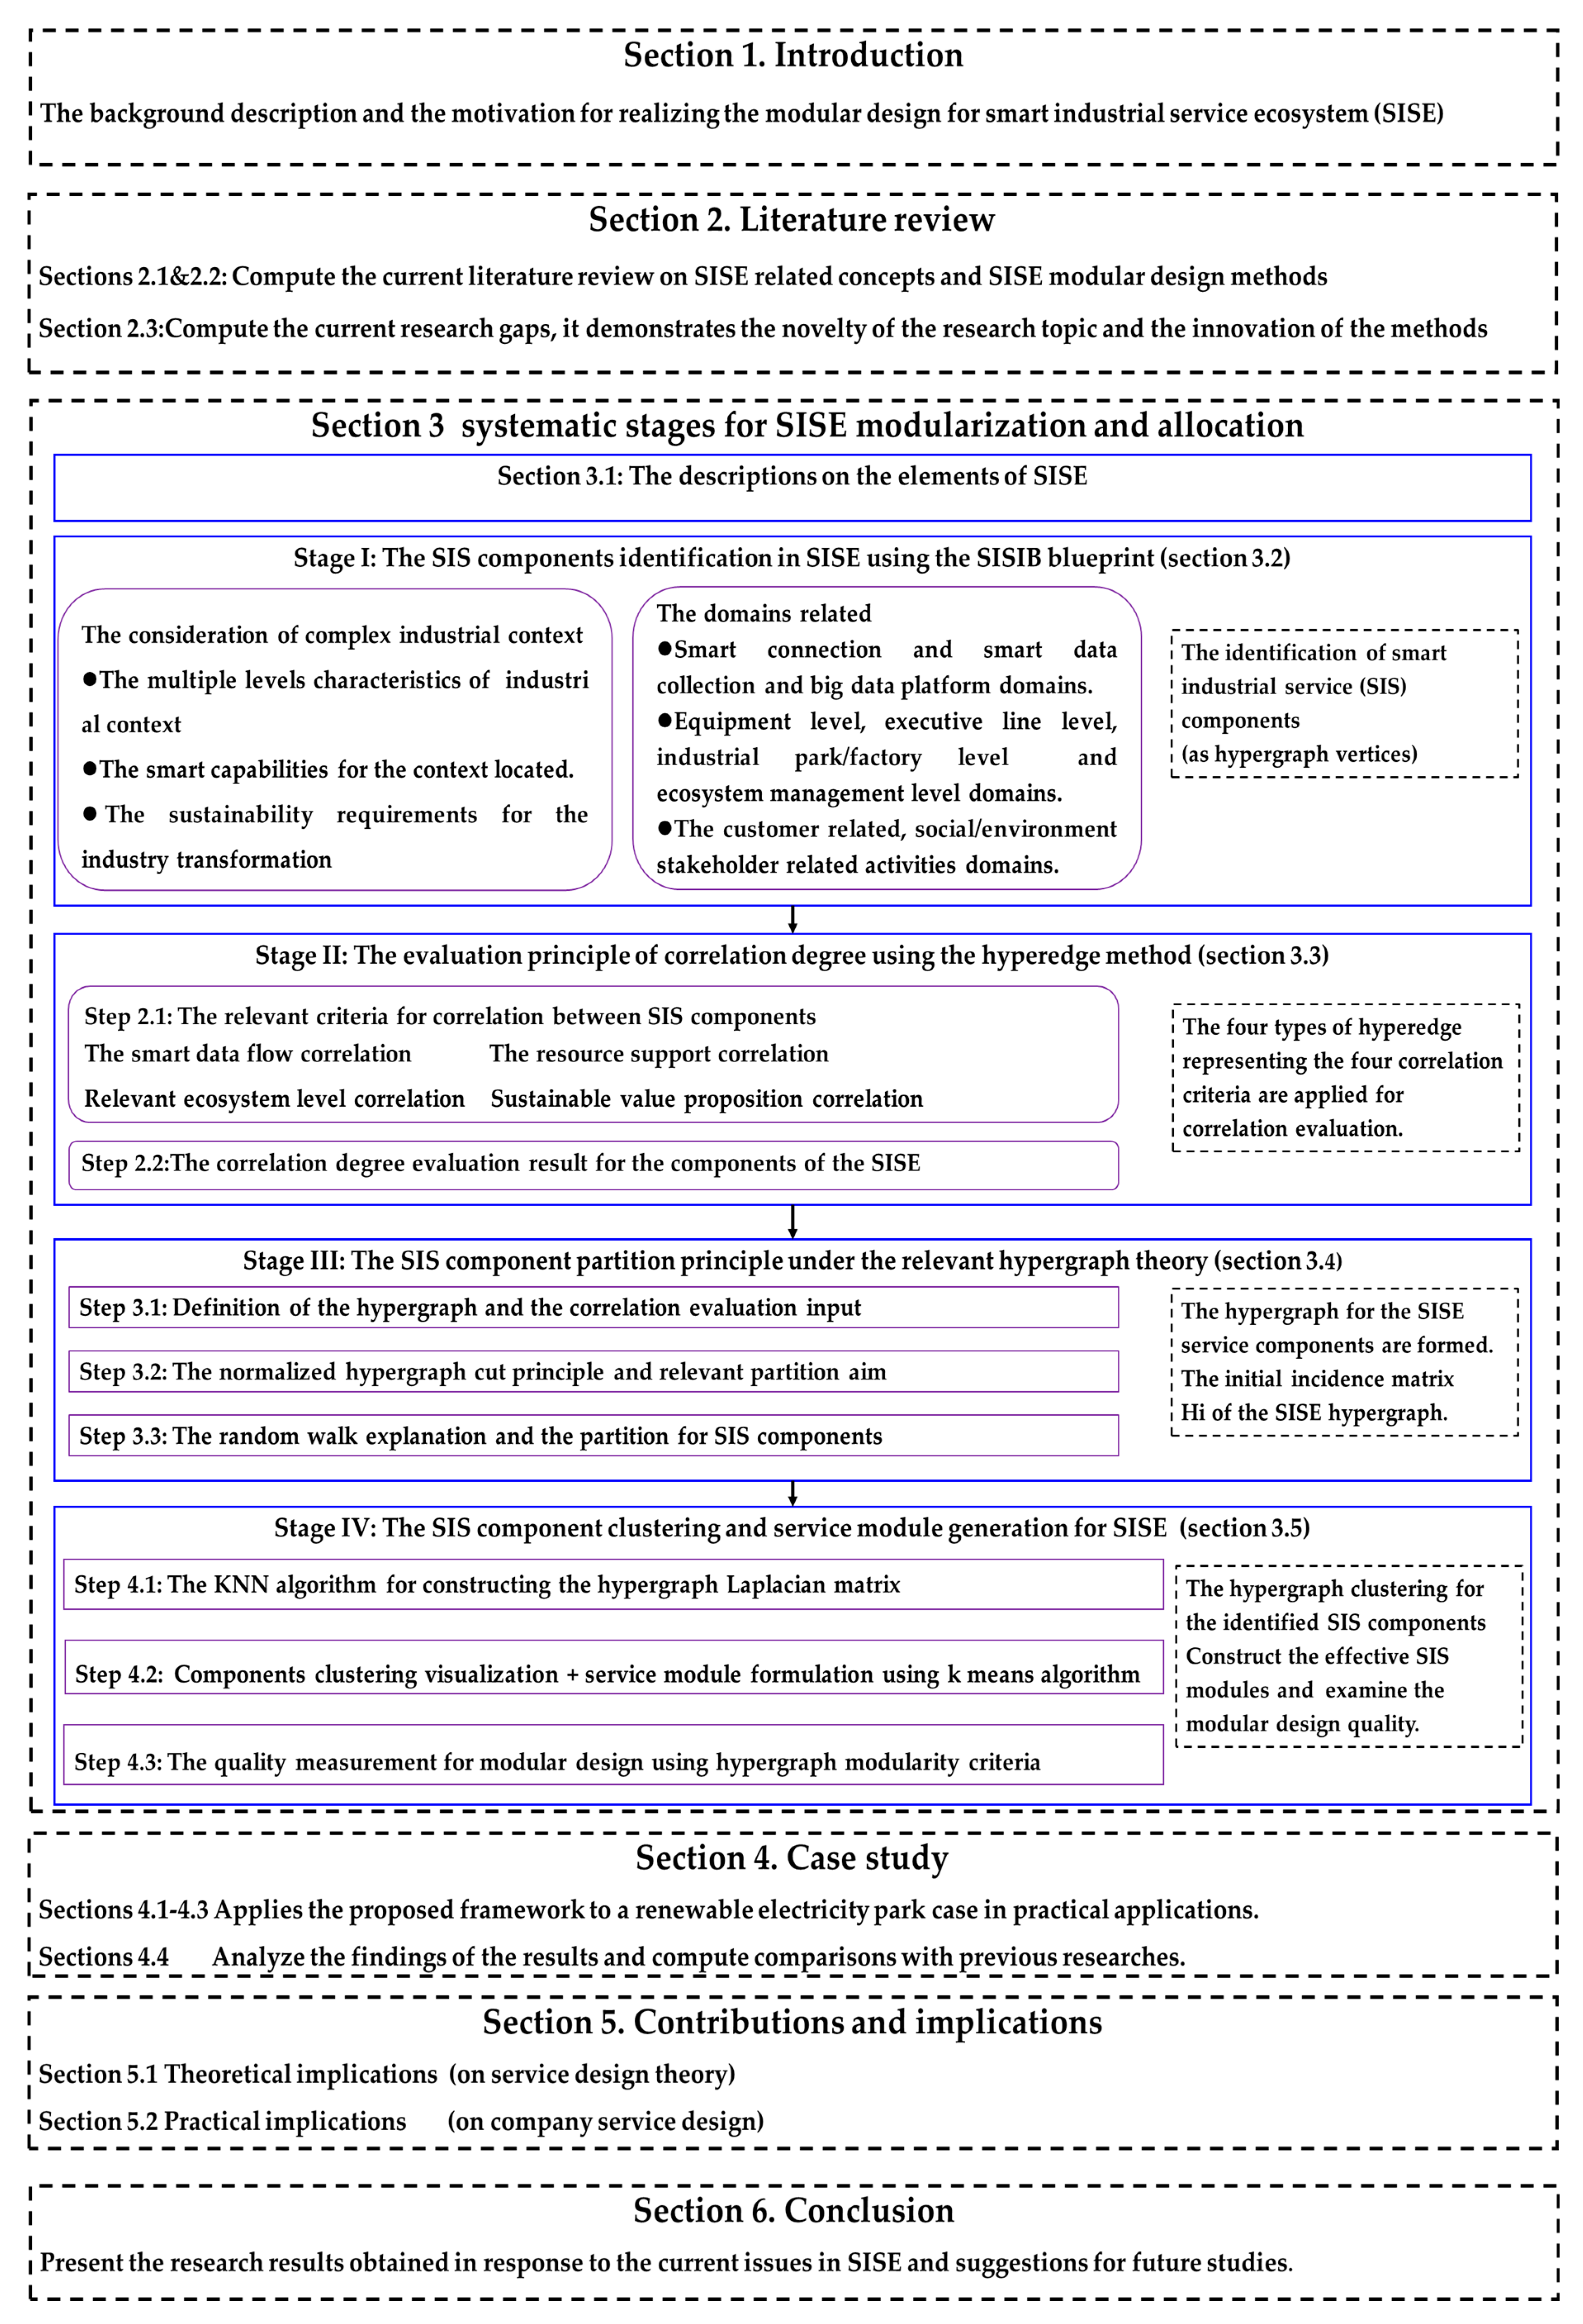
The existing research gaps motivated the authors to apply the SISE as an extension and a more result-oriented form of traditional smart IPS2 and aims to explore the effective method of its modular design. The authors’ previous study [3] mentioned that the SISE contains multiple industrial functional levels and has the characteristics of smart service and complex industrial systems. SISE covers two major types of aspects. One aspect relates to tangible and intangible components that enable the operation of the industrial context. The tangible hardware part covers more content than the traditional product-level service system, including the smart sensors, related industrial equipment, and controller components related to the executive line/station and industrial park. The intangible software part contains intangible communication support protocols and big data platforms [63]. These software components can support smart interconnection and resource integration within the SISE. The stakeholders who actively engage in service value co-creation compose the second aspect of SISE. Specifically, the related stakeholders can be classified into three major types according to their sustainable value propositions. The economically related stakeholders are usually the service provider company and customers, the social well-being related stakeholders are usually the security and safety administrations, and the environmentally friendly related stakeholders mainly cover pollution monitoring, waste recycling, energy saving administrations. In the classic smart IPS2, the service is mainly designed for the customer that uses the industrial product. However, the SISE is developed for a more complex industrial context and can provide more value for diverse socially and environmentally oriented stakeholders. The service process of SISE covers more groups of multiple levels in the industrial context than the industrial product-level service system. Moreover, the smart information and data flow exist in SISE in a complex context and need to consider the economic, social, and environmental stakeholder value propositions according to the sustainable development principle. Hence, an effective SISE modularization framework is developed to identify the relevant detailed service components and compute them into service modules. The entire framework is described in Figure 2, including the content of each section. The four main stages for SISE modularization have been emphasized in detail.
Stage I proposes the SISIB tool to identify the system activities. The classic product–service blueprint and related smart improvement cannot handle the complex situations in SISE. The smart industrial service (SIS) components in SISE are identified in Stage I using the SISIB tool. The suggested SISIB can offer a comprehensive visual description of the operation process at different levels of the industrial context as well as a distinct representation of the activities taken by the three primary groups of relevant stakeholders. The SISIB tool can accurately and comprehensively identify the embedded smart industrial service components. Stage II focuses on the judging criteria for the correlation degree among the service components. There will be deviations in the correlation evaluation if only the functional dependencies of system service components are considered. Stage II proposes the smart collaboration and sustainable correlation principle with four detailed evaluation criteria. Four types of hyperedges are applied to the four smart collaboration and sustainable correlation evaluation criteria. This evaluation method systematically considers the intrapersonal preference and the complexity of spatiotemporal distribution for service components. Using the hyperedge concept, the designers can accurately compare the relations between service components among various domains and stakeholders. This article combines the hyperedge characteristics to evaluate the correlation degree between service components. Stage III focuses on the explanation of hypergraph-related basic concepts and relevant graph partition mechanisms. After the hyperedges representing the correlation degrees are formed, an initial hypergraph can be constructed that covers the SIS components. However, although the initial hypergraph can describe the relationships among service components in various domains, it cannot provide clustering partition results for service modules. The clustering of service components needs to be based on the effective partition. This means connections between two clusters should be scarce, and connections between components within the same cluster should be dense. Stage III normalizes the hypergraph based on the random walk principle and proposes the clustering principle that is dependent on the eigenvalues of the Laplace matrix. Stage IV includes the computation of the clustering results and the specific visualization. The k-nearest neighbor (kNN) method is applied to act as the mechanism of random walk behavior. This algorithm is applied to select k neighbor points closest to a sample point. These N + 1 sample points construct a new hyperedge, and the weight of the edge is the same as the number of k. This method can realize the normalized random walk hypergraph cut and natural partition. Specifically, the method focuses on the computing of the hypergraph node distance matrix and the upgrade of the new fused hypergraph incidence matrix Hck. The new fused hypergraph incidence matrix Hck and the related two diagonal matrices Dv and De are computed, and then the Laplacian matrix Lck is computed based on the calculation method of Stage III. From the Laplacian matrix, the relevant eigenvalues and the eigenvectors with the k smallest eigenvalues are computed, where N is equal to the number of service components. These eigenvectors formed the row vectors of matrix X. Finally, the vertices clustering is realized through the K-means method. The graph vertices in k-dimensional Euclidian space are presumed to be represented by the row vectors of X [64]. The component partition can be realized, while the computed output is the module division result for SISE design. The quality of the modular design result can be measured through hypergraph modularity calculation.

3.2. The SIS Components Identification Using the SISIB (Stage I)

In the classic modularization thinking for the PSS, the system usually follows the service division principle [65]. The identification of service components is the basis of service system design [66]. Therefore, it is essential to analyze the background industrial context and the related service activities. This study uses the system service components and service modules to describe the major design process. To construct the SISE system, the mutual relationships between activities of the industrial context and wider stakeholders need to be analyzed. Therefore, the first major task for SISE design is to define the SIS components. The traditional product-level-related service blueprint mainly focuses on a single dimension, such as the use and maintenance of products. Recently, the concept of a smart product service blueprint has been proposed [13], and the new smart capabilities around the products can be considered. However, this still mainly expands service activities from product-related activities. The SISE can provide a systematic industrial solution and typically involve the service value co-creation at broader levels, including the equipment/product, executive line, factory, and enterprise management [3]. This requires the service designer to construct a novel and effective service blueprint. To improve the traditional product-level service blueprint, this section proposes the SISIB for the holistic identification of SISE service components. The proposed method is inspired by integrating the advantages of the smart product–service blueprint [13], the industrial context architecture [67], and the ecological stakeholder thinking in sustainable value creation.
The proposed SISIB method can systematically identify SIS components and aims to promote smart and sustainable service design.
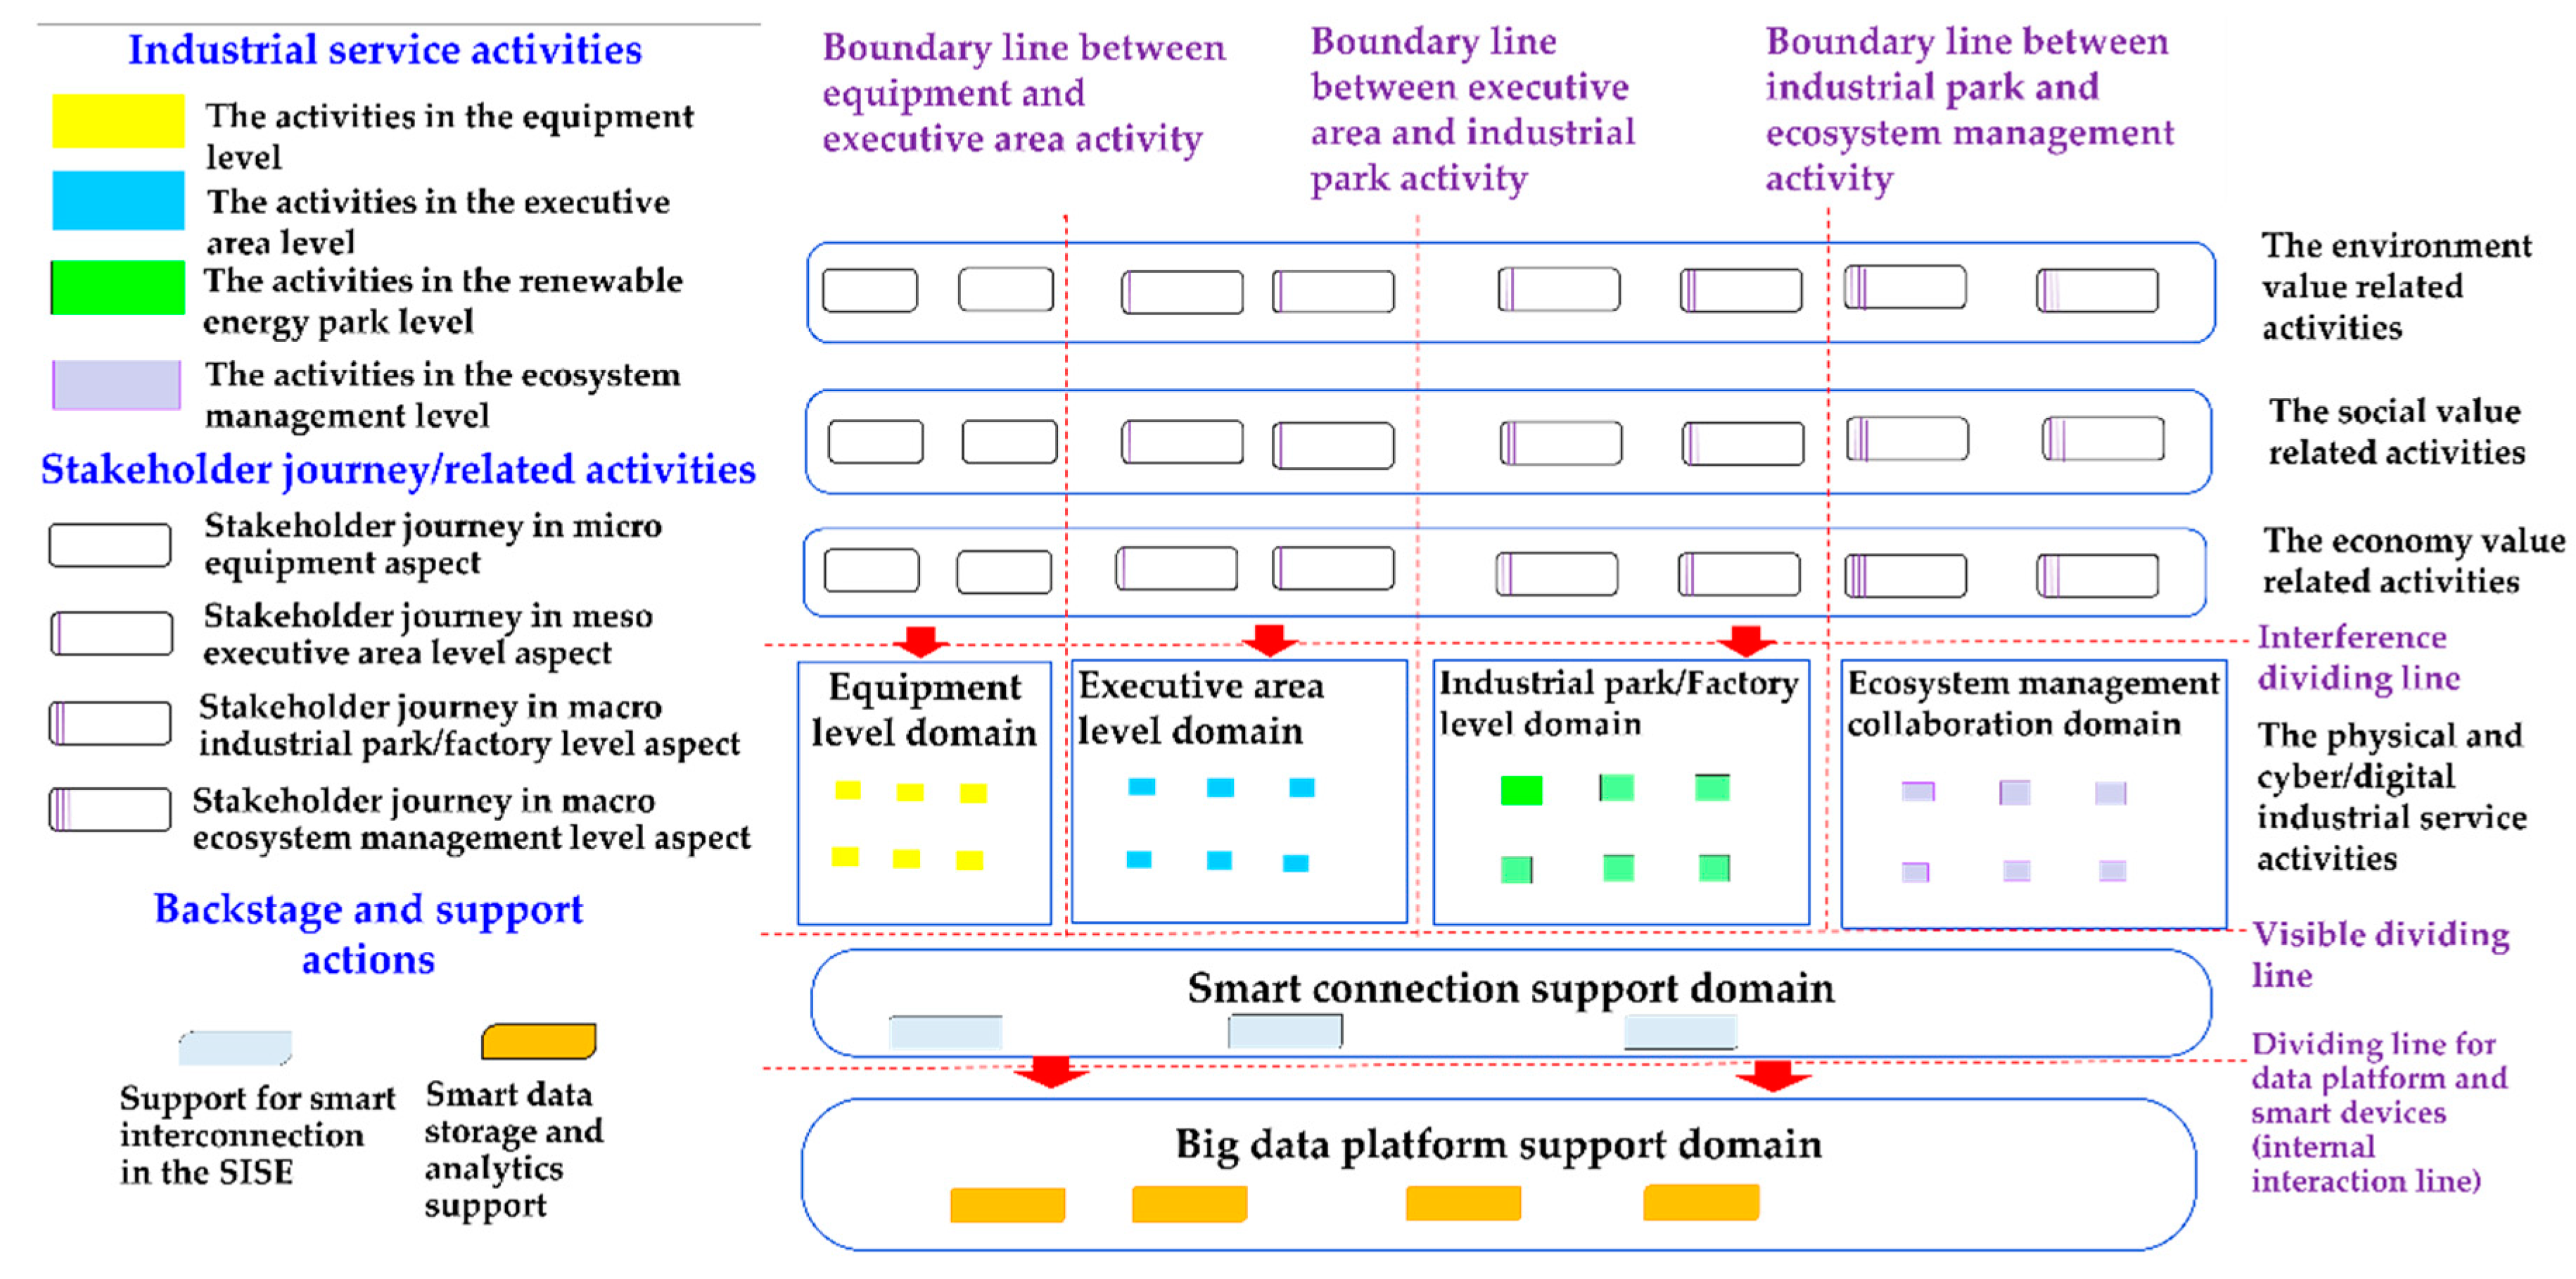
Figure 3 shows the proposed SISIB model that contains three aspects and can be further classified into nine major domains.
The first aspect majorly contains the smart technologies that support the intelligence functionality of the SISE including the smart connection/device support domain and big data platform domain. The smart connection/device support domain contains the interconnection and real-time monitoring support for the industrial context. This domain can collect data from various operation activities in the industrial context. The digital twin models can be created by combining the installed equipment-based data and sensor data. The big data domain mainly describes data mining, storage, and feature extraction activities.
The second aspect contains the relevant operation activities at the various levels of the industrial context. This aspect can be classified into four domains corresponding to the industrial activities on equipment, processing line, industrial park, and more macroscopic enterprise management levels. The activities in the industrial equipment level domain are similar to product-level services, mainly including the smart services for the entire life cycle of equipment, such as smart monitoring, maintenance, and waste recycling. The SISIB model considers the detailed architecture of the complex industrial context compared with the product-level service blueprint. The service processes in the executive line domain contain the activities in a functional zone area, such as the production line in a smart factory or the electricity generation station in an industrial park. This domain is responsible for functional area optimization and workflow control. The service processes in the industrial park/factory level domain are mainly related to the industrial park integration for sub-ordinated functional areas. The service processes in the ecosystem management level domain are related to the holistic management of the SISE. This domain describes the management of the context by the relevant industrial company and its cooperation with the outer connected world.
The third aspect contains the behaviors and actions of stakeholders in the industrial context. This aspect can be considered as an extension of customer activities description in the conventional service blueprint. In SISE, the service value co-creation exists in the stakeholder activities in the context located. The relevant stakeholders may have various actions in a complex industrial context. The stakeholders connected to the industrial context can be mainly classified into three types, including economy, social-related, and environment-related. In this study, identifying the actions of stakeholders can introduce their sustainable value propositions during the operation of industrial tasks. With the application of the proposed SISIB method, the various SIS components can be identified in SISE for further design. The next three subsections describe the principle of clustering the components into effective service modules.

3.3. The Smart Collaboration and Sustainable Correlation Evaluation Using the Hyperedge Method (Stage II)

Step 2.1: The relevant criteria for correlation between SIS components
The correlation degree between the service components should be taken into account after they have been identified. As the correlation criteria can show the relationships between SIS components and provide references for the following component clustering. The majority of the previous studies focused on the resource and function correlation among the service components [11]. Z. Yin et al. [15] used the function, resource, class, and process correlations as the reference criteria for service modularization of a computer numerical control (CNC) machine service system. Chen, Z. et al. [13] mentioned that the evaluation criteria for correlation between service components should contain service-flow, function, and resource aspects. With the wide spread of digital and information technology, the SISE has transformed into a more holistic and multiple-level form. Moreover, sustainable development should also be considered when designing the SISE. Therefore, based on previous articles this study proposes the concept of smart collaboration and sustainable development standards to measure the correlation between service components.
These four criteria are described as follows:
(1)
Smart data flow correlation: The SISE contains several components in the background smartness and data support part domain. The components that have interactions in data and information can be seen as correlated to smart data flow, including smart interconnection, real-time monitoring, and operation data flow.
(2)
Resource support correlation: In the operation of SISE, two or more related service components may be related to the same type of support resource. The support resources needed in SISE include equipment parts, operation technology management, and human resource management. The service components that require a certain type of resource can be considered to be aggregated into one service module to enhance the module functionality and improve the design efficiency.
(3)
Ecosystem level correlation: The SISE contains four levels of the functional layer, including a relatively microscopic product/equipment level that mainly focuses on equipment maintenance. The mesoscopic executive line/workstation level mainly focuses on the operation service for functional zones. The two more macroscopic park or ecosystem management levels are also considered in these criteria as some SIS components are related to more holistic system process management.
(4)
Sustainable value proposition correlation: Since various stakeholders may be involved in the SISE service process, their value propositions can exceed ordinary economic benefits. Therefore, this criterion is especially important for the SISE design. The components that have a value proposition related to economic, social, or environmental improvement should be considered into one edge and aggregated into one service module.
Step 2.2: The correlation degree evaluation for the SISE components
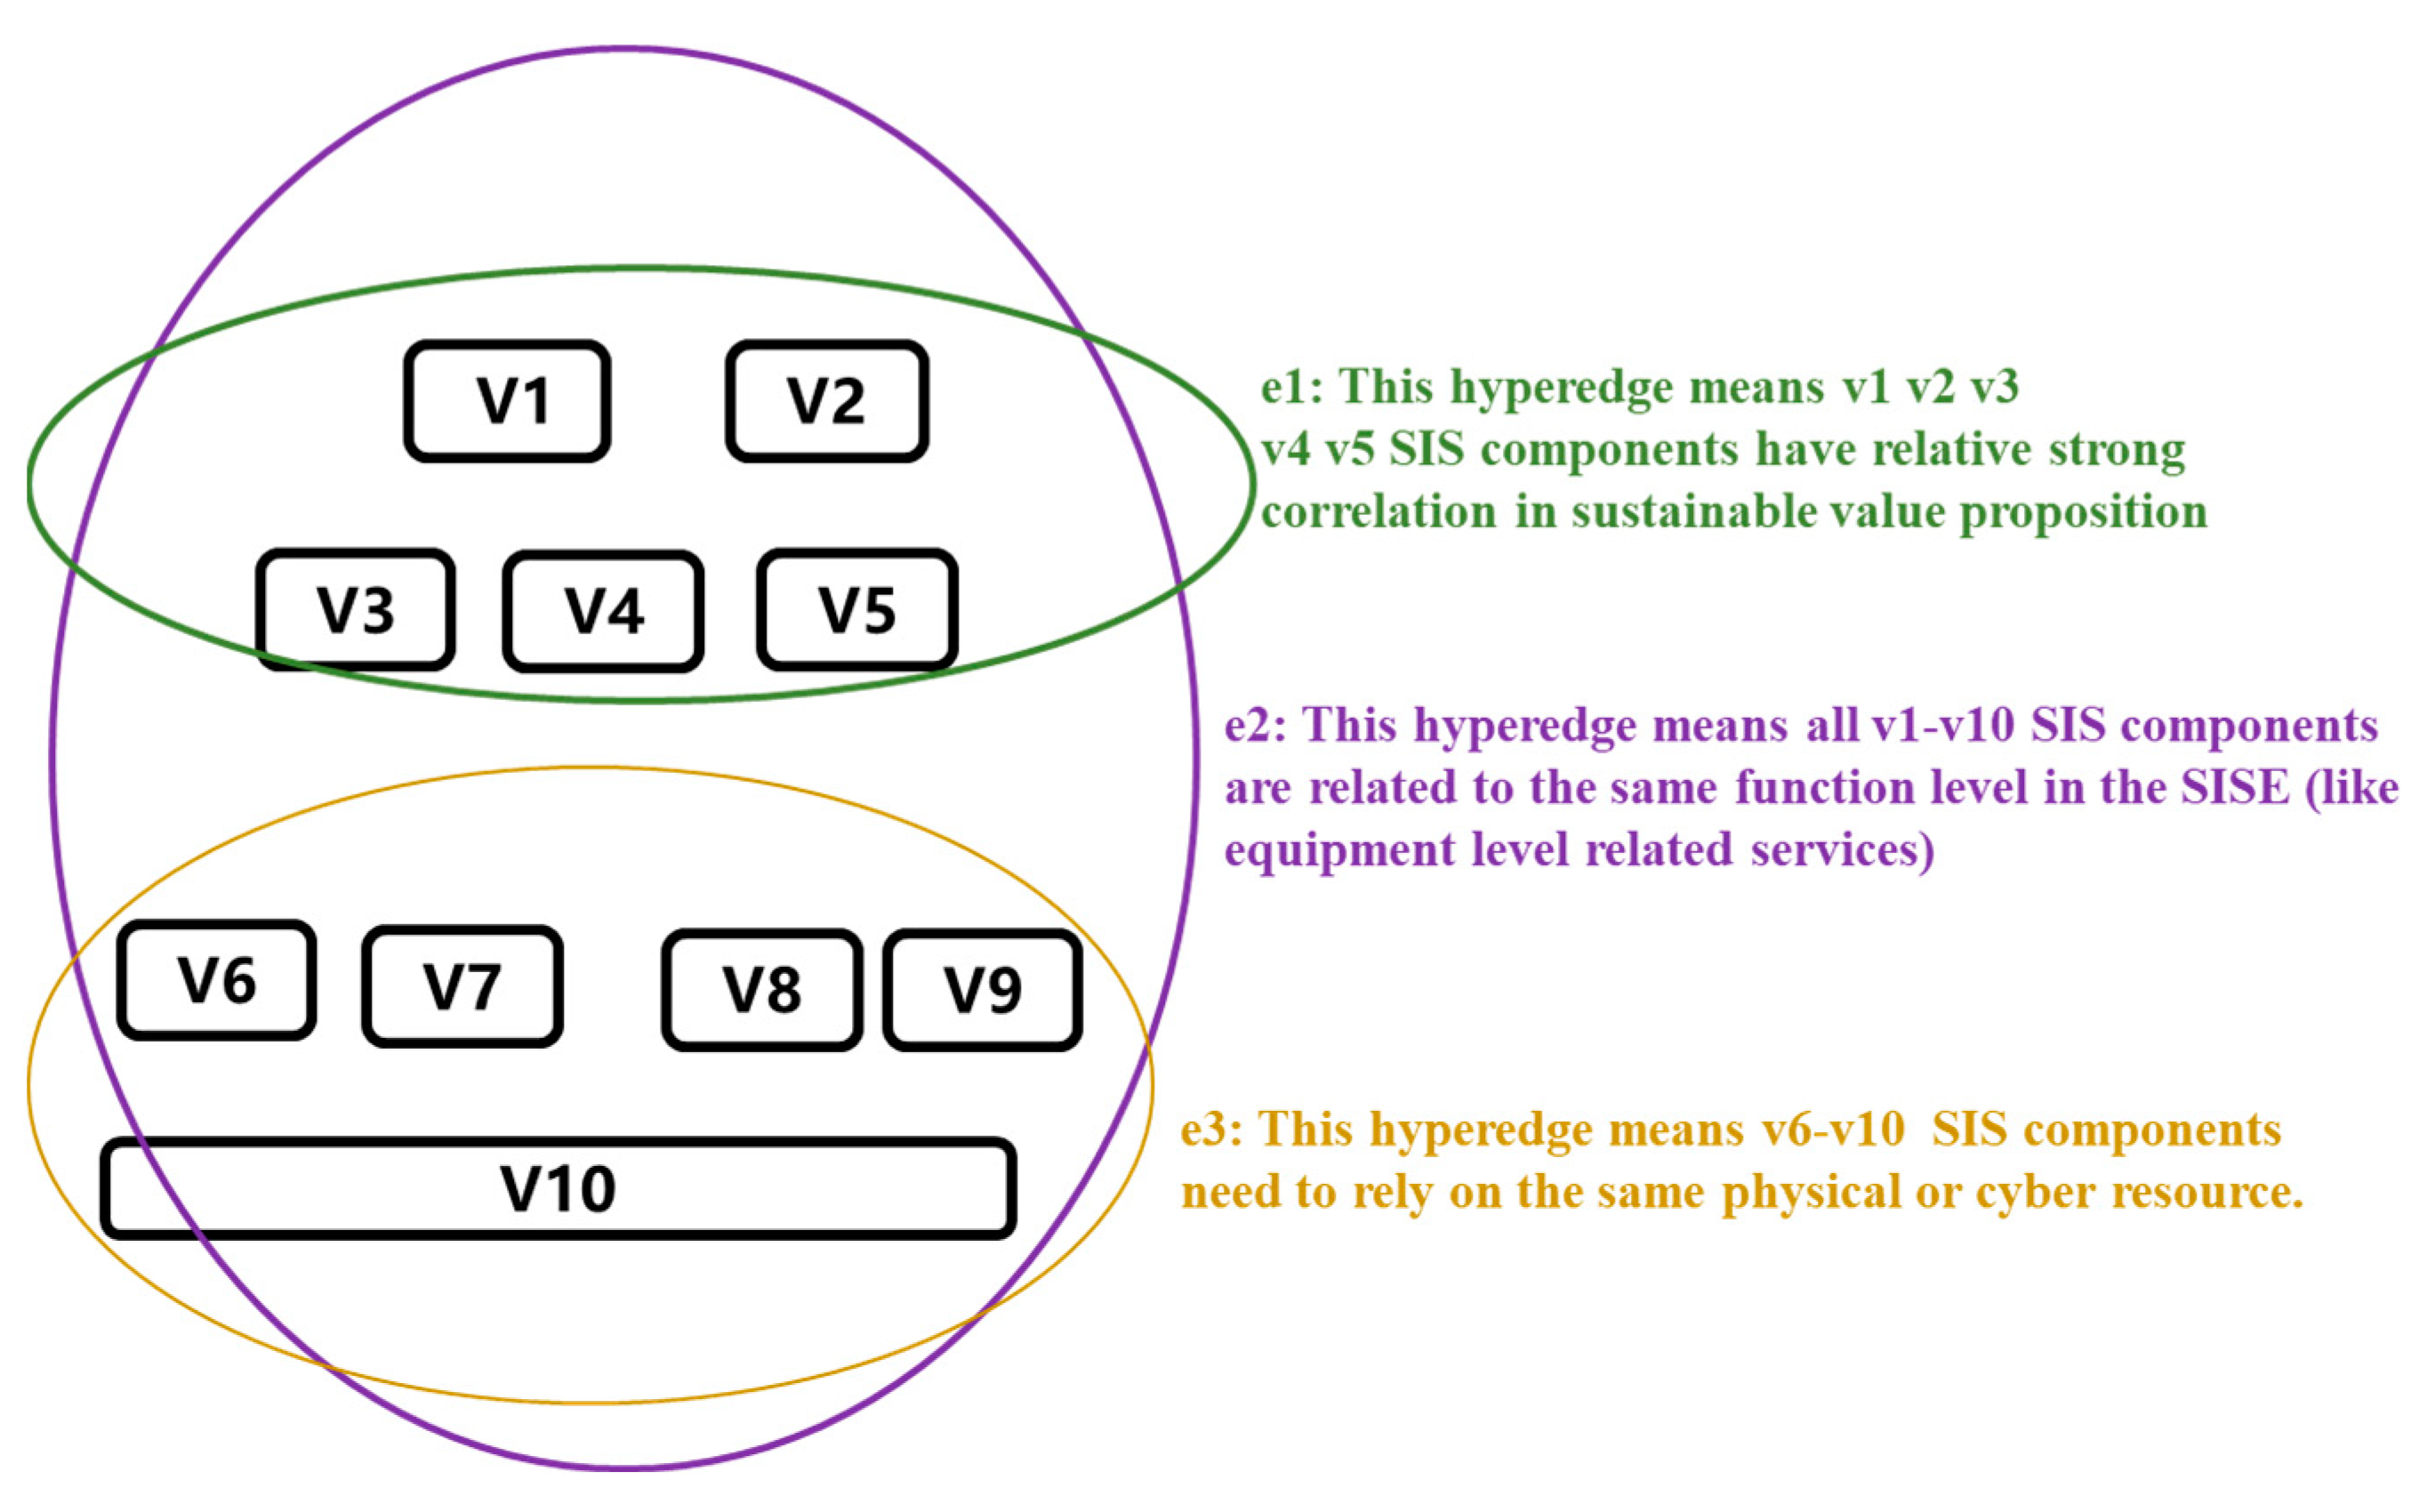
In SISE, the interference between SIS components is complex, and there are up to four potential interrelationships that exist between components. The two service components that are not in the same domain may especially contain a strong correlation. For example, the statistics for industrial station pollution and station operation data collection support are from different domains, but both are SIS components that are related to executive lines and have a strong correlation. Therefore, due to the characteristics of SISE, the correlation between service components is more complex than in a traditional smart IPS2 system. Compared with the traditional graphs that compare the correlation criteria of service components in pairs, the hypergraph can cover more components and represent the correlation criteria between them. According to the four correlation criterion types, four colors of hypergraphs are applied for the correlation evaluation. The red, yellow, purple, and green colors represent the relevant service component correlation from the smart data flow correlation, resource support correlation, system function level correlation, and sustainability correlation. Figure 4 shows a simple example where three hypergraphs are applied to systematically reflect the relationship between ten components. Note that each hyperedge mentioned here corresponds to a type of correlation criteria.

3.4. The SIS Component Partition Principle under the Relevant Hypergraph Theory (Stage III)

Step 3.1 Definition of the hypergraph and the correlation evaluation input
In this stage, a hypergraph model is constructed for the network relationship description among identified service components. The ordinary graph can only describe the pairwise relations between the identified service components, and each edge contains just two vertices. The hypergraph is an extension of the ordinary graph model and can effectively handle complex relationships among SIS components. If the degree of hyperedges is restricted to two, a hypergraph will degenerate into a simple graph.
Suppose G h = V , E ,   ω is defined as a hypergraph model, where V represents a finite set of service components as vertices and E represents the hyperedge set, in which each hyperedge is assigned with a weight value w ( e ) [68]. The amount of weight w ( e ) is defined as the sum of the vertices of each column. Here, W is used to describe the diagonal matrix of the hyperedge weights.
Some matrices need to be defined to mathematically analyze the hypergraph [69]. A hypergraph can be described using an initial incidence matrix Hi, which can intuitively reflect the relationship between service components. The classic initial incidence matrix Hi is defined as Equation (1) [70]:
H i = h ( v , e ) = { 1 , i f   v e 0 , v e
However, the classic H matrix definition can only provide a single option on whether a service component belongs to the hyperedge or not. The classic initial incidence matrix cannot effectively handle linguistic vagueness and decision uncertainties in real design circumstances. Therefore, a modified initial incidence matrix Hi is used in this study to describe the relationships with service components and constructed hyperedge. To better comply with the vague linguistics from service design experts, the triangular fuzzy number [71] is used to describe the edge strength. The relationship correlations among service components can be divided into very strong correlation, fairly strong correlation, and slightly strong correlation as shown in Table 2.
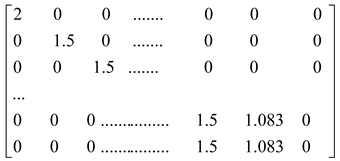
Therefore, the initial incidence matrix Hi in this study is defined as:
H i = h ( v , e ) = 2 ,   i f   v e , a n d   e d g e e V S C 1.5 , i f   v e , a n d   e d g e   e F S C 1.083 ,     i f   v e , a n d   e d g e   e S S C   0 , o t h e r w i s e
This allows design experts to consider not only the types of correlation criteria but also the intensity of their relevance when evaluating the relationship between service components.
According to the definition of Hi, the degree Dv of a vertex v V (each vertex represents a service component) is defined as [70]:
d ( v ) = e E w ( e ) h ( v , e )
For a hyperedge e E , its degree is considered as the count of vertices (components) it contains and can be defined as:
δ ( e ) = v V h ( v , e )
In this study, Dv, De, and W are used to denote the diagonal matrices of the vertices, the hyperedge degrees, and the hyperedge weights, respectively. The scored initial incidence matrix Hi can effectively describe the vertex-to-hyperedge relationships with the hypergraph. However, it still has limitations in representing vertex-to-vertex relationships [72]. The initial incidence matrix Hi can reflect the correlation relationships between SIS components but is not clear about component clustering. The next two steps describe the clustering of SIS components using the hypergraph partition principle.
Step 3.2. The normalized hypergraph cut principle and relevant partition aim
Each vertex in a hypergraph represents an SIS component. This section explains the hypergraph normalized cut principle based on the initial incidence matrix Hi and the related formalization of the natural partition. A subset S V is defined to represent a cluster of vertices that belongs to the hypergraph G = ( V , E , w ) , and the rest is divided into S P . The vertices of a hyperedge e can be simultaneously divided into S and S P . Therefore, a two-way partition and the volume of S ( v o l S ) can be defined as:
H c u t ( S , S P ) = v o l S = e S w e e S e S P δ ( e )
The edges in such an imaginary subgraph are referred to as sub-edges to prevent confusion. Additionally, all the sub-edges are assigned the same weight w ( e ) / δ ( e ) during each cut. In service modular clustering, a partition is obtained where the service components are of high density, and the connection between two partitions/clusters is sparse [70]. Using this clustering principle, the partition function can be formalized as:
arg min M ( S ) : = v o l S ( 1 v o l S + 1 v o l S P )
where v o l S and v o l S P are the volumes of S and SP and are defined as v o l S = v S d ( v ) and v o l S P = v S P d ( v ) , respectively.
Step 3.3. The random walk explanation and the partition for SIS components
This section introduces the principle of random walk, which is considered an effective method of graph clustering. By considering their importance, this principle can be effective in terms of randomly shifting to its neighbors [73]. We set u V , with u denoting the probability proportional to ω e , and randomly chose v as a vertex belonging to hyperedge e uniformly. Therefore, the transition probability matrix (T) of this hypergraph random walk can be defined as: t ( u , v ) = e E w ( e ) h ( u , e ) h ( v , e ) d ( u ) δ ( e ) . Note the stationary distribution π and current position are π ( v ) = d ( v ) v o l V   π ( u ) = d ( u ) v o l V It can be defined from Equation (6) that
M ( S ) : = v o l S v o l V ( 1 v o l S / v o l V + 1 v o l S P / v o l V ) = u S v S P π ( u ) t ( u , v ) ( 1 π ( v ) + 1 π ( v ) ) = u S v S P e E w ( e ) 2 d ( u ) d ( v ) h ( u , e ) δ ( e ) h ( v , e )
Here, referring to the partitioning principle [74], minimizing Equation (6) can be considered an NP-complete problem. The M(S) description can be computed as:
arg min M ( S ) = arg min 1 2 e E u , v e w ( e ) δ ( e ) f u d ( u ) f v d ( v ) 2
= 1 2 e E u , v e w ( e ) h ( u , e ) h ( v , e ) δ ( e ) 2 ( f u 2 d ( u ) f u f v d ( u ) d ( v ) )   = u V V f u 2 e E V u , v e f u w ( e ) h ( u , e ) h ( v , e ) f v d ( u ) d ( v ) δ ( e ) = f T L f
where the hypergraph Laplacian matrix is computed as: L = I G , and I is equal to the identity matrix.
Where the G matrix is defined as:
G = D V - 1 / 2 H W h D e - 1 H T D V - 1 / 2
The principle of hypergraph clustering is introduced in this task. The related process is relatively complex, but it can be briefly understood to gain the Laplacian matrix to display the partition result. The core mechanism of hypergraph clustering is to realize the best clustering solution through the random walk principle, which requires an effective algorithm to compute, such as the K nearest neighbors (kNN) method. Section 3.5 next describes the detailed method for the computing of clusters from the new fused Laplacian matrix.

3.5. The SIS Component Clustering and Service Module Generation for SISE (Stage IV)

Stage IV of the framework considers the service module generation and modularity check in SISE design. This subsection introduces the kNN to act as an effective method to realize the “random walk cut process” in hypergraphs [39] and form the fused hypergraph Laplacian matrix. The component clustering using the k-means algorithm and the hypergraph modularity criteria for design quality measurement are also introduced.
Step 4.1: The kNN algorithm for constructing the hypergraph Laplacian matrix
The kNN algorithm acts as an absorbing implementation of the random walk for hypergraph normalized cut. Under the kNN method, the Euclidean distance is first calculated between the hyperedges in the initial ranking incidence matrix Hi, covering each row of the matrix. One SIS component (vertex) is chosen at random to serve as the centroid point for each iterative process of the random walk, and a related cut hyperedge eck connects the centroid with its k-nearest neighbors, while each cutout hyperedge is constructed by connecting the nearest K neighbors of one SIS component (vertex point) [75]. In this study, K is set as the common value of ten. Under this circumstance, the amount of hyperedges formed is the same as the number of service components (vertices). The new fused hypergraph incidence matrix Hck is in n*n form, where n equals the number of the SIS components. This stage aims to discover the vertices with stronger connections on the hypergraph. The incidence matrix Hck [19] of the hypergraph describes the connections between the vertices and the hyperedges and can be shown in Equation (8).
H c k ( v , e c k ) = exp ( d ( v , v c k ) 2 d ^ 2 )   if   v e c k 0     if   v e c k
In Equation (8), d ( v , v c k ) represents the Euclidean distance between an SIS component and the centroid SIS component in hyperedge e, while d ^ is the average distance between the components. After the newly fused H c k is gained, following Equations (3) and (4) the relevant vertex degree d ( v ) and hyperedge degree δ ( e ) can be updated as:
d ( v c k ) = e c k E w c k ( e c k ) h c k ( v , e c k )
δ ( e c k ) = v V h c k ( v , e c k )
Let the D v c k , W c k , and D e c k represent their diagonal matrices form; then, the new fused Gck matrix can be computed following Equation (7) from Section 3.4. With the kNN method, the new unified hypergraph and related Laplace matrix L c k can be obtained, which represents the clustering result.
Step 4.2: Components clustering visualization and service module formulation using the k-means algorithm
After the new fused Laplace matrix L c k is obtained, we compute the eigenvector corresponding to the smallest non-zero eigenvalue of the matrix. The eigenvectors are computed as λ1, λ2 …… λk. After that, the eigenvectors corresponding to each service component are arranged as the input of the k-means algorithm. These eigenvectors relating to the vertices are typically assumed to be well separated. We can create a good partition by simply applying k-means to those eigenvectors once, and this method is applied to realize modular clustering [19]. In this study, PyCharm software (Version 2022.2) was used to compute the result. The clustering point number in k means algorithm can decide the amount of the service module generated. The objects closest to these points are clustered around and then classified. An iterative process is used to incrementally update the value of each cluster center until the best service component clustering result is attained. The clustering of highly correlated SIS components forms effective SIS service modules. The final results include both visualization and specific classified output.
Step 4.3: The quality measurement for the modular design using hypergraph modularity criteria
To validate the results of the modular design framework in this study, this subsection computes the modularity for the clustering output. The modularity concept was presented by Newman [76]. This concept is widely used to measure the cluster quality and the effectiveness of the modular design. For an undirected network in the ordinary graph, the classic definition of modularity is expressed as:
Q = 1 2 m i j [ A i j P i j ] δ ( s i , s j )   where   P i j = k i k j i k i = k i k j 2 m
where Pij stands for the expected edge number among nodes i and j, while Ki and Kj mean the degrees for nodes i and j, respectively. δ ( s i , s j ) stands for the Kronecker delta symbol, which equals 0 when i/j nodes are not in the same community and equals 1 when i/j nodes are in the same community. Combined with the characteristics of the hypergraph, the modularity equation Q h y p for a hypergraph clustering is defined as [77]:
Q h y p = 1 2 m i j [ A i j h y p P i j h y p ] δ ( s i , s j )
The corrected adjacency matrix for hypergraph clustering is defined as:
A i j h y p = H c k W c k ( D e c k 1 ) 1 H c k T
where H c k , W c k , and D e c k are the new fused incidence matrix, weight matrix, and hyperedge degree matrix gained in step 4.1, respectively. The definition of P i j h y p and the Kronecker delta part δ ( s i , s j ) are similar to the ordinary graph. The value of δ ( s i , s j ) is defined by the cluster results. The modularity falling from 0.3 to 0.7 implies that the SISE modular design has a strong community structure.

4. Case Study

A real-world case study is proposed to confirm the framework’s feasibility and applicability. The framework is applied to the modularized service design of a smart renewable energy service ecosystem (SRSE). Company E is a world-class renewable energy service solution provider committed to providing relevant stakeholders with service modules according to their requirements and sustainable development policy. Company E has transformed its strategy from wind/solar equipment service to a more holistic renewable energy industrial park service. Our case research is focused on a renewable energy park of Company E. We employed the purposive sampling (judgmental sampling) in the case survey study (the researchers depend on their own opinion and judgment when choosing who will participate in the study). This is because the SISE model of this study is designed to face detailed technical service requirements for an industrial context, which requires relevant service design experts to complete the conception and design. The situation of six relevant experts is introduced in Section 4.1. In this study, the case renewable energy park studied is located in Jiangsu Province, southeastern China, and contains 15 MW of total installed capacity, including 8 MW of wind power generation capacity and 7 MW of photovoltaic solar electric power generation capacity. The case study includes three steps to realize the fully modular design process including the identification of the related forty-six SIS components, evaluating their correlation in terms of maximizing functionality and sustainability, and clustering high-correlation components to generate service modules.

4.1. Identification of SIS Components for Smart Renewable Energy Park Service System (Stage I)

This section takes the real service process and resource integration of the smart renewable energy industrial park of Company E into consideration. The proposed SISIB method is applied to display the holistic service process in the renewable equipment, photovoltaic wind farm station, renewable electricity industrial park, and ecosystem collaboration levels. In this study, a team of six experts from Company E conducted the service component identification from real service requirements in the park and conducted the following correlation evaluation, including two experienced senior engineers in the operation and maintenance of wind turbine photovoltaic equipment, two experts in station maintenance, and two experts in energy park holistic management. The identification results in Figure 5 show that the forty-six components (Vs) are distributed in various domains and their functional levels are quite different. These service components represent the service activities from reality service requirements in the real operation of wind turbines/photovoltaic equipment and the operational management requirements at the station/park level. Table 3 shows that SRSE components are identified with the proposed blueprint method and explains relevant representative smart functions. Compared to the edge that can only connect two components in the ordinary graph, the hyperedge is more applicable and efficient to handle these circumstances. In the following Section 4.2, the hypergraph theory is applied to realize the correlation analysis and evaluation of the components.

4.2. Smart and Sustainable Correlation Relevance Evaluation for SRSE Service Component (Stage II)

Step 2.1: The relevant criteria for correlation between SIS components
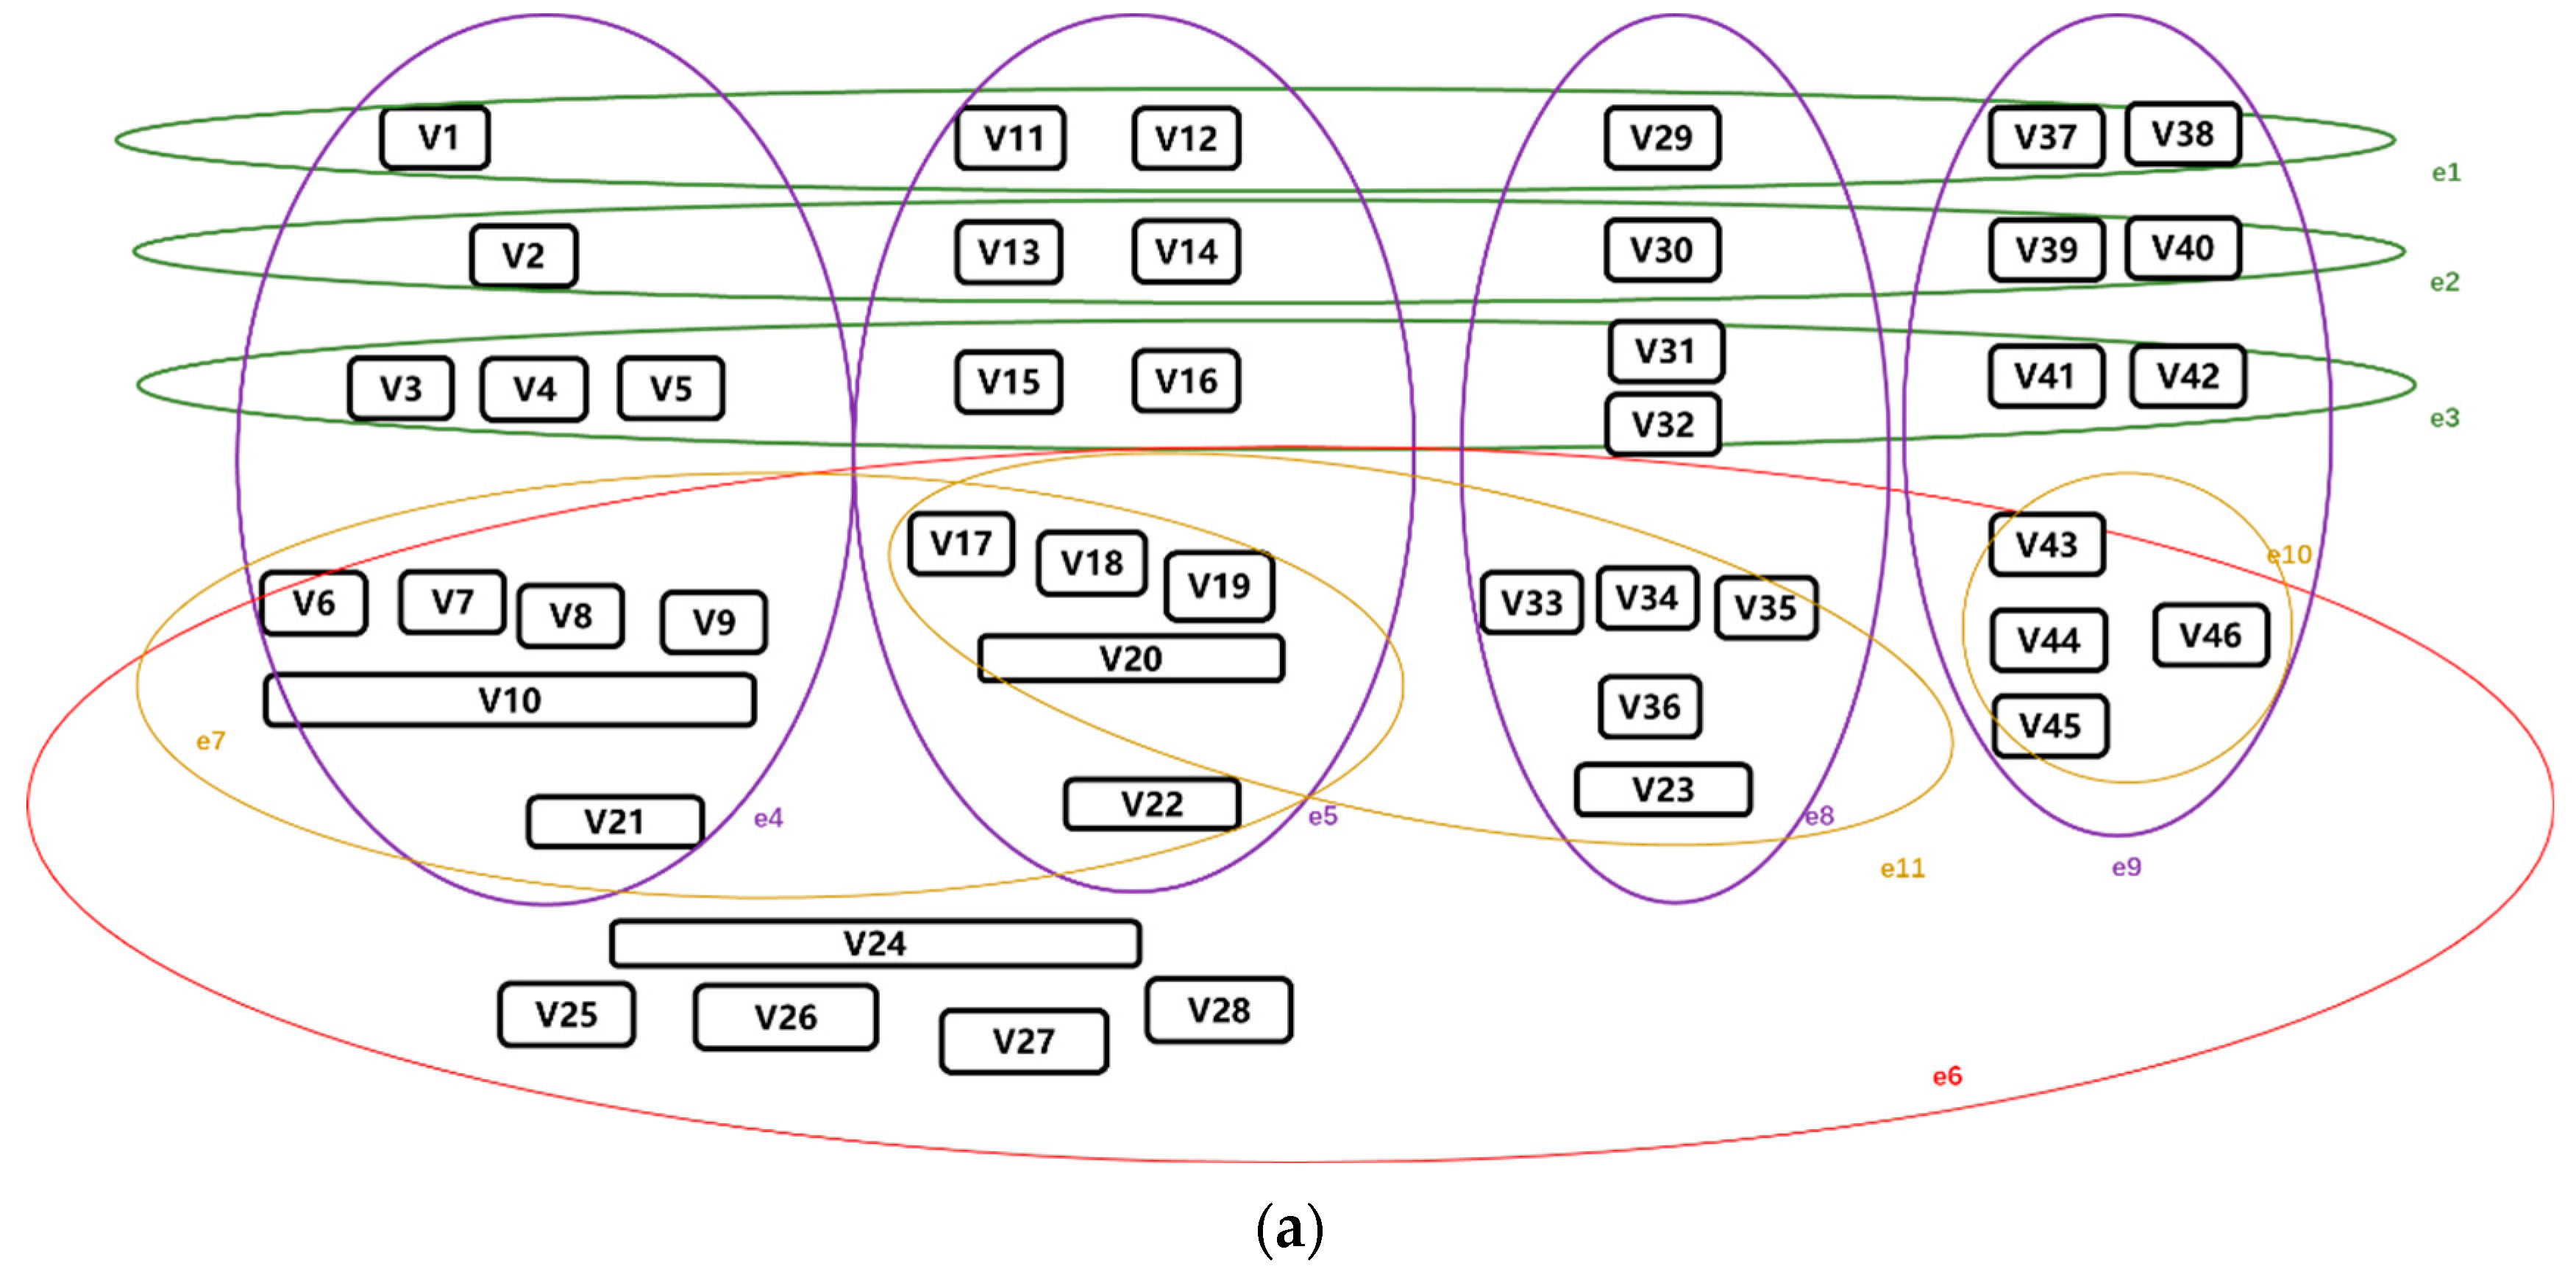
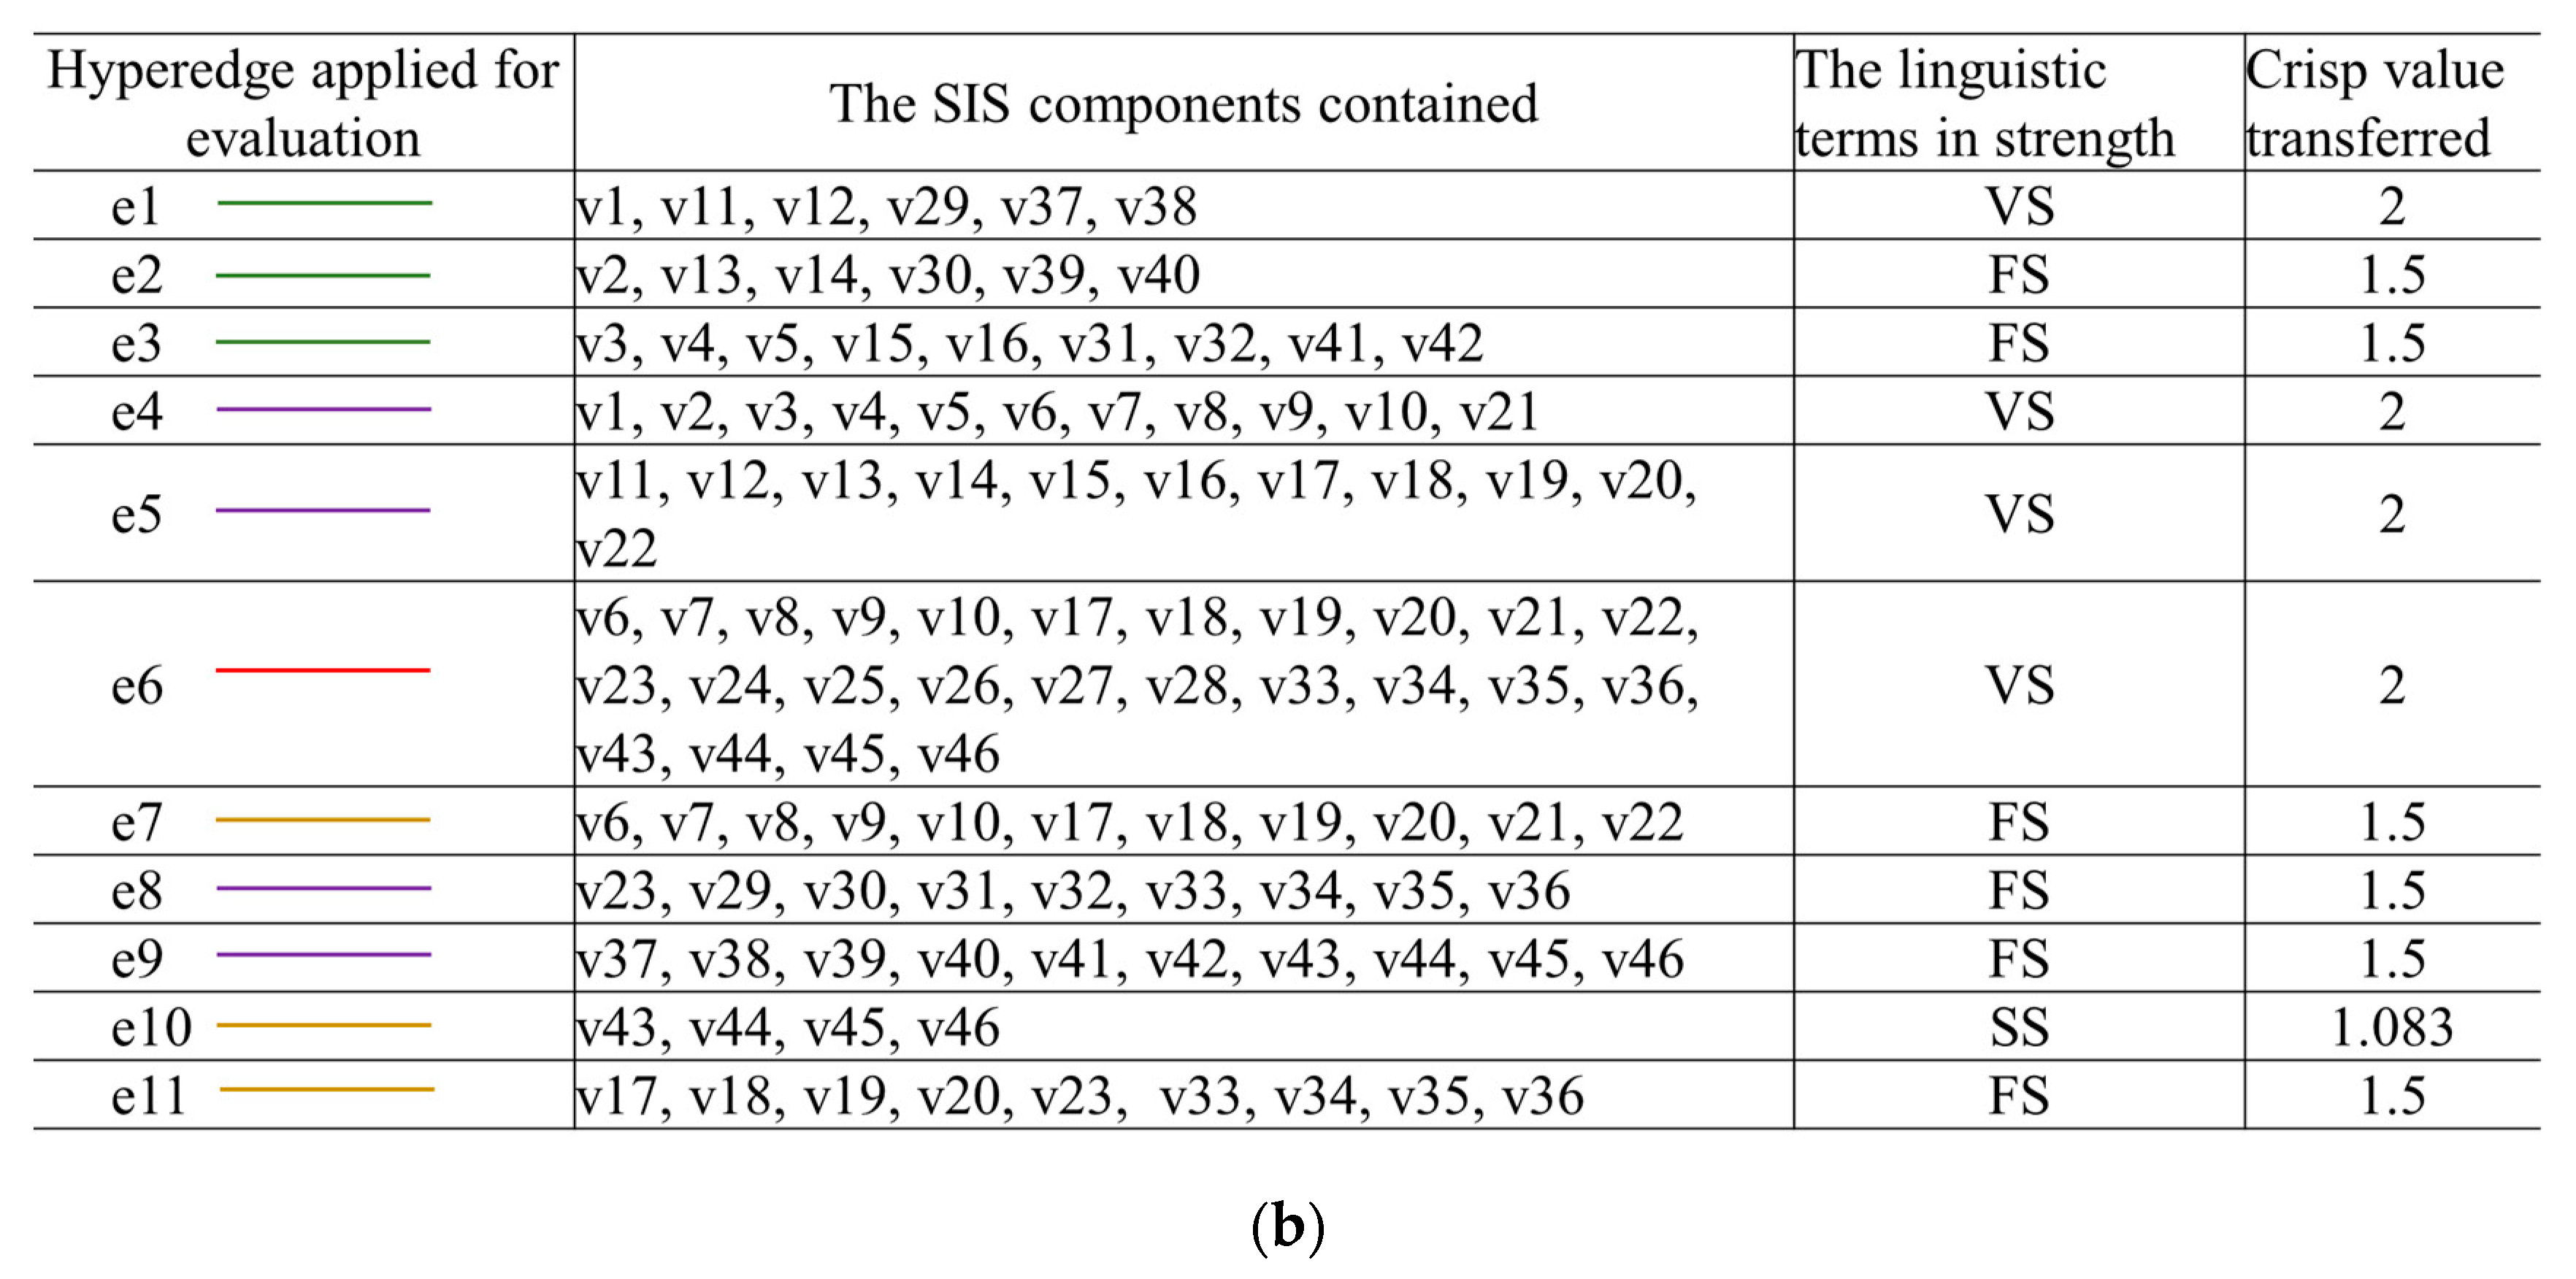
The SISIB applied for smart renewable energy industrial parks can display the distribution of the service components in the actual service process. The correlation between the SIS components listed in Table 3 is addressed using the fuzzy hyperedge theory. Figure 6a shows that 11 hyperedges are covering all relevant SIS components and involves four kinds of correlation criteria. The experts synthesized their evaluations, and the strength of each hyperedge is described in Figure 6b.
Step 2.2: The correlation degree evaluation result for the SRSE components
In Figure 6a, the red e6 hyperedge stands for the smart data flow correlation in the renewable energy park, which is the data generated during operation at all levels of the park, including the wind and photovoltaic solar panel equipment operation, and interconnection and visualization at the station and park levels. These processes are related to the data flow in the operation of the park, and they all need the support of a big data platform. The four purple hyperedges (e4, e5, e8, and e9) represent the relevancy of service components at the system function level. For example, in hyperedge e4, V3 (wind/photovoltaic power equipment monitoring access), V6 (smart interconnection service of wind/photovoltaic power equipment), V10 (wind/photovoltaic power equipment digital twin model), and V21 (smart acquisition sensors) belong to the equipment operation and maintenance service. In hyperedge e8, V23 (industrial park holistic data query interface), V30 (industrial park security emergency response system), and V36 (industrial park virtual reality) belong to the renewable energy park level management service.
The three yellow hyperedges e7, e10, and e11 correspond to the set of components that need to be supported by equipment part resources, technical management resources, and human management resources, respectively. For example, in hyperedge e11, V43 (stakeholder expectation management), V44 (operation of enterprise resource management system), V45 (operation access management of industrial big data platform), and V46 (service value network management at ecosystem level) are all related to the company internal self-management and external stakeholder human relationship maintenance.
The three green hyperedges (e1, e2, and e3) represent the correlations that exist from the stakeholder sustainable value proposition perspective. For example, in hyperedge e1, V1, V11, and V12 are all considered to be components belonging to the concerns of environment-related stakeholders. These components reflect environment-related activities. Table 4 shows the hyperedges applied to form the initial hypergraph.

4.3. The Partition of SRSE System Modules Based on Hypergraph Clustering (Stages III and IV)
The correlation result analysis and partition principle are stage III of the case study.
Step 3.1: Gain the initial incidence matrix of the hypergraph as the correlation evaluation input
Following the definition in Section 3.4, the initial incidence matrix Hi is formed in Table 4 and can be described in a matrix form. Hi reflects the view of design experts; with Hi as an evaluation input, hypergraph clustering can be performed based on the relevance between SIS components.
Sustainability 15 08858 i001
Steps 3.2 and 3.3: Implement the normalized hypergraph cut principle and the partition for SIS components
With the hypergraph cut principle in Section 3.4, we know that in service modular clustering, a partition is created with a high density of SIS components and a sparse connection between two partitions or clusters. Therefore, it is essential to apply the random walk explanation in SRSE components and gain the hypergraph Laplacian matrix.
Proposing the detailed SIS component clustering and service module generation for SRSE is stage IV of the case study.
Step 4.1: The KNN algorithm for constructing the hypergraph Laplacian matrix
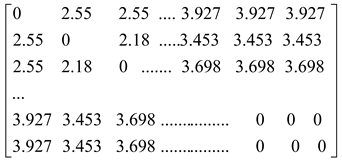
Following the KNN algorithm principle, calculate the Euclidean distance d ( v , v c k ) between an SIS component and the centroid SIS component in every hyperedge e. The Euclidean distance matrix can be formed as below.
Sustainability 15 08858 i002
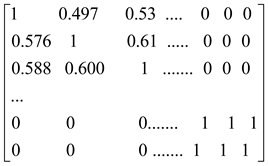
Following Equation (8) in Section 3.5 with the kNN algorithm as a random walk method, the new fused hypergraph Hck matrix can be described as:
Sustainability 15 08858 i003
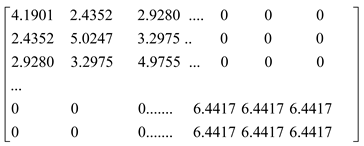
Note that the Hck matrix is a 46*46 form matrix. The number of rows and columns is the same as the number of SIS components. The sum of each column is the hyperedge weight. Then, using Equations (9) and (10) the D v c k and D e c k matrices can be obtained as below.
Sustainability 15 08858 i004
Then, using Equation (7) in Section 3.4, the new fused matrix Gck can be computed. After that, using the equation Δ = I G , the new fused Laplacian matrix Lck can be gained as:
Sustainability 15 08858 i005
Step 4.2: The component clustering visualization and service module formulation using k means algorithm
The fused Lck has an n*n structure, and n equals the service components. To realize the final clustering of the components, the 46 corresponding eigenvectors are computed and can be formed as an eigenspace.
Sustainability 15 08858 i006
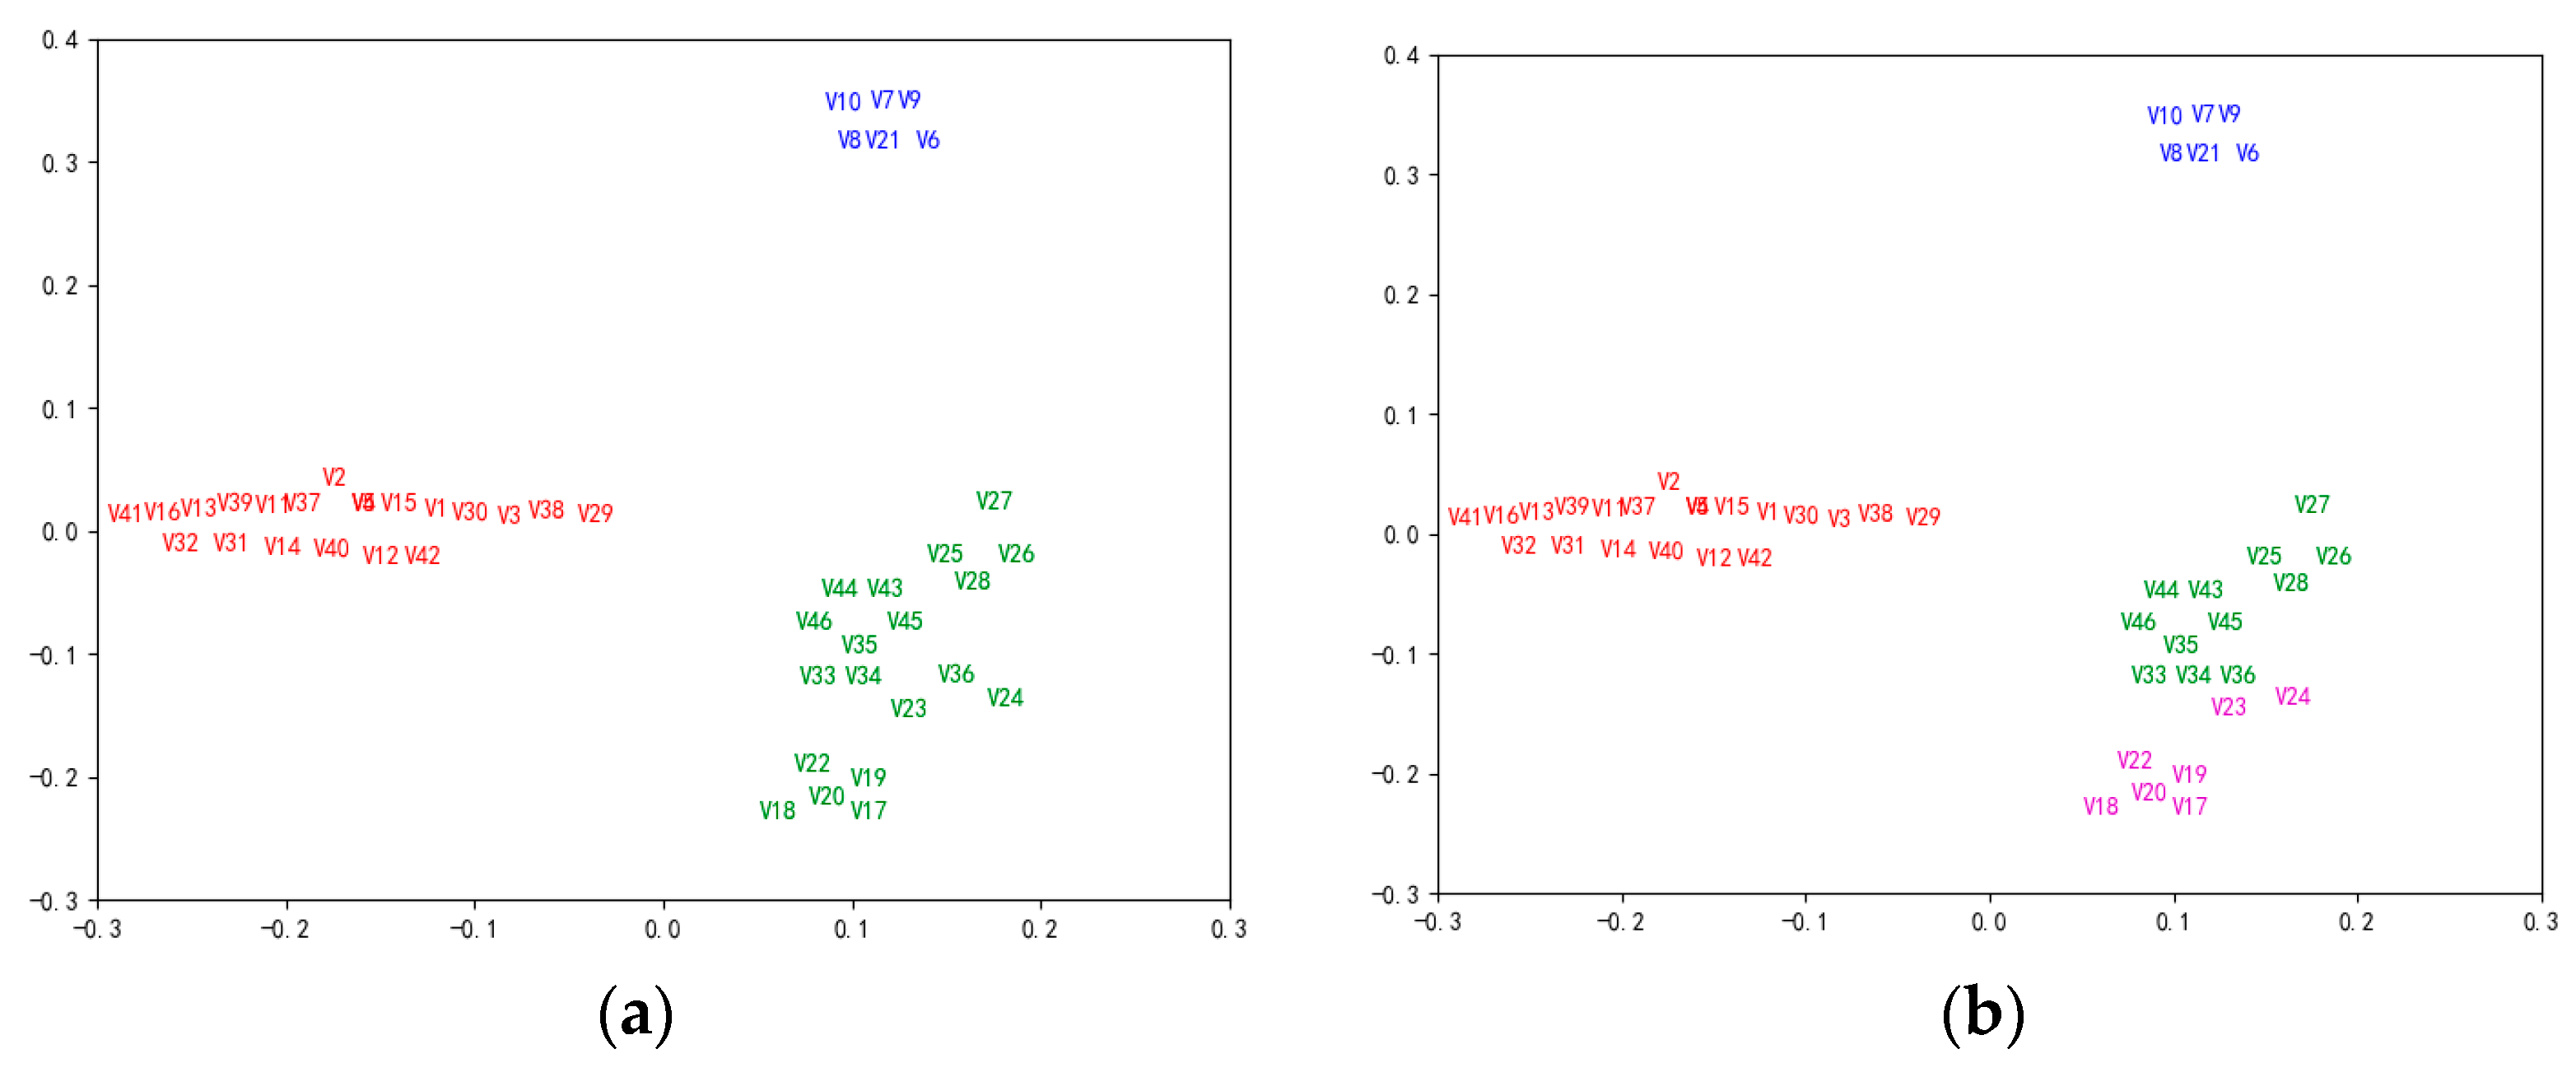
The k-means clustering algorithm is applied to the computed eigenspace to obtain the final clustering results for SIS components. In this study, the service modules identified are classified as groups, and each group has a representative color. For example, when the number of clusters in k-Means is set as 3 and 4, the visualized service cluster result is described in Figure 7. It should be noted that the horizontal and vertical axes in Figure 7 only show the numerical magnitude and do not have physical units. This is because the horizontal and vertical axes, respectively, correspond to the numbers of 46 corresponding eigenvectors (like v1 = −0.165 in the horizontal axis and 0.003 in the vertical axis), which are calculated from the new fused Laplacian matrix Lck. The names of the detailed vertices are generated in the python console and can be seen in modular division schemes.
Step 4.3: The quality measurement for a modular design using hypergraph modularity criteria
To better validate the quality of the service module classification. The hypergraph adjacency matrix can be computed using Equation (13) similar to below.
Sustainability 15 08858 i007
Then, we can compute the hypergraph modularity criteria according to modular division schemes using Equation (12).
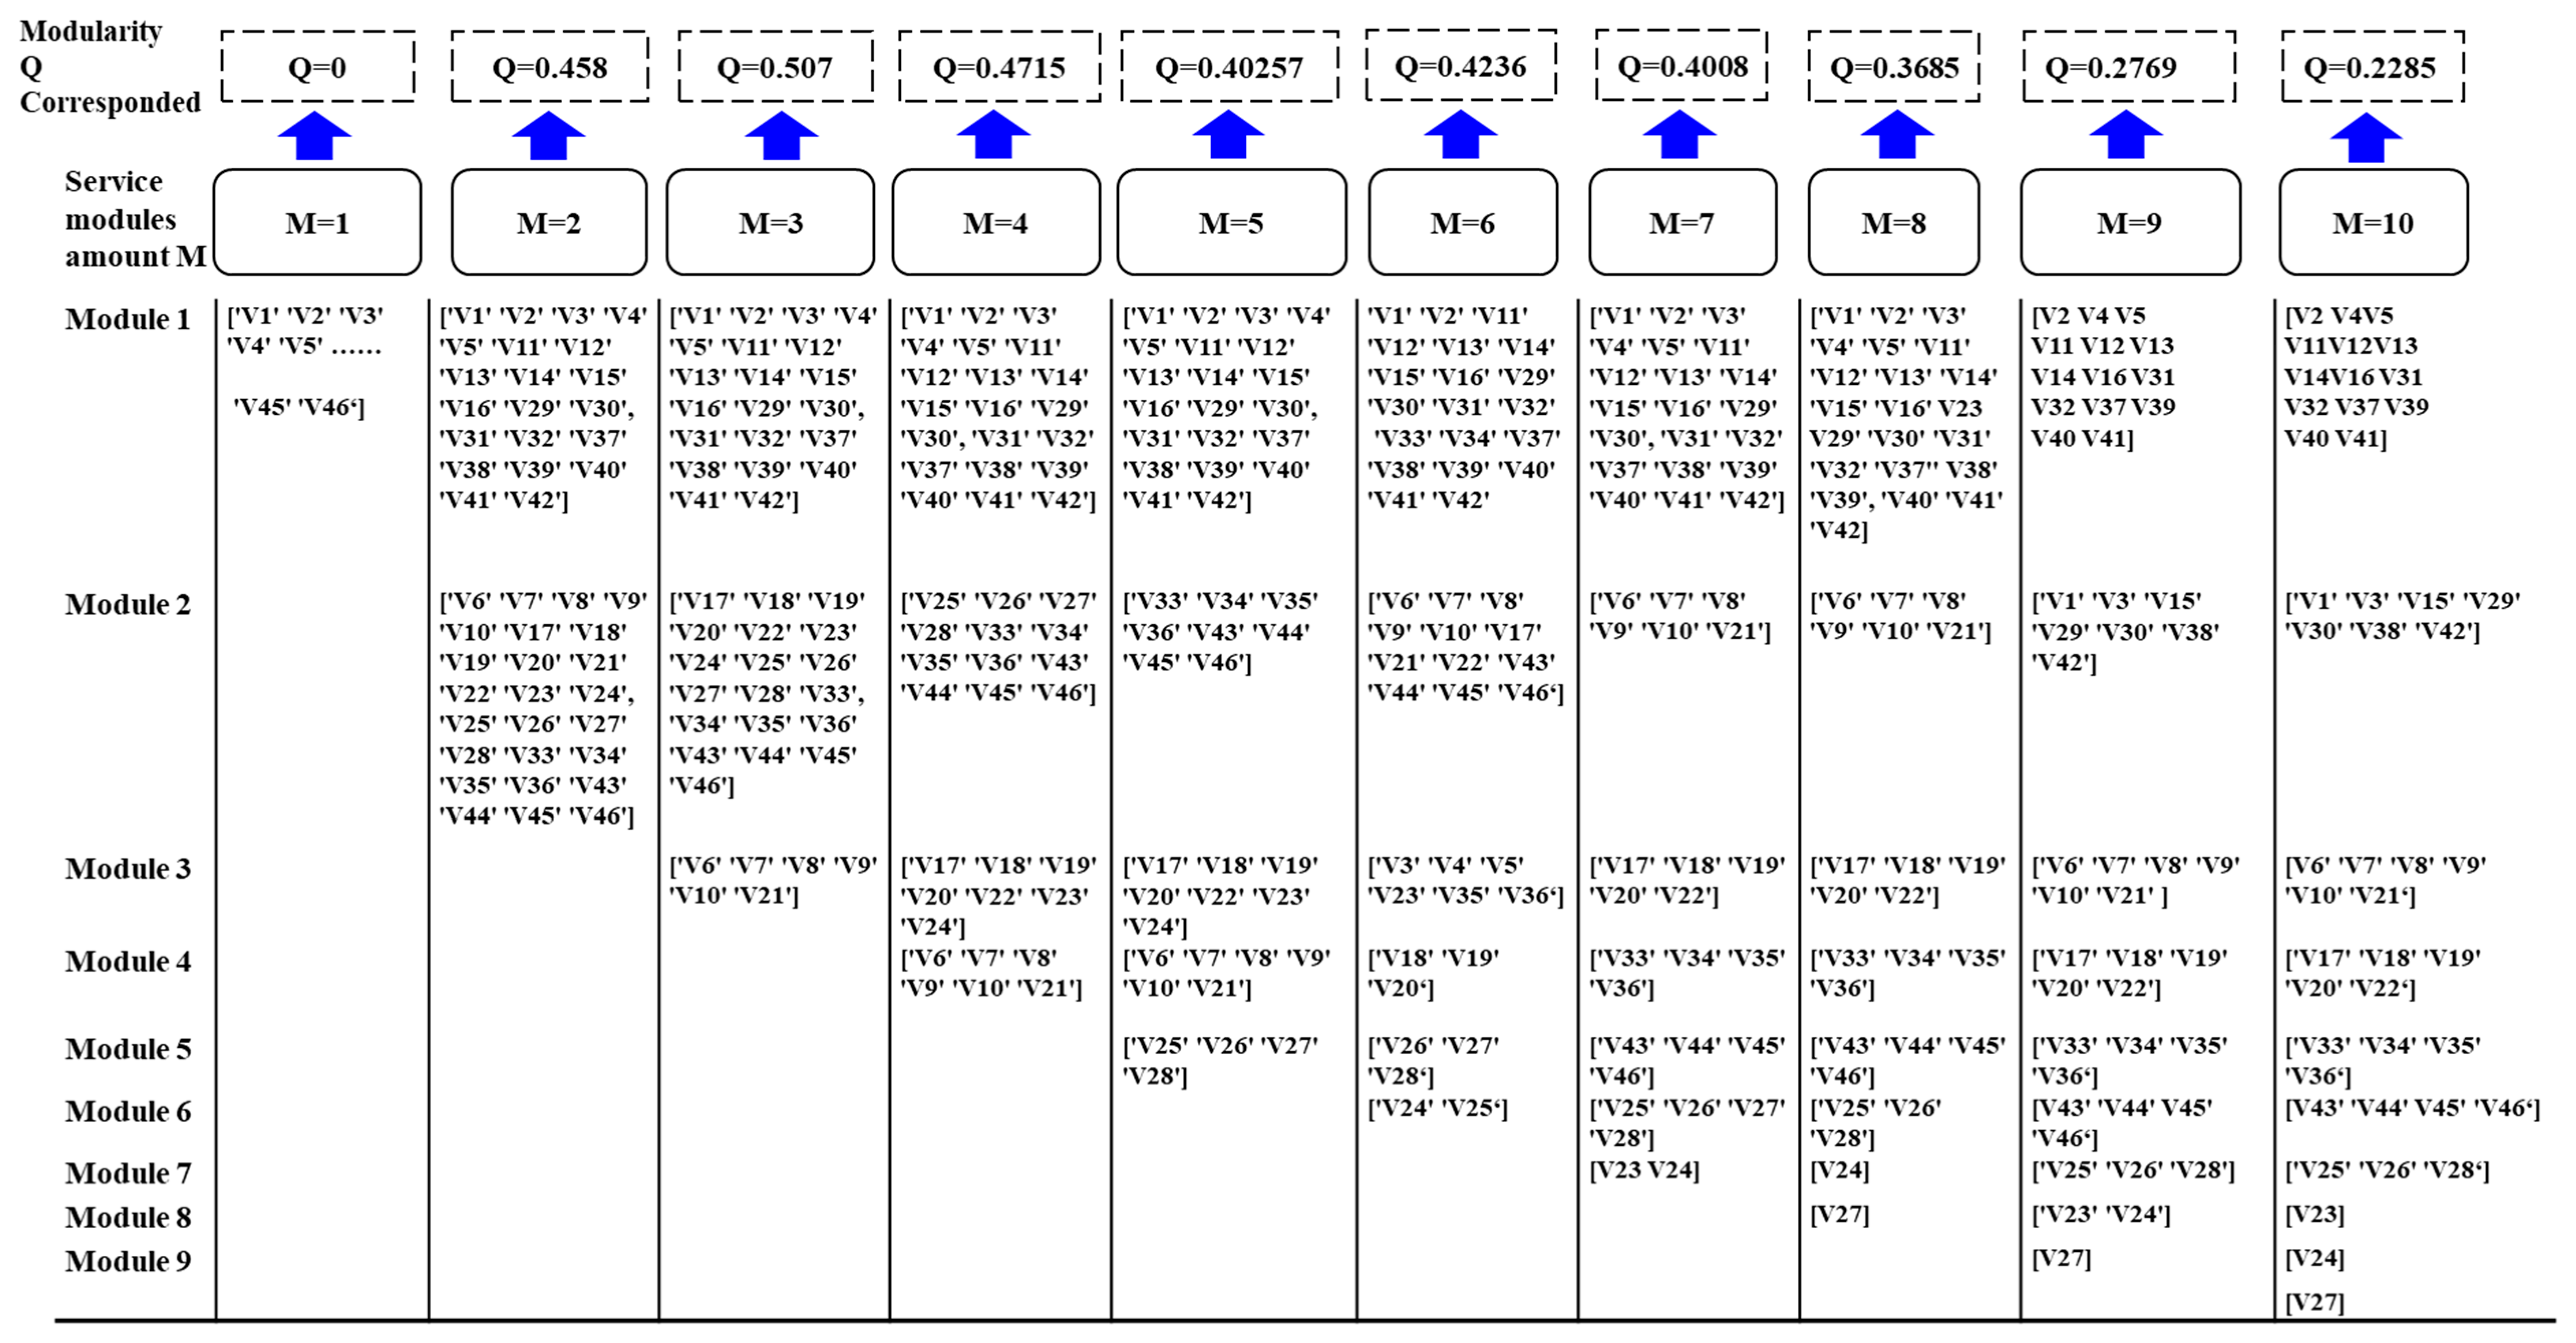
When the modular number is M = 3 its modularity Q3 equals 0.507, and the modularity Q4 = 0.4715/Q5 = 0.4025 when the modular number is 4/5. The modularity of these design schemes is greater than 0.3, which shows that the proposed framework is effective and has potential in service modular design, especially in complex service systems such as the SRSE. However, in order to select the best service module scheme it is essential to obtain the relationship between the modularity and service module numbers and find the scheme with the greatest modularity. The specific results analysis is described in Section 4.4, and the detailed division schemes are shown in Figure 8.

4.4. Findings of the Results and Comparisons

Modularization is considered to be an important strategy for efficiently organizing complex products, services, and processes [33]. The case study of the smart renewable energy industrial park demonstrated the effectiveness of the proposed framework. More macro-level service requirements were covered by a smart service solution such as the SRSE. The improved SISIB method avoids the limitations of the product-level service blueprint and can be used to realize more comprehensive and detailed SIS component identification.
In the following service component cluster of SRSE, the hypergraph theory is first applied to assist the modular design. The fuzzy hyperedges are applied for the correlation evaluation between SIS components and can better describe the many-to-many relationships between the SIS components. The SIS component partition through relevant hypergraph theory can generate smart service modules needed for the service company (renewable energy industrial park designer). It is found that the final clustering results do have some connections with the domains they belong to. This is due to the influence of hyperedge correlation evaluation on SIS components. The service modules formed may cross various domains, which shows the necessity of service modularization. The related results include both visualization and specific classified output. Figure 8 shows the corresponding modularity with the increasing module number. At the optimum partition scheme, a single global peak appears, and as the number of partitions increases, the modularity starts to decline. It is also observable that the modularity of the clusters can easily reach above 0.4, which shows the quality of the generated service modules. When the modularity is in the range between 0.3 and 0.7, the community has a good partition. In this study, when the modular number is M = 3 and M = 4, the highest modularity (Q3 = 0.507) and the second highest modularity (Q4 = 0.4715) are achieved, respectively. This means that for the case company the best modular design scheme can be achieved with three smart service modules.
The comparisons of the modular design effect between this study and previous articles are described in Table 5. To systematically reflect the advantages of this study, we chose four aspects as comparison criteria. Including two qualitative criteria (consideration of smartness and multi-level industrial context and visibility and clearance on service component identification) and two quantitative criteria (correlation evaluation simplicity and best modularity reached) to demonstrate the advantage of our framework. Compared to traditional DSM and product service blueprint modular design methods, this study can better identify the service components through the service operation process and also clearly reflect their distributions among various functional domains, which can better fit the smart and interconnected industrial contexts in real applications. Moreover, the framework in this study can make the subsequent specific module design process more concise and effective. With the hyperedge theory, only 12 hyperedges are needed to construct the correlation evaluation matrix, instead of analyzing 46 components in pairs. The maximum modularity reached in this study can exceed 0.5. The result is better than that of traditional graph theory. The network community division principle states that the better the community division, the bigger the value of Q [78]. This shows the effectiveness and big potential of the hypergraph clustering algorithm in service design.

5. Contributions and Implications

5.1. Theoretical Implications

The traditional product service blueprint presents the activities at product related level. Previous studies mainly focus on service ecosystem concepts or qualitative planning and design [80]. This paper presents a methodology based on context-based SISIB and hypergraph theory.
The key theoretical contributions of this study are summarized below. Firstly, this study conceptualizes the SISIB as an improved method of SIS component identification. This method is applied to describe the detailed service process in a complex and connected smart industrial context. The SISIB blueprint can provide a more holistic description of the digital and physical service operation process at different industrial levels than traditional service [11] or product service blueprints. Secondly, the hyperedge theory and fuzzy set theory are integrated to evaluate the correlation degree among the various SIS components considering the complexity of the industrial context and the linguistic uncertainties. Compared to previous studies [17], this aspect can consider the evaluation uncertainty involved and realize the decision process in a more simplified way. The proposed method can gain an effective systematic correlation matrix for SISE circumstances compared with the conventional graph theory-based method. Compared to traditional pairwise correlation with traditional graph edges [11], the hyperedges can more efficiently reflect the interrelationship between components. Thirdly, this work also advances the understanding of modular theory through service modularization’s quantitative realization. The study describes how the hypergraph partition principle can be referenced among SIS components and proposes applying kNN and k-means methods to compute the evaluated hypergraph network into detailed optimal clusters. The related modularity range gained showed the high design quality of modular community structure [76]. The generated service module can contribute to agile and convenient service delivery to stakeholders. Finally, the service company proposed the modular design quality measurement using hypergraph modularity calculation and performs a good result in modularity value, which verifies the effectiveness of the framework and can help the designer choose the most appropriate modular scheme. To further illustrate the feasibility and superiority of the proposed framework, an example of an SRSE service modular design is provided.

5.2. Practical Implications

From the perspective of practical application, the findings of this study will be helpful to companies connected to the energy, manufacturing, or construction industries to design smart industrial context service solutions. Firstly, the proposed framework can guide company managers with a holistic level method of qualitative design, realize the effective discovery of various SIS components, and sequence their distribution. Secondly, the hypergraph method applied allows the designers to better evaluate the interrelationship between SIS components. The proposed framework can especially provide more evaluation information with fewer hyperedges, and linguistic vagueness is considered in the correlation degree analysis. This allows the service companies to efficiently complete the design for complex service systems, and the following hypergraph clustering can divide the intuitive modular scheme. Thirdly, this study can assist the pertinent companies in managing their commitment to sustainable development. The smart function integration and sustainable correlation criteria proposed using the hyperedge method can remind the companies to consider social and environmental responsibilities during their service modular design.

6. Conclusions

In summary, a systematic modularization design method for a smart industrial service ecosystem (SISE) is explored to realize complex smart service solution design. Based on previous relevant research [4,5,8], the authors propose a new business model for smart industrial service solutions. This study systematically illustrated the concept and characteristics of SISE, and specific quantitative modular construction for SISE has been realized. Currently, one of the most popular methods for complex system design is module-based decomposition. The smart industrial context-based SISIB blueprint is first developed to describe a whole complex SISE operation status and can systematically identify the SIS components from real service requirements. A multi-stakeholder-related and complex industrial context SISE also requires systematic SIS component clustering to form service modules. To the best of the authors’ knowledge, this is the first known article that combines the hyperedge characteristics to evaluate component correlation and finally partition them into effective service modules. Moreover, due to the limitations of conventional PSS/IPS2 component clustering and new characteristics of SISE, a more multi-level context-aware and hypergraph clustering manner for SISE service module construction is achieved. This method brings a new path in the research field of service ecosystem modularization. The demonstrated result can offer a visualized representation graph of the service modules formed using the k-means algorithm. Compared to previous articles that only implemented service modularity solutions, this study also performed the quality measurement and the best solution selection for the modular design using hypergraph modularity criteria. The high modularity shows the effectiveness and efficiency of the study. The SRSE case design approach further validates the stability and feasibility of the study in real circumstances.
This study still has some limitations. Firstly, the proposed SISIB method mainly focuses on service design in a smart industrial context that is renewable electric power generation-focused. The proposed framework could also be applied in other complex contexts, such as the smart factory or the smart construction site. Secondly, this study is the initial exploration of the smart service ecosystem modular design using hypergraph clustering theory. Future studies can work on modifying and upgrading the classic hypergraph clustering algorithm to realize a more effective service design. Moreover, future studies could also try to implement computer software for the proposed framework for convenient practical usage in the industry.

Author Contributions

Conceptualization, Y.C.; methodology, Y.C. and X.Z.; software, Y.C.; validation, Y.C., X.Z. and X.M.; formal analysis, X.Z.; investigation, X.M.; resources, X.M. and Y.B.; data curation, Y.C.; writing—original draft preparation, Y.C. and Y.B.; writing—review and editing, Y.C. and X.Z.; supervision, X.M.; project administration, X.M.; funding acquisition, X.M. All authors have read and agreed to the published version of the manuscript.

Funding

The authors would like to thank the National Major Science and Technology Projects of China [grant number 2017-I-0007-0008] and SJTUSME-COSMOPlat Joint Research Project for New Generation Industrial Intelligent Technology [grant number TL2022060200027] for the funding support to this research. The authors would also like to thank the Producer Service Development Innovation Center of Shanghai Jiao Tong University, Shanghai Research Center for industrial Informatics, and Shanghai Key Lab of Advanced manufacturing Environment for the support to this research.

Institutional Review Board Statement

Not applicable.

Informed Consent Statement

Not applicable.

Data Availability Statement

The data presented in this study are available within the article.

Conflicts of Interest

The authors declare no conflict of interest.

References

  1. Meier, H.; Roy, R.; Seliger, G. Industrial Product-Service Systems—IPS2. CIRP Ann. 2010, 59, 607–627. [Google Scholar] [CrossRef]
  2. Meng, Z.; Chen, Z.; Sun, Z.-H.; Ming, X. Smart product service requirements identification and evaluation: A hybrid method. In Proceedings of the 2021 IEEE International Conference on Industrial Engineering and Engineering Management (IEEM), Singapore, 13–16 December 2021. [Google Scholar]
  3. Chang, Y.; Ming, X.; Chen, Z.; Zhou, T.; Liao, X.; Song, W. Stakeholder requirement evaluation of smart industrial service ecosystem under Pythagorean fuzzy environment for complex industrial contexts: A case study of renewable energy park. Adv. Eng. Inform. 2023, 55, 101823. [Google Scholar] [CrossRef]
  4. Anthony, B. Distributed ledger and decentralised technology adoption for smart digital transition in collaborative enterprise. Enterp. Inf. Syst. 2021, 1–34. [Google Scholar] [CrossRef]
  5. Anthony, B. Deployment of distributed ledger and decentralized technology for transition to smart industries. Environ. Syst. Decis. 2023, 43, 298–319. [Google Scholar] [CrossRef]
  6. Kortum, H.; Rebstadt, J.; Hagen, S.; Thomas, O. Integrating Data and Service Lifecycle for Smart Service Systems Engineering: Compilation of a Lifecycle Model for the Data Ecosystem of Smart Living. 2022. Available online: https://scholarspace.manoa.hawaii.edu/items/a415b33b-a4a4-4833-a08a-bf96a030b99a (accessed on 9 May 2023).
  7. Beverungen, D.; Kundisch, D.; Wünderlich, N. Transforming into a platform provider: Strategic options for industrial smart service providers. J. Serv. Manag. 2021, 32, 507–532. [Google Scholar] [CrossRef]
  8. Herterich, M.M.; Dremel, C.; Wulf, J.; Brocke, J.V. The emergence of smart service ecosystems—The role of socio-technical antecedents and affordances. Inf. Syst. J. 2022, 33, 524–566. [Google Scholar] [CrossRef]
  9. Khan, M.A.; Wuest, T. Towards a framework to design upgradable product service systems. Procedia CIRP 2018, 78, 400–405. [Google Scholar] [CrossRef]
  10. Zhang, F.; Ding, H.; Zhang, N. Productive service demands modularization for CNC machine tools based on the improved AP clustering algorithm. Neural Comput. Appl. 2019, 32, 1567–1579. [Google Scholar] [CrossRef]
  11. Song, W.; Wu, Z.; Li, X.; Xu, Z. Modularizing product extension services: An approach based on modified service blueprint and fuzzy graph. Comput. Ind. Eng. 2015, 85, 186–195. [Google Scholar] [CrossRef]
  12. Zhang, X.; Ma, S.; Chen, S. Healthcare process modularization using design structure matrix. Adv. Eng. Inform. 2019, 39, 320–330. [Google Scholar] [CrossRef]
  13. Chen, Z.; Ming, X.; Vareilles, E.; Battaia, O. Modularization of smart product service: A framework integrating smart product service blueprint and weighted complex network. Comput. Ind. 2020, 123, 103302. [Google Scholar] [CrossRef]
  14. Sun, J.; Chai, N.; Pi, G.; Zhang, Z.; Fan, B. Modularization of Product Service System Based on Functional Requirement. Procedia CIRP 2017, 64, 301–305. [Google Scholar] [CrossRef]
  15. Yin, Z.; Gao, Q.; Ji, X. A New Service Module Partition Approach for Product Service System Based on Fuzzy Graph and Dempster-Shafer Theory of Evidence. Math. Probl. Eng. 2018, 2018, 8346859. [Google Scholar] [CrossRef]
  16. Geng, X.; Jin, Y.; Zhang, Y. Result-oriented PSS Modular Design Method based on FDSM. Procedia CIRP 2019, 83, 610–615. [Google Scholar] [CrossRef]
  17. Zheng, H.; Feng, Y.; Tan, J.; Zhang, Z. An integrated modular design methodology based on maintenance performance con-sideration. Proc. Inst. Mech. Eng. Part B J. Eng. Manuf. 2017, 231, 313–328. [Google Scholar] [CrossRef]
  18. Mata, A.S.D. Complex Networks: A Mini-review. Braz. J. Phys. 2020, 50, 658–672. [Google Scholar] [CrossRef]
  19. Huang, Y.; Liu, Q.; Lv, F.; Gong, Y.; Metaxas, D.N. Unsupervised image categorization by hypergraph partition. IEEE Trans. Pattern Anal. Mach. Intell. 2011, 33, 1266–1273. [Google Scholar] [CrossRef]
  20. Meier, H.; Völker, O.; Funke, B. Industrial Product-Service Systems (IPS2). Int. J. Adv. Manuf. Technol. 2011, 52, 1175–1191. [Google Scholar] [CrossRef]
  21. Anke, J.; Wellsandt, S.; Thoben, K.-D. Modelling of a Smart Service for Consumables Replenishment A Life Cycle Perspective. Enterp. Model. Inf. Syst. Archit. Int. J. 2018, 13, 17-1. [Google Scholar]
  22. Liu, Z.; Ming, X. A framework with revised rough-DEMATEL to capture and evaluate requirements for smart industrial product-service system of systems. Int. J. Prod. Res. 2019, 57, 7104–7122. [Google Scholar] [CrossRef]
  23. Schulte, J.K.G.; Steven, M. Risk Management of Industrial Product-Service Systems (IPS2)—How to Consider Risk and Uncertainty over the IPS2 Lifecycle? Springer: Berlin/Heidelberg, Germany, 2012; pp. 37–42. [Google Scholar] [CrossRef]
  24. Gutsche, K.; Droll, C. Enabling or Stressing? Smart Information Use Within Industrial Service Operation. In Digital Human Modeling and Applications in Health, Safety, Ergonomics and Risk Management. Human Communication, Organization and Work. HCII 2020; Lecture Notes in Computer Science; Duffy, V., Ed.; Springer: Cham, Switzerland, 2020; Volume 12199. [Google Scholar] [CrossRef]
  25. Vargo, S.L.; Akaka, M.A. Value Cocreation and Service Systems (Re)Formation: A Service Ecosystems View. Serv. Sci. 2012, 4, 207–217. [Google Scholar] [CrossRef]
  26. Vink, J.; Koskela-Huotari, K.; Tronvoll, B.; Edvardsson, B.; Wetter-Edman, K. Service Ecosystem Design: Propositions, Process Model, and Future Research Agenda. J. Serv. Res. 2020, 24, 168–186. [Google Scholar] [CrossRef]
  27. Zheng, M.; Ming, X.; Wang, L.; Yin, D.; Zhang, X. Status Review and Future Perspectives on the Framework of Smart Product Service Ecosystem. Procedia CIRP 2017, 64, 181–186. [Google Scholar] [CrossRef]
  28. Bake, J.S.; Pereira Pessôa, M.V.; Sipke, H. Mapping challenges and methodologies for providing PSS—A thematic and descriptive analysis. Cogent Bus. Manag. 2020, 7, 1809945. [Google Scholar] [CrossRef]
  29. Nätti, S.; Ulkuniemi, P.; Pekkarinen, S. Implementing Modularization in Professional Services—The Influence of Varied Knowledge Environments. Knowl. Process. Manag. 2017, 24, 125–138. [Google Scholar] [CrossRef]
  30. Geum, Y.; Park, Y. Designing the sustainable product-service integration: A product-service blueprint approach. J. Clean. Prod. 2011, 19, 1601–1614. [Google Scholar] [CrossRef]
  31. Fadeyi, J.A.; Monplaisir, L.; Aguwa, C. The integration of core cleaning and product serviceability into product modularization for the creation of an improved remanufacturing-product service system. J. Clean. Prod. 2017, 159, 446–455. [Google Scholar] [CrossRef]
  32. Sinha, K.; Han, S.Y.; Suh, E.S. Design structure matrix-based modularization approach for complex systems with multiple de-sign constraints. Syst. Eng. 2020, 23, 211–220. [Google Scholar] [CrossRef]
  33. Micheli, G.J.; Trucco, P.; Sabri, Y.; Mancini, M. Modularization as a system life cycle management strategy: Drivers, barriers, mechanisms and impacts. Int. J. Eng. Bus. Manag. 2019, 11, 1847979018825041. [Google Scholar] [CrossRef]
  34. Papazoglou, M.P.; Elgammal, A. The manufacturing blueprint environment: Bringing intelligence into manufacturing. In Proceedings of the 2017 International Conference on Engineering, Technology and Innovation (ICE/ITMC), Madeira Island, Portugal, 27–29 June 2017; pp. 750–759. [Google Scholar] [CrossRef]
  35. Li, F.; Lu, Y. Engaging end users in an AI-enabled smart service design—The application of the smart service blueprint scape (SSBS) framework. Proc. Des. Soc. 2021, 1, 1363–1372. [Google Scholar] [CrossRef]
  36. Fogaça, M.; Kahng, A.B.; Monteiro, E.; Reis, R.; Wang, L.; Woo, M. On the superiority of modularity-based clustering for de-termining placement-relevant clusters. Integration 2020, 74, 32–44. [Google Scholar] [CrossRef]
  37. Fender, A.; Emad, N.; Petiton, S.; Naumov, M. Parallel Modularity Clustering. Procedia Comput. Sci. 2017, 108, 1793–1802. [Google Scholar] [CrossRef]
  38. Franzese, N.; Groce, A.; Murali, T.M.; Ritz, A. Hypergraph-based connectivity measures for signaling pathway topologies. PLoS Comput. Biol. 2019, 15, e1007384. [Google Scholar] [CrossRef]
  39. Zizhao, Z.; Lin, H.; Gao, Y. Dynamic Hypergraph Structure Learning. In Proceedings of the Twenty-Seventh International Joint Conference on Artificial Intelligence, Stockholm, Sweden, 13–19 July 2018. [Google Scholar]
  40. Ouvrard, X. Hypergraphs: An introduction and review. arXiv 2020, arXiv:2002.05014. [Google Scholar]
  41. Ma, X.; Liu, W.; Li, S.; Tao, D.; Zhou, Y. Hypergraph p-Laplacian Regularization for Remotely Sensed Image Recognition. IEEE Trans. Geosci. Remote Sens. 2018, 57, 1585–1595. [Google Scholar] [CrossRef]
  42. Yu, N.; Gao, Y.-L.; Liu, J.-X.; Wang, J.; Shang, J. Robust hypergraph regularized non-negative matrix factorization for sample clustering and feature selection in multi-view gene expression data. Hum. Genom. 2019, 13, 46. [Google Scholar] [CrossRef]
  43. Frow, P.; McColl-Kennedy, J.R.; Payne, A.; Govind, R. Service ecosystem well-being: Conceptualization and implications for theory and practice. Eur. J. Mark. 2019, 53, 2657–2691. [Google Scholar] [CrossRef]
  44. Cimini, C.; Rondini, A.; Pezzotta, G.; Pinto, R. Smart manufacturing as an enabler of servitization: A framework for the business transformation towards a smart service ecosystem. In Proceedings of the 23rd Summer School “Francesco Turco”-Industrial Systems Engineering 2018, Palermo, Italy, 12–14 September 2018; pp. 341–347. [Google Scholar]
  45. Yin, D.; Ming, X.; Zhang, X. Understanding Data-Driven Cyber-Physical-Social System (D-CPSS) Using a 7C Framework in Social Manufacturing Context. Sensors 2020, 20, 5319. [Google Scholar] [CrossRef] [PubMed]
  46. Zhou, D.; Xue, X.; Zhou, Z. SLE2: The Improved Social Learning Evolution Model of Cloud Manufacturing Service Ecosystem. IEEE Trans. Ind. Inform. 2022, 18, 9017–9026. [Google Scholar] [CrossRef]
  47. Weinberger, M.; Bilgeri, D.; Fleisch, E. IoT business models in an industrial context. Auto 2016, 64, 699–706. [Google Scholar] [CrossRef]
  48. Medini, K.; Boucher, X. Specifying a modelling language for PSS Engineering—A development method and an operational tool. Comput. Ind. 2019, 108, 89–103. [Google Scholar] [CrossRef]
  49. Radenković, M.; Lukić, J.; Despotović-Zrakić, M.; Labus, A.; Bogdanović, Z. Harnessing business intelligence in smart grids: A case of the electricity market. Comput. Ind. 2018, 96, 40–53. [Google Scholar] [CrossRef]
  50. Zhai, Y.; Chen, K.; Zhou, J.X.; Cao, J.; Lyu, Z.; Jin, X.; Shen, G.Q.; Lu, W.; Huang, G.Q. An Internet of Things-enabled BIM platform for modular integrated construction: A case study in Hong Kong. Adv. Eng. Inform. 2019, 42, 100997. [Google Scholar] [CrossRef]
  51. da Costa Fernandes, S.; Martins, L.D.; Rozenfeld, H. Who are the stakeholders mentioned in cases of Product-Service System (PSS) design? In Proceedings of the Design Society: International Conference on Engineering Design, Delft, The Netherlands, 5–8 August 2019; pp. 3131–3140. [Google Scholar]
  52. Kaartemo, V.; Akaka, M.; Vargo, S. A Service-Ecosystem Perspective on Value Creation: Implications for International Busi-ness. Value Creat. Int. Bus. 2017, 2, 131–149. [Google Scholar]
  53. Maleki, E.; Belkadi, F.; Boli, N.; Van Der Zwaag, B.J.; Alexopoulos, K.; Koukas, S.; Marin-Perianu, M.; Bernard, A.; Mourtzis, D. Ontology-based framework enabling smart product-service systems: Application of sensing systems for machine health monitoring. IEEE Internet Things J. 2018, 5, 4496–4505. [Google Scholar] [CrossRef]
  54. Mastrapa, L.H.; Assumpo, M.P.; Velázquez, D.; Gennaro, C.K.; Dias, E. Product-Service System Modularization: A Systematic Review. In Proceedings of the 25th International Joint Conference on Industrial Engineering and Operations Management—IJCIEOM, Rio de Janeiro, Brazil, 8–11 July 2020. [Google Scholar]
  55. Brusoni, S.; Prencipe, A. Patterns of Modularization: The Dynamics of Product Architecture in Complex Systems. Eur. Manag. Rev. 2011, 8, 67–80. [Google Scholar] [CrossRef]
  56. Shehab, E.; Tiwari, A.; Annamalai Vasantha, G.V.; Lightfoot, H.; Roy, R. Decision Engineering Report Series: Industrial Product-Service Systems (IPS2): THINK TANK. Available online: https://dspace.lib.cranfield.ac.uk/handle/1826/7173 (accessed on 3 May 2023).
  57. Peters, C.; Leimeister, J.M. TM3-A modularization method for telemedical services: Design and evaluation. In Proceedings of the 21st European Conference on Information Systems (ECIS), Utrecht, The Netherlands, 5–8 June 2013. [Google Scholar]
  58. Santana, F.; Nagata, F.; Cursino, D.; Barberato, M.; Leal, C. Using BPMN-Based Business Processes in Requirements Engineering: The Case Study of Sustainable Design. 2016. Available online: https://www.proquest.com/openview/c6d316b7c0400cbfaa96d0bd83c5ec39/1?cbl=1976356&pq-origsite=gscholar&parentSessionId=lS2HAX%2BlQeHDF6CLdKNfJNrcNIPP7cO6iOkO%2F0s7yAw%3D (accessed on 2 May 2023).
  59. Wei, X.; Cai, L.; Liao, B.; Lu, T. Local-view-assisted discriminative band selection with hypergraph autolearning for hyperspectral image classification. IEEE Trans. Geosci. Remote Sens. 2019, 58, 2042–2055. [Google Scholar] [CrossRef]
  60. Li, P.; Milenkovic, O. Inhomogeneous Hypergraph Clustering with Applications. Adv. Neural Inf. Process. Syst. 2017, 30. [Google Scholar] [CrossRef]
  61. Wang, Z.; Chen, C.-H.; Zheng, P.; Li, X.; Song, W. A hypergraph-based approach for context-aware smart product-service system configuration. Comput. Ind. Eng. 2021, 163, 107816. [Google Scholar] [CrossRef]
  62. Halstenberg, F.A.; Lindow, K.; Stark, R. Leveraging circular economy through a methodology for smart service systems en-gineering. Sustainability 2019, 11, 3517. [Google Scholar] [CrossRef]
  63. Maglio, P.P.; Lim, C. Innovation and Big Data in Smart Service Systems. J. Innov. Manag. 2016, 4, 11–21. [Google Scholar] [CrossRef]
  64. Chen, R.; Hua, Q.; Jia, W.; Zhang, M.; Ji, X.; Li, J.; Wang, B.; Liu, J. A hybrid recommendation method and development framework of user interface patterns based on hypergraph theory. Int. J. Innov. Comput. Inf. Control 2017, 13, 1169–1185. [Google Scholar]
  65. Lee, S.; Kim, M.S.; Park, Y.; Kim, C. Identification of a technological chance in product-service system using KeyGraph and text mining on business method patents. Int. J. Technol. Manag. 2016, 70, 239. [Google Scholar] [CrossRef]
  66. Euchner, J. Ecosystem Innovation. Res.-Technol. Manag. 2016, 59, 9–10. [Google Scholar] [CrossRef]
  67. Resman, M.; Pipan, M.; Simic, M.; Herakovic, N. A new architecture model for smart manufacturing: A performance analysis and comparison with the RAMI 4.0 reference model. Adv. Prod. Eng. Manag. 2019, 14, 153–165. [Google Scholar] [CrossRef]
  68. Li, M.; Zhao, C.; Tang, J. Hybrid image summarization by hypergraph partition. Neurocomputing 2013, 119, 41–48. [Google Scholar] [CrossRef]
  69. Huang, Y.; Liu, Q.; Zhang, S.; Metaxas, D.N. Image retrieval via probabilistic hypergraph ranking. In Proceedings of the 2010 IEEE Computer Society Conference on Computer Vision and Pattern Recognition, San Francisco, CA, USA, 13–18 June 2010. [Google Scholar]
  70. Zhou, D.; Huang, J.; Schlkopf, B. Learning with Hypergraphs: Clustering, Classification, and Embedding. In Proceedings of the Advances in Neural Information Processing Systems 19, Proceedings of the Twentieth Annual Conference on Neural Information Processing Systems, Vancouver, BC, Canada, 4–7 December 2006. [Google Scholar]
  71. Kutlu, A.C.; Ekmekçioğlu, M. Fuzzy failure modes and effects analysis by using fuzzy TOPSIS-based fuzzy AHP. Expert Syst. Appl. 2012, 39, 61–67. [Google Scholar] [CrossRef]
  72. Zhang, Z.; Bai, L.; Liang, Y.; Hancock, E. Joint hypergraph learning and sparse regression for feature selection. Pattern Recognit. 2017, 63, 291–309. [Google Scholar] [CrossRef]
  73. Halim, Z.; Sargana, H.M.; Aadam; Uzma; Waqas, M. Clustering of graphs using pseudo-guided random walk. J. Comput. Sci. 2021, 51, 101281. [Google Scholar] [CrossRef]
  74. Mao, M.; Lu, J.; Han, J.; Zhang, G. Multiobjective e-commerce recommendations based on hypergraph ranking. Inf. Sci. 2018, 471, 269–287. [Google Scholar] [CrossRef]
  75. Jiang, J.; Wei, Y.; Feng, Y.; Cao, J.; Gao, Y. Dynamic Hypergraph Neural Networks. In Proceedings of the IJCAI, Macao, China, 10–16 August 2019; pp. 2635–2641. [Google Scholar] [CrossRef]
  76. Newman, M.E. Modularity and community structure in networks. Proc. Natl. Acad. Sci. USA 2006, 103, 8577–8582. [Google Scholar] [CrossRef] [PubMed]
  77. Kumar, T.; Vaidyanathan, S.; Ananthapadmanabhan, H.; Parthasarathy, S.; Ravindran, B. A New Measure of Modularity in Hypergraphs: Theoretical Insights and Implications for Effective Clustering; Springer International Publishing: Cham, Switzerland, 2019; pp. 286–297. [Google Scholar] [CrossRef]
  78. Holmström, E.; Bock, N.; Brännlund, J. Modularity density of network community divisions. Phys. D Nonlinear Phenom. 2009, 238, 1161–1167. [Google Scholar] [CrossRef]
  79. Zheng, P.; Chen, C.-H.; Shang, S. Towards an automatic engineering change management in smart product-service systems—A DSM-based learning approach. Adv. Eng. Inform. 2019, 39, 203–213. [Google Scholar] [CrossRef]
  80. Wu, M.; Liu, Y.; Chung, H.F.; Guo, S. When and how mobile payment platform complementors matter in cross-border B2B e-commerce ecosystems? An integration of process and modularization analysis. J. Bus. Res. 2021, 139, 843–854. [Google Scholar] [CrossRef]
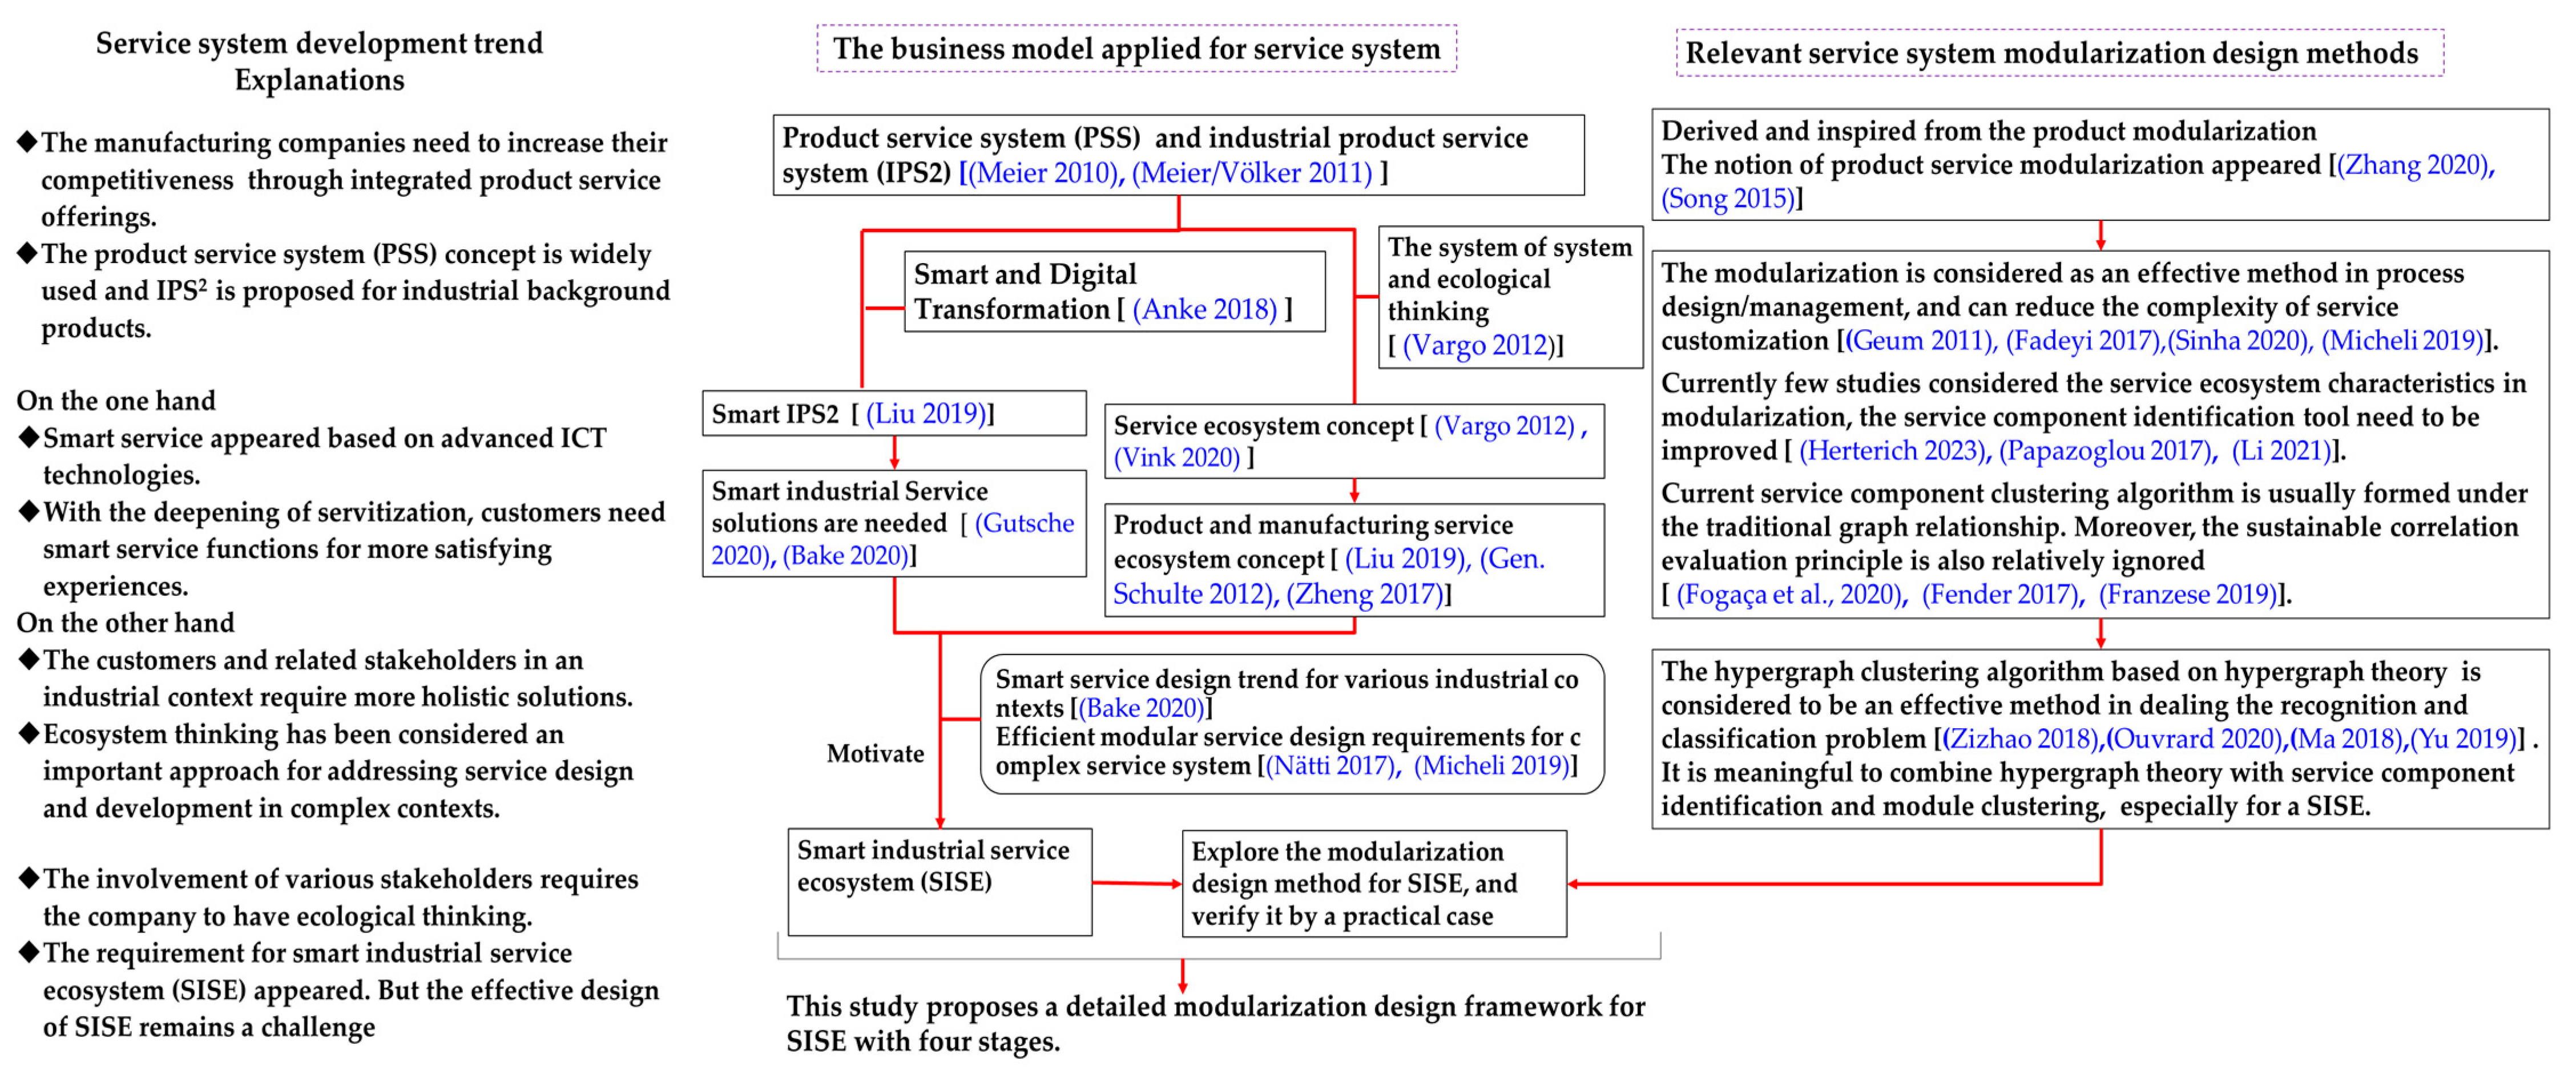
Figure 1. The rise of the SISE concept and the necessity of developing an effective service modular design framework [1,8,10,11,20,21,22,23,24,25,26,27,28,29,30,31,32,33,34,35,36,37,38,39,40,41,42].
Sustainability 15 08858 g001
Figure 2. The entire proposed framework for systematic SISE design process using SISIB and hypergraph theory.
Sustainability 15 08858 g002
Figure 3. The proposed SISIB for complex interconnected smart industrial contexts.
Sustainability 15 08858 g003
Figure 4. An example of the evaluation of the service components.
Sustainability 15 08858 g004
Figure 5. The smart industrial service identification blueprint (SISIB) for a smart renewable energy industrial park.
Sustainability 15 08858 g005
Figure 6. (a) The initial correlation evaluation score graph for the SRSE (b) The strength of the hyperedges applied.
Sustainability 15 08858 g006aSustainability 15 08858 g006b
Figure 7. The results of hypergraph clustering when the number of service modules K (clusters) is set as (a) K = 3 and (b) K = 4.
Sustainability 15 08858 g007
Figure 8. The Modular division schemes and the corresponding modularity values.
Sustainability 15 08858 g008
Table 2. Correlation scale of hyperedge strength.
Linguistic Terms in Hyperedge Strength on the Fuzzy ScoreCrisp Value Transferred
Very strong correlation (VSC)(3/2, 2, 5/2)2
Fairly strong correlation (FSC)(1, 3/2, 2)1.5
Slightly strong correlation (SSC)(1, 1, 3/2)1.083
Table 3. The smart industrial service components of SRSE.
No.NameDomainRelevant Smart Function
V1Smart classification and recovery of scrapped wind/photovoltaic power equipmentEnvironmental stakeholder value proposition Intelligent classification
V2Operation safety feedback of wind/photovoltaic power equipmentSocial stakeholder value proposition Real-time communication and feedback
V3Wind/photovoltaic power equipment access to monitoring networkEconomical stakeholder value proposition Predictive Maintenance
V4Ensure the normal operation of wind/photovoltaic power equipmentEconomical stakeholder value proposition Smart diagnosis and repair
V5Predictive maintenance of wind/photovoltaic power equipmentEconomical stakeholder value proposition Predictive maintenance
V6Smart interconnection service of wind/photovoltaic power equipmentEquipment level-related service activity Smart sensing and connectivity
V7Real-time status monitoring of wind/photovoltaic power equipmentEquipment level-related service activityReal-time monitoring
V8Wind/photovoltaic power equipment fault diagnosis Equipment level-related service activitySmart diagnosis
V9Wind/photovoltaic
power equipment accurate repair
Equipment level-related service activitySmart & accurate repair
V10The digital twin model of wind/photovoltaic power equipmentEquipment level-related service activityDigital twin simulation
V11Feedback of station energy consumptionEnvironmental stakeholder value propositionSmart statistical data classification
V12The noise and radiation pollution
statistics for stations
Environmental stakeholder value propositionSmart statistical data classification
V40Rectification and feedback of safety problems Social stakeholder value propositionReal-time communication
V41Economic benefit feedback of new energy power system operationEconomical stakeholder value propositionSmart and visual report view
V42Better cooperation system of related stakeholders Economical stakeholder value propositionSmart enterprise resource planning
V43Stakeholder expectation managementEcosystem management level-related service activityManagement of smart ecosystem
V44Operation of enterprise resource management systemEcosystem management level-related service activitySmart enterprise resource planning
V45Operation access management of industrial big data platformEcosystem management level-related service activityBig data platform
V46Service value network management at the ecosystem levelEcosystem management level-related service activityManagement of smart ecosystem
Table 4. The 11 hyperedges applied to form the initial hypergraph.
e1e2e3e4e5e6e7e8e9e10e11
V120020000000
V201.50 1.50000000
V3001.520000000
V4001.520000000
V5001.520000000
V60002021.50000
V43000002001.51.0830
V44000002001.51.0830
V45000002001.51.0830
V46000002001.51.0830
Table 5. The comparison between this study and previous service modular design studies.
Comparison with the Current Representative Methods The Consideration of Smartness and Multi-Level Industrial Context The Visibility and Clearance of Service Component Identification The Simplicity of the Evaluation Matrix in Correlation Evaluation The Maximum Modularity Q that can Gain in Relevant Study
This method Both considered the smart data flow and the multi-level activities in a complex industrial context. Can clearly identify the service components through the service operation process and also reflect their distributions among various domains.The effective correlation comparison can be formed with only 12 hyperedges. A 12*46 correlation matrix is enough. 0.507
Representative DSM-related study [79]The authors considered the smart connectivity around the smart product. However, their DSM matrix cannot reflect the distribution of service activities at different levels. Not clear and visible in describing the detailed service operation process.
It also cannot reflect the different functional domains of a complex industrial context clearly.
46 SIS components need to be compared with each other.
Need to form a 46*46 correlation matrix
0.33865
Representative smart product service blueprint-related study [13]The authors considered the cyber smart function domain for product service in the CPS-based SPS blueprint applied.
However, they did not consider more macro activities in the executive line or industrial park levels.
The related service components can be displayed and identified in the relevant service operation process but are rather limited in product-level related activities. 46 SIS components need to be compared with each other.
Need to form a 46*46 correlation matrix
0.320
Disclaimer/Publisher’s Note: The statements, opinions and data contained in all publications are solely those of the individual author(s) and contributor(s) and not of MDPI and/or the editor(s). MDPI and/or the editor(s) disclaim responsibility for any injury to people or property resulting from any ideas, methods, instructions or products referred to in the content.