Article

Multimodal Traveling with Rail and Ride-Sharing: Lessons Learned during Planning and Demonstrating a Pilot Study

by
Lambros Mitropoulos
1,*,
Annie Kortsari
1,
Emy Apostolopoulou
2,
Georgia Ayfantopoulou
1 and
Alexandros Deloukas
2
1
Hellenic Institute of Transport, Centre for Research and Technology Hellas, 57001 Thessaloniki, Greece
2
Elliniko Metro S.A., 11525 Athens, Greece
*
Author to whom correspondence should be addressed.
Sustainability 2023, 15(18), 13755; https://doi.org/10.3390/su151813755
Submission received: 30 June 2023 / Revised: 10 August 2023 / Accepted: 8 September 2023 / Published: 15 September 2023

Abstract

:
Multimodal traveling is expected to enhance mobility for users, reduce inequalities of car ownership, and reduce emissions. In the same context, ride-sharing aims to minimize negative impacts related to emissions, reduce travel costs and congestion, increase passenger vehicle occupancy, and increase public transit ridership when planned for first/last-mile trips. This study uses the empirical data gained from the pilot study in Athens, Greece, to outline a step-by-step planning guide for setting up a pilot study, and it concludes with challenges that emerged during and after its implementation. The demo aims to enhance the connection of low-density regions to public transport (PT) modes, specifically to the metro, through the provision of demand-responsive ride-sharing services. During the demo period, two different applications were utilized: the “Travel Companion” app and the “Driver Companion” app, which refer to passengers and drivers of the ride-sharing service, respectively. Demo participants were identified through a Stated Preference (SP) experiment. Challenges that were faced during the implementation show that although participants are willing to try new mobility solutions, the readiness and reliability of the new service are essential attributes in maintaining existing users and engaging new ones.

1. Introduction

The emerging growth of on-demand transport services has contributed to the development of terminology with differences often not being distinct. Several definitions have emerged for different and sometimes overlapping concepts, including ride-sharing, ride-selling (i.e., commercial, organized by an individual), ride-hailing (i.e., commercial, organized by businesses), and ride-pooling (i.e., organized by public agencies). Ride-sharing is one of the most popular terms in the field of shared mobility and, according to a number of studies in the literature [1], refers to the sharing of a motor vehicle between a driver and one or more passengers in order to share the trip cost. The term is used in several instances to describe (1) the sharing of a road vehicle to equalize costs as part of a trip that the driver is making for his or her own account (also referred to as carpooling), or (2) the sharing of a professional rental vehicle by multiple passengers who have the same (or a different) destination to share the cost of the trip (e.g., airport transfers). Therefore, ride-sharing is divided into for-profit and non-profit (i.e., trip cost-sharing) services based on the concept that is adopted by each service provider [1].
“Ride-sharing” in the context of this study is similar to carpooling and is defined as the transport of people in a motor vehicle when such transport is incidental to the principal purpose of the driver, which is to reach a destination, rather than to transport people for profit [2]. Ride-sharing has had limited adoption to date due to business, economic, and technological barriers [1], and when combined with public transport, the uncertainty toward its successful planning and implementation increases due to the multiple stakeholders involved and the integrated technological components. Ride-sharing combined with public transport (PT) may enable multimodal travel because ride-sharing combines the key attributes of the private car, namely convenience, time savings, freedom, and status [3,4,5].
Ride-sharing is enabled by mobile applications, and it may also be considered a non-technical innovation, which implies changes in travel behavior [6]. In the same context, the notion of multimodality as a policy solution is well aligned with the “behavior change agenda” for sustainable mobility [7]. Travel behavior changes become more likely if there is in parallel a change in the life course (e.g., starting a new job) [5,8]. Literature studies have concluded that modal shifts are significantly related to age [5,9,10] and gender [11], changes in income and place of residence [11,12], and social and income status [13,14]. High car availability, a high number of cars in a household, and the presence of children under the age of six all have negative effects on the likelihood that a person will engage in multimodal behavior [9].
The literature review on multimodal travel and ride-sharing revealed that numerous studies have focused on the factors influencing users’ behavior in using ride-sharing services [1], their impact [15,16,17], the development of route planning algorithms and apps [18,19,20,21], and incentives to attract more participants [22,23,24]. However, only a few of them have focused on the planning and implementation process of ride-sharing demonstrations as part of a multimodal transport system. Most ride-sharing demonstrations are deployed in the framework of research projects or initiatives derived from these projects [22,24,25].
Ensuring the participation of a critical mass of participants, including both drivers and passengers, is a key component for designing a successful ride-sharing service; however, there are additional steps that need to be considered to test such a service. In this sense, studying and developing an evidence-based guide for planning and implementing ride-sharing demonstrations becomes essential, as such a guide has the potential to provide directions for future pilot schemes [26].
This paper aims to outline the process of planning and implementing a pilot demonstration in central Athens, Greece, regarding multimodal traveling with rail and ride-sharing within the context of the Ride2Rail project. The Ride2Rail project is a European Union (EU)-funded project that aims to improve the concept of ride-sharing by developing, testing, and deploying a set of as-a-service software components to support the scheduling of daily trips made partly by public transport and partly by private cars (ride-sharing). In our study, ride-sharing therefore complements rail and other public transport in rural areas.
Based on empirical data, this work presents a step-by-step planning guide that aims to assist interested stakeholders in promoting and implementing ride-sharing and public transport initiatives within their communities. This section presents the process used to design the pilot study in Athens, Greece, and provides guidance for similar future pilot projects. The challenges identified are linked to lessons learned to provide recommendations for the successful design and implementation of such pilot projects. This manuscript contributes to the growing body of knowledge on multimodality and ride-sharing by describing the planning and implementation methods, as well as lessons learned, to assist ride-sharing stakeholders (i.e., researchers, public authorities, critical infrastructure providers, transport service providers, and operators).
In the remainder of this paper, Section 2 provides a summary of the literature findings on the ride-sharing concept with reference to planning steps and challenges. The multimodal scheme of the study is presented in Section 3, including the description of the demo area and app, and the user engagement process. The implementation phase along with lessons learned are described and discussed in Section 4, and finally, Section 5 concludes the present study.

2. Background

Multimodality refers to switching between different travel modes at least once as part of a journey between an origin and a destination [27]. Multimodal planning has been broadened to include innovative mobility solutions that contribute to achieving sustainable transport systems. However, the success of multimodal planning depends on the successful integration of all available modes within a community, given different spatial, user, and mode characteristics [28,29].

2.1. Planning and Implementation

Ride-sharing is a mobility alternative that can help accommodate the growth in urban travel demand and at the same time alleviate problems such as excessive vehicular emissions [30]. Ride-sharing services have been found to promote sustainable transport as they reduce car utilization and minimize negative impacts related to carbon, emissions, travel cost, and congestion [31]. However, ride-sharing success depends on changes in travel behavior and the provision of alternatives that compete with the “universality” of the car [5,8].
Ride-sharing services can support the need to shift towards public transport and multimodality as they serve the first and/or last mile of a traveler’s trip. Ride-sharing is a transport mode that combines the flexibility and speed of private cars with the reduced cost of fixed-line systems [3]. According to Clauss and Doppe (2016) [32], urban travelers select travel alternatives primarily based on determinants associated with private cars such as privacy, flexibility, and autonomy, while costs and time efficiency also play a major role.
Nowadays, the coordination of ride-sharing is mostly realized through smart applications. Several studies have identified the following steps when planning and implementing a ride-sharing scheme [22,24,33]:
  • Early engagement of a diverse group of participants;
  • Technical testing of the smart application (if applicable);
  • Design of a survey to obtain user satisfaction after the pilot.
The Washington State Department of Transportation (WSDOT) conducted the Carpool Pilot Project using the Avego real-time ride-sharing application [33]. The early engagement of stakeholders, the introduction of the Avego app to early adopters, and the extensive local and/or national public relations efforts were essential steps towards planning the pilot. Regarding recruitment, the participants had to meet predefined liability and security criteria; thus, an approval process was initiated by requiring several documents/certifications by potential participants. It turned out that participants were reluctant to share such information, and many dropped out of the pilot.
The European Union (EU)-funded project SocialCar [24] ran a field test in Southern Switzerland, among other cities, which also emphasized the significance of the recruitment process. During planning, the participation of a diverse group of citizens, in terms of socio-economic characteristics, was required. In order to guarantee a critical mass of offered rides, the team decided to limit the study area. An invitation was released through a press conference and a network of local partners and stakeholders were mobilized to invite their members and affiliated citizens through newsletters. Moreover, paid advertisements were executed via social media channels. During the implementation phase, participants were given clear instructions on how to use the app on a weekly basis and they were asked to complete two online surveys and participate in two focus group meetings (i.e., before and after the demo) to evaluate their attitudes and opinions. Transport vouchers were provided to them (e.g., free weekly public transport season tickets) to reward them for their participation.
Considering the technical aspects of a ride-sharing pilot, the development of the RideMyRoute application in the SocialCar project required the organization of transit data in a multi-layer temporal network to help users find optimal routes [24]. In order to provide ride-sharing services in the journey planner, ride offers by external ride-sharing applications were also integrated, which ensured a higher offer of drivers. Regarding public transport data, most public transport companies published data using the GTFS (General Transit Feed Specification) format originally proposed by Google.
Despite the fact that ride-sharing principally uses ICT tools, informal ride-sharing pilots (i.e., between neighbors, or members of the same association [34]) also provided useful insights on planning and implementation [22,25,35]. The initiative of “Stop Covoiturage” was launched in Val de Saône in 2013 and potential users had to register online; upon signing a commitment charter, a membership card, a car sticker for the drivers, and a network map were issued [35]. It should be noted that dedicated stops were initially defined and according to the popularity of the service, new ones were added. In a similar context, the EU-funded project Changing Habits for Urban Mobility Solutions (CHUMS) developed and delivered a methodology (“the CHUMS approach”) to maximize ride-sharing demand and establish a critical mass of users. The CHUMS project applied a composite behavioral change strategy in five cities: Craiova (RO), Edinburgh (UK), Leuven (B), Toulouse (F), and Perugia (IT). In brief, the strategy included personalized travel plans, and the provision of a mobility jackpot lottery to attract users to shared rides. The target group was not the general public but rather restricted groups, such as workplaces, large employers, or universities [22].

2.2. Challenges and Barriers

Several studies have identified social, technical, and operational challenges when planning and implementing ride-sharing schemes [22,24,33,36]. During the SR 520 pilot project, the approval process of participants (i.e., drivers and passengers) proved to be the most important obstacle and caused a large part to drop out [33]. This resulted, as reported by several studies [23,24,35], in limited recruitment of a critical mass of users. In the same context, the field-testing of the SocialCar app showed that one of the main challenges was the recruitment of a significant number of participants. While locating users who are willing to test multi-modal options that include public transport and ride-sharing may be challenging, finding drivers who are eager to share their cars became more difficult [24]. The users’ willingness to share rides was mainly attributed to psychological barriers and a lack of involvement by local stakeholders [37]. Mitropoulos, Kortsari, and Ayfantopoulou (2021) [1] reviewed ride-sharing platforms, user factors, and barriers and reported that the strongest identified barriers for ride-sharing users are mainly psychological, with the most common ones being personal security, comfort, and privacy. Anthopoulos and Tzimos (2021) [23] claimed that participation in ride-sharing in Europe is low, mainly due to high car ownership, difficulties in formulating ride-sharing plans, lack of confidence in commuting with strangers, and lack of linkages with public transport in cities. Two key barriers were detected in the application of ride-sharing in Krakow, Poland—the fear for personal safety and the unwillingness to share rides with strangers [38].
Regarding technical aspects, the SocialCar team who developed the RideMyRoute application reported that the most significant obstacle was the availability of data, including both the quality and quantity of the information [24]. They also reported that the Open Street Map (OSM) cartography data proved insufficient since the automatic location of certain street addresses was often not reported correctly. The OSM’s failure to map an address string to the correct location and automatically place an address in a different position caused the route planning algorithms to suggest incorrect routes to passengers. The complexity of route planning algorithms was reported also by Martins et al. (2021) [20], where it is mentioned that user matching depends on spatiotemporal constraints. Regarding public transport data in the SocialCar test [24], only two out of the four cities reported that the GTFS data were of sufficient quality.
In addition to users’ attitudes and technological aspects, other parameters such as the transport infrastructure could be a barrier to the adoption of ride-sharing. Potenza, Italy, introduced a ride-sharing system with a web-based match-making tool for employees and provided designated parking spaces for the riders [25]. However, the wide availability of free parking and the fact that many people relied on private cars to take their children to school were major barriers to the uptake of the service. Mitropoulos, Kortsari, and Ayfantopoulou (2021) [36] presented the findings of a survey conducted and reported that ride-sharing combined with public transport services is more popular for drivers who live in non-urban areas due to limited accessibility to public transport.
Based on the literature’s findings, the challenges and barriers that arise during the design and implementation of ride-sharing demonstrations are summarized in Table 1.
In addition to the challenges that apply under normal circumstances, there are also occasions that bring additional obstacles such as pandemics. During pandemics, people tend to avoid crowded places, postpone or cancel their travel plans, and reduce the use of public transport as a crucial preventive measure. Similar safety concerns arise regarding ride-sharing during pandemics, especially if someone shares the trip with strangers [39].

3. Multimodal Pilot Planning

The following sections describe the planning and implementation process of a multimodal pilot in Athens, Greece, to provide a guideline for interested stakeholders.

3.1. Demo Implementation Phases

The method that was followed consists of four distinct phases that are required for the preparation, implementation, execution, and monitoring of the demonstration. More specifically, the phases are as follows:
  • Demo preparation: It aims to plan and provide the checklist of all technical and organizational activities needed for deploying the demonstration execution. During this phase, collaboration among local stakeholders is established.
  • Demo implementation: It aims to set up all technical requirements for running the demonstrations, including the integration of related software tools with required local services. Upon integration, the system infrastructure and software integration will be tested.
  • Demo execution: The execution of the demonstration activities takes place within this phase, covering different and increasing levels of end-user involvement.
  • Demo monitoring: It aims to define and calculate the necessary indicators and targets for allowing for cross-site comparison and assessment. The tools for monitoring are also described within this phase.
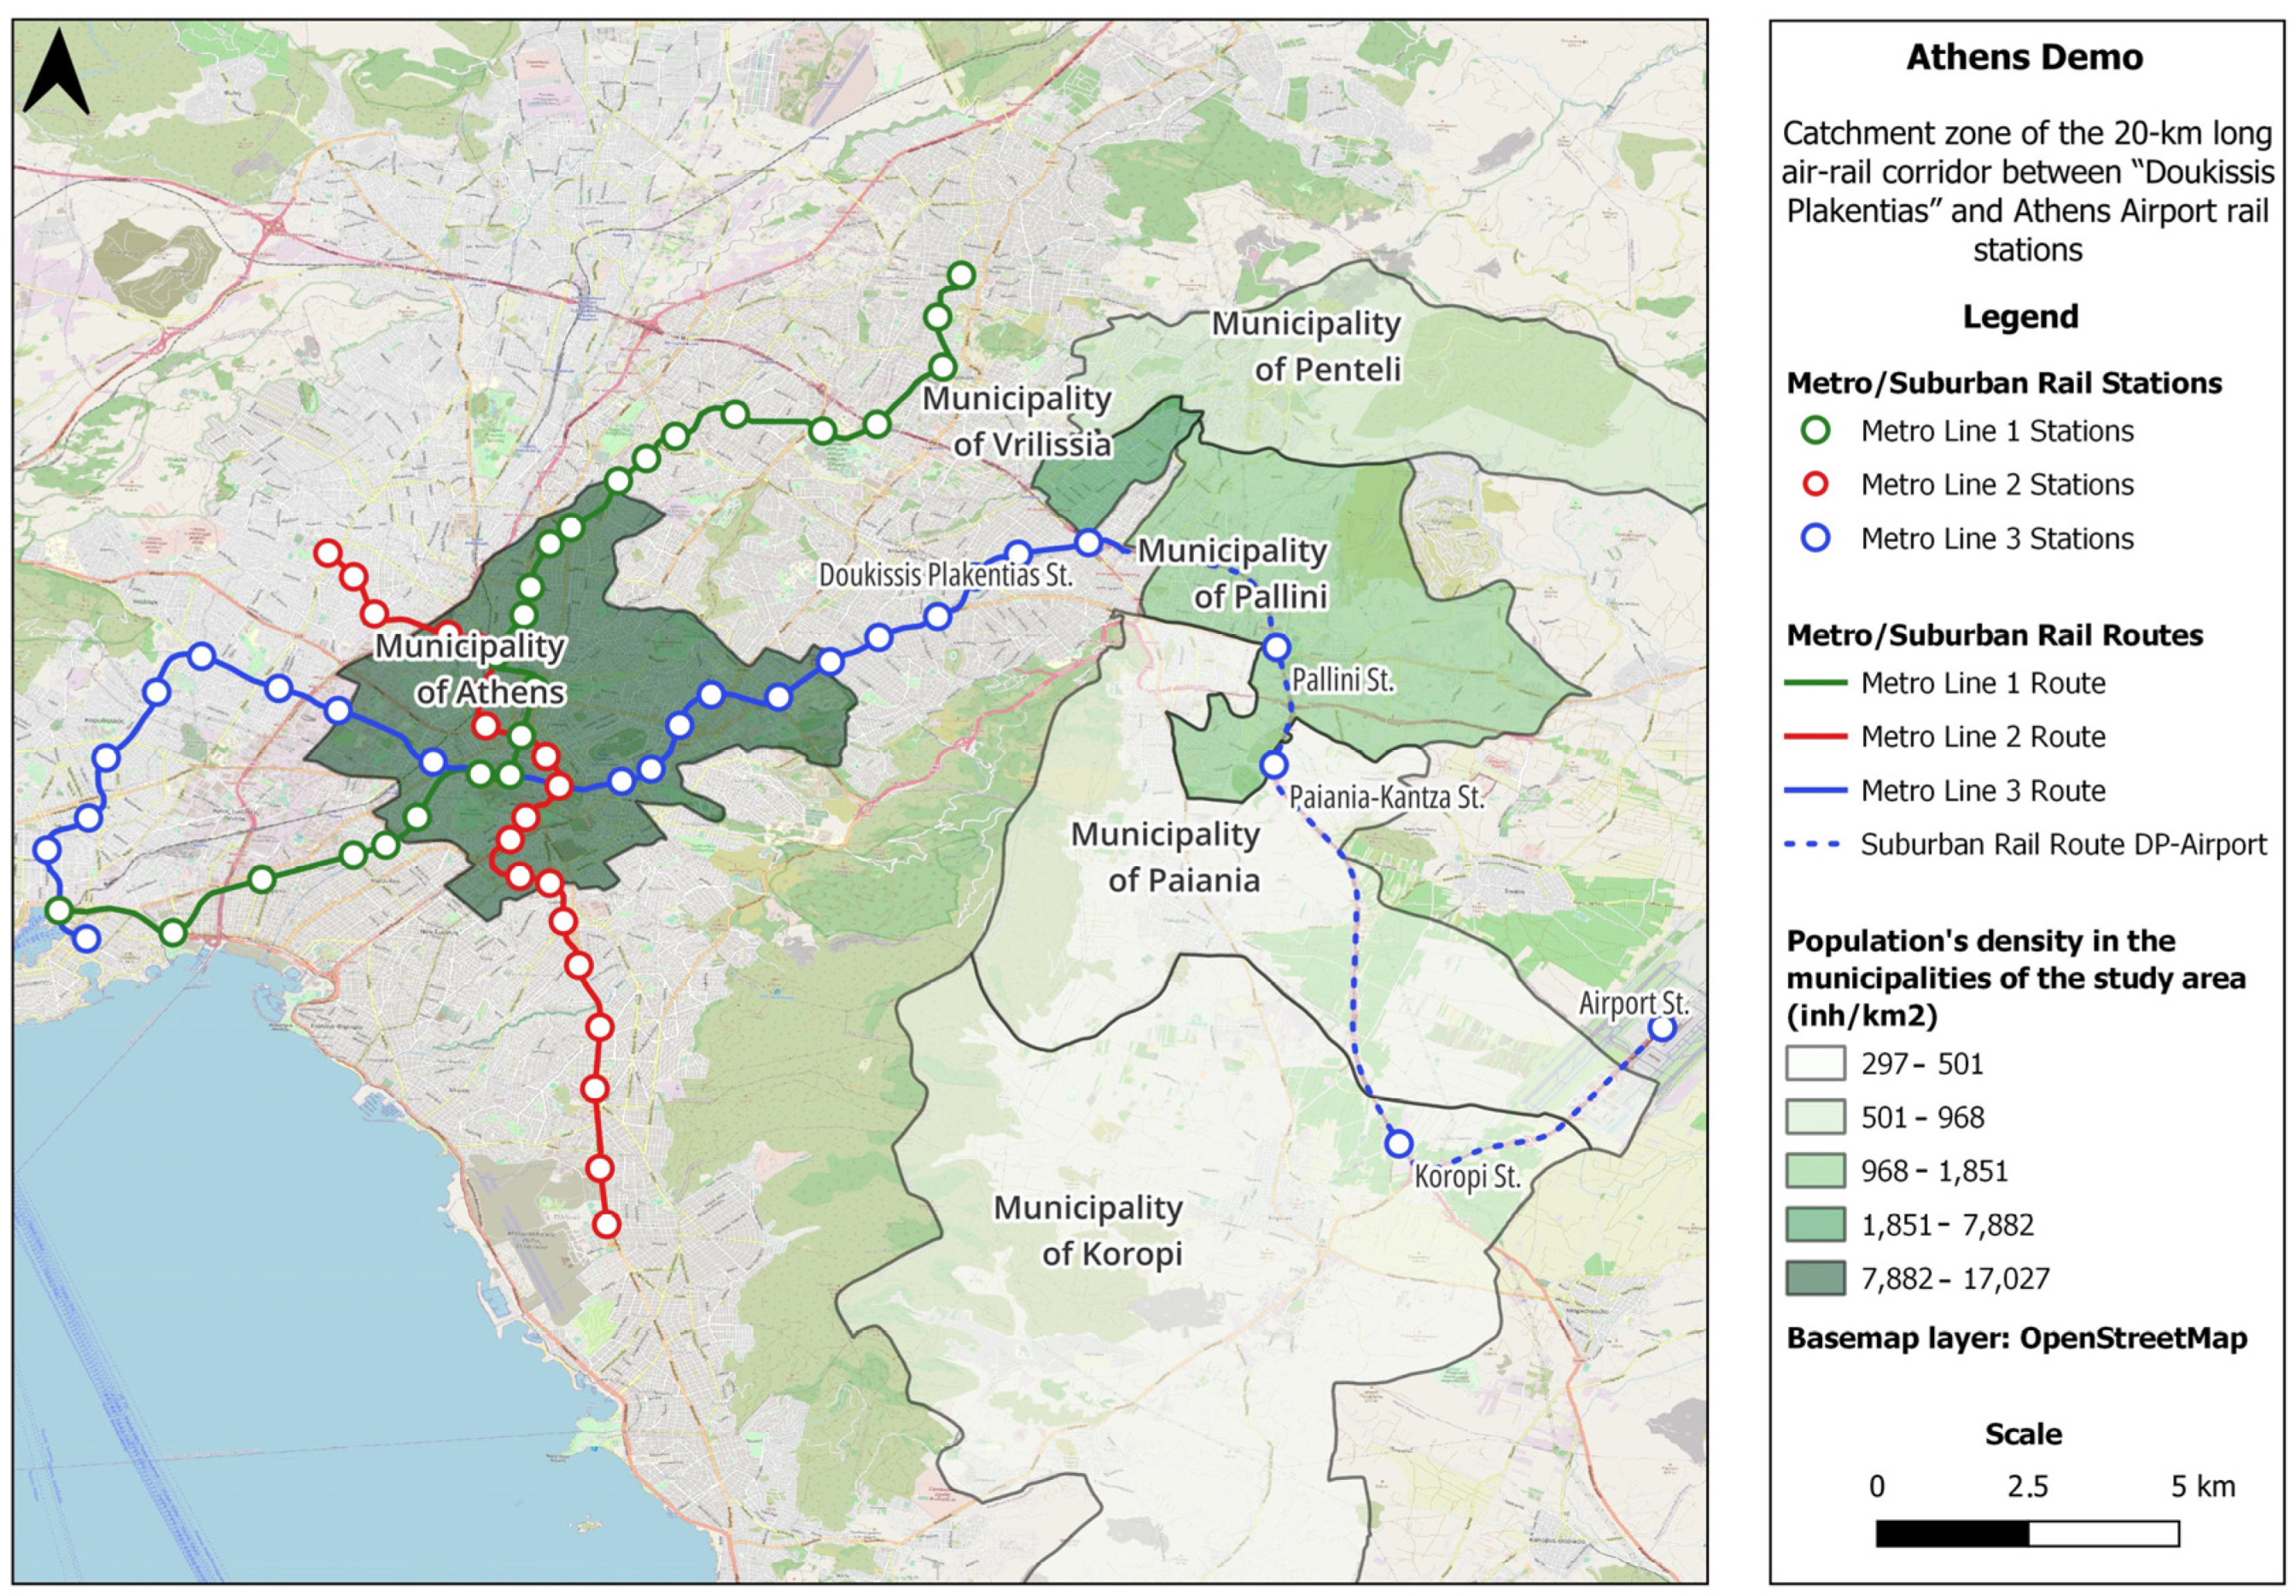
3.2. Demo Site

The city of Athens is located in the region of Attica and is the capital and largest city of Greece, as well as the seventh-largest city in the European Union. The region of Attica has an area of 3808 km2, a population of about 3,923,000 inhabitants, and is administratively divided into 113 municipalities, with the city of Athens being divided into 7 districts due to its size [40].
Attica’s public transportation network consists of five different modes of public transport modes: metro, suburban railroad, tramway, buses, and trolleybuses, operated by different service providers. The Athens metro network includes three lines with 67 stations, covering a length of 85.3 km and carrying about 1,400,000 passengers per day [41,42]. Line 1 was put into service in 1869, and lines 2 and 3 in 2000. A total of 39 new metro stations were added to the system in 2004, 2007, 2009, 2010, 2013, and 2021 [41,43]. The suburban railroad was put into operation in 2004. It is 20.7 km long and connects the Athens International Airport with the city center of Athens and the port of Piraeus [43]. The tramway was put into service in 2004, it operates on a 31.3 km network and connects the center of Athens with the area of P. Faliro (southern district next to Piraeus), and the southern suburb of Voula [43]. Finally, there is an extensive bus and trolley bus network, consisting of about 260 bus routes and 19 trolley bus routes, covering most of the Athens metropolitan area [43].
The demo area is the 20 km long corridor between Athens Airport and the Doukissis Plakentias metro station (with Park and Ride facilities), along Attiki Odos toll motorway. This area comprises the territories of five (5) municipalities with low population densities compared to the core center of the Athens municipality (Figure 1 and Table 2) [42,44,45].
The metro and suburban rail also serve the three intermediate stations between the Airport and D. Plakentias stations: Pallini, Kantza, Koropi. For the Athens demo, two test sites were foreseen:
  • Paid Park&Ride (P&R) with 500 parking spaces (PS) at D. Plakentias, which is located about 12 kms from the Athens’ city center (i.e., Syntagma square);
  • Free municipal Park&Ride with 300 PS at the Koropi station, which is located 13 kms south of D. Plakentias station.
Both stations are equipped with P&R facilities which encourage ride-sharing for multimodal travelers. Table 3 shows the main features of the parking facilities at both sites. The utilization rate at D. Plakentias P&R station is moderate due to parking charges. At the D. Plakentia hub, the P&R operator leases the land from the metro owner. The average parking duration is estimated to be 6–8 h. The parking lot at Koropi station is saturated during weekday morning peak hours. Furthermore, parking spillovers of about 300 passenger cars are recorded on a regular basis.
The overall goal of the demo is to enhance the connection of low-density Attica Region areas to public transport (PT) modes, and specifically to the metro lines, through the provision of demand-responsive ride-sharing services.
Travelers going to Athens (north and center) from peri-urban areas with a low frequency of PT services often use their cars for their trips. Ride-sharing services were offered through a dedicated app, for the first and/or last leg of the trip. More specifically, the objectives of the demo are as follows:
  • Investigate and provide input on smart multimodal integration of PT—ride-share mode, where ride-share acts as a complement to PT (i.e., feeder) for the first/last part of the route, thus increasing both car occupancy and urban rail ridership when connecting low- and high-density areas in Attica;
  • Serve as test sites for platform evaluation, considering new forms of shared mobility;
  • Evaluate innovative concepts of multimodality.
The target values of the relevant indicators of the demonstration are set and described in Table 4. The target value of each indicator represents the scope of the demo, e.g., the number of passengers involved using ride-sharing, the number of trips studied, the number of trips shifted to rail or multimodal solutions, etc. Table 4 reports the potential demand for the demo, as assessed by local stakeholders, and the newly assessed targets.

3.3. Mobile Application

The Travel Companion (TC) is an application offering intelligent multimodal mobility developed and updated by Shift2Rail IP4. The development had two main objectives:
  • To upgrade the existing features provided by Travel Companion;
  • To create a new feature where ride-sharing offers will be provided.
Regarding the first objective, a module named Offer Enhancer and Ranker was developed. This module enables the characterization of the offers that appear in the user’s search so the system can classify the different options according to their preferences. This is achieved through the retrieval of information about the user’s profile and the computation of various descriptors such as quickness, comfort, environmental friendliness, etc., to characterize the offers provided (Offer Categorizer). Finally, a Machine Learning (ML) model that receives as input the previously mentioned features ranks the offers to be presented to users. The Agreement Ledger is a blockchain-based module to increase trust in the management of agreements between IP4 stakeholders. The Incentive Provider module determines in advance if users are eligible for travel incentives. The rewards are connected to travel offers.
Regarding the integration of ride-sharing services, the Ride2Rail project developed a stand-alone Android application named Travel Companion (TC) (Figure 2). The TC makes a trip available to travelers who may be interested. On the other side, through the Driver Companion (DC), drivers can create rides according to which a detailed journey plan is being designed. If a traveler accepts it, then the DC notifies the driver. The DC provides valuable information during the journey by showing the origin of each traveler as well as his/her destination (Figure 3).
Both applications, the Travel and the Driver Companion, were demonstrated in the pilot of Athens.

3.4. User Case

During the demo period, several functionalities were tested within the “Travel Companion” and the “Driver Companion” app. More specifically, the functionalities integrated into the “Travel Companion” app were Offer Categorizer, Offer Matcher and Ranker, Agreement Ledger, Incentive Provider, and Crowd-Based TSP. The following storytelling provides the basic concept of the Athens demo site:
  • Marietta is an employee living in Koropi;
  • She commutes daily from Koropi to central Athens;
  • She needs to go shopping after work;
  • On her return trip home, she looks for a bus ride to reach Evangelismos metro station (i.e., central Athens);
  • After shopping in the area, she goes to the Doukissis Plakentias metro station in the late evening, when bus service is low;
  • Thanks to the Travel Companion, she uses a ride-sharing driver to reach home.
The Athens demo engagement strategy was twofold; extensive dissemination was conducted through social media and companies’ websites, while volunteers for testing the Travel Companion app were recruited through the conduction of a Stated Preference (SP) experiment. The latter is described in Section 3.5.

3.5. User Identification

Volunteers for testing the Ride2Rail Travel Companion app were recruited by conducting a Stated Preference (SP) experiment [45]. The main aim of the survey was to investigate (1) which users of the metro/suburban rail system in the Attica Region commute from the eastern regions to Athens and vice versa, and (2) their willingness to use a ride-sharing service for their first/last mile of their trip either as drivers or passengers. For these users, at the moment, the main segment of their trip is completed by metro or suburban rail, while the first/last segment is made by other modes or on foot.
Two distinct phases took place as part of the SP survey; in the first phase, questionnaires were screened at stations (field interview), using the Computer-Assisted Personal Interview (CAPI) technique.
Users of two metro/suburban rail stations, the Doukissis Plakentias station and the Koropi station, were approached for the survey purposes. The first phase included a screening questionnaire to ensure that the approached persons were eligible to participate in the full SP survey. The second phase, which included the full SP survey, was completed by the respondents at home or at work using the Computer-Assisted Web Interview (CAWI) technique (telephone assistance was available if it was requested).
Overall, 5400 persons were approached, with 2000 of them being eligible to participate in the survey. All in all, 1250 agreed to proceed and 414 completed the second phase. Then, 151 of the respondents who completed the second phase accepted to participate in the Athens demo by giving their email addresses. The completion of the survey required 15–20 min. These travelers completed a trip from home to their destination and vice versa, which usually consisted of three segments:
  • From home to the metro/suburban rail station (Doukissis Plakentias or Koropi);
  • From metro/suburban rail station to another metro/suburban rail station using the metro/suburban rail or a combination of these;
  • From metro/suburban rail station to their final destination by any transport mode or on foot.
The reverse order applies for the return home trip.
For the Athens demo, the first and last segments (first/last mile) are of interest for using ride-sharing services. Trip makers with respect to first/last mile can be classified into the following categories (strata):
  • Travelers who use PT bus;
  • Travelers who drive alone (solo drivers) to/from any of the two stations;
  • Travelers who drive with one or more co-riders to/from any of the two stations;
  • Travelers who take a taxi to/from any of the two stations;
  • Travelers who are riders—not drivers—of another car traveling to/from any of the two stations.
The first four categories may expect benefits in terms of travel time savings, travel cost reductions, comfort and convenience, or a combination of these. The last category is not of interest in the specific survey given that these travelers do not benefit from ride-sharing either as drivers or as riders.
Given that the survey includes two phases, the critical sample size concerns the second phase. As expected, the sample size of the first phase was much larger than the one of the second. The sample size depends on the following:
  • Eligibility criteria, i.e., whether approached people belong in one of the four eligible categories;
  • Response rate, i.e., the percentage of eligible persons that accept to participate in the survey;
  • The share of those who satisfied the eligibility criteria and accepted to participate in the second phase of the survey but did not fill the SP.
For determining the required sample size for the second phase of the survey, the choice-based sampling method was followed. A minimum sample size per stratum was set to ensure reliable findings. A combination of the various existing travel modes for the first/last of the inward/outward trip and trip purpose (commuting, other) resulted in eight different groups (4 strata × 2 trip purposes).
For the purposes of the study, a minimum of 35–40 valid surveys per group were regarded as sufficient. This cutoff greatly depends on how many cards must be sent in advance to each respondent. Since each interviewee received eight cards with alternate travel observations, a group of 40 interviewees can produce 320 observations. It is anticipated that 10–20% of the completed questionnaires will ultimately be useless because of bias in the answers or other issues. For this reason, the target sample size is increased by 25% for each group, so that the size of the usable questionnaires per group does not fall below 40.
Table 5 shows the groups to be surveyed and the indicative/targeted sample size for each hub location and trip purpose. The targeted sample for other purposes is slightly higher than the one for commuting, to account for wider variation.
For the screening phase, it was expected that at least 1500 to 2000 persons in total would have to be approached on the field in order to secure the figures of Table 5 per group and per station. An approximate figure of the exact ratio of persons accepting to participate over the persons approached was determined only after the end of the pilot survey and the first days of the main survey.
The initial questionnaire sample was 5400 respondents; 64.5% of the interviews were conducted at D. Plakentias station and the remaining 35.5% at Koropi station. More than 95% of the questionnaires were conducted on the metro/suburban railway platforms of both stations.
With regard to socioeconomic characteristics of the sample, 58% are women, while 52% of the sample belong to the age group 36–55, 38% belong to the age group 18–35, and 1% are over 65 years old. Almost 70% of the sample are either public or private sector employees, 9.7% are freelancers, and 13.4% are students. Concerning the economic status of the respondents, almost 20% stated an average monthly household income of up to EUR 1000, 43.8% earn between EUR 1000 and 2000, and 36.3% earn more than EUR 2000.
More than half of the sample (57.8%) belong to a household with three or four members, probably a family with one or two children, while approximately 30% belong to a household with one or two members. More than 83% of the respondents have one or two private vehicles in their household while only 6.5% belong to a household with no access to a private vehicle. Almost 71% live in a household with one or two members with a driving license.
More than 70% of the respondents have a driving license, while almost 60% of the respondents own a private passenger vehicle. More than half (51%) are commuters, approximately 25% of them travel for personal reasons, and 3% travel for business and other purposes.
For the majority of the respondents (84.6%), the trip origin is their home, and 54% of the respondents stated the workplace as their destination. Regarding the transport mode used during the first mile of their trip, almost 62% of them used a private car, 45.4% were drivers with no passengers (SOV), and 16.3% were drivers with passengers (HOV). The bus was used by 29.3% of the respondents, and 9.1% of the respondents used a taxi for the first mile of their trip (Figure 4).
Regarding the last mile of their trip, 68% of the respondents continued their trip on foot while 18.4% continued by bus (Figure 5).
To investigate the willingness of respondents to use ride-sharing as drivers or passengers, a series of cards with different travel alternatives were presented to them. More than 57% of the sample selected ride-sharing either as a driver or a rider.
Figure 6 presents the share of preferred modes according to the current transport mode respondents use for the first mile of their trip. For example, the majority of current bus users prefer to continue using the bus rather than shifting to a ride-sharing option. On the contrary, the majority of taxi users prefer to shift to ride-sharing as passengers, while SOV or HOV drivers prefer to ride-share as drivers.
By applying the survey results, it becomes possible to estimate the number of users who are willing to change their current travel mode to another mode, i.e., becoming ride-sharing drivers or riders for their trip segment home to the metro/suburban rail station.

3.6. Incentives and Participation

Following the SP experiment, 151 invitations were sent by email on July 18. Finally, more than 100 users stated that they would be willing to participate in the Athens demo; the final number of participants, however, was significantly lower, probably due to the unfavorable period of the demo execution, which coincided with people’s summer vacation (July and August are considered a vacation period in Greece).
At this point, it should be noted that, apart from the dissemination strategy and the SP survey, the Athens pilot partners provided specific incentives, in order to persuade identified users to participate in the Athens demo [46]. More specifically, ride-sharing passengers were awarded a voucher of EUR 30 for groceries (supermarket), while drivers were awarded a EUR 50 voucher for gasoline. All incentives were provided by specific companies in Athens, where users could redeem them after the completion of the demo. The final figures describing the participants at the Athens demo are as follows:
  • Number of registered users (travelers): 19;
  • Number of registered users (drivers): 9;
  • Number of users that completed the survey: 17.

4. Demo Planning and Implementation

During the planning and implementation of the demo, several challenges were faced. First, a low number of trip makers was recorded during the completion of the SP, as respondents are used to traveling by their private vehicle together with other riders or by using a taxi. Regarding the execution of the survey, the most difficult issue was related to respondents’ consent. The survey platform used did not provide a related feature and clicking on a box was not approved as adequate by the project partners’ Data Protection Officer. To overcome this issue, hard-copy statements were also developed and distributed to respondents.
The main challenges that were faced during the execution of the demo and the proposed directions to address them are analyzed and presented in the following sections.

4.1. Planning of the Demo

The ride-sharing demonstration in Athens was scheduled to last two working weeks, from the 11th of July until the 22nd. However, due to various technical issues that arose during the testing week (i.e., 4–8 July), the project partners decided to postpone it for a week. During this week, all efforts were placed on the improvement of the application and the overcoming of identified issues. As a result, the demo lasted 1 week, from 18–22 July 2022. The month of July was selected in order to include, apart from local commuters, tourists visiting Athens during the specific time period. This choice, however, had a negative side effect, since in July, ambient conditions due to high temperatures are not favorable for staying (for the case of tourists) and traveling by public transport in Athens. Moreover, the postponement of the demo made the circumstances even less favorable for the participation of local users. A significant decrease in the number of actual demo participants compared to the number of participants who agreed during the SP to participate in the demo was recorded. Therefore, one of the main lessons learned is that it is of imperative importance to plan well in advance the time period during which the actual demo will take place and inform potential participants. Implementing a demo during the summer, while high temperatures are recorded and during holiday seasons, should be avoided at all costs.
Additionally, the time frame that was foreseen for the technical testing of the application was one week before the actual demo. This proved to be insufficient in terms of working days, and led to the demo being postponed and shortened by one week. The technical partners along with the demo leaders strenuously worked on optimizing the application in a very short period of time to prepare it for the demonstration. Thus, the technical testing should be scheduled to initiate at least 3 weeks before the demo and last for at least 2 weeks.

4.2. Allocation of Responsibilities

One of the things that emerged during the application testing was that responsibilities were not as clear as they should have been due to the large number of stakeholders involved. In several cases, more than one person per company/organization was involved, which sometimes led to misunderstandings about who was responsible for solving each problem. For this reason, it is important to identify responsible partners for each role in advance and to designate at least 1–2 people per partner as points of contact.

4.3. Translation of the Travel Companion (TC)

During the preparation of the Travel Companion, one of the issues discussed at length was the translation of the application into the local language. In the case of Athens, the local partners decided that it would be better to translate the app into Greek, as some of the targeted user groups may not be familiar with English. Some of the key conclusions and lessons learnt from this process include the following:
  • The demo leader must decide which parts of the app should be translated. It was decided that presenting a partially translated application would be confusing;
  • Due to the lack of context, since the translation was more word-by-word within the application, the translation does not always reflect the actual word meaning;
  • Place names should be available in the local language.

4.4. Travel Companion (TC) Download

The Travel Companion has been developed in two different modules: the Driver Companion and the Travel Companion. If a user wanted to participate as both a driver (offering rides) and a traveler (being a passenger), they had to download and install these two different applications. This process assumed that the user had a fairly high level of technological knowledge regarding the installation and use of apps. However, this is not the case for the average user to whom the project demo was aimed.
In addition, drivers and travelers were offered a separate user manual and terms and conditions. It would be more efficient and user-friendly if only a download had to be requested, a user guide to be read through, and a document with the terms and conditions accepted.

4.5. Operational and Technical Issues

The key operational and/or technical challenges that have been identified and should be resolved in future efforts are as follows:
  • Addresses and Points of Interest (POIs) from other countries (also participating in the project and demos) need to be either deleted or hidden during the pilot period in a given city. It was confusing for users to identify a specific address when places from other countries were available;
  • Using the available map was the easiest way to identify an origin or destination; this is also related to the challenge mentioned above;
  • Loading a ride request or offer required more than the average wait time for a mobile user;
  • Ride offers from drivers were sometimes not assigned to a traveler;
  • The technical terminology used in the provided guidance made it unfriendly to the everyday user.

4.6. Survey

During the implementation of the pilot, users were asked to complete a survey to rate their overall satisfaction with the Travel Companion (TC). The survey was sent out twice during the demo week and once at the end of the week to remind users to participate.
After completing the survey, users were asked to send an email with a code provided at the end of the survey to receive their gift (supermarket or gas station coupon). The format of the code was misleading, so participants did not return it to request their prize.
The main conclusion drawn from this process was that the survey should be automatically sent to the user immediately after using the app. It was observed that after the email was sent, 3–5 users completed the survey immediately. This proves that users tend to complete the survey when it is sent to them. If the survey had been sent to the participants at the end of the trip, the number of completed surveys would have been much higher.

4.7. Lessons Learned

The SP results revealed how travelers would be willing to commute based on their travel and sociodemographic characteristics. Bus users, for different time and cost values, preferred to travel by their current transport mode compared to the alternative ride-sharing options. On the other hand, taxi users preferred to ride-share as a rider, while SOV or HOV drivers preferred to ride-share as drivers. With respect to the choices according to gender, men chose at a greater degree to ride-share as drivers, while women preferred to ride-share as passengers. The older the respondents’ age, the less likely they were to choose an alternative travel option compared to the current transport mode used. On the contrary, respondents falling in younger ages preferred to a higher degree sharing rides as riders.
One of the most important conclusions of the SP experiment [45], is that users of first/last mile ride-sharing in East Attica perceive it as complementary to the metro line, but antagonistic to bus feeder services. This is an important conclusion in terms of linking public transport systems and Mobility as a Service (MaaS) solutions.
The discussion of the lessons learned during the planning and implementation of the ride-sharing service is summarized in the list that follows.
  • Lack of awareness: One of the primary barriers to ride-sharing demonstrations is the lack of awareness [47,48] and understanding among potential participants. More specifically, participants may not be familiar with the concept of ride-sharing or the benefits that it offers. In a similar context, Timmer, Bosehans, and Henkel (2023) [49] found that the greatest hindrance in promoting multimodal commuting instead of monomodal is the lack of a positive attitude toward low-carbon mobility options, and they suggested that employers should encourage and reward sustainable multimodal commuting. It requires effective marketing and communication strategies to raise awareness and educate the public about the advantages of ride-sharing and multimodality. In this context, the CHUMS project included in its measures an awareness-raising event called Carpool Week [22]. Finally, the duration of the incentives after the completion of the demo should be considered to persuade participants to use the mobility service for longer (if the duration is extended beyond the demo period).
  • Limited participation: Ride-sharing demonstrations require a critical mass of participants, both drivers and passengers, to be effective [24,33]. If the number of people willing to share rides is limited, it becomes challenging or impossible to form viable ride-sharing groups and develop a successful and sustainable service. Achieving a sufficient number of participants can be difficult, especially in areas with low population density or where public transport options are readily available. For example, a corridor strategy was adopted in the Carpool Pilot Project [33] to build toward critical mass according to a previous Avego study. Due to the large number of participants that dropped out, restricting the service to only two routes made sense in the context of focused marketing, approval, and adoption activities to achieve critical mass and to facilitate a useful pool of “approved” participants. It is noteworthy that during the COVID-19 pandemic in Greece, the number of daily trips per person was reduced by 50%, and the share of public transport trips decreased from 22% to 0.2% [39]. This was an additional challenge in recruiting a critical mass of participants for the demonstration.
  • Geographic constraints: Ride-sharing demonstrations face geographical challenges, as in areas with dispersed populations or inadequate road infrastructure, it is difficult to establish convenient ride-sharing routes. Commuters may need to travel long distances to meet up with other participants or wait in isolated/undesignated areas, thus reducing the feasibility and attractiveness of ride-sharing.
  • Scheduling and flexibility: Coordinating schedules among participants can be a significant challenge. In real life, people have different work schedules, varying commitments, and unexpected changes in their daily routines. Aligning schedules and ensuring flexibility can be difficult, leading to potential difficulties in organizing and maintaining ride-sharing arrangements in advance. Stiglic et al. (2016) [50] studied the impact on the matching rate of different flexibility scenarios in conjunction with the number of announced trips in dynamic ride-sharing systems. The results showed that a low system-wide matching flexibility of 5 min significantly limits the ability of the system to establish matches. On the other hand, a higher matching flexibility can make up for a lack of density. For example, a matching flexibility of 30 min results in matching rates of 55.9% on average at the lowest density. A solution to this may be the establishment of ride-sharing services among limited communities (e.g., companies, universities) as implemented in CHUMS and various CIVITAS initiatives [22,25].
  • Trust and compatibility: Successful ride-sharing depends on establishing trust and compatibility among participants [1,3,36,46,51]. According to Morency (2006) [52], her study based on a large-scale OD survey revealed that approximately 70% of all ride-sharing trips were intra-household. People need to feel comfortable with their fellow passengers, especially when it comes to safety, reliability, and adhering to agreed-upon rules. Building trust within a ride-sharing group or community requires time that is not available within the framework of a ride-sharing demonstration. If participants do not feel compatible or comfortable, they may hinder the success of the ride-sharing demonstration or service. To address this issue, some ride-sharing schemes [22,25] defined as target groups limited communities such as big companies or universities.
  • Incentives and disincentives: The availability and effectiveness of incentives play a crucial role in promoting ride-sharing, as indicated in previous ride-sharing studies [33,36,53,54,55]. A lack of appropriate incentives, such as reduced tolls, dedicated ride-sharing lanes, or financial incentives, may discourage potential participants from engaging in such demonstrations. Similarly, disincentives, such as limited parking spaces or inconvenient pick-up and drop-off locations, can deter individuals from choosing ride-sharing as a comfortable transport option.
  • Regulatory and legal challenges: Ride-sharing demonstrations may face regulatory and legal barriers. Local transport regulations, insurance requirements, liability concerns, and privacy issues may pose challenges to the implementation of ride-sharing initiatives. According to Anthopoulos and Tzimos (2021) [23], the lack of interconnection with means of public transport in cities has been reported as a significant challenge for the implementation of ride-sharing schemes. Overcoming these obstacles requires collaboration between relevant authorities, policy makers, and stakeholders.
Finally, the lack of a smartphone or access to mobile technology may be a significant barrier to participating in digital ride-sharing platforms. Smartphones and mobile apps have become integral to the functioning of many modern ride-sharing services, making it challenging for those without access to such technology to take advantage of these platforms [1]. The participants in the pilot did not face major challenges regarding the use of the application. However, this finding is not representative since only 1% of the sample was older than 65 years old. The elderly population often faces unique challenges when it comes to adopting and using smartphone apps [56]; while some older individuals are tech-savvy and embrace new technologies, many others may find it challenging due to factors such as limited digital literacy, physical limitations, and reluctance to change. By proactively addressing the lack of smartphone barriers and promoting alternative access methods, such as digital literacy training and in-person support, we can ensure that ride-sharing remains an inclusive and sustainable transport option for a more diverse range of individuals.
Addressing these challenges requires a multi-faceted approach involving public awareness campaigns, supportive policies, infrastructure development, effective scheduling tools, and incentives to encourage participation. It also requires ongoing evaluation and adaptation of strategies to ensure the long-term success of ride-sharing demonstrations.

5. Conclusions

The overall implementation of the demo showed that the ride-sharing concept is generally considered a viable solution for transport in urban and peri-urban areas, both as a stand-alone mode and as part of a multimodal trip. Gaining knowledge of the complementary modes that support transit is useful for transport modeling, infrastructure planning, urban planning, and health research [27].
With respect to ride-sharing, several projects and studies confirm that there are a number of challenges in planning and implementing such systems, including engaging a critical mass of users, supporting digital services, and receiving feedback from participants.
This study outlined the planning and implementation process, as well as key challenges and lessons learned related to the ride-sharing/public transit demo in Athens. These are summarized below:
  • Efficient planning of the demo is of imperative importance for its success. Holiday seasons should be avoided, while sufficient time should be foreseen for testing the application, before making it available to actual users;
  • Clear responsibilities should be allocated to involved parties throughout all phases: planning, testing, demo execution;
  • Having the application translated into the local language is an added value and a facilitator of the demo’s success. This, however, is true only in the case of a high-quality, ideally professional, translation;
  • Technical testing of the application should be carried out enough time before the pilot (e.g., at least 3 weeks) and last a sufficient period of time (e.g., at least 2 weeks);
  • The ride-sharing app should be available in only one download, accompanied by one user guide and one document of terms and conditions to which the user needs to agree;
  • No POIs from other countries should be included in the app; also, shorter loading time, efficient matching between driver and traveler, and a user-friendly guide are a few of the operational and technical issues that need to be resolved;
  • A short survey which is sent immediately after the user has tested the app ensures high participation in the evaluation and provision of high-quality input.
Aside from the demonstration challenges, the present study also has additional limitations, such as the rather small number of participants. In addition, it should be noted that measures to protect travelers from COVID-19 were active in Athens during the demo period, which posed major difficulties for the demo pilot partners in recruiting travelers (i.e., convincing travelers to participate in the trials and make trips, and especially convincing drivers to share their private vehicles with strangers). Similar to other European cities that faced a sharp decline in public transport use and changes in daily mobility due to the COVID-19 pandemic, travelers in Athens, Greece, were not expected to use public transport [39]. This fact resulted in fewer commuters and pilot testers.
Although the duration of the demo was not long, the results did not deviate from the literature findings regarding the challenges of implementing public transit ride-sharing, indicating that the lessons learned and the planning process are transferable to other sites.
In summary, successful stakeholder engagement in the early stages leads to higher adoption of multimodal travel. Over time, stakeholder engagement should evolve into more structured and sustained forms of collaboration that enable strategic functions, evaluation, and monitoring, which should lead to the achievement of desired mobility patterns and environmental goals [26]. Future research steps should focus on the development of a robust technological application that takes into account the characteristics of local participants and develops business models that enable public transport and ride-sharing providers to work together to develop a reliable and sustainable multimodal system.

Author Contributions

Conceptualization, A.K.; methodology, L.M. and A.K.; formal analysis, L.M., A.K. and E.A.; resources, L.M., A.K. and A.D.; writing—original draft preparation, L.M., A.K. and E.A; writing—review and editing, L.M. and G.A.; visualization, L.M.; supervision, A.K. and G.A.; funding acquisition, G.A. All authors have read and agreed to the published version of the manuscript.

Funding

This research was funded by the European Union’s Horizon 2020 Research and Innovation Programme under Grant Agreement No. 881825.

Institutional Review Board Statement

Not applicable.

Informed Consent Statement

Not applicable.

Data Availability Statement

Not applicable.

Conflicts of Interest

The authors declare no conflict of interest.

References

  1. Mitropoulos, L.; Kortsari, A.; Ayfantopoulou, G. A Systematic Literature Review of Ride-Sharing Platforms, User Factors and Barriers. Eur. Transp. Res. Rev. 2021, 13, 61. [Google Scholar] [CrossRef]
  2. Code of Virginia Code—Chapter 14. Ridesharing. Available online: https://law.lis.virginia.gov/vacodefull/title46.2/chapter14/ (accessed on 4 August 2023).
  3. Furuhata, M.; Dessouky, M.; Ordóñez, F.; Brunet, M.-E.; Wang, X.; Koenig, S. Ridesharing: The State-of-the-Art and Future Directions. Transp. Res. Part B Methodol. 2013, 57, 28–46. [Google Scholar] [CrossRef]
  4. Wang, F.; Ross, C.L. New Potential for Multimodal Connection: Exploring the Relationship between Taxi and Transit in New York City (NYC). Transportation 2019, 46, 1051–1072. [Google Scholar] [CrossRef]
  5. Haustein, S.; Kroesen, M. Shifting to More Sustainable Mobility Styles: A Latent Transition Approach. J. Transp. Geogr. 2022, 103, 103394. [Google Scholar] [CrossRef]
  6. Lygnerud, K.; Nilsson, A. Business Model Components to Consider for Ridesharing Schemes in Rural Areas—Results from Four Swedish Pilot Projects. Res. Transp. Bus. Manag. 2021, 40, 100553. [Google Scholar] [CrossRef]
  7. Heinen, E.; Mattioli, G. Multimodality and CO2 Emissions: A Relationship Moderated by Distance. Transp. Res. Part D Transp. Environ. 2019, 75, 179–196. [Google Scholar] [CrossRef]
  8. Chlond, B. Making People Independent from the Car—Multimodality as a Strategic Concept to Reduce CO2-Emissions. In Cars and Carbon: Automobiles and European Climate Policy in a Global Context; Zachariadis, T.I., Ed.; Springer: Dordrecht, The Netherlands, 2012; pp. 269–293. ISBN 978-94-007-2123-4. [Google Scholar]
  9. Nobis, C. Multimodality—Facets and Causes of Sustainable Mobility Behaviour. Transp. Res. Rec. 2007, 2010, 35–44. [Google Scholar] [CrossRef]
  10. Goletz, M.; Haustein, S.; Wolking, C.; L’Hostis, A. Intermodality in European Metropolises: The Current State of the Art, and the Results of an Expert Survey Covering Berlin, Copenhagen, Hamburg and Paris. Transp. Policy 2020, 94, 109–122. [Google Scholar] [CrossRef]
  11. Heinen, E.; Mattioli, G. Does a High Level of Multimodality Mean Less Car Use? An Exploration of Multimodality Trends in England. Transportation 2019, 46, 1093–1126. [Google Scholar] [CrossRef]
  12. An, Z.; Heinen, E.; Watling, D. When You Are Born Matters: An Age-Period-Cohort Analysis of Multimodality. Travel Behav. Soc. 2021, 22, 129–145. [Google Scholar] [CrossRef]
  13. Groth, S.; Hunecke, M.; Wittowsky, D. Middle-Class, Cosmopolitans and Precariat among Millennials between Automobility and Multimodality. Transp. Res. Interdiscip. Perspect. 2021, 12, 100467. [Google Scholar] [CrossRef]
  14. Groth, S.; Kuhnimhof, T. Multimodality in Transportation. In International Encyclopedia of Transportation; Elsevier: Amsterdam, The Netherlands, 2021; pp. 118–126. ISBN 978-0-08-102672-4. [Google Scholar]
  15. Seyedabrishami, S.; Mamdoohi, A.; Barzegar, A.; Hasanpour, S. Impact of Carpooling on Fuel Saving in Urban Transportation: Case Study of Tehran. Procedia–Soc. Behav. Sci. 2012, 54, 323–331. [Google Scholar] [CrossRef]
  16. Shaheen, S.; Cohen, A.; Bayen, A. The Societal Value of Carpooling: The Environmental and Economic Value of Sharing a Ride. 2018. [Google Scholar] [CrossRef]
  17. Noussan, M.; Jarre, M. Assessing Commuting Energy and Emissions Savings through Remote Working and Carpooling: Lessons from an Italian Region. Energies 2021, 14, 7177. [Google Scholar] [CrossRef]
  18. Huang, H.; Bucher, D.; Kissling, J.; Weibel, R.; Martin, R. Multimodal Route Planning With Public Transport and Carpooling. IEEE Trans. Intell. Transp. Syst. 2018, 20, 3512–3525. [Google Scholar] [CrossRef]
  19. Wright, S.; Nelson, J.D.; Cottrill, C.D. MaaS for the Suburban Market: Incorporating Carpooling in the Mix. Transp. Res. Part A Policy Pract. 2020, 131, 206–218. [Google Scholar] [CrossRef]
  20. Martins, L.D.C.; De La Torre, R.; Corlu, C.G.; Juan, A.A.; Masmoudi, M.A. Optimizing Ride-Sharing Operations in Smart Sustainable Cities: Challenges and the Need for Agile Algorithms. Comput. Ind. Eng. 2021, 153, 107080. [Google Scholar] [CrossRef]
  21. He, W.; Hwang, K.; Li, D. Intelligent Carpool Routing for Urban Ridesharing by Mining GPS Trajectories. IEEE Trans. Intell. Transport. Syst. 2014, 15, 2286–2296. [Google Scholar] [CrossRef]
  22. Engels, D.; Van Den Bergh, G. Deliverable 4.2: Impacts of CHUMS Measures; Interreg Europe: London, UK, 2016. [Google Scholar]
  23. Anthopoulos, L.G.; Tzimos, D.N. Carpooling Platforms as Smart City Projects: A Bibliometric Analysis and Systematic Literature Review. Sustainability 2021, 13, 10680. [Google Scholar] [CrossRef]
  24. Derboni, M.; Rizzoli, A.-E.; Montemanni, R.; Jamal, J.; Kovacs, N.; Cellina, F. Challenges and Opportunities in Deploying a Mobility Platform Integrating Public Transport and Car-Pooling Services. In Proceedings of the 18th Swiss Transport Research Conference, Ascona, Switzerland, 16 May 2018. [Google Scholar]
  25. CIVITAS. Sustainable Mobility Highlights 2002–2012; CIVITAS Initiative: Brussels, Belgium, 2013. [Google Scholar]
  26. Mitropoulos, L.; Kortsari, A.; Mizaras, V.; Ayfantopoulou, G. Mobility as a Service (MaaS) Planning and Implementation: Challenges and Lessons Learned. Future Transp. 2023, 3, 498–518. [Google Scholar] [CrossRef]
  27. Clifton, K.; Muhs, C.D. Capturing and Representing Multimodal Trips in Travel Surveys: Review of the Practice. Transp. Res. Rec. 2012, 2285, 74–83. [Google Scholar] [CrossRef]
  28. O’Riordan, V.; Rogan, F.; Ó Gallachóir, B.; Mac Uidhir, T.; Daly, H. How and Why We Travel—Mobility Demand and Emissions from Passenger Transport. Transp. Res. Part D Transp. Environ. 2022, 104, 103195. [Google Scholar] [CrossRef]
  29. Kłos-Adamkiewicz, Z.; Szaruga, E.; Gozdek, A.; Kogut-Jaworska, M. Links between the Energy Intensity of Public Urban Transport, Regional Economic Growth and Urbanisation: The Case of Poland. Energies 2023, 16, 3799. [Google Scholar] [CrossRef]
  30. Masoud, N.; Nam, D.; Yu, J.; Jayakrishnan, R. Promoting Peer-to-Peer Ridesharing Services as Transit System Feeders. Transp. Res. Rec. 2017, 2650, 74–83. [Google Scholar] [CrossRef]
  31. Gärling, T.; Steg, L. (Eds.) Threats from Car Traffic to the Quality of Urban Life: Problems, Causes, and Solutions; Emerald Group Publishing Limited: Bingley, UK, 2007; ISBN 978-0-08-048144-9. [Google Scholar]
  32. Clauss, T.; Döppe, S. Why Do Urban Travelers Select Multimodal Travel Options: A Repertory Grid Analysis. Transp. Res. Part A Policy Pract. 2016, 93, 93–116. [Google Scholar] [CrossRef]
  33. AVEGO. SR 520 Real-Time Ridesharing Pilot Summary Report; AVEGO: New York, NY, USA, 2011; p. 33. [Google Scholar]
  34. Pigalle, E.; Aguiléra, A. Ridesharing in All Its Forms—Comparing the Characteristics of Three Ridesharing Practices in France. J. Urban Mobil. 2023, 3, 100045. [Google Scholar] [CrossRef]
  35. Eltis Reducing Commuter Traffic in Val de Saône with Carpooling (France). Available online: https://www.eltis.org/discover/case-studies/reducing-commuter-traffic-val-de-saone-carpooling-france (accessed on 4 August 2023).
  36. Mitropoulos, L.; Kortsari, A.; Ayfantopoulou, G. Factors Affecting Drivers to Participate in a Carpooling to Public Transport Service. Sustainability 2021, 13, 9129. [Google Scholar] [CrossRef]
  37. Nechita, E.; Crişan, G.-C.; Obreja, S.-M.; Damian, C.-S. Intelligent Carpooling System. New Approaches Intell. Control 2016, 107, 43–72. [Google Scholar]
  38. Živojinović, T.; Petrović, M.; Bojkovic, N.; Pejcic-Tarle, S. Carpooling as a Measure for Achieving Sustainable Urban Mobility: European Good Practice Examples. Mach. Technol. Mater. 2015, 9, 40–43. [Google Scholar]
  39. Kłos-Adamkiewicz, Z.; Gutowski, P. The Outbreak of COVID-19 Pandemic in Relation to Sense of Safety and Mobility Changes in Public Transport Using the Example of Warsaw. Sustainability 2022, 14, 1780. [Google Scholar] [CrossRef]
  40. Economopoulou, M.A.; Economopoulou, A.A.; Economopoulos, A.P. A Methodology for Optimal MSW Management, with an Application in the Waste Transportation of Attica Region, Greece. Waste Manag. 2013, 33, 2177–2187. [Google Scholar] [CrossRef] [PubMed]
  41. Zarkadoula, M.; Giannakopoulou, K.; Goumas, G.; Tsarmpopoulou, M.; Leoutsakos, G.; Deloukas, A.; Apostolopoulos, I.; Kiriazidis, D. Energy Audit in Athens Metro Stations for Identifying Energy Consumption Profiles of Stationary Loads. Int. J. Sustain. Energy 2022, 41, 1142–1163. [Google Scholar] [CrossRef]
  42. Deloukas, A.; Georgiadis, G.; Papaioannou, P. Shared Mobility and Last-Mile Connectivity to Metro Public Transport: Survey Design Aspects for Determining Willingness for Intermodal Ridesharing in Athens. In Proceedings of the International Conference on Computational Science and Its Applications, Calagri, Italy, 1–4 July 2020; pp. 819–835, ISBN 978-3-030-58802-1. [Google Scholar]
  43. Spyropoulou, I. Impact of Public Transport Strikes on the Road Network: The Case of Athens. Transp. Res. Part A Policy Pract. 2020, 132, 651–665. [Google Scholar] [CrossRef]
  44. Hellenic Statistical Authority. Official Website. Available online: https://www.statistics.gr/en/home/ (accessed on 4 August 2023).
  45. Attiko Metro, S.A. TSA416/22 Final Report, Revealed and Stated Preference Survey for Willingness to Accept Carpooling; Attiko Metro S.A.: Athens, Greece, 2022. [Google Scholar]
  46. Asimakopoulou, M.N.; Mitropoulos, L.; Milioti, C. Exploring Factors Affecting Ridesharing Users in Academic Institutes in the Region of Attica, Greece. Transp. Plan. Technol. 2022, 45, 449–472. [Google Scholar] [CrossRef]
  47. Chaube, V.; Kavanaugh, A.L.; Perez-Quinones, M.A. Leveraging Social Networks to Embed Trust in Rideshare Programs. In Proceedings of the 2010 43rd Hawaii International Conference on System Sciences, Honolulu, HI, USA, 5–8 January 2010; pp. 1–8. [Google Scholar]
  48. Malichová, E.; Pourhashem, G.; Kováčiková, T.; Hudák, M. Users’ Perception of Value of Travel Time and Value of Ridesharing Impacts on Europeans’ Ridesharing Participation Intention: A Case Study Based on MoTiV European-Wide Mobility and Behavioral Pattern Dataset. Sustainability 2020, 12, 4118. [Google Scholar] [CrossRef]
  49. Timmer, S.; Bösehans, G.; Henkel, S. Behavioural Norms or Personal Gains?—An Empirical Analysis of Commuters‘ Intention to Switch to Multimodal Mobility Behaviour. Transp. Res. Part A Policy Pract. 2023, 170, 103620. [Google Scholar] [CrossRef]
  50. Stiglic, M.; Agatz, N.; Savelsbergh, M.; Gradisar, M. Making Dynamic Ride-Sharing Work: The Impact of Driver and Rider Flexibility. Transp. Res. Part E Logist. Transp. Rev. 2016, 91, 190–207. [Google Scholar] [CrossRef]
  51. Hartwig, S.; Buchmann, M. Empty Seats Traveling: Next-Generation Ridesharing and Its Potential to Mitigate Traffic- and Emission Problems in the 21st Century; Technical Report; Nokia Research Center: Bochum, Germany, 2007. [Google Scholar]
  52. Morency, C. The Ambivalence of Ridesharing. Transportation 2007, 34, 239–253. [Google Scholar] [CrossRef]
  53. Olsson, L.E.; Maier, R.; Friman, M. Why Do They Ride with Others? Meta-Analysis of Factors Influencing Travelers to Carpool. Sustainability 2019, 11, 2414. [Google Scholar] [CrossRef]
  54. Shaheen, S.; Cohen, A. Shared Ride Services in North America: Definitions, Impacts, and the Future of Pooling. Transp. Rev. 2019, 39, 427–442. [Google Scholar] [CrossRef]
  55. De Almeida Correia, G.H.; de Abreu e Silva, J.; Viegas, J.M. Using Latent Attitudinal Variables Estimated through a Structural Equations Model for Understanding Carpooling Propensity. Transp. Plan. Technol. 2013, 36, 499–519. [Google Scholar] [CrossRef]
  56. Why Do Many Seniors Have Trouble Using Technology? Available online: https://www.noisolation.com/research/why-do-many-seniors-have-trouble-using-technology (accessed on 4 August 2023).
Figure 1. Athens Metro and suburban rail routes.
Sustainability 15 13755 g001
Figure 2. Travel Companion (TC) application.
Sustainability 15 13755 g002
Figure 3. Driver Companion (DC) application.
Sustainability 15 13755 g003
Figure 4. First-mile used transport mode.
Sustainability 15 13755 g004
Figure 5. Last-mile used transport mode.
Sustainability 15 13755 g005
Figure 6. Preferred transport mode per type of user (i.e., mode they currently use).
Sustainability 15 13755 g006
Table 1. Implementation challenges and barriers in ride-sharing pilot studies/projects.
Study/ProjectLocationChallenge/BarrierUser Group
SR 520 Real-time Rideshare Project [33]USA (Seattle and Bellevue)Reluctancy to share personal information during the approval process, which leads to limited recruitment of participants.Participants (drivers and riders)
SocialCar [24]Switzerland (Lugano)Recruitment of a critical mass of users.Participants (drivers and riders)
Data availability both in terms of quantity and quality (e.g., GTFS).Transport authorities
Changing Habits for Urban Mobility Solutions (CHUMS) [22]Romania (Craiova),
UK (Edinburgh),
France (Toulouse), Italy (Perugia),
Belgium (Leuven)
Difficulty in implementing ride-sharing in small target groups.Participants (drivers and riders)
Limited accessibility of certain cities and regions by public transport.Transport authorities
In the Leuven case study, companies prefer an integrated mobility solution.Participants (drivers and riders),
Local stakeholders
Stop Covoiturage [35]France (Val de Saône)Distrust of non-car users to take advantage of the service.Participants (drivers and riders)
A systematic literature review of ride-sharing
platforms, user factors and barriers [1]
N/APsychological barriers, with the most common ones being personal security, comfort, and privacy.Participants (drivers and riders)
Carpooling Platforms as Smart City Projects: A Bibliometric Analysis and Systematic Literature Review [23]N/AHigh car ownership.Participants (drivers and riders)
Lack of trust when commuting with strangers.Participants (drivers and riders)
Lack of interconnection with means of public transport in cities.Transport authorities
Table 2. Demographic and travel demand features of municipalities represented in the study area. (Source: [42,44,45]).
MunicipalityTotal Area (km2)PopulationPopulation Density (inh/km2)24 h Travel DemandPT Share (%)
Athens39.0664,04617,026.81,491,53178
Vrilissia3.930,7417882.364,14232
Penteli36.134,934967.727,05127
Pallini29.454,4151850.966,08830
Paiania53.226,668501.328,83327
Koropi102.030,307297.157,71226
Note: Data extracted from ELSTAT [45]—the data have been translated and the ELSTAT bears no responsibility for the result of the modification.
Table 3. P&R facilities’ features in the selected intermodal hubs (Source: [42]).
Metro/Suburban Rail StationArea (m2)CapacityFees per hour
Doukissis Plakentias (DP)15,200—paved630 spacesEUR 0.5 (up to 12 h per day)
Koropi (KR)6100—unpaved300 spacesFree
Table 4. Indicators and target values for the Athens demonstration.
IndicatorPotential DemandTarget
Passenger trips estimated80,000 trips (30,000 commuter trips) p.a.2000 p.a.
Maximum number of car trips potentially attracted to rail/ride-sharing 40,000 p.a.200 p.a.
Number of parking spaces designated for Ride2Rail at the urban gate D. Plakentias 5020 (during demo)
Number of parking spaces designated for Ride2Rail at the extra-urban Koropi station505 (during demo)
Number of app users during demo-50
Number of ride-sharing trips performed with the app during demo-10
p.a: passengers per annum.
Table 5. Sample size per population group, intermodal hub location, and trip purpose.
Intermodal HubDoukissis PlakentiasKoropiTotal
Transport
Mode
PT BusCarTaxiPT BusCarTaxi
SOV DriverHOV DriverSOV DriverHOV Driver
Trip Purpose
Commuting4040404030303030280
Other4545454535353535320
Total questionnaires8585858565656565600
Expected valid questionnaires7070707050505050480
Disclaimer/Publisher’s Note: The statements, opinions and data contained in all publications are solely those of the individual author(s) and contributor(s) and not of MDPI and/or the editor(s). MDPI and/or the editor(s) disclaim responsibility for any injury to people or property resulting from any ideas, methods, instructions or products referred to in the content.

