Article

Hyperspectral Estimation Model of Organic Matter Content in Farmland Soil in the Arid Zone

1
College of Geographical Science and Tourism, Xinjiang Normal University, Urumqi 830054, China
2
Xinjiang Laboratory of Arid Zone Lake Environment and Resources, Xinjiang Normal University, Urumqi 830054, China
*
Author to whom correspondence should be addressed.
Sustainability 2023, 15(18), 13719; https://doi.org/10.3390/su151813719
Submission received: 12 August 2023 / Revised: 4 September 2023 / Accepted: 13 September 2023 / Published: 14 September 2023
(This article belongs to the Section Soil Conservation and Sustainability)

Abstract

:
Soil organic matter (SOM) is one of the most important indicators of soil quality. Hyperspectral remote sensing technology has been recognized as an effective method to rapidly estimate SOM content. In this study, 173 samples (0–20 cm) were collected from farmland soils in the northwestern arid zones of China. Partial least squares regression (PLSR), support vector machine regression (SVMR), and random forests regression (RFR), based on 15 types of mathematical transformations of the original spectral data of soil, were applied for identifying the optimal estimation method. Distribution of SOM content was mapped using both ground-measured values and predicted values estimated based on the optimum models. Obtained results indicated that the important spectral wavebands with the highest correlation were identified as 421 nm, 441 nm, 1014 nm, 1045 nm, and 2351 nm for SOM in the soil. Spectral transformations had obvious effects on the spectral characteristics of SOM. The optimal estimation was obtained when RFR was combined with the reciprocal logarithmic first-order differential (RLFD) (R2 = 0.884, RMSE = 2.817%, MAE = 2.222) for SOM contents. Finally, the RFR-RLFD method had much better performance compared with the PLSR and SVMR models. Results of this study can provide an alternative to the application of the hyperspectral estimation of SOM in farmland soils in arid zones.

1. Introduction

Soil organic matter (SOM) is one of the most important indicators of soil fertility and quality [1]. SOM not only provides the nutrients necessary for crops and affects soil chemical, physical, and biological properties [2,3,4], but also affects the adsorption and retention mechanisms of pollutants in soil [5,6,7]. SOM is also significant for the ecosystem service, ecological environment [4,5]. These things considered, SOM is one of the most important factors for the sustainable development of agriculture in arid zones [8,9].
Conventionally, the laboratory chemical method of SOM content is always field sampling followed by the laboratory experimentation of collected soil samples [10]. However, the traditional method has high accuracy, but is complex, labor-intensive, cost-intensive, and time-consuming [11,12]. Therefore, it is of great significance to be able to identify the SOM content quickly and accurately.
A high-spectral remote sensing dataset has a strong correlation with soil properties, making them applicable for estimating soil attributes such as SOM content, soil moisture, and soil texture [2,6]. Hyperspectral remote sensing technology has the advantages of rapid and accurate monitoring and plays a critical role in the detection of soil properties, including soil moisture [13], salinity [14], electrical conductivity (EC) [15], heavy metals [16], trace elements [17], organic carbon [18], etc. Recently, with the promotion of hyperspectral resolution, the application of hyperspectral remote sensing technology to SOM estimating has also developed rapidly [19,20]. The spectrum of soil is highly correlated with SOM in the visible bands, especially in the red bands, with the most sensitive bands being the near-infrared spectrum [20,21]. Related research on the hyperspectral monitoring of SOM has indicated that the spectral information of soil samples can be highlighted and the mathematically transforming of the original spectral data can enhance the correlations between reflectivity and SOM content [20,22]. Several critical studies have also established various estimation models for SOM content, including simple linear regression (SLR), multiple stepwise linear regression (SMLR) [20], partial least squares regression (PLSR) [2], and machine learning techniques such as artificial neural networks (ANNs) [23], geographically weighted regression (GWR) [24], etc. For example, Meng et al. [25] utilized RFR to predict the SOM content and found that the 0.6-order reflectance captured more valuable details in satellite hyperspectral data. Zhou et al. [26] used the PLSR, SVMR, and RFR models to estimate the SOM content in the Three-Rivers Source Region of China. However, each method has its advantages and limitations.
However, the accuracy of hyperspectral inversion models is affected by natural conditions of the studied area, as well as the quality of the inputs data, spectral analysis methods, and model optimization algorithms [27]. The most appropriate estimation models for different soil types or soils with different geo-chemical properties in different regions are different [19]. And, there is no unified standard for selecting appropriate models to estimate SOM content. So far, there have been few pieces of literature found as yet on the hyperspectral inversion of organic matter contents of farmland soils in arid zones. Therefore, it is very important to analyze the possibility of the hyperspectral inversion of organic matter contents of farmland soils in arid zones.
The objectives of this study were to (a) identify the important spectral wavebands of SOM; (b) evaluate the potential application of 15 types of spectral transformation methods on SOM content; and (c) develop an optimum estimation model for SOM content of farmland in arid zones using the PLSR and two machine learning methods including SVMR and RFR.

2. Materials and Methods

2.1. Experimental Design

The experimental field was located in the Yanqi Basin (85°55′–87°25′ E, 41°51′–42°21′ N), which is one of the important pepper production regions of NW China (Figure 1).
The Yanqi Basin was located in the middle parts of the Tianshan Mountain and the northeastern parts of the Tarim Basin in northwestern arid zones of China, with farmlands of about 213,000 ha and with an altitude within 1050–1250 m. The climate is a continental arid climate with mean annual temperature, precipitation, and evaporation of 10.88 °C, 70 mm, and 1900 mm, respectively. The main soil types include the brown desert soil, saline soil, and gypsum desert soil [28]. The main crops are pepper, tomato, and cotton.
In August of 2016, a total of 173 surface soil samples (0–20 cm depth) were systematically collected from farmland soils in the study area. The spatial distributions of these soil samples, including both training and validation samples, were visualized in Figure 1. At each sampling point, five sub-samples of soil were taken at the same environment condition. These sub-samples were subsequently combined to create a single representative soil sample, which was then transported to the laboratory for further analysis. All collected samples were air dried and passed through a 60-mesh nylon sieve. Then, the soil organic carbon (SOC) contents of the collected samples were measured. The chemical analysis for SOC content was conducted using a Muffle Furnace System. Each soil sample was measured three times, and the mean value was used. Finally, the measured SOC content was converted to SOM content by multiplying a conversion factor of 1.724, according to the National Standard of China detailed in GB/T 9834–88 [29]. A normal distribution test was conducted in the measured data and then an abnormal distribution test to analyze the SOM content data after logarithmic transformation.

2.2. Indexes Measurement

The sampled farmland soils were divided into two groups, one was to determine the soil spectral reflectance, and the other was to determine the SOM. Spectral data of collected soil samples were measured using a FieldSpec®3 spectrometer (ASD, Analytical Spectral Devices, Boulder, CO, USA). The 60-mesh-sieved soil sample was placed on a black cardboard of 2 m × 2 m during the test, and the sensor probe of spectrometer was kept 15 cm above and vertical to the soil surface. To eliminate the effect of noise on spectral data during field measurements, the spectral curves were averaged, denoised, and smoothed. Ten spectral curves were processed using the View SpecPro averaging, and the arithmetic mean was taken as the original spectral reflectance. Certain hyperspectral bands may be affected by noise, stray light, or other interferences, resulting in poor data quality or unreliability [2]. In such cases, these affected bands can be removed to improve data quality and enhance the credibility of the analysis results. Therefore, unified removal of water absorption bands from the ranges of 350 to 400 nm, 1340 to 1430 nm, 1800 to 1960 nm, and 2400 to 2500 nm, and the total output was 1748 bands. Finally, the original spectra were smoothed using the Savitzky–Golay method [30], and the treated spectral curve was used as the spare soil spectral feature curve.

2.3. Data Processing and Analysis

2.3.1. Algorithm Construction

The quality of the inputs data can affect the accuracy of hyperspectral inversion models [31]. For improving the accuracy and stability of the hyperspectral inversion models, reducing the interference of the surrounding environment on the spectral data of soil samples, and systematically enhancing the SOM spectral information, the original spectral reflectance data were subjected to lgR, 1/lgR, lg(1/R), first-order differentiation (FD), second-order differentiation (SD), reciprocal first-order differentiation (RTFD), reciprocal second-order differentiation (RTSD), logarithmic first-order differentiation (LTFD), logarithmic second-order differentiation (LTSD), root mean first-order differentiation (RMSFD), root mean second-order differentiation (RMSSD), reciprocal logarithmic first-order differential (ATFD), reciprocal logarithmic second-order differential (ATSD), reciprocal logarithmic first-order differential (RLFD), and reciprocal logarithmic second-order differential (RLSD).

2.3.2. Algorithm Assessment Approach

In order to consider both the SOM content and the spectral data, the collected farmland soils were randomly divided into a training dataset (138 samples) and a validation dataset (35 samples) in a ratio of 3:1. The training dataset was used to construct estimation models, while the validation dataset was used to test the model accuracy.
Considering the operability, stability, and estimation ability of hyperspectral estimation models, partial least squares regression (PLSR), support vector machine regression (SVMR), and random forests regression (RFR) were used. PLSR is a popular method used to correlate soil spectral data with the SOM content. The PLSR method not only can provide a suitable regression model, but also can more comprehensively express related information [2]. SVMR is a pattern recognition method based on statistical learning theory, which can use a small amount of training data in a high-dimensional feature subset space to obtain the support vector [26]. RFR is a major branch of machine learning, which is widely used in nonlinear and large data problems. The RFR method is good at solving nonlinearity problems, does not require normalization or scaling of the raw data, and is not sensitive to multicollinearity [27].
The determination coefficient (R2), the root mean square error (RMSE), and the mean absolute error (MAE) were used to assess the prediction accuracy of established inversion models. R2 was used to express the degree of fitness of the estimation model. When R2 < 0.5, the hyperspectral inversion model does not have prediction ability; when 0.5 ≤ R2 < 0.7, the hyperspectral inversion model has preliminary prediction ability; and when R2 ≥ 0.7, the hyperspectral inversion model has good prediction ability [32]. RMSE and MAE were used to represent the predictive capacity and the robustness of the hyperspectral inversion models. In general, lower RMSE and MAE indicate better model prediction accuracy [33]. The analytical expressions of R2, RMSE, and MAE are given below:
R M S E = i = 1 n y ^ i y i 2 n
R 2 = 1 i = 1 n y ^ i y i 2 i = 1 n y ¯ i y i 2
M A E = 1 n i = 1 n y i y ^ i
where y ^ i represents the estimated values of SOM, yi indicates the measured values of SOM, and y ¯ i corresponds to the average measured values of SOM.

3. Results

3.1. Statistics of SOM Content

Statistical results of SOM contents of the collected farmland soils (including training dataset and validation dataset) in the study area are given in Table 1. The standard deviation (SD) and the coefficient of variation (CV) were used to represent data dispersion. As shown in Table 1, the SOM contents of all the collected farmland soil samples in the study area were distributed in the range of 1.12–43.34 g·kg−1 and with a mean value of 16.60 g·kg−1. The average SOM contents of the training dataset and the validation dataset were 16.67 g·kg−1 and 16.32 g·kg−1, respectively. The SDs of the training dataset and the validation dataset were 8.00 g·kg−1 and 6.98 g·kg−1, respectively. The CV values of the training dataset and the validation dataset were 48% and 43%, respectively. It can be seen from Table 1 that the mean, SD, and CV values of SOM contents in the training dataset were essentially the same as those of the validation dataset. It indicates that the division of soil samples in this study was reasonable and can be used for subsequent hyperspectral modeling.

3.2. Analysis of Soil Spectral Reflectivity

The spectral reflectance curves of 173 farmland soil samples were obtained (Figure 2). As shown in Figure 2, the spectral reflectance values of soil samples were between 0 and 0.6, and the visible light band was smaller than that of the near-infrared band, the difference was also slightly less than that of the near-infrared band. The spectral reflectance of the collected soil samples increased with the increase in the wavelength, the spectral reflectance increased rapidly within 400–600 nm, which is related to the iron contained in the soil [34]. The spectral reflectance within 600–2400 nm was relatively stable for the collected soil samples.
The absorption valleys were found within 1340–1430 nm and 1800–1960 nm, which were caused by the soil moisture. The spectral reflectance of the collected soil samples increased significantly in the range of 400–800 nm bands, then gradually increased in the range of 800–2200 nm, and reached the highest value around 2100 nm. The spectral reflectance decreased slowly since 2200 nm. For the soil reflection spectrum, the absorption characteristics are related to some specific soil properties. The absorption characteristics of soil spectra in the visible light (400–700 nm) and short near-infrared (700–1000 nm) band range are mainly due to the electronic transition of metal ions (such as Fe2+, Fe3+, Mn3+, etc.) [35].

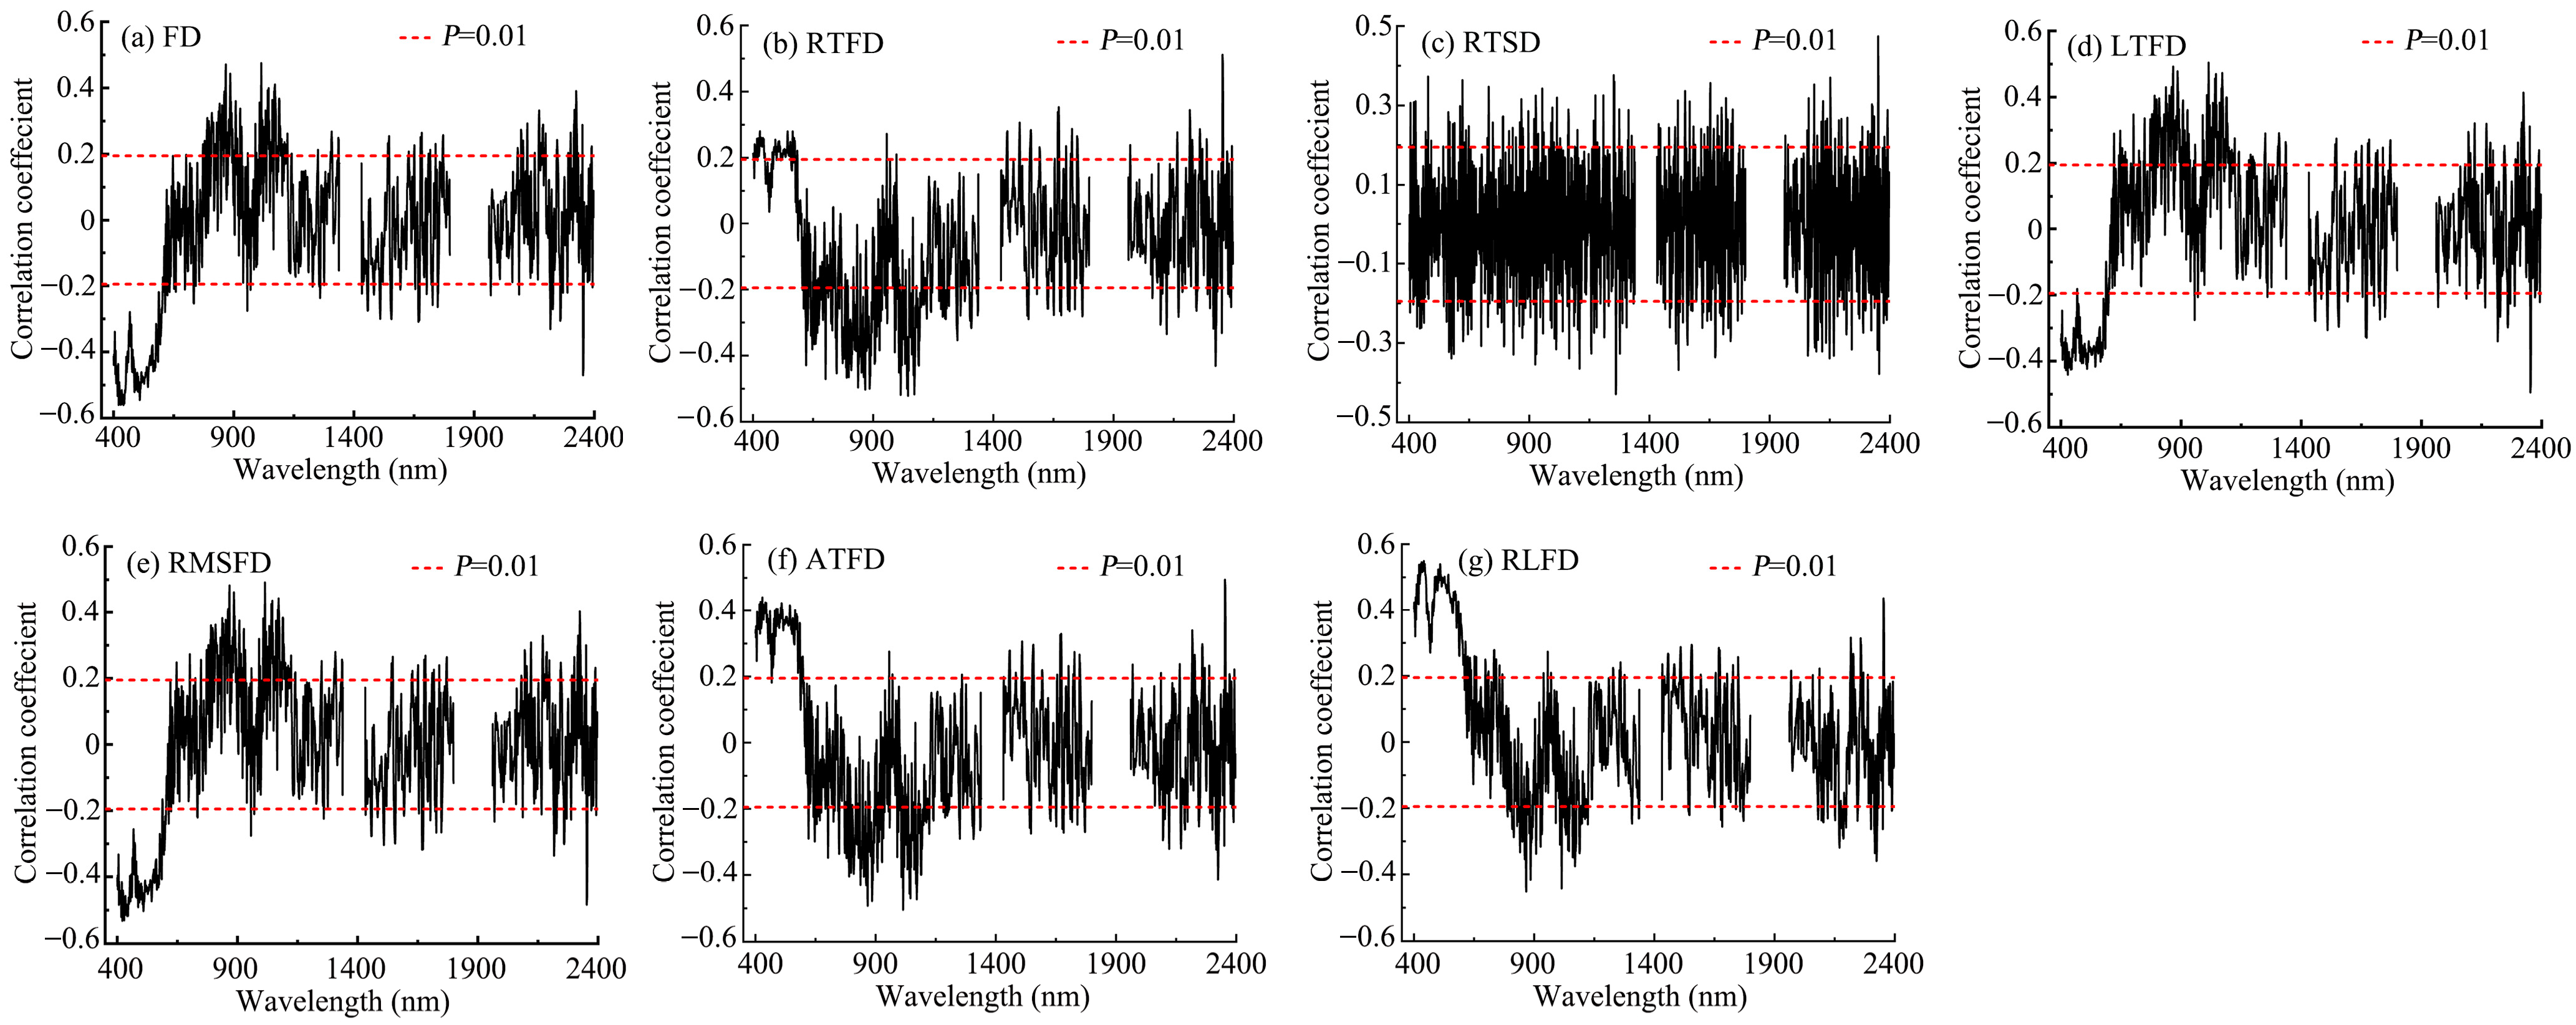
3.3. Correlation between SOM Content and Reflectance Data

The Pearson correlation analysis (PCA) of the measured values of SOM contents and soil spectral data including the original spectral reflectance and transformed spectral reflectance data after 15 types of mathematical transformation were used to identify the relations among the SOM and different spectral transformation forms. The degree of correlation was expressed by the Pearson coefficient (R), and the PCA was examined in the significance test at the p < 0.01 level (two-sided).
Table 2 shows that the correlation coefficient between the measured SOM content and the 16 types of spectral reflectance data all reached a very significant level (p < 0.01). Each spectral transformation had the same effect on the strengthening of the spectral characteristics of SOM, among which FD, RTFD, RTSD, LTFD, RMSFD, ATFD, and RLFD transformations had the most obvious effect on the spectral characteristics of soil, as illustrated in Figure 3. The characteristic wavebands with the highest correlation were 421 nm, 441 nm, 1014 nm, 1045 nm, and 2351 nm. The largest positive correlation appeared at the 441 nm waveband of the RLFD transformation, with a correlation coefficient of 0.549. The largest negative correlation appeared at 441 nm of the FD transformation, with a correlation coefficient of −0.561.
Overall, the spectral sensitive characteristics of SOM in the collected soil samples were distributed in the visible light band. Among the 15 types of spectral transformations, FD, RTFD, RTSD, LTFD, RMSFD, ATFD, and RLFD had obvious effects on enhancing the spectral characteristics of SOM in soil. The original spectral reflectance of the original reflectance showed a low correlation, with a coefficient of −0.385. However, following the application of 15 types of different spectral transformations, the correlation coefficient correspondingly improved. It suggests that performing spectral transformation on the original spectral reflectance data can effectively enhance the correlation between spectral reflectance data and SOM content.

3.4. Modeling and Validation of SOM Content

According to the correlation coefficient between the SOM content and the spectral reflectance data, wavebands with absolute values more than 0.195 under the processed spectral reflectance data were chosen as the significant wavebands. Then, the significant wavebands were selected as the independent variables (x), and the SOM contents were selected as the dependent variables (y). The hyperspectral estimation models for SOM in the optimal spectral transformation form was established using the PLSR, SVMR, and RFR algorithms, based on both the original spectral data and the transformed ones, respectively. The obtained results estimated by these three models were compared to ground-measured data of SOM content. The basic statistics related to the stability and accuracy of the hyperspectral estimation models are given in Table 3.

3.4.1. Estimation of SOM Content with PLSR

Table 3 shows that there were obvious differences between the prediction results of different hyperspectral estimation models. R2 values in the PLSR models ranged from 0.166 to 0.700, while the RMSE values ranged from 4.158% to 10.355%, and the MAE values ranged from 3.318 to 5.531. The highest R2 (0.700) was found in the LTFD transformation. It indicates that the PLSR model has low prediction ability and low accuracy of the SOM content.

3.4.2. Estimation of SOM Content with SVMR

The ranges of the R2, RMSE, and MAE values inverted by SVMR were 0.118–0.350, 5.876–6.633%, and 4.456–5.271, respectively. R2 was lower than 0.35, and the highest R2 (0.350) was found in the ATFD transformation. It indicates that the SVMR model basically does not have estimation ability of the SOM content. In other words, the prediction ability of SVMR was poorer than PLSR.

3.4.3. Estimation of SOM Content with RFR

R2 values in the RFR model ranged from 0.141 to 0.884, indicating that the RFR estimation model has a good prediction ability of the SOM content in soil. The ranges of RMSE and MAE values inverted by the RFR model were 2.817–6.513% and 2.222–5.263, respectively. The highest R2 (0.884) was observed in the RLFD transformation. The smaller values of RMSE and MAE indicated that the estimation accuracy of the RFR model was high, and it had a high stability and generalization ability [33]. Overall, RFR based on RLFD (R2 = 0.884, RMSE = 2.817%, MAE = 2.222) was the optimal estimation method for SOM content using the hyperspectral remote sensing data.

4. Discussion

In this study, 173 soil samples and hyperspectral data were used to propose an effective hyperspectral estimation method, which combined the PLSR, SVMR, and RFR algorithms to estimate SOM content of farmland soils in arid zones. Considering the random sampling method has a relatively higher performance in the hyperspectral estimation of SOM content, collected soil samples in this study were split into a training dataset and a validation dataset based on the random sampling method [19].
Since the soil spectrum is an integrated reflection of soil geo-chemical properties, the relations between the soil spectral data and SOM content vary in different regions [19]. In this study, the fitness, stability, and accuracy of the constructed hyperspectral estimation models for farmland SOM contents were improved after different mathematical transformations of the original spectrum, as illustrated in Table 3 and Figure 3. For example, R2 of the RFR model under spectral transformation can be ranked as RLFD (0.884) > ATFD (0.742) > RMSFD (0.725) > LTFD (0.722) > FD (0.712) > RTFD (0.625) > ATSD (0.381) > RTSD (0.358) > SD (0.354) > LTSD (0.349) > RLSD (0.318) > RMSSD (0.316) > lg(1/R) (0.274) > R (0.232) > 1/lgR (0.188) > lgR (0.141). Among the 15 spectral transformations, the FD transformation of the original spectral reflectivity had the most prominent effect on enhancing the spectral characteristics of SOM in the study area. This result was basically consistent with results of related research [34], which found that the FD transformation had the largest negative correlation with the arsenic content of soil. However, the spectral information of soil was highlighted, and the number of effective and sensitive wavebands was increased in our study. This result coincides with the previous research [20,35,36]. It indicates that the mathematical transformations of the original spectral reflectance data effectively reduced the interference of the background noise and improved the correlations between the spectral reflectance data and the SOM contents of farmland soil in the study area.
Many studies have estimated SOM contents based on linear models. For example, Qiao et al. [10] built a PLSR-based SOM prediction model using different processed spectra and selected the most effective preprocessing method based on PLSR. Their results suggested that the method of PSLR based on spectra processed by the FD transformation can present a satisfactory accuracy for the SOM estimation. Xu et al. [6] used PLSR to effectively estimate the SOM contents in black soil areas in China. Shen et al. [2] also constructed a PLSR-based SOM prediction model using six types of data transformations and three types of dimensionality reduction methods and considered that PLSR is an effective way of determining SOM. Chen et al. [20] used PLSR to estimate the SOM contents in forest soil in the Yunnan Province of China and suggested that PSLR after the LFR (logarithmic first-derivative reflectance) transformation was the best method for SOM estimation of forest soil. Cao et al. [37] proposed a multiple linear regression (MLR)-based hyperspectral estimation model based on the gray correlation for overcoming the interference of abnormal soil samples on the constructing of linear regression models. Wang et al. [38] and Sun et al. [39] reported that MLR was the best multivariate technique to predict SOM content of soil. However, the above-mentioned research has regarded that there are differences in the optimum hyperspectral estimation models for different soil types and different regions, but the results of PLSR and MLR are preferable and more stable.
In this work, it was found that the best estimation accuracy of constructed estimation models of organic matter content of farmland soil in the study area can be ranked as R2RFR > R2PLSR > R2SVMR. Therefore, considering the performance of the estimation accuracy of the SOM content in farmland soils in arid zones, the inversion accuracy of RFR is significantly better than that of PLSR and SVMR. This achievement signifies the successful quantitative estimation of SOM content within the designated study area. Notably, the application of the RFR modeling technique was proven to be feasible for this specific geographical context. However, nonlinear models, such as stepwise multiple linear regression (SMLR), partial least squares regression (PLSR), and the employed random forest (RF) approach, have been identified in other studies as powerful tools for enhancing inversion accuracy in various geographic contexts. For instance, in a leaf mercury estimation study [40], the application of the RFR model for inversion demonstrated its suitability, which aligns with the findings of our study. Meanwhile, the results in this study demonstrated that the fitness, prediction ability, and prediction accuracy of the RFR model based on RLFD was the best among the 15 types of mathematical transformations of the original spectral data, with an R2 value of 0.884. The SOM content in farmland soil in arid zones was estimated effectively, and the scatter plot of the ground-measured and predicted values of SOM content modeling using the RFR model is exhibited in Figure 4.
Based on GIS technology and the geostatistical analysis method, the spatial distribution patterns of the SOM contents using laboratory-measured values and estimated values were mapped. The main parameters of geostatistical analysis were determined using GS+9.0 software.
Figure 5 illustrates that the estimated SOM contents based on the RFR-RLFD method (Figure 5d) showed very similar distribution patterns as the laboratory-measured SOM contents (Figure 5a). A zonal distribution pattern, with the most accumulation in the southern parts and least accumulation in the northern parts, was observed both for the laboratory-measured and the RFR-RLFD-estimated SOM contents. The result further validated the accuracy of the estimation model based on the RFR-RLFD method. Results of previous studies indicated that the FD transformation can significantly improve the characteristic spectral information of SOM, reduce the noise, and increase the relationship between SOM and reflectivity [20]. Relatedly, the RL transformation can not only reduce the influence of stochastic factors caused by changes in light conditions and topography, but can also enhance the spectral differences in visible light areas [41]. RFR has powerful predictive performance and robustness to outliers. Therefore, compared with the other 14 types of transformations, the RLFD combination with RFR more effectively improved the simulation accuracy of SOM in this study. In summary, the RFR-RLFD model offered both strong predictive performance and interpretability.
Overall, the RFR-RLFD model proposed in this research can be applied to estimate SOM contents in other areas, especially farmland soils in arid zones. At the same time, due to the differences in regional locations, soil types, and pollution levels of soil, whether the best model is suitable for other soil types and regions needs further research. In addition, the present work only focused on the PLSR, RFR, and SVMR algorithms in the statistical analysis. Other powerful machine/deep learning methods, such as geographically weighted regression (GWR), artificial neural networks (ANNs), and naive Bayes (NB), could be assessed for their potential to further improve the prediction accuracy of organic matter contents of agricultural soils in arid zones.

5. Conclusions

Traditional measuring of SOM content is time-consuming and inefficient. This work demonstrated hyperspectral remote sensing for predicting organic matter content of agricultural soil based on the relationship between the SOM contents and spectral values of soil. In this paper, the PLSR, SVMR, and RFR algorithms based on 16 types of spectral data were applied for identifying the optimal hyperspectral estimation method of SOM contents in farmlands in arid zones. Results of this study can conclude that mathematical transformations including FD, RTFD, RTSD, LTFD, RMSFD, ATFD, and RLFD had obvious effects on the soil spectral characteristics and also had a determined ability to improve the accuracy of hyperspectral estimation models for the SOM in farmland soils. The best estimation accuracy of constructed estimation models of the SOM content in the collected farmland soils can be ranked as R2RFR > R2PLSR > R2SVMR. The optimal estimation was obtained when RFR was based on the RLFD transformation. Overall, the RFR-RLFD method was proposed for the hyperspectral estimation of SOM content of farmland soils. This study demonstrated the possibility of directly applying the hyperspectral remote sensing technology to estimate the SOM contents of farmlands in arid zones. Results of this study can not only provide a scientific basis for the rapid prediction of SOM content and the sustainable utilization of farmland soils in the study area, but can also provide a reference for the hyperspectral remote sensing of SOM content of farmlands in arid zones.

Author Contributions

Conceptualization, X.S., M.E., and Q.Z.; methodology, X.S. and M.E.; software, X.S.; validation, X.S. and M.E.; formal analysis, X.S. and Q.Z.; investigation, M.E.; resources, X.S. and M.E.; data curation, X.S.; writing—original draft preparation, X.S.; writing—review and editing, X.S., M.E., and Q.Z.; visualization, M.E. and Q.Z.; supervision, X.S. and M.E.; project administration, M.E.; funding acquisition, M.E. All authors have read and agreed to the published version of the manuscript.

Funding

This research is funded by the National Natural Science Foundation of China (grant number U2003301) and the Tianshan Talent Training Project of Xinjiang.

Institutional Review Board Statement

Not applicable.

Informed Consent Statement

Not applicable.

Data Availability Statement

Data will be available upon request to the corresponding author.

Conflicts of Interest

The authors declare no conflict of interest.

References

  1. Six, J.; Paustian, K. Aggregate-associated soil organic matter as an ecosystem property and a measurement tool. Soil Biol. Biochem. 2014, 68, A4–A9. [Google Scholar] [CrossRef]
  2. Shen, L.Z.; Ga, M.F.; Yan, J.W.; Li, Z.L.; Leng, P.; Yang, Q.; Duan, S.B. Hyperspectral estimation of soil organic matter content using different spectral preprocessing techniques and PLSR method. Remote Sens. 2020, 12, 1206. [Google Scholar] [CrossRef]
  3. Feng, X.; Simpson, M.J. Molecular-level methods for monitoring soil organic matter responses to global climate change. Environ. Monit. Assess. 2011, 13, 1246–1254. [Google Scholar] [CrossRef]
  4. Cotrufo, M.F.; Lavallee, J.M. Soil organic matter formation, persistence, and functioning: A synthesis of current understanding to inform its conservation and regeneration. Adv. Agron. 2022, 172, 1–66. [Google Scholar]
  5. Schillaci, C.; Acutis, M.; Lombardo, L.; Lipani, A.; Fantappie, M.; Märker, M.; Saia, S. Spatio-temporal topsoil organic carbon mapping of a semi-arid Mediterranean region: The role of land use, soil texture, topographic indices and the influence of remote sensing data to modelling. Sci. Total Environ. 2017, 601, 821–832. [Google Scholar] [CrossRef]
  6. Xu, X.T.; Chen, S.B.; Xu, Z.Y.; Yu, Y.; Zhang, S.; Dai, R. Exploring appropriate preprocessing techniques for hyperspectral soil organic matter content estimation in black soil area. Remote Sens. 2020, 12, 3765. [Google Scholar] [CrossRef]
  7. Kögel-Knabner, I.; Amelung, W. Soil organic matter in major pedogenic soil groups. Geoderma 2021, 384, 114785. [Google Scholar] [CrossRef]
  8. Andrew, S.C.; Arnoud, B.; Brian, M.C.; Michael, E.M.; Zoë, E.R.; Matthew, N.B.; Alex, M.J.C. Biome-scale characterization and differentiation of semi-arid and arid zone soil organic matter compositions using pyrolysis–GC/MS analysis. Geoderma 2013, 200, 189–201. [Google Scholar]
  9. Spencer, M.S.; Vernon, F.H. Copper complexation by dissolved organic matter in arid soils: A voltametric study. Environments 2018, 5, 125. [Google Scholar]
  10. Qiao, X.X.; Wang, C.; Feng, M.C.; Yang, W.; Ding, G.W.; Sun, H.; Liang, Z.Y.; Shi, C.C. Hyperspectral estimation of soil organic matter based on different spectral preprocessing techniques. Spectrosc. Lett. 2017, 50, 156–163. [Google Scholar] [CrossRef]
  11. Xia, X.M.; Li, M.W.; Liu, H.; Zhu, Q.H.; Huang, D.Y. Soil organic matter detection based on pyrolysis and electronic nose combined with multi-feature data fusion optimization. Agriculture 2022, 12, 1540. [Google Scholar] [CrossRef]
  12. Zhou, T.; Jia, C.H.; Zhang, K.L.; Yang, L.; Zhang, D.X.; Cui, T.; He, X.T. A rapid detection method for soil organic matter using a carbon dioxide sensor in situ. Measurement 2023, 208, 112471. [Google Scholar] [CrossRef]
  13. Jiang, X.Q.; Luo, S.J.; Ye, Q.; Li, X.C.; Jiao, W.H. Hyperspectral estimates of soil moisture content incorporating harmonic indicators and machine learning. Agriculture 2022, 12, 1188. [Google Scholar] [CrossRef]
  14. Jiang, X.F.; Duan, H.C.; Liao, J.; Guo, P.L.; Huang, C.H.; Xue, X.A. Estimation of soil salinization by machine learning algorithms in different arid regions of northwest China. Remote Sens. 2022, 14, 347. [Google Scholar] [CrossRef]
  15. Yasenjiang, K.; Yang, S.T.; Nigara, T.; Zhang, F. Hyperspectral estimation of soil electrical conductivity based on fractional order differentially optimized spectral indices. Acta Ecol. Sin. 2019, 39, 7237–7248. (In Chinese) [Google Scholar]
  16. Wang, Y.B.; Zhang, X.; Sun, W.C.; Wang, J.N.; Ding, S.T.; Liu, S.H. Effects of hyperspectral data with different spectral resolutions on the estimation of soil heavy metal content: From ground-based and airborne data to satellite-simulated data. Sci. Total Environ. 2022, 838, 156129. [Google Scholar] [CrossRef]
  17. Ye, M.; Zhu, L.; Li, X.J.; Ke, Y.H.; Huang, Y.; Chen, B.B.; Yu, H.L.; Li, H.; Feng, H. Estimation of the soil arsenic concentration using a geographically weighted XGBoost model based on hyperspectral data. Sci. Total Environ. 2023, 858, 159798. [Google Scholar] [CrossRef] [PubMed]
  18. Yang, C.B.; Feng, M.C.; Song, L.F.; Wang, C.; Yang, W.D.; Xie, Y.K.; Jing, B.H.; Xiao, L.J.; Zhang, M.J.; Song, X.Y.; et al. Study on hyperspectral estimation model of soil organic carbon content in the wheat field under different water treatments. Sci. Rep. 2021, 11, 18582–18590. [Google Scholar] [CrossRef] [PubMed]
  19. Sun, W.C.; Liu, S.; Zhang, X.; Li, Y. Estimation of soil organic matter content using selected spectral subset of hyperspectral data. Geoderma 2022, 409, 115653. [Google Scholar] [CrossRef]
  20. Chen, Y.; Wang, J.L.; Liu, G.J.; Yang, Y.L.; Liu, Z.Y.; Deng, H. Hyperspectral estimation model of forest soil organic matter in northwest Yunnan Province, China. Forests 2019, 10, 217. [Google Scholar] [CrossRef]
  21. Wu, H.; Fan, Y.M.; He, J.; Jin, G.; Xie, Y.; Chai, D.; He, L. Response of soil hyperspectral characteristics of different particle sizes to soil organic matter. Acta Agrestia Sin. 2014, 22, 266–270. (In Chinese) [Google Scholar]
  22. Vašát, R.; Kodešová, R.; Klement, A.; Borůvka, L. Simple but efficient signal pre-processing in soil organic carbon spectroscopic estimation. Geoderma 2017, 298, 46–53. [Google Scholar] [CrossRef]
  23. Yang, Y.; Gao, X.; Jia, W.; Zhang, W.; Li, J.; Zhang, Y.; Tian, C. Hyperspectral retrieval of soil organic matter for different soil types in the Three-river Headwaters Region. Remote Sens. Technol. Appl. 2015, 31, 186–198. (In Chinese) [Google Scholar]
  24. Wang, L.; Zhou, Y. Combining multi-temporal sentinel-2A spectral imaging and Random Forest to improve the accuracy of soil organic matter estimates in the plough layer for cultivated land. Agriculture 2022, 13, 8. [Google Scholar] [CrossRef]
  25. Meng, X.; Bao, Y.; Ye, Q.; Liu, X.; Zhang, X.; Tang, H.; Zhang, X. Soil organic matter prediction model with satellite hyperspectral image based on optimized denoising method. Remote Sens. 2021, 13, 2273. [Google Scholar] [CrossRef]
  26. Zhou, W.; Xie, L.J.; Yang, H.; Huang, L.; Li, H.R.; Yang, M. Hyperspectral inversion of soil organic matter content in the Three-Rivers source region. Chin. J. Soil Sci. 2021, 52, 564–574. (In Chinese) [Google Scholar]
  27. Zhou, W.; Yang, H.; Xie, L.; Li, H.; Yue, T. Hyperspectral inversion of soil heavy metals in Three-River Source Region based on random forest model. Catena 2021, 202, 105222. [Google Scholar] [CrossRef]
  28. Mamattursun, E.; Anwar, M.; Ajigul, M.; Gulbanu, H. A human health risk assessment of heavy metals in agricultural soils of Yanqi Basin, Silk Road Economic Belt, China. Human Ecol. Risk Assess. 2018, 24, 1352–1366. [Google Scholar]
  29. GB/T 9834-88; Methods for Determination of Soil Organic Matter. Ministry of Ecology and Environment of the People’s Republic of China: Beijing, China, 2021. (In Chinese)
  30. Askari, M.S.; Cui, J.F.; O’Rourke, S.M.; Holden, N.M. Evaluation of soil structural quality using VIS–NIR spectra. Soil Tillage Res. 2015, 146, 108–117. [Google Scholar] [CrossRef]
  31. Wang, X.M.; Yumiti, M.M.; Mao, D.L.; Liang, T. Hyperspectral estimation of heavy metal chromium content in arable soil of arid area oasis. Ecol. Environ. Sci. 2021, 30, 2076–2084. (In Chinese) [Google Scholar]
  32. Vohland, M.; Besold, J.; Hill, J.; Heinz-Christian, F. Comparing different multivariate calibration methods for the determination of soil organic carbon pools with visible to near infrared spectroscopy. Geoderma 2011, 166, 198–205. [Google Scholar] [CrossRef]
  33. Wang, Y.; Niu, R.; Lin, G.; Xiao, Y.; Ma, H.; Zhao, L. Estimate of soil heavy metal in a mining region using PCC-SVM-RFECV-AdaBoost combined with reflectance spectroscopy. Environ. Geochem. Health 2023. [Google Scholar] [CrossRef]
  34. Li, Z.Y.; Deng, F.; He, J.L.; Wei, W. Hyperspectral estimation model for heavy metal arsenic in soil. Spectrosc. Spectr. Anal. 2021, 41, 2872–2878. (In Chinese) [Google Scholar]
  35. Hu, W.; Ren, H.; Zhuang, D.; Shi, X.; Yu, X. Effects on application of spectroscopy in estimating of soil organic matter content. Geo-Inf. Sci. 2012, 14, 258–264. (In Chinese) [Google Scholar] [CrossRef]
  36. Hummel, J.W.; Sudduth, K.A.; Hollinger, S.E. Soil moisture and organic matter prediction of surface and subsurface soils using an NIR soil sensor. Comput. Electron. Agric. 2001, 32, 149–165. [Google Scholar] [CrossRef]
  37. Cao, X.S.; Li, X.C.; Ren, W.J.; Wu, Y.A.; Liu, J.Y. Hyperspectral estimation of soil organic matter content using grey relational local regression model. Grey Syst. Theory Appl. 2021, 11, 707–722. [Google Scholar] [CrossRef]
  38. Wang, C.; Qiao, X.X.; Li, G.X.; Feng, M.C.; Xie, Y.K.; Sun, H.; Zhang, M.J.; Song, X.Y.; Xiao, L.J.; Anwar, S.; et al. Hyperspectral estimation of soil organic matter and clay content in loess plateau of China. Agron. J. 2021, 113, 2506–2523. [Google Scholar] [CrossRef]
  39. Sun, M.; Li, Q.; Jiang, X.; Ye, T.; Li, X.; Niu, B. Estimation of soil salt content and organic matter on arable land in the Yellow River Delta by combining UAV hyperspectral and Landsat-8 multispectral imagery. Sensors 2022, 22, 3990. [Google Scholar] [CrossRef]
  40. Liu, W.W.; Li, M.J.; Zhang, M.Y.; Long, S.Y.; Guo, Z.L.; Wang, H.N.; Li, W.; Wang, D.A.; Hu, Y.K.; Wei, Y.Y.; et al. Hyperspectral inversion of mercury in reed leaves under different levels of soil mercury contamination. Environ. Sci. Pollut. Res. 2020, 27, 22935–22945. [Google Scholar] [CrossRef]
  41. Lu, Y.L.; Bai, Y.L.; Yang, L.P.; Wang, H.J. Application of hyperspectral data for soil organic matter estimation based on principle components regression analysis. Plant Nut. Fert. Sci. 2008, 14, 1076–1082. [Google Scholar]
Figure 1. Locations of the study area and sample sites.
Sustainability 15 13719 g001
Figure 2. Spectral reflectance changes in soil samples.
Sustainability 15 13719 g002
Figure 3. The correlation coefficient curves between SOM content and spectral reflectance data.
Sustainability 15 13719 g003
Figure 4. Measured and RFR-estimated values of SOM content in soil.
Sustainability 15 13719 g004
Figure 5. Distribution of SOM content of laboratory-measured values and estimated values.
Sustainability 15 13719 g005
Table 1. Descriptive statistics of SOM in each dataset.
Sample TypenSOM Content (g·kg−1)CV (%)
MaximumMinimumMeanSD
Total17343.3381.12016.5977.80347%
Training dataset13843.3381.12016.6677.99748%
Validation dataset3536.4983.89716.3226.98043%
Table 2. The maximum correlation coefficients of SOM content and spectral reflectance.
Spectral TransformationRlgR1/lgRLg(1/R)FDSDRTFDRTSD
Maximum correlation band/nm611611611611441235110452351
Correlation coefficient−0.385 *−0.393 *0.366 *0.409 *−0.561 *−0.434 *−0.522 *0.475 *
Spectral TransformationLTFDLTSDRMSFDRMSSDATFDATSDRLFDRLSD
Maximum correlation band/nm101423514212351101423514412351
Correlation coefficient0.505 *−0.457 *−0.532 *−0.446 *−0.505 *0.457 *0.549 *0.404 *
Note: * significant at 0.01 level (2-tailed).
Table 3. Statistics of precision parameter of the hyperspectral estimation models.
Spectral TransformationPLSRSVMRRFR
R2RMSE (%)MAER2RMSE (%)MAER2RMSE (%)MAE
R0.17610.3554.8250.2246.3124.9260.2326.2245.146
lgR0.17710.2064.8460.3155.8764.4560.1416.5135.068
1/lgR0.4355.3394.0730.2936.0894.7230.1886.3685.263
Lg(1/R)0.4446.0364.0230.3016.0384.6590.2745.9504.746
FD0.6474.4963.8530.3315.9154.7350.7123.9963.227
SD0.2806.3835.4130.1766.5095.1880.3545.6234.551
RTFD0.6644.1583.3180.3166.3995.0370.6254.3763.683
RTSD0.2685.9924.8010.1766.5355.2240.3585.6354.460
LTFD0.7004.2783.4810.3495.9914.7350.7223.8923.335
LTSD0.1666.4355.1120.1846.4985.2100.3495.6484.478
RMSFD0.6574.4483.6930.3645.8764.6670.7253.8013.029
RMSSD0.2716.4465.5310.2216.4415.1840.3165.8324.783
ATFD0.6584.2623.4550.3505.9884.7350.7423.6682.900
ATSD0.1666.4355.1120.1846.4985.2100.3815.5554.324
RLFD0.6554.4843.8910.3395.9594.7570.8842.8172.222
RLSD0.3406.2395.2130.1186.6335.2710.3185.8174.843
Disclaimer/Publisher’s Note: The statements, opinions and data contained in all publications are solely those of the individual author(s) and contributor(s) and not of MDPI and/or the editor(s). MDPI and/or the editor(s) disclaim responsibility for any injury to people or property resulting from any ideas, methods, instructions or products referred to in the content.

