
Dynamic Clustering Strategies Boosting Deep Learning in Olive Leaf Disease Diagnosis

 ,
,  ,
, 
 ,
,  ,
,
Abstract
:1. Introduction
1.1. Motivations
- Safer from unbalanced data: It can significantly affect the performance of deep learning models, leading to biased predictions and lower accuracy. A lack of sampling of minority classes can cause the model to prioritize the majority class and neglect essential patterns in the data [9,10]. Techniques such as resampling, synthetic data generation, and special loss functions are commonly used to mitigate the adverse effects of data imbalance in deep learning.
- Low accuracy with noise data: Noisy data or low-visibility images can significantly impact the accuracy of deep learning models [6]. Noise can distort underlying data patterns, leading to misclassifications and reduced performance. To address this issue, robust preprocessing techniques, noise reduction methods, and regularization strategies may enhance a CNN’s ability to extract meaningful features from noisy input.
- High complexity: The size of samples in deep learning contributes to increased complexity, impacting training times and risking overfitting. Techniques such as dimensionality reduction help mitigate this challenge by improving efficiency and generalization.
1.2. Contributions
- Integration of clustering and deep learning: The proposed model integrates clustering and deep learning techniques to analyze olive leaf images comprehensively. This combination of methods helps in the accurate identification of olive diseases.
- Robust diagnostic approach: The proposed model provides a powerful and practical method for diagnosis of olive disease. It aims to provide accurate and reliable results by combining image enhancement and deep learning-based classification.
- High accurate and reliable results: The employment of image enhancement through color correction methodology, coupled with intensity assessment using the hierarchical convolution approach, and applying the dynamic clustering technique, culminates in a notably precise outcome characterized by significant accuracy.
- Low complexity: Training deep neural networks on selected samples enhances the accuracy of diagnostic procedures compared to training on the entire dataset, owing to reduced computational complexities by utilizing a smaller subset of data during training and reducing the overfitting.
2. Related Works
3. Material and Methods
3.1. Prerequisite
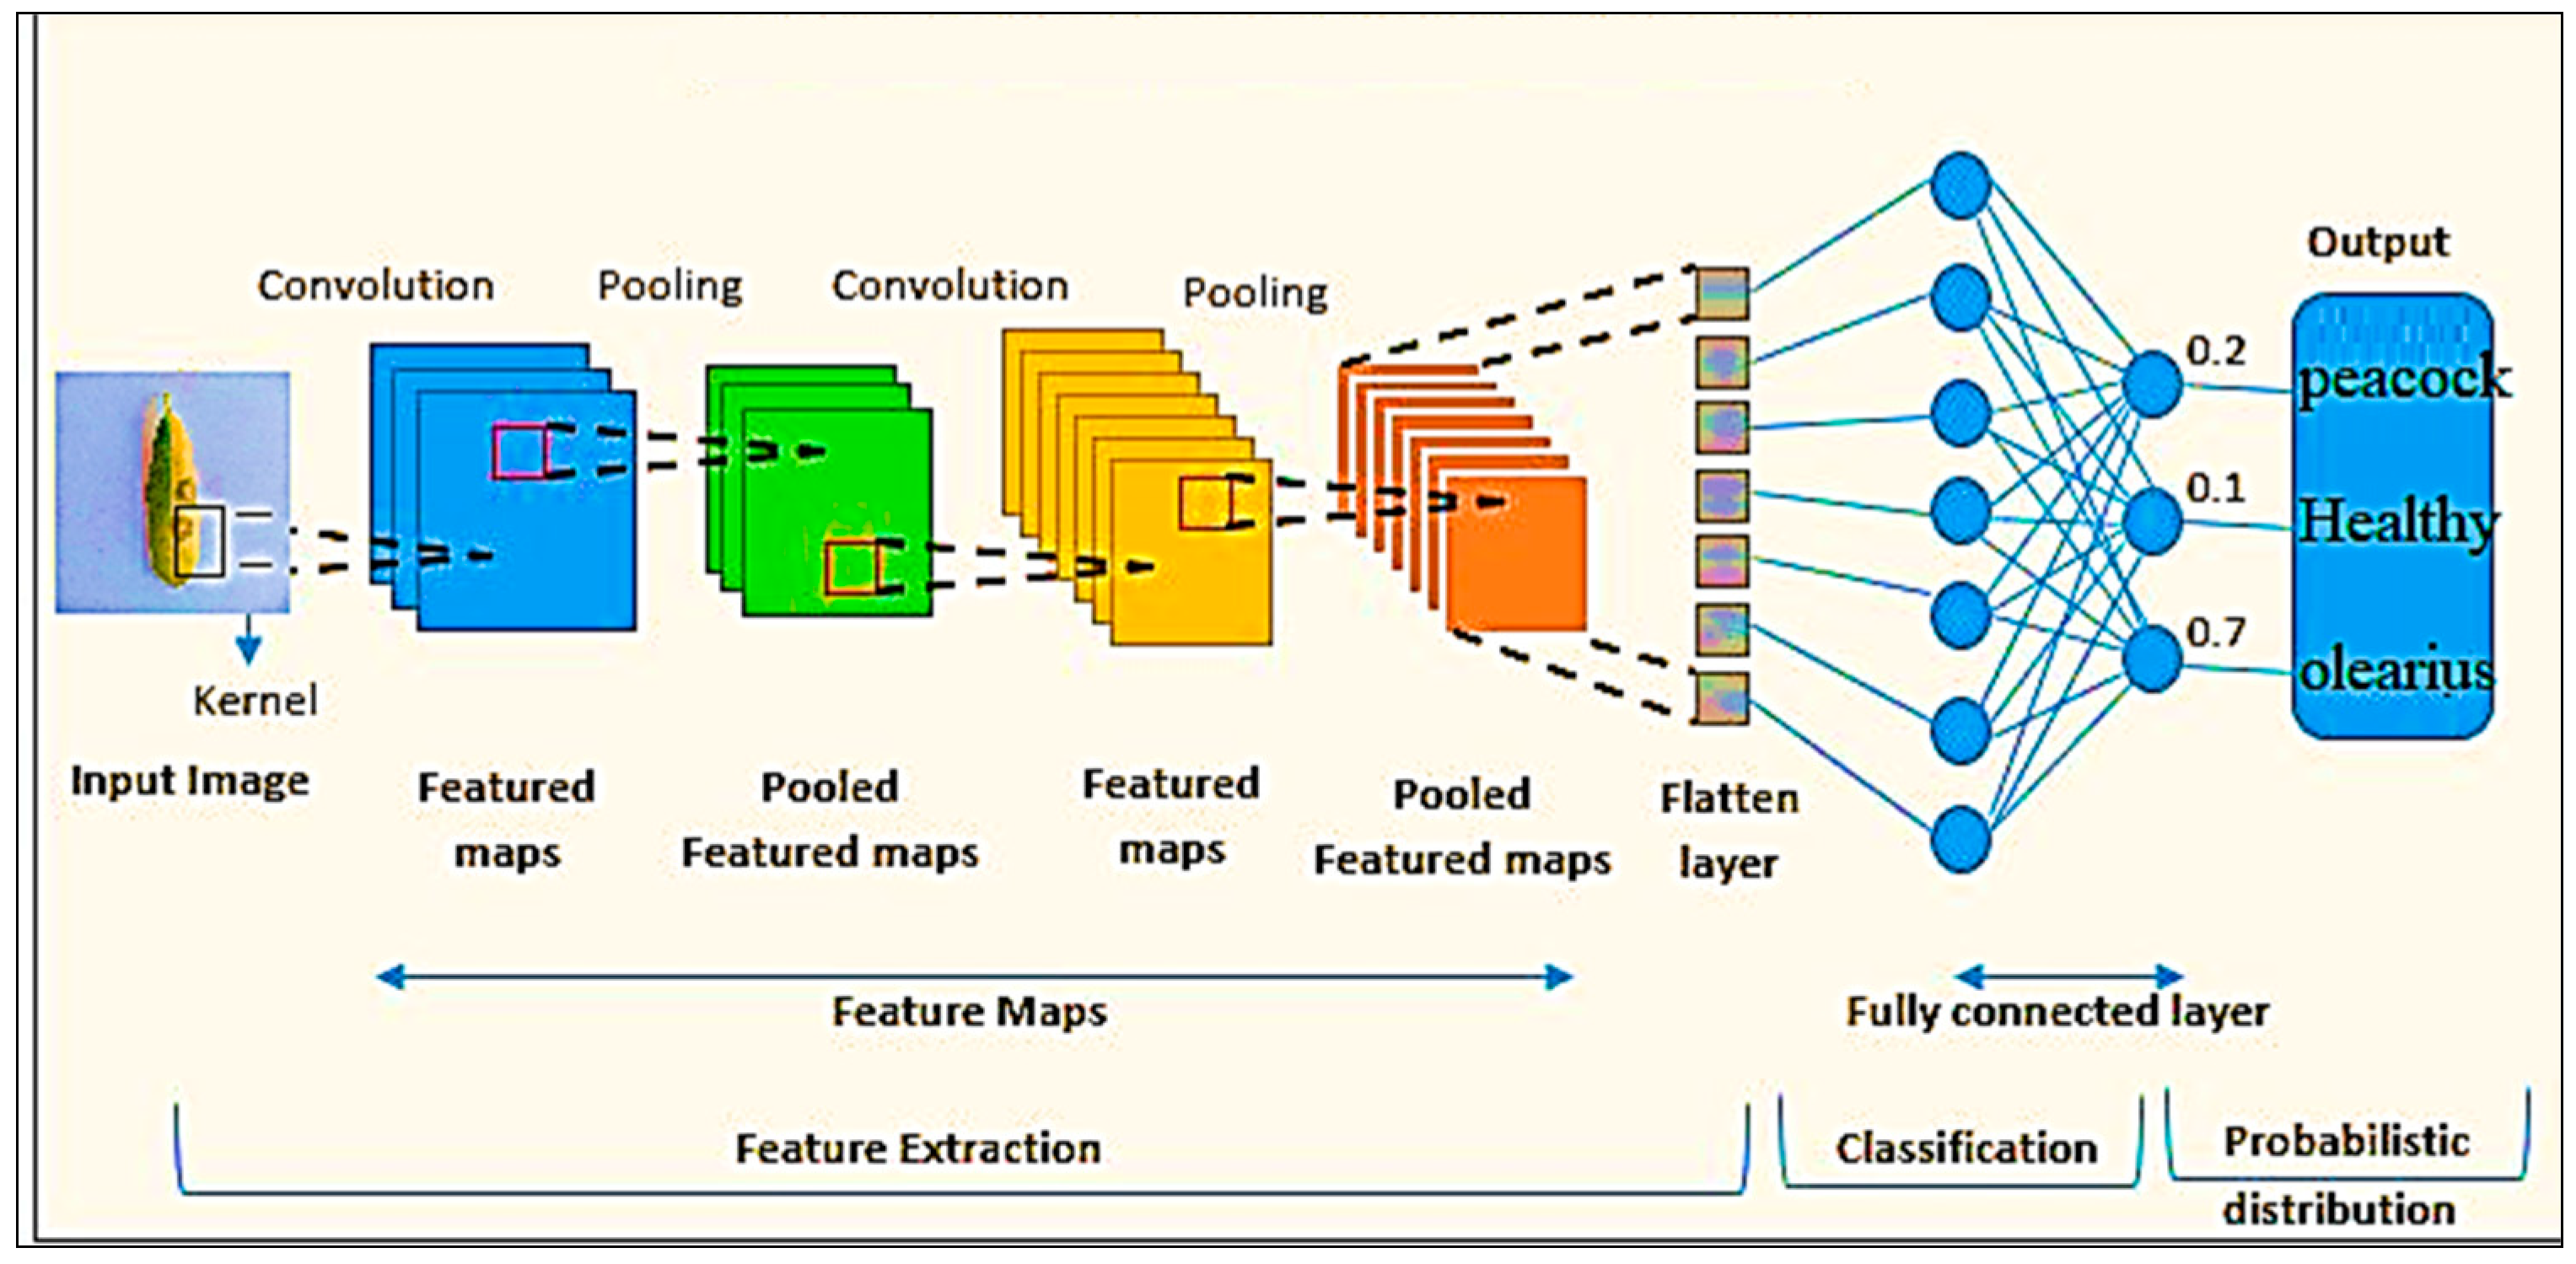
3.1.1. Convolutional Neural Networks (CNN)
3.1.2. Dynamic Clustering Empowering Deep Learning
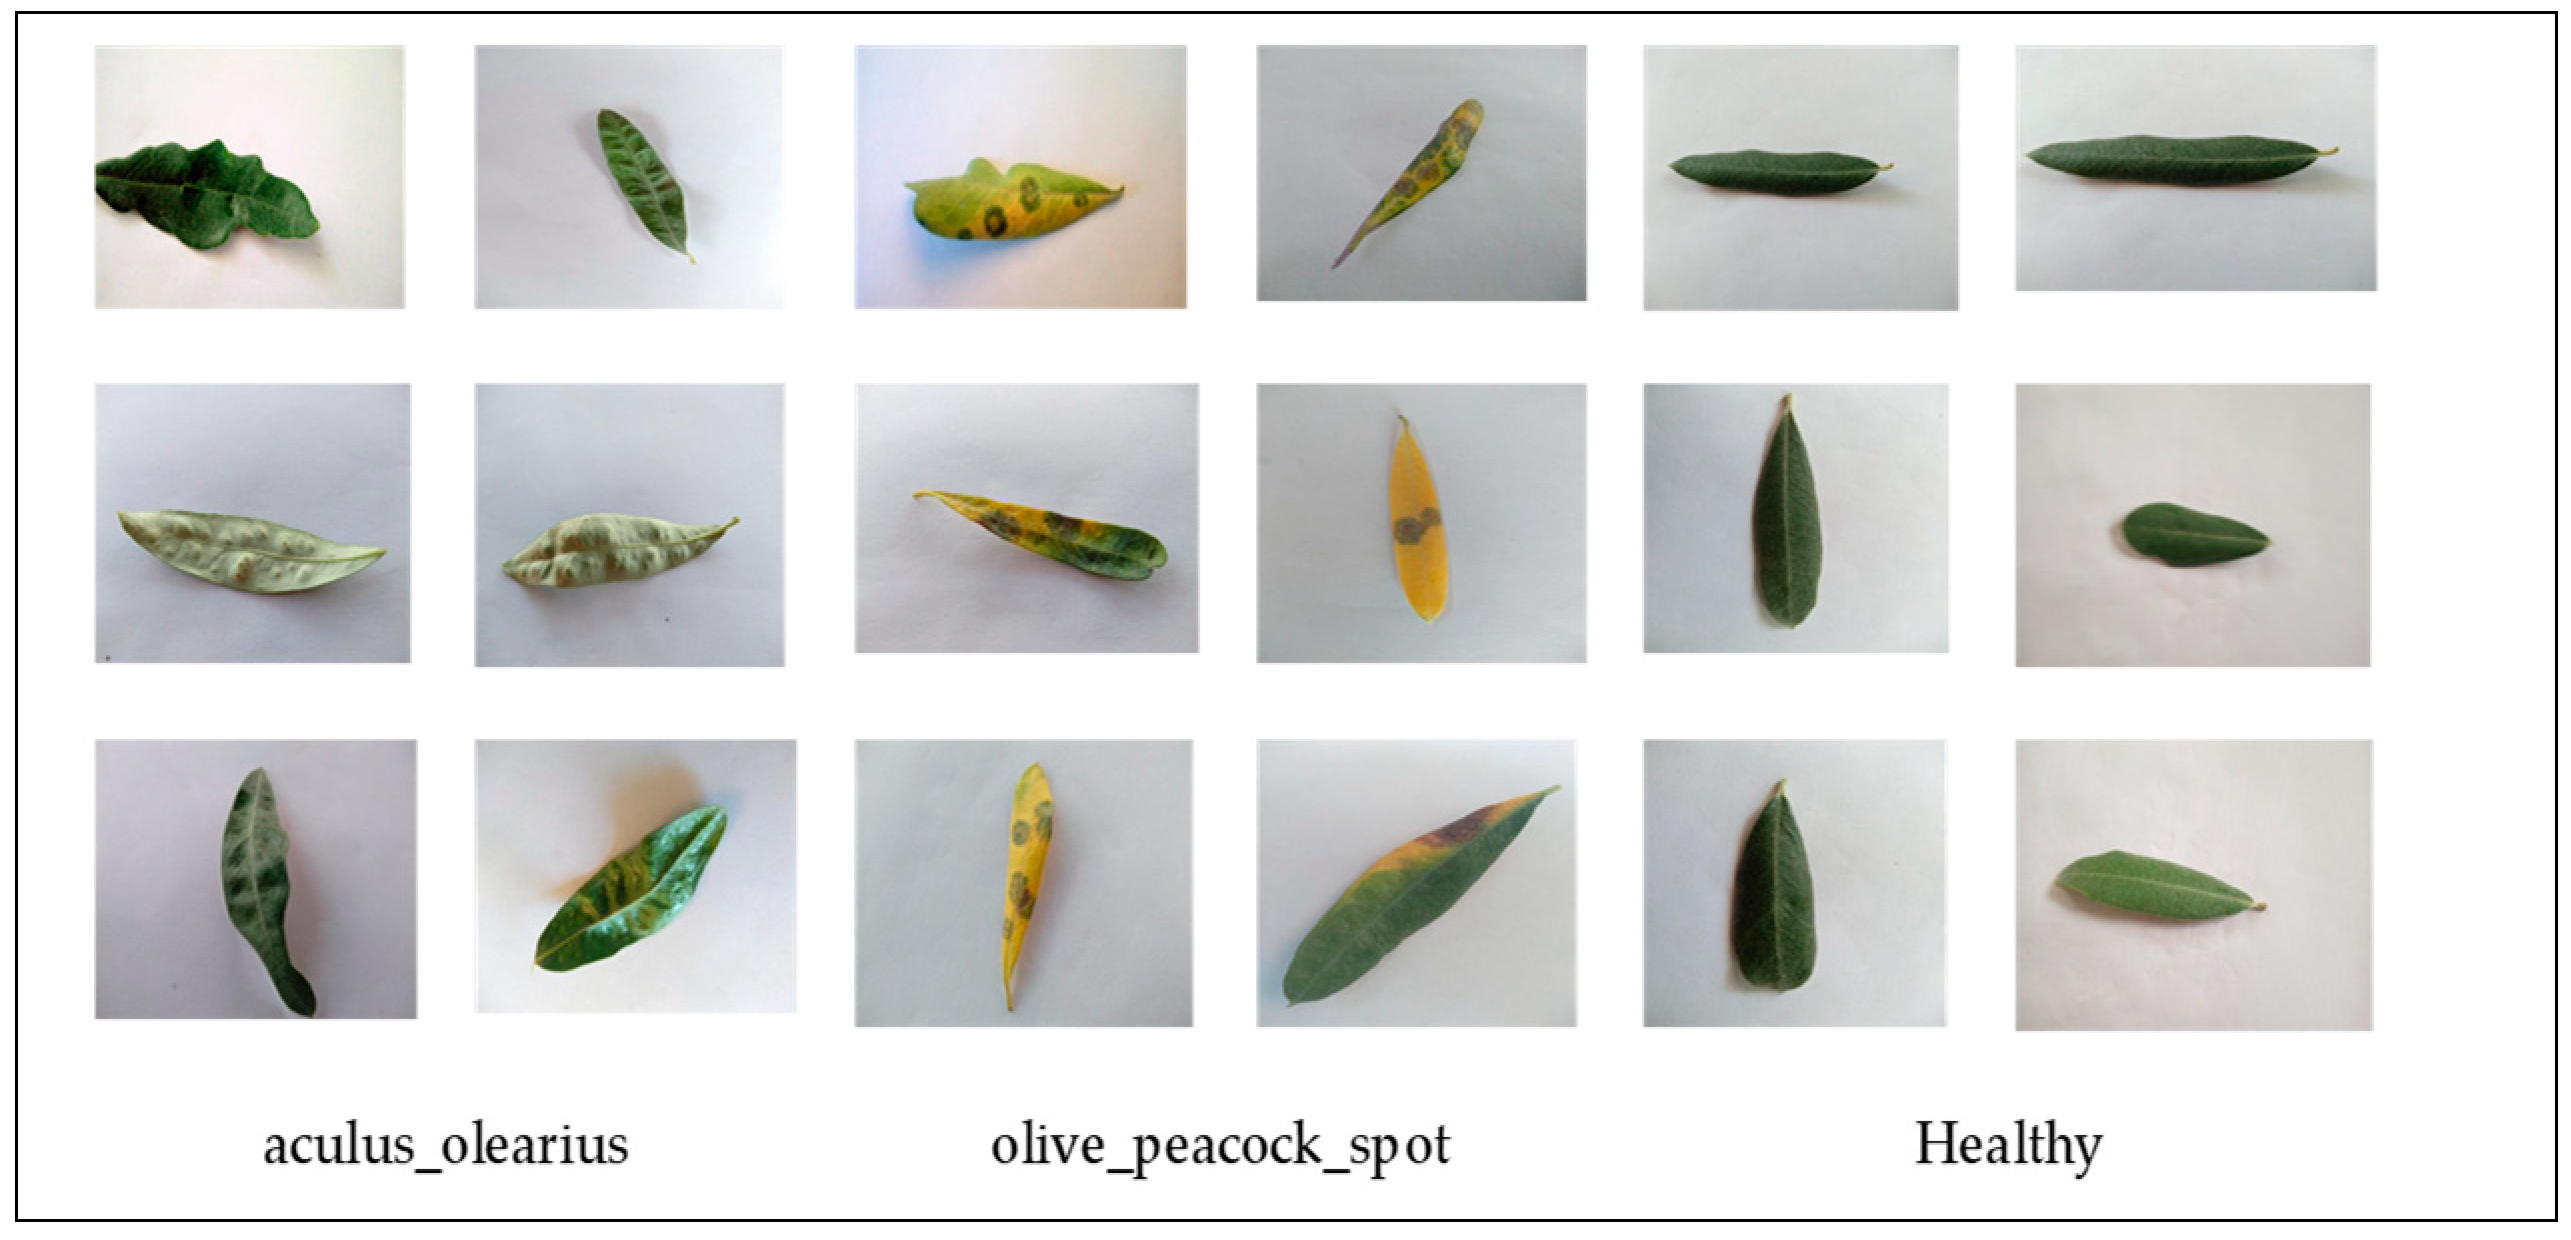
3.2. Dataset Description
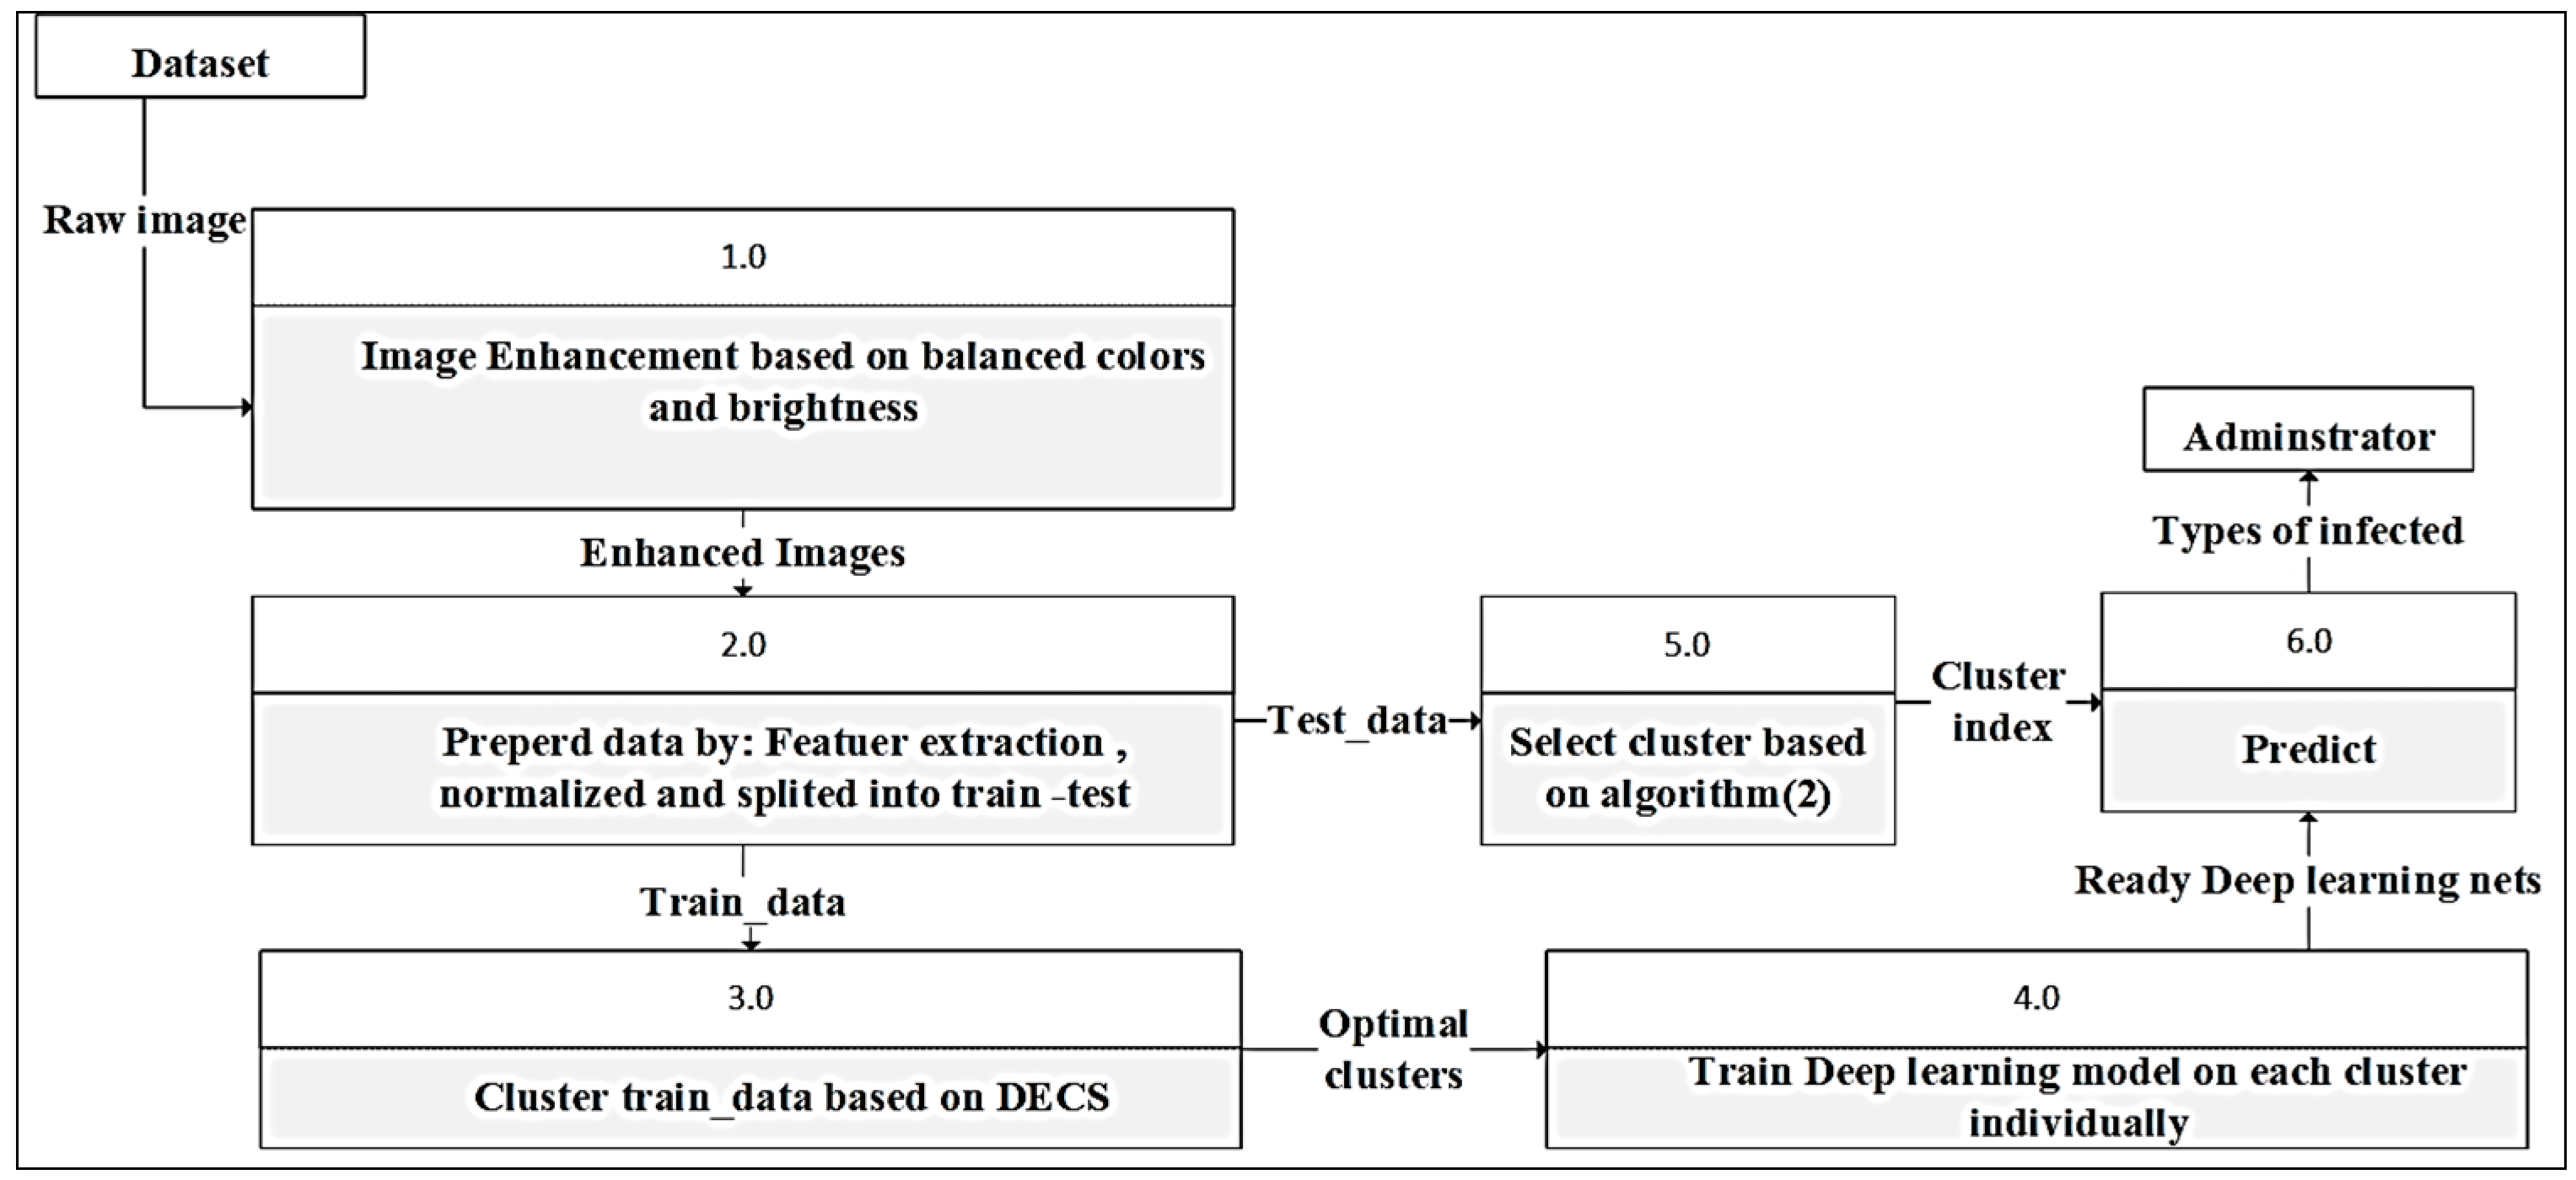
3.3. Methodology of the Research
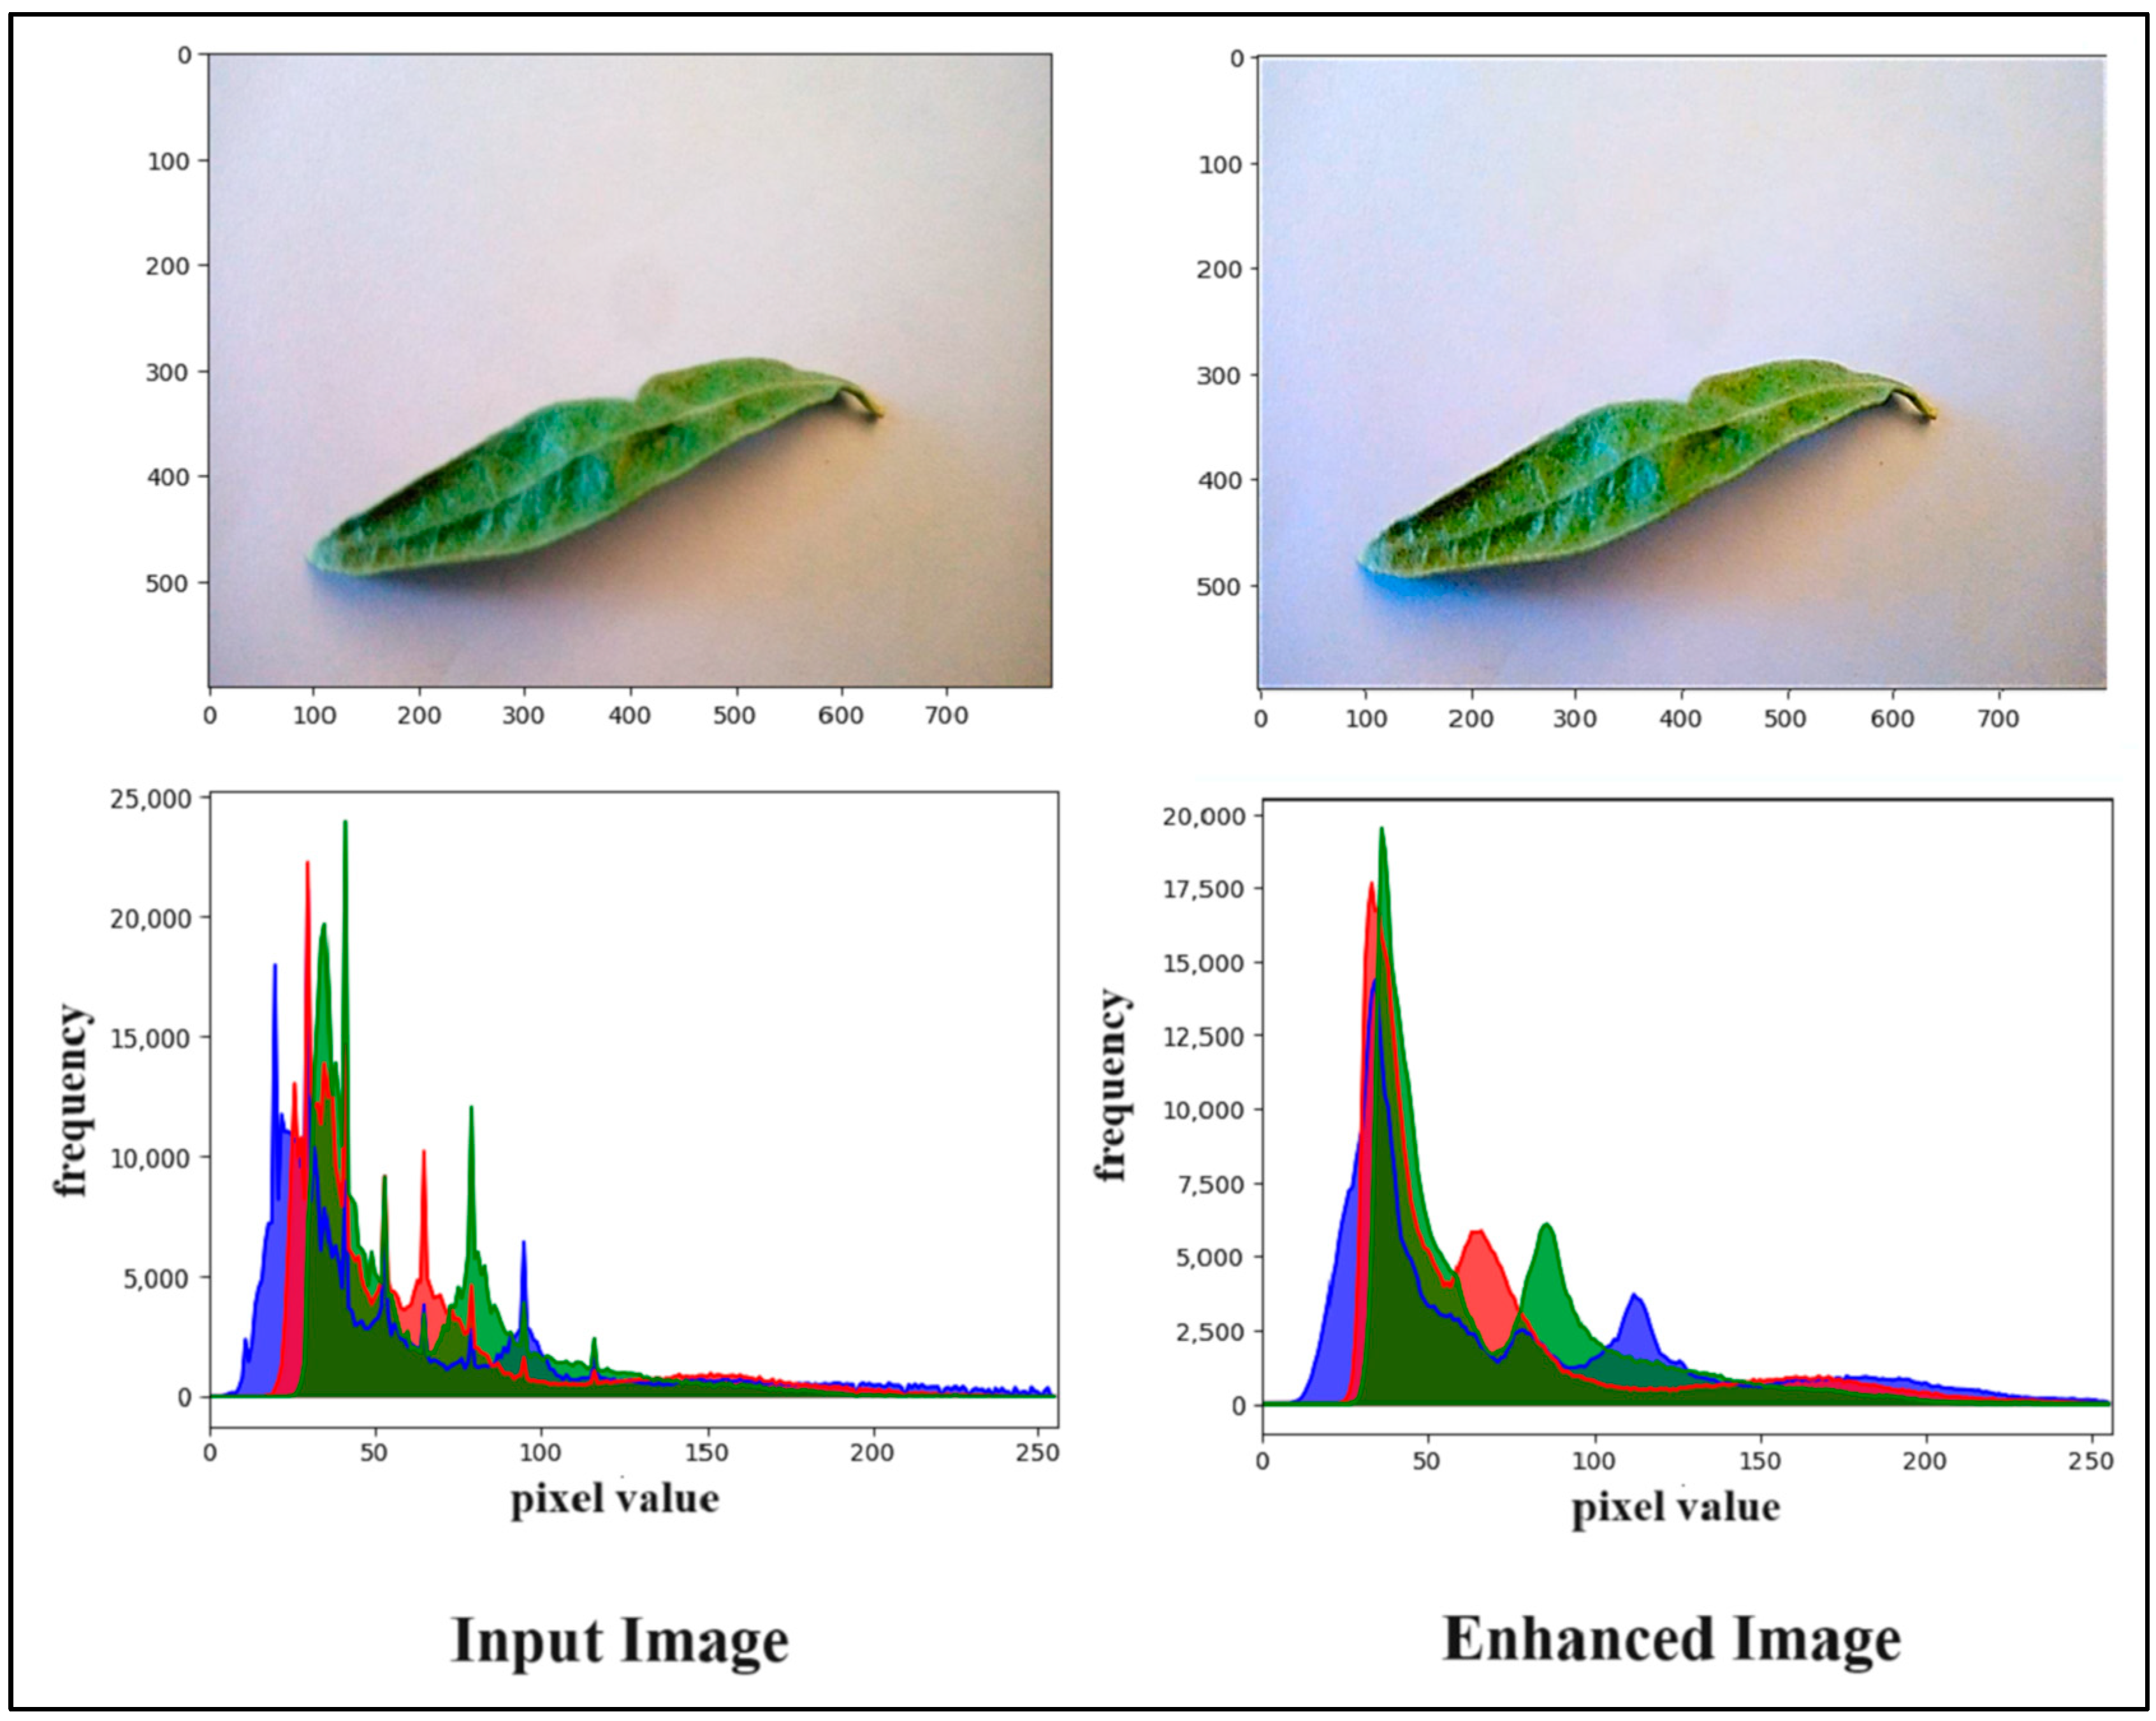
3.3.1. Image Enhancement Based on Balanced Colors and Brightness
| Algorithm 1: Image Enhancement Algorithm |
| Input: input the BGR image (I) Output: Enhanced _image
|
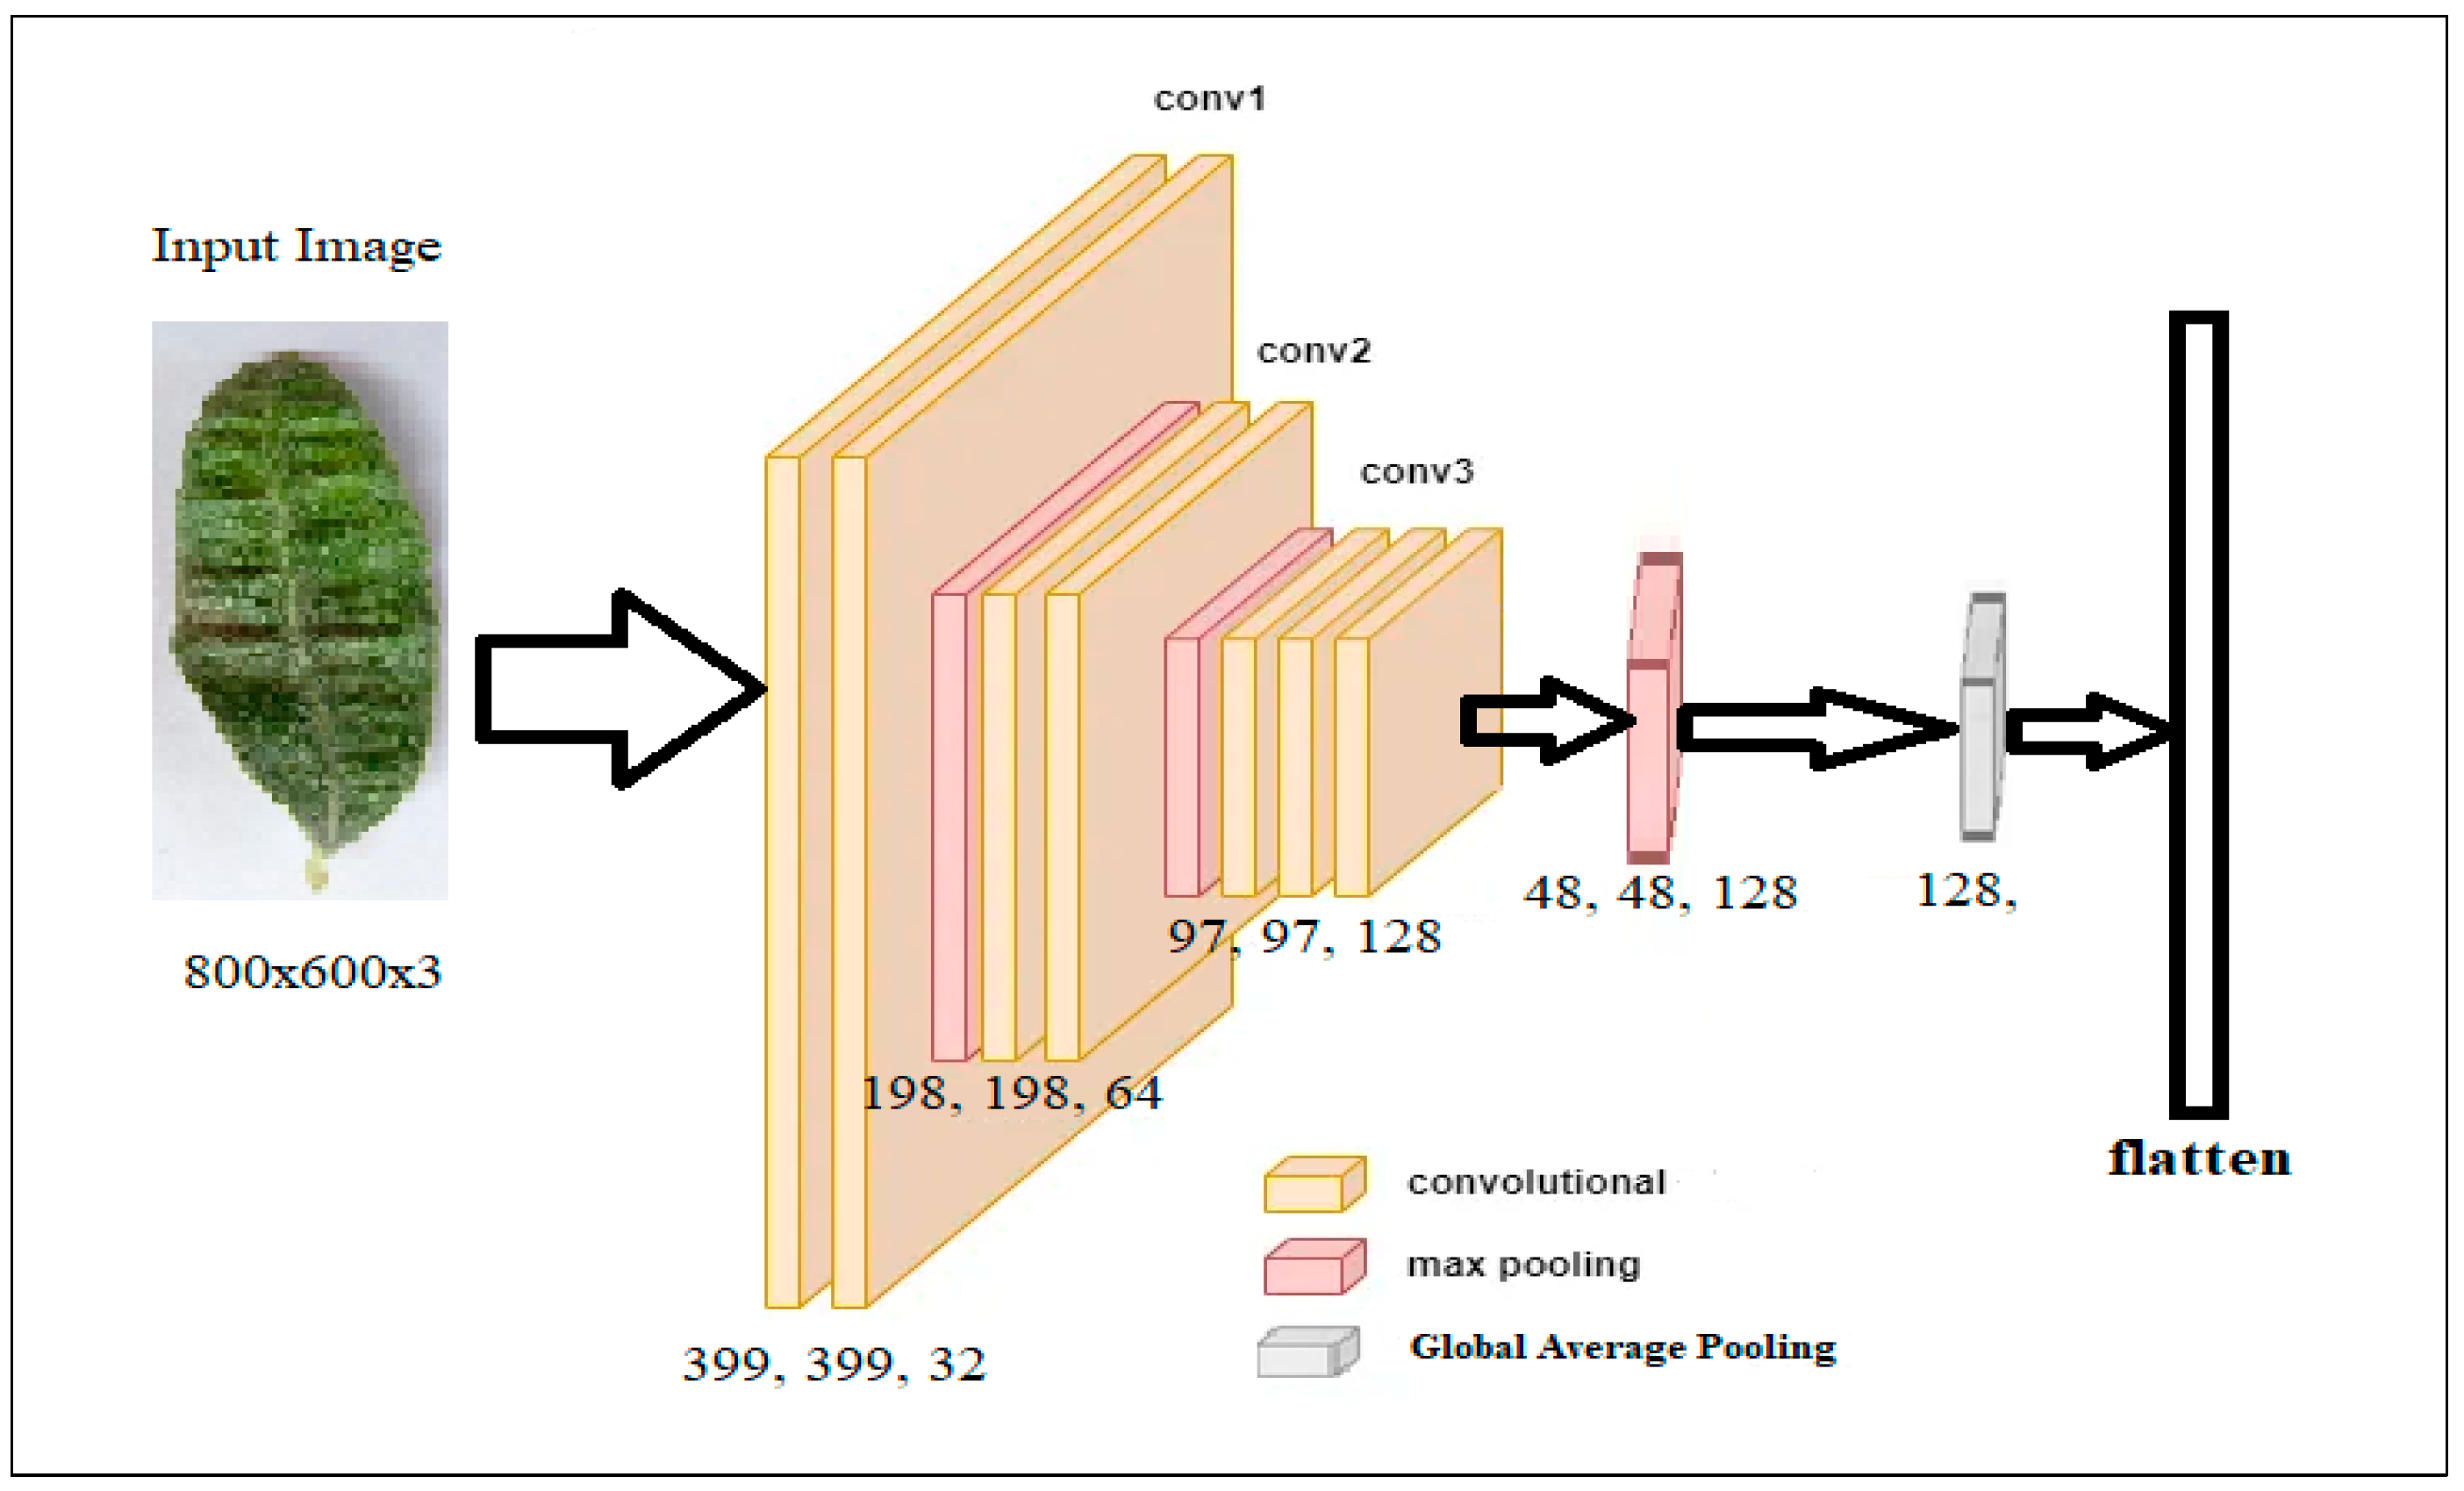
3.3.2. Prepared Data
- Input image: the first layer takes an RGB image of resolution 800 × 600 pixels.
- Layer 1: The convolutional layer 1 applies 32 filters to the input image using a kernel size of 3 × 3 and a stride of 1. The activation function used in this layer is rectified linear unit (ReLU). Max Pooling 1 takes the maximum value over a 2 × 2 pool size with a stride of 2—the output of this layer (399 × 399 × 32).
- Layer 2: Applies 64 filters on the input image, using a kernel size 3 × 3 and a stride of 1. The activation function used here is also ReLU. The second max pooling operation uses the same methodology, yielding an output of size 198 × 198 × 64.
- Layer 3: The third convolutional layer employs 128 filters, using a kernel size of 3 × 3 and a stride of 1. Again, ReLU serves as the activation function. The third max pooling operation works similarly, providing an output of size 97 × 97 × 128.
- Layer 3: This layer applies two types of max pooling. Initially, Max Pooling 4 chooses the maximum value across a 2 × 2 pool size with a stride of 2. The global average pooling calculates the average value for each feature map, reducing the spatial dimensions to 1 × 1, resulting in an output of size 128.
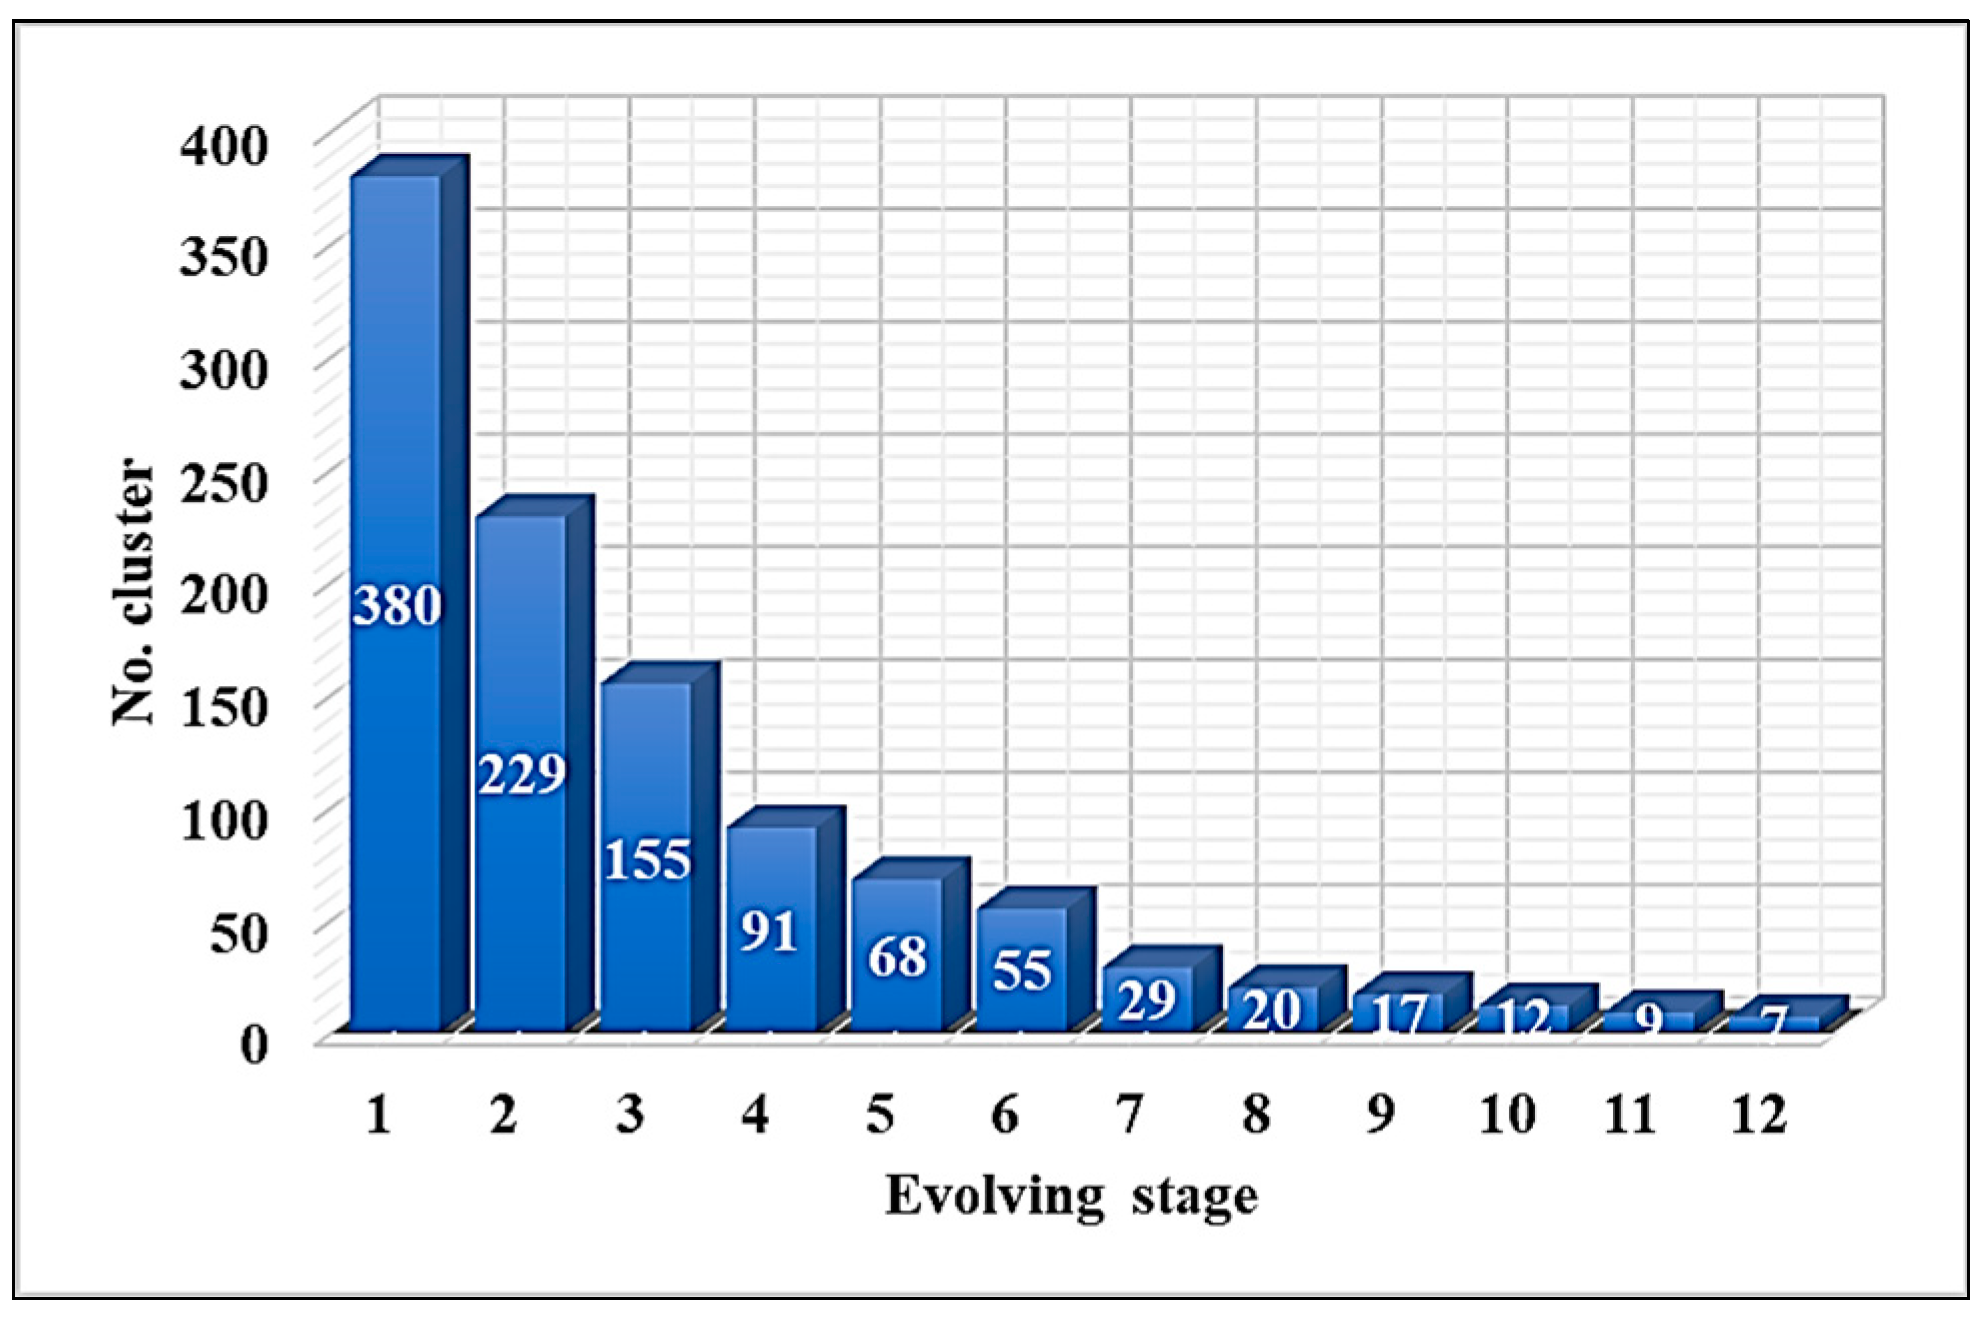
3.3.3. Cluster Train_Data Based on DECS
A. Generate Initial Clustering Pool
B. Optimize Clusters
3.3.4. Train the Deep Learning Model on Each Cluster Individually
3.3.5. Select a Cluster
| Algorithm 2: select cluster for new data point |
| Input: new data point x_n, set of clusters C Output: Selected cluster for new data point i. Calculate center distances: For each cluster in : ii.Calculate average distance: For each cluster in C: iii.Select cluster: // Return: selected_cluster |
3.3.6. Predict
4. Results
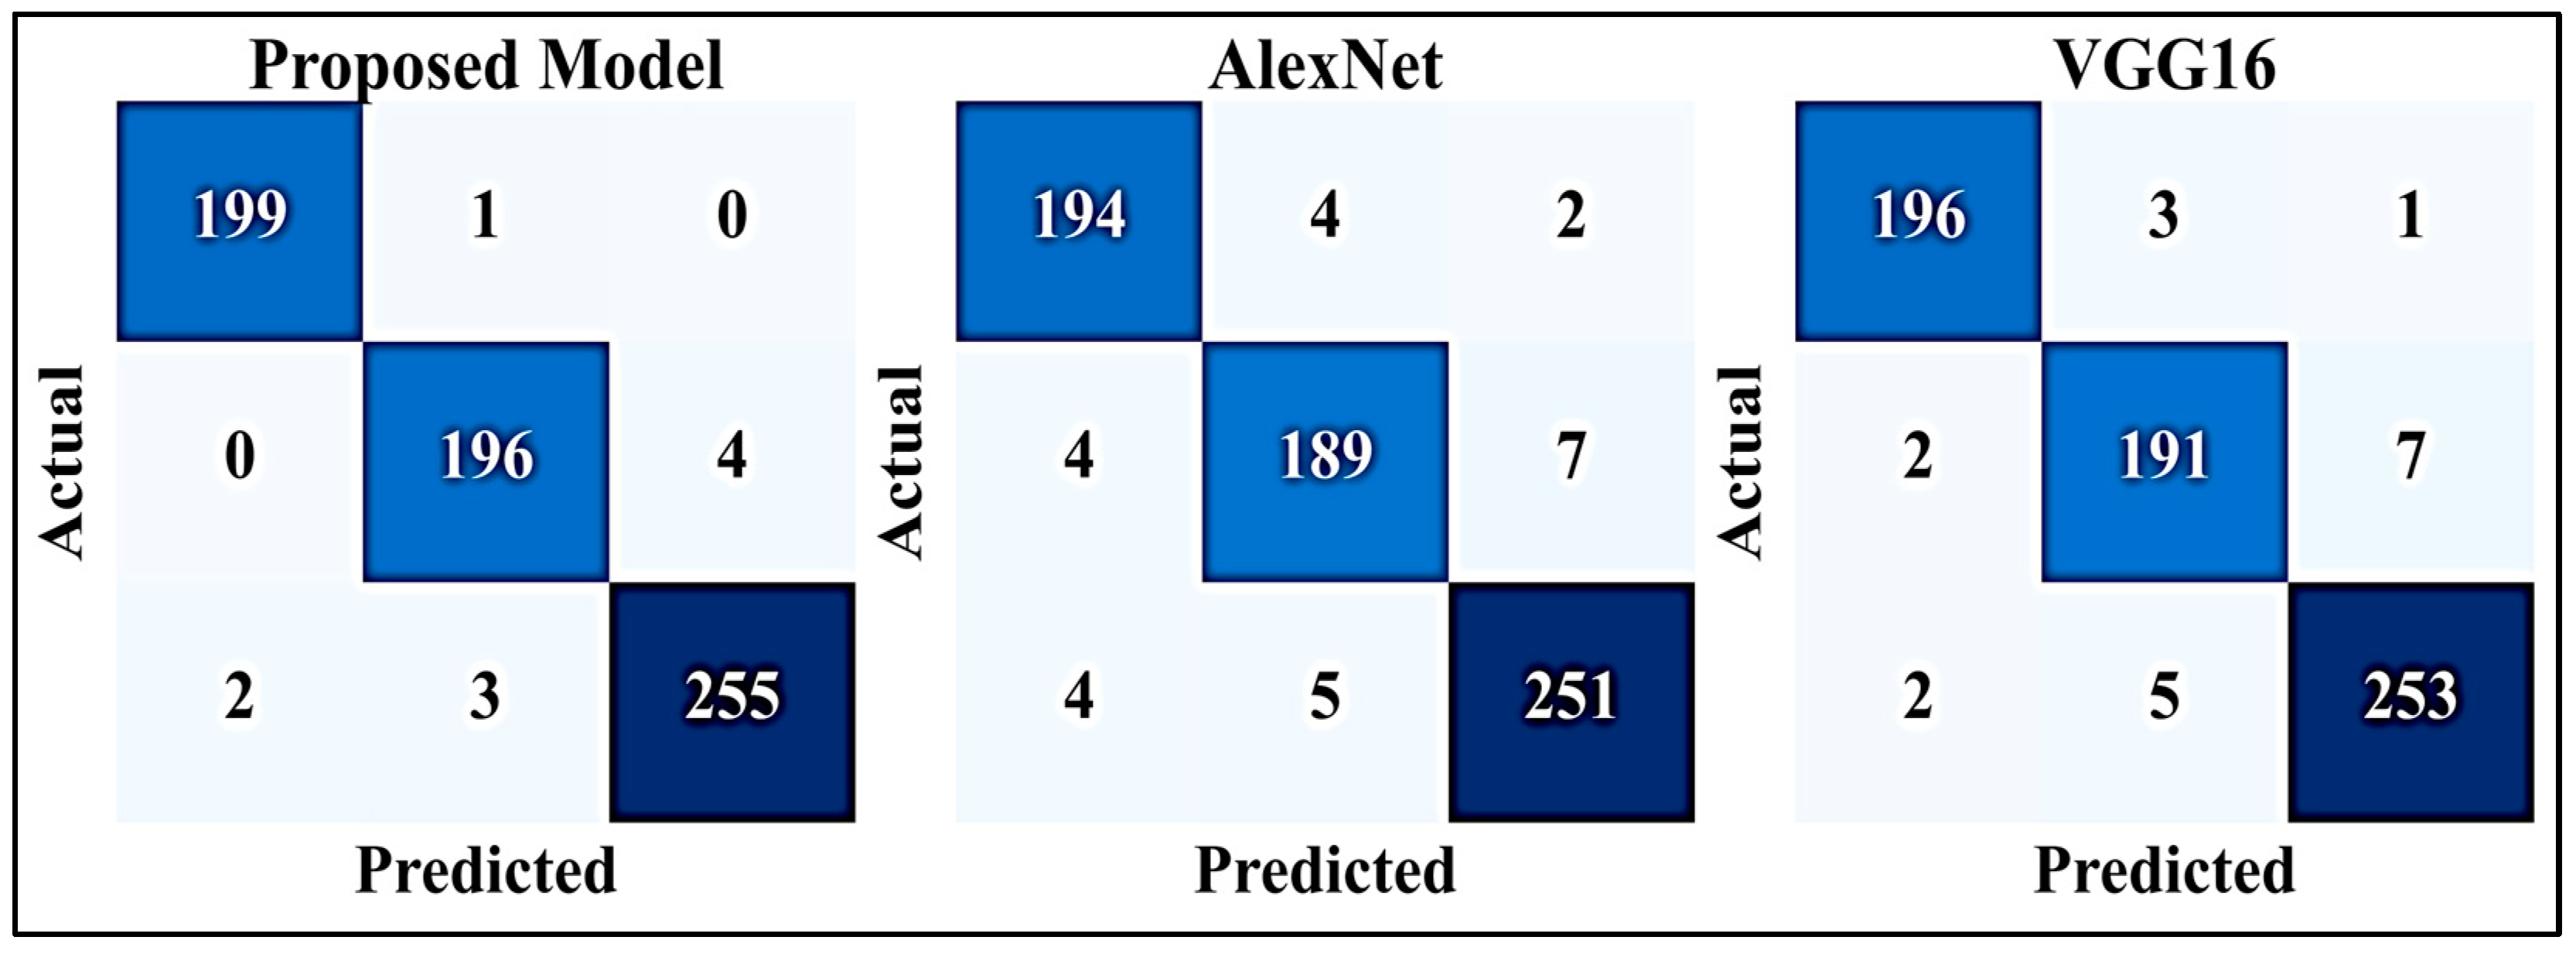
- Accuracy is the ratio of correctly predicted observations to total observations. It measures how well a model can classify or predict data correctly. Let be the number of true positives, be the number of true negatives, be the number of false positives, and be the number of false negatives. Equation (11) calculates the accuracy.
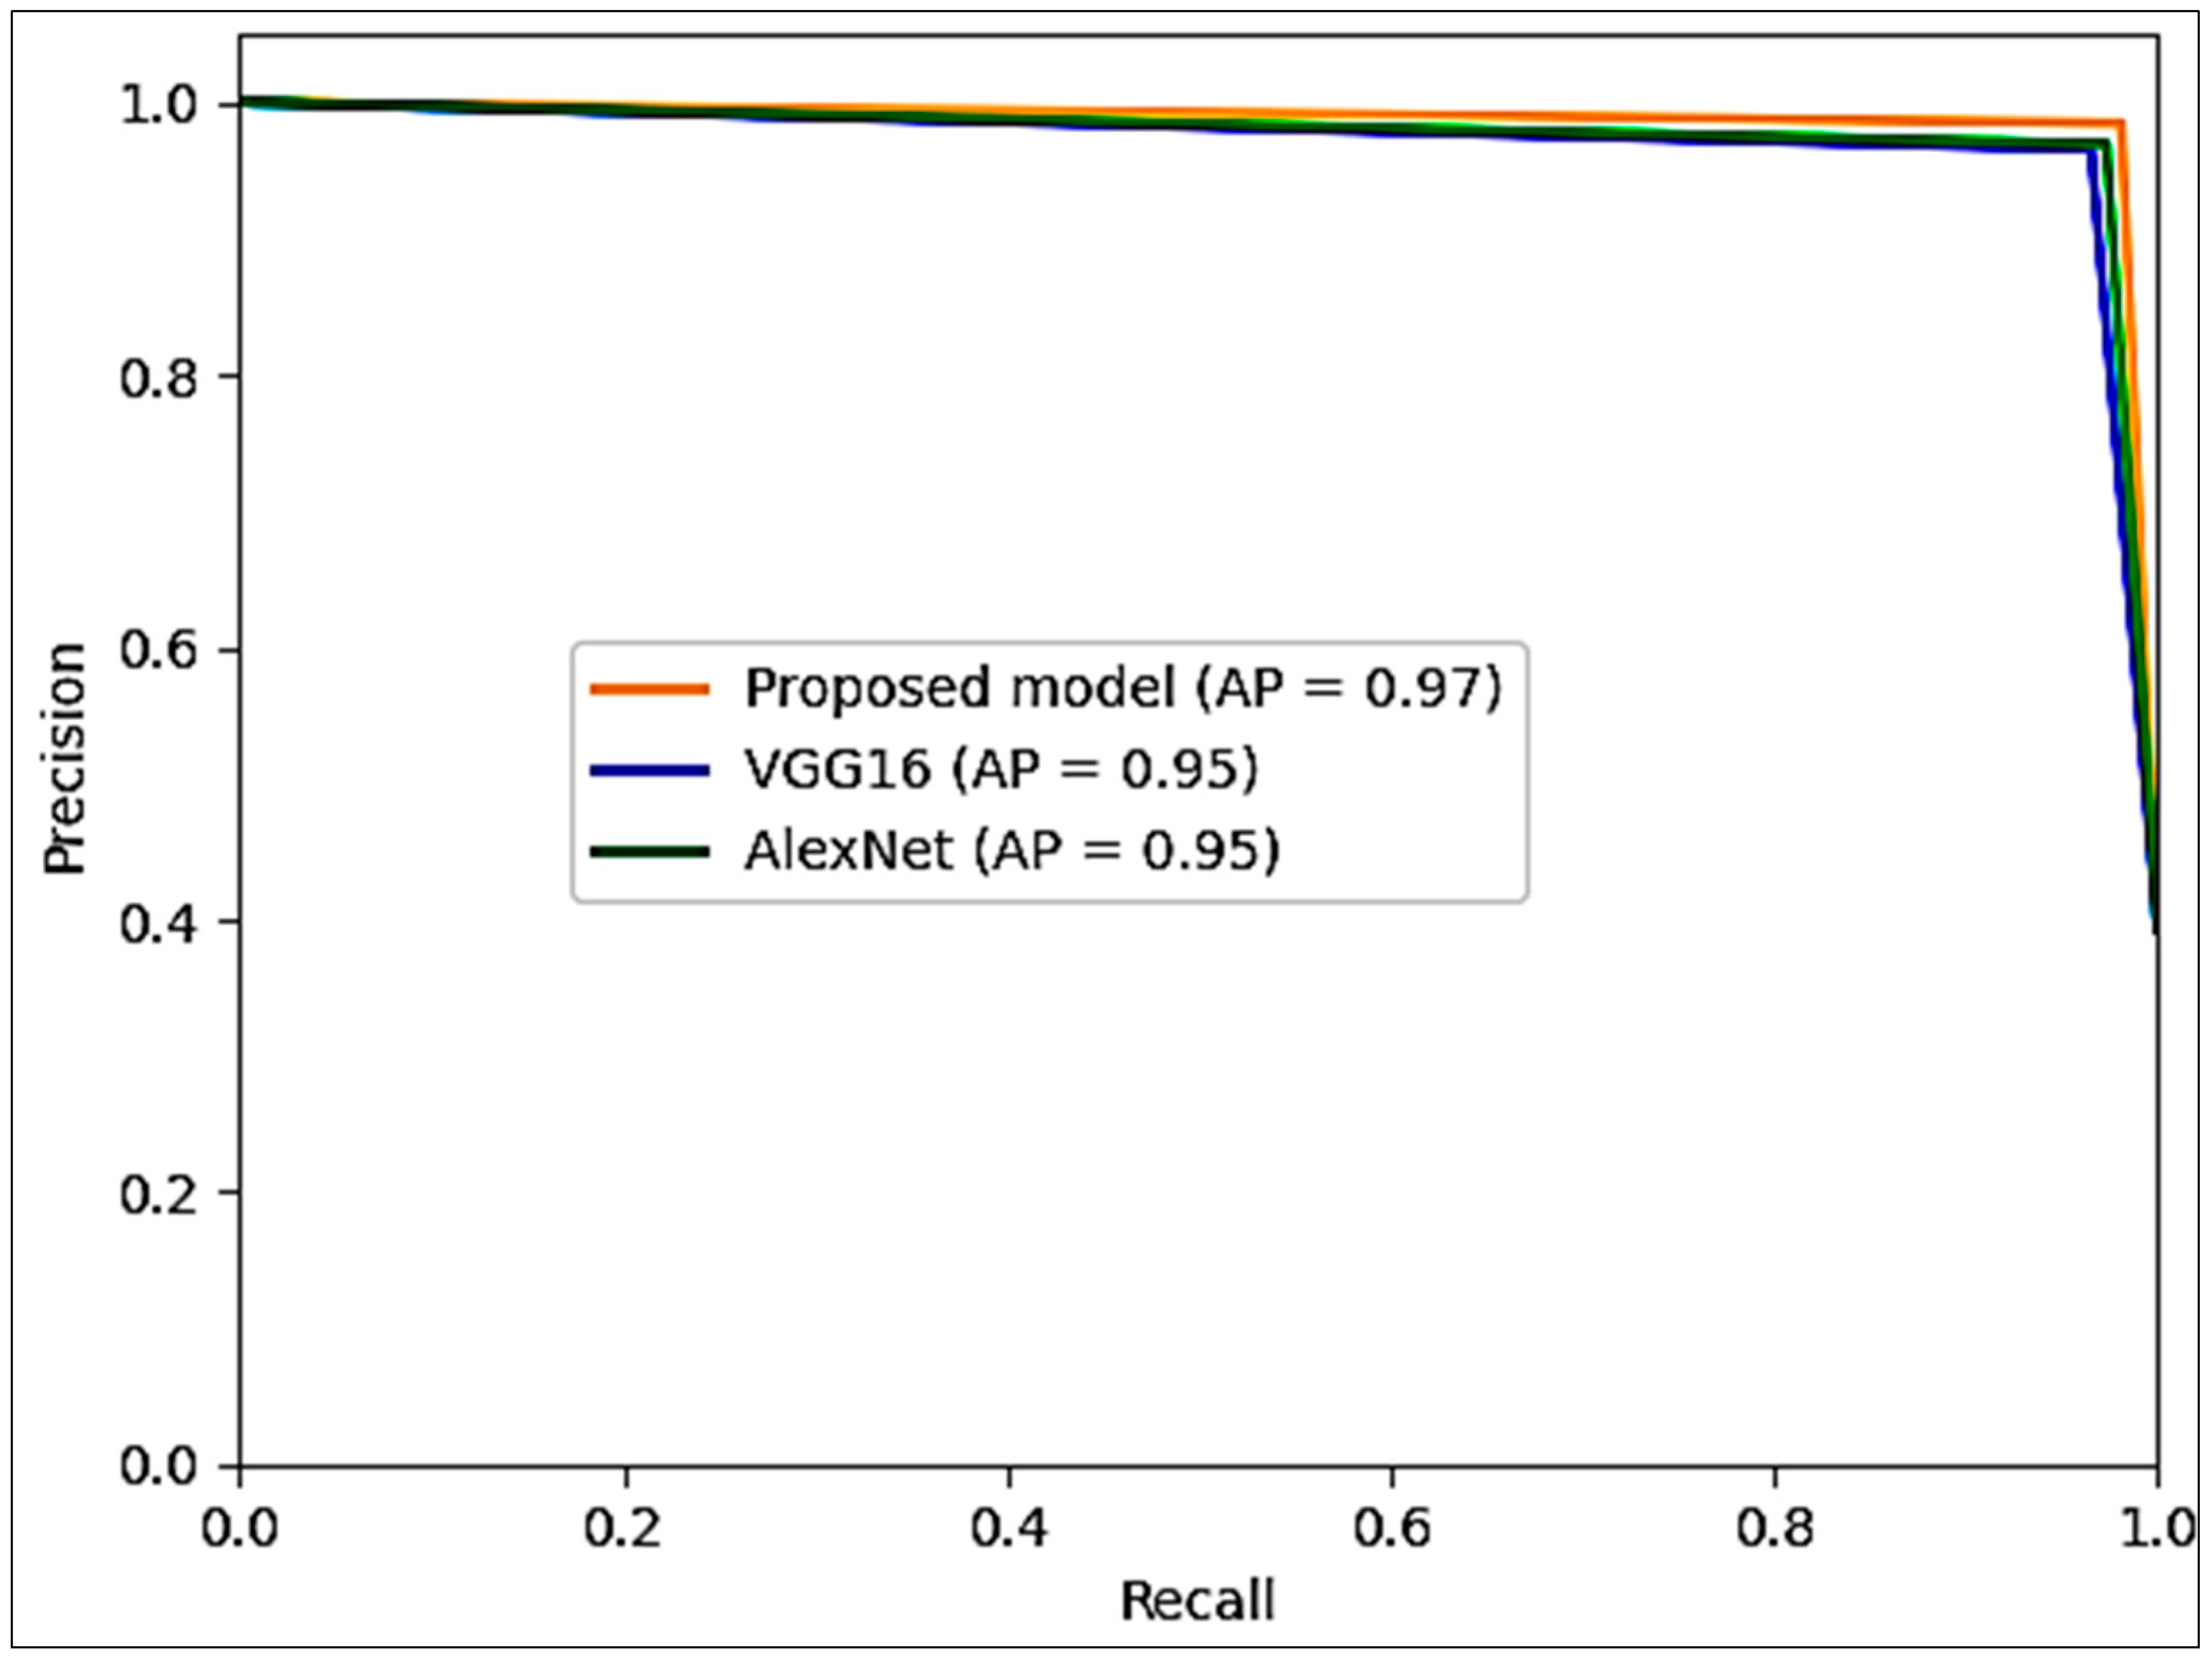
- Precision is the ratio of results divided by the number of all positive outcomes, including those incorrectly identified. It is especially beneficial when the consequences of FP are significant, as seen in medical diagnoses where a false positive could result in unnecessary treatments or procedures. Equation (13) calculates the precision.
- Recall, also known as sensitivity, is the ratio of TP results divided by the number of all samples that should be identified as positive. It measures how well a model can identify all positive instances. Equation (14) calculates the recall.
- F1-Score: F1-Score is the harmonic mean of precision and recall. It balances both metrics and is particularly useful when dealing with imbalanced datasets. Equation (15) calculates the F1-Score.
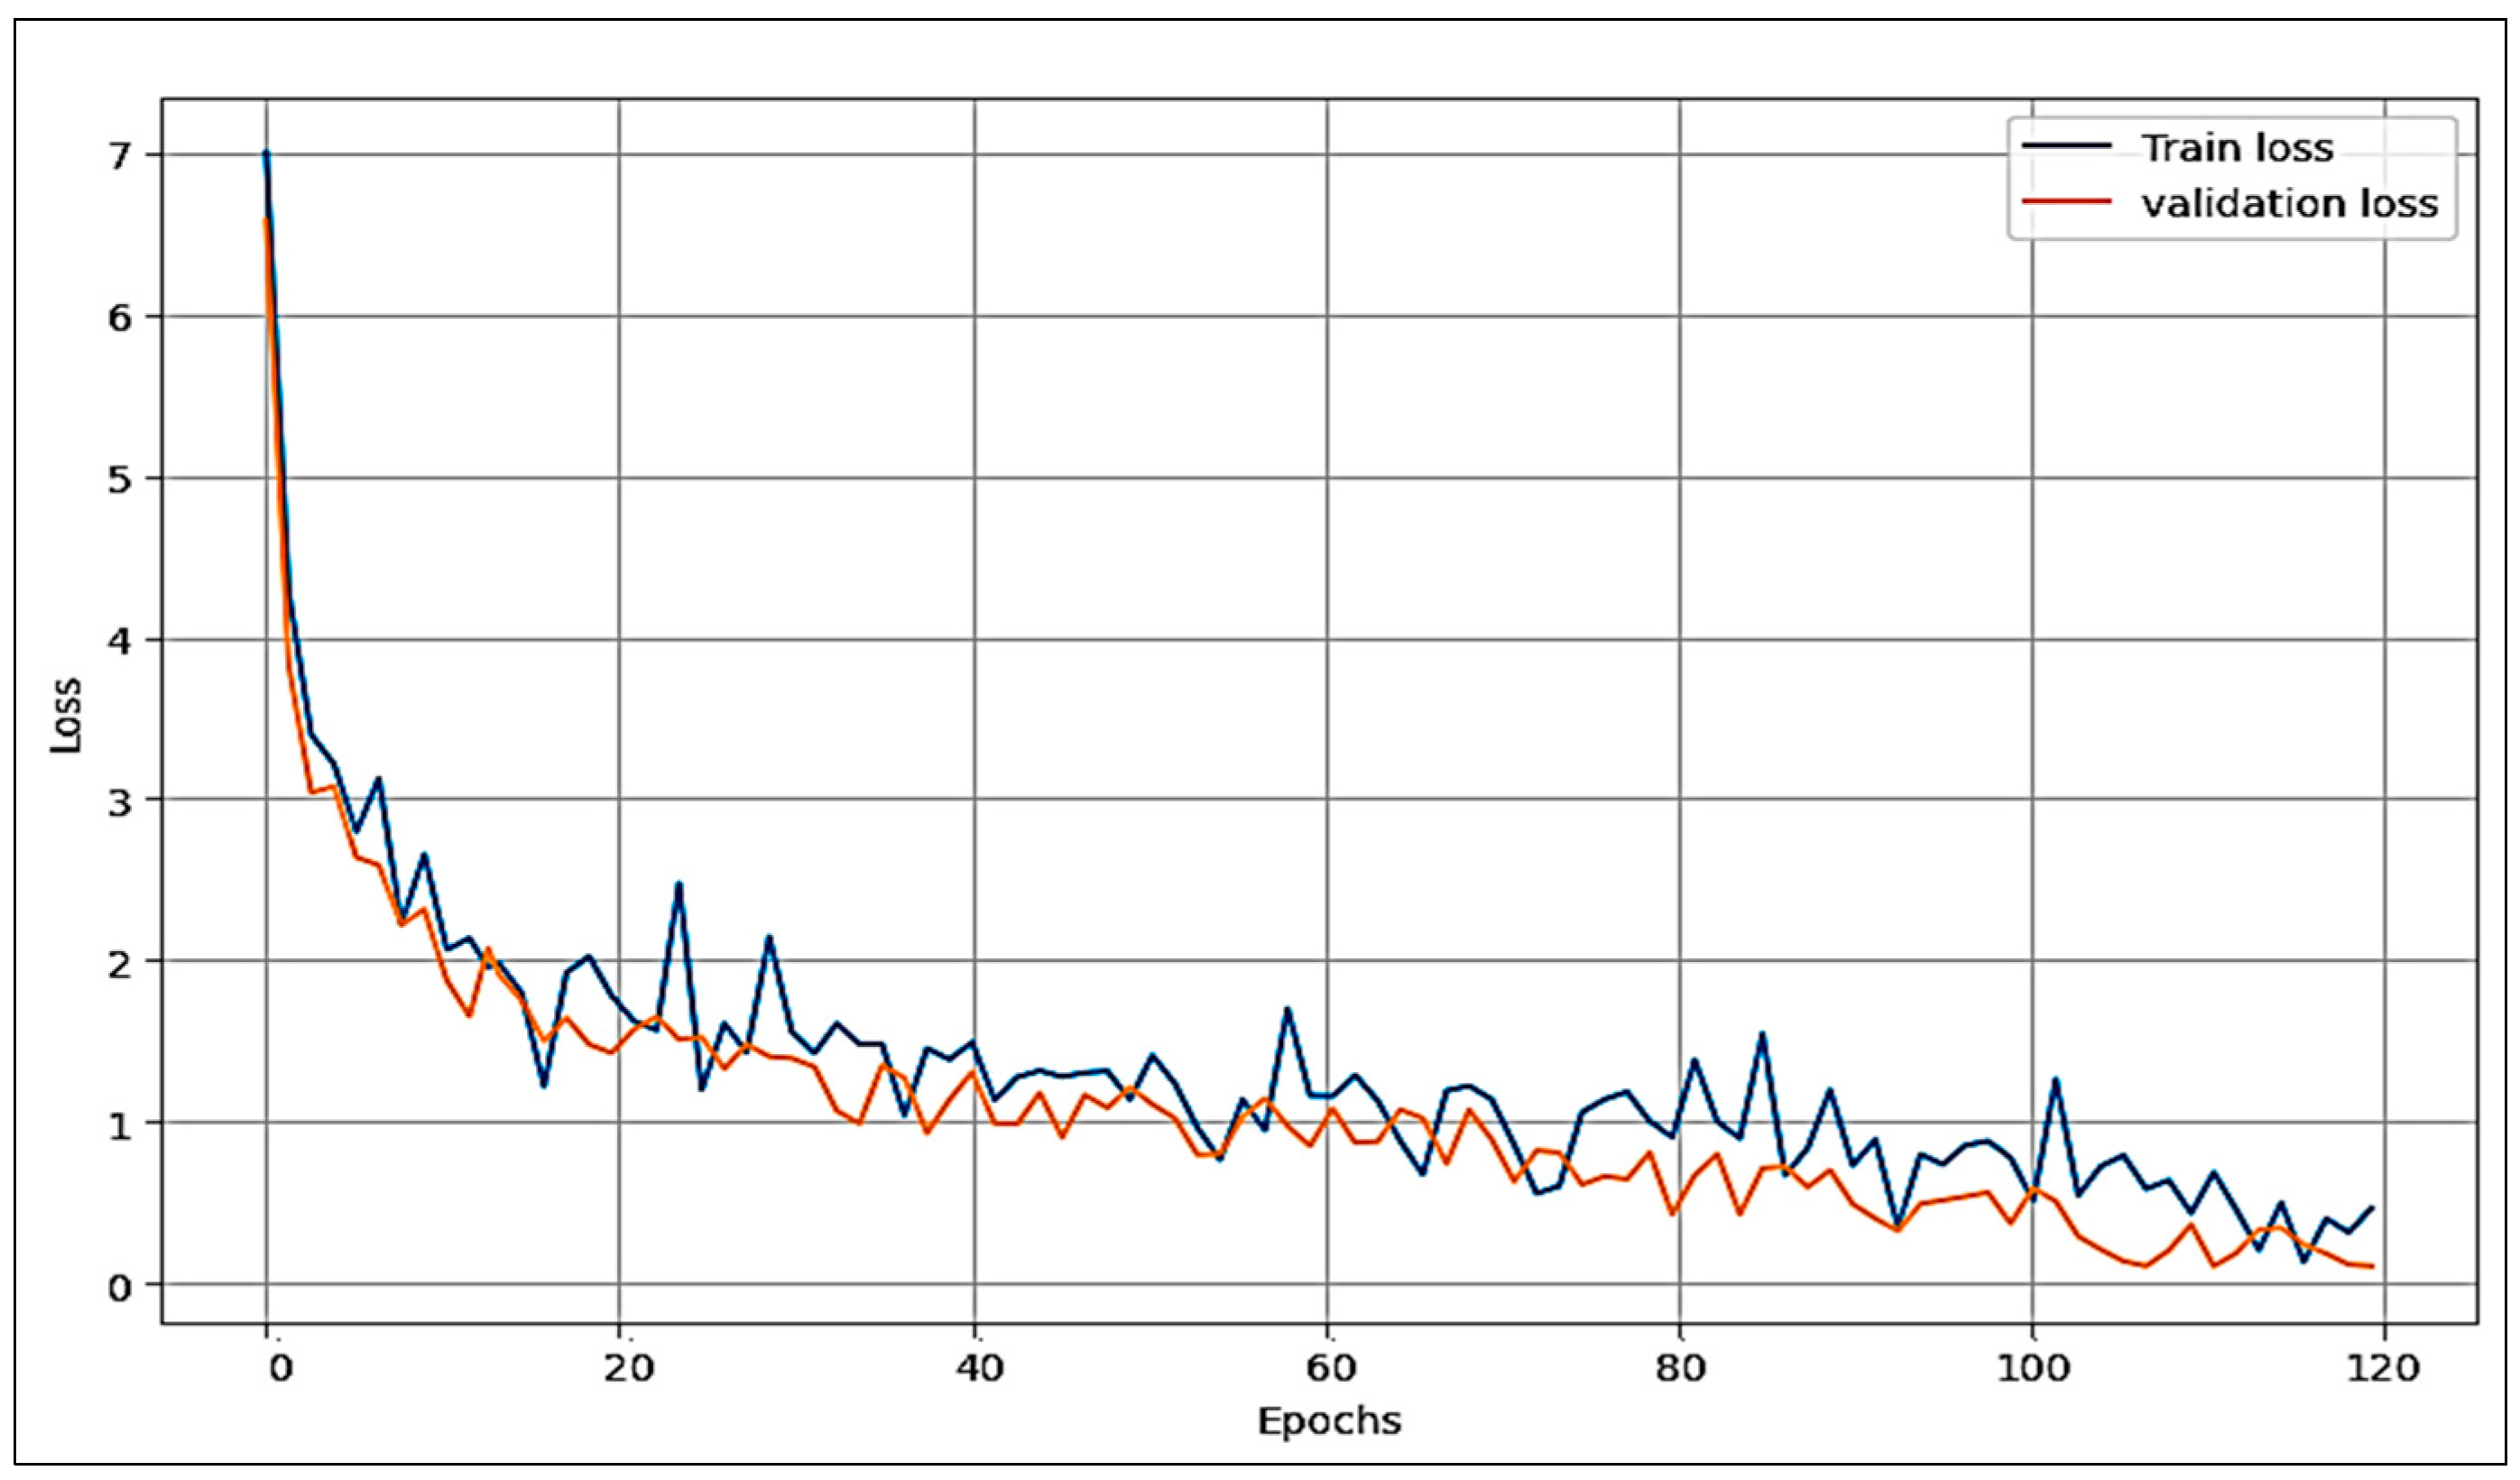
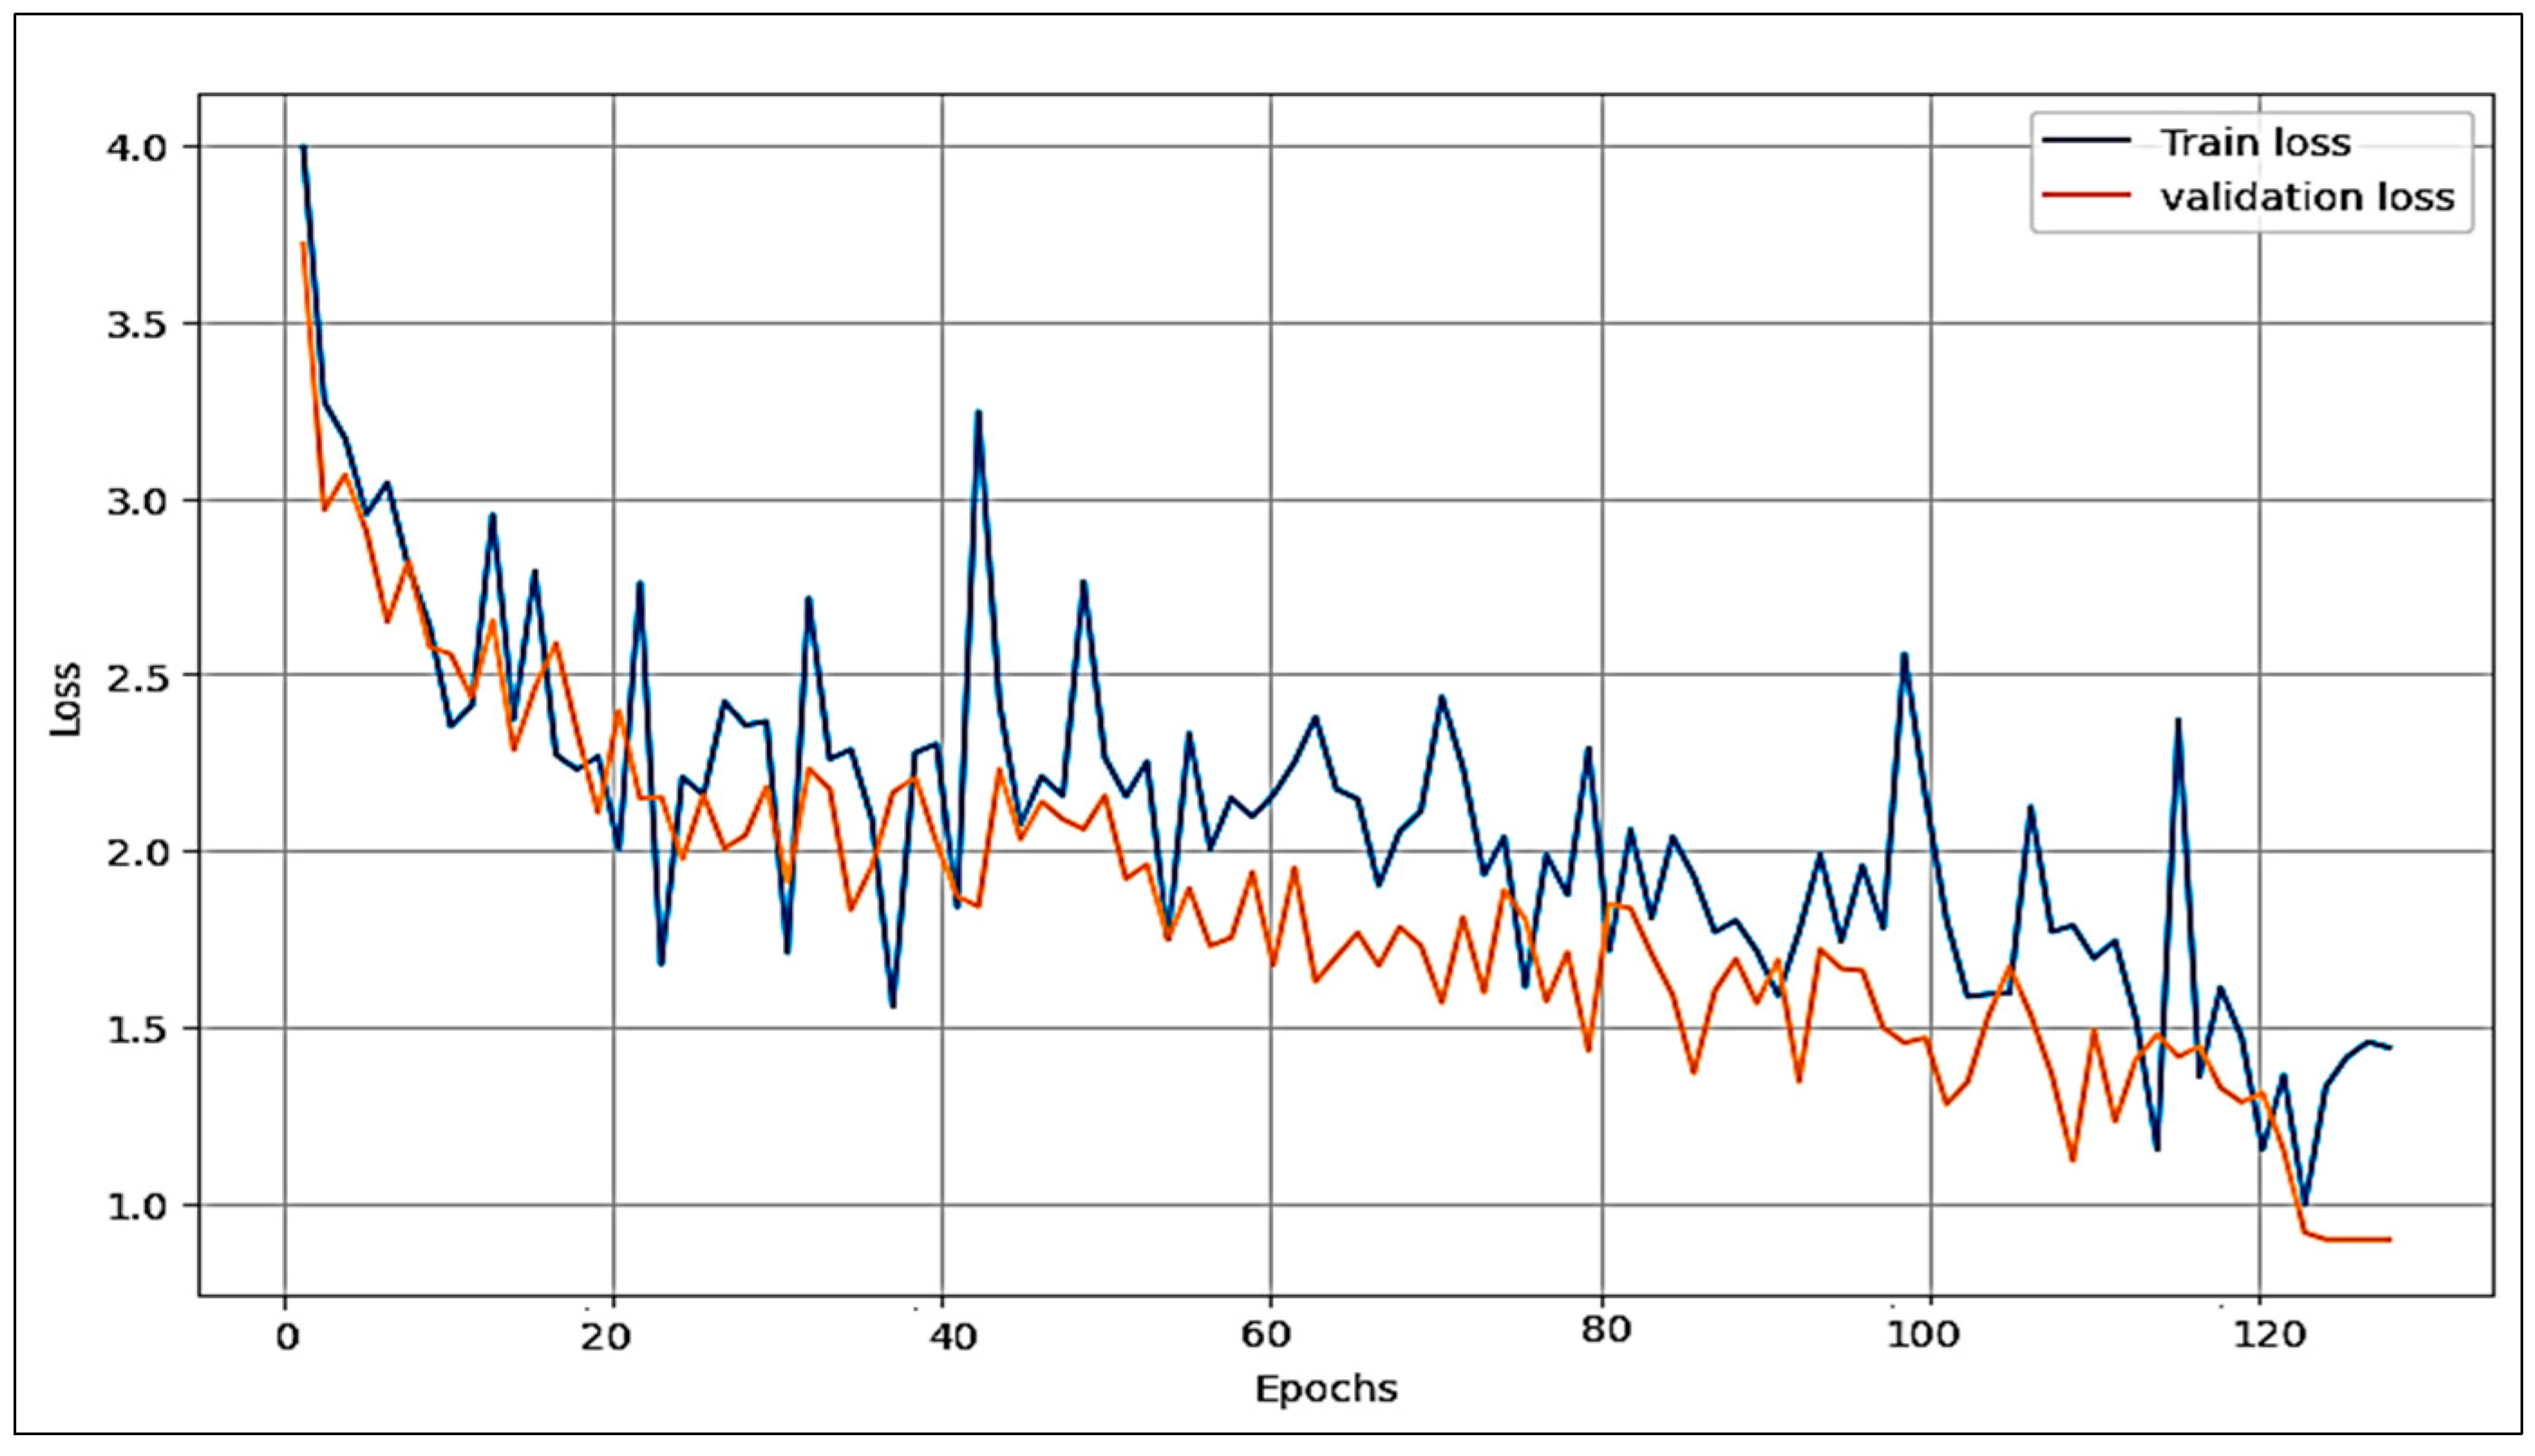
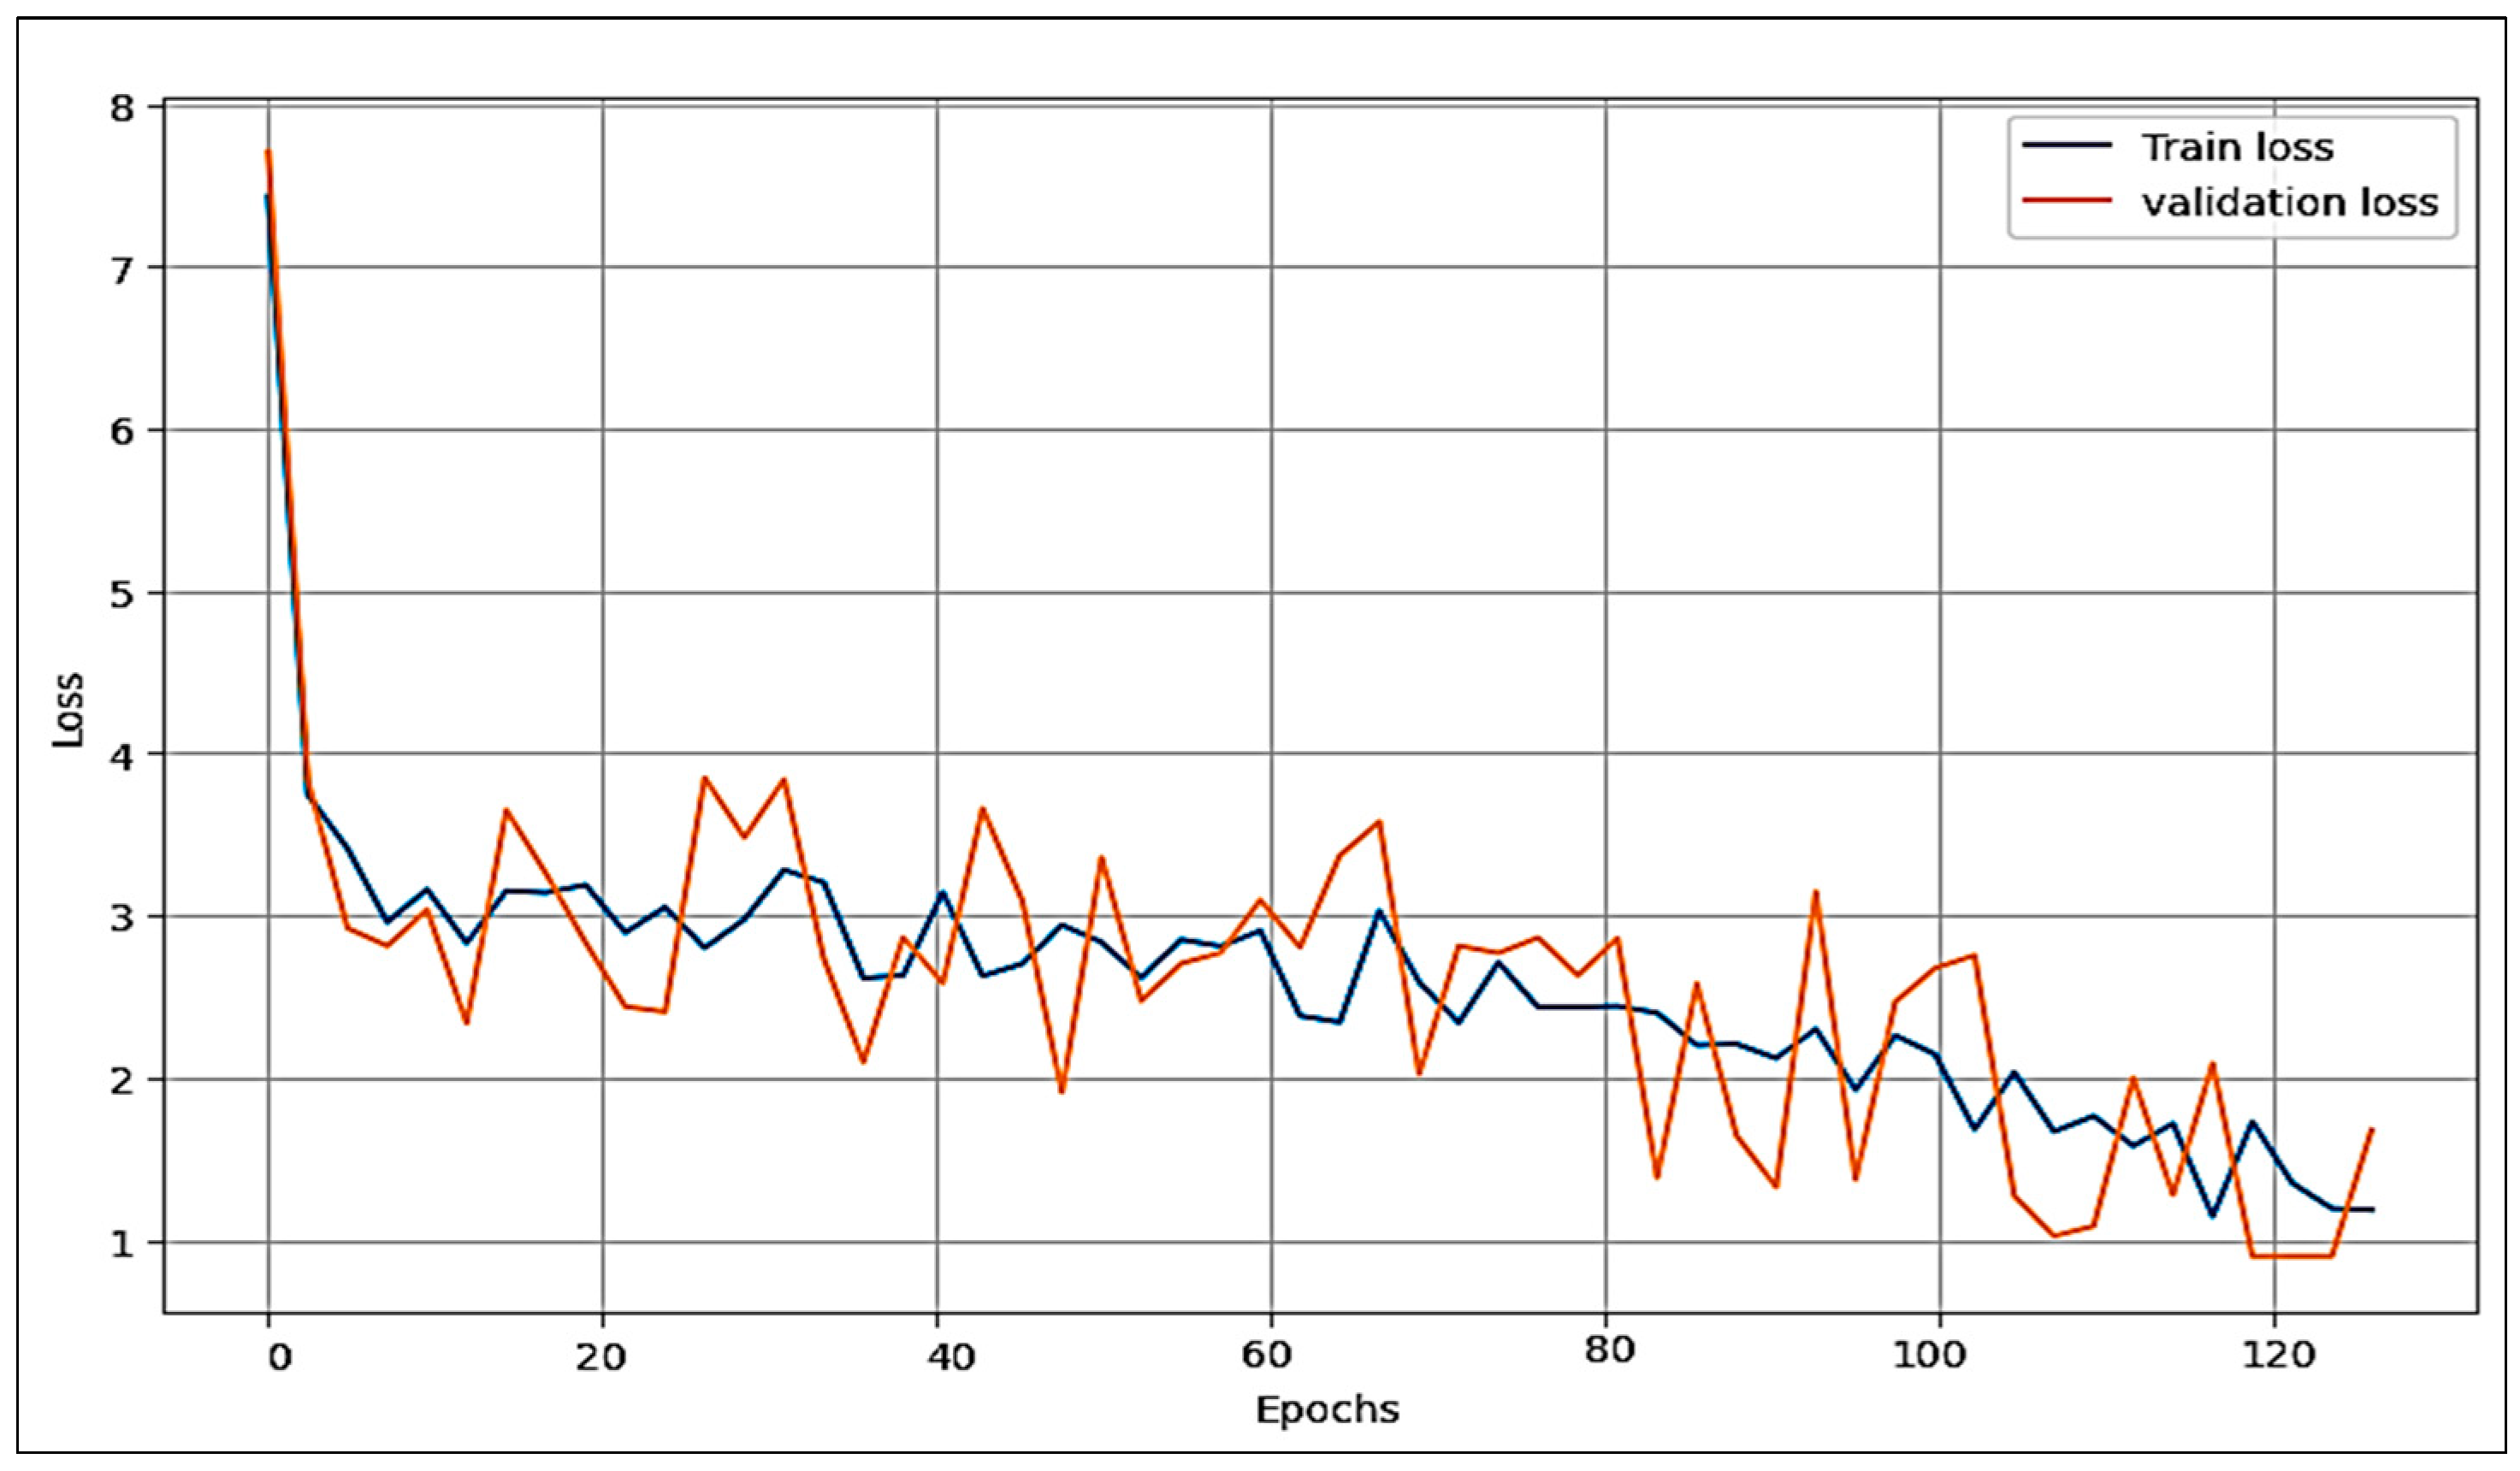
- Loss function trains neural networks for accurate multi-class classification by minimizing the discrepancy between predicted probabilities and true labels. Equation (16) calculates the loss function.
4.1. Experiment Result
4.2. Comperive with Other Studies
5. Conclusions
Author Contributions
Funding
Institutional Review Board Statement
Informed Consent Statement
Data Availability Statement
Conflicts of Interest
References
- Laasli, S.E.; Mokrini, F.; Dababat, A.A.; Yüksel, E.; Imren, M.; Amiri, S.; Lahlali, R. Phytopathogenic nematodes associated with olive trees (Olea europaea L.) in North Africa: Current status and management prospects. J. Plant Dis. Prot. 2023, 130, 698–706. [Google Scholar] [CrossRef]
- Victoriano, M.; Oliveira, L.; Oliveira, H.P. Automated Detection and Identification of Olive Fruit Fly Using YOLOv7 Algorithm. In Proceedings of the Iberian Conference on Pattern Recognition and Image Analysis, Alicante, Spain, 27–30 June 2023; Springer: Berlin/Heidelberg, Germany, 2023; pp. 211–222. [Google Scholar]
- Wang, W.; Tian, W.; Liao, W.; Li, B.; Hu, J. Error compensation of industrial robot based on deep belief network and error similarity. Robot. Comput. Integr. Manuf. 2022, 73, 102220. [Google Scholar] [CrossRef]
- Alshammari, H.; Gasmi, K.; Ltaifa, I.B.; Krichen, M.; Ammar, L.B.; Mahmood, M.A. Olive Disease Classification Based on Vision Transformer and CNN Models. Comput. Intell. Neurosci. 2022, 2022, 3998193. [Google Scholar] [CrossRef] [PubMed]
- Islam, M.K.; Ali, M.S.; Miah, M.S.; Rahman, M.M.; Alam, M.S.; Hossain, M.A. Brain tumor detection in MR image using superpixels, principal component analysis and template based K-means clustering algorithm. Mach. Learn. Appl. 2021, 5, 100044. [Google Scholar] [CrossRef]
- Khalaf, N.A.; Daway, H.G.; Ahmed, B.M. Hazy Image Enhancement Using DCP and AHE Algorithms with YIQ Color Space. Int. J. Intell. Eng. Syst. 2023, 16, 92–99. [Google Scholar]
- Chen, F.; Wang, X.; Zhao, Y.; Lv, S.; Niu, X. Visual object tracking: A survey. Comput. Vis. Image Underst. 2022, 222, 103508. [Google Scholar] [CrossRef]
- Ghawy, M.Z.; Amran, G.A.; AlSalman, H.; Ghaleb, E.; Khan, J.; Al-Bakhrani, A.A.; Alziadi, A.M.; Ali, A.; Ullah, S.S. Optimal deep learning model for olive disease diagnosis based on an adaptive genetic algorithm. Wirel. Commun. Mob. Comput. 2022, 2022, 8531213. [Google Scholar]
- Kirtane, N.; Chelladurai, J.; Ravindran, B.; Tendulkar, A. ReGrAt: Regularization in Graphs using Attention to handle class imbalance. arXiv preprint 2022, arXiv:2211.14770. [Google Scholar]
- Wang, S.; Huang, L.; Gao, A.; Ge, J.; Zhang, T.; Feng, H.; Satyarth, I.; Li, M.; Zhang, H.; Ng, V. Machine/deep learning for software engineering: A systematic literature review. IEEE Trans. Softw. Eng. 2022, 49, 1188–1231. [Google Scholar] [CrossRef]
- Uğuz, S.; Uysal, N. Classification of olive leaf diseases using deep convolutional neural networks. Neural Comput. Appl. 2021, 33, 4133–4149. [Google Scholar] [CrossRef]
- Ksibi, A.; Ayadi, M.; Soufiene, B.O.; Jamjoom, M.M.; Ullah, Z. MobiRes-net: A hybrid deep learning model for detecting and classifying olive leaf diseases. Appl. Sci. 2022, 12, 10278. [Google Scholar] [CrossRef]
- Mamdouh, N.; Khattab, A. Olive Leaf Disease Identification Framework using Inception V3 Deep Learning. In Proceedings of the 2022 IEEE International Conference on Design & Test of Integrated Micro & Nano-Systems (DTS), Cairo, Egypt, 6–9 June 2022; IEEE: Piscataway, NJ, USA, 2022; pp. 1–6. [Google Scholar]
- Gulzar, Y. Fruit image classification model based on MobileNetV2 with deep transfer learning technique. Sustainability 2023, 15, 1906. [Google Scholar] [CrossRef]
- Mamat, N.; Othman, M.F.; Abdulghafor, R.; Alwan, A.A.; Gulzar, Y. Enhancing image annotation technique of fruit classification using a deep learning approach. Sustainability 2023, 15, 901. [Google Scholar] [CrossRef]
- Sarker, I.H. Machine learning: Algorithms, real-world applications and research directions. SN Comput. Sci. 2021, 2, 160. [Google Scholar] [CrossRef]
- Wu, Z.; Jiang, S.; Zhou, X.; Wang, Y.; Zuo, Y.; Wu, Z.; Liang, L.; Liu, Q. Application of image retrieval based on convolutional neural networks and Hu invariant moment algorithm in computer telecommunications. Comput. Commun. 2020, 150, 729–738. [Google Scholar] [CrossRef]
- Nam, G.; Choi, H.; Cho, J.; Kim, I.-J. PSI-CNN: A Pyramid-Based Scale-Invariant CNN Architecture for Face Recognition Robust to Various Image Resolutions. Appl. Sci. 2018, 8, 1561. [Google Scholar] [CrossRef]
- Yin, C.; Zhu, Y.; Fei, J.; He, X. A Deep Learning Approach for Intrusion Detection Using Recurrent Neural Networks. IEEE Access 2017, 5, 21954–21961. [Google Scholar] [CrossRef]
- Sohn, I. Deep belief network based intrusion detection techniques: A survey. Expert Syst. Appl. 2021, 167, 114170. [Google Scholar] [CrossRef]
- Malhan, R.K.; Gupta, S.K. The Role of Deep Learning in Manufacturing Applications: Challenges and Opportunities. J. Comput. Inf. Sci. Eng. 2023, 23, 1–11. [Google Scholar] [CrossRef]
- Miakshyn, O.; Anufriiev, P.; Bashkov, Y. Face Recognition Technology Improving Using Convolutional Neural Networks. In Proceedings of the 2021 IEEE 3rd International Conference on Advanced Trends in Information Theory (ATIT), Kyiv, Ukraine, 15–17 December 2021. [Google Scholar]
- Raouhi, E.M.; Lachgar, M.; Hrimech, H.; Kartit, A. Optimization techniques in deep convolutional neuronal networks applied to olive diseases classification. Artif. Intell. Agric. 2022, 6, 77–89. [Google Scholar] [CrossRef]
- Babalola, E.-O.; Asad, M.H.; Bais, A. Soil Surface Texture Classification using RGB Images Acquired under Uncontrolled Field Conditions. IEEE Access 2023, 11, 67140–67155. [Google Scholar] [CrossRef]
- Almabdy, S.; Elrefaei, L. Deep Convolutional Neural Network-Based Approaches for Face Recognition. Appl. Sci. 2019, 9, 4397. [Google Scholar] [CrossRef]
- Hesse, R.; Schaub-Meyer, S.; Roth, S. Content-Adaptive Downsampling in Convolutional Neural Networks. In Proceedings of the IEEE/CVF Conference on Computer Vision and Pattern Recognition, Seattle, WA, USA, 10 November 2023; pp. 4543–4552. [Google Scholar]
- Yuan, F.; Zhang, Z.; Fang, Z. An effective CNN and Transformer complementary network for medical image segmentation. Pattern Recognit. 2023, 136, 109228. [Google Scholar] [CrossRef]
- Ravikumar, A.; Sriraman, H. Real-time pneumonia prediction using pipelined spark and high-performance computing. PeerJ Comput. Sci. 2023, 9, e1258. [Google Scholar] [CrossRef]
- Oluwasakin, E.; Torku, T.; Sun, T.; Yinusa, A.; Hamden, S.; Poudel, S.; Vargas, J.; Poudel, K.N. Minimization of high computational cost in data preprocessing and modeling using MPI4Py. Mach. Learn. Appl. 2023, 100483. [Google Scholar] [CrossRef]
- D’Angelo, G.; Farsimadan, E.; Palmieri, F. Recurrence Plots-Based Network Attack Classification Using CNN-Autoencoders. In Proceedings of the International Conference on Computational Science and Its Applications, Prague, Czech Republic, 3–5 July 2023; Springer: Berlin/Heidelberg, Germany, 2023; pp. 191–209. [Google Scholar]
- Bisen, D.; Lilhore, U.K.; Manoharan, P.; Dahan, F.; Mzoughi, O.; Hajjej, F.; Saurabh, P.; Raahemifar, K. A Hybrid Deep Learning Model Using CNN and K-Mean Clustering for Energy Efficient Modelling in Mobile EdgeIoT. Electronics 2023, 12, 1384. [Google Scholar] [CrossRef]
- Guo, W.; Huang, C.; Qin, X.; Yang, L.; Zhang, W. Dynamic clustering and power control for two-tier wireless federated learning. IEEE Trans. Wirel. Commun. 2023. [Google Scholar] [CrossRef]
- Liang, J.; Wang, S.; Zhao, S.; Chen, S. FECC: DNS Tunnel Detection model based on CNN and Clustering. Comput. Secur. 2023, 128, 103132. [Google Scholar] [CrossRef]
- Singh, A.; Kumar, M. Bayesian fuzzy clustering and deep CNN-based automatic video summarization. Multimed. Tools Appl. 2023, 1–38. [Google Scholar] [CrossRef]
- Cheung, L.; Wang, Y.; Lau, A.S.; Chan, R.M. Using a novel clustered 3D-CNN model for improving crop future price prediction. Knowl. Based Syst. 2023, 260, 110133. [Google Scholar] [CrossRef]
- Sánchez, C.N.; Orvañanos-Guerrero, M.T.; Domínguez-Soberanes, J.; Álvarez-Cisneros, Y.M. Analysis of beef quality according to color changes using computer vision and white-box machine learning techniques. Heliyon 2023, 9, e17976. [Google Scholar] [CrossRef] [PubMed]
- Narayan, V.; Mall, P.K.; Alkhayyat, A.; Abhishek, K.; Kumar, S.; Pandey, P. Enhance-Net: An Approach to Boost the Performance of Deep Learning Model Based on Real-Time Medical Images. J. Sens. 2023, 2023, 8276738. [Google Scholar] [CrossRef]
- Hadi, S.M.; Alsaeedi, A.H.; Nuiaa, R.R.; Manickam, S.; Alfoudi, A.S.D. Dynamic Evolving Cauchy Possibilistic Clustering Based on the Self-Similarity Principle (DECS) for Enhancing Intrusion Detection System. Int. J. Intell. Eng. Syst. 2022, 15. [Google Scholar] [CrossRef]
- Rawat, D.B.; Doku, R.; Garuba, M. Cybersecurity in big data era: From securing big data to data-driven security. IEEE Trans. Serv. Comput. 2019, 14, 2055–2072. [Google Scholar] [CrossRef]


| Olive Disease | Train | Test | Total |
|---|---|---|---|
| Healthy | 830 | 220 | 1050 |
| aculus_olearius | 690 | 200 | 690 |
| olive_peacock_spot | 1200 | 260 | 1460 |
| Type | Component of the Proposed Model | Accuracy (%) | ||
|---|---|---|---|---|
| Image Enhancement | Clustering | Deep Learning | ||
| Combination I | No | No | Yes | 84.16 |
| Combination II | Yes | No | Yes | 94.09 |
| Combination III | No | Yes | Yes | 88.42 |
| Combination IV | Yes | Yes | Yes | 98.30 |
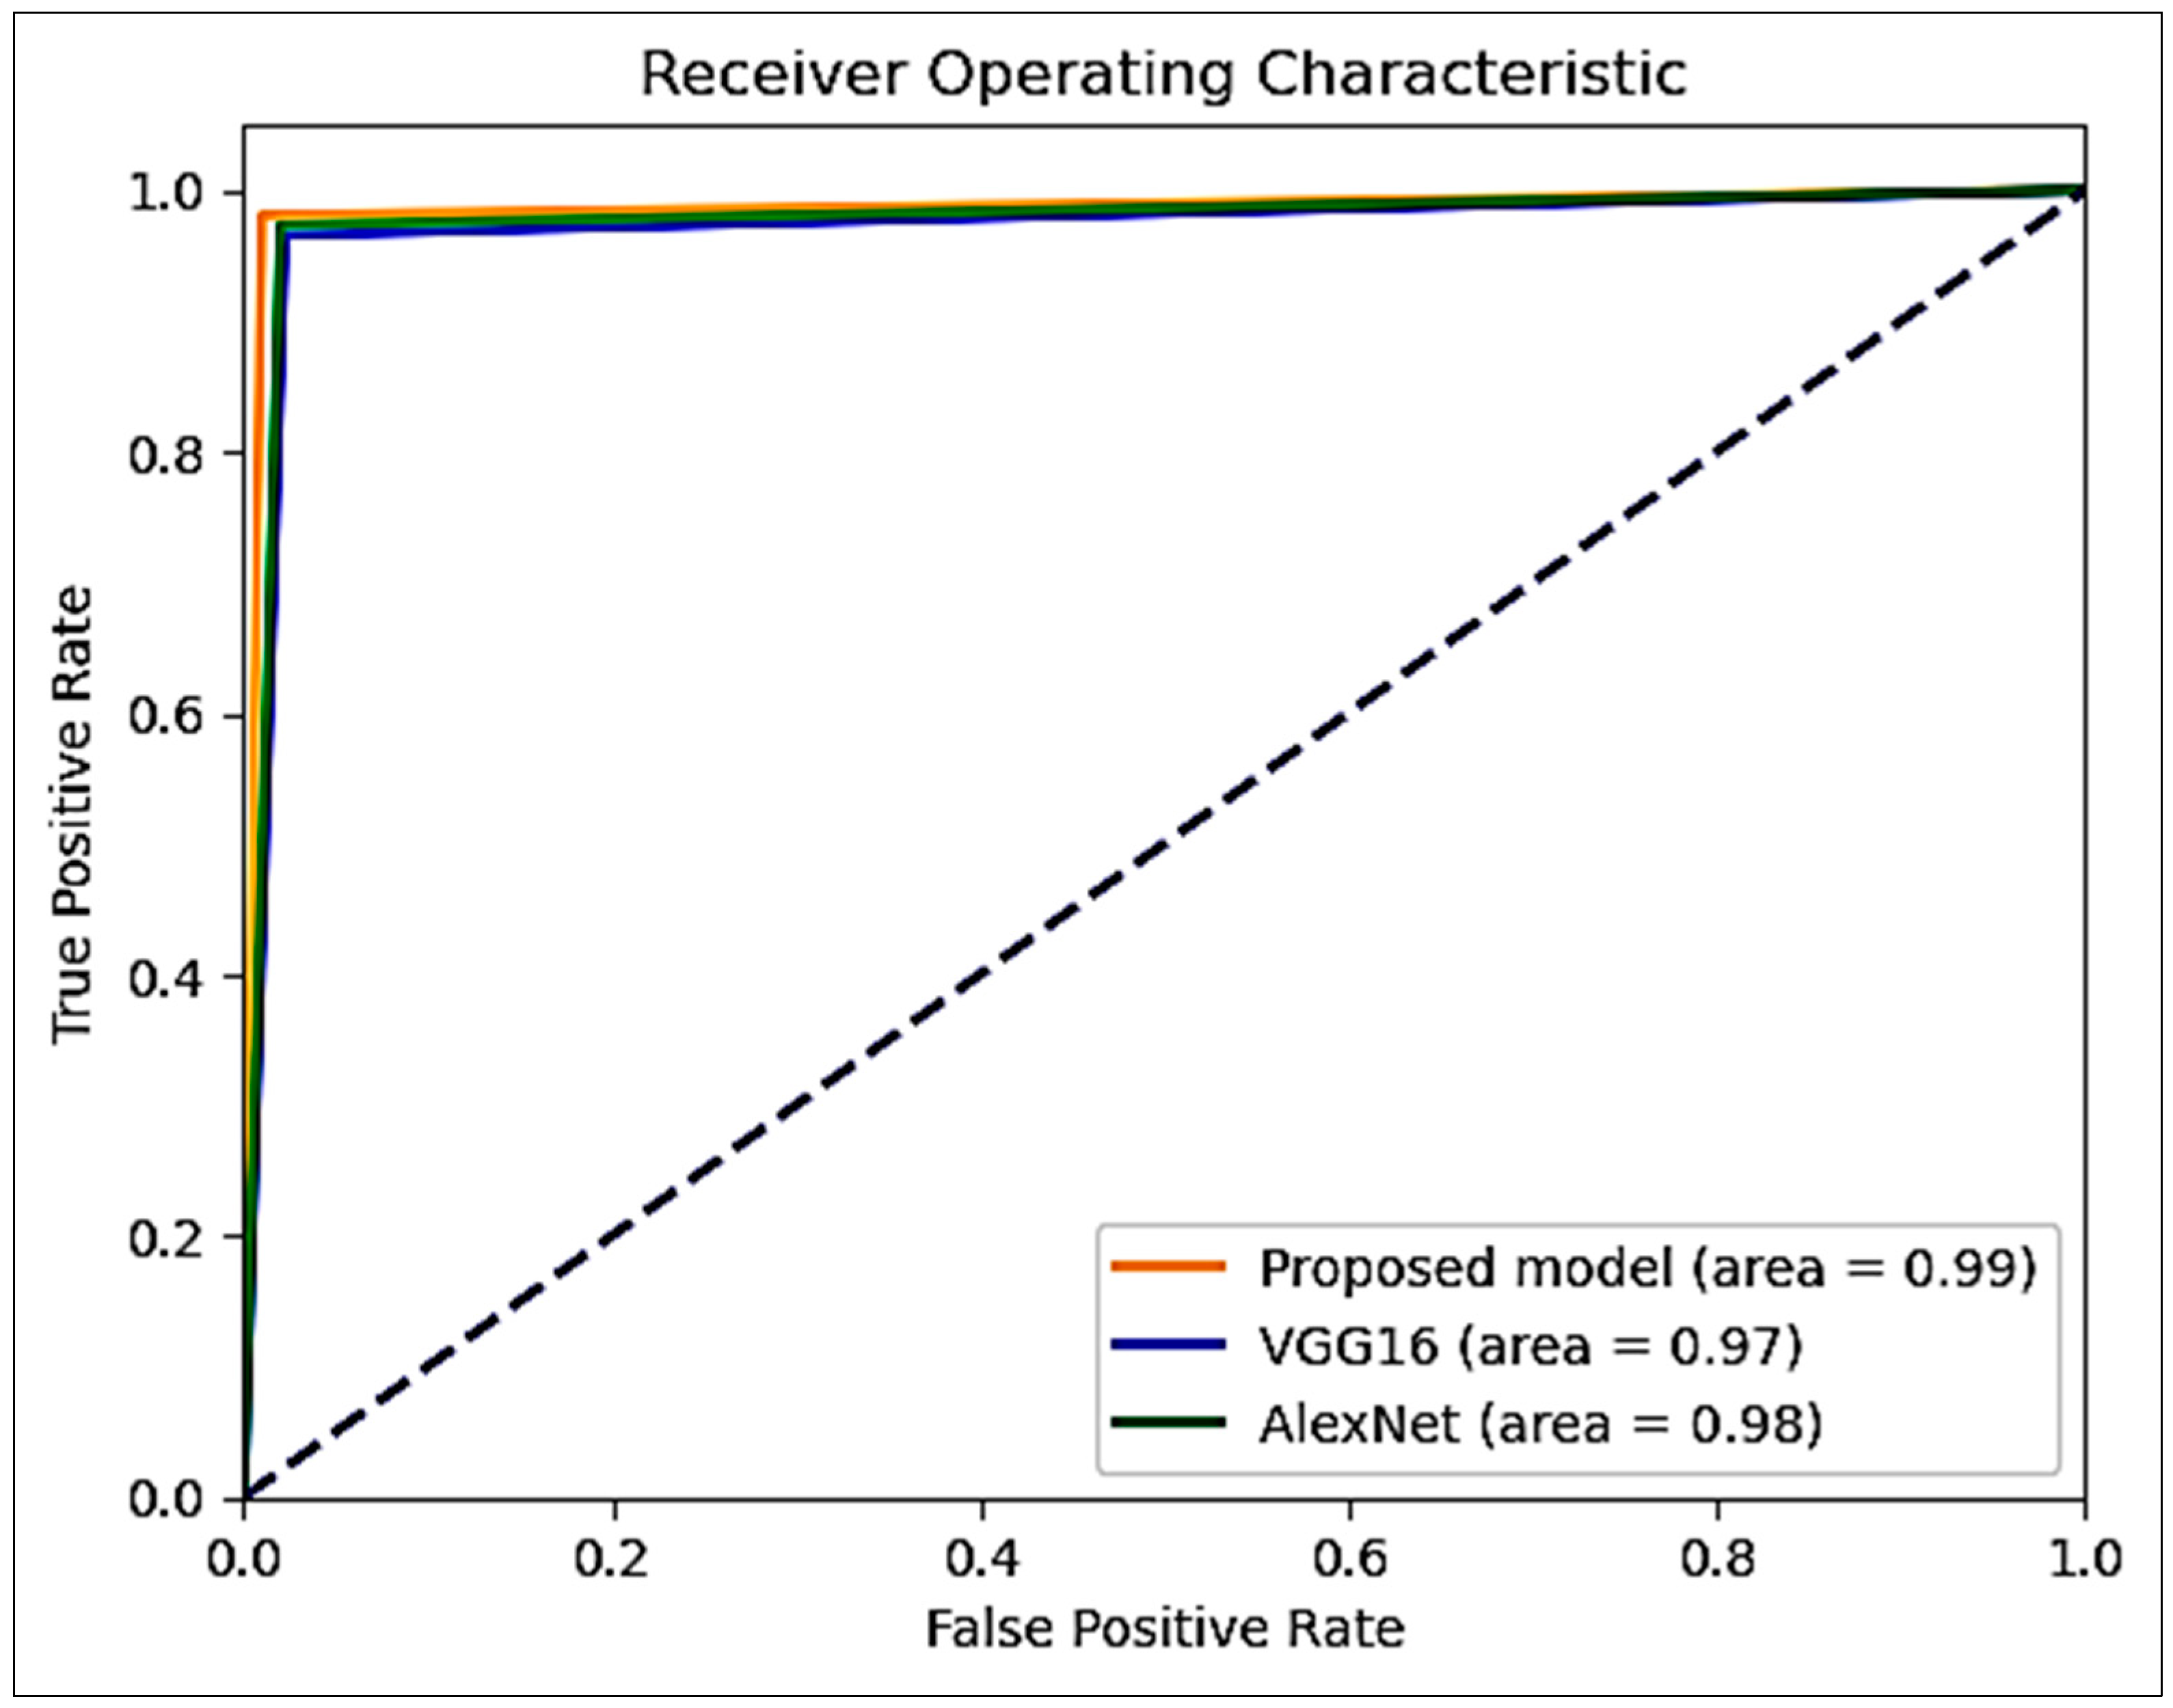
| Model | Accuracy (%) | Precision | Recall | F1-Score |
|---|---|---|---|---|
| Proposed | 98.3 | 98.5 | 98.2 | 98.3 |
| AlexNet | 95.0 | 95.4 | 95.8 | 95.6 |
| VGG16 | 96.0 | 96.1 | 95.7 | 95.9 |
| Ref. | Model Name | Populations year | Accuracy | Precision | Recall | F1-Score |
|---|---|---|---|---|---|---|
| [4] |
| 2022 | 96% | 97% | 96% | 96% |
| [10] |
| 2020 | 95% | 93% | 90% | 91% |
| [12] |
| 2022 | 95.6 | 96.6% | 97.1% | 96.8% |
| [13] |
| 2022 | 96% | Not mention | ||
| 98.3% | 98.5 | 98.2 | 98.3 | ||
Disclaimer/Publisher’s Note: The statements, opinions and data contained in all publications are solely those of the individual author(s) and contributor(s) and not of MDPI and/or the editor(s). MDPI and/or the editor(s) disclaim responsibility for any injury to people or property resulting from any ideas, methods, instructions or products referred to in the content. |
© 2023 by the authors. Licensee MDPI, Basel, Switzerland. This article is an open access article distributed under the terms and conditions of the Creative Commons Attribution (CC BY) license (https://creativecommons.org/licenses/by/4.0/).
Share and Cite
Alsaeedi, A.H.; Al-juboori, A.M.; Al-Mahmood, H.H.R.; Hadi, S.M.; Mohammed, H.J.; Aziz, M.R.; Aljibawi, M.; Nuiaa, R.R. Dynamic Clustering Strategies Boosting Deep Learning in Olive Leaf Disease Diagnosis. Sustainability 2023, 15, 13723. https://doi.org/10.3390/su151813723
Alsaeedi AH, Al-juboori AM, Al-Mahmood HHR, Hadi SM, Mohammed HJ, Aziz MR, Aljibawi M, Nuiaa RR. Dynamic Clustering Strategies Boosting Deep Learning in Olive Leaf Disease Diagnosis. Sustainability. 2023; 15(18):13723. https://doi.org/10.3390/su151813723
Chicago/Turabian StyleAlsaeedi, Ali Hakem, Ali Mohsin Al-juboori, Haider Hameed R. Al-Mahmood, Suha Mohammed Hadi, Husam Jasim Mohammed, Mohammad R. Aziz, Mayas Aljibawi, and Riyadh Rahef Nuiaa. 2023. "Dynamic Clustering Strategies Boosting Deep Learning in Olive Leaf Disease Diagnosis" Sustainability 15, no. 18: 13723. https://doi.org/10.3390/su151813723
APA StyleAlsaeedi, A. H., Al-juboori, A. M., Al-Mahmood, H. H. R., Hadi, S. M., Mohammed, H. J., Aziz, M. R., Aljibawi, M., & Nuiaa, R. R. (2023). Dynamic Clustering Strategies Boosting Deep Learning in Olive Leaf Disease Diagnosis. Sustainability, 15(18), 13723. https://doi.org/10.3390/su151813723