Article

Examining Adaptation and Resilience Frameworks: Data Quality’s Role in Supporting Climate Efforts

1
Centre for Environment and Sustainability, Faculty of Engineering and Physical Sciences, University of Surrey, Guildford GU2 7XH, UK
2
Climate and Earth Observation Group, National Physical Laboratory, Teddington TW11 0LW, UK
*
Author to whom correspondence should be addressed.
Sustainability 2023, 15(18), 13641; https://doi.org/10.3390/su151813641
Submission received: 24 July 2023 / Revised: 29 August 2023 / Accepted: 8 September 2023 / Published: 12 September 2023
(This article belongs to the Section Air, Climate Change and Sustainability)

Abstract

:
The current landscape of climate change adaptation and resilience policies, frameworks, and indicators is rapidly changing as nations, organizations, and individuals acknowledge the urgent need to address its impacts. Various methods for adaptation and resilience are developed and monitored through formal indicators. However, there are gaps in indicator development and monitoring, including the need for more indicators to address monitoring gaps, lacks in the availability of fit-for-purpose (quality and quantity) data sets, and interpretation challenges. Especially at the local level, these gaps are pronounced. In this study, we assessed current policies, frameworks, and indicators, and conducted semi-structured interviews with stakeholders. A key concern raised was the difficulty in handling insufficient, quality data, particularly in developing nations, hindering adaptation implementation. Respondents also noted the lack of a standardised approach/tool for planning, monitoring, and evaluation. To address this, stakeholders advocated for local indicators and a unified approach/tool. Comparable and consistent data, collected by qualified personnel, were emphasised. Effective adaptation plans are vital in responding to climate change, yet challenges persist in planning, implementation, and monitoring, reporting, and verification phases. A recommended solution involves a common measurement approach for adaptation and resilience, alongside tailored local strategies to ensure success of these plans.

1. Introduction

The adverse impacts of climate change are already being seen and acknowledged globally and are well-documented in attributing severe climate events to their consequences [1,2,3]. These impacts are projected to intensify over the coming years. While the concepts of ‘adaptation’ and ‘resilience’ are related in the context of climate change, they hold distinct meanings and implications. According to the Intergovernmental Panel on Climate Change (IPCC) AR6 WGII [4] adaptation is defined as “in human systems, the process of adjustment to actual or expected climate and its effects, in order to moderate harm or exploit beneficial opportunities. In natural systems, the process of adjustment to actual climate and its effects; human intervention may facilitate adjustment to expected climate and its effects” whereas resilience is “the capacity of social, economic and environmental systems to cope with a hazardous event or trend or disturbance, responding or reorganising in ways that maintain their essential function, identity, and structure while also maintaining the capacity for adaptation, learning and transformation”. In addition, resilience is commonly used under a “wide spectrum of meaning which overlaps with concepts of vulnerability, adaptive capacity and, thus, risk, and resilience as a strategy overlap with risk management, adaptation, and transformation. Implemented adaptation is often organised around resilience as bouncing back and returning to a previous state after a disturbance” [4] (p. 55, Box TS.1).
These two concepts are often presented as strategies, approaches, and indicators. Adaptation strategies are the specific measures/actions taken to mitigate the adverse effects of climate change and are typically tailored to the specific impacts and vulnerabilities of a particular region or community, while resilience strategies are specific measures taken to improve the ability of systems to withstand and rebound from the impacts of climate change [5]. For example, an adaptation strategy specific to a community might involve building seawalls and implementing land-use regulations to protect against coastal flooding and erosion caused by rising sea levels. This targeted approach addresses the community’s vulnerability to the impacts of climate change. On the other hand, a resilience strategy for the same community would focus on improving overall preparedness and adaptive capacity. This could include building robust and adaptable infrastructure that can withstand the brunt of extreme weather events, such as hurricanes or storm surges. Additionally, implementing early warning systems and evacuation plans can enhance the community’s capacity to rebound and recover swiftly from the aftermath of such events. By combining these strategies, the community not only minimises the immediate risks posed by sea-level rise and extreme weather but also enhances its long-term ability to cope with and adapt to future challenges brought on by climate change. The adaptation measures provide targeted protection against known vulnerabilities, while resilience measures build a broader foundation of preparedness, ultimately creating a more climate-resilient community.
Adaptation and resilience approaches refer to the broader frameworks, policies, and principles, that guide the development and implementation of strategies [6]. They are more conceptual in nature and provide a basis for understanding the different factors that need to be considered in adapting to climate change. Some common approaches include ecosystem-based approaches, nature-based solutions (NbS), community-based approaches, and bringing adaptation into the mainstream in development planning and green infrastructure [7].
Adaptation and resilience indicators are measures used to assess the effectiveness of adaptation strategies or the overall progress of adaptation and resilience efforts. Adaptation indicators are often used to track changes in vulnerability, exposure, and resilience to climate change impacts, as well as to monitor the implementation and impact of specific adaptation measures [8,9]. Examples of adaptation indicators include, but are not limited, to measures of water scarcity, changes in crop yields, or the frequency of extreme weather events. By tracking these indicators over time, policymakers and practitioners can better understand how effective their adaptation strategies are and make adjustments as needed to ensure that they are meeting their goals.
Resilience indicators are measures used to assess an individual, community, or system’s ability to cope with and adapt to stress, change, and adversity. Some examples are the measure of the diversity of livelihoods and employment, reliable communication and mobility, availability of financial resources, integrated development planning, access to school markets, health facilities, expenditure, etc. [10].
The current landscape of global policies, frameworks, and indicators for adaptation and resilience to climate change is rapidly evolving as the severity of the climate crisis becomes increasingly clear and accepted [11]. Arguably the most widely known and used frameworks are those provided by the IPCC, the United Nations Framework Convention on Climate Change (UNFCCC), National Adaptation Plans (NAPs), and the Sustainable Development Goals (SDGs). The IPCC was established in 1988 to offer policymakers regular scientific assessments on the current state of knowledge about climate change [12]. The latest IPCC report [4] covers the impacts of climate change assessing the vulnerability, capacities, and limits of ecosystems and biodiversity and the adaptation of human communities at global and regional levels, and adaptation is divided into five stages: awareness, assessment, planning, implementation, and monitoring and evaluation. In the same report, resilience refers to anticipating, preparing for, and responding to climate-related hazards. The report also suggested policies, frameworks, and indicators related to capturing adaptation and resilience to climate change at more local levels.
The NAPs framework of the UNFCCC places emphasis on the need for developing country governments to create comprehensive and integrated adaptation plans that are aligned with their development priorities [13]. More than 70 countries have adopted such policies [14], but there is limited information on the level of implementation and monitoring and evaluation of these plans. Likewise, over 60% of these countries do not conduct a regular and organized assessment of adaptation implementation and there is a lack of critical assessment of the effectiveness of NAPs [15]. The NAPs framework emphasises the importance of stakeholder engagement, including consultation with vulnerable groups and civil society organizations, in the development and implementation of NAPs. Parties of UNFCCC established the Cancun Adaptation Framework (CAF) in December 2010, [16] which aimed to enhance adaptation action by assessing impacts, reducing vulnerability and risks, building resilience in developing countries that are especially vulnerable, and enabling collaboration and partnership. The SDGs have underpinned several adaptation and resilience frameworks. For example, the Agroforestry Network report [17], builds on an extensive literature review of 1000 publications and reports on practical agroforestry projects, showing that agroforestry is a key tool for both climate mitigation and adaptation, for regulating soil and water quality, fighting poverty and hunger, enriching biodiversity, and it can strengthen women’s control over resources and free up women’s time. The latest IPCC report [4] has assessed the outcomes of current adaptation responses in reducing climate and associated risks concerning SDGs which was based on the Global Adaptation Mapping Initiative (GAMI) database developed by Berrang-Ford et al. [18,19].
In all of the above initiatives, and indeed many others designed to support adaptation and resilience, indicator frameworks are critical for monitoring and evaluating climate adaptation and resilience efforts [20]. For example, the UNFCCC’s report highlighted the need for indicators in the NAPs process to be relevant, measurable, and easy to understand, and suggests that they should be used to track progress, identify gaps, and inform decision-making. The UNFCC’s report also provides examples of indicators that can be used to monitor climate adaptation efforts, including those related to vulnerability, exposure, resilience, and adaptive capacity. Other guidelines offer sets of indicators and tools developed to measure progress in adaptation and resilience such as the Notre Dame Global Adaptation Index (ND-GAIN), World Bank’s latest report “Adaptation Principles: A guide for designing strategies for climate change adaptation and resilience” [21], Singh et al.’s study [22], European Climate Adaptation Platform Climate (ADAPT) [23] and Climate Change Vulnerability Index [24].
However, there is currently no widely accepted set of indicators to measure adaptation and resilience to climate change, and different stakeholders often use different metrics, making it challenging to compare results across different contexts [25]. The choice of indicators for measuring adaptation and resilience to climate change can have a significant impact as some indicators may be more relevant or appropriate than others for certain contexts, and the use of inappropriate or irrelevant indicators can lead to inappropriate measurements [2]. The quality of the data used to populate these indicators is also crucial, and data should be obtained from credible sources, using reliable and transparent methods. The data should be comprehensive and cover all relevant dimensions of adaptation and resilience, this means that the data should address social, economic, and environmental factors. This could include data on the vulnerability of communities to climate change, the availability and accessibility of natural resources, the impacts on biodiversity and ecosystems, and the effectiveness of adaptation and resilience strategies. To ensure that data are comprehensive, it is crucial to use a variety of sources, including scientific research, community-based knowledge, and other relevant data sets [26]. However, the availability of high-quality data are often limited, particularly in developing countries where resources and technical capacities may be scarce. Nonetheless, it is essential to invest in data collection and management systems and to build the technical capacities of local actors to collect, manage and analyse data on adaptation and resilience [27].
While the issues noted above have been well-reported, there have been few published studies that reflect on them from the perspective of those who are meant to make use of the indicator frameworks. This is the knowledge gap addressed by the research reported here. This study aims to investigate the application of climate change adaptation and resilience policies, frameworks, and indicators, thus this study was based on a set of semi-structured interviews with civil servants and stakeholders involved in policy development and implementation within relevant organizations at both the policy and technical levels.

2. Materials and Methods

Qualitative data were collected via semi-structured interviews between April and August 2022 with 13 key civil servants and stakeholders engaged in the planning and implementation of climate change adaptation and resilience. The interviews aimed to understand their use of adaptation and resilience policies/practices and indicators and the role of data availability and quality in supporting climate adaptation and resilience efforts. An email invitation was sent with a brief explanation of the request and a detailed description of this study (Table S1) to experts carefully chosen based on their experience in this field, and a sample of 13 respondents was selected for interview. Each interview lasted for between 20 and 45 min. Twelve were carried out through online conversations with permitted recording, and one was undertaken in writing as the expert preferred that format.
The primary rationale for the selection of respondents was expertise and experience in the field of adaptation and resilience, and, in particular, the use of indicators in this field. There was also a desire on the part of the researchers to include respondents from a diverse range of geographical and sectoral contexts to understand potential common issues and challenges. The interviewees represented the following range of sectors academia (3), research centres (4), and governmental or intergovernmental organisations (6) (Table 1). The respondents were based in different countries across the world and their research activities covered places from a local scale such as London, through regional and continental scales, including Europe, South America, and Asia, to a global level (Table 1).
The interviews were based on a set of open-ended questions which acted as prompts for discussion. In the opening section of the interview, a brief introduction was provided regarding the study’s objectives before moving on to the questions themselves.
The set of 13 questions was structured in four sections (Table S2). Section 1 comprised seven questions about the adaptation and resilience indicators in their current projects. Section 2 covered one comprehensive question regarding data for measuring the adaptation and resilience indicators and depending on the interviewees’ answers a follow-up set of additional questions was asked. The four questions in Section 3 sought to explore data type and the importance of quality data for measuring adaptation and resilience strategies. Finally, in Section 4, the respondents were given the opportunity to raise any further points or observations.
The transcribed interviews were subjected to manual content analysis [28]. A series of open and axial coding techniques were used to identify themes, sub-themes, and ‘key concerns or recommendations’ (KC/R) (i.e., more specific points of interest). The first step was ‘open coding’, in which tentative labels were assigned to the interview transcription data. Secondly, in the axial coding, codes were selected to focus on the analysis of the core categories to identify relationships among the open codes. Thus, categories/themes were identified in the data using the underlying objectives and structure of the questions posed, together with insights emerging from the respondents. Finally, a set of KCs were identified across the interviews.
During the interviews, the respondents’ answers often reflected experiences within their current and past projects, thus Table 2 summarises the projects and reports of 13 respondents who have had a major implication. These are diverse, spanning the planning of policies, development of climate services and user interaction tools, remote sensing platforms, assessments of climate change impacts, projects related to carbon reduction, emissions trend analysis, and sustainability, with a focus on adaptation, resilience, and potential risks from climate change.

3. Results

3.1. Adaptation and Resilience: Main Themes, Sub-themes, and KCs Emerging from the Interviews

Table 3 summarises the themes, sub-themes, and key concerns or recommendations (KC/R) that were identified from the analysis. Three main themes, 12 sub-themes, and 43 KCs were identified from the interviews:
  • Theme 1: Complexity and challenges in the interviewees’ current or past projects (3 sub-themes and 11 KC/Rs)
  • Theme 2: Current landscape of adaptation and resilience indicators (3 sub-themes and 10 KC/Rs)
  • Theme 3: Issues about data availability and quality for measuring indicators (6 sub-themes and 22 KC/Rs)
The number of respondents who mentioned each of the KC/Rs at least once is also shown in Table 3. Some of the KC/Rs were based on relatively few responses. Therefore, as the sample size was relatively small (13) the emphasis in the analysis presented here was upon those KC/R that were mentioned by at least half (7 or more) of the respondents. However, especially given the breadth of expertise by the respondents, it is important to note that KC/Rs mentioned by a small number of respondents are still important and relevant. To help illustrate the points being made in the KC/R, some quotations have been added below and more are provided in Tables S3, S4 and S5.

3.1.1. Theme 1: Complexity and Challenges

In terms of the complexity and challenges that occurred during adaptation projects, the participants’ answers were grouped into three sub-themes: social issues, strategy and planning, and government implications. Under ‘social issues’, KC/R 1 was mentioned by most respondents (8 out of 13 respondents) who noted that adaptation plans should target the most vulnerable people/communities and take into consideration the coping capacity of each different sector at the local scale and concerning climate risks.
“To implement adaptation plans, the local governments must look at the vulnerability of people and the coping capacity to deal with climate risks, at local scale…to look at indicators, for example, how many people were able to stay at the shelter, how many people were able to find their way to the shelter, but also how many energy systems survived, and not just survive by staying in one piece, but survive in terms of also being functional when the disaster happened.” (R 3)
In the ‘strategy and planning’ theme, KC/R 4 was mentioned by most participants (10), who noted the need to have knowledge and understanding regarding the local impact and risks of climate change before planning or implementing any adaptation solutions.
The economic capacity concern (KC/R 7; 8 respondents) comprised two aspects: the lack of funding for adaptation and resilience projects and the use of funding on unsuitable infrastructure. Seven respondents mentioned the challenges associated with implementing and monitoring adaptation strategies (KC/R 8) as they experienced difficulties with assessing the progress and effectiveness of adaptation action, especially under the dynamic nature of climate change.
In addition, just four respondents raised the lack of resilient infrastructure and the lack of vulnerability assessments and the associated indicators that could help in measuring these (KC/R 9). They referred to the insufficient or inadequate physical and social systems in place to withstand and recover from the impacts of various stressors, shocks, and disturbances. This KC/R highlights the vulnerability of communities to adverse events such as natural disasters, climate change, economic disruptions, or social crises. The lack of resilience in systems such as buildings, transportation networks, power grids, water supply systems, communication networks, and other critical lifeline infrastructure, means they are more prone to damage or failure when faced with disruptions, especially when vulnerability assessments are not undertaken. This KC/R chimes well with the literature and indeed off-repeated calls by major initiatives such as the IPCC and others for more work on indicators and frameworks for assessing adaptation and resilience.
The third sub-theme is the role of governments in implementing adaptation and resilience strategies. Government intervention is crucial for building resilience by implementing policies and regulations, providing funding and investment, promoting education and awareness, and bridging collaborations with other stakeholders. Within this sub-theme, two KC/Rs have been raised, KC/R 10 (6 respondents) notes the reluctance of certain governments to use open-access platforms for monitoring and to intentionally avoid obtaining relevant information and/or designing the right indicators, while KC/R 11 (4 respondents) touched on the need to compare different datasets before making decisions but also to understand the cost efficiency of all the data types.
“Many critical infrastructures in developing countries suffer from a lack of resilience. This is caused by a number of dynamic challenges. First of all, there is no common understanding of what resilient infrastructure is and a lack of vulnerability assessment, then the absence of funding for embracing the current technology. Also, there is a need for a common set of indicators to measure resilience and construct policies based on those. Last but not least, [there is] poor data on disaster damage and indirect losses.” (R 11)

3.1.2. Theme 2: Current Landscape of Adaptation and Resilience Indicators

Theme 2 was divided into three sub-themes: challenges with the current adaptation and resilience indicators, types of climate risks, and challenges and opportunities in developing indicators. In the first sub-theme, KC/R 12 was mentioned by most of the respondents (12), in which they discussed that there is a lack of indicators at global, national, and regional scales which can hinder the effectiveness of certain adaptation policies. At the global scale, there is a lack of standardised indicators that can comprehensively measure adaptation progress across different countries and regions. This can make it difficult to compare and evaluate the effectiveness of adaptation policies implemented by different nations. At the national or regional scales, indicators may not adequately capture the specific vulnerabilities and risks faced by different communities or sectors. For example, if an adaptation policy focuses on coastal areas, but the indicators used only measure changes in average temperature, they may fail to capture the increased frequency and intensity of storms or sea-level rise, which are critical factors affecting coastal resilience. Similarly, at the local scale, indicators may not capture the unique characteristics and needs of communities or ecosystems. They recognised that a lack of locally relevant indicators can hinder the ability to design and implement effective adaptation policies that address specific vulnerabilities and enhance resilience in a particular context.
Moreover, respondents within KC/R 13 (6 respondents) described how existing indicators recorded in the literature are not designed for local/community scales. In their discussions, they mentioned the importance of creating local indicators for adaptation and resilience that are supported by corresponding policies, and the need to create a set of indicators that can be consistently measured. For instance, a couple of respondents also highlighted specific country drawbacks, such as the removal of indicator 188 in the UK. National Indicator (NI) 188 was a process-based indicator (it measured efforts) used to document progress in local authorities’ ability to manage risks and opportunities presented by climate change impacts such as flooding, extreme weather events, temperature changes, and drought and evaluated the incorporation of appropriate actions into strategic planning to address these impacts. NI 188 was based on a grade of 0 to 4 (i.e., five levels where the higher the number, the better the performance) for the level of preparedness. Details for the indicator and the criteria used for providing the grades can be found in DEFRA’s report [10].
“UK government removed national indicator 188 […] We had that national indicator, all local authorities had to report on their adaptation activity. There was a lot of progress. There was even a really good index that was developed on adaptation capacity building, some really good work and a lot on actually monitoring and measuring adaptation indicators via the environment agencies, climate-ready programs with the different environmental climate change partnerships, regional ones, but then the government scrapped that dismantled all of that infrastructure: the legitimate adaptation action was under the sort of civil response.” (R 6)
The sub-theme on challenges and opportunities in developing A&R indicators comprised three KCs. However, two of these (KC/R 19 and KC/R 20) were highlighted by less than half of the respondents. In KC/R 19, 6 respondents stressed challenges they had encountered during the implementation of adaptation projects, and the lack of a common approach/tool or a practical guidance tool to assist them in developing, implementing, monitoring, and evaluating climate change adaptation plans. KC/R 20 (5 respondents) was focused on the lack of indicators in monitoring adaptation actions and resilience. The lack of appropriate indicators and frameworks for assessing adaptation and resilience did appear to be a minority view amongst this group of respondents. However, while there was no clear sense that there was a lack of indicators for use in adaptation and resilience, respondents did raise some recommendations on how indicators in adaptation and resilience should be designed (KC/R 21). Eight respondents emphasised the need to engage with experts in the development of new indicators. The respondents said that indicators were needed to be able to measure the effectiveness of adaptation actions such as NbS (as it can be used as a tool for adaptation) (10 respondents), and emphasised the importance of data quality, consistency, availability, and open-access data (8 respondents) in indicator descriptions.
“Key steps in developing indicators to measure the adaptation and resilience is to stay engaged with experts, measure the effectiveness of adaptation actions and NbS (after implementation), and ensure that the data are available and ideally consistent, and open-accessed.” (R 10)
“I think that we are quite a way behind in terms of even gathering information for adaptation and resilience. The priority should be to measure the same indicators so that you can measure something consistently. At the moment, we haven’t gotten into the quality of measurement, how you measure things, or whatever else I think that’s important, and hopefully, that will come. I think the priority is still to get something in terms of a consistent approach to this. So, it’s quite early in the process in that sense, which is not good.” (R 4)

3.1.3. Theme 3: Data Availability and Quality

Theme 3 covers issues around data availability and quality in the process of assessing climate risks, planning adaptation strategies, and monitoring, reporting and verification (MRV) the effectiveness of adaptation solutions. It comprises six sub-themes: data availability, data sources, data quality, data interoperability/consistency, uncertainty information, accuracy and cost efficiency.
In the data availability sub-theme, a majority of respondents (10) raised the issue of a lack of quality data especially at the local level and in developing nations (KC/R 22). Respondents noted that data coverage is often patchy, missing, or outdated, particularly at the local level, and there is a lack of understanding about which datasets can be used for assessing climate risks (before planning any adaptation solutions).
“First of all, data are patchy with local authorities, local government, whether they are measuring any adaptation specifically at all, in a way that they measure.” (R 2)
A smaller number of respondents (6) added that processing the data can also be a barrier (KC/R 23). While some good data repositories exist, accessing data, particularly older datasets, can be time-consuming, or other datasets are not publicly available.
In the data sources subtheme, respondents mentioned the need to use many different types of data sources in understanding climate risks and in computing indicators of adaptation and resilience, but the two most commonly mentioned are satellite data (e.g., Copernicus Climate Change Service; KC/R 26) mentioned by 10 respondents, and weather data and meteorological institute climate projections (KC/R 27) mentioned by 7 respondents. Respondents noted how satellite data play a useful role in planning and MRV of NbS, measuring green areas, urban heat, and forest fires, assessing the susceptibility of an area to flooding, and planning infrastructure for climate adaptation. However, respondents also noted that the process of assessing climate risks and adaptation strategies often ignores available data. For instance, urban microclimate effects can be measured with satellite data, which is important for understanding risk and resilience, but this data are not yet routinely used in risk assessment and management.
“And sometimes even in London, I think the kind of weather station that is normally used is in Heathrow. So, you don’t have an urban microclimate effect, being recorded on that. So that’s why there is an interest in the satellite data, they can get the day and night-time temperatures and that’s really important, frequently and consistently” (R 6).
The respondents described how socioeconomic data are necessary for monitoring adaptation (KC/R 29), but it is challenging to collect and integrate these data with other data sets at a local level. Crowdsourced (citizen science) data can reduce data collection costs and provide very local information (KC/R 28), but the quality of the data must be considered. Integration of traditional socioeconomic statistic data, satellite data, and data from citizen science can support adaptation measures and monitor the efficacy of actions. Regional observations are essential for region-specific policies, and primary surveys are often necessary for sub-national and lower levels.
The data quality subtheme emphasised the importance of data quality in general (KC/R 32) and specifically of quality assurance of data sets (KC/R 33). Ten respondents explicitly mentioned data quality, and six mentioned a lack of quality assurance. Others suggested that datasets need to have ‘robustness’ (KC/R 33). The data quality subtheme is linked to the uncertainty information and accuracy subthemes, as these represent different aspects of ensuring the data are ‘fit for purpose’ (also explicitly covered in KC/R 37). One respondent emphasised these links, and also made it clear that what data quality is necessary will depend on the application:
“Quality of data are of course important, but I think it’s most important when you’re looking for an indicator that’s actually used for monitoring […]. I mean either when you’re doing a comparison or when you’re looking at patterns over time. Uncertainty is also important, if it’s quantified is manageable, […] It’s very purpose dependent, […], let’s say a dataset that measures a certain indicator has a particular level of uncertainty around it, that you can use it to inform certain kinds of decisions and not to inform other kinds of decisions.” (R11)
The concept of data quality was linked to the separated subtheme of interoperability and consistency of different data sets. These concepts affect the ability to make comparisons between countries, combine different types of data sources and monitor changes over time. An example given was that water bodies that straddle Northern Ireland (UK) and the Republic of Ireland are mapped differently by the different countries and therefore do not meet. Another example is how there are three different land productivity datasets across Europe and these datasets give “completely different maps for land degradation across Europe” (R4),
Data quality and consistency are also related to data completeness. Ongoing measurements with consistent approaches (reliable methods and qualified personnel) and data quality are required to support the monitoring of change. For instance, a lack of regular assessments and data collection can hinder the ability to track progress over time.
“Comparability is an issue that can be addressed through continuity. This means that we have to regularly perform observations and data collection. In Greece, it is very often the case that, there is, an assessment done at a certain point in time, based on, a collection of data. And then this process is not, regularly repeated. So, you don’t have, an idea of how things, go, do they get worse? Do they go better? And this is a problem, so consistency in continuity, and good data collected by reliable methods and by trained people and good equipment they are very much, needed.” (R 5)
In contrast, a good example of data quality, consistency, and completeness is provided in the Netherlands, where water and flood risks are monitored with a very strong measurement network with dense measurements. This density provides robustness because outliers can be easily identified. For newer risks, such as forest fires, this level of monitoring is not yet in place. More generally to support interoperability, the respondents also highlighted the importance of complying with Open Geospatial Consortium standards and properly documenting data sets to ensure that they are easily accessible and usable by others.
The sub-theme of uncertainty information (KC/R 38, 39) and accuracy and cost-efficiency (KC/R 40–43) describe the importance of communicating the difficulties in quantifying uncertainties, and the need to balance accuracy and cost. Most participants (10) emphasised the importance of quantifying, documenting, and communicating uncertainty in both data sets and in the information and modelling. For example: “uncertainty acknowledges the inherent limitations and potential errors in the data. Understanding uncertainty helps decision-makers gauge the reliability of the information and consider alternative scenarios, enabling them to make robust choices even in the face of incomplete data.” (R1)
Uncertainty, which comes from the data, its processing and the models and predictions, is difficult to quantify and difficult to communicate. However, various respondents recognised that the level of uncertainty is closely linked to the data and methodology used, and if it can be quantified, it can be managed. However, if the uncertainty provided is too high, it can lead to a lack of trust in the results, a point captured in the following quotation: from one respondent.
“[...] because I really have the feeling that they are taking decisions, but not on the [...] best knowledge available. That’s why I think communicating uncertainty properly is even more difficult when more results are compared, and error associated with the model is linked to the data and algorithms used.” (R 4)
In talking about uncertainties of data, respondents appeared to consider not only measurement uncertainties but also aspects such as resolution, sampling and statistical techniques used. Concepts of ‘completeness’ and ‘availability’ also seemed to be linked to uncertainty as they affect the uncertainty of conclusions derived from the data. Additionally, the respondents seem to recognise the increasing availability of information about uncertainty as being important as well as the development of a mindset that acknowledges it. Some explained how the IPCC’s use of uncertainty in model predictions has helped with developing such a mindset (R 11). They recommended making robust decisions by considering the full spectrum of uncertainty in the data, as well as in the climate predictions for both mitigation and adaptation purposes. Uncertainty can even be complex to communicate amongst scientists, one respondent emphasised that uncertainty cannot be easily documented in existing data sharing XML metadata (R4).
In the accuracy and cost-efficiency subtheme, the balance between obtaining accurate (and robust and quality-assured) data versus cost was considered. Some respondents noted that there was not always a need for higher accuracy, but for the right, fit-for-purpose datasets.
“If you get more accuracy for more cost then it may not be equally cost efficient. What do you regard as a good outcome from greater investment? It could be more accurate. But alternatively, one of the things about adaptation and resilience is that they have a number of facets. And if you spend an enormous amount of resources on something that tells you in great and wonderful detail about one of those facets, (you may not have the resources to look at another)” (R 11).
When deciding on which data to prioritise, several metrics can be used, but cost-effectiveness is likely to be a high priority, especially given the limited funding available for data collection and analysis. There are links and trade-offs here with other KCs. For example, in KC/R 40 (4 respondents) there was an emphasis on the need for using multiple datasets to obtain more accurate results, thereby building trust with policymakers. On the other hand, using different datasets can also introduce variability in the process as different datasets may have different distributions, biases, or noise. Also, as noted with KC/R 41 (4 respondents) there is a potential trade-off between accuracy and cost-effectiveness in data collection and processing. While more precise data may be desirable, it can also be more costly, and sometimes a less precise but more cost-effective approach can still provide useful information.
“Using different data that can consistently measure an indicator would give higher accuracy of the results and become trustworthy for policymakers.” (R 12)
“The more data added, the broader the overview of the problem, creating increased accuracy and trust in the results.” (R 7)
As well as understanding the cost-effectiveness of the adaptation processes and becoming more resilient either from implementing adaptation solutions or monitoring approaches, most respondents (10) described the need for cost efficiency (KC/R 42) as the interest in knowing how much it would cost. Therefore, cost–benefit analysis is a key factor in deciding which adaptation strategies to pursue, including NbS.
“When we talk about adaptation processes, stakeholders usually want to know how much it will cost to implement adaptation solutions. So, this factor also goes into our thinking, and we need to prove that what we call NbS are not only effective but cost-beneficial for them in order to be included in an adaptation process.” (R 11)
However, the feasibility of implementing a particular solution, or monitoring approach, can also depend on the adaptive capacity or resilience of a region, which can be limited by various factors, including financial resources.

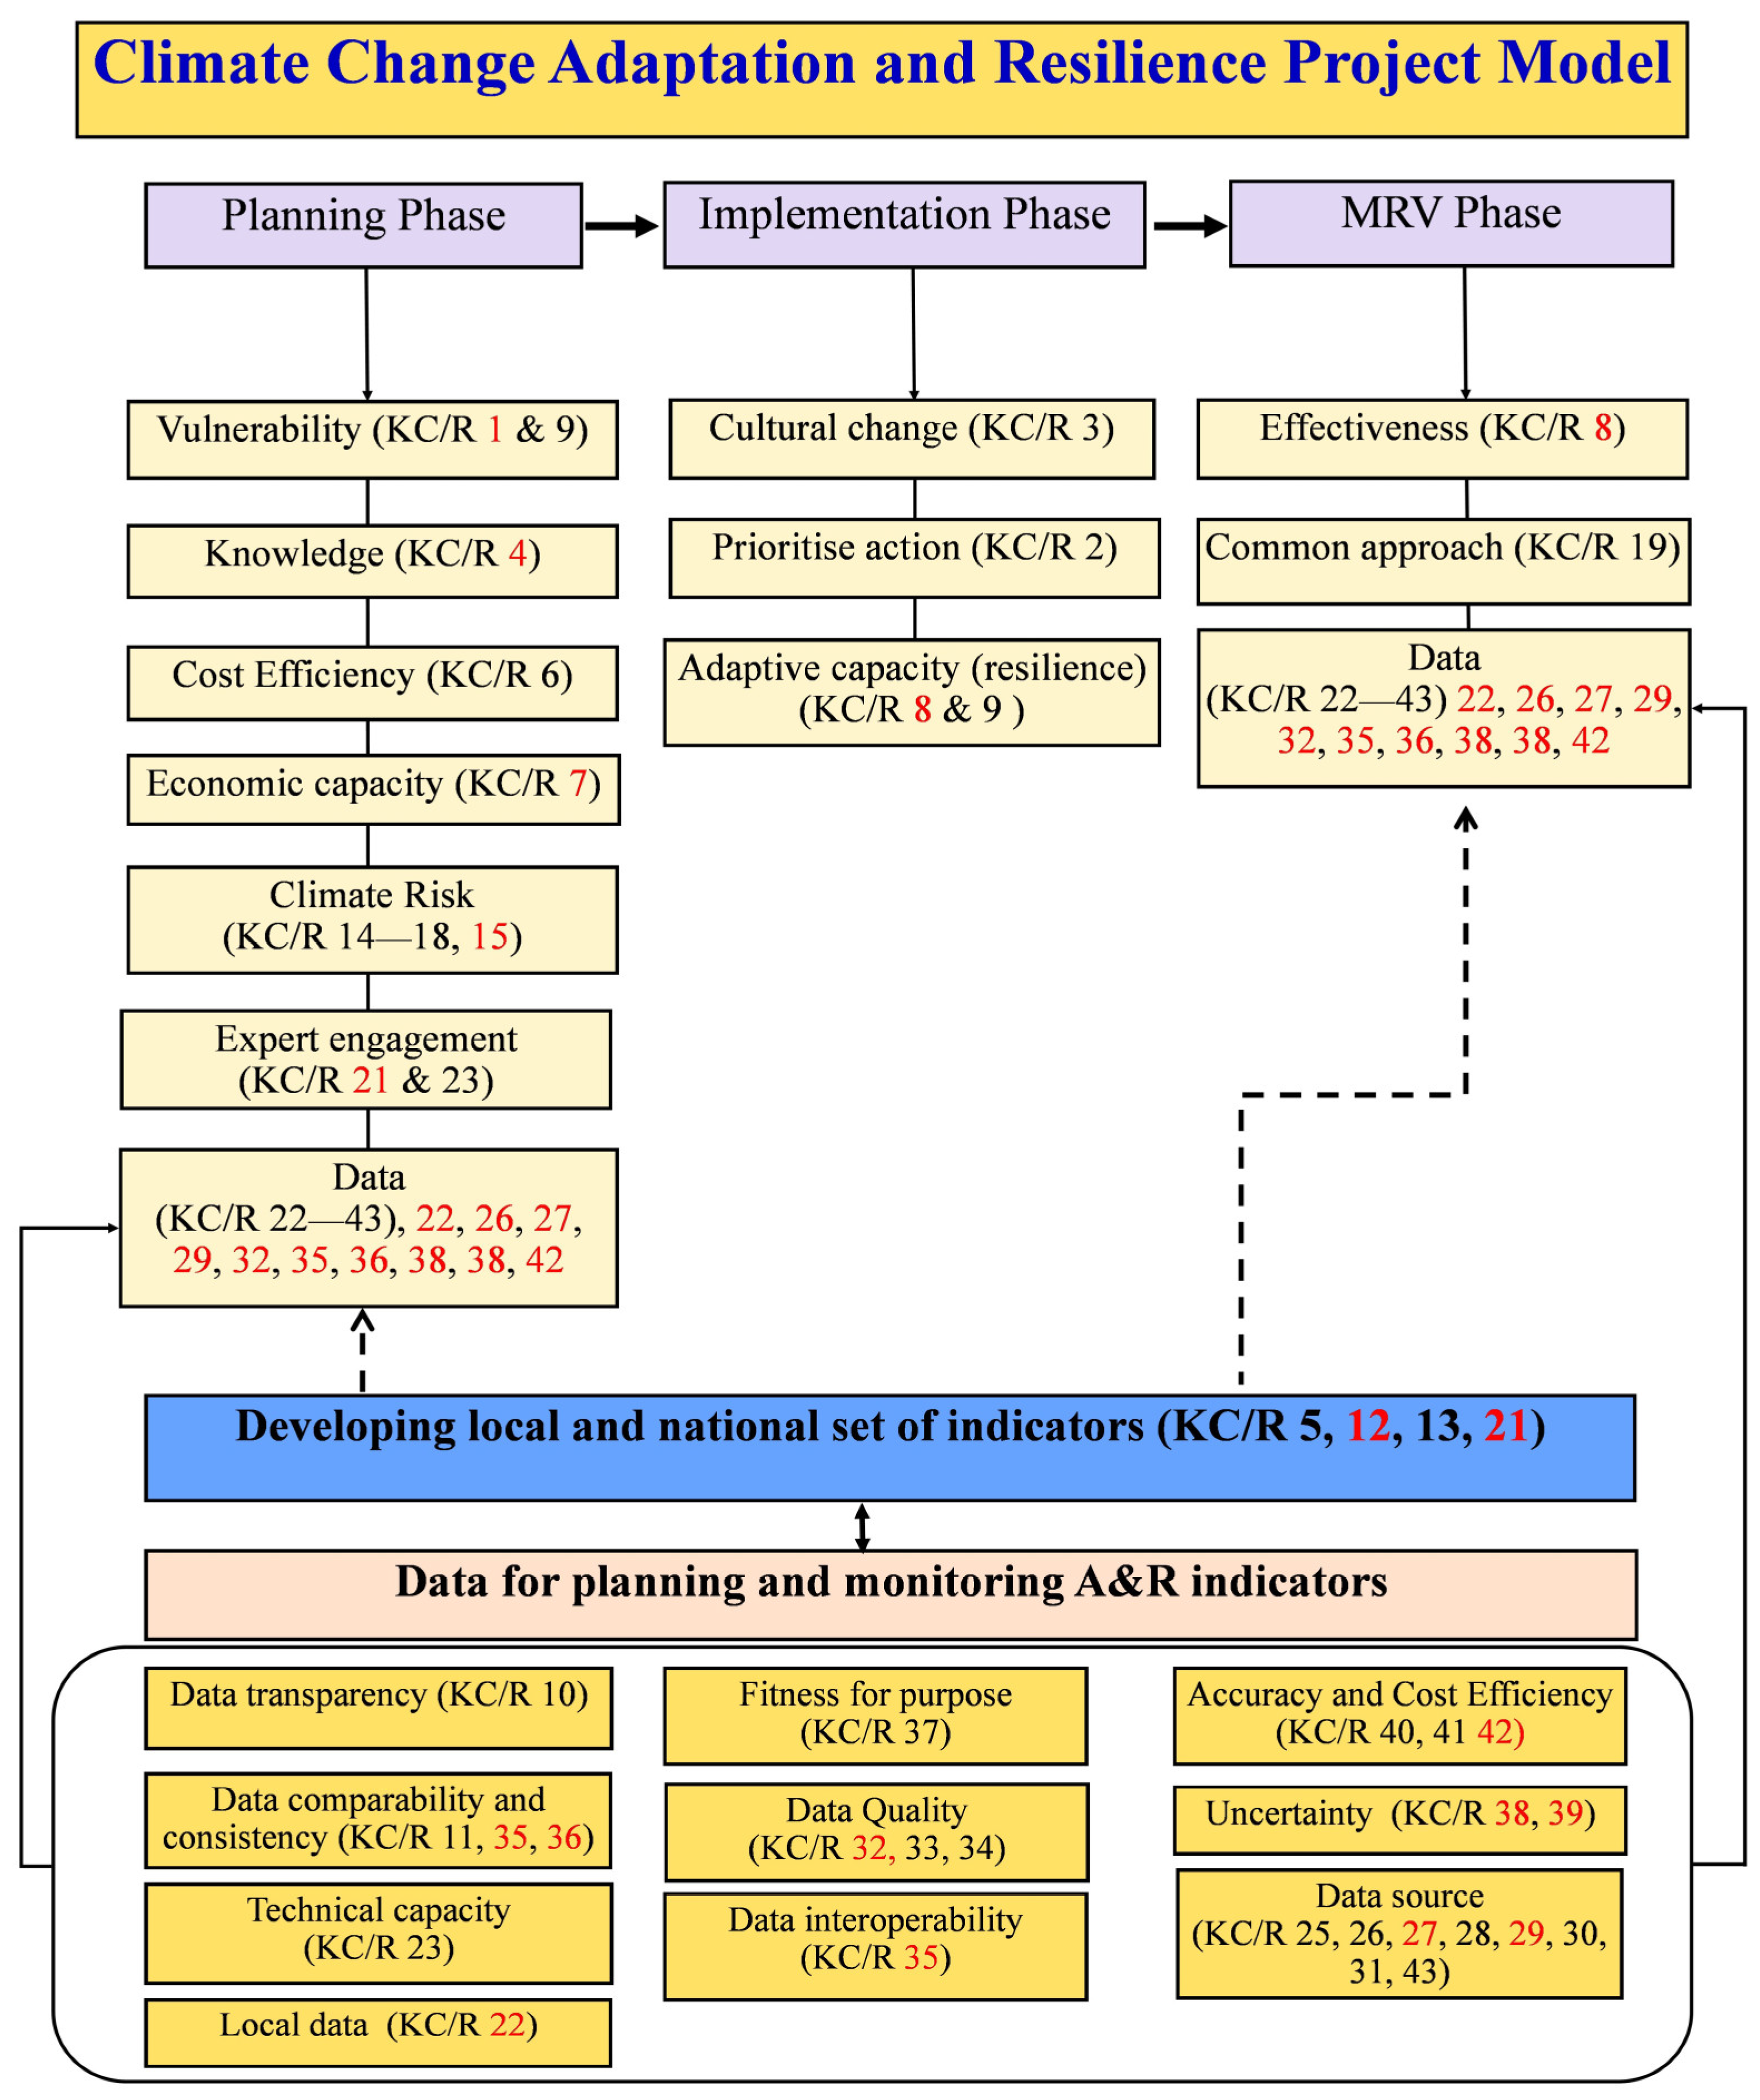
3.2. KC/Rs in the Project Model

The KC/Rs in Table 3 can also be re-grouped in terms of a standard model of project phases for interventions designed to address climate change adaptation and resilience at the local level: planning, implementation, and Monitoring, Reporting and Verification (MRV). This re-arrangement is shown in Figure 1, with the three phases at the top of the diagram and the cross-cutting concerns linked to data and indicators towards the foot of the diagram. Within each of the three phases, the relevant KC/Rs have been listed and those having more than seven respondents have been highlighted in red text.
Of the three main phases of an intervention designed to address local-scale adaptation and resilience, most of the identified KC/Rs (17) are within the planning phase. Implementation has just four KC/Rs while MRV has seven KCs. In the implementation phase, just one KC/R 8 was based on the responses of more than half of the respondents while in the MRV phase, three out of the seven KC/R were derived from the responses of more than half of the respondents.
For the cross-cutting data and indicator-based KC/R at the foot of Figure 1, the participants made a series of useful recommendations regarding indicator design (KC/R 21) which can be divided into two parts referring to adaptation plans/actions in the planning phase (noted as P) and monitoring the effectiveness of adaptation actions and measuring the adaptive capacity (noted as M). These recommendations regarding indicator design related to the two project phases are shown in Table 4. Indicators can be developed to provide a way to measure for planning adaptation solutions, then indicators can be designed for the MRV stage where they can provide a standardised way to monitor and report on adaptation and resilience efforts at the local and national levels. This helps to ensure consistency and comparability of data, which is important for tracking progress over time and across different regions.

4. Discussion

A lack of common approaches, tools, and practical guidance for designing, implementing, and monitoring indicators relating to adaptation and resilience has been highlighted as a significant challenge in the wider literature, e.g., in the recently published systematic reviews by Singh et al. [22] and Goonesekera et al. [33] who noted that climate change adaptation is rarely developed or implemented across local governance levels and sectors. The reports of the IPCC and others also make repeated calls for appropriate indicators to be developed and used to meet local needs. However, the results of interviews with key informants paint a far more nuanced picture. There was no call for new indicators from a majority of respondents but what they did often raise were issues of consistency (“there is a need for a common set of indicators to measure resilience and construct policies based on those” R 3) and a need for good quality data. The sense from the respondents was that there are clearly dangers here if multiple organisations develop indicator frameworks in relative isolation, and instead what is needed is a consistent set of indicators that all agree on. Hence, the choice and use of indicators require a more coordinated approach that considers local contexts and provides practical guidance for measuring progress toward adaptation and resilience goals. It is also worth noting here that while the existing adaptation and resilience frameworks, policies/plans, and indicators/tools are designed largely for the country level (e.g., ND-GAIN, World Bank’s latest report “Adaptation Principles: A guide for designing strategies for climate change adaptation and resilience” [21], Singh et al.’s study [22]), there are also some local adaptation strategies [34]. It has been noted in the literature [4,35] and also by the respondents of our interviews, that different regions, communities, and sectors develop their unique adaptation strategies based on their specific local climate risks. Such diversity in the local context can, of course, mean that indicators become diverse, and this would contradict, to an extent, the calls from the respondents for more consistency. There are also many barriers and triggers when it comes to implementation at local scales [36]. For instance, Aguiar et al. [36] provided an overview of local-level adaptation strategies for climate change in Europe that have been taken to address the impacts of climate change, including ecosystem-based, community-based, infrastructure-based, technological, and policy and governance strategies. The article highlights the need for better coordination and communication among stakeholders to ensure effective adaptation efforts.
Rather than have new indicators per se, a majority of respondents noted that a lack of good quality data was a significant issue, especially at the local level and in developing nations, and that there was a need for a clear protocol to follow when processing data. Moreover, collaboration within and between countries was also highlighted as important, with some respondents stressing how this can support regular assessment and data collection to track progress over time.
Despite the questioning not being particularly focused on health indicators, it is worth acknowledging that measuring health outcomes impacted by climate change, such as survival rates and the incidence of specific conditions like heat stroke, cardiac issues, respiratory problems, kidney ailments, and mental health disorders, could provide a robust framework for assessing human adaptation and resilience in the face of climate change [37]. Indeed, health-based indicators can serve a dual purpose, revealing both the vulnerabilities of communities to climate impacts as well as their capacity to withstand and mitigate these effects. High rates of heat-related illnesses or cardiovascular complications underscore the susceptibility of populations to extreme temperatures, highlighting the urgent need for adaptive strategies such as heat-resistant infrastructure, early warning systems, and public health campaigns. Conversely, lower incidence rates in the same areas could be used to signal successful resilience measures [38]. Mental health conditions, aggravated by climate-related stressors, offer insight into psychological resilience, emphasising the importance of supportive networks, community cohesion, and accessible mental health services [39]. By analysing health outcomes, societies can gauge the effectiveness of their adaptation and resilience measures, identify vulnerable groups requiring targeted interventions, and refine strategies to fortify communities against the multifaceted challenges posed by a changing climate.
The importance of using reliable methods and qualified personnel for data collection was also emphasised, as well as the need to consider fitness for purpose when selecting datasets. The use of satellite data and weather data was noted as important. For all the data types mentioned, respondents stressed the importance of quality assurance, data robustness and accuracy and having quantified measurement uncertainty information properly communicated to policymakers (points also raised in the literature [40,41]).
In this paper, the KC/Rs identified from the respondents’ interviews have been re-arranged in terms of a typical and simplified project structure spanning planning, implementation, and MRV (Figure 1) for local-level interventions designed to address climate change adaptation and resilience. The study found that the majority of the KC/Rs related to the planning phase of interventions rather than implementation or even MRV. However, using KC/Rs that emerged from qualitative data to create a typical project model or framework can bring a level of subjectivity, but can also offer several benefits such as better decision-making and more effective project outcomes, attract investments, successful project intervention and implementation, provide a common language and understanding of the topic [42]. Likewise, for the cross-cutting data and indicator-based KC/R, the study made useful recommendations for indicator design, which can be divided into two parts: planning and monitoring the effectiveness of adaptation actions and measuring adaptive capacity. Developing indicators can help to monitor and report on adaptation and resilience efforts at the local and national levels, ensuring consistency and comparability of data.
Finally, it does have to be acknowledged that the sample size behind this study is relatively small (13 respondents), although the primary focus was on selecting respondents with extensive expertise and experience in the field of adaptation and resilience and especially the practical use of indicators to help plan and implement interventions. Hence the results presented here can be considered to be indicative of the various issues, based on what these respondents considered to be of importance, and it would certainly be useful to expand the sample size in future research to cover more countries and project contexts. Indeed, given the geographical and contextual diversity of the 13 respondents, it is intriguing to see how many points of commonality emerged. One point of special relevance here relates to the practical use of indicators for adaption and resilience. To date, much of the research on indicators has focused on indicator development rather than practical issues surrounding their application and impact, and these latter points certainly require much more attention from researchers [43,44]. Indeed, and as noted by the respondents, there is a complex interplay here as indicator design, as well as data availability, can be important factors in terms of their use, and more research is needed to unravel this relationship.

5. Conclusions

In conclusion, the findings presented in this paper shed light on the multifaceted nature of climate change adaptation and resilience efforts. The interviews conducted with experts in adaptation and resilience revealed a wealth of insights that can guide effective strategies in this critical field. The three main themes—Complexity and Challenges, Current Landscape of Adaptation and Resilience Indicators, and Data Availability and Quality—underscore the intricate interplay of factors that must be considered when addressing climate-related issues. Of particular significance is the emphasis placed on the planning phase of interventions. This recognition highlights the crucial role of thorough preparation and well-designed strategies in the success of adaptation and resilience initiatives. The resonating call for consistent indicator frameworks reflects a need for unified approaches in a landscape that is marked by diverse local contexts and needs. This duality between consistency and context-specificity underscores the importance of coordinated collaboration among stakeholders to ensure that efforts are aligned and effective. Data quality and availability emerge as pivotal concerns, particularly at the local level and within developing nations. The gaps identified in data coverage and reliability highlight challenges in making informed decisions and monitoring progress. The recommendations for ensuring data robustness, accuracy, and availability are not only crucial for effective adaptation and resilience strategies but also for building trust among policymakers and stakeholders.
Moreover, the dynamic concept of uncertainty underscores the complexity of climate data and modelling. Addressing this uncertainty and communicating it effectively becomes essential in guiding informed decision-making. Balancing accuracy and cost-efficiency in data collection and processing also adds a layer of intricacy, emphasising the importance of prioritising fit-for-purpose data that support meaningful analysis.
The articulation of the findings within a project model framework further contextualises the identified key concerns and recommendations. This model encompasses planning, implementation, and MRV phases, and highlights the distribution of challenges and insights across the various stages of intervention. It serves as a valuable guidance for policymakers, researchers, and practitioners, offering a structured approach to support climate change adaptation and resilience efforts. Likewise, the need for comprehensive planning, reliable data, coordinated collaboration, and effective communication of uncertainty cannot be overstated.
This research not only deepens our understanding of the complexities surrounding adaptation and resilience but also equips us with actionable recommendations to navigate these challenges successfully. By incorporating these insights into future initiatives, we can strive for more sustainable and resilient communities in the face of an ever-evolving climate landscape. Nonetheless, there is still more research that needs to be undertaken here to follow-up and expand upon the work reported here. In the view of the authors, of especial interest here is the complex interplay between indicator design, data quality and availability and the practical use of indicators to help guide interventions.

Supplementary Materials

The following supporting information can be downloaded at: https://www.mdpi.com/article/10.3390/su151813641/s1, Table S1: Information sheet for participants and consent form; Table S2: Interview questions; Table S3: Quotes associated with the KC/Rs within Theme 1: Complexity and challenges in the interviewees’ current or past projects; Table S4: Quotes associated with the KC/Rs within theme 2: Current landscape of A&R indicators; Table S5: Quotes associated with the KC/Rs within theme 3: Data for A&R indicators.

Author Contributions

Conceptualization, A.A., S.M., R.J.M., and E.R.W.; methodology, A.A., S.M., R.J.M., and E.R.W.; software, A.A., S.M., R.J.M., and E.R.W.; validation, A.A., S.M., R.J.M., and E.R.W.; formal analysis, A.A., S.M., R.J.M., and E.R.W.; investigation, A.A., S.M., R.J.M., and E.R.W.; resources A.A., S.M., R.J.M., and E.R.W.; data curation, A.A., S.M., R.J.M., and E.R.W.; writing original draft—A.A., S.M., R.J.M., and E.R.W.; visualization, A.A., S.M., R.J.M., and E.R.W.; supervision, S.M., R.J.M., and E.R.W.; project administration S.M.; funding acquisition, E.R.W. All authors have read and agreed to the published version of the manuscript.

Funding

This project [19ENV07: MetEOC-4] has received funding from EMPIR programme co-financed by the Participating States and from the European Union’s Horizon 2020 research and innovation programme and the APC was funded through this project.

Institutional Review Board Statement

Not applicable.

Informed Consent Statement

Informed consent was obtained from all subjects involved in the study.

Data Availability Statement

Not applicable.

Acknowledgments

We would like to express our deepest gratitude to all the respondents who generously dedicated their time and shared their valuable insights during the interview process. Without their willingness to participate and their invaluable contributions, this publication would not have been possible.

Conflicts of Interest

The authors declare no conflict of interest.

References

  1. Met Office. Effects of Climate Change. Available online: https://www.metoffice.gov.uk/weather/climate-change/effects-of-climate-change (accessed on 23 January 2023).
  2. Pearce-Higgins, J.W.; Antão, L.H.; Bates, R.E.; Bowgen, K.M.; Bradshaw, C.D.; Duffield, S.J.; Ffoulkes, C.; Franco, A.M.A.; Geschke, J.; Gregory, R.D.; et al. A framework for climate change adaptation indicators for the natural environment. Ecol. Indic. 2022, 136, 108690. [Google Scholar] [CrossRef]
  3. Gabric, A.J. The Climate Change Crisis: A Review of Its Causes and Possible Responses. Atmosphere 2023, 14, 1081. [Google Scholar] [CrossRef]
  4. IPCC. Climate Change 2022: Impacts, Adaptation and Vulnerability. Contribution of Working Group II to the Sixth Assessment Report of the Intergovernmental Panel on Climate Change; Pörtner, H.-O., Roberts, D.C., Tignor, M., Poloczanska, E.S., Mintenbeck, K., Alegría, A., Craig, M., Langsdorf, S., Löschke, S., Möller, V., et al., Eds.; IPCC: New York, NY, USA, 2022; p. 3056. [Google Scholar]
  5. Pachauri, R.K.; Allen, M.R.; Barros, V.R.; Broome, J.; Cramer, W.; Christ, R.; Church, J.A.; Clarke, L.; Dahe, Q.; Dasgupta, P. Climate Change 2014: Synthesis Report. Contribution of Working Groups I, II and III to the Fifth Assessment Report of the Intergovernmental Panel on Climate Change; IPCC: New York, NY, USA, 2014. [Google Scholar]
  6. Drouet, L.; Bosetti, V.; Tavoni, M. Selection of climate policies under the uncertainties in the Fifth Assessment Report of the IPCC. Nat. Clim. Change 2015, 5, 937–940. [Google Scholar] [CrossRef]
  7. Singh, P.K.; Chudasama, H. Pathways for climate resilient development: Human well-being within a safe and just space in the 21st century. Glob. Environ. Change 2021, 68, 102277. [Google Scholar] [CrossRef]
  8. Ford, J.D.; Berrang-Ford, L.; Lesnikowski, A.; Barrera, M.; Heymann, S.J. How to track adaptation to climate change: A typology of approaches for national-level application. Ecol. Soc. 2013, 18, 14. [Google Scholar] [CrossRef]
  9. Feldmeyer, D.; Wilden, D.; Kind, C.; Kaiser, T.; Goldschmidt, R.; Diller, C.; Birkmann, J. Indicators for Monitoring Urban Climate Change Resilience and Adaptation. Sustainability 2019, 11, 2931. [Google Scholar] [CrossRef]
  10. DEFRA. Adapting to Climate Change Guidance Notes for NI188. Available online: https://assets.publishing.service.gov.uk/government/uploads/system/uploads/attachment_data/file/218800/ni188-guidance.pdf (accessed on 12 March 2023).
  11. IPCC. Summary for Policymakers. In Climate Change 2014: Impacts, Adaptation, and Vulnerability. Part A: Global and Sectoral Aspects. Contribution of Working Group II to the Fifth Assessment Report of the Intergovernmental Panel on Climate Change; Field, C.B., Barros, V.R., Dokken, D.J., Mach, K.J., Mastrandrea, M.D., Bilir, T.E., Chatterjee, M., Ebi, K.L., Estrada, Y.O., Genova, R.C., et al., Eds.; Cambridge University Press: Cambridge, UK; New York, NY, USA, 2014; pp. 1–32. [Google Scholar]
  12. IPCC. IPCC History. Available online: https://www.ipcc.ch/about/history/ (accessed on 20 December 2022).
  13. Cochran, I.; Pauthier, A. A Framework for Alignment with the Paris Agreement: Why, What and How for Financial Institutions; Institute for Climate Economics: Paris, France, 2019; p. 56. [Google Scholar]
  14. UNEP. A New Era for National Adaptation Plans? Available online: https://www.unep.org/gan/news/blogpost/new-era-national-adaptation-plans (accessed on 15 January 2023).
  15. Leiter, T. Do governments track the implementation of national climate change adaptation plans? An evidence-based global stocktake of monitoring and evaluation systems. Environ. Sci. Policy 2021, 125, 179–188. [Google Scholar] [CrossRef]
  16. Liu, J. The Cancun Agreements. Environ. Law Rev. 2011, 13, 43–49. [Google Scholar] [CrossRef]
  17. Network, A. Achieving the Global Goals through Agroforestry. Available online: https://www.siani.se/wp-content/uploads/2018/09/AchievingTheGlobalGoalsThroughAgroforestry_FINAL_WEB_144ppi-1.pdf (accessed on 21 July 2022).
  18. Berrang-Ford, L.; Lesnikowski, A.; Fischer, A.; Siders, A.R.; Mach, K.; Thomas, A.; Callaghan, M.; Haddaway, N.; Kerr, R.; Biesbroek, R.; et al. The Global Adaptation Mapping Initiative (GAMI): Part 1—Introduction and Overview of Methods. 2021, PROTOCOL (Version 1). Available online: https://protocolexchange.researchsquare.com/article/pex-1240/v1 (accessed on 23 January 2023).
  19. Berrang-Ford, L.; Siders, A.R.; Lesnikowski, A.; Fischer, A.P.; Callaghan, M.W.; Haddaway, N.R.; Mach, K.J.; Araos, M.; Shah, M.A.R.; Wannewitz, M.; et al. A systematic global stocktake of evidence on human adaptation to climate change. Nat. Clim. Change 2021, 11, 989–1000. [Google Scholar] [CrossRef]
  20. UNFCCC. Report of the Conference of the Parties on Its Twenty-First Session, Held in Paris from 30 November to 13 December 2015. Available online: https://unfccc.int/sites/default/files/resource/docs/2015/cop21/eng/10a01.pdf (accessed on 23 January 2023).
  21. Hallegatte, S.; Rentschler, J.; Rozenberg, J. Adaptation Principles: A Guide for Designing Strategies for Climate Change Adaptation and Resilience; License: CC BY 3.0 IGO; The World Bank: Washington, DC, USA, 2020; Available online: https://openknowledge.worldbank.org/handle/10986/34780 (accessed on 23 January 2023).
  22. Singh, C.; Ford, J.; Ley, D.; Bazaz, A.; Revi, A. Assessing the feasibility of adaptation options: Methodological advancements and directions for climate adaptation research and practice. Clim. Change 2020, 162, 255–277. [Google Scholar] [CrossRef]
  23. ClimateAdapt. The Adaptation Support Tool—Getting Started. Available online: https://climate-adapt.eea.europa.eu/en/knowledge/tools/adaptation-support-tool (accessed on 23 January 2023).
  24. Edmonds, H.K.; Lovell, J.E.; Lovell, C.A.K. A new composite climate change vulnerability index. Ecol. Indic. 2020, 117, 106529. [Google Scholar] [CrossRef]
  25. Bours, D.; McGinn, C.; Pringle, P. Guidance Note 1: Twelve Reasons Why Climate Change Adaptation MandE Is Challenging. Available online: https://www.ukcip.org.uk/wp-content/PDFs/MandE-Guidance-Note1.pdf (accessed on 12 January 2022).
  26. UNFCCC. Data for Adaptation at Different Spatial and Temporal Scales. Available online: https://unfccc.int/sites/default/files/resource/AC%20adaptation%20data%20full.pdf (accessed on 23 January 2023).
  27. Andries, A.; Morse, S.; Murphy, R.J.; Lynch, J.; Woolliams, E.R. Using Data from Earth Observation to Support Sustainable Development Indicators: An Analysis of the Literature and Challenges for the Future. Sustainability 2022, 14, 1191. [Google Scholar] [CrossRef]
  28. Hsieh, H.-F.; Shannon, S.E. Three approaches to qualitative content analysis. Qual. Health Res. 2005, 15, 1277–1288. [Google Scholar] [CrossRef] [PubMed]
  29. Rogelj, J.; Shindell, D.; Jiang, K.; Fifita, S.; Forster, P.; Ginzburg, V.; Handa, C.; Kheshgi, H.; Kobayashi, S.; Kriegler, E. Global Warming of 1.5 °C. An IPCC Special Report on the impacts of global warming of 1.5 °C above pre-industrial levels and related global greenhouse gas emission pathways, in the context of strengthening the global response to the threat of climate change, sustainable development, and efforts to eradicate poverty. In Sustainable Development, and Efforts to Eradicate Poverty; Cambridge University Press: Cambridge, UK, 2018. [Google Scholar]
  30. Mechler, R.; Singh, C.; Ebi, K.; Djalante, R.; Thomas, A.; James, R.; Tschakert, P.; Wewerinke-Singh, M.; Schinko, T.; Ley, D.; et al. Loss and Damage and limits to adaptation: Recent IPCC insights and implications for climate science and policy. Sustain. Sci. 2020, 15, 1245–1251. [Google Scholar] [CrossRef]
  31. UNEP&GRID-Geneva. World Environmental Situation Room (WESR). Available online: https://wesr.unep.org/ (accessed on 25 October 2022).
  32. Partnership, L.C.C. Promoting the Resilience and Sustainability of London’s Health Sector. Available online: https://climatelondon.org/projects/adapting-londons-health-sector/ (accessed on 29 October 2022).
  33. Goonesekera, S.M.; Olazabal, M. Climate adaptation indicators and metrics: State of local policy practice. Ecol. Indic. 2022, 145, 109657. [Google Scholar] [CrossRef]
  34. Jhan, H.-T.; Ballinger, R.; Jaleel, A.; Ting, K.-H. Development and application of a Socioeconomic Vulnerability Indicator Framework (SVIF) for Local Climate Change Adaptation in Taiwan. Sustainability 2020, 12, 1585. [Google Scholar] [CrossRef]
  35. Van Aalst, M.K.; Cannon, T.; Burton, I. Community level adaptation to climate change: The potential role of participatory community risk assessment. Glob. Environ. Change 2008, 18, 165–179. [Google Scholar] [CrossRef]
  36. Aguiar, F.C.; Bentz, J.; Silva, J.M.N.; Fonseca, A.L.; Swart, R.; Santos, F.D.; Penha-Lopes, G. Adaptation to climate change at local level in Europe: An overview. Environ. Sci. Policy 2018, 86, 38–63. [Google Scholar] [CrossRef]
  37. World Health Organization. Measuring the Climate Resilience of Health Systems; World Health Organization: Geneva, Switzerland, 2022; p. 44. [Google Scholar]
  38. Ebi, K.L.; Boyer, C.; Bowen, K.J.; Frumkin, H.; Hess, J. Monitoring and Evaluation Indicators for Climate Change-Related Health Impacts, Risks, Adaptation, and Resilience. Int. J. Environ. Res. Public Health 2018, 15, 1943. [Google Scholar] [CrossRef]
  39. Charlson, F.; Ali, S.; Benmarhnia, T.; Pearl, M.; Massazza, A.; Augustinavicius, J.; Scott, J.G. Climate Change and Mental Health: A Scoping Review. Int. J. Environ. Res. Public Health 2021, 18, 4486. [Google Scholar] [CrossRef]
  40. Smith, B.; Rai, N.; D’Errico, S.; Argon, I.; Brooks, N. Monitoring and Evaluation of Adaptation-an Introduction. Available online: https://www.adaptationcommunity.net/wp-content/uploads/2020/05/Adaptation-Briefings-2-Monitoring-and-Evaluation-of-Adaptation-An-Introduction.pdf (accessed on 13 March 2022).
  41. Leiter, T.; Olhoff, A.; Al Aza, R.; Barmby, V.; Bours, D.; Clemen, V.W.C.; Dale, T.W.; Davies, C.; Jacobs, H. Adaptation Metrics. Current Landscape and Evolving Practices. Available online: https://orbit.dtu.dk/en/publications/adaptation-metrics-current-landscape-and-evolving-practices (accessed on 12 March 2023).
  42. Busetto, L.; Wick, W.; Gumbinger, C. How to use and assess qualitative research methods. Neurol. Res. Pract. 2020, 2, 14. [Google Scholar] [CrossRef]
  43. Morse, S. The Rise and Rise of Indicators: Their History and Geography; Routledge: Abingdon, UK, 2019. [Google Scholar]
  44. Morse, S. To Rank or Not to Rank with Indices? That Is the Question. Sustainability 2020, 12, 5572. [Google Scholar] [CrossRef]
Figure 1. Adaptation and resilience project model (the KC/Rs written in red are those mentioned by more than half of the respondents).
Sustainability 15 13641 g001
Table 1. Interviewees’ role and research focus.
SectorInstitution NameResearch Focus
AcademiaUniversity of Bath, UKUK
Ahmedabad University, IndiaGlobal with a focus on South Asian countries
Wageningen University, NetherlandsNetherlands
Governmental or intergovernmental organisationUN Environment Programme World Conservation Monitoring Centre (UNEP-WCMC)Global
European Space Agency (ESA)UK and Europe
European Environment Agency European CommissionItaly and Europe
United Nations Economic Commission for Latin America and the Caribbean (ECLAC)Central and
South Americas
UN Environment/Science Division/GRID-Geneva, SwitzerlandGlobal
The Greater London Authority, UKLondon
Research CentreFinnish Meteorological Institute, FinlandFinland
Climate Northern IrelandNorthern Ireland
Joint Research Centre (European Commission)Europe
Institute for Environmental Research & Sustainable Development National Observatory of AthensGreece
Table 2. Respondents’ current and past projects involved.
Respondent CodeCurrent and Previous Projects and Programmes Involved with Relevancy to Adaptation and Resilience in Climate Change
R1Transformational adaptation
Adaptation and Resilience in the Context of Change (ARCC) Network Creating climate services and user interaction tools with a specific emphasis on adaptation measurements’ advancement
R2Projects on climate change impacts, risks and vulnerability, indicators, digitalisation and adaptation- European Climate Adaptation Platform Climate-ADAPT, part of Climate Change Impacts in the group of Climate Change Impacts and Adaptation at the EEA
Designing a Climate Service for Planning Climate Actions in Vulnerable Countries
R3Projects on adaptation and transformational adaptation, renewable energy, poverty rural electrification issues in South and Central America.
Supporting IPCC reports “Global Warming of 1.5 °C” (and its updates), “Climate Change 2022. Impacts, Vulnerability and Adaptation.”, “Loss and damage and limits to adaptation”
  • Global Warming of 1.5 °C. IPCC Special Report and its updates [29]
  • IPCC report Climate Change 2022. Impacts, Vulnerability, and Adaptation [4]
  • Loss and damage and limits to adaptation: recent IPCC insights and implications for climate science and policy [30]
R4Projects with a strong focus on remote sensing platforms and global databases with scope to adaptation and impact of climate change. Reviewing geospatial solutions for climate data and information. Work on the UNEP and GRID-Geneva Global Risk Data Platform, and World Environmental Situation Room [31].
R5Economic quantitative research into the future climate change impacts and adaptation options for Greek agriculture.
R6Projects in the carbon reduction agenda, primarily look at adaptation, resilience, and the potential risks from climate change -development of adaptation indicators for London. London Climate Change Partnership [32]
R7Projects on emissions trend analysis, sustainability and co-benefits analysis of various adaptation and mitigation solutions. Support to the IPCC Special Report on Global Warming of 1.5 °C. Investigations of connections between climate change adaptation options and gender equality [29].
R8Projects studying policy making processes around how different governments across the world are adapting to the impacts of climate change and understanding how data for measuring indicators are used by governments. Considering national-level progress and the options for a global stocktake on human adaptation to climate change. Challenging governance barriers and understanding adaptation decision-making.
R9Development of the first climate change adaptation plan for a UK district council and work to extend this within a UK region.
R10Research includes EO for SDGs, concerning disaster risk management and climate change adaptation. Establishment of knowledge centres and data services for disaster risk management and crisis and emergency management.
R11Projects on all sorts of aspects of the use of nature to address societal challenges, especially on climate change, mitigation, and adaptation. Development of a framework for climate change adaptation indicators. Monitoring the effectiveness of nature-based solutions and ecosystem-based adaptation. Links between biodiversity and climate change.
R12Studies focus on minimising the energy use of buildings through a process of physical design, energy modelling, and an understanding of people’s behaviour towards climate change. Balancing mitigation and adaptation requirements (e.g., on insulation).
R13Research mostly focused on cost–benefit analysis of different types of nature-based solutions and implementation of adaptation measures for hydro-meteo risks. Developing tools and methods for nature-based solution efficiency evaluation. Monitoring methods for assessing the performance of nature-based solutions.
Table 3. Interviews’ themes, sub-themes, and KC/R (rows that are shaded in grey indicate KC/Rs mentioned by more than seven respondents).
Theme 1: Complexity and Challenges in the Interviewees’ Current or Past Projects
Sub-themeKey Concerns or Recommendations (KC/R)Number of Respondents
1.1. Social issuesKC/R 1. Adaptation planning must be aimed at a group of people/sectors (e.g., vulnerable people)8
KC/R 2. Prioritise adaptation strategies 5
KC/R 3. The need for cultural change and education about the adaptation solutions3
1.2. Strategy and planningKC/R 4. The need for better knowledge about the impacts and risks of climate change 10
KC/R 5. Lack of adaptation and resilience indicators (in the planning, monitoring, and evaluating process)6
KC/R 6. Cost efficiency of adaptation solutions 4
KC/R 7. Lack of economic capacity (funding)8
KC/R 8. Challenges of implementing and measuring adaptation solutions7
KC/R 9. Lack of resilience infrastructure and vulnerability assessment4
1.3. Role of governments in implementing adaptation and resilience strategiesKC/R 10. Biasing information6
KC/R 11. The need to compare different datasets before making decisions4
Theme 2: Current Landscape of Adaptation and Resilience (A&R) Indicators
Sub-themeKey Concerns or Recommendations (KC/R)Number of Respondents
2.1. Challenges with the current A&R indicatorsKC/R 12. Lack of A&R indicators at any scale that support certain adaptation policies12
KC/R 13. The existing A&R indicators are not designed for the local needs6
2.2. Type of climate riskKC/R 14. Droughts5
KC/R 15. Urban heat/ Heatwaves7
KC/R 16. Floods/ extreme precipitation6
KC/R 17. Wildfires3
KC/R 18. Storms2
2.3. Challenges and Opportunities in developing the A&R indicatorsKC/R 19. The need to develop a common approach for planning/measuring adaptation.6
KC/R 20. Lack of indicators in monitoring adaptation actions and resilience5
KC/R 21. Designing A&R indicators should be based on the following recommendations
(a)
Expert engagement
8
(b)
Assess effectiveness of adaptation strategies and NbS
10
(c)
data quality, consistency, availability, and open-access data
8
(d)
interdependency with mitigation indicators
6
(e)
necessity of having a baseline
5
(f)
focus on the area at high risk
3
(g)
feasibility assessment
3
(h)
include social-cultural indicators
3
(i)
measured yearly
2
(j)
non-traditional data-based indicators
6
(k)
climate risk assessment
4
(l)
Human and technical capacity for data processing
3
Theme 3: Issues about Data Availability and Quality for Measuring Indicators
Sub-themeKey Concerns or Recommendations (KC/R)Number of Respondents
3.1. Data availabilityKC/R 22. Lack of data and quality data especially at the local level and in developing nations.10
KC/R 23. Technical capacity for data availability, access, processing, and modelling6
KC/R 24. Lack of citizen science data5
3.2. Data sources KC/R 25. Use of “Big Data”4
KC/R 26. Value of satellite data (e.g., Satellite data (e.g., Copernicus Climate Change Service) 10
KC/R 27. Weather data and climate projections7
KC/R 28. Use of crowdsourced data 4
KC/R 29. Socio-economic survey data (e.g., National statistical data, Eurostat, Public health data)11
KC/R 30. All different types of data5
KC/R 31. In situ measurements 4
3.3. Data quality KC/R 32. Data quality is very important10
KC/R 33. Quality assurance is missing for some datasets6
KC/R 34. Data robustness and data measurement network5
3.4. Data interoperability/consistency KC/R 35. Lack of interoperability within the same country or with other countries (from local to national) 7
KC/R 36. Importance of coverage, comparability, consistency in data collection, ground truth data, and historical data 7
KC/R 37. Fitness for purpose of data4
3.5. Uncertainty informationKC/R 38. Evaluating and communicating uncertainty is very important 10
KC/R 39. Challenges of evaluating uncertainty10
3.6. Accuracy and cost efficiencyKC/R 40. Different data—better accuracy4
KC/R 41. Trade-off between accuracy and cost4
KC/R 42. To be considered10
KC/R 43. Availability of open-access data5
Table 4. List of suggestions for designing adaptation and resilience (A&R) indicators. All of these are within KC21.
Suggestion for Designing the A&R Indicators(P) & (M) 1Number of Respondents
Experts’ engagement(P) & (M)8
Assess effectiveness of adaptation strategies and nature-based solutions (NbS)(P) & (M)10
Data availability, quality, consistency, availability, and open-access data(P) & (M)8
Interdependency with mitigation indicators(P)6
Necessity of having a baseline(P)5
Focus on the area at high risk (P)3
Feasibility assessment(P)3
Social-cultural features(P) & (M)3
Measured yearly(P) & (M)2
Non-traditional data-based indicators(P) & (M)6
Climate risk assessment(P) & (M)4
Human and technical capacity for data processing(P) & (M)3
1 Planning (P) and monitoring (M) the effectiveness of adaptation actions and the adaptive capacity.
Disclaimer/Publisher’s Note: The statements, opinions and data contained in all publications are solely those of the individual author(s) and contributor(s) and not of MDPI and/or the editor(s). MDPI and/or the editor(s) disclaim responsibility for any injury to people or property resulting from any ideas, methods, instructions or products referred to in the content.

