Article

Peer-to-Peer Power Energy Trading in Blockchain Using Efficient Machine Learning Model

by
Mahfuzur Rahman
1,*,
Solaiman Chowdhury
2,
Mohammad Shorfuzzaman
3,
Mohammad Kamal Hossain
4 and
Mohammad Hammoudeh
1
1
Department of Information and Computer Science, King Fahd University of Petroleum and Minerals (KFUPM), Dhahran 31261, Saudi Arabia
2
Department of Electrical and Computer Engineering, North South University, Dhaka 1229, Bangladesh
3
Department of Computer Science, College of Computers and Information Technology, Taif University, Taif 21944, Saudi Arabia
4
Interdisciplinary Research Center for Renewable Energy and Power Systems (IRC-REPS), King Fahd University of Petroleum and Minerals (KFUPM), Dhahran 31261, Saudi Arabia
*
Author to whom correspondence should be addressed.
Sustainability 2023, 15(18), 13640; https://doi.org/10.3390/su151813640
Submission received: 16 July 2023 / Revised: 3 September 2023 / Accepted: 6 September 2023 / Published: 12 September 2023
(This article belongs to the Special Issue Renewable Energy and Greenhouse Gas Emissions Reduction)

Abstract

:
The advancement of mircogrids and the adoption of blockchain technology in the energy-trading sector can build a robust and sustainable energy infrastructure. The decentralization and transparency of blockchain technology have several advantages for data management, security, and trust. In particular, the uses of smart contracts can provide automated transaction in energy trading. Individual entities (household, industries, institutes, etc.) have shown increasing interest in producing power from potential renewable energy sources for their own usage and also in distributing this power to the energy market if possible. The key success in energy trading significantly depends on understanding one’s own energy demand and production capability. For example, the production from a solar panel is highly correlated with the weather condition, and an efficient machine learning model can characterize the relationship to estimate the production at any time. In this article, we propose an architecture for energy trading that uses smart contracts in conjunction with an efficient machine learning algorithm to determine participants’ appropriate energy productions and streamline the auction process. We conducted an analysis on various machine learning models to identify the best suited model to be used with the smart contract in energy trading.

1. Introduction

A smart grid leverages modern technology and advanced communication systems to enable two-way communication between utilities and consumers and allows real-time data exchange by incorporating smart meters, sensors, automation, and software applications. Similarly, microgrids also revolutionize the way to locally generate, distribute, and regulate electricity in a particular area or community. Microgrids can integrate various renewable energy sources independently but can also connect to the smart grid. Renewable energy sources have very low environmental impact with a natural capacity for replenishment, and the energy is normally derived from sunlight (solar), wind, water (hydropower), geothermal heat, biomass, etc. Fossil fuels deplete over time, resulting in harmful emissions and increasing greenhouse gas emissions with a high impact of climate change. To ensure the future of sustainable energy, it is important to reduce reliance on fossil fuels by making renewable energy more accessible and cost-effective with advanced technologies. Individual entities (such as households, businesses, and institutions) in smart grids and microgrids have demonstrated an increased interest in producing and distributing electricity from possible renewable energy sources for their personal use as well as in engaging in trading if appropriate. The energy trading among the entities demands a suitable infrastructure that can allow them to perform trustworthy transactions. According to [1], the design of the energy trade market can be categorized as centralized, decentralized, and distributed markets. In a centralized market design, a central entity takes control of determining prices and the import–export of energy, whereas a decentralized market architecture eliminates the need for central organization to manage transactions and instead allows individuals (also termed “peers”) to transact energy directly. A decentralized market permits bilateral trading and enables each participant to make their own decision and control their deals. A distributed market design combines the features of centralized and decentralized approaches where multiple agents can be involved in coordinating transactions between participants, but participants can trade energy directly without the involvement of any coordinators.
For a decentralized energy market, blockchain technology has enormous potential to build a more resilient and sustainable energy-trading infrastructure. The decentralized and transparent nature of blockchain technology has various benefits for data management, security, and trust in a setting without depending on middlemen. Blockchain technology facilitates transparency and eliminates the need for intermediaries by enabling numerous parties to keep a synchronized and immutable record of transactions. Smart contracts, which are programmable scripts that automatically carry out predetermined rules when particular conditions are satisfied, are special feature of blockchain technology. Using smart contracts, auctions can easily be conducted in a secured and automated fashion where each participant can purchase and sell energy. There are various auction models, and a double auction model is more suitable with blockchain [2], as both potential buyers and sellers independently enter their bids or offers, indicating the quantity and price ranges at which they are prepared to buy or sell. In order to maximize trades and provide the most benefit, the auction platform matches offers and bids based on compatibility. A double auction allows simultaneous competition between many vendors for the same buyer(s) and the same item(s). Trades take place at a price that is agreeable to both the buyer and the seller because prices are established by the interaction of supply and demand. A prior knowledge of local energy production can help participants appropriately determine their demand, and an efficient machine learning model can serve them for such predictions. Machine learning algorithms such as artificial neural networks, support vector machines, decision trees, random forests, and regression models have successfully been used in solving various problems. Energy markets are becoming more complicated, and machine learning techniques are also being used to improve decision making, optimize trading strategies, and quickly adapt to changing market conditions. Smart contracts that incorporate machine learning models can help to perform the auction process, and energy auctions can become more effective and competitive that continuously learn from real-time data automatically and update their own bidding methods accordingly. Advanced machine learning algorithms can help analyze complex datasets and discover patterns that traditional statistical methods might overlook. Research should explore the potential of machine learning techniques in solar power prediction to improve forecasting accuracy. Solar power prediction involves inherent uncertainties due to variable weather conditions. It is necessary to focus on quantifying and incorporating uncertainty into the prediction models to provide confidence intervals or probabilistic forecasts. Integrating real-time solar power generation data into prediction models can create a feedback loop that continuously updates and improves the accuracy of forecasts, especially for short-term predictions. While short-term solar power prediction is crucial for grid stability, long-term predictions are equally essential for energy planning and policy making. Research gaps exist in developing accurate long-term solar power prediction models that consider factors like climate change and land-use variations. Access to reliable and high-quality data is critical for accurate predictions. Research should address challenges related to data availability, data gaps, and data quality to ensure robust solar power forecasting. Predicting solar power should also consider the integration of energy storage systems. It is needed to optimize solar power predictions in conjunction with energy storage capacities to ensure grid stability and efficiency.
Our study in this article incorporates a blockchain-based energy auction architecture where the smart contract will incorporate an efficient machine learning algorithm to properly characterize the participant’s energy demand participating in energy trading. We have analyzed a number of models to identify the best one to be used with the smart contract. We collected and prepared a real-life observation dataset from a solar energy generation setup. This dataset includes the information about the amount of power generated from a set of solar panel systems in a certain number of days in a year. Additionally, certain weather information (e.g., temperature, wind speed, humidity, air pressure, etc.) on those days was also analyzed. We tried to select an appropriate machine learning model that finds the relationship between the amount of solar energy generation with those weather conditions. This information related to solar energy production is utilized to estimate the appropriate energy demand of the participating entities in energy trade. The contributions in this article can be summarized as follows: (1) Exhibiting an energy-trading architecture: presents an effective architecture for energy trading that incorporates two cutting-edge technologies, namely blockchain (smart contracts) and machine learning. This architecture aims to create a decentralized and transparent platform for energy trading, addressing some of the challenges faced in traditional centralized energy markets. (2) Using smart contracts for automated transactions: highlights the benefits of smart contracts in energy trading. Smart contracts can automate the trading process based on predefined conditions, such as energy supply and demand levels, prices, and contractual agreements. This automation streamlines the auction process and reduces the need for manual intervention. (3) Evaluation of machine learning models: conducts an analysis on various machine learning models to identify the best-suited model to be used with the smart contract in energy trading. This evaluation ensures that the chosen machine learning approach provides accurate predictions and supports real-time decision making in energy trading.
We have designed the following sections in three parts: Related Works, System Architecture and Model Overview, and Model Analysis. In the Related Works section, we have mainly discussed related research studies focusing on solar power prediction. We have found a plethora of works on the prediction model, and among them, we picked the most rational and similar models related to our work to compare. Our System Architecture and Model Overview section contains the architecture of the whole system along with the description of how each of the components functions. In that section, we have also discussed the possibility of integrating the machine learning models in our blockchain-based design approach. In the last section, we have added the overview of the whole process, the impact of our results, and our future plans.

2. Related Works

The authors in [3] provided a comprehensive review of peer-to-peer energy trading using blockchain technology, game theory, and optimization algorithms. The study identifies important factors of integrating power generation, transmission, and distribution by modeling the complex behavior of consumers and prosumers. Their work describes the opportunities and challenges associated with peer-to-peer energy trading with the successful implementation of a real-world energy market approach. In a study in [4], a secure blockchain-based demurrage mechanism is introduced as a novel method of improving energy trade. The technique tries to support equitable energy distribution, discourage energy hoarding, and promote effective energy use. The suggested remedy takes advantage of blockchain technology to address the issues of trust, security, and transparency in energy trade transactions among decentralized communities. The study’s simulation findings shed light on the demurrage mechanism’s possible influence on the dynamics of energy trade. It also integrates a mathematical optimization model for energy-related applications, particularly in the context of decentralized power systems driven by renewable sources. Similarly, the authors in [5] described the uses of a blockchain framework with optimization strategies for energy trading. By addressing issues with trust, security, and efficiency, the framework creates a reliable and effective energy-trading ecosystem. The suggested system offers significant advantages for both energy producers and customers. The authors identified that existing systems lack any consideration of interactions among prosumers in pricing. To address this, a game theory-based pricing model is proposed in a localized Practical Byzantine Fault Tolerance-based Consortium Blockchain (PBFT- CB). The model incorporates interactions between sellers and buyers formulated as a bi-level Stackelberg game. A Rule-based Iterative Pricing (RIP) algorithm is introduced to determine equilibrium prices. With our case study, the framework provided increased seller profit by 12.61% and decreased buyer utility sacrifice by 4.36%. The study emphasizes the benefits of peer-to-peer electricity trading and the potential of blockchain in advancing electricity markets through efficient and fair pricing mechanisms. In [6], the authors proposed the blockchain-as-coordination-committee framework that provides trust and fairness by ensuring honest behavior among market participants. The effectiveness of the framework is demonstrated through quantitative results obtained from a multi-energy district demonstration. The study also quantifies the value of blockchain by comparing energy-trading outcomes with and without blockchain technology. Moreover, the framework’s flexibility allows the customization of blockchain modules, enabling the exploration of different delegate selection methods and consensus mechanisms, to optimize security and efficiency. The utilization of renewable energy resources, particularly wind power, has become essential in addressing environmental concerns related to fossil fuel usage, and the authors in [7] investigated the viability of producing wind energy at several wind farms in Jordan. The study evaluates the expenses related to wind turbine installation and operation by using sophisticated optimization techniques. The authors presented a comprehensive review of wind energy estimation and economic analysis for establishing wind turbine systems. The authors employed Weibull statistical distribution to assess wind energy-trading potential and proposed the whale optimization algorithm (WOA) for economic wind power production. The article in [8] explores the use of artificial intelligence, machine learning, and the Normal Probability Density Function for the wind power production estimates. The study makes a contribution to the development of precise wind forecasting, which may have ramifications for the use of renewable energy sources, environmental planning, and sustainable energy practices. The authors also compared the performance of models in estimating wind speed and the extracted energy from wind turbines. To determine the model performance, artificial intelligence techniques such as genetic algorithm (GA), bacterial foraging optimization algorithm (BFOA), simulated annealing (SA), and a neuro-fuzzy method were evaluated using the root mean square error (RMSE) and mean absolute error (MAE) as performance indicators. Their results show that the normal PDF outperformed the Weibull PDF and BFOA, while SA exhibits the highest accuracy. Additionally, machine learning techniques were also employed to classify and predict the error level between actual and estimated probabilities. Among the 24 classifier algorithms used, the medium tree classifier demonstrated the best performance in terms of accuracy and training time, while the ensemble-boosted trees classifier provided less accurate predictions. This innovative methodology aims to enhance the accuracy of parameter estimation, which is crucial for subsequent wind energy production calculations and resource assessment processes. We also have a similar goal, i.e., forecasting solar energy using a suitable machine learning model.
The study from [9] conducted a survey of around 200 publications on machine learning techniques and discussed the uses of machine learning methods and its expansion to denote technical challenges of the smart grid. Forecasting on various methods like electric loads, power and also power generation predictions are now very much important factors for the real world. According to their observation from the survey, the forecasting of electric load is a mature topic, and ML tools are playing an important role, giving accurate results with different weather data. Supervised neural networks and random forest are very popular forecasting algorithm for electric load. However, in fault detection and diagnosis results, machine learning techniques also provide accurate outputs as they are very sensitive to pattern variations in the data. The study from [10] proposed a deep learning-based system for forecasting solar power generation using an ensemble approach. Their proposed strategy combines multiple machine learning algorithms (e.g., LSTM, gated recurrent unit, Auto LSTM) with statistical methods to create a hybrid model. Their dataset was collected from two geographical regions—Shagaya, Kuwait and Cocoa, FL, USA. After examining the results, they concluded that their hybrid model performed well among all the single traditional models. Also, they claimed that all ensemble methods performed better in terms of accuracy than any single ML algorithm. Another study from [11] proposed a method for predicting the system performance accurately for the lifetime design of the hybrid geothermal solar power system in real-time operation. The authors used an artificial neural network (ANN) to predict the performance of a hybrid system on an hourly basis. After comparing the stand-alone geothermal power plants during operation, the hybrid system had the higher turbine efficiency. The study from [12] designed a machine learning model to predict daily solar radiation accurately using hybrid swarm optimization, and the five most popular machine learning models were compared with it. From their experiment, it is found that the more accurate result of the solar radiation prediction was provided by particle swarm optimization. Authors from the study [13] developed a framework to evaluate different models and feature selection methods. In their work, the random forest, artificial neural network and extreme gradient boosting have been used with feature selection techniques including feature importance and principal components analysis (PCA). Their dataset was built with 11 parameters and provided 327,000 measurements of those parameters. The authors from the study [14] came up with a proposal that designed and developed the solar parabolic through collecting the data of large-scale solar power plants. They also mentioned the heat loss under the laboratory test conditions. The study [15] reported on the electrical and thermal performance of photovoltaic (PV) panels, which was integrated with non-rectangular PCM. The authors claimed that the melting rate increased by 17% and 11.5% compared with the dropping rate of the PV cell temperature. Another study from [16] conducted an analysis on a passive inclined solar panel basin (PISPB) where they found that the efficiency of still energy decreases while freshwater was collected from the solar still at different rates. This study revealed that under higher flow conditions, the efficiency increases in terms of the electrical, thermal and exergy of the photovoltaic panel. The experimental study from [17] investigated a hybrid solar system with desalination where the solar panel is integrated with a solar still by utilizing permeable material and preheating saline water. Their study took place in Borg Al-Arab city, Alexandria, Egypt, under the meteorological conditions. The results showed that 40%, 50% and 60% preheating of the salty water improves the fresh water of the solar desalinization system by 10.4%, 15.5% and 20.9% respectively. The study from [18] experimented on the efficiency that is related to the wavelength of the solar radiation. The study evaluated the electrical performance of the solar photovoltaic module using five different color filters. To determine the relationship of the frequency, the filer color used changed from magenta to red. The result from the experiment claimed that the maximum efficiency was given by the magenta color in the visible spectrum of solar radiation. Peer-to-peer (P2P) energy trading between microgrids was studied in [19] using a variety of strategies including deep reinforcement learning (DRL) methods, bilateral contract networks for local trade, and game theory-based methods that optimize utility functions. These methods, however, frequently ignore the unpredictability of power consumption and renewable energy production. This study introduces a new method, called Multi-Agent Deep Deterministic Policy Gradient (MADDPG), which uses centralized training and decentralized execution to deal with uncertainty. With this strategy, microgrids can learn the best energy-trading rules, which promotes coordination. The authors in [20] enhanced existing research by examining the challenges and opportunities of employing blockchain technology in energy trading. Notably, the article introduces a novel second-layer solution to address the scalability–security–decentralization trilemma inherent in blockchain systems, aiming to reduce transactional costs while ensuring robustness. The research draws from the RENeW Nexus project as a case study, employing real-world energy data to model transaction numbers and associated costs for different settlement periods. Furthermore, the article extends its analysis to anticipate the integration of emerging technologies like Big Data, Data Analytics, Machine Learning, and Artificial Intelligence in future iterations of blockchain-based energy-trading models. Table 1 provides a summary of some related articles on energy trading, machine learning models, and blockchain.
The blockchain-based energy-trading platform was also presented in [21] by mentioning the challenges of peer-to-peer (P2P) energy trading within a Virtual Power Plant (VPP) framework. Through the integration of smart contracts, the platform enables efficient, transparent, and secure energy trading among participants. By utilizing technologies such as Solidity, Remix, Metamask, Infura.io, and the Ropsten test network, the system creates a functional blockchain environment for bidding and trading. Furthermore, the study evaluates the platform’s performance under varying workloads and case scenarios. The authors also suggested future directions involving deep learning and game–theoretical analysis to enhance VPP operation and profit maximization. Overall, this research offers a holistic approach to revolutionize P2P energy trading within the evolving landscape of blockchain technology and smart contracts. In the study [22], the researchers explored how blockchain technology can make energy systems more efficient and secure. They investigated using blockchain to create decentralized energy markets where people can directly trade energy with each other (P2P transactions). Different blockchain platforms were tested to see whether they are a good fit for energy trading, with a focus on handling lots of users, keeping things private, and simplifying decision making. They also worked on smart contracts that automatically carry out energy transactions to make sure everyone trusts the process. They also used Hyperledger Fabric to make energy trading more scalable, secure, and efficient for local energy networks. In [23], the authors used an Agent-Based Model (ABM) to confirm that the simulation environment of a considered trading scenario properly resembles the real world. This strategy made ABM a useful tool to see how changes in rules and policies affect the changes in an energy market’s functions. The authors also recommended that using power storage to store energy can enhance the flexibility in the power trading.
Table 1. Summary of related articles on energy trading, machine learning models, and blockchain.
Related ArticleAreaMajor Focus
Bandeiras et al. [1]Smart Cities, Smart Grids, MicrogridsIntegration of Local Energy Markets, 
Addressing Intermittency, Game Theory
Guerrero et al. [2]Energy-Trading Platforms, Grid ManagementMethodology for P2P Energy Trading, Network Constraints
Soto et al. [3]P2P Energy Trading, BlockchainComprehensive P2P Energy-Trading Review, Game theory
Samuel et al. [4]Prosumer Energy Trading, Consortium BlockchainBlockchain-Based Energy Trading, Dynamic Pricing
Chen et al. [5]Multi-Energy Trading, Decentralized FinanceBlockchain Coordination Framework, Trust Evaluation
Jiang et al. [6]Community Microgrids, P2P Energy TradingGame Theory-Based Pricing Model
Al-Quraan et al. [7]Wind Energy Assessment, Cost AnalysisWind Energy Models, Optimization Algorithm
Darwish et al. [8]Wind Energy AssessmentExploration of Probability Distribution, Model Selection
Ibrahim et al. [9]Load Forecasting, CybersecurityML Trends in Smart Grids, Technical Challenges
AlKandari et al. [10]Solar PV ForecastingNew ML Model (Auto-GRU), Ensemble Methods
Hu et al. [11]Off-Design PerformanceData-Driven Methodology, Multi-Objective Optimization
Feng et al. [12]Solar Energy GenerationHybrid ML Model, Solar Energy Planning
Munawar et al. [13]Renewable Energy IntegrationML Model Comparison, Feature Selection
Reddy et al. [14]Electricity GenerationLarge Aperture PTC System Design
Kumar et al. [15]PV Panel EfficiencyImproved PV Panel Efficiency, PCM Enclosure
Sasikumar et al. [16]Desalination, Water ManagementSolar Panel Basin Still System Analysis
Abd Elbar et al. [17]Desalination in Arid RegionsSolar Still Performance Enhancement
Ramkiran et al. [18]Solar Panel DesignExperimental Analysis, Efficiency Comparison
Xu et al. [19]P2P Energy Trading, BlockchainProblem Formulation, Algorithm Development
Marrable et al. [20]P2P Energy Trading, EV ChargingExploration of P2P Energy Trading, Blockchain Analysis
Zhou et al. [24]Residential Communities, EV ChargingInnovative Pricing Approaches, Decision Strategies
Seven et al. [21]P2P Energy Trading, BlockchainBlockchain-Based P2P Energy Trading
Wang et al. [22]P2P Energy Trading, Grid ManagementConceptual Framework, Blockchain Implementation
Monroe et al. [23]Decentralized Energy MarketsAgent-Based Modeling Framework

3. Machine Learning Approach and Blockchain

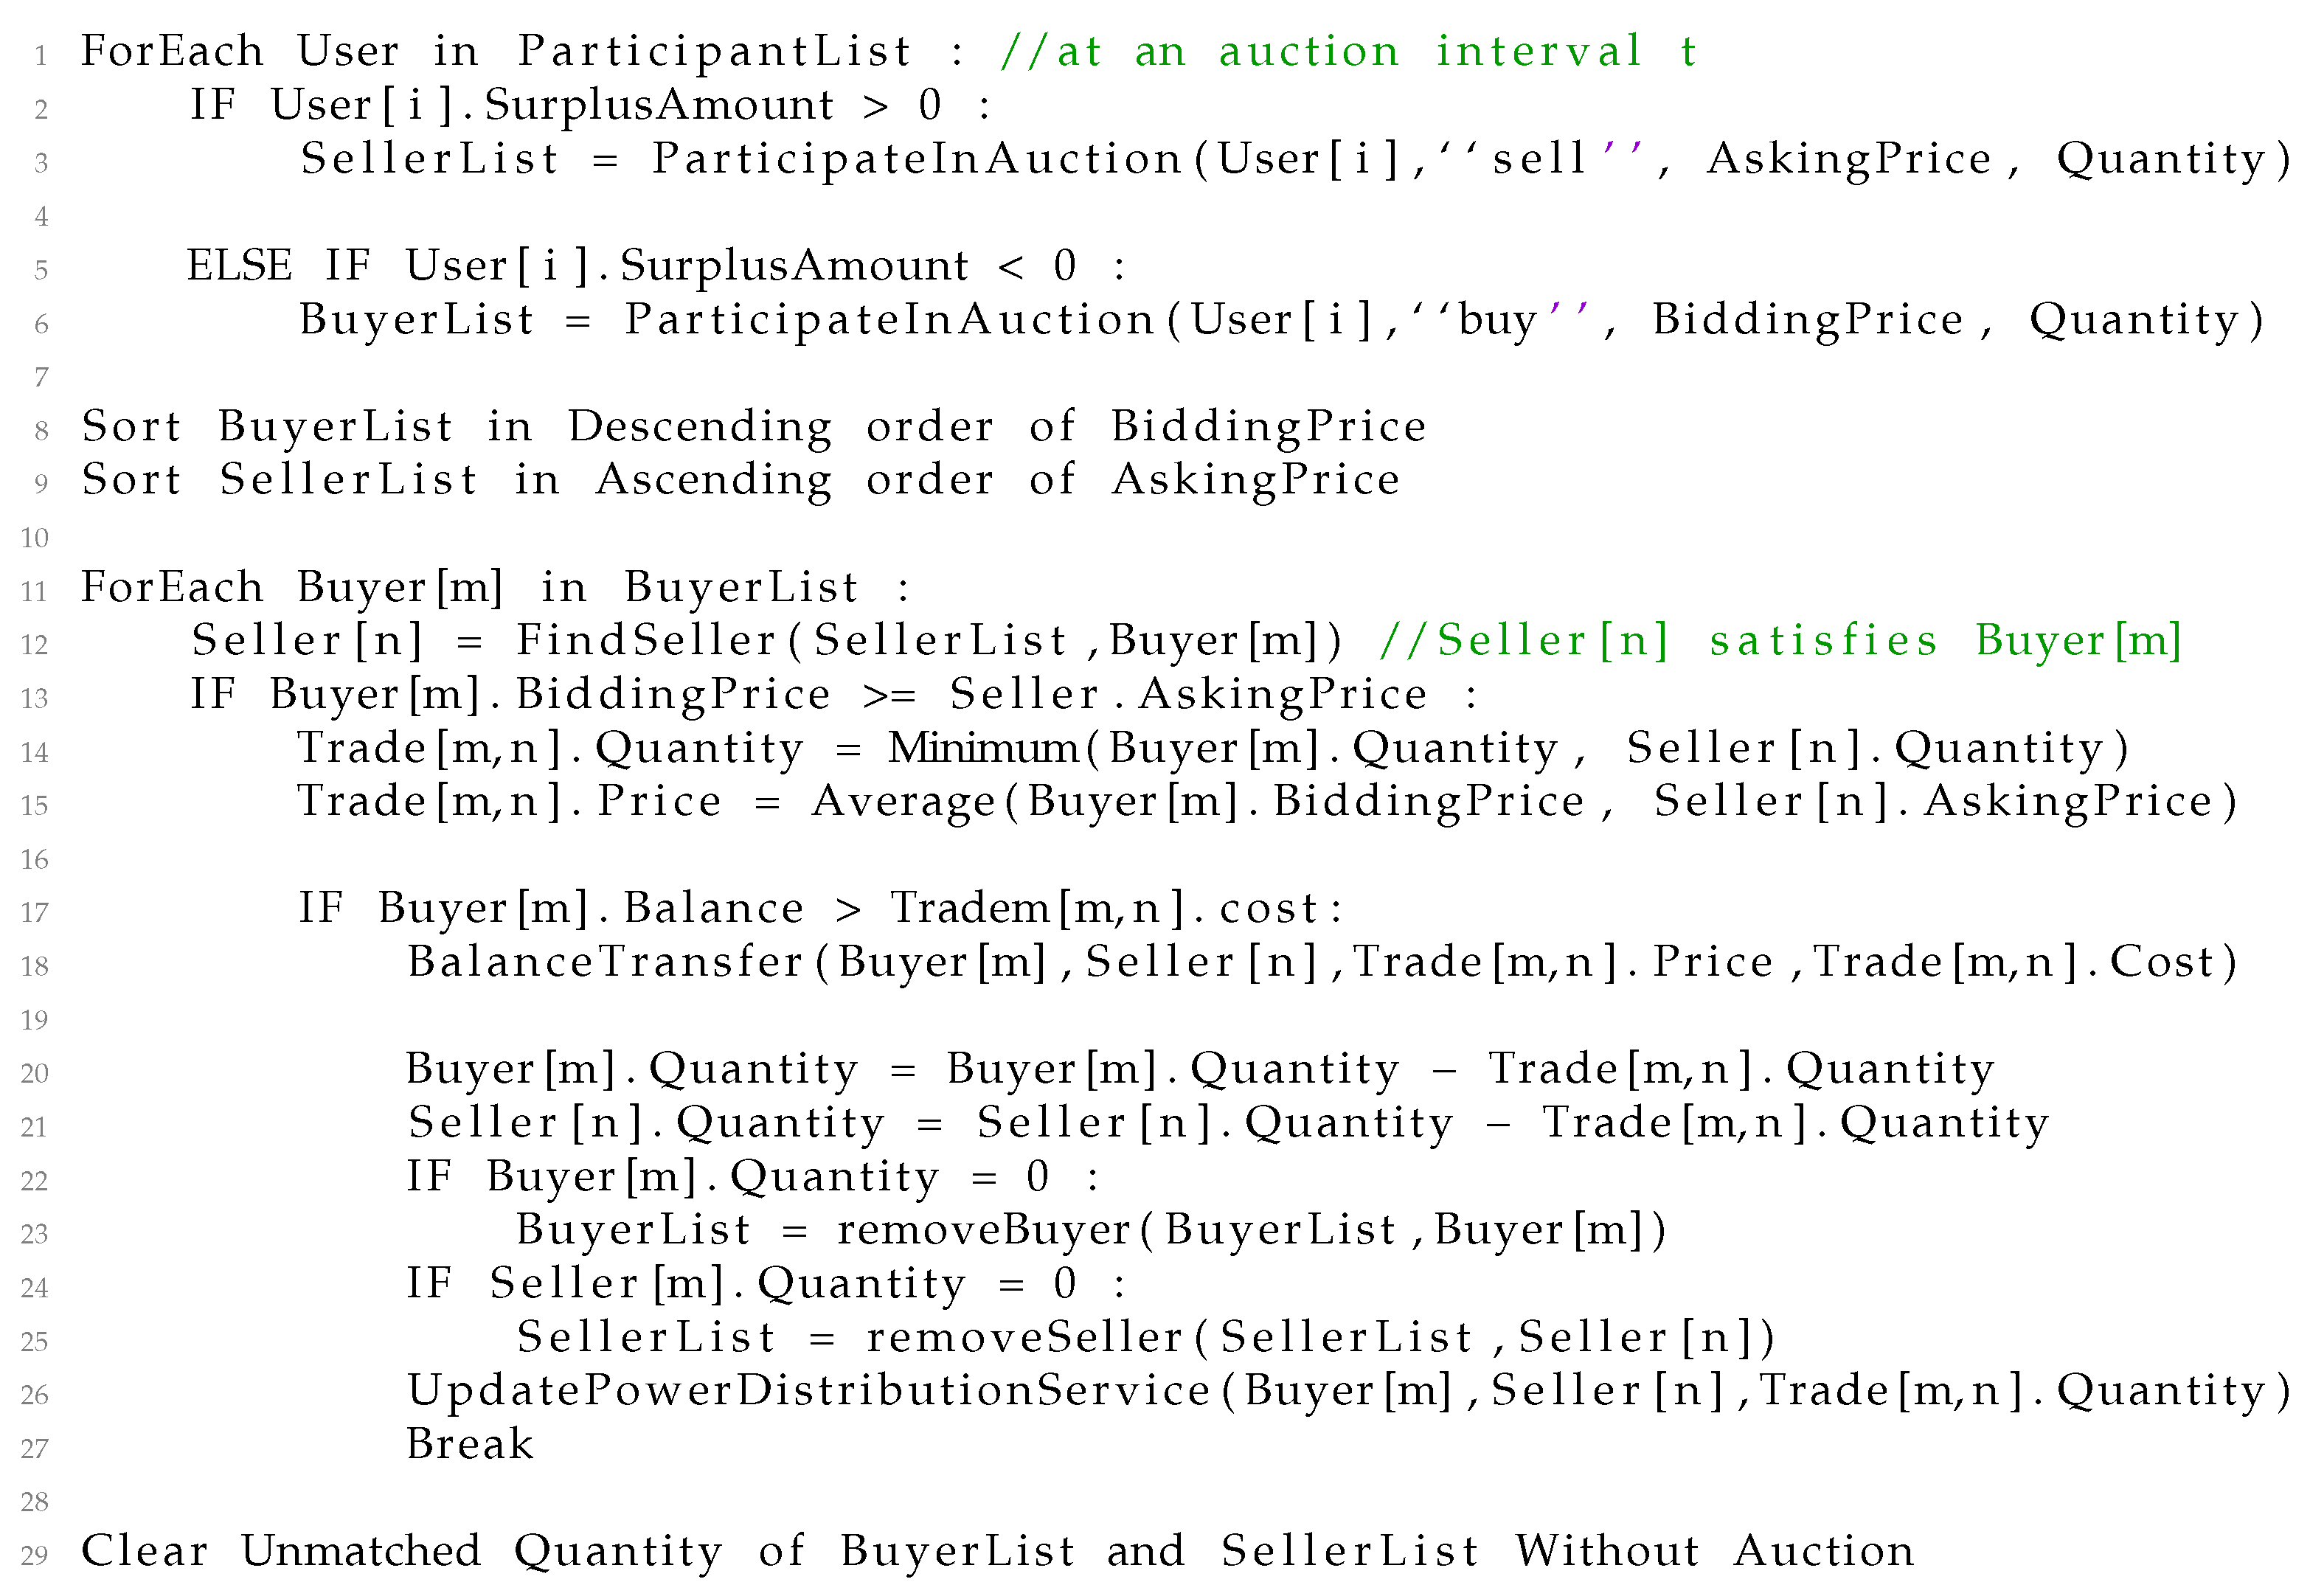
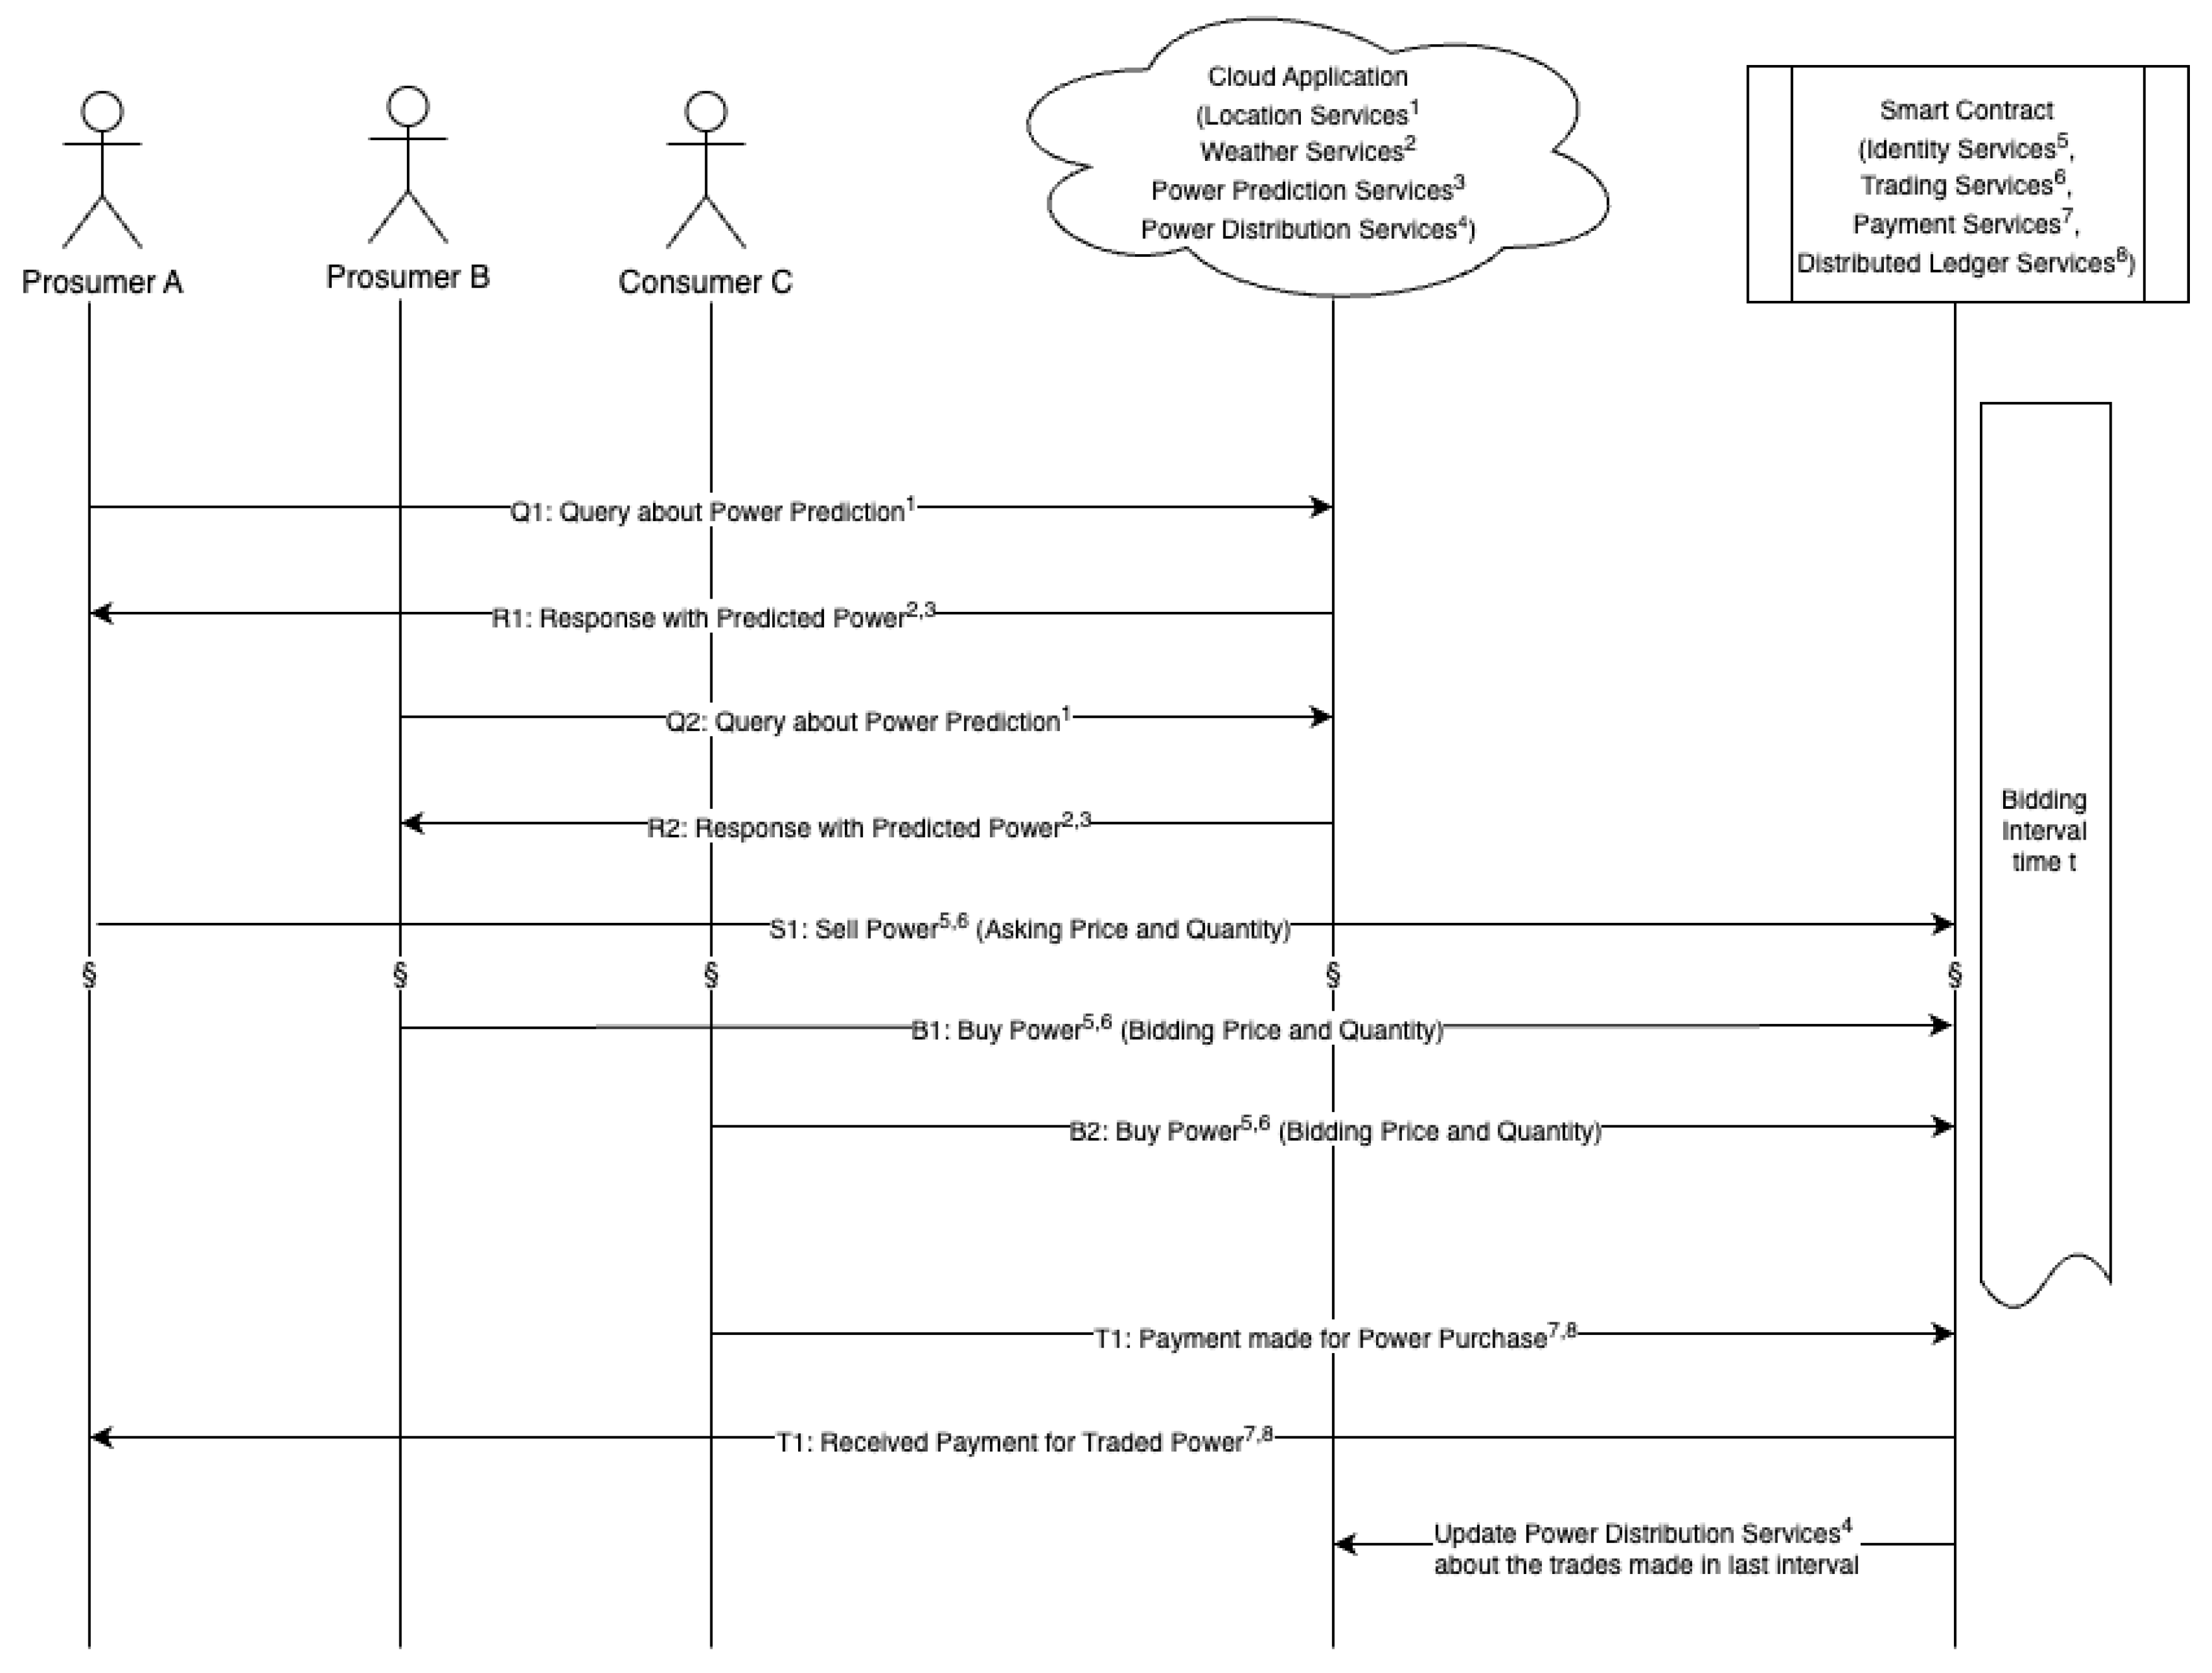
3.1. System Architecture
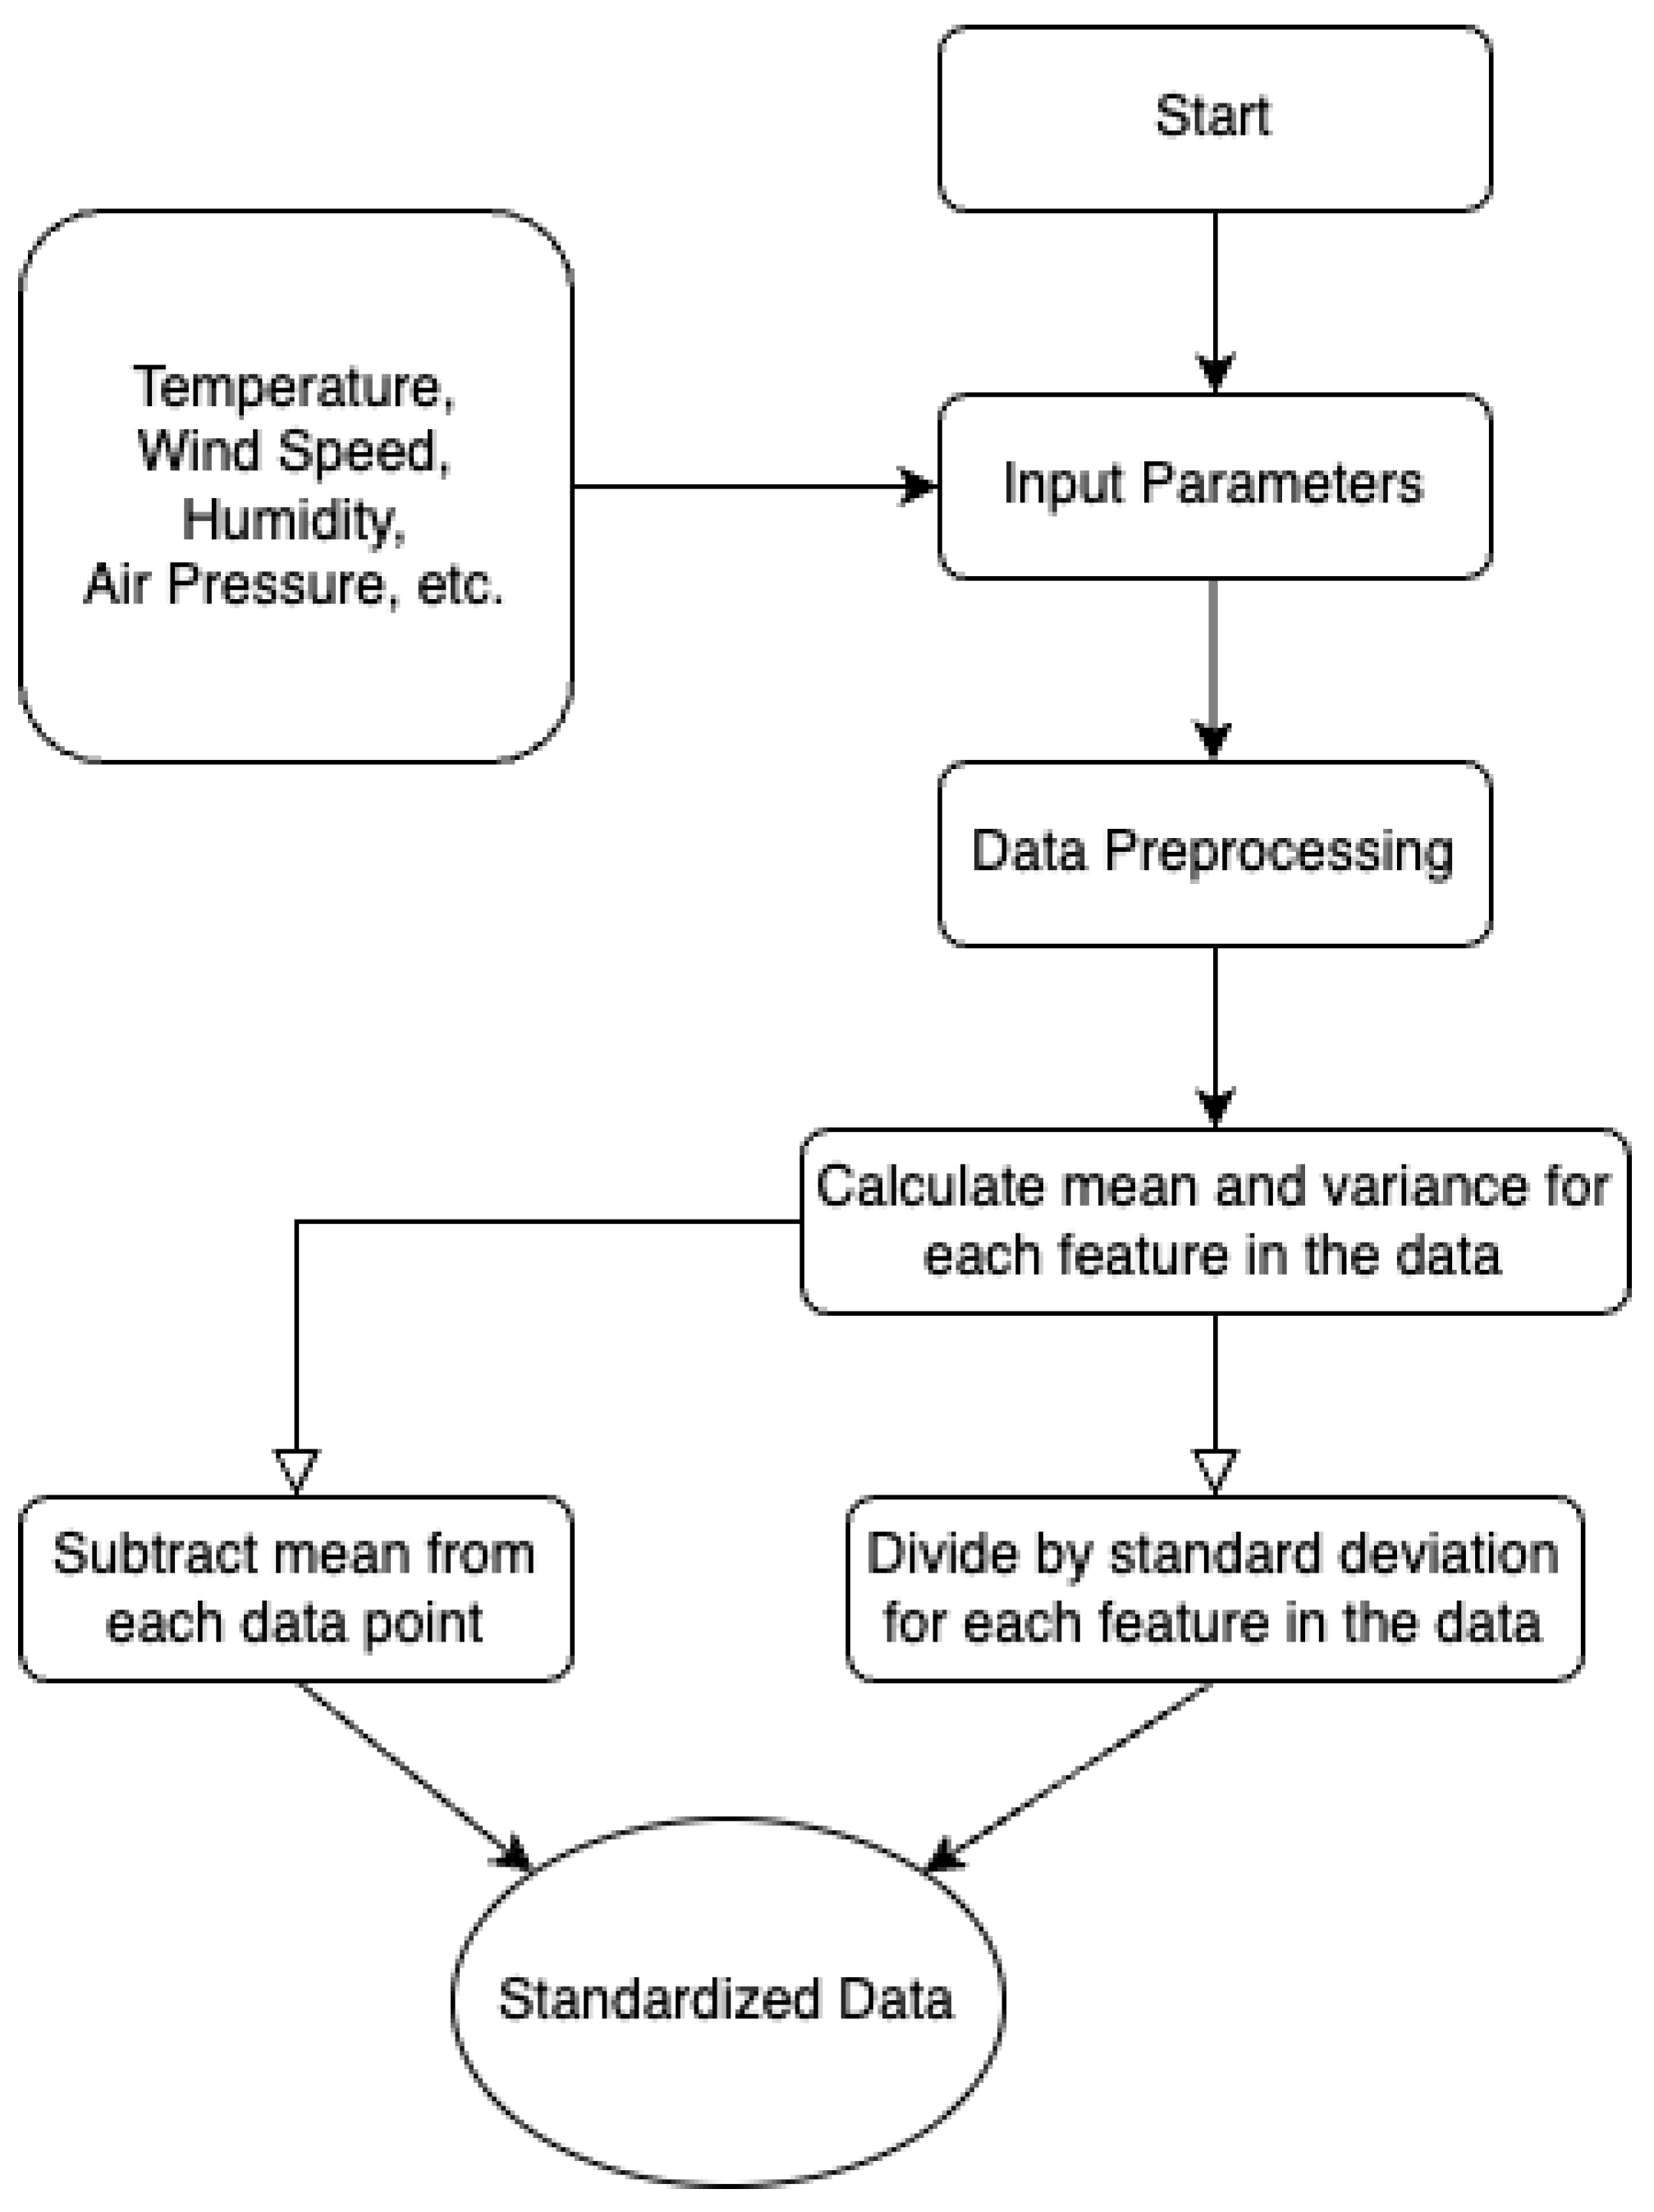
Our proposed architecture considers a cloud-based application and a smart contract to facilitate the energy trade between a number of participants (either as prosumers or consumers). The cloud-based application includes a number of useful services: location services1 (the superscript identifies the corresponding service in Figure 1), weather services2, power prediction services3, and power distribution services4. The location-related services are useful to provide the current location of the participant, and the weather services are used to obtain the weather information (current, previous, or predicted for any future period) of any given location. Power prediction services take the input from weather services and use the machine learning model to predict power generation possibilities at the participant end. Our developed machine learning models are used for prediction by the power prediction services. This will help the prosumers identify the demand more appropriately beforehand and participate in the energy market. Power distribution services are responsible for managing and controlling the distribution of power according to the decisions made in an auction for the participants. The power trade (within an auction) is actually made by a smart contract, and at the end of each auction interval, the smart contract updates the power distribution services about the transactions already made and the smart contract finally makes the financial transactions recorded in blockchain (with the help of distributed ledger services8).
The smart contract included trading services6 that initially prepare a buyerlist and a sellerlist from the interested participants (e.g., Prosumer A, Prosumer B, Consumer C, etc. as shown in Figure 1). The trading services find suitable seller(s) of each for the interested buyer and fix the trading price and quantity accordingly. The identity5 and payment services7 in the smart contract take care of the financial transactions among participants. In Figure 1, the Prosumer A and Prosumer B queries (Q1 and Q2, as an example) are used to obtain the predicted power production result (as R1, R2 correspondingly) by providing their locations to the weather services. For a bidding time period t, the Prosumers A and B as well as Consumer C place their sell/buy request to the smart contract, and then the smart contract analyzes their requests and performs bidding, recording the transactions in blockchain and updating all the required entities automatically. Figure 2 describes the algorithm used by energy trade services in the smart contract. The service collects all the requests and categorizes the participants as either a buyer or seller (Lines 1–6) and then sorts the lists in a particular order to prepare the requests for auction (Lines 8–9), as the auction process is designed to follow a double auction strategy. For each of the buyers, the appropriate seller(s) is looked for, and then transactions are made in a secure manner between buyer and seller after a number of conditional checks (Lines 11–25). The power distribution services are updated regarding the transactions to control the actual power exchange between the seller and buyer (Line 26). The remaining unmatched quantity (intended for auction) is then cleared (Line 29) with an agreed policy (i.e., without auction).
Our machine learning model operates in two distinct stages. Initially, we make predictions regarding the weather condition in the considered location. Subsequently, our system determines the power production by assessing the weather condition. In Figure 1, we have a flowchart of energy trading where an appropriate machine learning model is used by the power prediction and other related services. We employed various machine learning models to explore and visualize our dataset. The dataset we utilized holds potential for training the model to accurately predict the power production level of a prosumer. These predictions aid in the early estimation of power production, surpassing the efficiency of commonly employed methods. After making the estimation, the prosumer participates in the auction market.

3.2. Dataset

While a small dataset may lead to inadequate model performance, it can still be utilized depending on the specific use case. Proof-of-concept studies often require less data compared to large-scale commercial applications. To address the issue of limited data, it is advisable to employ a relatively simple model architecture. Complex models tend to be more susceptible to overfitting when data are scarce. By keeping the model simple, the risk of overfitting can be mitigated. Another important aspect is proper validation of the ML model’s performance. It is crucial to validate the model thoroughly using appropriate techniques. By doing so, one can assess the model’s effectiveness in handling the available data. In the current study, both approaches were implemented to ensure the satisfactory performance of the ML model despite the limited dataset. Table 2 provides the statistical summary of the dataset and Figure 3 shows the process for standardizing the data.
The dataset table consists of weather parameters including temperature, wind speed, humidity, and air pressure. With 553 data points, the table provides statistical measures for each parameter such as the mean, standard deviation, minimum, maximum, and quartiles. The temperature ranges from 25 to 45 degrees Celsius, the wind speed ranges from 4 to 48, the humidity ranges from 7 to 84, and the air pressure ranges from 1000 to 1006. The generated power (PMax) is also measured with a range from 0.14 to 18.4. These summary statistics offer insights into the distribution of the weather data, aiding in analyzing patterns and trends for further analysis or modeling purposes. From Table 2, we can see a summary of the central tendency, dispersion, and shape of a dataset’s distribution, excluding NaN values. The method returns a data frame that contains various statistics such as the count, mean, standard deviation, minimum, and maximum values as well as percentiles (25%, 50%, and 75%) of the data.

3.3. Machine Learning Models

A variety of machine learning methods were evaluated to implement the entire system. To identify the best suited model, we experimented with random forest, decision tree, support vector machine (SVM), and K nearest neighbor (KNN) machine learning algorithms. Random forest is a powerful machine learning algorithm widely used for classification and regression tasks. This is a cluster learning approach that makes predictions by connecting multiple decision trees. The name “random forest” comes from the fact that each decision tree in the cluster is composed of a random subset of the training data and random subsets of features This randomness helps enhance features and reduces the risk of overfitting. During the training process, each decision tree learns patterns and makes predictions independently. The final prediction from a random forest is determined by a set of predictions of all individual trees either by voting (for classification) or by averaging (for regression). Random forests are known for their robustness and ability handle high-level issues with large numbers of diversity. They are also better able to deal with missing values and those who want to go behind the scenes. Random forests provide important insights into priorities, enabling the identification of the most appropriate features for the task at hand. Decision tree is a popular machine learning algorithm widely used for classification and regression functions. It is a hierarchical model that represents decisions in a tree-like structure and their possible outcomes. The tree consists of inner nodes representing decision points and leaf nodes representing outcomes or predictions. Each internal node has an attribute, and based on the value of the attribute, the decision to follow a particular branch is made. The process continues until a leaf node is reached, providing a prediction or final decision. Decision trees are known for being interpretable, because they are easy to visualize and understand. Categorical and numeric features can be handled, and missing values and outliers can be handled to some extent. Decision trees are also used for resource selection, as they can provide insight into the resources required for the task at hand. However, decision trees can suffer from overfitting if not handled properly, and they can struggle to capture strong relationships in the data. Overall, decision trees provide a versatile and flexible way to solve classification regression problems in machine learning. Support vector machine (SVM) is a widely used machine learning algorithm that is primarily used for classification tasks. SVM aims to find the optimal hyperplane in a high-dimensional space that maximally separates different classes of data points. It achieves this by identifying support vectors, which are data points that lie closest to the decision boundary. SVM can handle both linearly separable and non-linearly separable data by utilizing different kernel functions, such as the linear kernel, polynomial kernel, or radial basis function (RBF) kernel. One of the key strengths of SVM is its ability to handle high-dimensional data with a relatively small number of samples. SVM is effective in dealing with overfitting by employing regularization parameters that control the trade-off between maximizing the margin and minimizing classification errors. SVM also has a strong theoretical foundation, offering statistical learning guarantees and robustness against noisy data. While SVMs are generally used for classification, they can be extended to handle regression and anomaly detection tasks. K nearest neighbor (KNN) is a simple machine learning algorithm used for both classification and regression tasks. It is a non-parametric method that makes predictions based on the proximity of data points in the feature space. KNN works by calculating the distance between the new input data point and all the existing data points in the training set. The K nearest neighbors to the new data point are then determined, and the majority class or average value of the K neighbors is assigned as the predicted value for classification or regression, respectively. The choice of K, the number of neighbors to consider, is an important parameter in KNN, as it influences the model’s bias and variance trade-off. KNN is easy to understand and implement, and it can be particularly effective when the decision boundary is nonlinear or when there is a large amount of training data. However, KNN can be computationally expensive when dealing with large datasets, and it is sensitive to the choice of distance metric and the presence of irrelevant features.

4. Model Analysis

The entire process is divided into two primary stages: training and testing. Before feeding the data into the machine learning (ML) model, an important step of data standardization is performed on the input parameters summarized in the flowchart in Figure 3. The training process involves iteratively adjusting the model’s hyper-parameters until the mean squared error (MSE) reaches a satisfactory level. This iterative refinement ensures that the model is optimized to capture the underlying patterns in the data effectively. The best-performing model is then saved and designated as a reference model, denoting its ability to predict numerical values accurately. In the final phase, the model’s predictive capabilities are evaluated using the remaining fold of data. Specifically, this reserved dataset is used to assess the model’s accuracy in predicting pressure gradients. By evaluating its performance on unseen data, we can gauge the model’s generalization and its potential applicability to real-world scenarios. In summary, the methodology encompasses data standardization, intensive training with hyper-parameter tuning, selection of the best model, and rigorous testing on a separate data subset to evaluate its predictive power specifically in relation to appropriate gradients. This systematic approach ensures the development of a reliable and robust predictive model.
The performance of a predictive model was mainly assessed using two key statistical metrics: mean squared error (MSE) and coefficient of determination (R 2 ). MSE quantifies the average squared difference between the predicted and actual values in a regression model. It calculates the average of the squared errors, giving a higher weight to larger error. On the other hand, R 2 provides an indication of how much of the variance in the dependent variable can be explained by the independent variables. Higher R 2 values indicate a better fit and a greater ability of the model to explain the variability in the data. By considering both MSE and R 2 , we can assess the accuracy and goodness of fit of the model, providing insights into its predictive performance.
R 2 = 1 RSS TSS
Equation (1) represents the computation of two crucial measures: Residual Sum of Squares (RSS) and Total Sum of Squares (TSS). RSS is the sum of the squared differences between the actual values (y) and the predicted values (y0), while TSS is the sum of the squared differences between y and the mean value of y. These measures serve as indicators of the model’s performance. To assess the model’s effectiveness, four distinct cases were evaluated by optimizing the hyperparameters based on the optimal values of mean squared error (MSE) and coefficient of determination (R 2 ). Additionally, the mean absolute error (MAE) helps to assess how well a prediction model performs between the expected and actual values by calculating the average absolute difference. Although MAE makes it evident how far the predictions of the model are, on average, from the actual data, MAPE is also calculated as it expresses the prediction errors as a percentage of the actual values. The root mean squared error (RMSE) is also observed as it may be more suited in situations when huge errors are more important.

4.1. Results

Table 3 summarizes the results experimented with different machine learning models. The random forest model’s performance in predicting pMax is determined using multiple metrics. The value of mean absolute error (MAE) is 1.1545, indicating an average deviation of 1.1545 units between the predicted and actual pMax values. The mean absolute percentage error (MAPE) is 0.7044%, representing the average relative difference between the predicted and actual pMax values. The mean squared error (MSE) is 3.8738, indicating the average squared deviation between the predicted and actual pMax values. The root mean squared error (RMSE) is 1.9682, providing an average measure of the prediction’s accuracy in the original units of pMax. Finally, the R 2 score of 0.8897 suggests that the model explains approximately 88.97% of the variance in the pMax variable. Overall, these results provide insights into the model’s performance in predicting pMax and the level of agreement between the predicted and actual pMax values.
The mean absolute error (MAE) of the decision tree model was 1.2462, which represents an average variation of 1.2462 units between the predicted and actual pMax values. The average relative difference between the predicted and actual pMax values is represented by the mean absolute percentage error (MAPE), which is 0.1882 percent. The average squared variation between the anticipated and actual pMax values is 7.3578, which is the mean squared error (MSE). The prediction’s average accuracy in the original units of pMax is measured by the root mean squared error (RMSE), which is equal to 2.7125. The R 2 score of 0.7922 suggests that the decision tree model explains approximately 79.22% of the variance in the pMax variable.
The SVR model obtained a mean absolute error (MAE) of 1.7271, suggesting an average divergence of 1.7271 units between the predicted and real pMax values. The average relative difference between the anticipated and actual pMax values is represented by the mean absolute percentage error (MAPE), which is 0.6940%. The mean squared error (MSE) is 6.6178. The accuracy of the forecast in the original units of pMax is averaged out by the root mean squared error (RMSE), which is 2.5725. The SVR model (RegressorChain alone) appears to account for 83.24 percent of the variance in the pMax variable, according to the R 2 score of 0.8324. These findings shed light on how well the SVR model (RegressorChain alone) predicted pMax.
The mean absolute error (MAE) of the KNN model is 0.5908 and the mean absolute percentage error (MAPE) is 0.1178%. Indicating the average squared variation between the expected and actual pMax values, the mean squared error (MSE) is 0.9569. The accuracy of the prediction in the original units of pMax is averaged out by the root mean squared error (RMSE), which is equal to 0.9782. According to the R 2 score of 0.9712, the KNN model explains roughly 97.12% of the variance in the pMax variable. With minimal errors and high prediction accuracy, these findings show the KNN model’s great performance in predicting pMax.

4.2. Discussion

Among the four machine learning algorithms evaluated for predicting the pMax variable, random forest achieved the best performance based on the simulation results. It had the lowest MAE of 1.1545, indicating the smallest average deviation between the predicted and actual pMax values. Random forest also had the lowest MAPE of 0.7044%, representing the smallest average relative difference between the predicted and actual pMax values. In terms of the overall model fit, random forest had the highest R-squared (R 2 ) score of 0.8897, indicating that it explained the highest proportion of variance in the pMax variable. Additionally, random forest had a relatively lower MSE and RMSE compared to the other models, further suggesting its superior performance in terms of predictive accuracy. Comparatively, the decision tree model had slightly higher MAE, MAPE, MSE, and RMSE values, indicating slightly less accurate predictions compared to random forest. SVR (RegressorChain only) and KNN models also showed higher errors and lower R 2 scores, suggesting less precise predictions and a lower ability to explain the variance in pMax compared to random forest. Overall, based on the simulation results, random forest outperformed the other models in terms of accuracy, precision, and overall fit for predicting the pMax variable.

5. Conclusions and Future Works

In this article, we propose an innovative energy-trading architecture that combines the strengths of blockchain technology (decentralization, transparency, and smart contracts) with the power of efficient machine learning algorithms. This integration aims to foster a more sustainable, resilient, and efficient energy infrastructure while empowering individual entities to actively participate in the energy market and optimize their energy usage. The proposed architecture and evaluation of machine learning models provide valuable insights for researchers, policymakers, and energy industry stakeholders looking to advance energy-trading technologies. The considered system relies on the analysis of a previous power production dataset to create an efficient machine learning model. By leveraging the machine learning algorithm, we aim to enhance the early estimation of power production. Through our dataset analysis and experiments, we have demonstrated the effectiveness of the random forest model over other models in accurately predicting power production. In future investigations, we plan to further advance our research by developing a real-life application that can provide live results. This application will enable us to gather real-time data from participants and continuously update our prediction models. By implementing this real-life application, we aim to enhance the accuracy and applicability of our predictions, ultimately improving the effectiveness of our system. While our current study focuses on a specific dataset and problem domain, in the future, we will explore the applicability of our findings across diverse datasets and scenarios using a simulation framework and further analyze the performance and viability of our blockchain-based solution.

Author Contributions

Conceptualization, M.R. and M.H.; Investigation, M.R. and M.K.H.; Data curation, M.K.H.; Writing—original draft, M.R. and S.C.; Writing— review & editing, M.S.; Supervision, M.H. All authors have read and agreed to the published version of the manuscript.

Funding

This work was funded by King Fahd University of Petroleum and Minerals (KFUPM), Saudi Arabia under the Interdisciplinary Research Center for Intelligent Secure System’s (IRC-ISS) research grant #INSS2203.

Institutional Review Board Statement

Not Applicable.

Informed Consent Statement

Not Applicable.

Data Availability Statement

Not Applicable.

Acknowledgments

This research was fully supported by a research grant #INSS2203 from the Interdisciplinary Research Center for Intelligent Secure Systems (IRC-ISS), King Fahd University of Petroleum and Minerals (KFUPM). We conducted experiments to evaluate the performance of Machine Learning Models. Data used to support the experiment were collected by Mohammad Kamal Hossain (through grant support #INRE2318).

Conflicts of Interest

The authors declare no conflict of interest.

References

  1. Bandeiras, F.; Gomes, Á.; Gomes, M.; Coelho, P. Exploring Energy Trading Markets in Smart Grid and Microgrid Systems and Their Implications for Sustainability in Smart Cities. Energies 2023, 16, 801. [Google Scholar] [CrossRef]
  2. Guerrero, J.; Chapman, A.C.; Verbič, G. Decentralized P2P energy trading under network constraints in a low-voltage network. IEEE Trans. Smart Grid 2018, 10, 5163–5173. [Google Scholar] [CrossRef]
  3. Soto, E.A.; Bosman, L.B.; Wollega, E.; Leon-Salas, W.D. Peer-to-peer energy trading: A review of the literature. Appl. Energy 2021, 283, 116268. [Google Scholar] [CrossRef]
  4. Samuel, O.; Javaid, N. A secure blockchain-based demurrage mechanism for energy trading in smart communities. Int. J. Energy Res. 2021, 45, 297–315. [Google Scholar] [CrossRef]
  5. Chen, S.; Shen, Z.; Zhang, L.; Yan, Z.; Li, C.; Zhang, N.; Wu, J. A trusted energy trading framework by marrying blockchain and optimization. Adv. Appl. Energy 2021, 2, 100029. [Google Scholar] [CrossRef]
  6. Jiang, Y.; Zhou, K.; Lu, X.; Yang, S. Electricity trading pricing among prosumers with game theory-based model in energy blockchain environment. Appl. Energy 2020, 271, 115239. [Google Scholar] [CrossRef]
  7. Al-Quraan, A.; Al-Mhairat, B. Intelligent Optimized Wind Turbine Cost Analysis for Different Wind Sites in Jordan. Sustainability 2022, 14, 3075. [Google Scholar] [CrossRef]
  8. Darwish, H.H.; Al-Quraan, A. Machine Learning Classification and Prediction of Wind Estimation Using Artificial Intelligence Techniques and Normal PDF. Sustainability 2023, 15, 3270. [Google Scholar] [CrossRef]
  9. Ibrahim, M.S.; Dong, W.; Yang, Q. Machine learning driven smart electric power systems: Current trends and new perspectives. Appl. Energy 2020, 272, 115237. [Google Scholar] [CrossRef]
  10. AlKandari, M.; Ahmad, I. Solar power generation forecasting using ensemble approach based on deep learning and statistical methods. Appl. Comput. Inform. 2020. [Google Scholar] [CrossRef]
  11. Hu, S.; Yang, Z.; Li, J.; Duan, Y. Thermo-economic optimization of the hybrid geothermal-solar power system: A data-driven method based on lifetime off-design operation. Energy Convers. Manag. 2021, 229, 113738. [Google Scholar] [CrossRef]
  12. Feng, Y.; Hao, W.; Li, H.; Cui, N.; Gong, D.; Gao, L. Machine learning models to quantify and map daily global solar radiation and photovoltaic power. Renew. Sustain. Energy Rev. 2020, 118, 109393. [Google Scholar] [CrossRef]
  13. Munawar, U.; Wang, Z. A framework of using machine learning approaches for short-term solar power forecasting. J. Electr. Eng. Technol. 2020, 15, 561–569. [Google Scholar] [CrossRef]
  14. Reddy, K.; Ananthsornaraj, C. Design, development and performance investigation of solar Parabolic Trough Collector for large-scale solar power plants. Renew. Energy 2020, 146, 1943–1957. [Google Scholar] [CrossRef]
  15. Kumar, A.; Singh, A.P.; Singh, O. Effect of novel PCM encapsulation designs on electrical and thermal performance of a hybrid photovoltaic solar panel. Sol. Energy 2020, 205, 320–333. [Google Scholar]
  16. Sasikumar, C.; Manokar, A.M.; Vimala, M.; Prince Winston, D.; Kabeel, A.; Sathyamurthy, R.; Chamkha, A.J. Experimental studies on passive inclined solar panel absorber solar still. J. Therm. Anal. Calorim. 2020, 139, 3649–3660. [Google Scholar] [CrossRef]
  17. Abd Elbar, A.R.; Hassan, H. Enhancement of hybrid solar desalination system composed of solar panel and solar still by using porous material and saline water preheating. Sol. Energy 2020, 204, 382–394. [Google Scholar] [CrossRef]
  18. Ramkiran, B.; Sundarabalan, C.; Sudhakar, K. Performance evaluation of solar PV module with filters in an outdoor environment. Case Stud. Therm. Eng. 2020, 21, 100700. [Google Scholar] [CrossRef]
  19. Xu, Y.; Yu, L.; Bi, G.; Zhang, M.; Shen, C. Deep reinforcement learning and blockchain for peer-to-peer energy trading among microgrids. In Proceedings of the 2020 International Conferences on Internet of Things (iThings) and IEEE Green Computing and Communications (GreenCom) and IEEE Cyber, Physical and Social Computing (CPSCom) and IEEE Smart Data (SmartData) and IEEE Congress on Cybermatics (Cybermatics), IEEE, Rhodes, Greece, 2–6 November 2020; pp. 360–365. [Google Scholar]
  20. Wongthongtham, P.; Marrable, D.; Abu-Salih, B.; Liu, X.; Morrison, G. Blockchain-enabled Peer-to-Peer energy trading. Comput. Electr. Eng. 2021, 94, 107299. [Google Scholar] [CrossRef]
  21. Seven, S.; Yao, G.; Soran, A.; Onen, A.; Muyeen, S. Peer-to-peer energy trading in virtual power plant based on blockchain smart contracts. IEEE Access 2020, 8, 175713–175726. [Google Scholar] [CrossRef]
  22. Wang, S.; Taha, A.F.; Wang, J.; Kvaternik, K.; Hahn, A. Energy crowdsourcing and peer-to-peer energy trading in blockchain-enabled smart grids. IEEE Trans. Syst. Man Cybern. Syst. 2019, 49, 1612–1623. [Google Scholar] [CrossRef]
  23. Monroe, J.G.; Hansen, P.; Sorell, M.; Berglund, E.Z. Agent-based model of a blockchain enabled peer-to-peer energy market: Application for a neighborhood trial in Perth, Australia. Smart Cities 2020, 3, 1072–1099. [Google Scholar] [CrossRef]
  24. Zhou, Y.; Lund, P.D. Peer-to-peer energy sharing and trading of renewable energy in smart communities—Trading pricing models, decision-making and agent-based collaboration. Renew. Energy 2023, 207, 177–193. [Google Scholar] [CrossRef]
Figure 1. Flowchart of energy trading.
Sustainability 15 13640 g001
Figure 2. Energy trade services using smart contract.
Sustainability 15 13640 g002
Figure 3. Flowchart of standardized data.
Sustainability 15 13640 g003
Table 2. Statistical summary of the dataset.
TempWind SpeedHumidityAir PressurepMax
Count553.00553.000553.000553.000553.000
Mean37.00722.12319.2431002.4309.975
Std5.0027.76812.5491.7485.890
Min25.0004.0007.0001000.0000.140
25%33.83317.00010.5001001.0004.180
50%37.66720.50016.6671002.00011.210
75%41.33328.33323.5001003.66715.600
Max45.00048.00084.0001006.00018.400
Table 3. Quantitative analysis of machine learning models.
ML ModelMAEMAPEMSERMSER 2
Random Forest1.15450.70443.87381.96820.8897
Decision Tree1.24620.18827.35782.71250.7922
SVR1.72710.69406.61782.57250.8324
KNN0.59080.11780.95690.97820.9712
Disclaimer/Publisher’s Note: The statements, opinions and data contained in all publications are solely those of the individual author(s) and contributor(s) and not of MDPI and/or the editor(s). MDPI and/or the editor(s) disclaim responsibility for any injury to people or property resulting from any ideas, methods, instructions or products referred to in the content.

