1. Introduction
The stability of power systems is at risk from disruptive phenomena like power swings, which can be triggered by sudden disturbances such as rapid changes in demand, switching or short circuits, or the disconnection of power lines resulting from faults within the power system. These events can cause significant swings in the rotor angle of the generators [
1]. In case of lack of pole slip, the power swing is stable, and this phenomenon is due to the efforts of generator units to find a new operating point [
2].
If the power swing remains stable, the distance relay must not send a trip command. However, it is possible for distance relays to experience malfunctions during stable power swings. The improper operation of distance relays within a wide-ranging power system can result in the malfunction of other relays and jeopardize the security of the system. An instance that highlights the significance of this issue is the blackout that occurred in the United States in 2003, which was ultimately caused by the tripping of distance relays due to overload and power swings, eventually culminating in the collapse of the entire system [
3].
Measures have been implemented to decrease the risk of inappropriate functioning of distance relays when power swings occur. To manage such situations effectively, power swing detector (PSD) or power swing blocking (PSB) mechanisms are incorporated into these relays. The role of these units is to identify power swings and prevent the distance relay from improper operation.
So far, several methods have been introduced to design the PSB unit and detect power swings in distance relays. The conventional and widely used approach assesses the speed of the impedance characteristic within a region [
4]. The rate of impedance variations observed by the relay during a fault surpasses that observed during the power swing [
5]. This approach encounters certain challenges, including the need to establish a time limit for the speedometer timer and unsatisfactory performance for extensive and overloaded lines. Currently, the most common technique for power swing detection is based on impedance measurement, which is sensitive to network topology [
6].
In the event of a short circuit fault occurring during power swing and operation of the PSB unit, the distance relay must detect the fault immediately and unblock in order to initiate the trip of the power lines. Extensive research has been conducted on different approaches for fault detection during power swings, which is briefly discussed within this paper. In [
7], a method based on the new superimposed negative sequence current was proposed to detect the fault during asymmetrical power swing. In [
8], probabilistic neural networks and S-Transform were employed to detect faults during power swings. Only symmetrical faults can be detected by this method, which takes a half cycle. In [
9], the data mining method based on a decision tree and random forests was employed to find faults during power swings. Twenty different feature numbers were chosen to be the data mining model’s input. The aforementioned method can also detect faults in series compensated lines. In [
10], the idea of DC-offset estimate to find faults during power swings was presented, but only a small number of fault environments were taken into account for all the case studies. In [
11], in order to identify faults, the utilization of synchrophasor measurements for estimating the voltage phasors and load angles of the buses was demonstrated. Swing is detected if the change in load angle exceeds a threshold, and fault is detected if the voltage magnitude falls below a certain threshold.
In [
12], an indicator called transient monitoring (TM) was introduced to detect a fault. The basis of the work is the comparison of the calculated TM value and the preset threshold. If the TM value is larger than the preset threshold, a fault has occurred. The TM index as a recorder of transient variations from the beginning of the fault is calculated using the dynamic phase estimation method. Another method of fault detection is the differential power method mentioned in [
13]. The differential power is obtained by calculating the difference between the voltage and current samples and the predicted samples. In this method, the auto-regression technique is used to estimate future voltage and current samples. The problem with this method is the large number of simulations required to select the appropriate auto-regression parameters. In [
14], a fault detection scheme was proposed based on superimposed negative sequence apparent power during power swing. In [
15], a method was introduced which is dependent on the TKEO of zero sequence voltage (obtained from instantaneous values) and negative sequence current (obtained from phasor values) during power swing. In [
16], a simple algorithm to detect symmetrical faults during power swing on a double circuit multi-terminal line was proposed. In [
17], different wavelet types were used, such as Battle Lemarie Spline, Beylkin, Daubechies, and Symlet, for fault detection during power swing by extracting voltage and current signals. In [
18], a fault detection algorithm was presented based on discrete wavelet transforms during power swings. In [
19], a method to estimate signals using a Taylor series expansion and a formulation of a discrimination index from the estimation error were proposed. The discriminating index is equal to or greater than the threshold, the fault is found. Although this method may contain estimation mistakes, it has not been evaluated for differences in fault resistance or phase angles. Also, in [
20] a method has been proposed based on the phase comparison of line current technique and the different percentage of transmission line length at the fault point to analyze the fault during power swing.
Fast wavelet coefficient index [
21] and covariance indices-based [
22] methods are employed for fault detection during power swing. In [
23], on the basis of the characteristics of fundamental frequency phasors, two different fault detector types were described. Despite the fact that some of the described features exist, there are issues with the suggested techniques. It appears that setting-free is one among the techniques. Given that the directional methods must be tuned, this technique is actually a variation in the directional relay. The speed of fault detection using that method is insufficient to meet the speed requirements of the protective relay. Based on the measured admittance in the IED, a different methodology was created. It is not yet clear if the admittance is determined in the sequence domain or the ABC system. In [
24], a method based on the absolute rate of change of zero sequence current was proposed for detecting faults, without any supporting analysis, as a heuristic characteristic. In [
25], a method based on concentric PSB was proposed for detecting fault in lines compensated by unified power flow controller (UPFC). In [
26], a method based on the variance of sampled current signal instead of using sophisticated signal processing was proposed for detecting power swing and blocking the distance relay. In [
27], chaos technique was proposed to detect power swing and the fault during power swing by using the current signal data and logistic map. In [
28], a new method was proposed which utilizes Hilbert transform to detect power swings and faults that occur during power swings. This method operates autonomously regardless of the system parameters.
This paper presents a new method for fault detection during power swing based on the extraction of current waveform components using the Prony method. This method can eliminate all the mentioned problems and detect the types of faults during power swings. To evaluate the efficiency of this method, a 9-bus grid model has been studied in MATLAB and DIgSILENT software. In the second section of this paper, the behavior of the distance relay during power swing is studied. In the third section, a fault detection algorithm is presented, based on the study of the main frequency damping coefficient in each window of the current waveform. Finally, the performance of the proposed method has been investigated by simulating various faults at different points of the line in DIgSILENT and MATLAB.
2. Distance Relay Behavior during Power Swing
The distance relay plays a crucial role in ensuring the robustness of the power system by effectively detecting and eliminating faults in transmission lines. Also, the relay must trip when a fault occurs in its set zone, and the operation of the relay must be prevented due to power swings caused by disturbances. As a result, the PSB unit has been added to modern distance relays, and the relays may be blocked during power swings [
29,
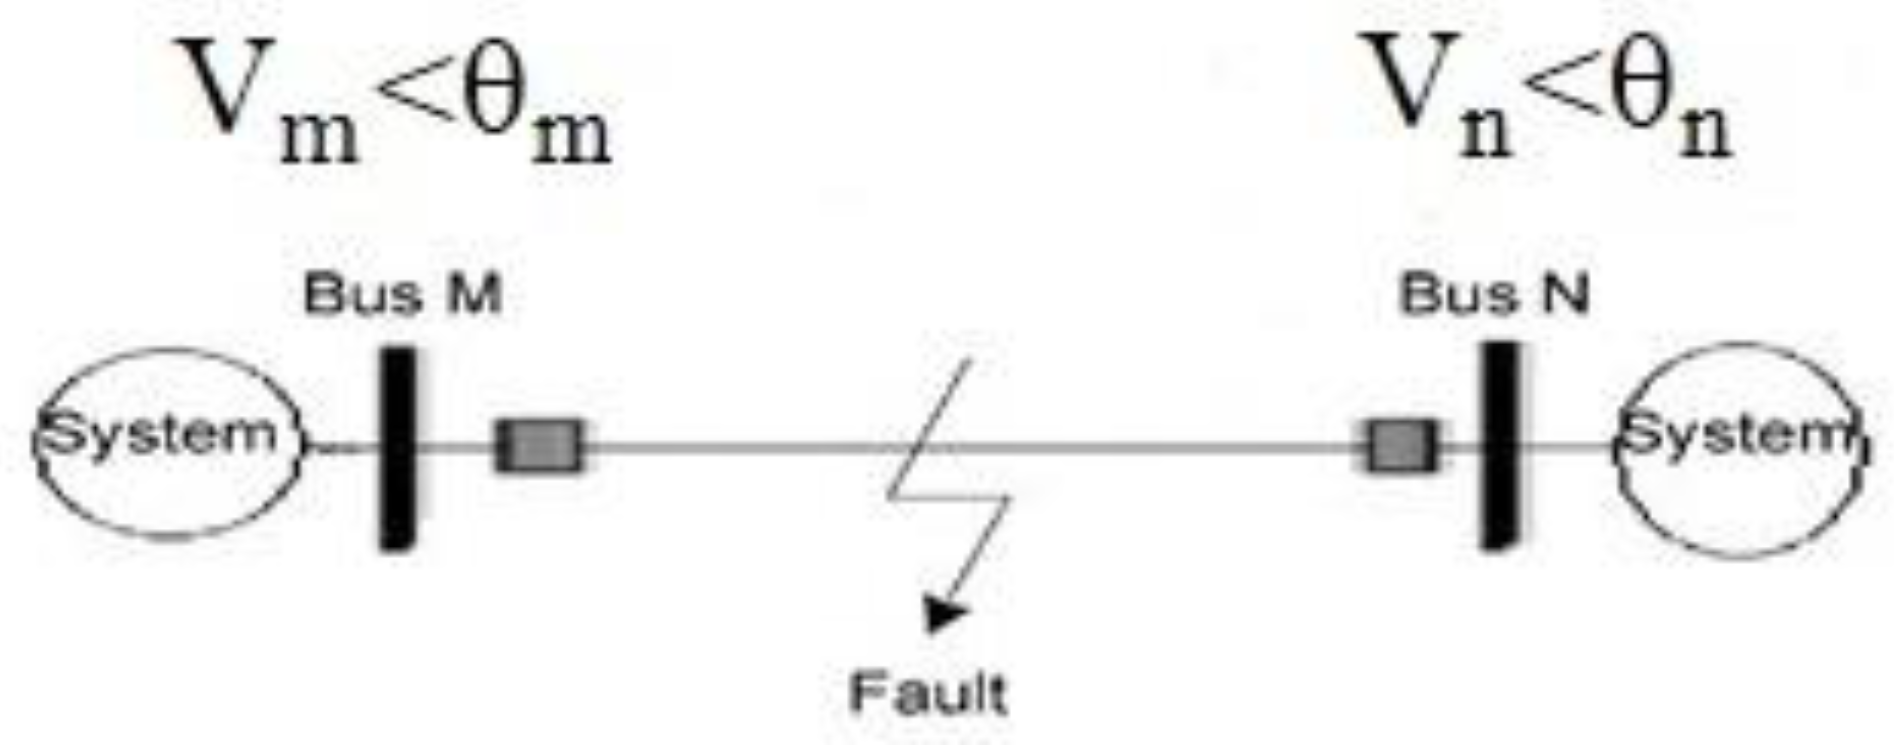
30]. According to
Figure 1, if no fault occurs in the transmission line, the impedance seen by the distance relay is obtained from (1).
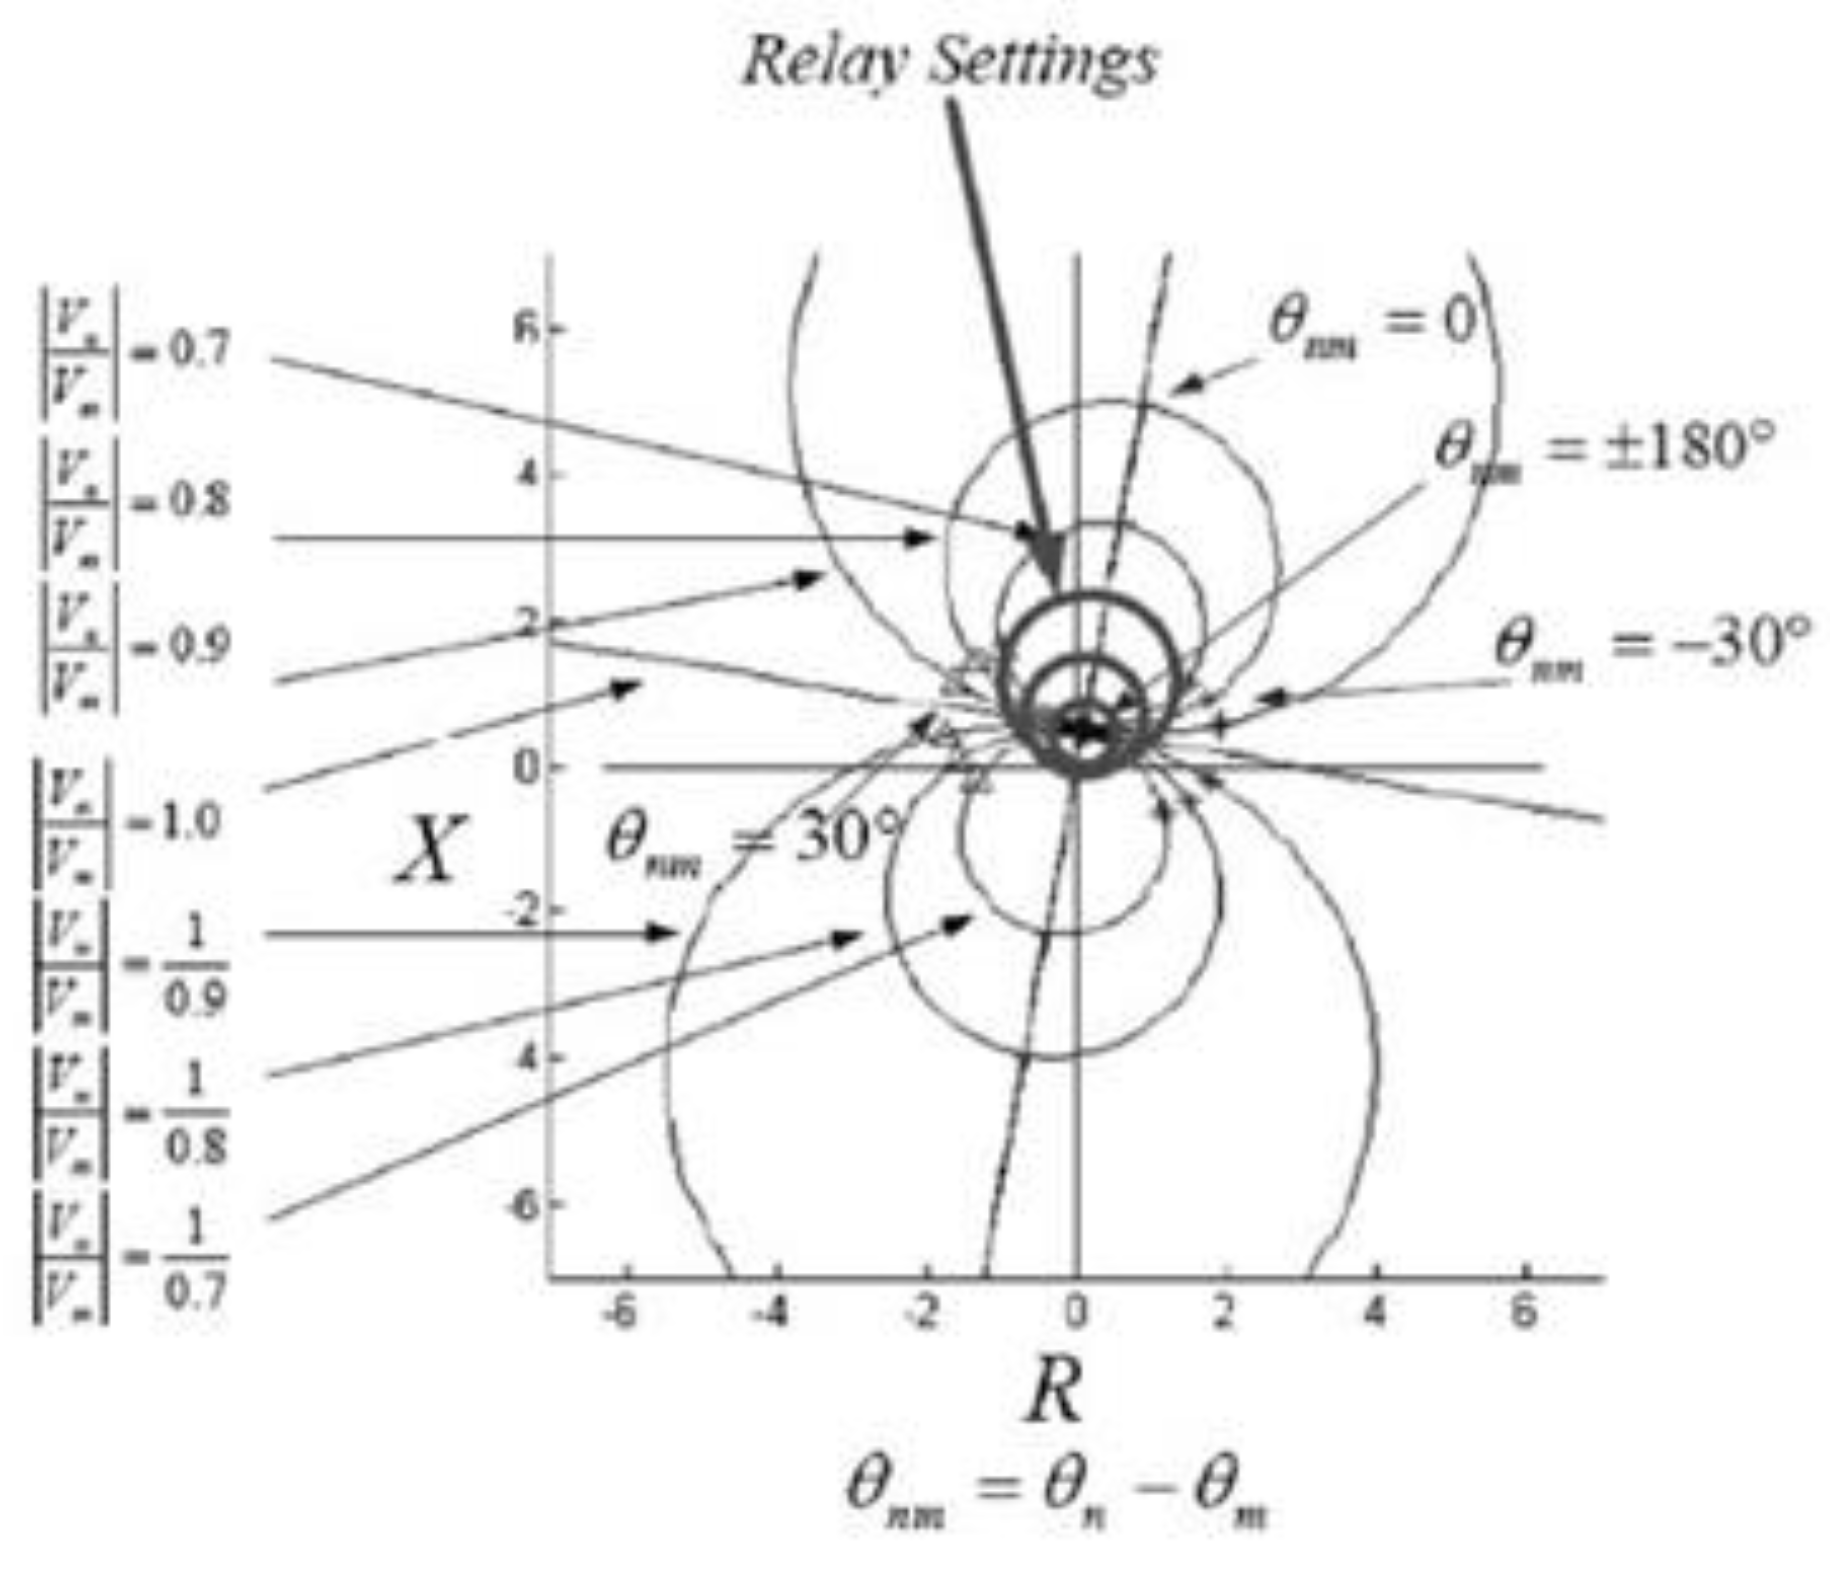
In (1), the impedance seen by the relay is determined by two variables: the magnitude ratio of two busbar voltages at the end of the line
and the angle difference between the two bus voltages (
). Due to the voltage swings of busbars during the power swing,
also oscillates. The
trajectories on the R-X plane is shown in
Figure 2 with respect to the voltage magnitude ratio of two buses and the angle difference between the two buses mentioned.
During power swing, if the voltage magnitude ratio of busbars and angle difference is such that the impedance seen by the relay enters the zone settings, an undesirable trip occurs.
3. Prony Method
This algorithm is utilized in signal processing, which has recently been used in the protection of power systems [
31,
32].
In [
33], Prony analysis is used to determine the operating modes of the power system (stability or instability detection) using the oscillation curve of network generators. This method as a powerful tool analyzes the signal and extracts its qualitative data. The power of the Prony algorithm in analyzing damped signals and estimating signal damping coefficients has made this algorithm a suitable tool for use in transient state analysis. Using this algorithm, signal information such as frequency, amplitude, and damping coefficient can be extracted. These data can be utilized to analyze the network conditions that have affected the signal. The two main advantages of this method are more simplicity and fewer calculations compared with existing methods and the lack of dependence of the result on the initial value.
The Prony method calculates the amplitude, frequency, and damping coefficient of the signal with the sum of the damped sub-sines according to (2):
In Equation (2), N is the number of samples in a window and M is the number of damping sines.
and
are also complex numbers.
is the damping coefficient and
is the damping frequency. In [
14], linear equations are expressed as estimation values as follows:
where b is the vector of inverse estimation coefficients; A is the sample matrix; and h is the sample vector. In [
34], it is shown that Equation (5) has roots in the form
.
In which M ≤ L ≤ (N − M). In Equation (5), if L > M, we have (L − M) more roots of zero, which are called external zeros. To obtain vector b, Equation (4) must be solved by the least square error method.
By calculating the roots of Equation (5), the damping coefficients and the damping frequency of the signal can be calculated according to Equations (6) and (7):
where Im (
), Re (
), and Δt are the imaginary part of the roots, the real part of the roots and the sampling time, respectively. Therefore, by defining y(n) correctly and applying the proposed method, the desired signal properties can be obtained at once and without repetition. In this study, y(n) is the current signal sampled at a frequency of 10 kHz.
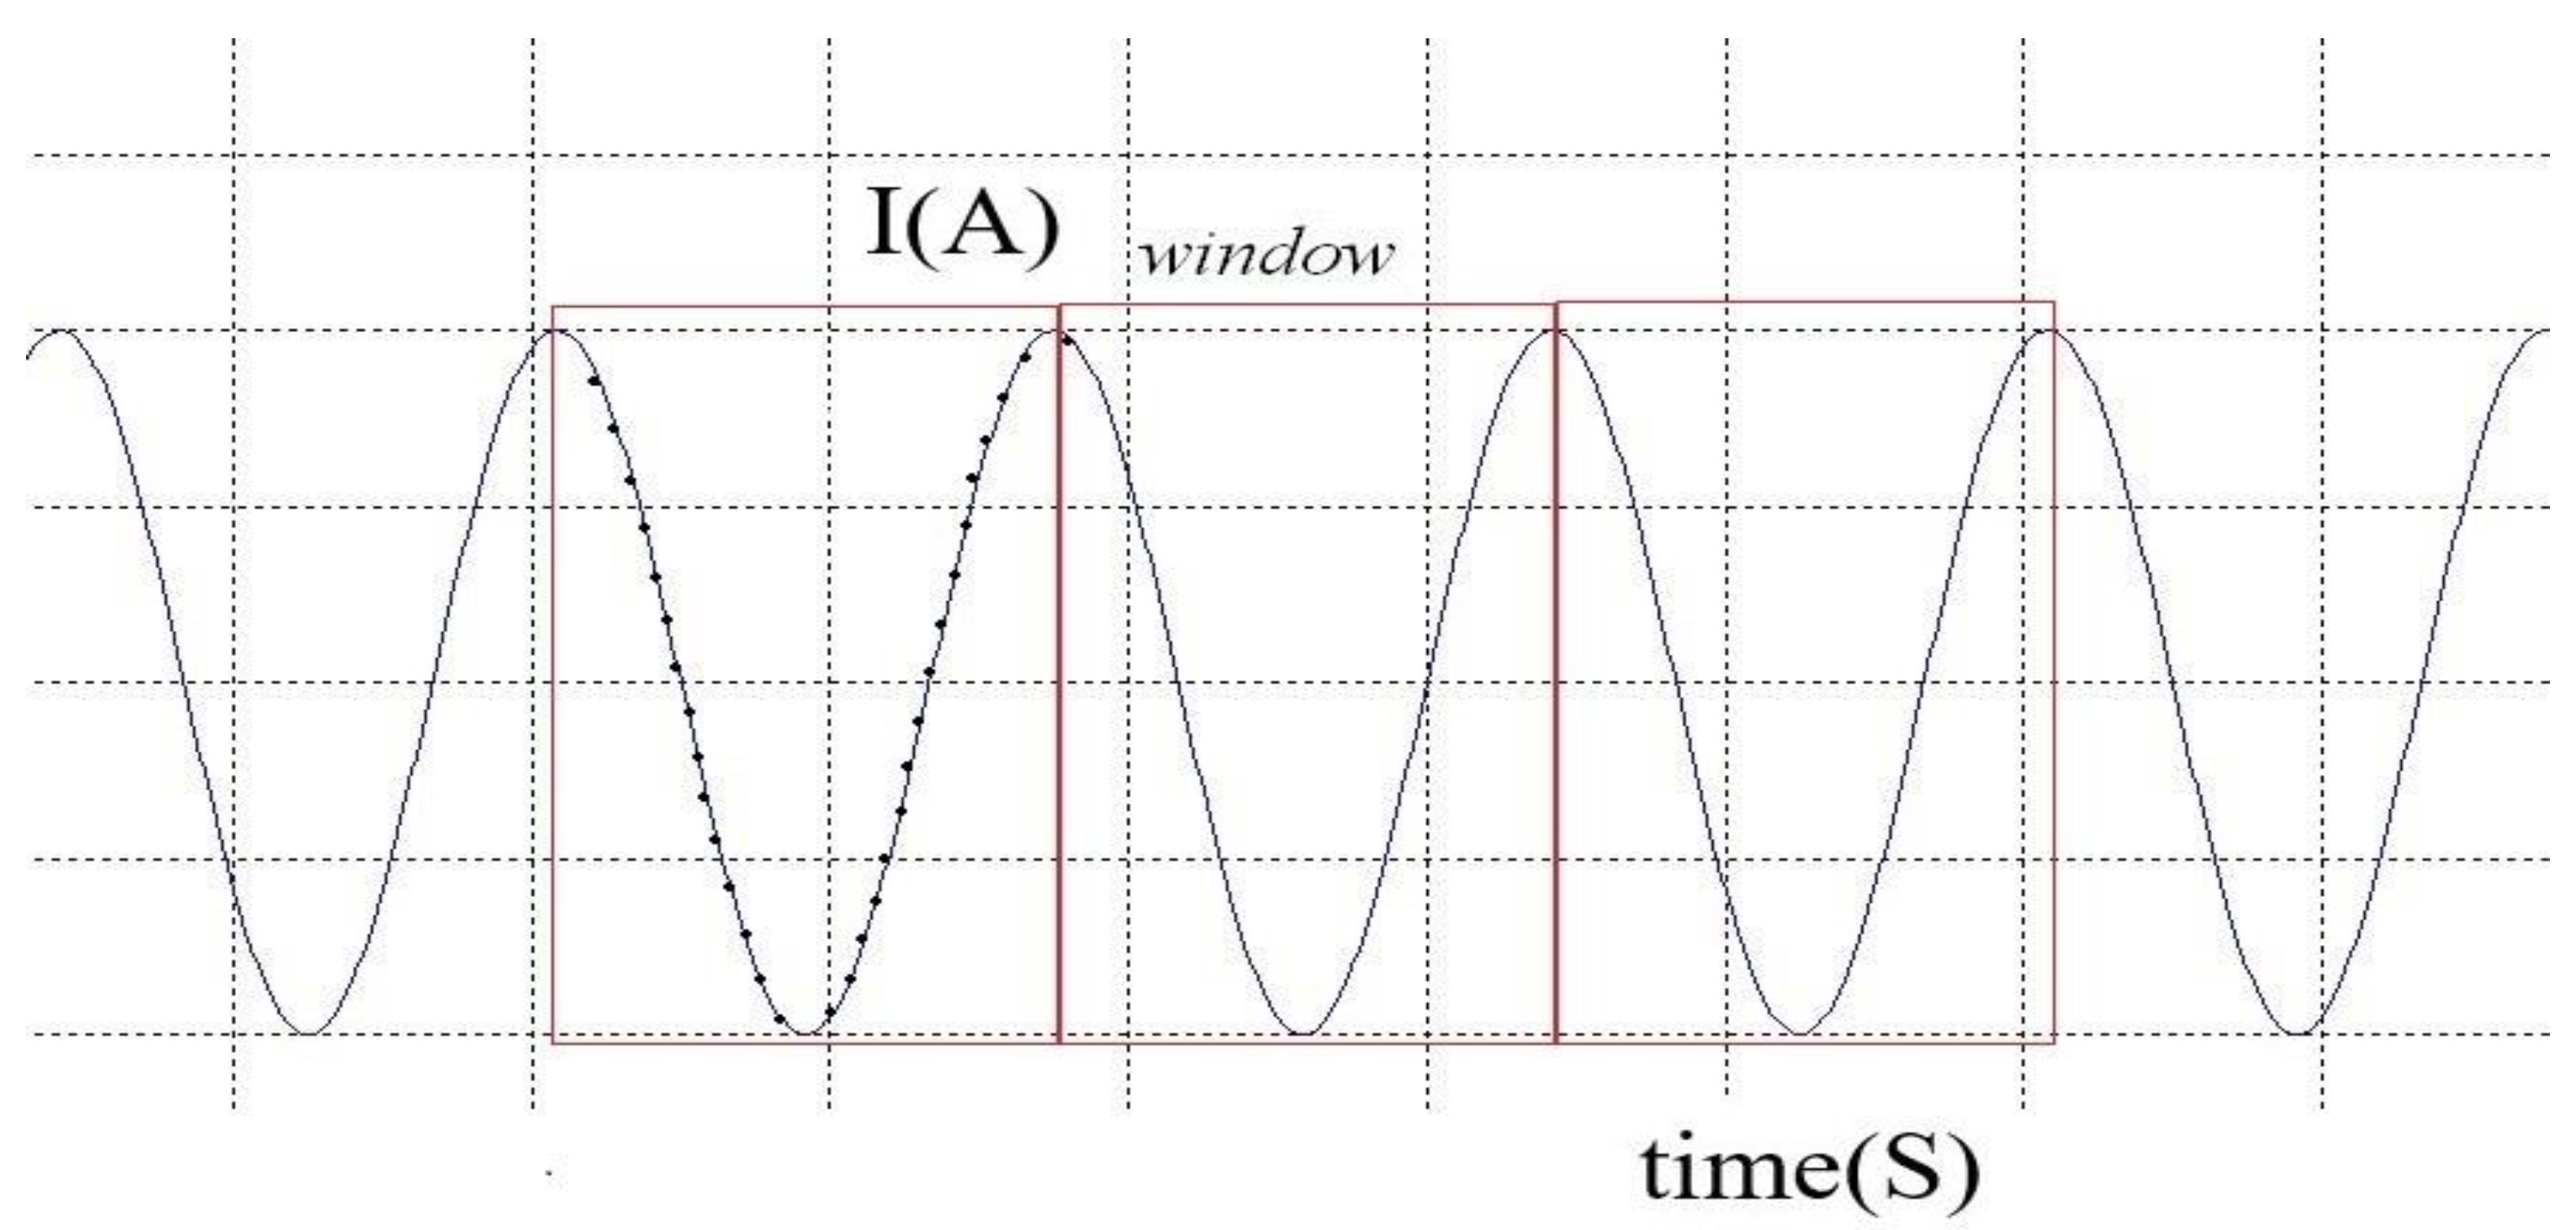
In order to calculate the components of the current waveform at the relaying point, the Prony method is used in a window according to
Figure 3.
Waveform components are calculated in one-cycle windows without overlap. It is better to choose the length of the windows and the number of damped sub-sinuses to reach an acceptable speed and desired accuracy.
An anti-aliasing filter is utilized to prevent the occurrence of similarity phenomena in the processing of current signals of phases a, b, and c [
35]. To satisfy the Nyquist equation, frequencies greater than half of the sampling frequency must be removed from all signals. Therefore, the cut-off frequency of the anti-aliasing filters should be set to less than half the sampling frequency. In practice, the filter cut-off frequency is set to one-third of the sampling frequency [
36]. The anti-aliasing filters utilized in this paper are low-pass butter-worth types commonly used in protection relays.
4. Proposed Algorithm
In this section, the proposed algorithm for fault detection during power swings is presented. As we know, the fault current is a damped sinusoidal waveform, and the current waveform of power swing is sinusoidal with a slip frequency between 0.3 Hz and 0.7 Hz. Therefore, the fault and power swing current waveforms have differences in their damping coefficient and frequency components. As mentioned in
Section 3, the Prony algorithm with its particular estimation method can extract signal components, such as frequency, amplitude, and damping coefficient in each window. Comparing these parameters can detect the fault during power swings. In the proposed method, the damping coefficient parameter extracted in each window is used. The steps of the proposed algorithm are as follows:
A: After the power swing occurs and the distance relay is blocked, the currents of all three phases, a, b, and c, are sampled with a frequency of 10 kHz. In regular operation, the currents of all three phases have a frequency of 60 Hz; however, during power swings, due to the dependency of frequency on the rotor speed, the frequency, voltage, and current during power swing are not constant, and the frequency has a value which is close to 60 Hz.
B: At this level, the current signals of all three phases in each window are processed with a length of one cycle and 167 samples based on the Prony method. Considering that both values of M and L are assumed to be equal to 6, by solving Equation (4), the value of the coefficients vector b is obtained. Finally, from Equations (6) and (7) in each window, 6 frequencies (), and six damping coefficients can be calculated. In this way, the main frequency in each window , which is close to 60 Hz and has the lowest damping coefficient, is identified.
C: Finally, the type of current can be determined by examining and comparing the amounts of damping coefficients of the main frequency
obtained in each window with the damping coefficient of the main frequency of the previous windows in each phase. In the window that fault occurs, the damping coefficient of the main frequency significantly increases compared with the damping coefficient of the main frequency during power swings (previous windows), which means that the main frequency is damped. High frequencies appear in the mentioned window. To determine the threshold value, the comparison of the damping coefficients of the main frequency
of each window in different conditions of power swing according to
Table 1 and
Table 2 has been utilized. Considering all the damping coefficients obtained from various simulations in
Table 2 and
Table 3, the threshold value is assumed to be 12. If at least during each phase the damping coefficient of the main frequency in each window is greater than the threshold, it means that a fault occurs during the power swing, and the relay must be unblocked.
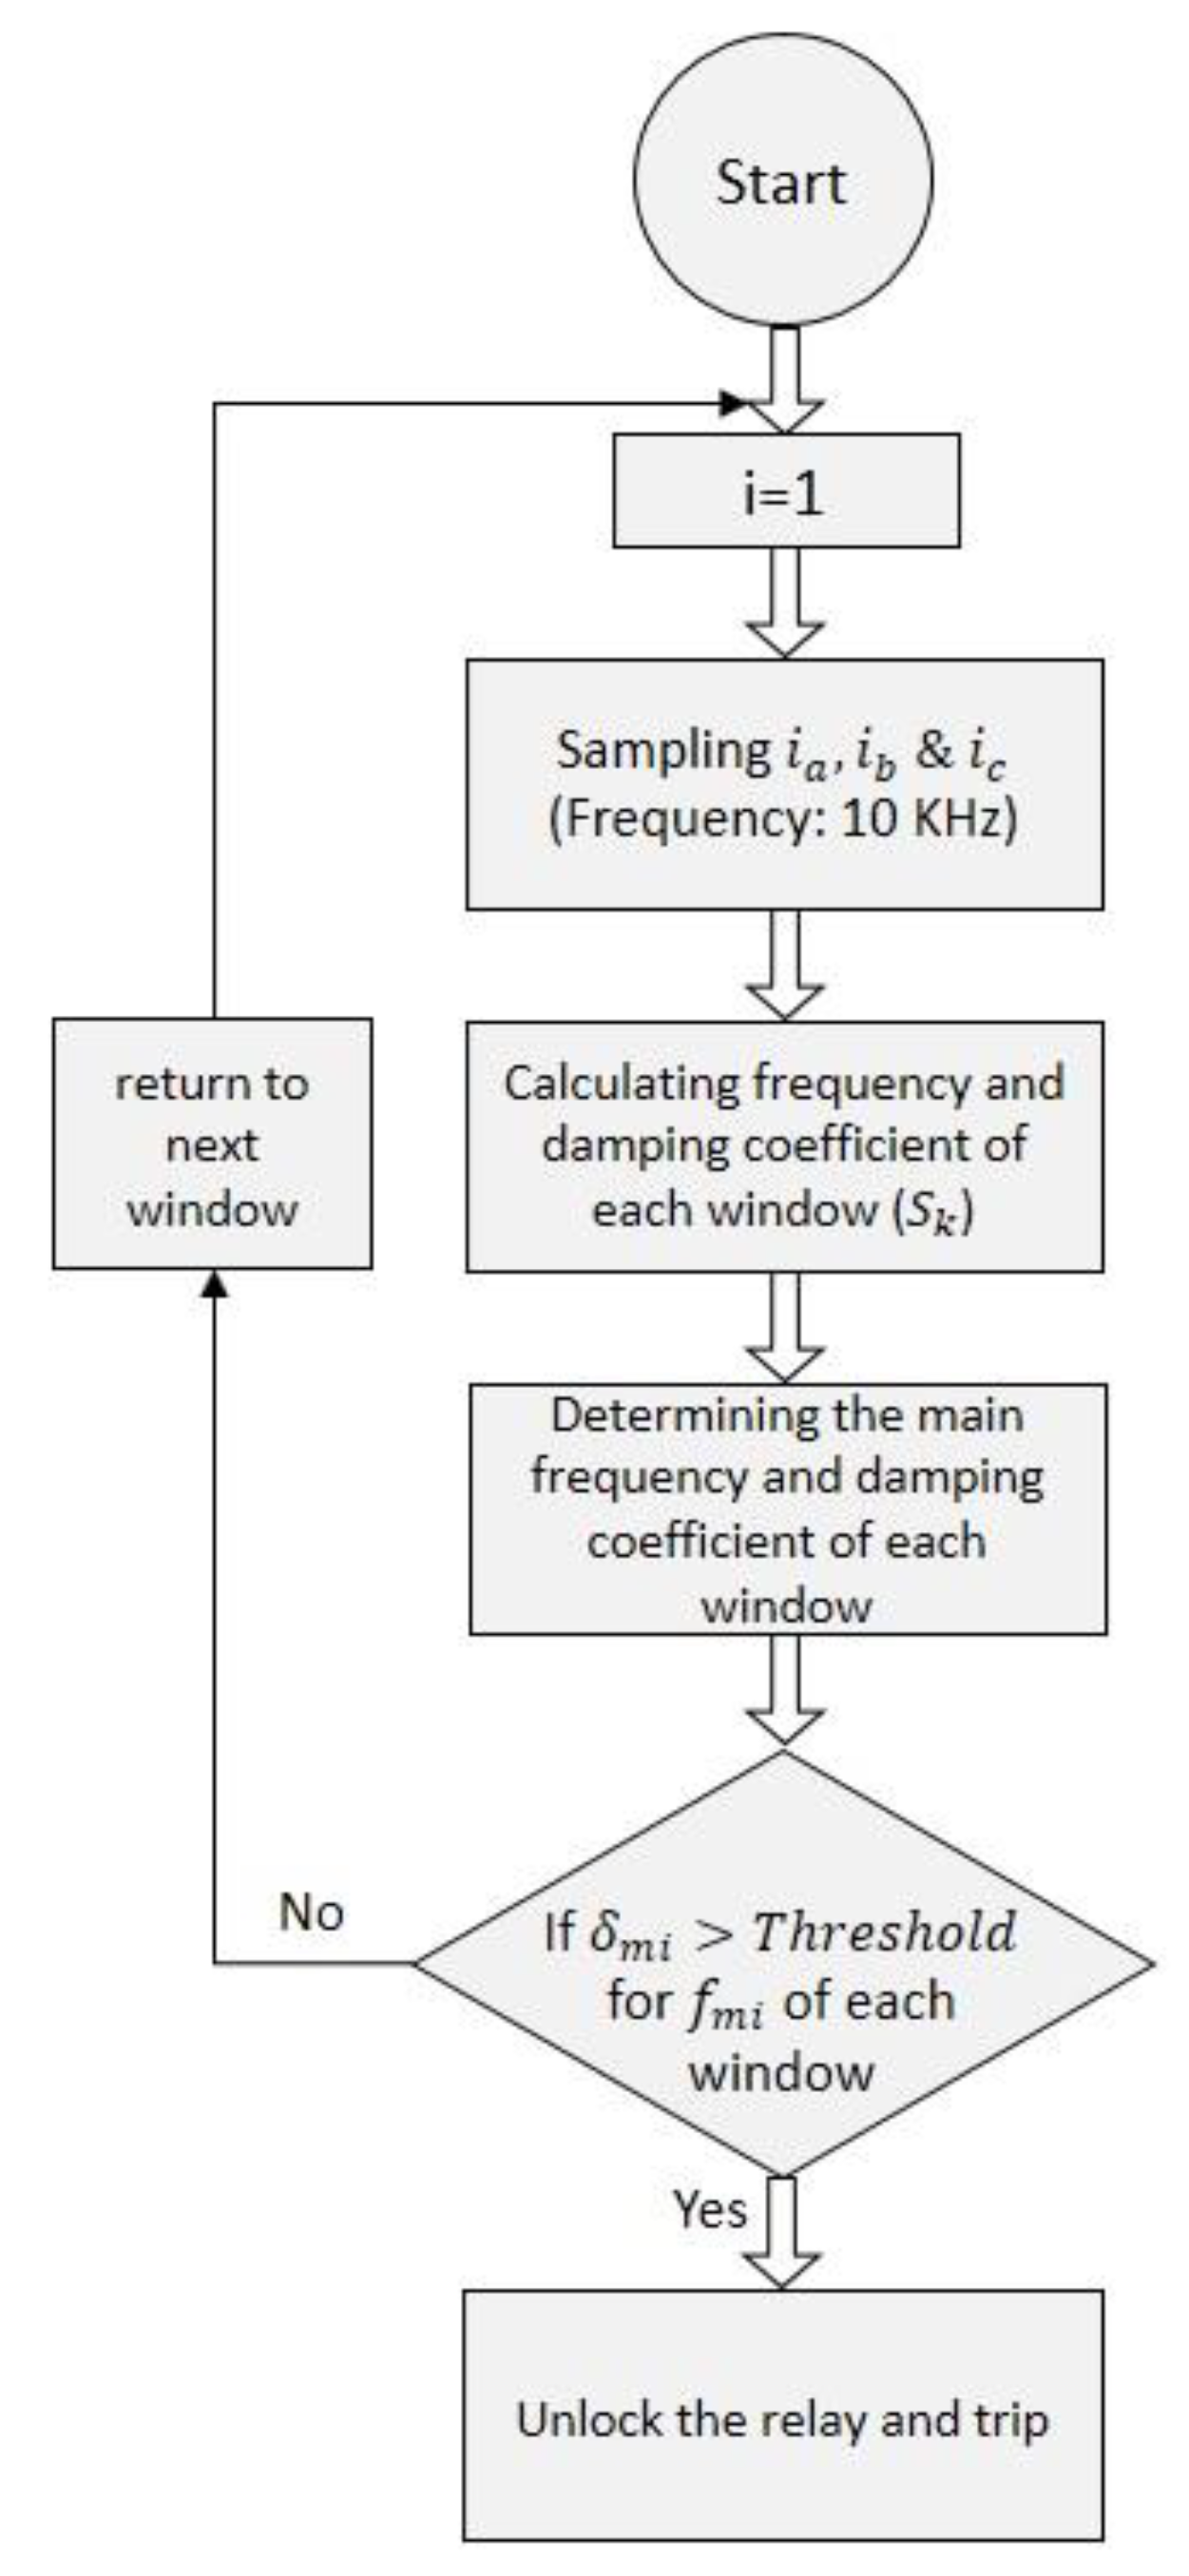
Figure 4 shows the flowchart of the proposed algorithm.
and
in the algorithm are the main frequency, and its damping coefficient in the
window, respectively.
5. Results
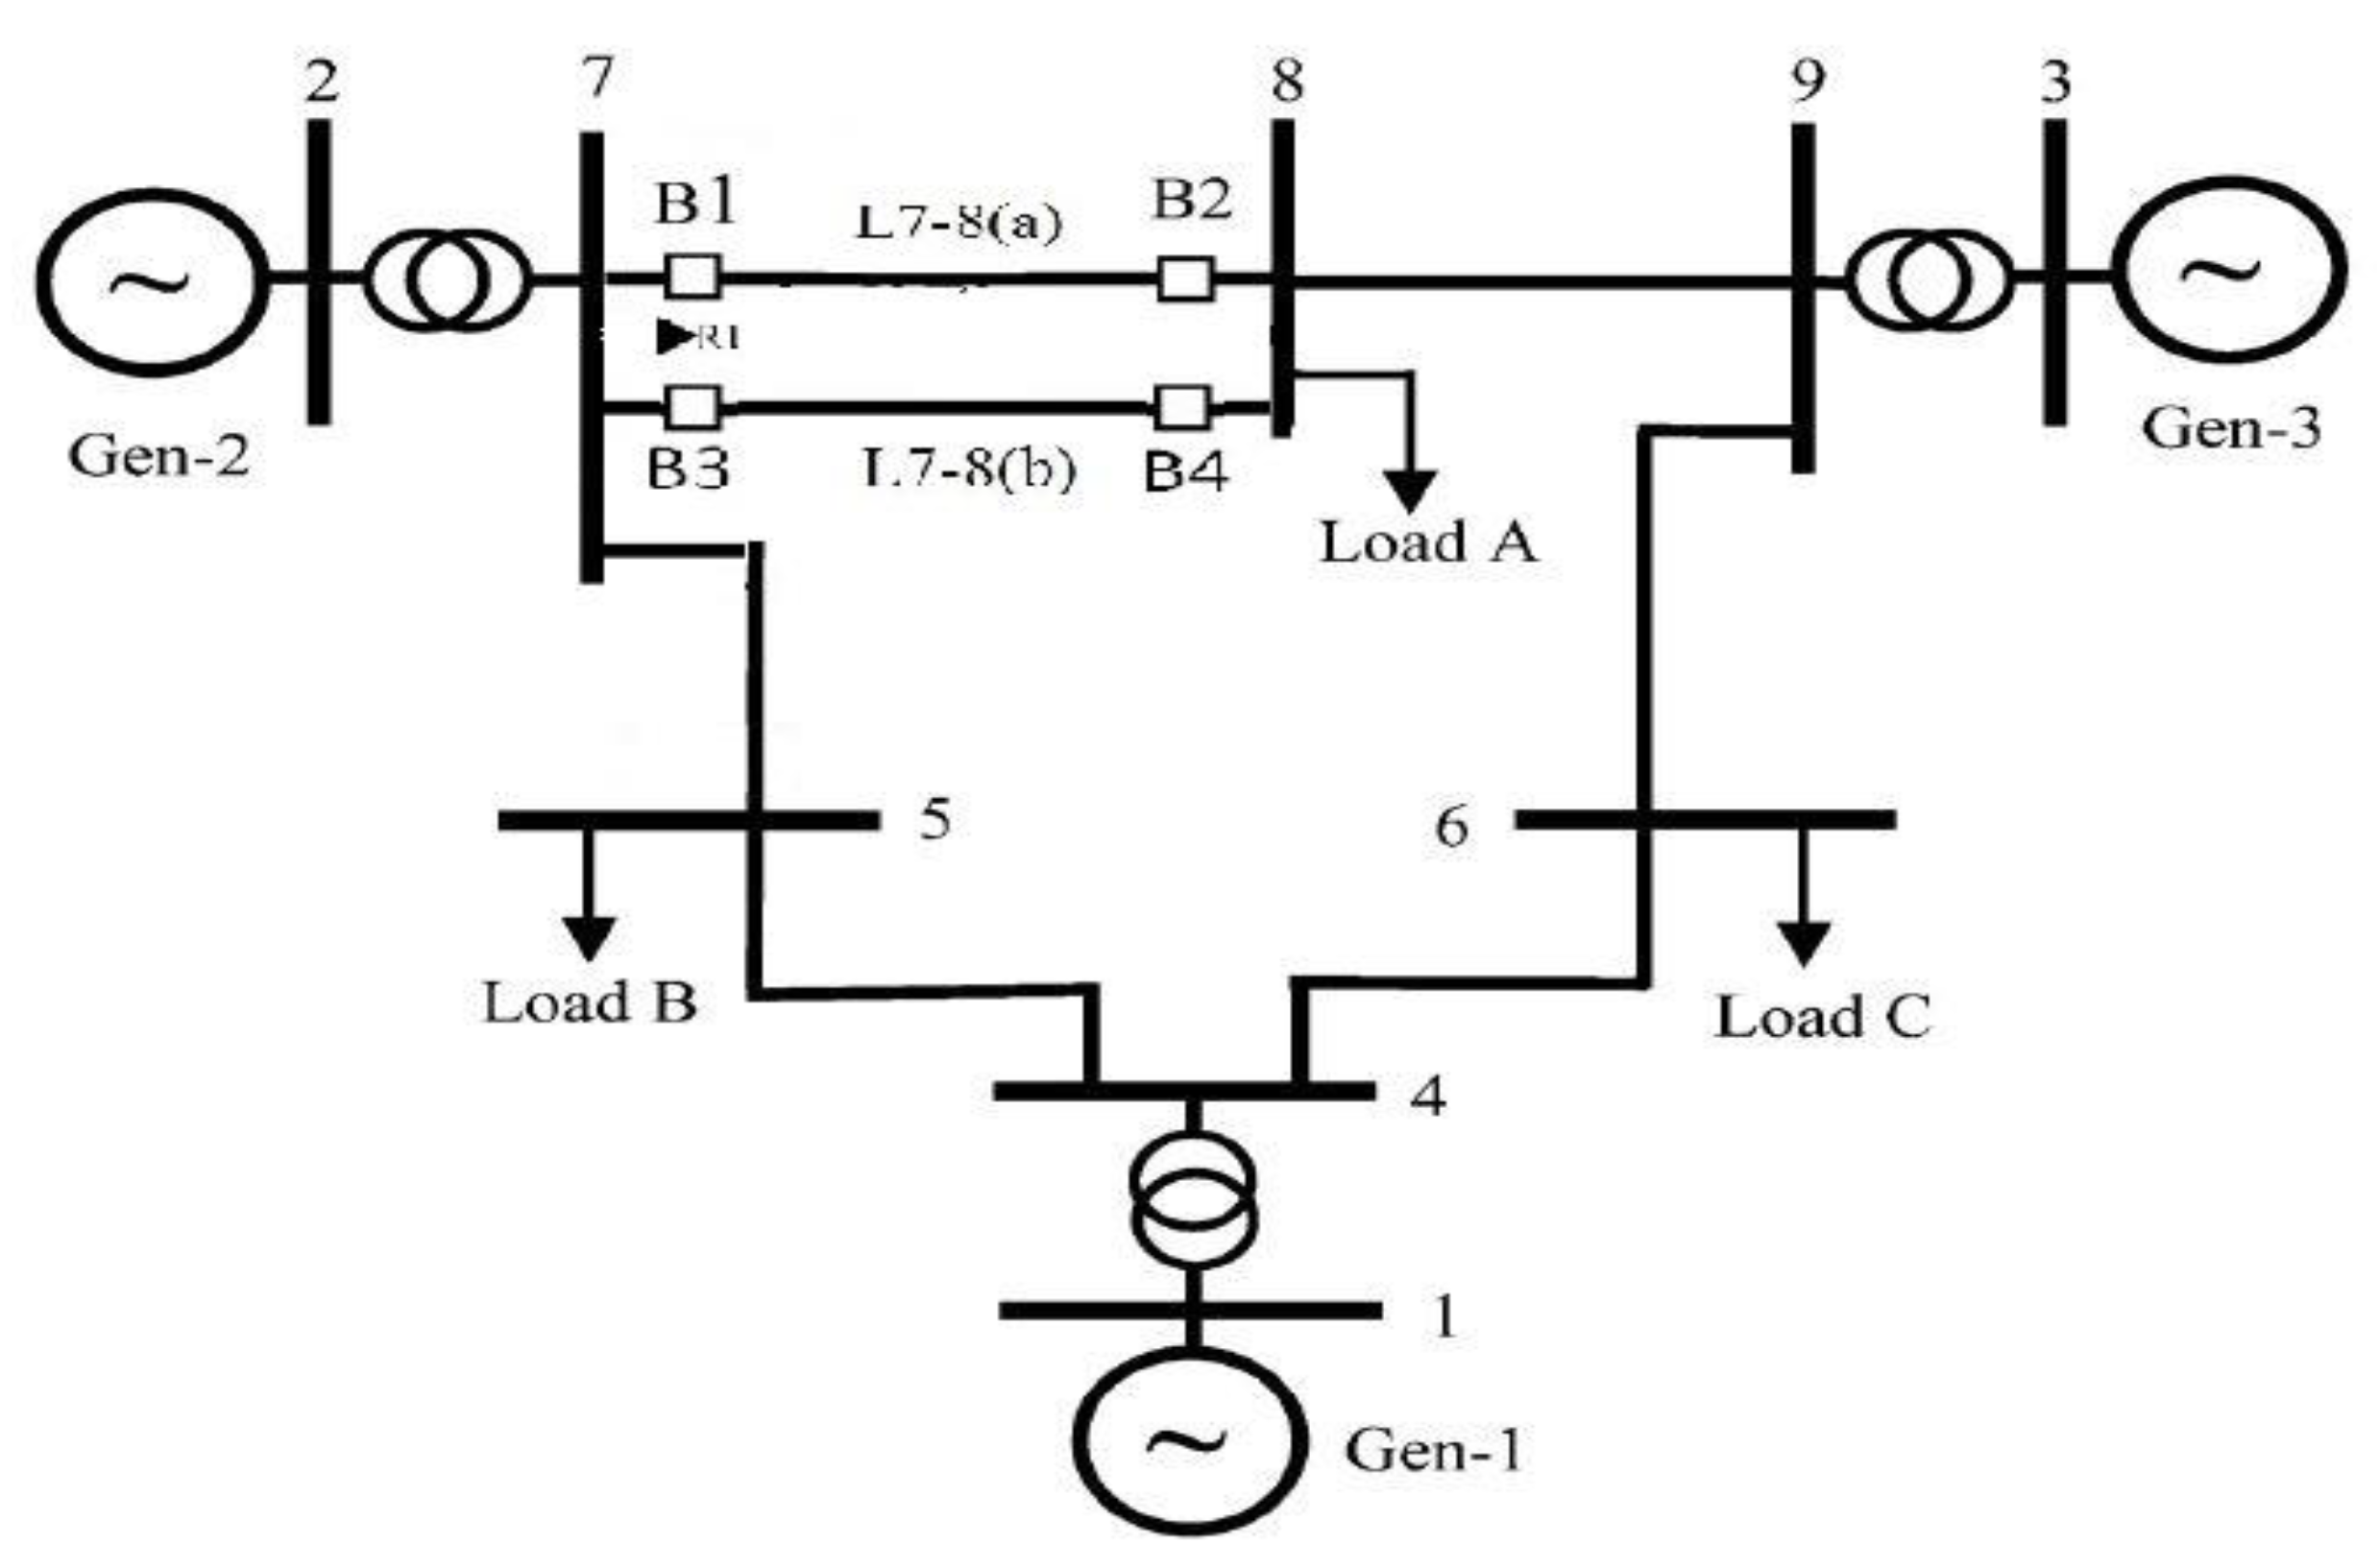
To evaluate the performance of the proposed method, a 9-bus 230 kV transmission grid is modeled in DIgSILENT software 15.7, DIgSILENT GmbH (Gomaringen, Gomaringen) according to
Figure 5. The most important point in the implementing of the proposed method is accuracy and non-saturation of current that seen by distance relay. According to the results of load flow studies and short circuit studies, ideal specification for CT is 5p20/30VA. The R1 distance relay is selected for the study (is the case study). After a fault occurs at t = 0.7 s in line 7–8(b) and tripped at t = 1 s, a power swing occurs in line 7–8(a), and relay R1 blocked.
The fault resistance value for various faults is determined using [
13]. It should also be noted that the fault resistance value for three-phase faults is minimal and less than 1 ohm, but for asymmetrical faults is larger.
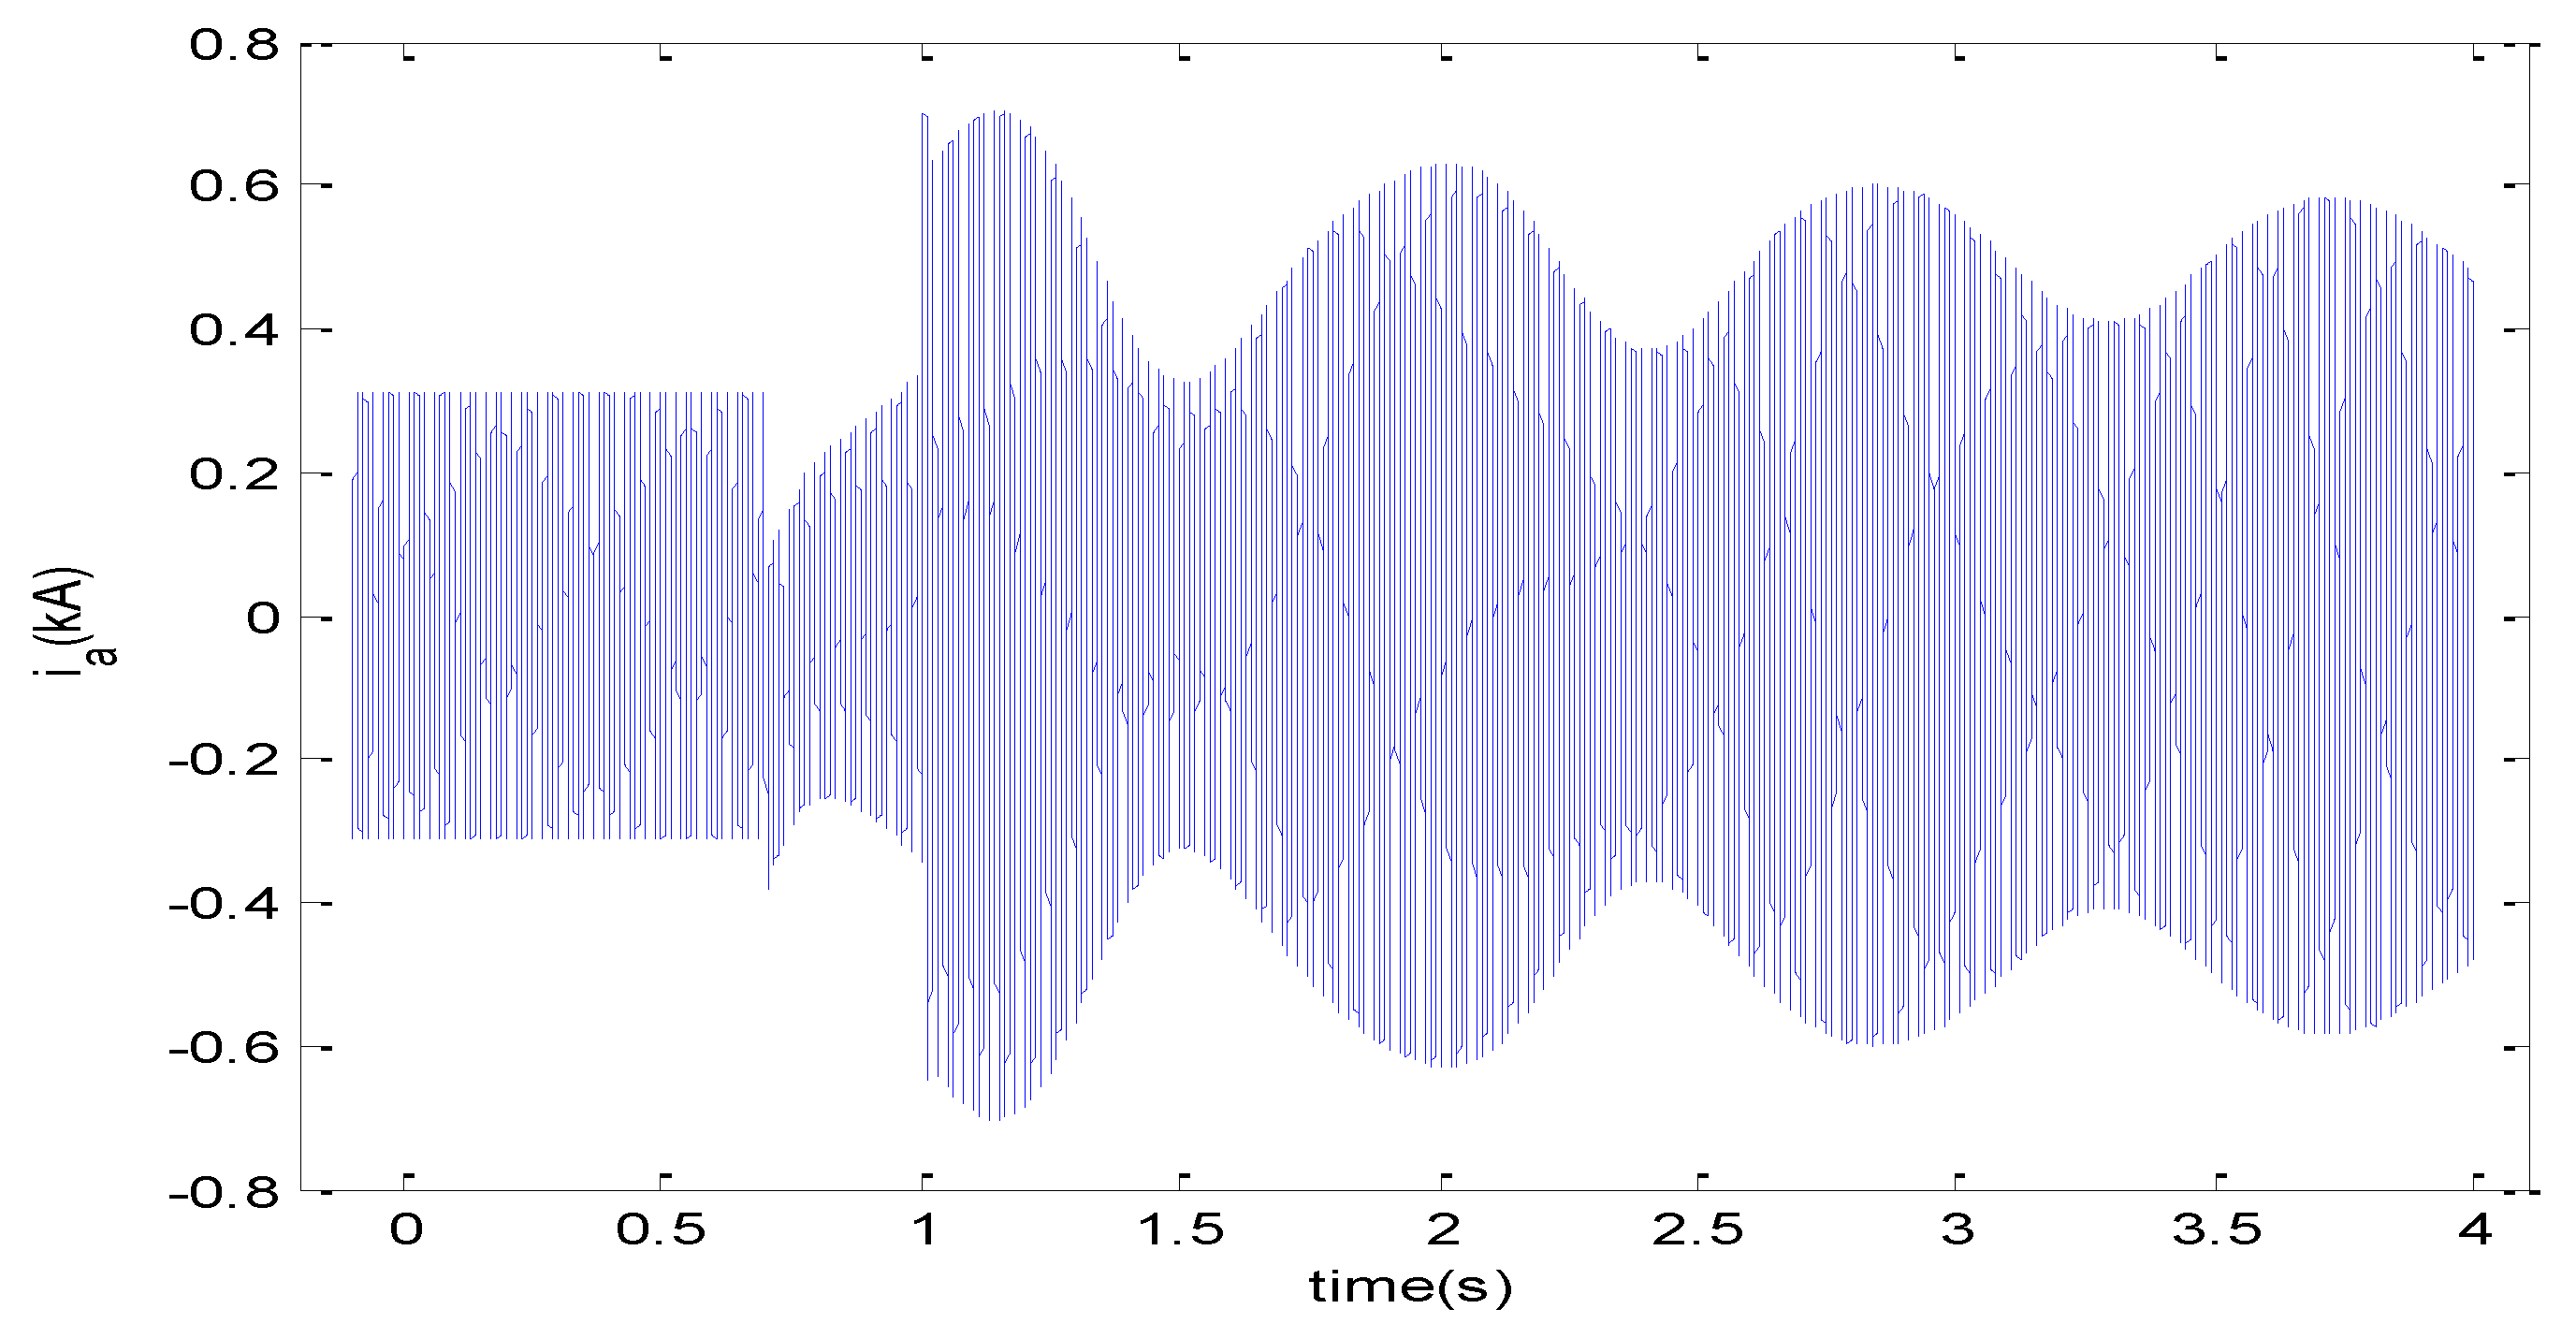
The sampling frequency is 10 kHz, and the length of each window is one cycle and 166 samples. The current waveform of phase A at the location of relay R1 during the power swing, is shown in
Figure 6.
As shown in
Figure 6, when a fault occurs, the amount of fault current is detectably more significant than the amount of current associated with the power swing. However, this component cannot be used to detect the fault; since during the fault, high-frequency harmonics in the current and voltage appear, which is the main specification of the fault. Also, the current amplitude during the fault depends on various factors, including fault resistance, so it is not a suitable and reliable parameter for fault detection. However, in the Prony method, the fault can also be detected from the main frequency amplitude parameter (
).
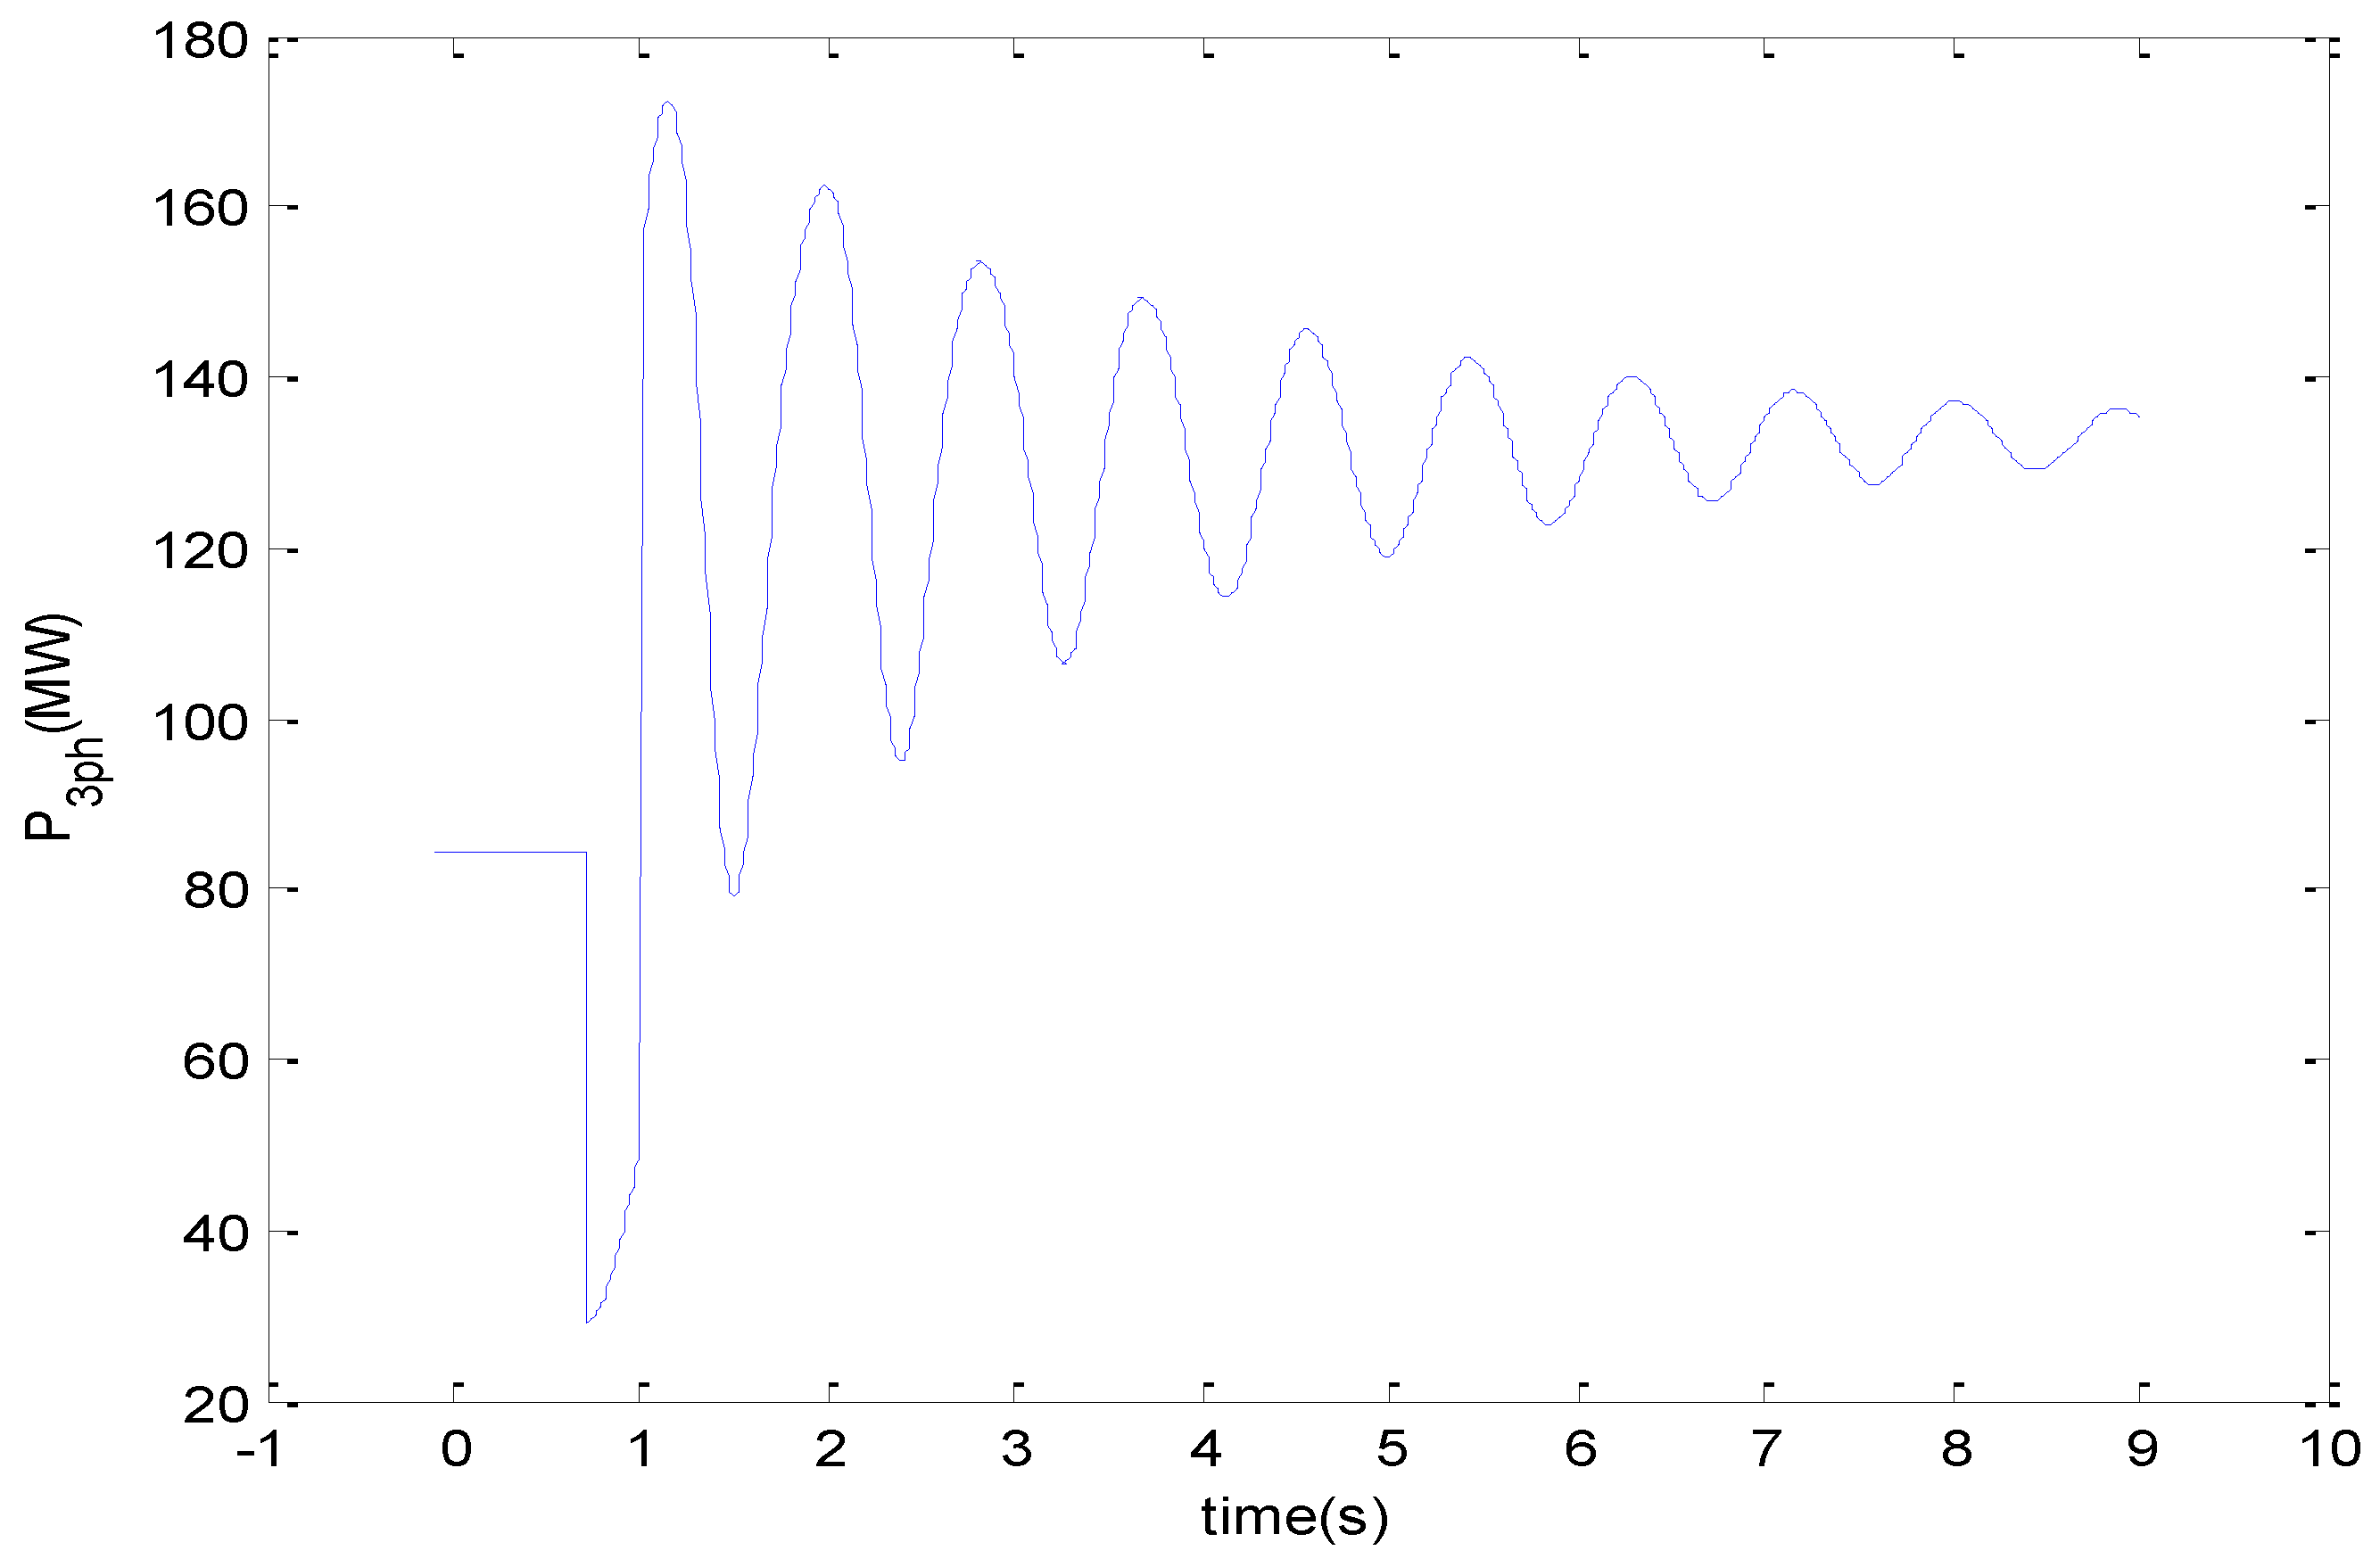
Figure 7 shows the three-phase power curve from 7–8(a). After disconnection of line 7–8(b) and the occurrence of a power swing, the power also reaches a steady state, and the power swing becomes stable.
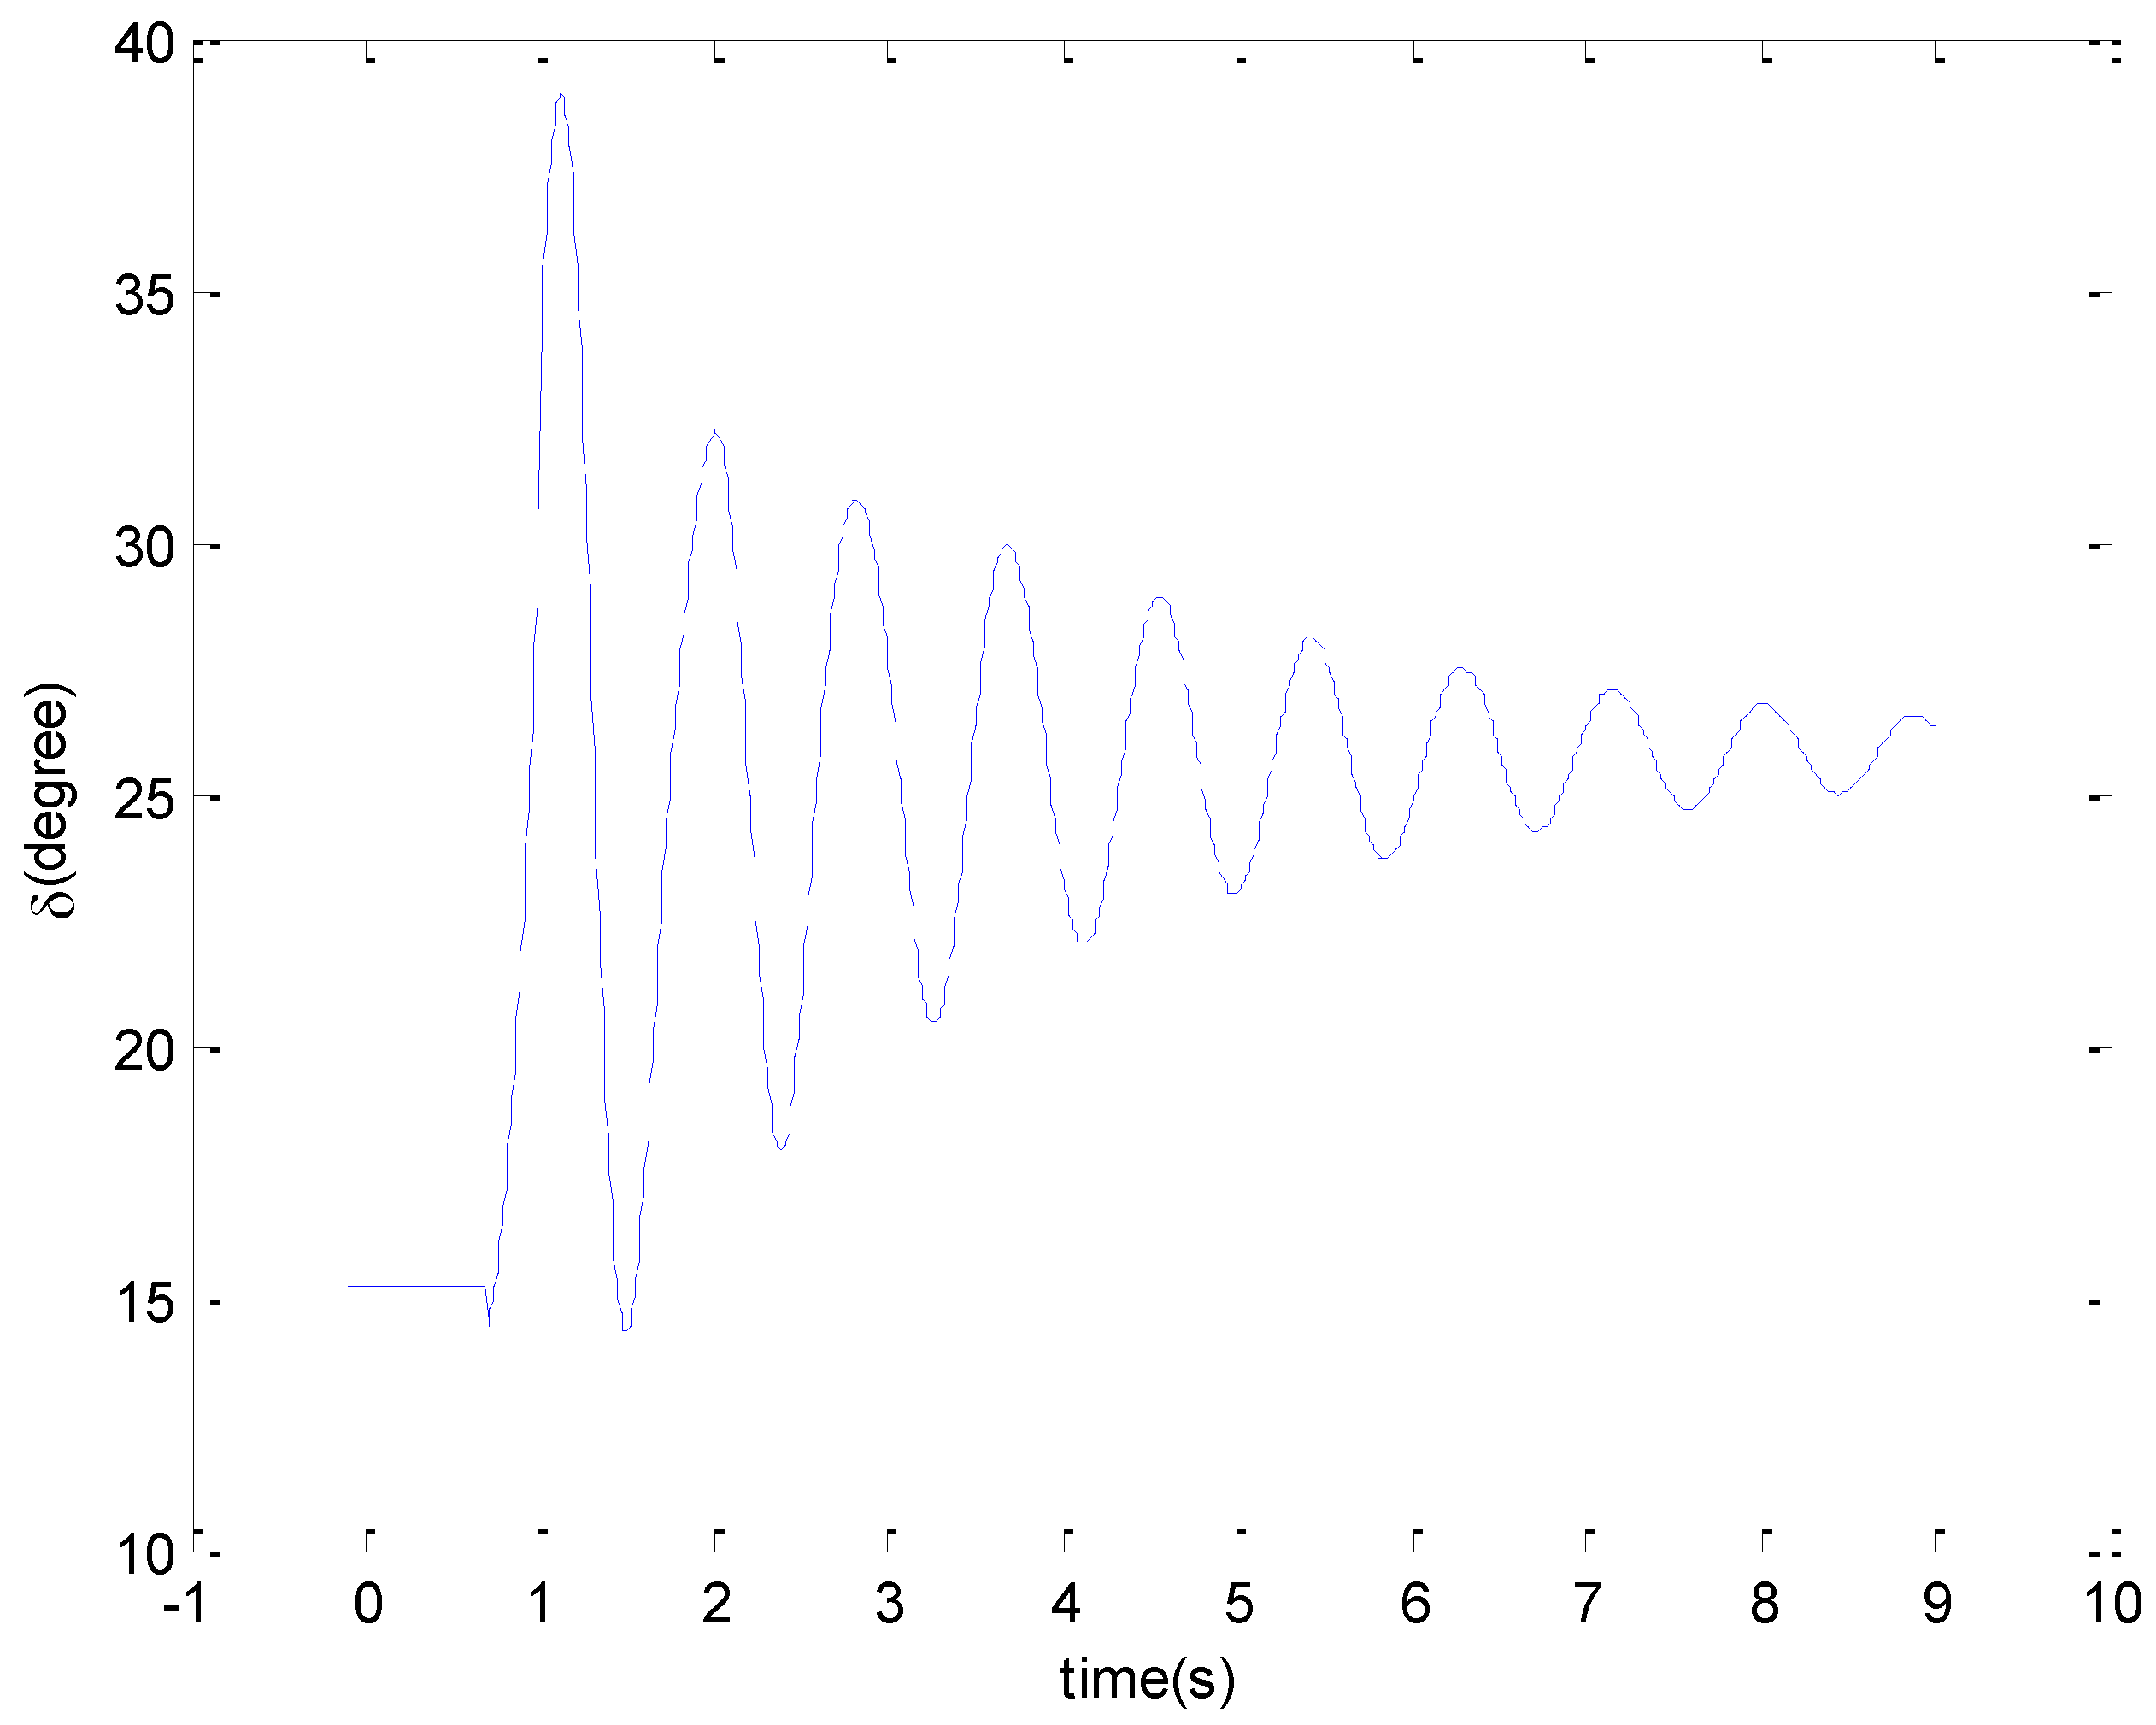
Figure 8 shows the variations in the voltage angle difference between buses 7 and 8. After disconnection of line 7–8(b), the voltage angle difference between the two buses fluctuates but eventually converges to 25° and becomes stable.
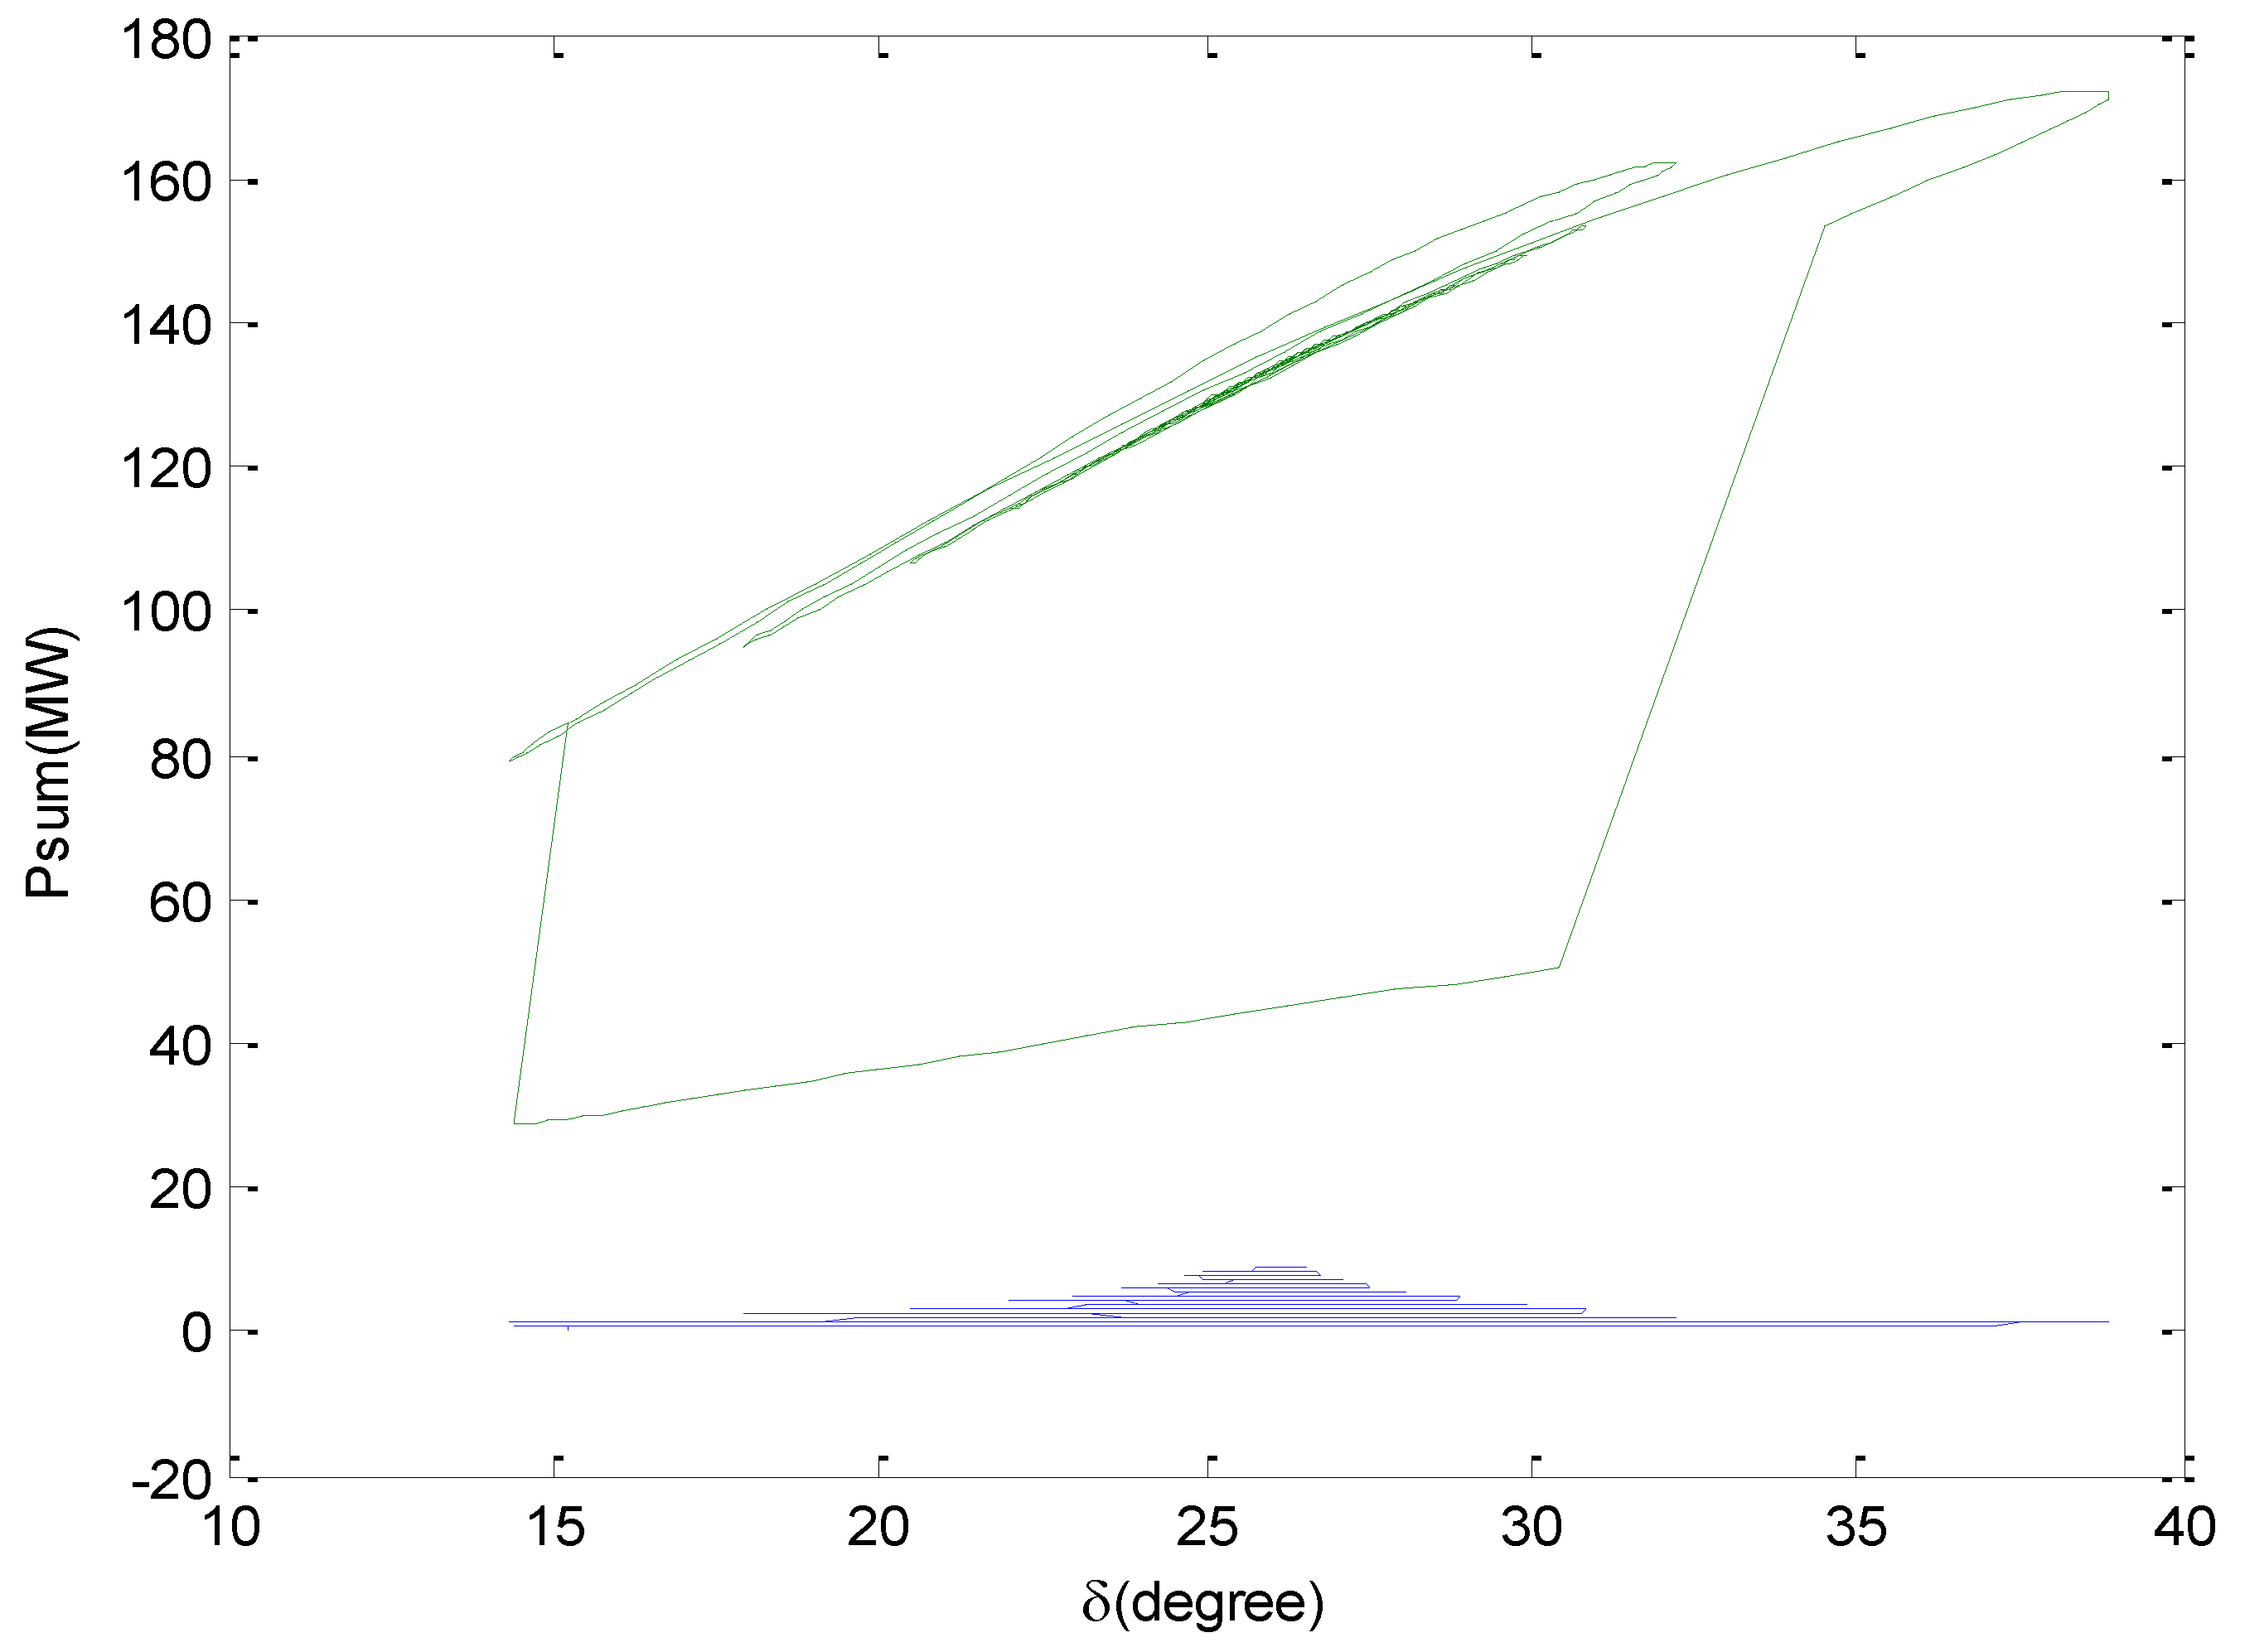
Figure 9, which is a combination of
Figure 7 and
Figure 8, illustrates the variations in three-phase power in the line 7–8(a) relative to the variations in the phase angle difference. As can be seen, after the disconnection of line 7–8(b) at t = 1 s, the phase angle difference (
) swings from 15° and converges to 25° (new operating point). Additionally, the three-phase power swings from 80 MW and converges to 120 MW, resulting in stable power swing.
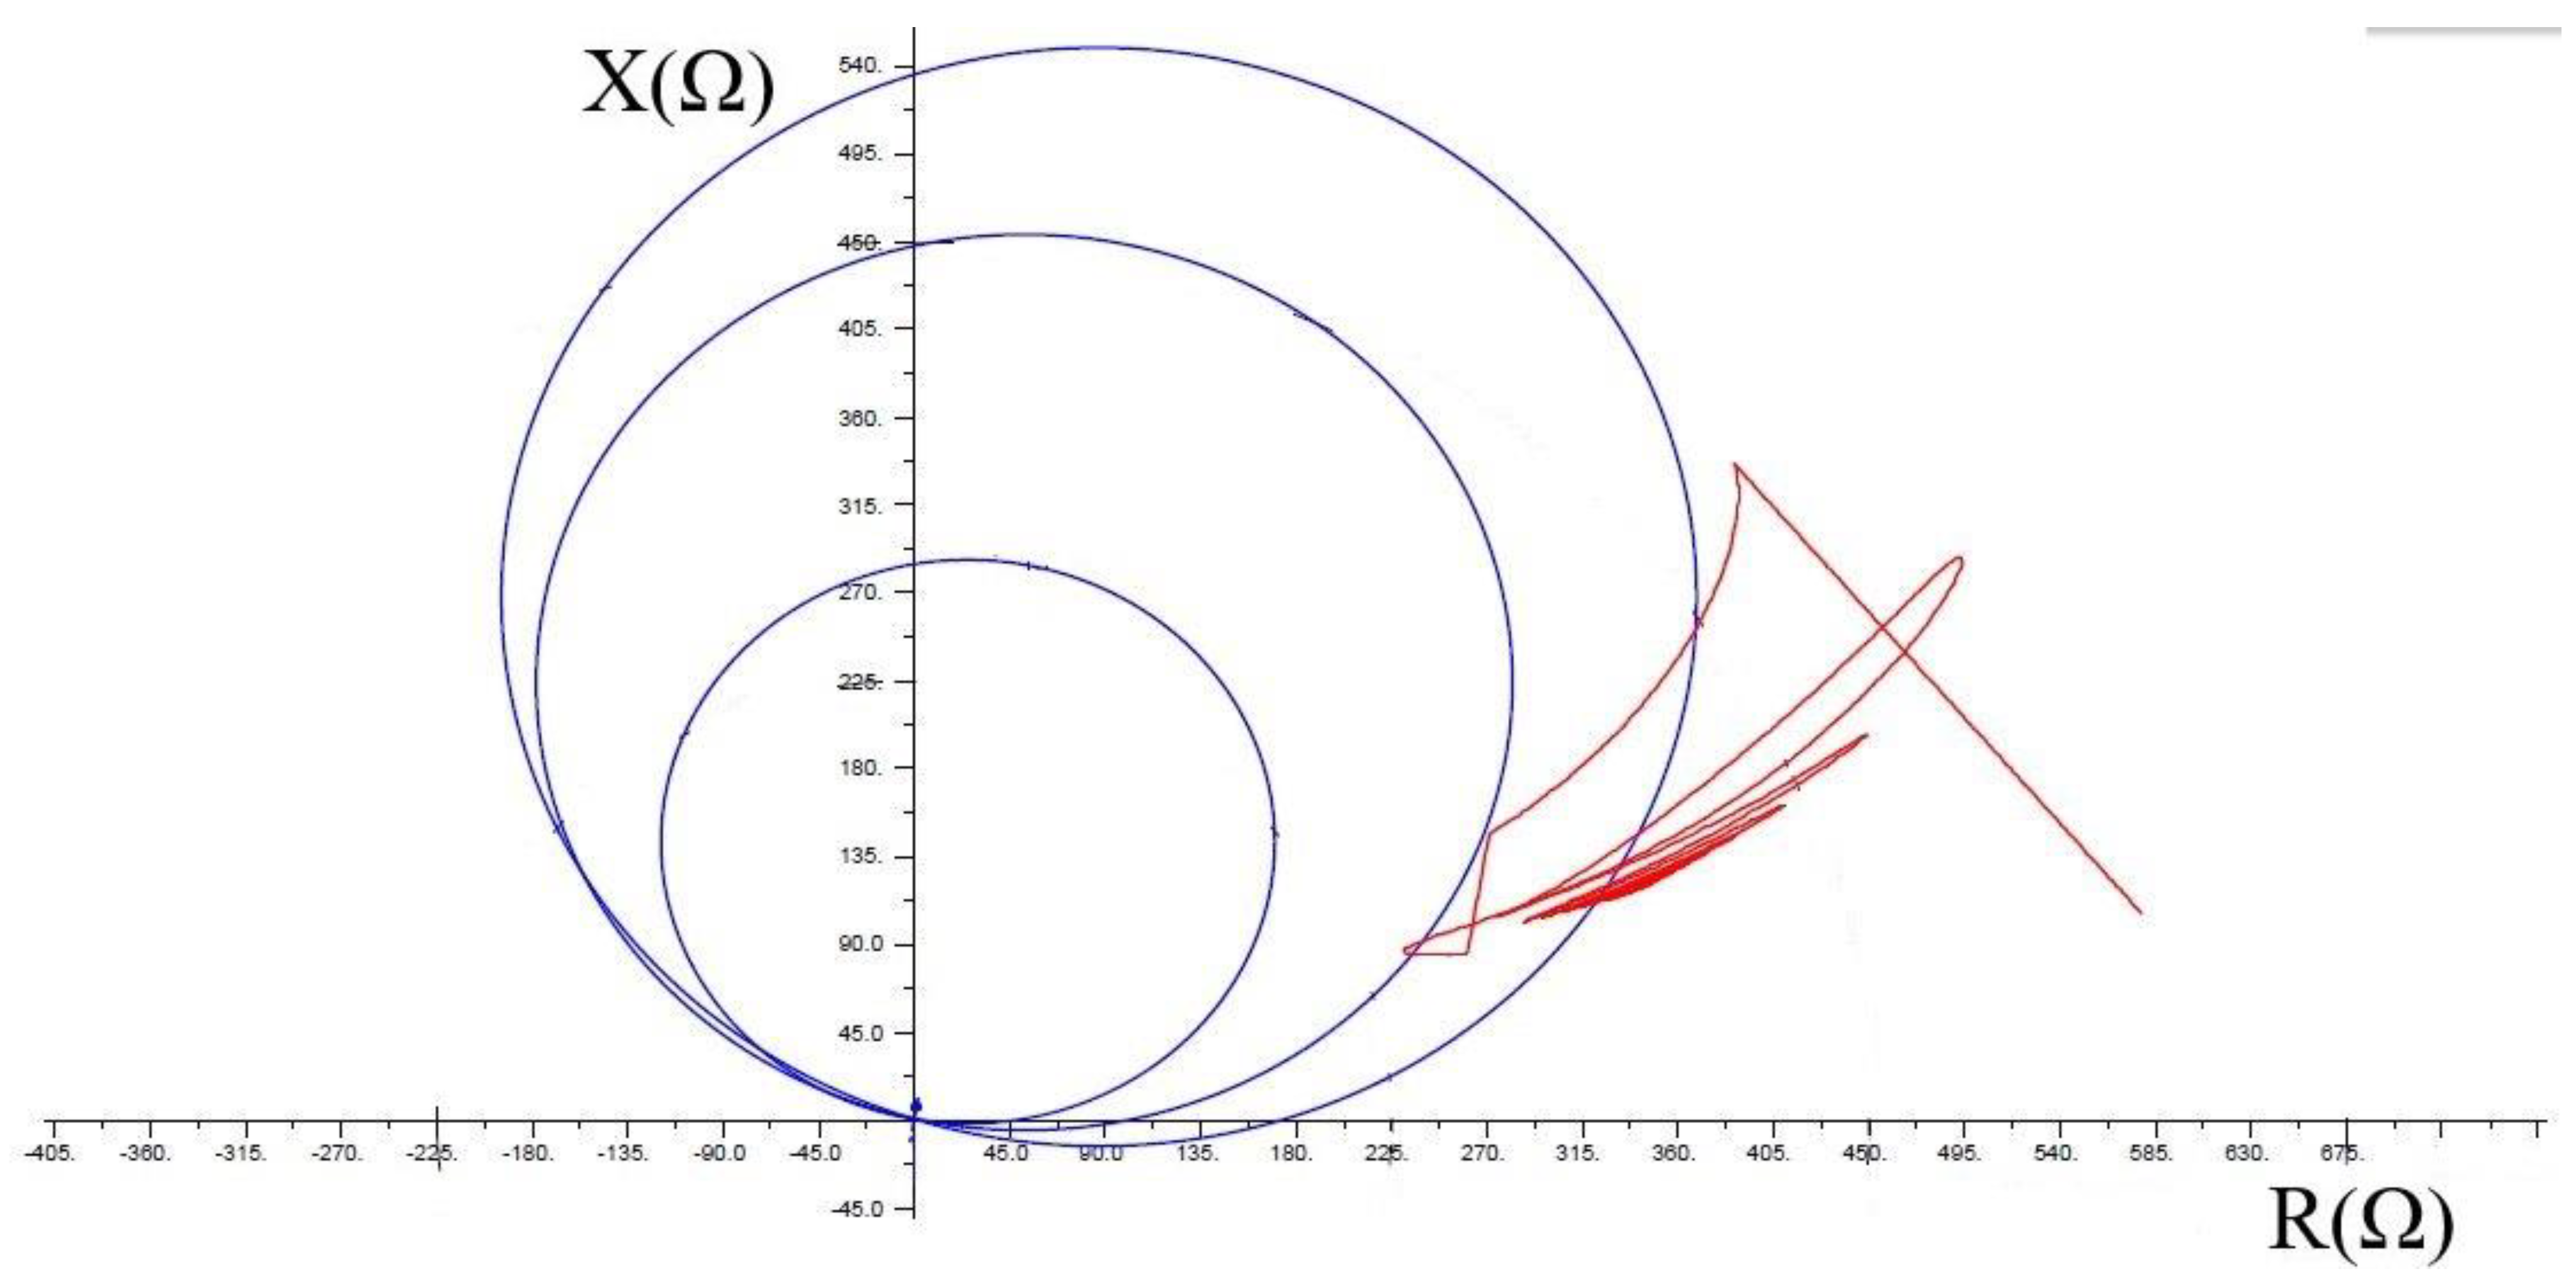
By adjusting the triple zones of the distance relay R1, as shown in
Figure 10, after the power swing occurs, the impedance seen by R1 swings between zones 2 and 3 of the relay and eventually converges to a specific value. By activating the PSB zone, the relay correctly detects power swing and blocks to prevent system instability.
When the voltage angle difference between the two end buses equals the minimum, the voltage reaches the maximum value, and the current reaches the minimum value. When the voltage angle difference between the two buses is maximum, the current reaches a maximum value, and the voltage reaches a minimum value [
37].
When the voltage angle difference between the two buses is maximum, the current reaches a maximum value, and the voltage reaches a minimum value [
37]. Since the system frequency depends on the rotor speed, the voltage and current frequencies during the power swing are not constant. According to
Figure 6, the maximum current frequency depends on the speed of power angle variations between the two regions and is called the “slip frequency.” The magnitude of slip frequency in a slow swing is between 0.3 Hz and 3 Hz and in a fast swing is between 4 Hz and 7 Hz [
37]. Suppose a fault occurs when δ is at the maximum value. In this case, the variation in the current signal is negligible due to the proximity of the current value during the power swing to the fault current value. Furthermore, the farther points from the relay and in a situation where the value of δ is very much, fault detection is complex [
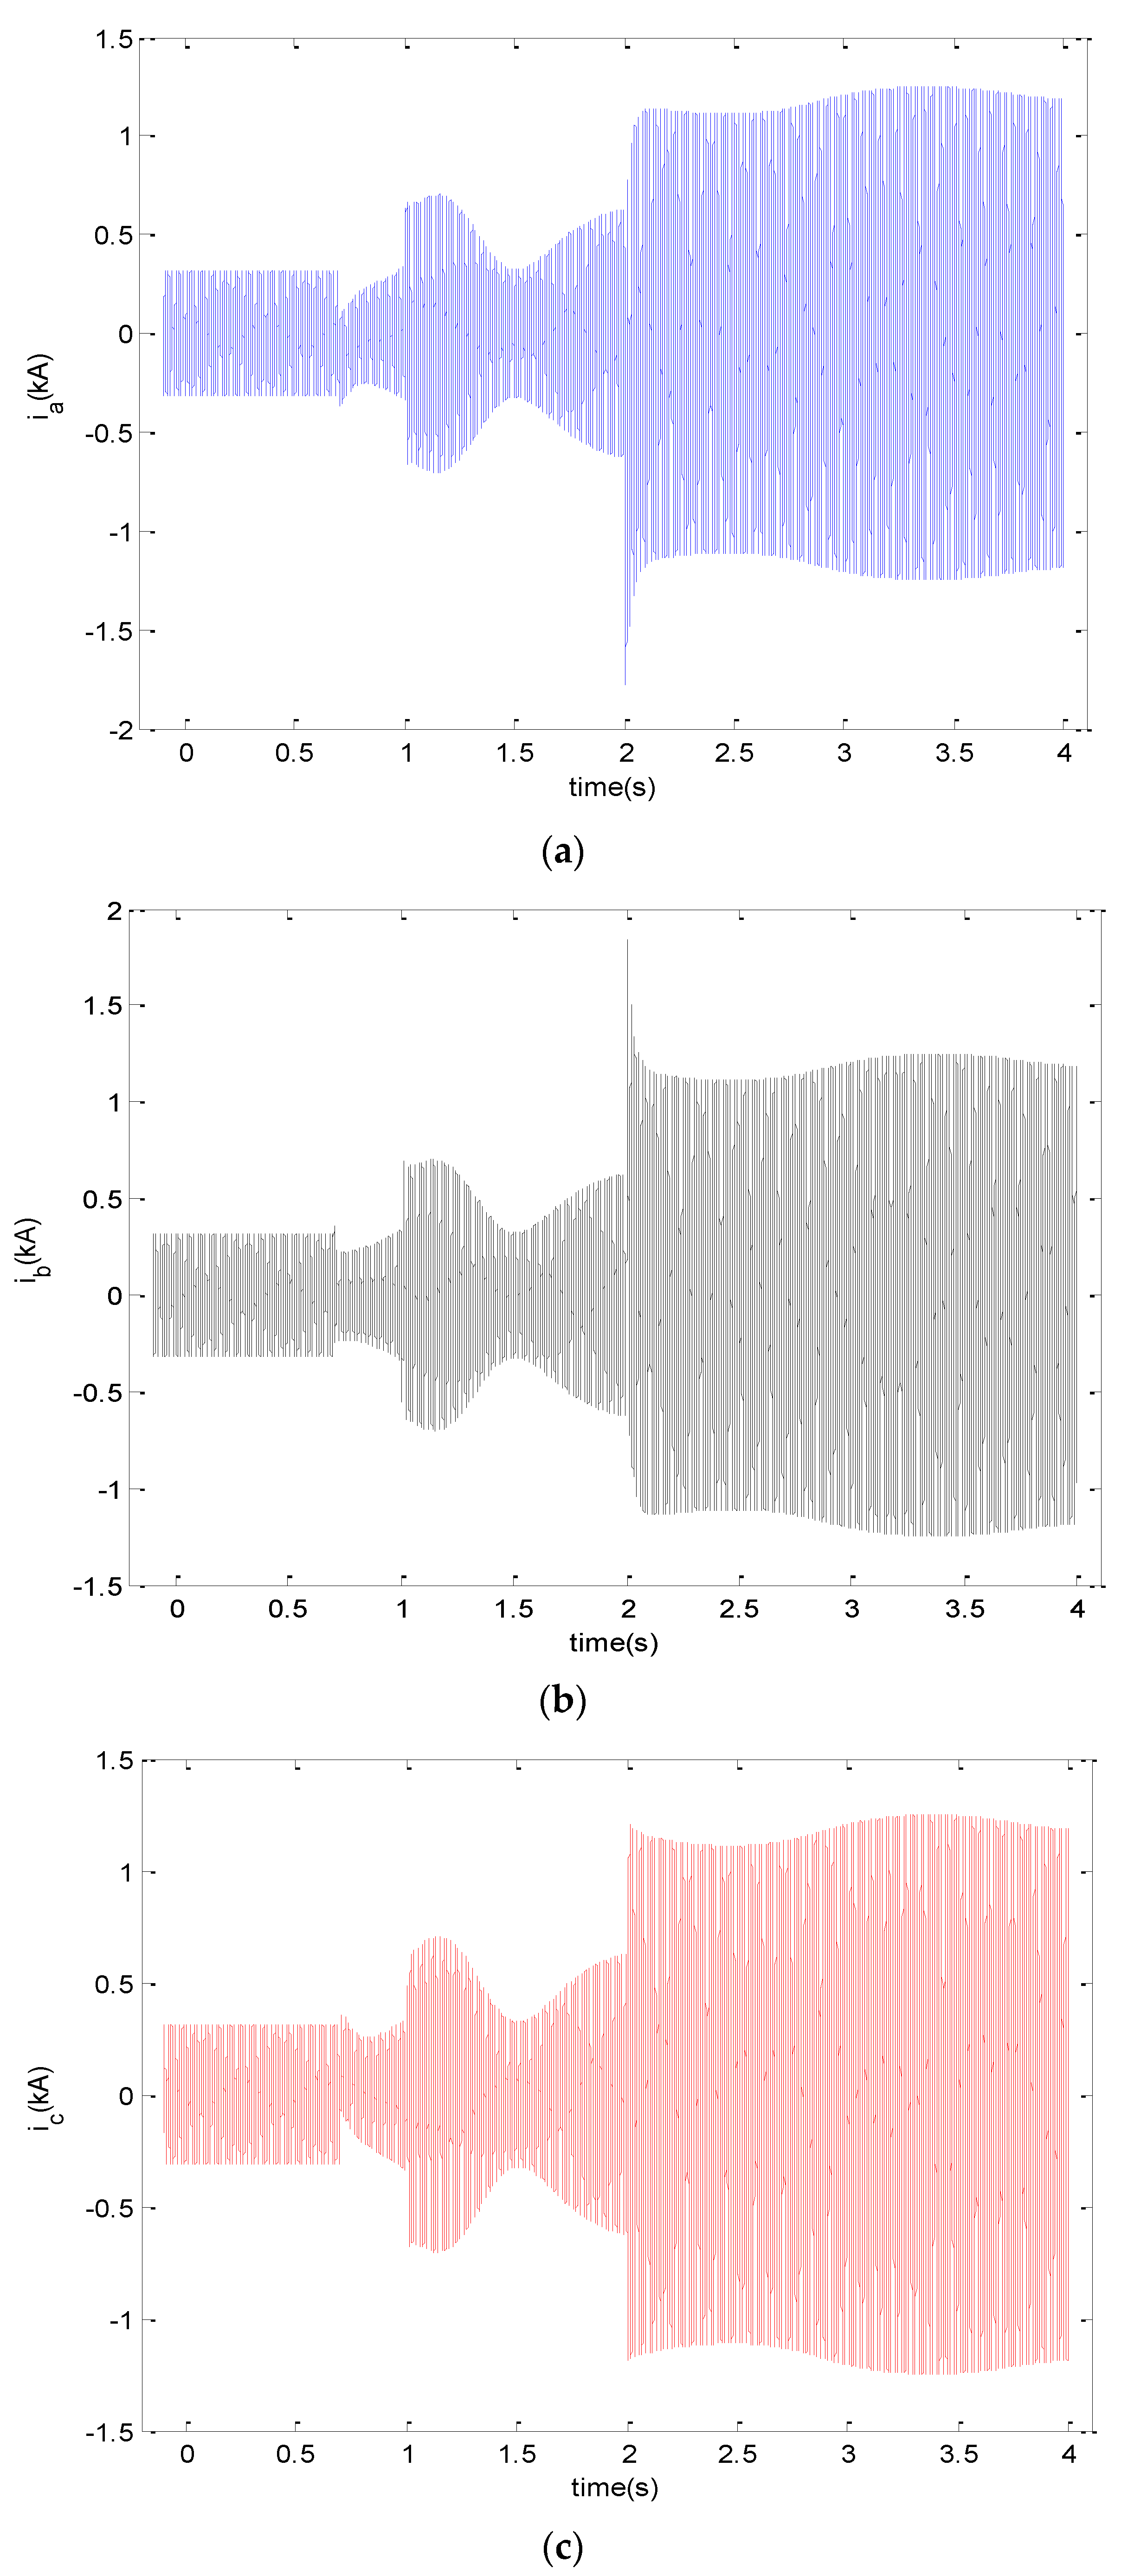
13]. In order to check the correct operation of the proposed algorithm in critical conditions, the different types of faults, according to
Table 1, have been applied to different intervals of the line 7–8(a) at t = 2 s and δ = 33. The three-phase current for item 1 is as follows:
The proposed algorithm is activated after the power swing occurs at t = 1 s and the R1 relay blocked.
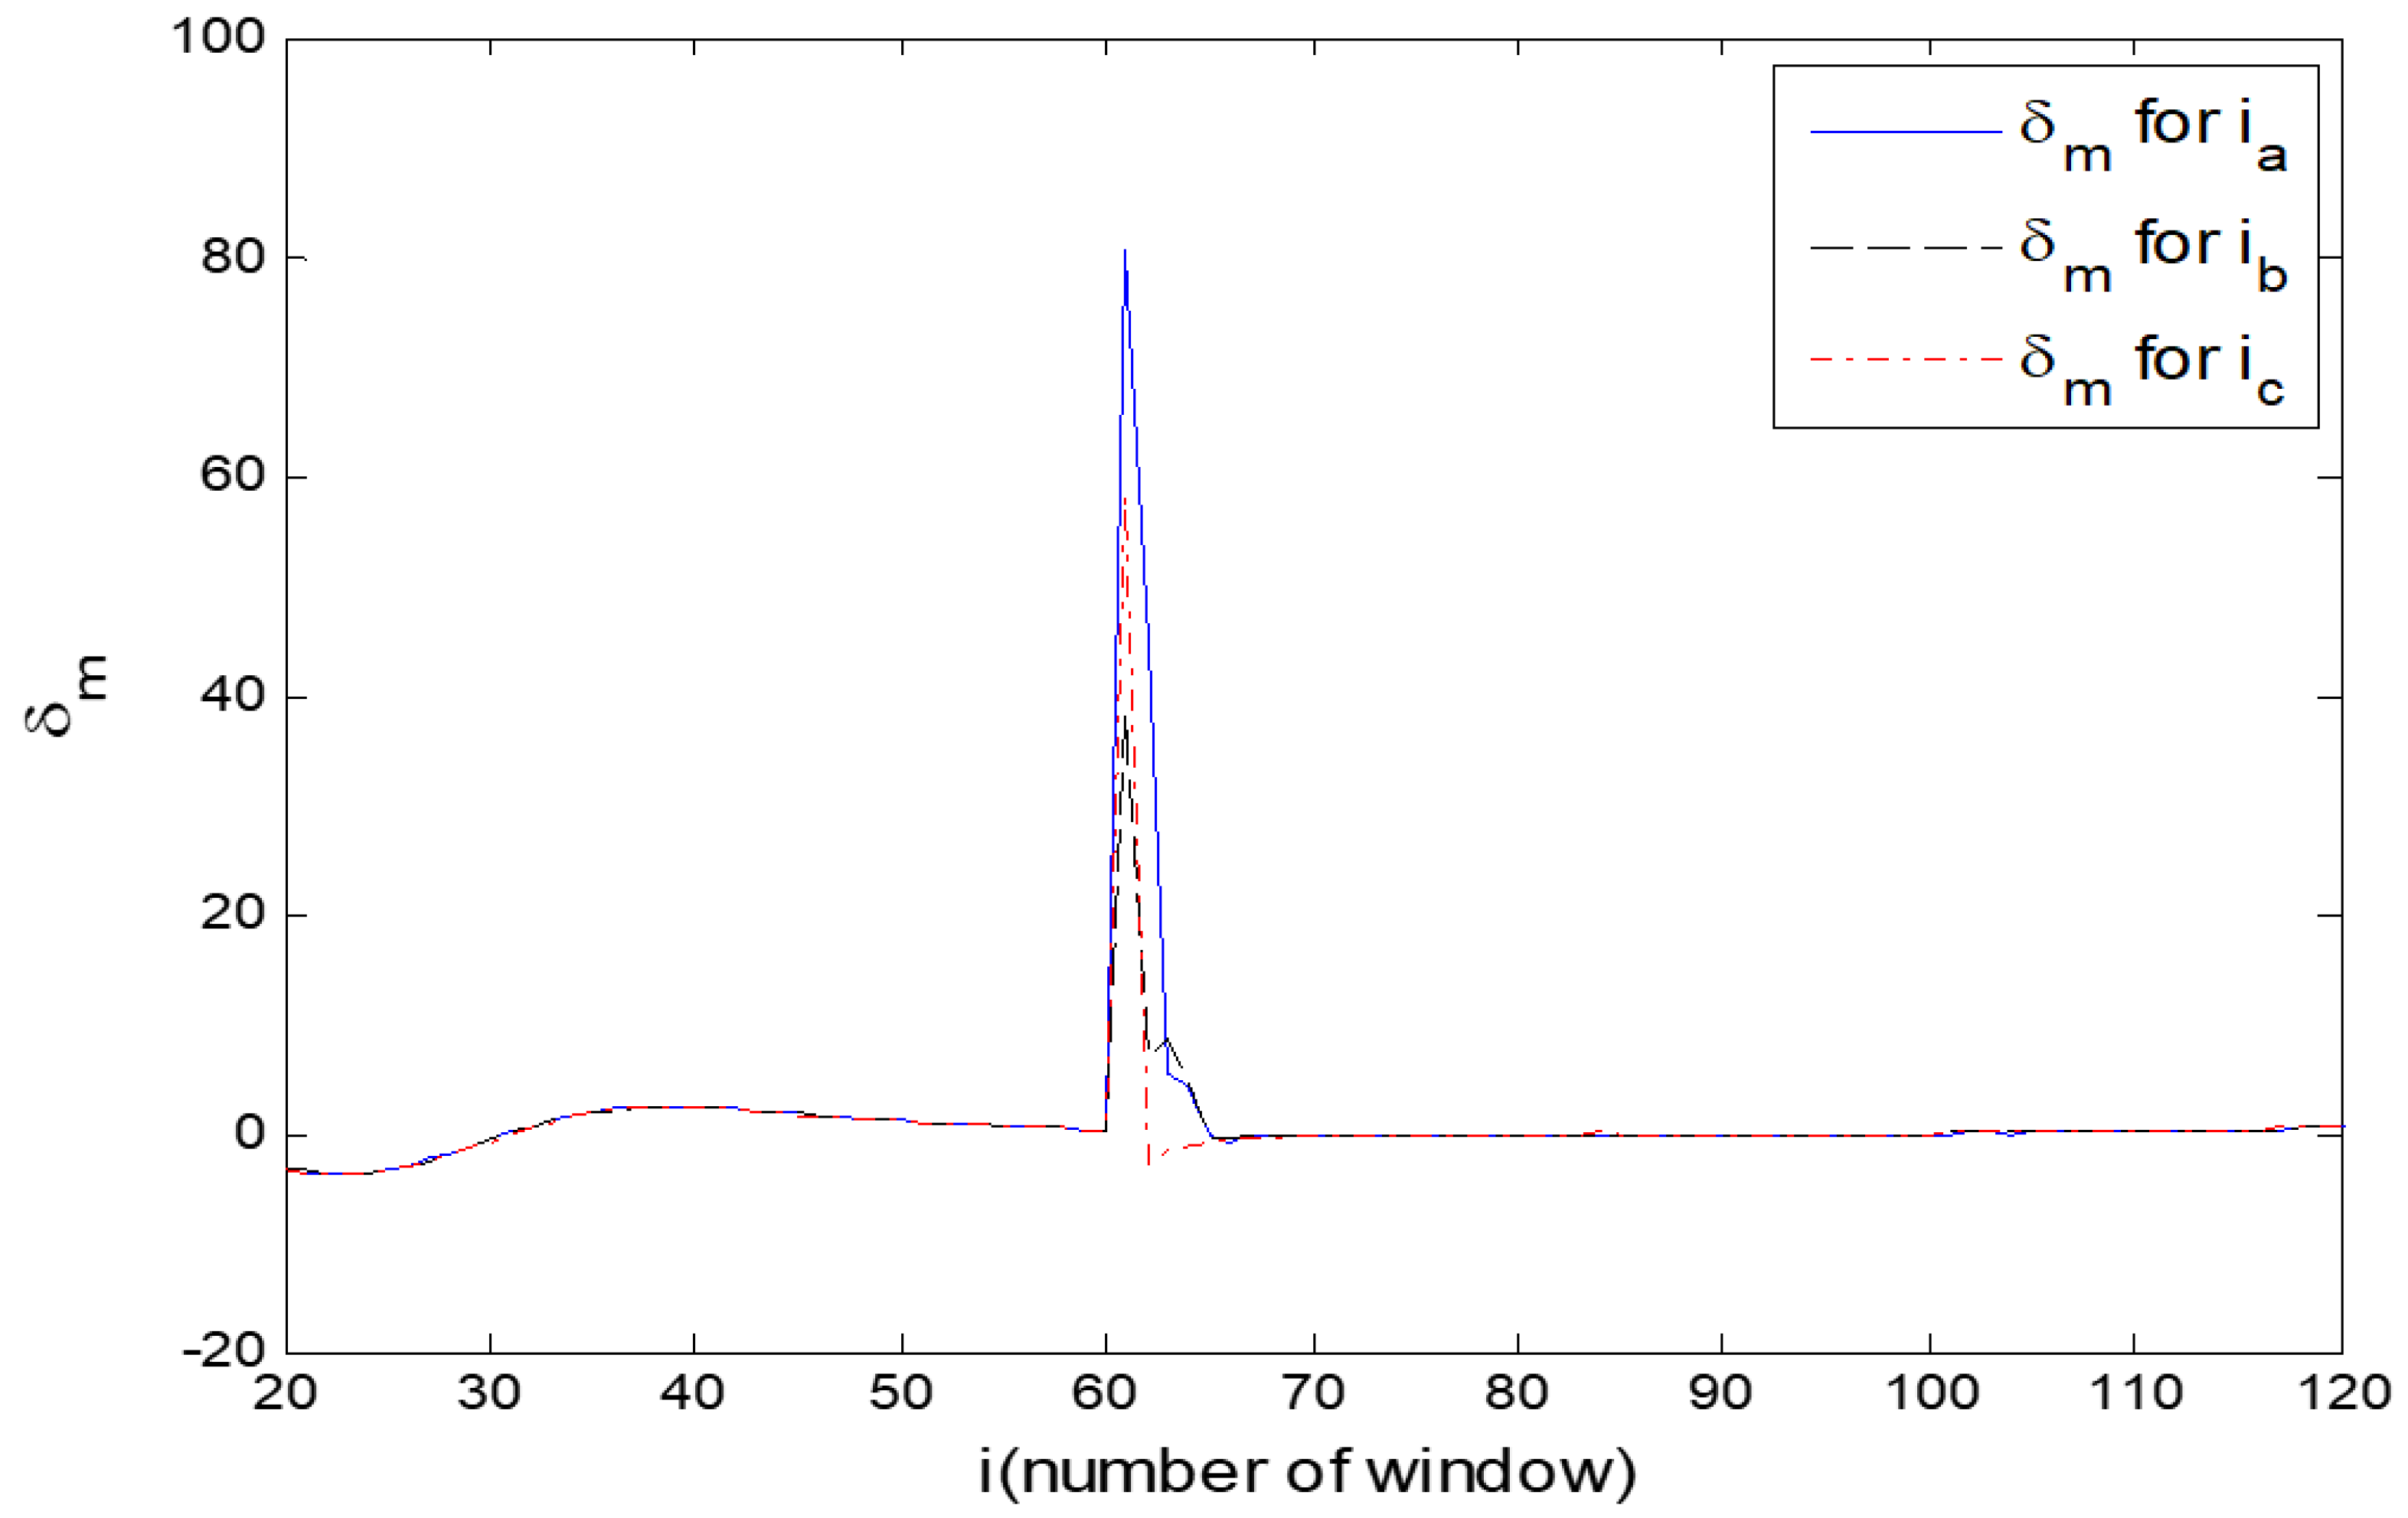
Figure 11 shows that with the occurrence of a three-phase fault with a fault resistance 1 Ω at 2 s at 80% of the line length, high-frequency components appear. Extracted currents (ia,ib,ic) from DIgSILENT software with a sampling rate of 10 kHz are transferred to MATLAB software for implementing the proposed method. In
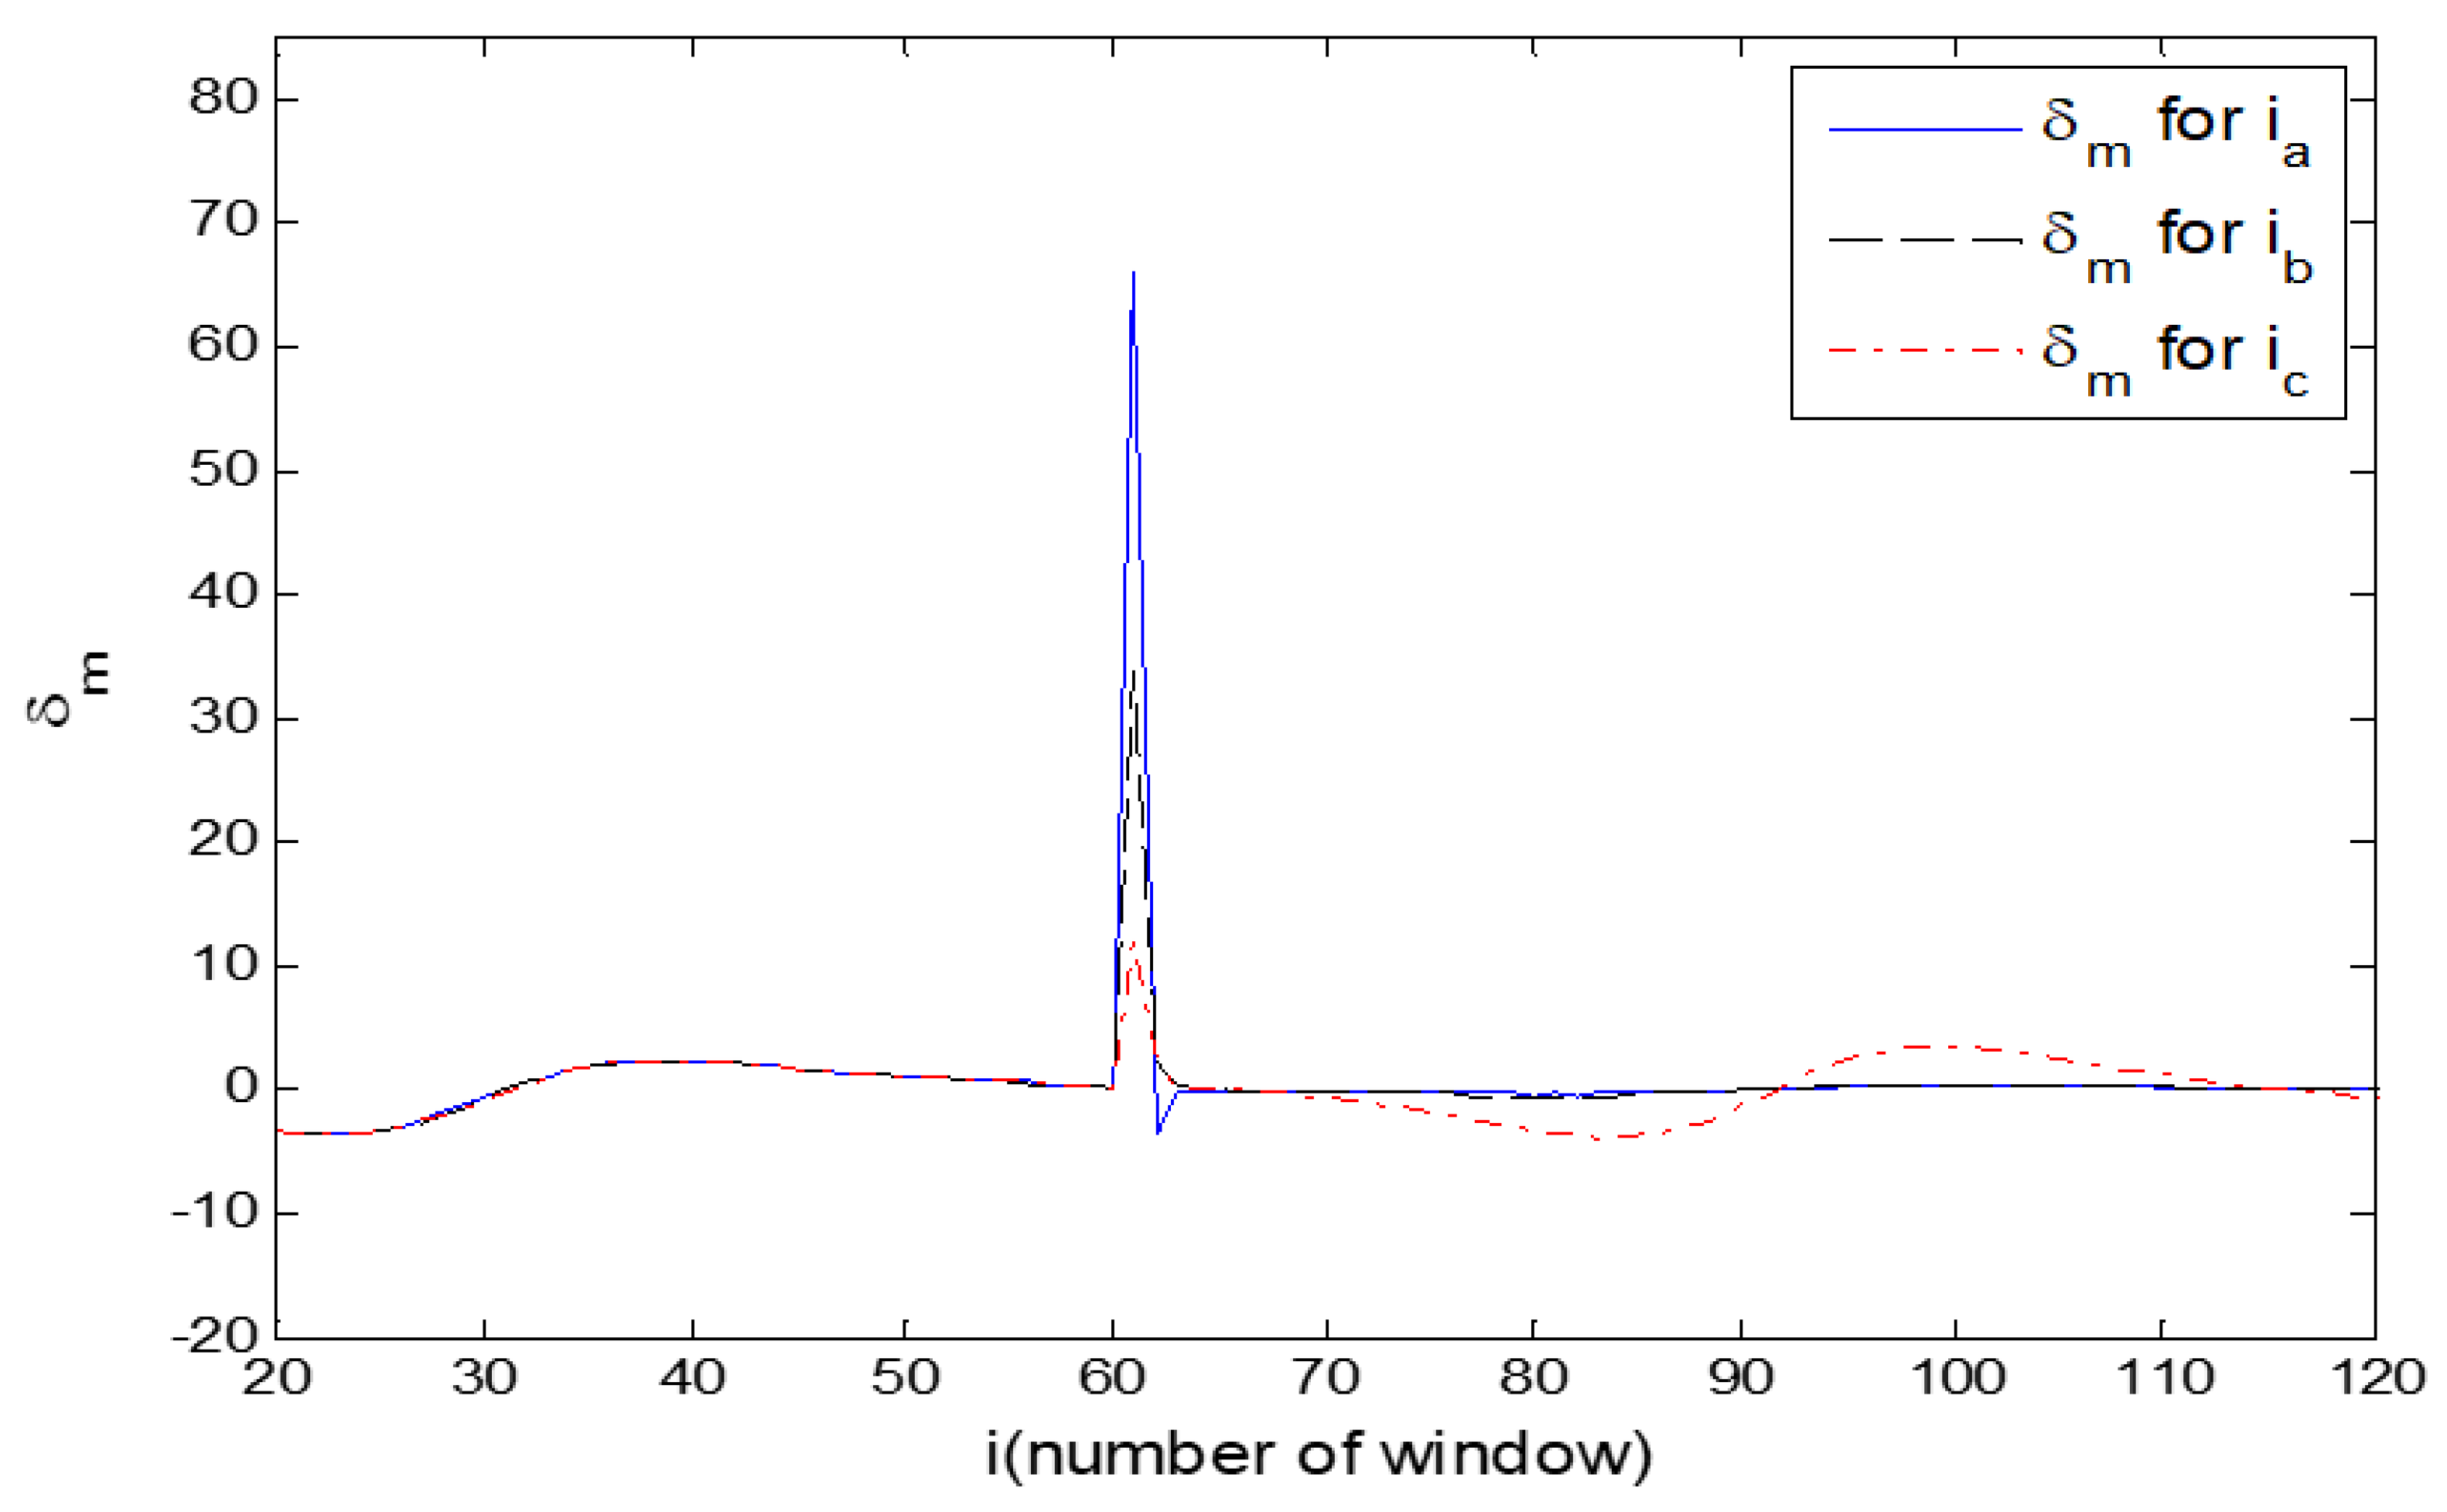
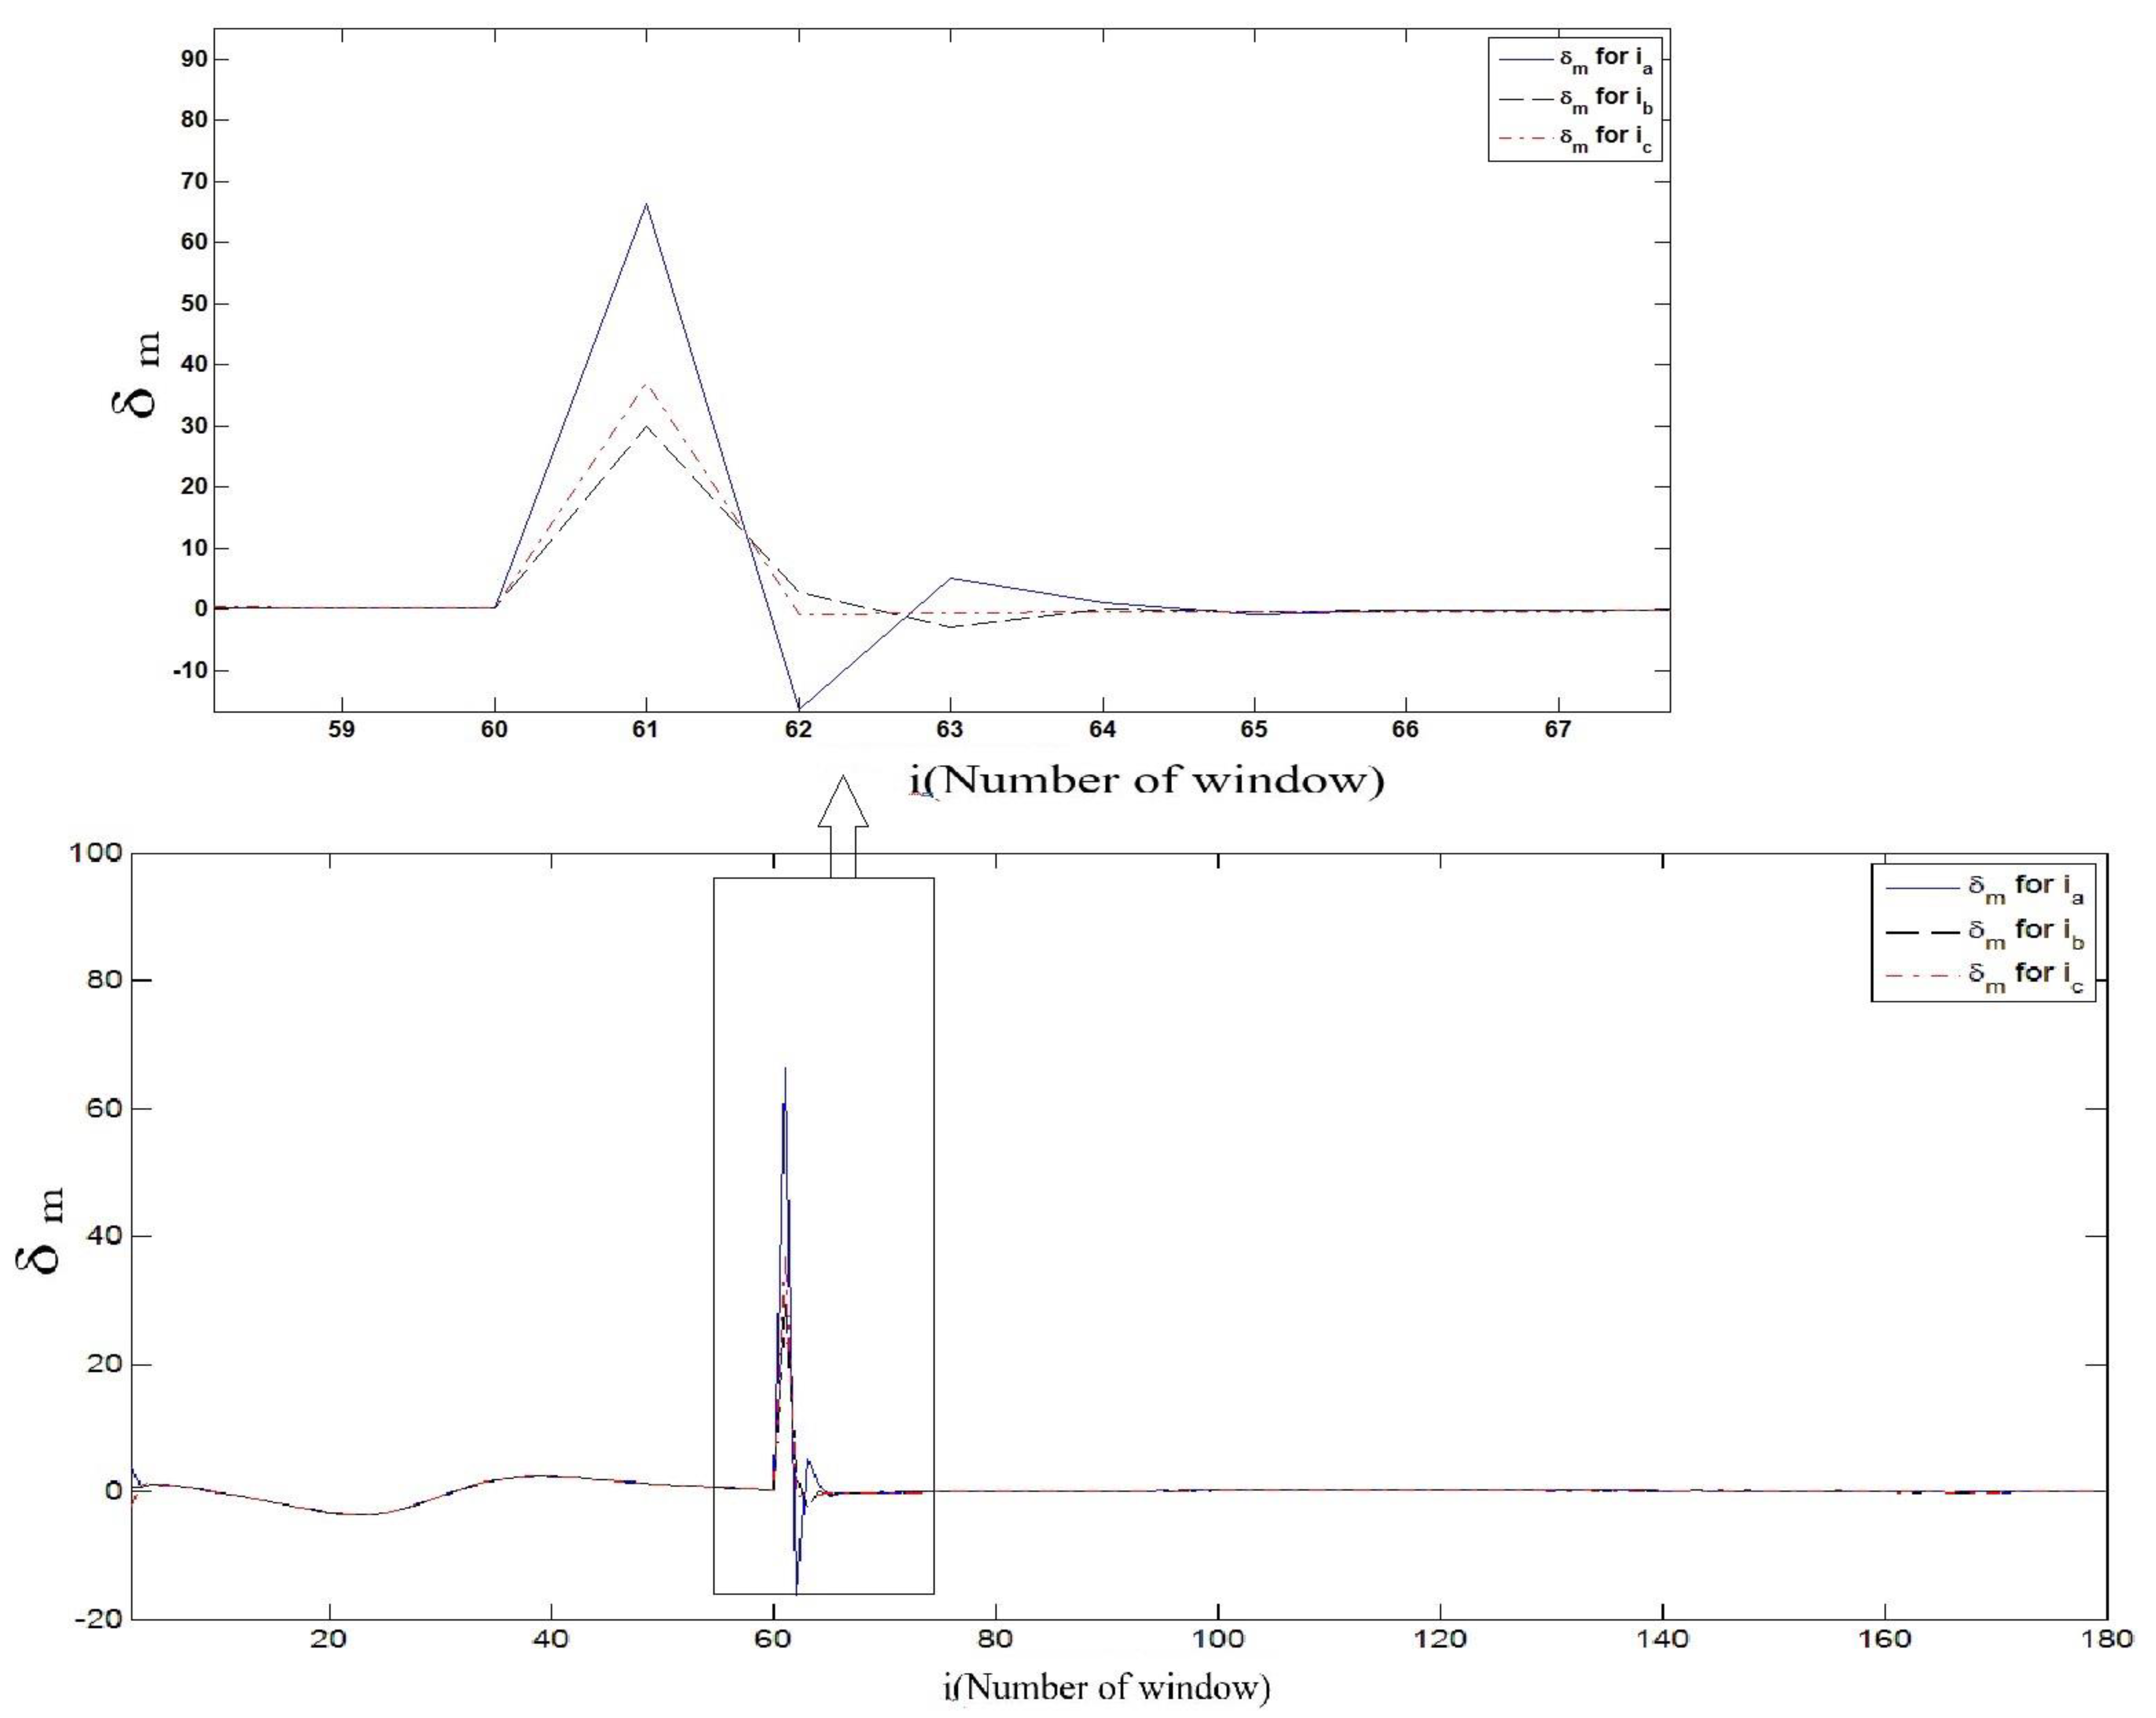
Figure 12, utilizing the proposed method, it can be seen that in the sixty-first window where the fault occurred, the damping coefficient of the main frequency during each three-phase current increases significantly.
For
, in the sixty-first window, the six extracted frequencies are
z,
z, and
z, and their damping coefficients are 66.4, 443.4 and 127.9. In this case, the main frequency is 47.5 Hz, and its damping coefficient is 66.4. Nevertheless, during power swing, the damping coefficients of the main frequency in each window is close to zero. For example, according to
Figure 12, in the thirty-ninth window the main frequency is 61.1 Hz, and its damping coefficients is 2.38.
In
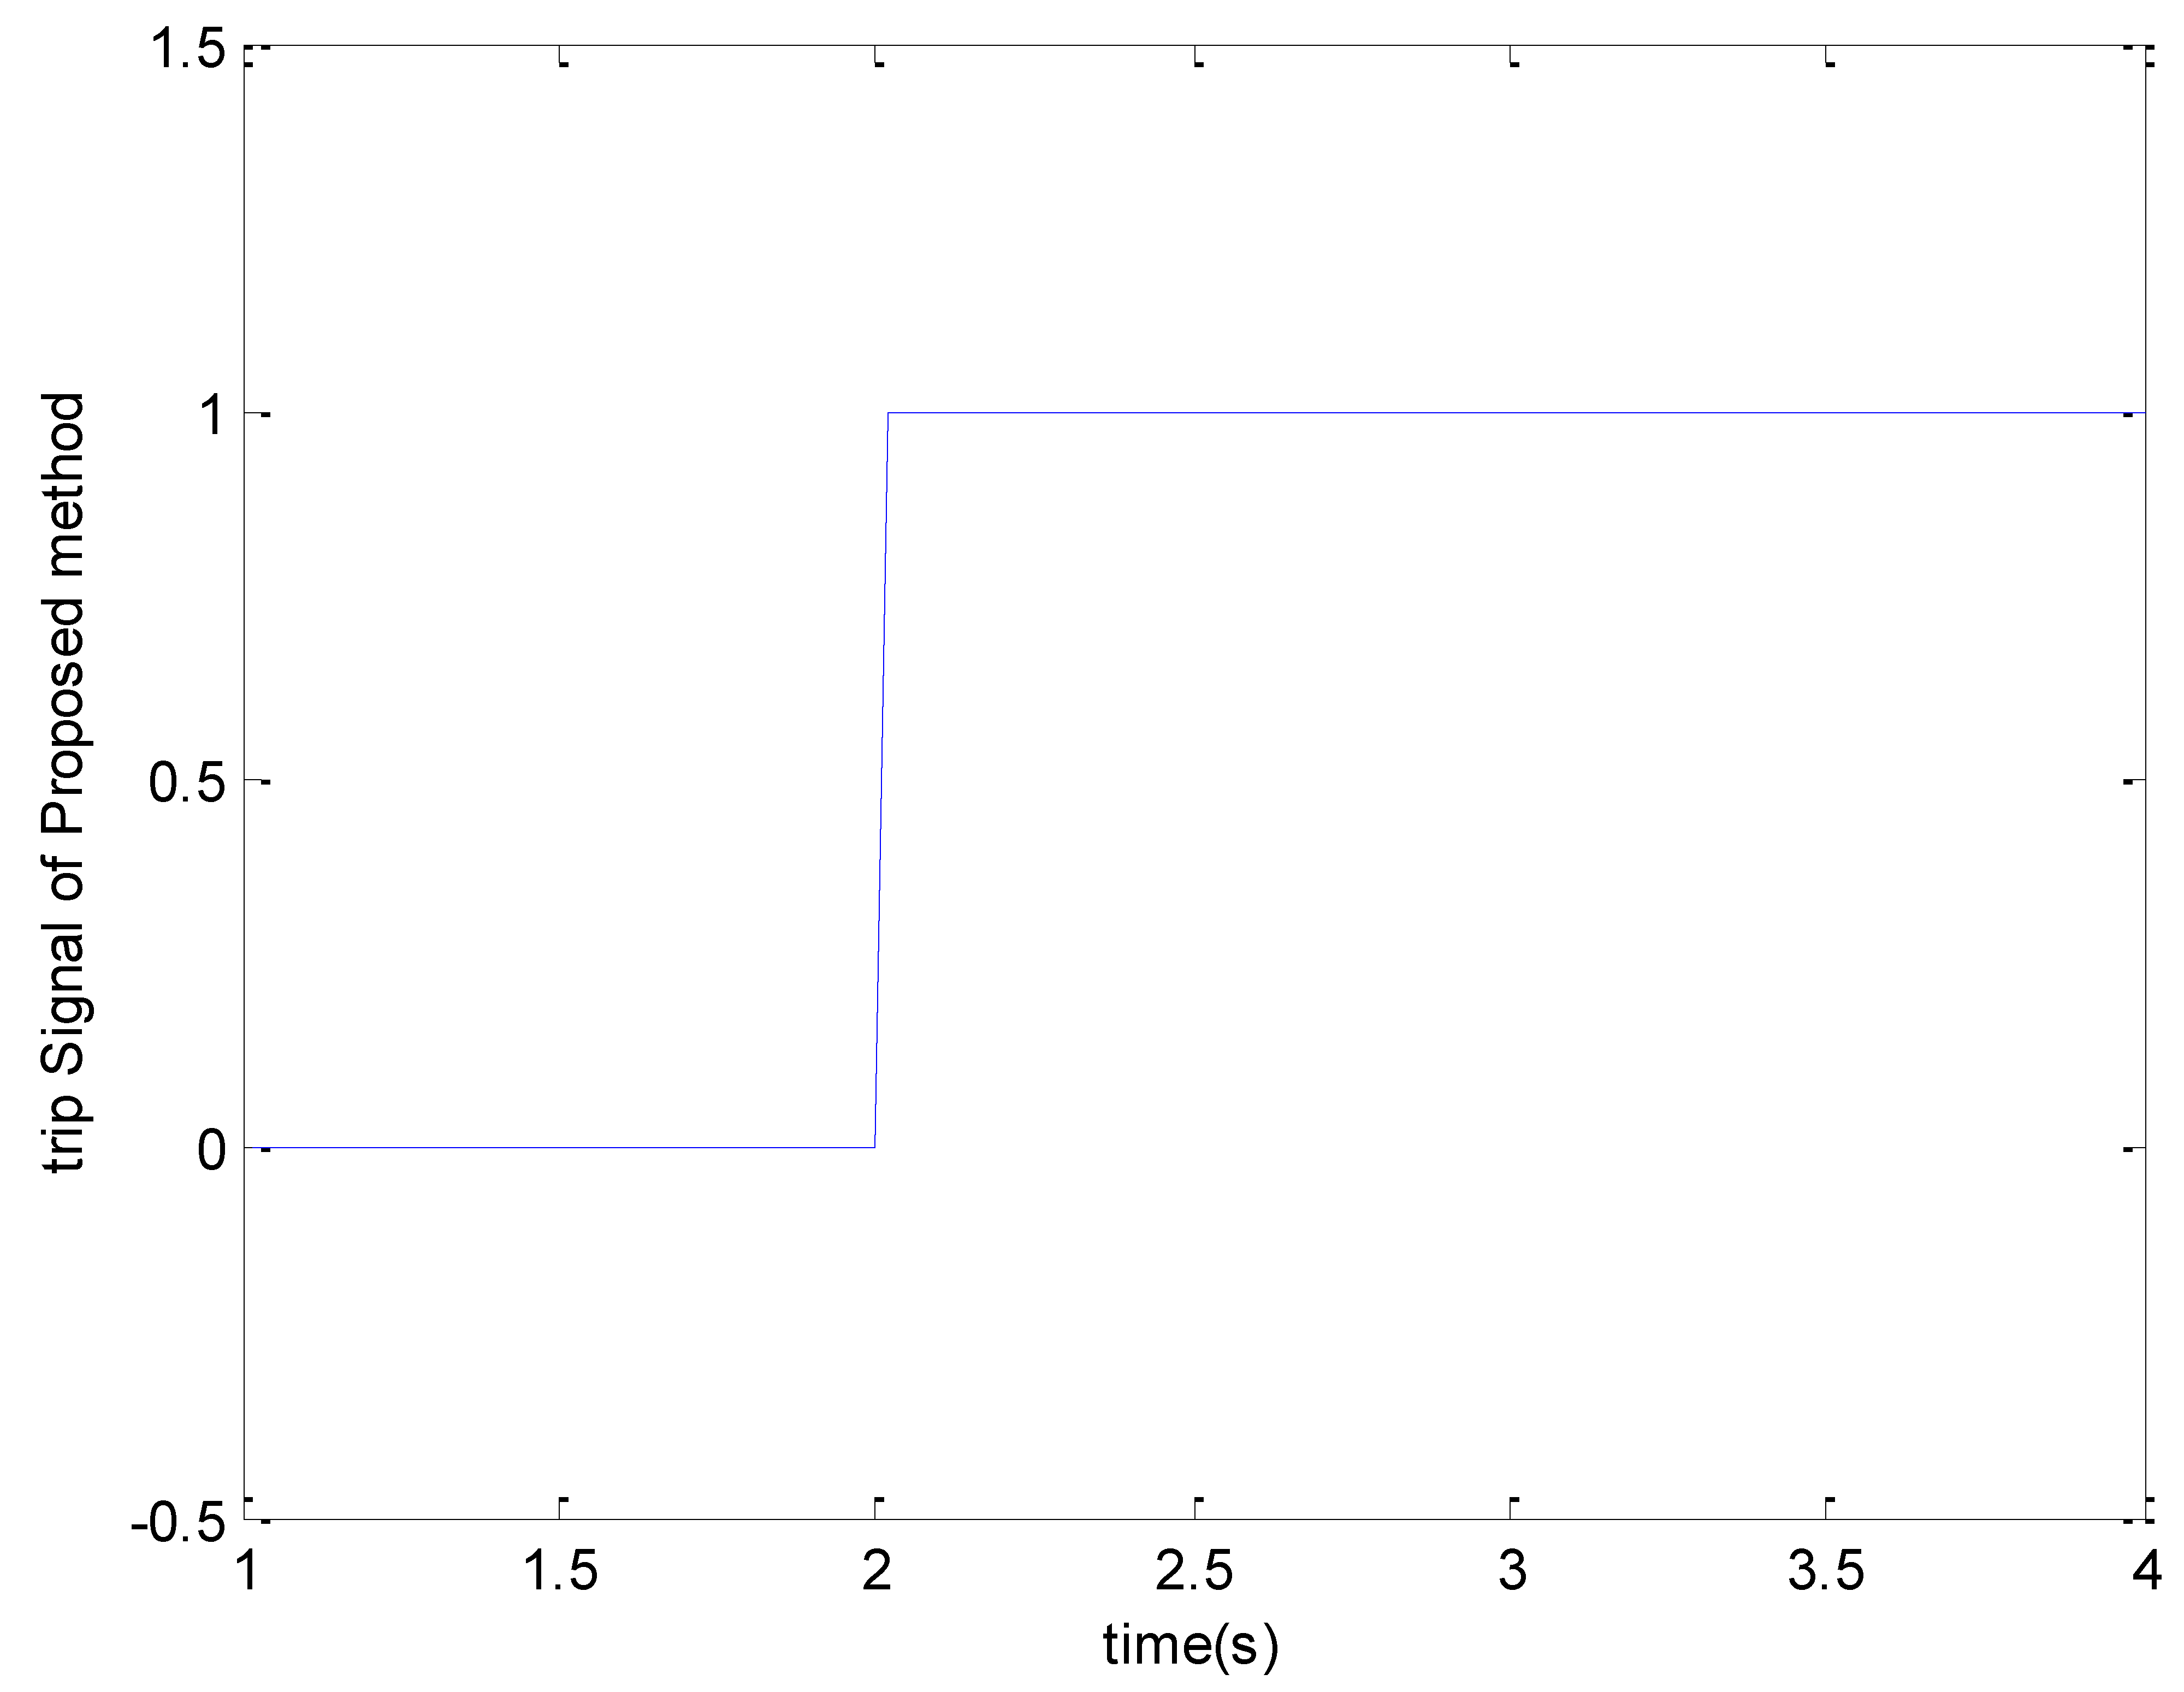
Figure 13, the trip signal for unblocking the distance relay after detecting a fault in case 1 is demonstrated.
6. Discussion
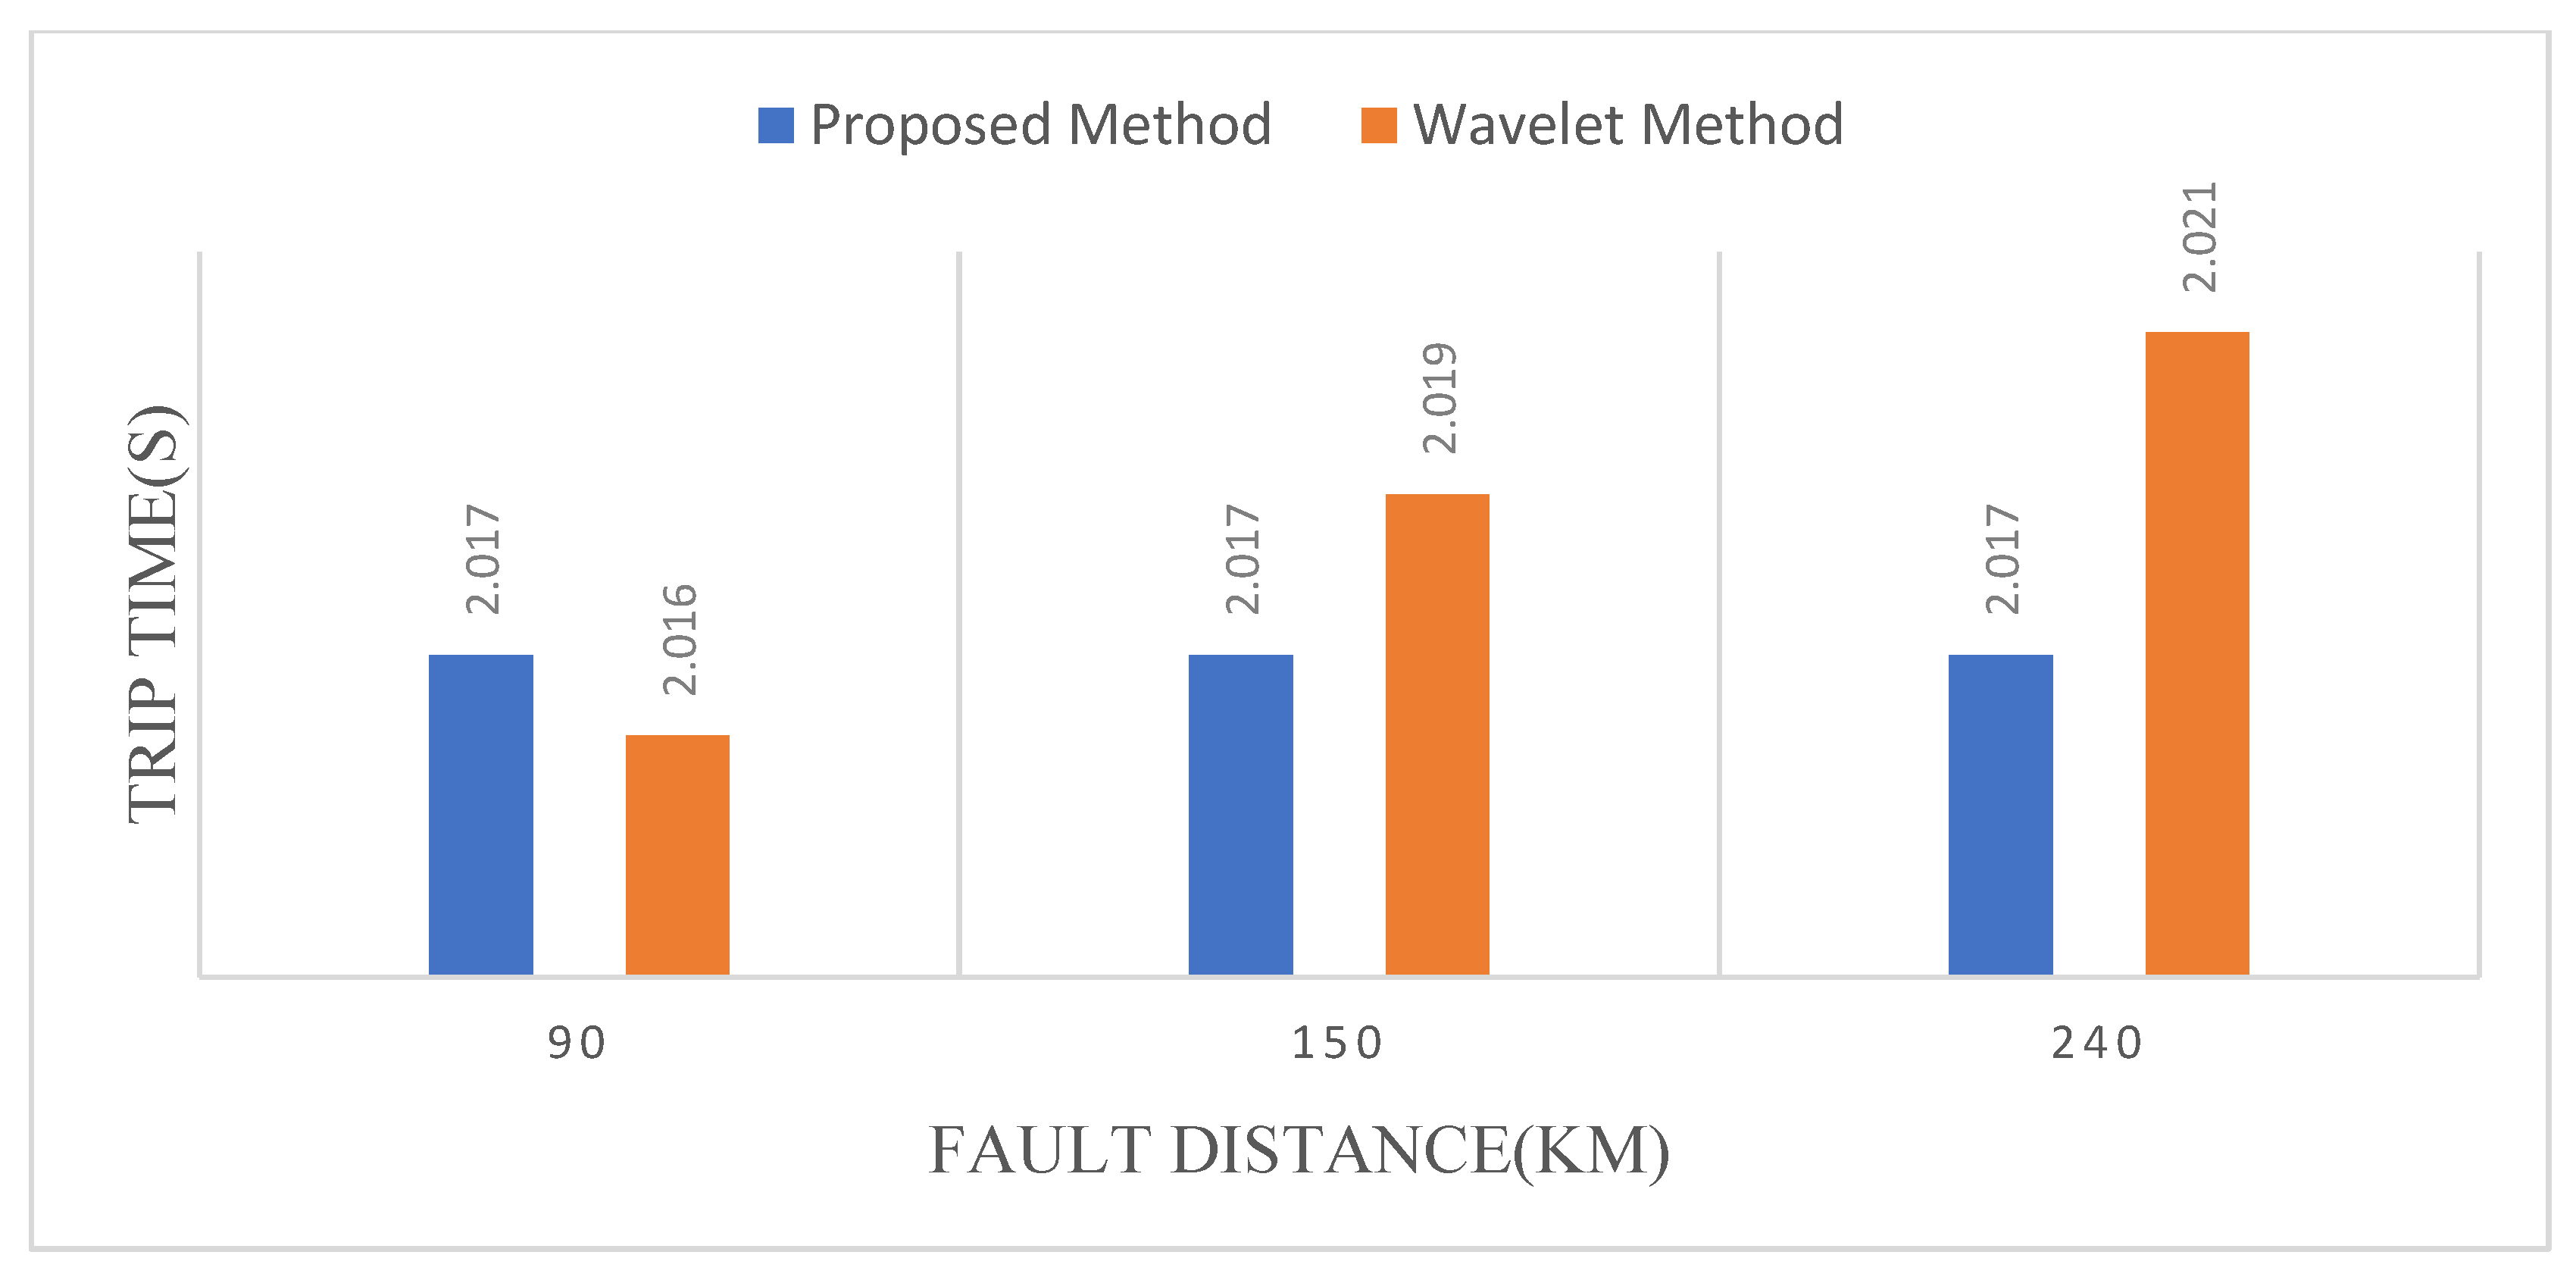
According to the results obtained through the proposed method, it is observed that in less than one cycle (0.0167 s), the fault during power swing is detected. It can be seen from
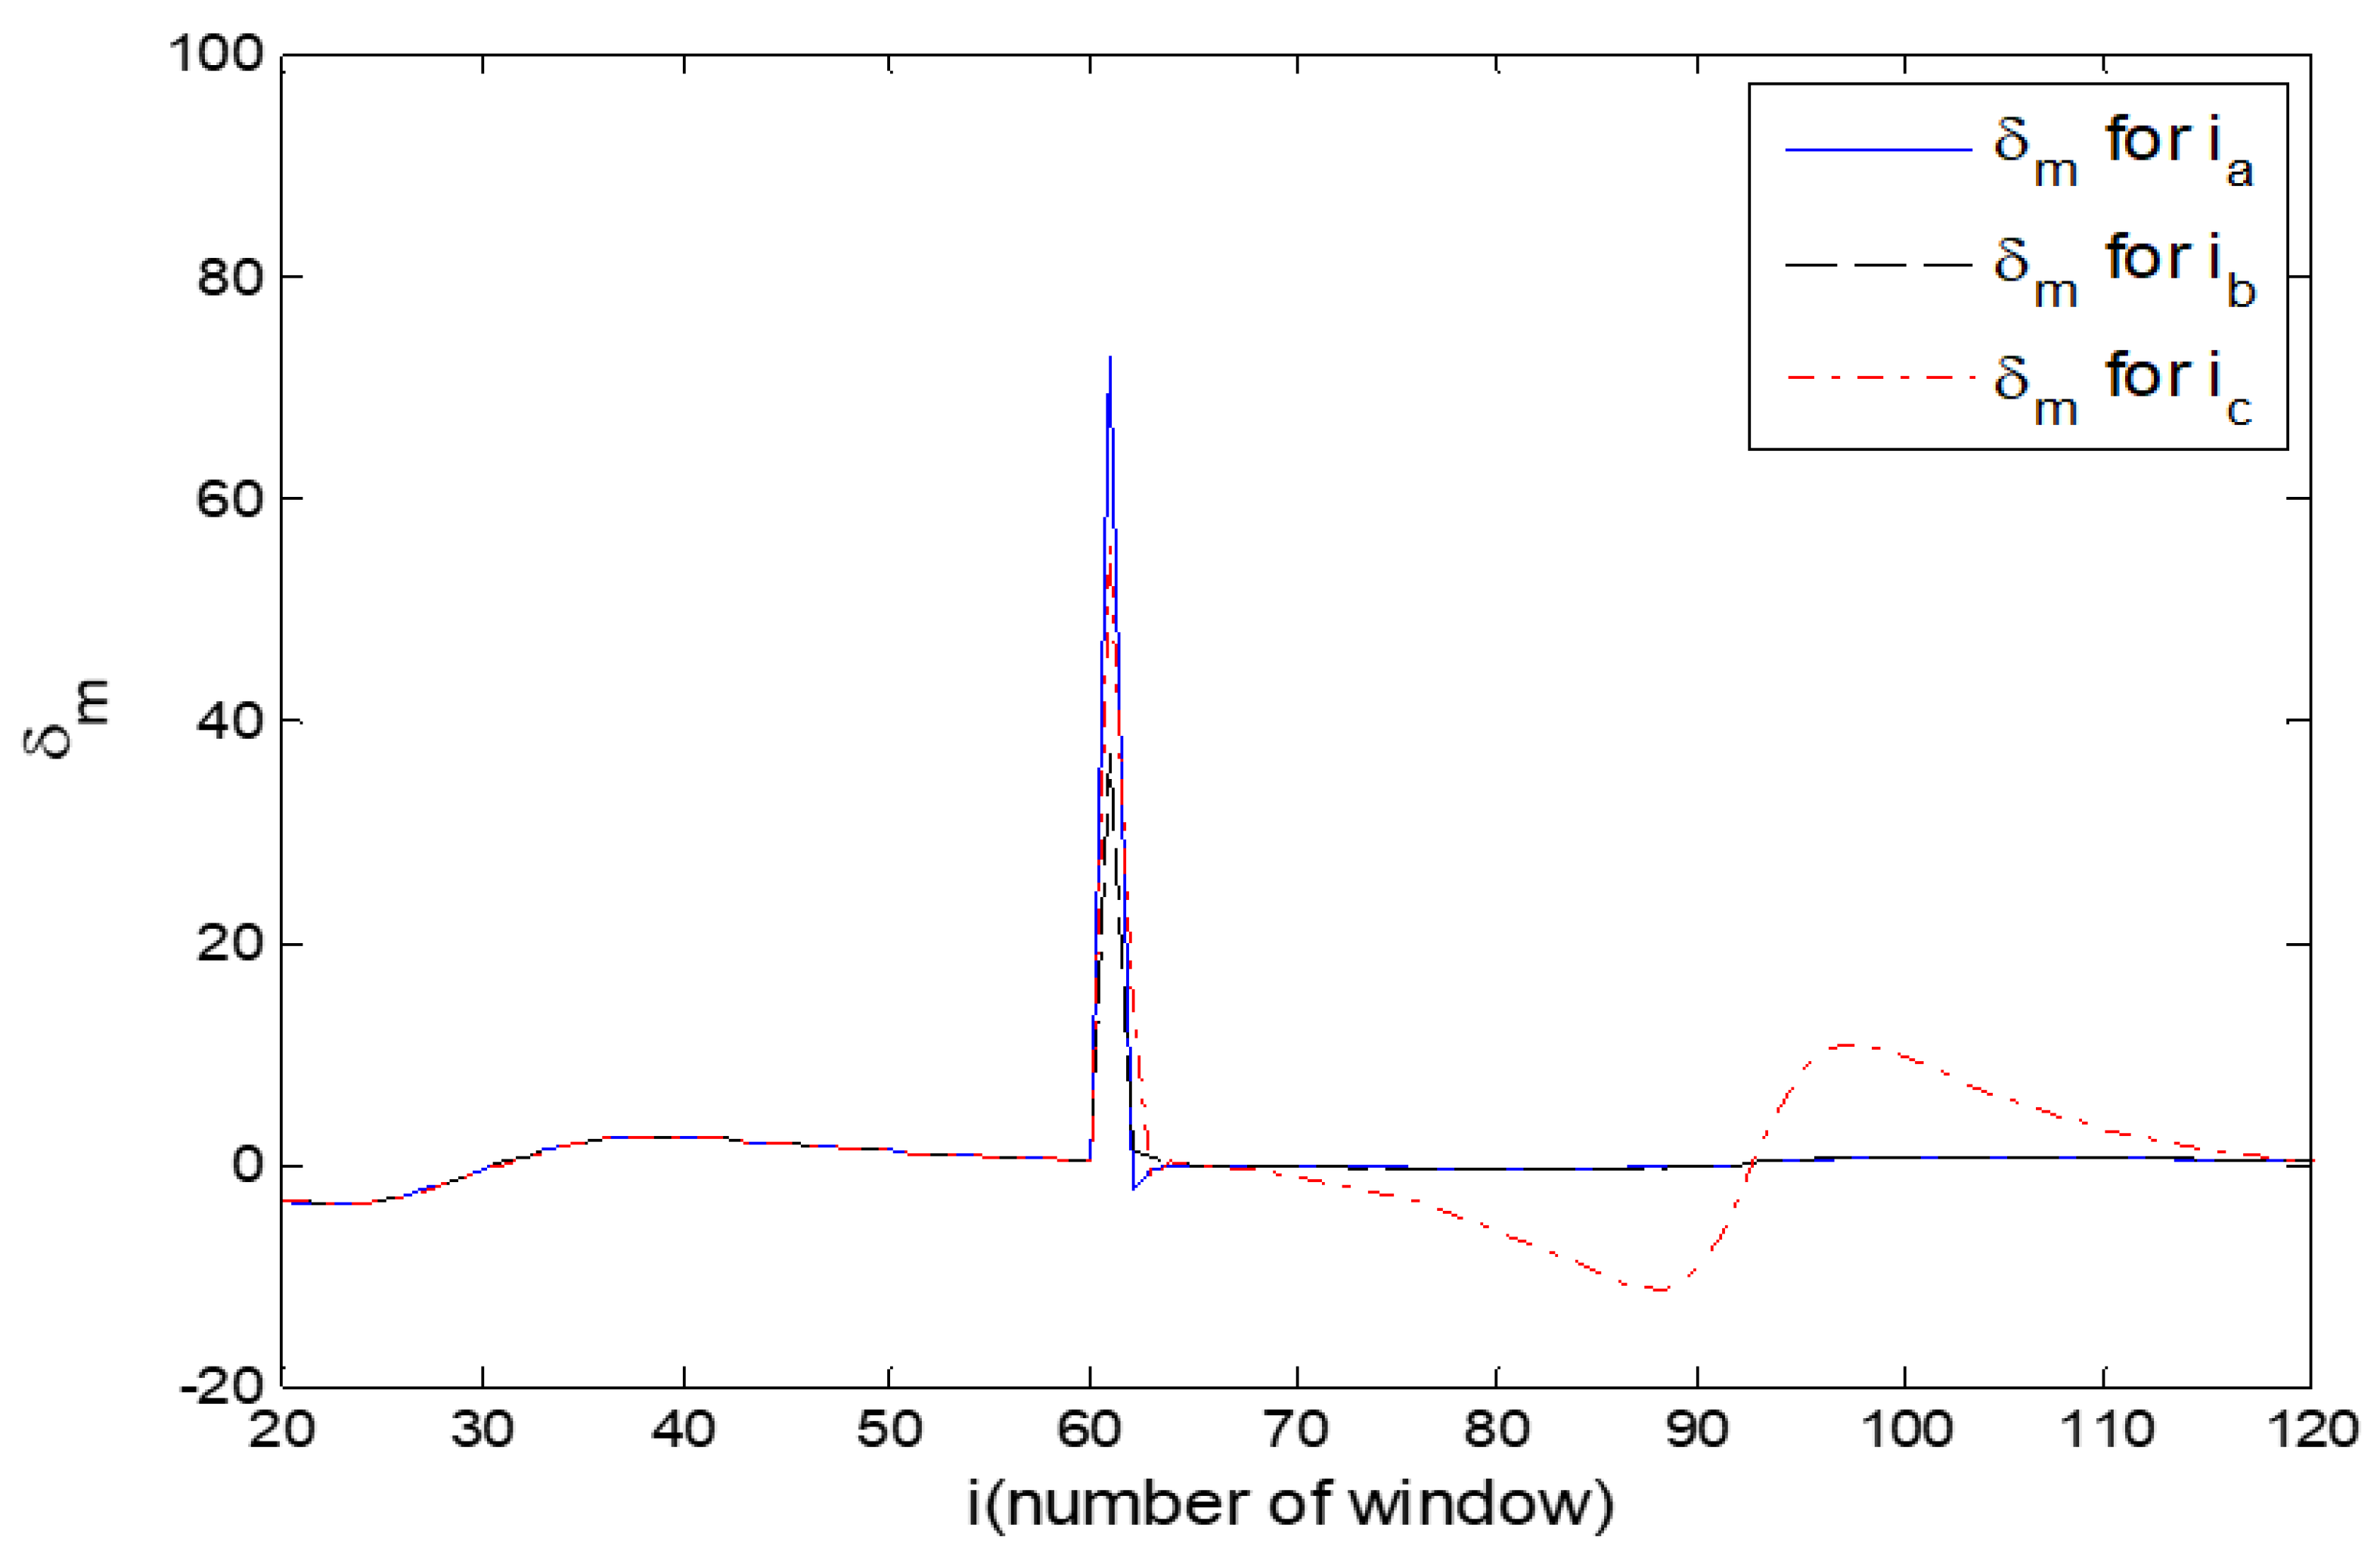
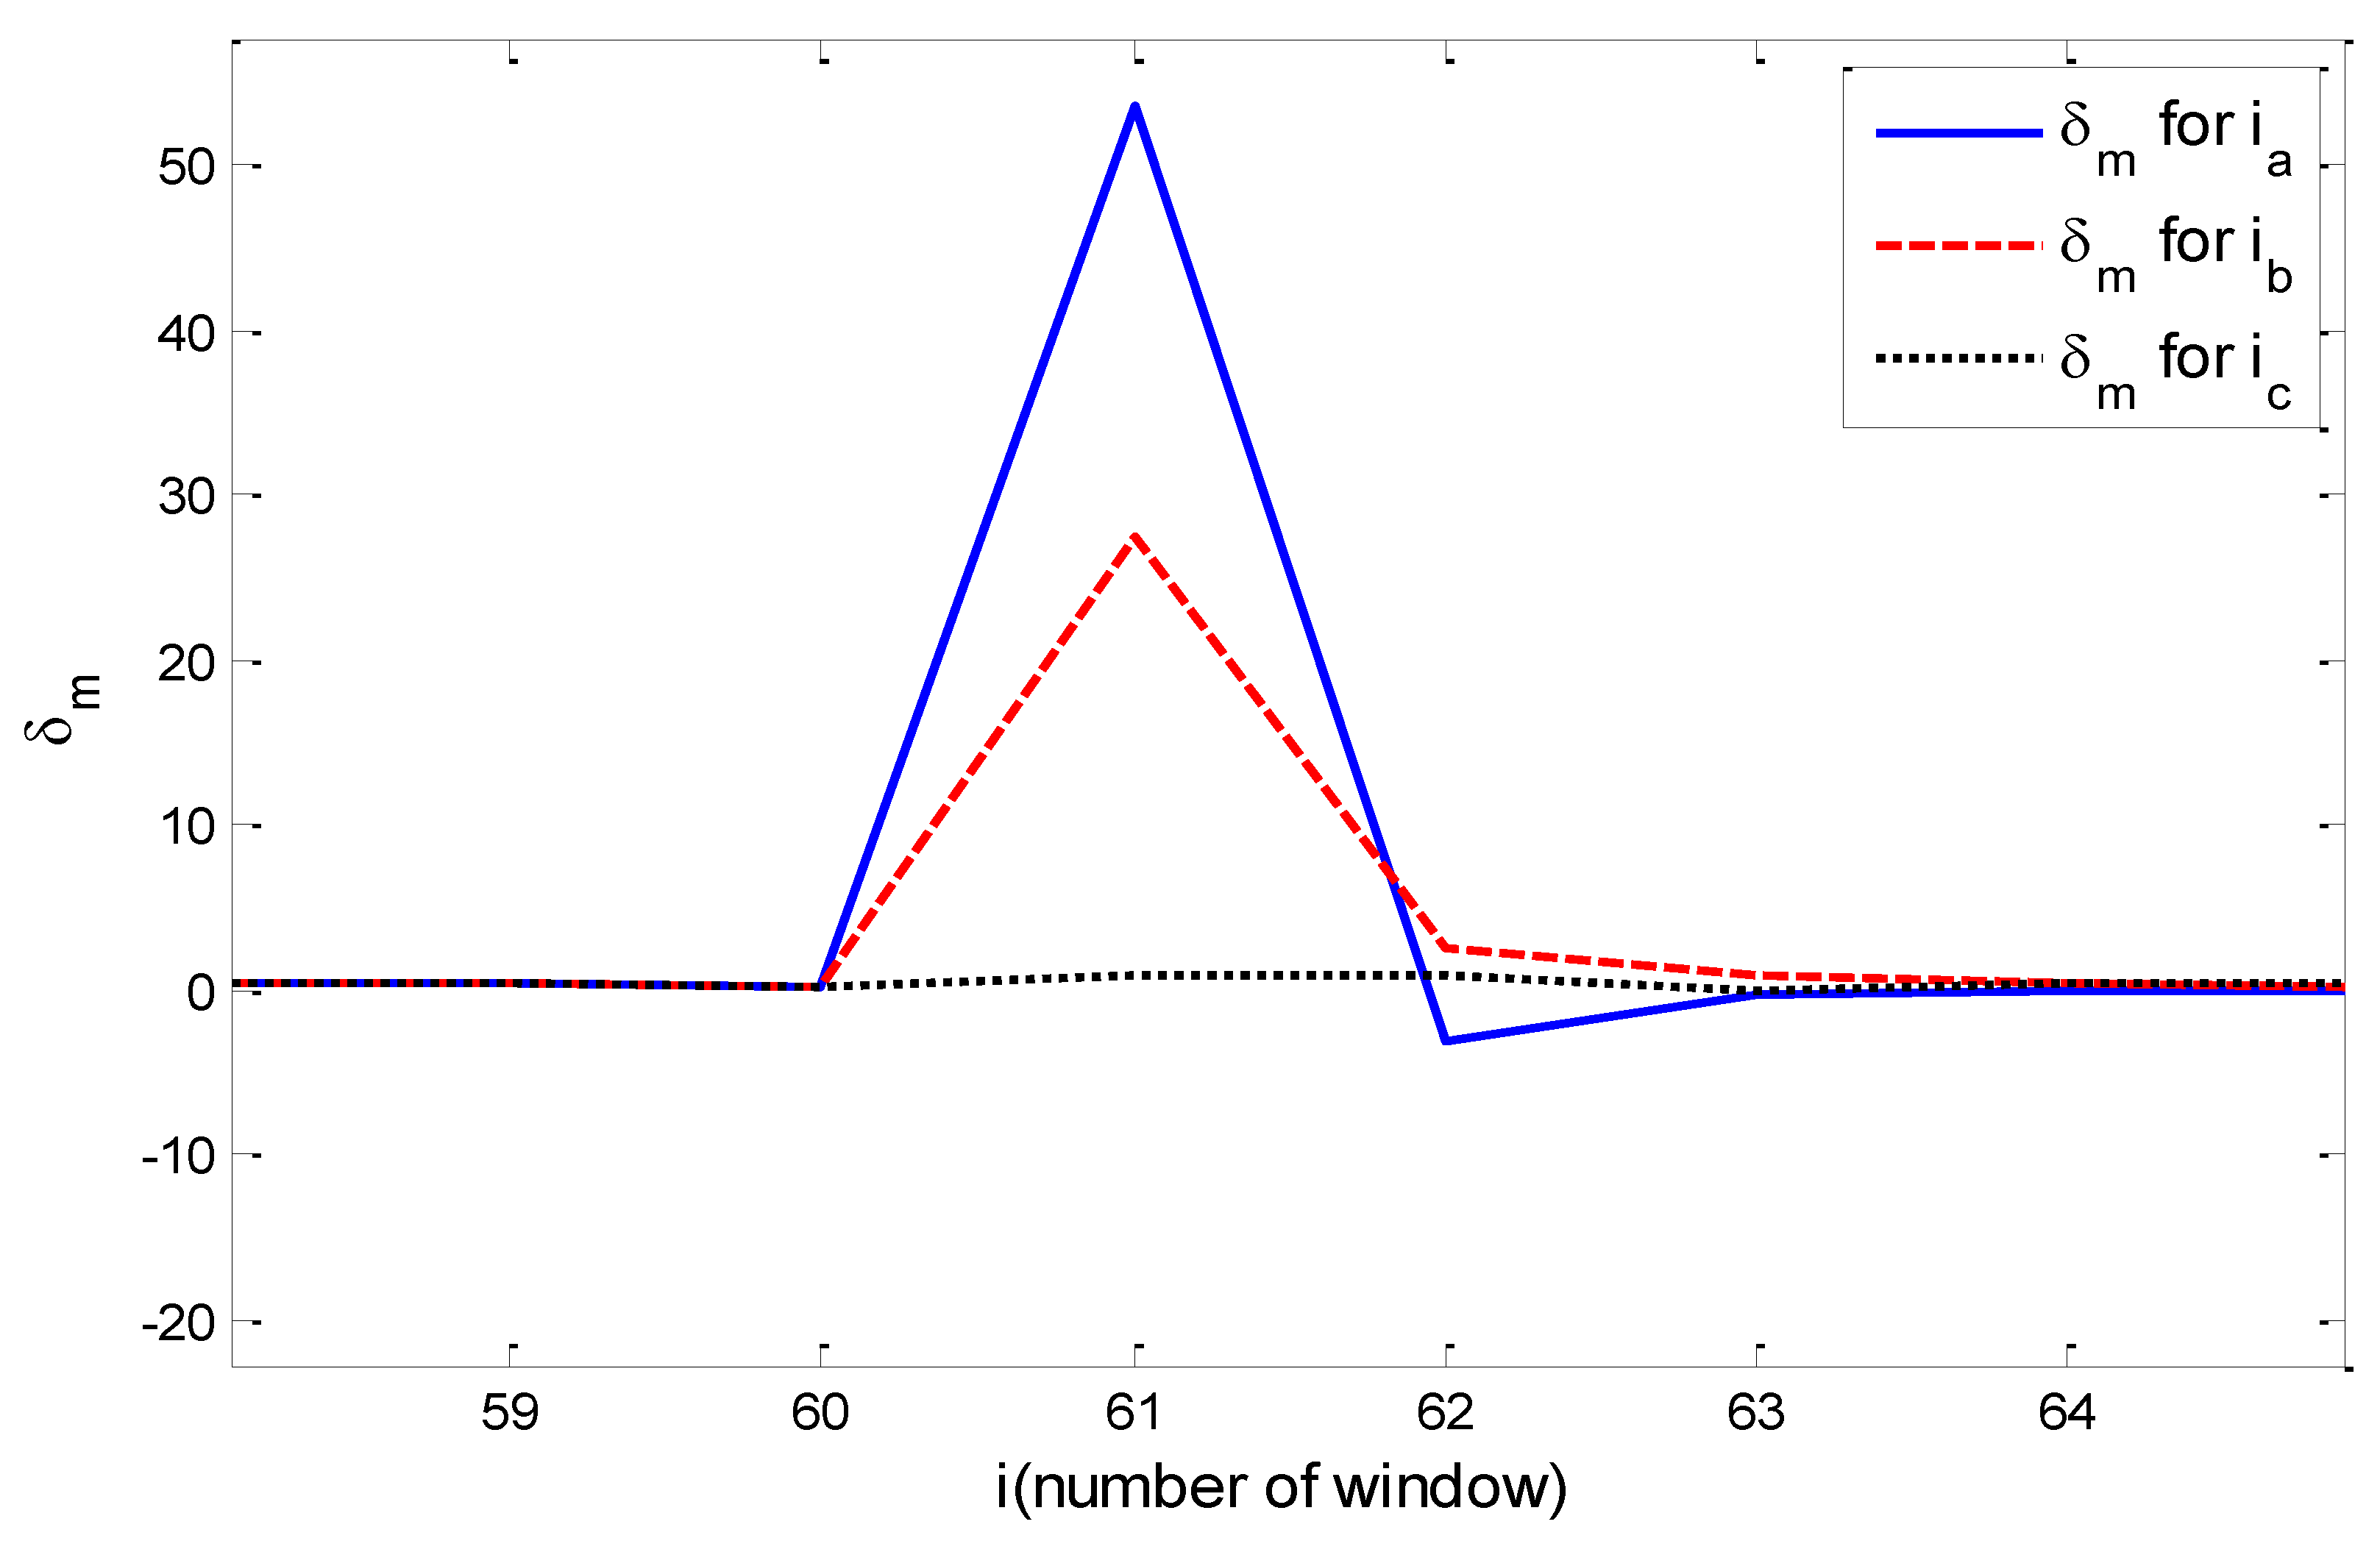
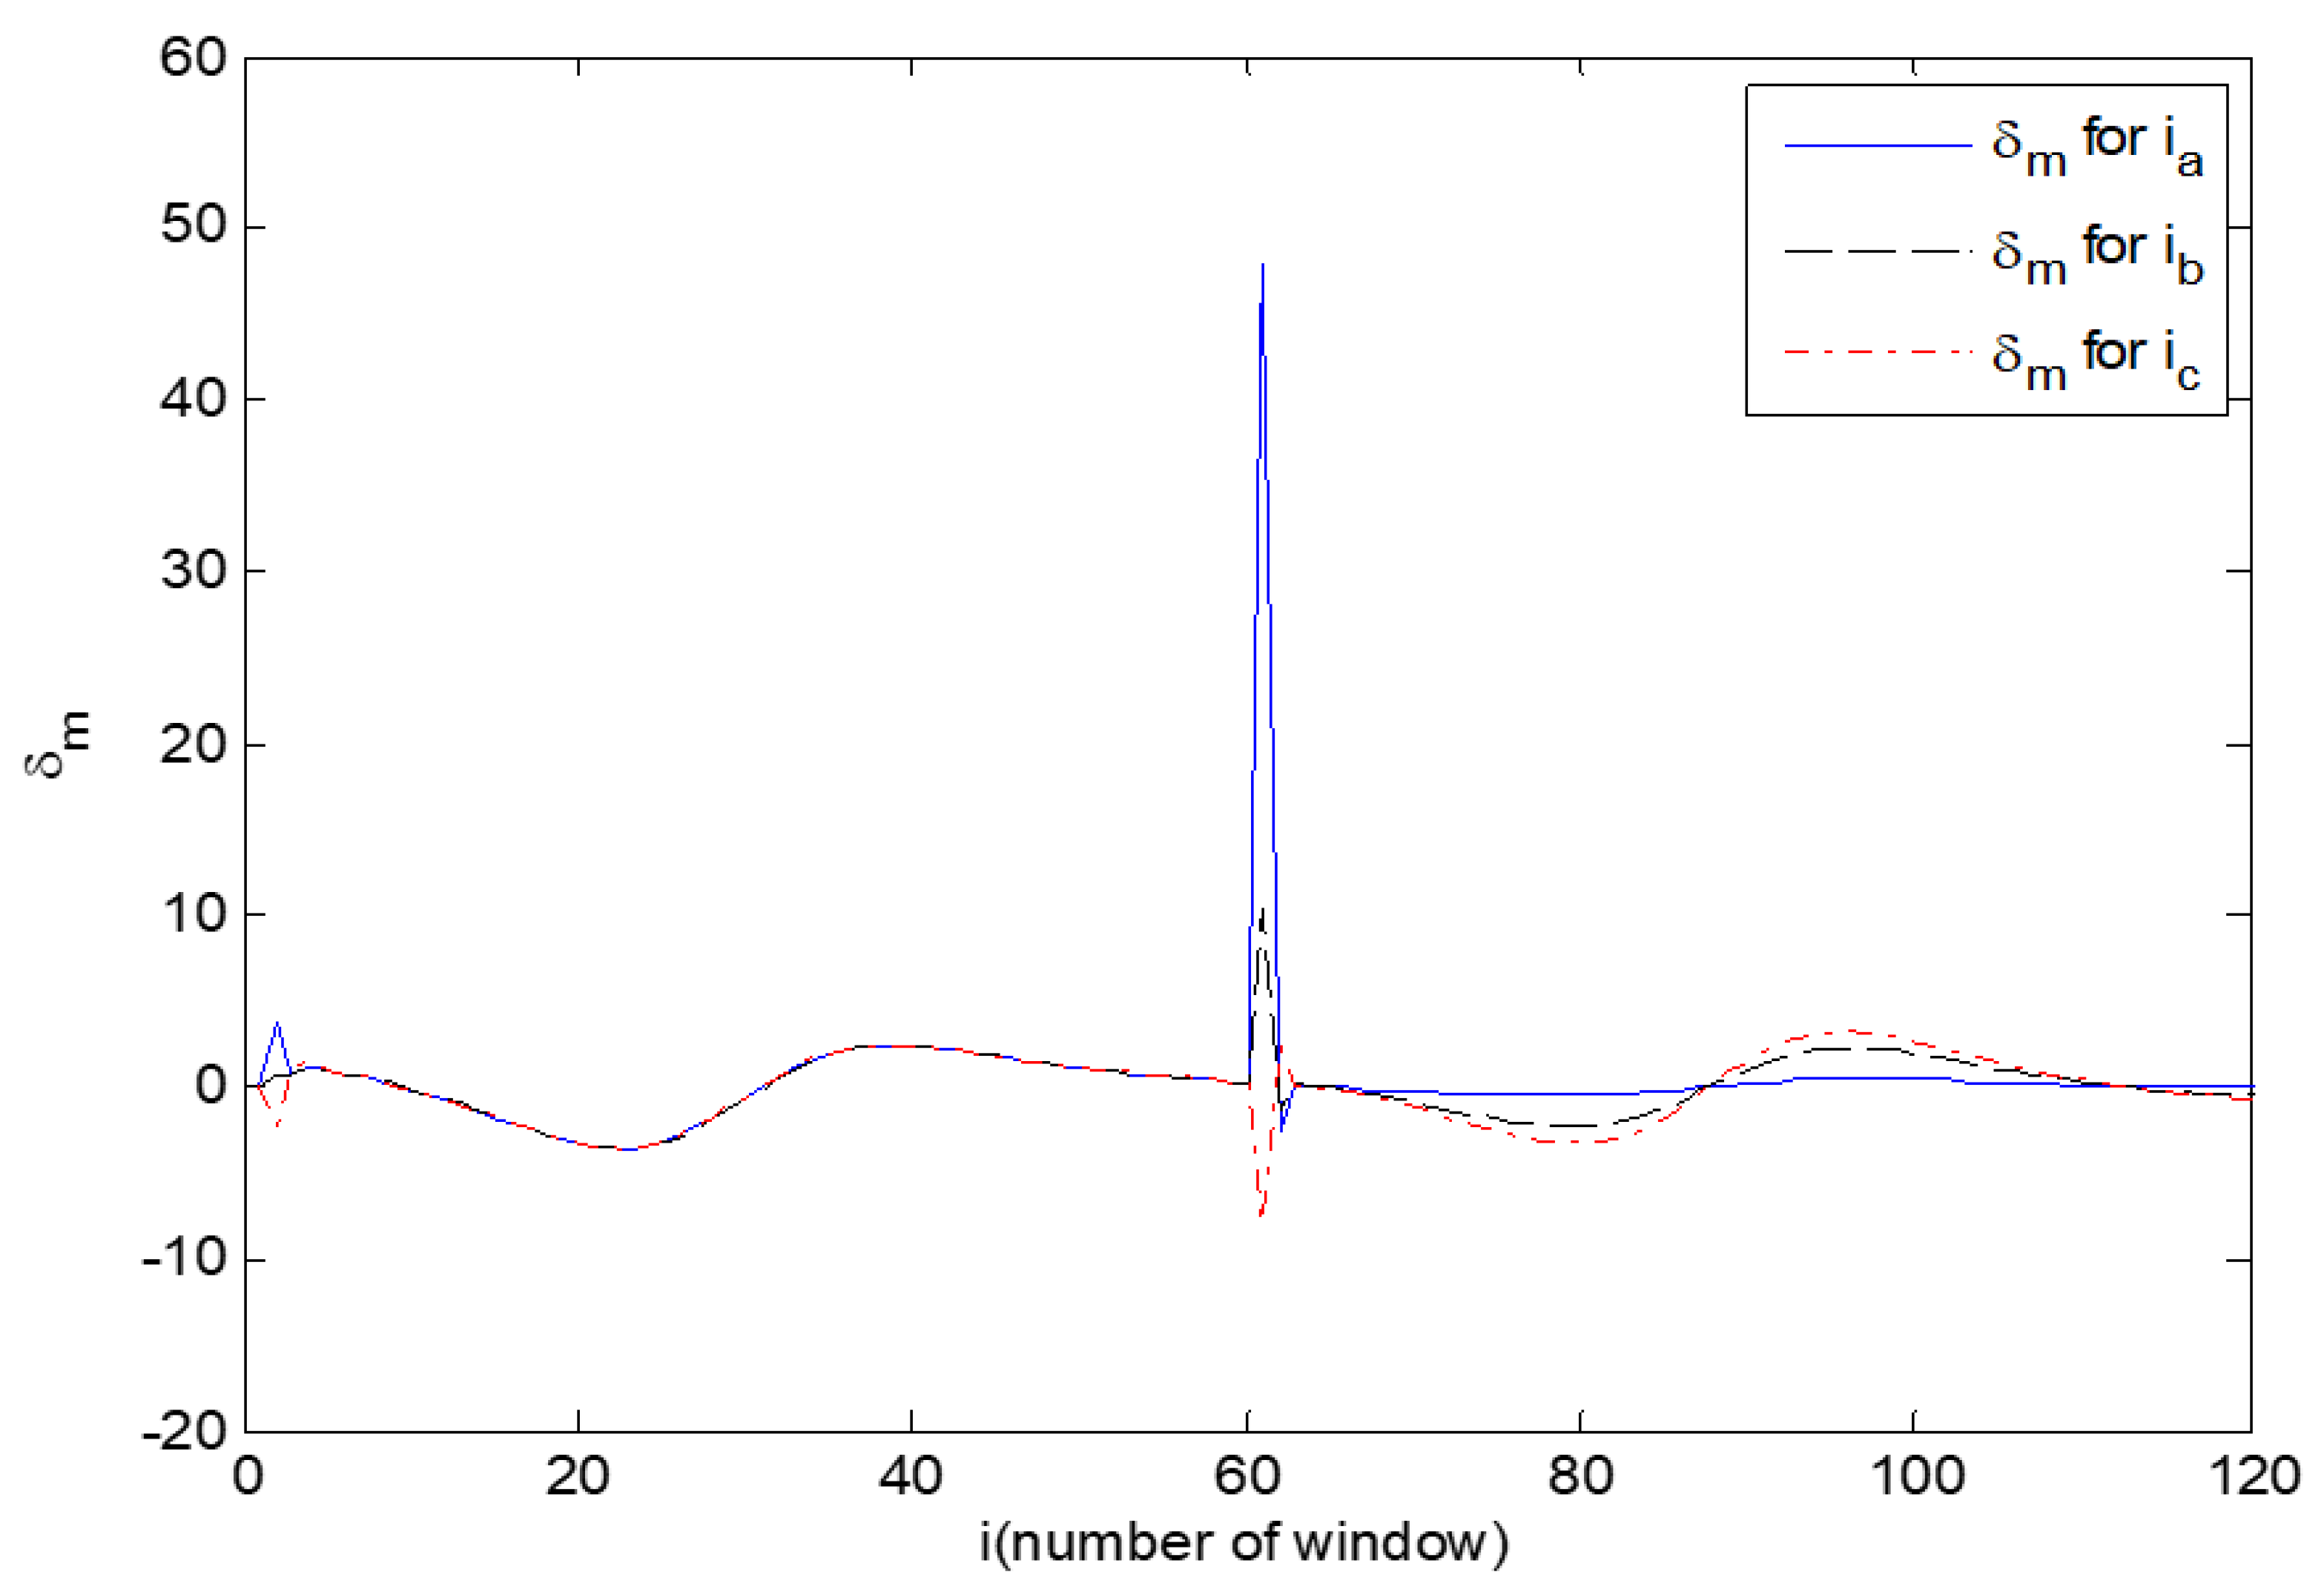
Figure 13 that after a fault occurs at 2 s (the sixty-first window), the fault is detected at high speed at 2.017 s, and the relay is unblocked. For case 4 (LL-G fault), similar to case one in
Figure 14, it can be seen that the main frequency damping coefficient increases significantly for
and
but does not change much for
.
According to
Figure 14, for the three-phase currents a, b, and c in the sixty-first window, 52 Hz, 51 Hz, and 62.2 Hz are the main frequencies, and 53.47, 27.35, and 0.9398 are the damping coefficients, respectively. It is observed that the increase in the main frequency damping coefficient in the phases with fault occurrence is much more.
Table 2 also shows the main frequencies and their damping coefficients in the window in which the fault occurred. To determine the threshold of the main frequency damping coefficient, it can be seen from
Table 3 that the maximum damping coefficient of the main frequency during power swing in the occurrence of different power swing is equal to 5.2 so that according to
Table 2 in faulty phases, the minimum main frequency damping coefficient in the faulty window is 27.35; therefore, 12 is a suitable value as a threshold. It should be noted that we can quickly obtain the threshold value for other power systems by simulation studies.
Also, according to
Table 2, in some cases a single-phase to ground fault or two-phase fault has occurred, the main frequency damping coefficient in other phases in which no fault has occurred due to the presence of high-frequency components has increased.
To check the validation of the Prony method, the presented method is compared with a method based on wavelet transform [
38].
For this purpose, the method of [
38] is implemented on the network of this paper. The results of this comparison are shown in
Figure 17.
With the occurrence of three-phase fault at 30%, 50%, and 80% length of line at 2 s and the implementation of the proposed method and the wavelet method [
38], it is observed that by wavelet method tripping times of the relay are equal to 2.016 s, 2.019 s, and 2.021 s, respectively, and by the proposed method, tripping time of the relay is 2.017 s, which shows the improvement of the results.


 ,
, 


