Article

Digitalisation in Bioeconomy in the Baltic States and Poland

1
Institute of Economics and Finance, Faculty of Economics and Social Development, Latvia University of Life Sciences and Technologies, Svetes Street 18, LV-3001 Jelgava, Latvia
2
Celteh Ltd., Purvini, LV-3701 Dobele, Latvia
3
Department of Applied Economics, Finance and Accounting, Faculty of Bioeconomy Development, Vytautas Magnus University, K. Donelaičio Str. 58, 44248 Kaunas, Lithuania
4
Institute of Economics and Finance, Warsaw University of Life Sciences—SGGW, Nowoursynowska Street 166, 02-787 Warsaw, Poland
5
Institute of Computer Systems and Data Science, Faculty of Information Technologies, Latvia University of Life Sciences and Technologies, Liela Street 2, LV-3001 Jelgava, Latvia
*
Author to whom correspondence should be addressed.
Sustainability 2023, 15(17), 13237; https://doi.org/10.3390/su151713237
Submission received: 22 July 2023 / Revised: 23 August 2023 / Accepted: 29 August 2023 / Published: 4 September 2023
(This article belongs to the Special Issue Digital Transformation of Agriculture and Rural Areas)

Abstract

:
The agricultural and food production sectors have a predominant role in the bioeconomy of the European Union (EU), followed by wood production. These sectors make significant contributions not only to national economies but also to local areas, in particular the rural ones. Although the digitalisation of businesses within the bioeconomy sector transforms the enterprises, improving the value chains and creating benefits for the rural communities where these enterprises are situated, there are still many barriers to digitalisation. This study has a dual aim: first, to analyse bioeconomy in the EU and the state of digitalisation in the EU, and second, to assess the barriers of the bioeconomy sector and ways to support digital transformation within this sector, focusing on agriculture as the main contributor to bioeconomy in the EU, taking Lithuania, Latvia, and Poland as the case studies. The cluster analysis was explored for the study of the digitalisation and R&D indicators of the EU. The Analytic Hierarchy Process (AHP) was used to determine digitalisation scenarios of the bioeconomy sector in Latvia, Lithuania, and Poland. Four stakeholder groups were selected as experts for the study: (i) national government, (ii) advisory and extension, (iii) research, and (iv) entrepreneurship. The findings of the cluster analysis identified 4 clusters in the EU, showing different levels of digitalisation. Strong links between digitalisation and R&D were also found. In this context, Latvia, Lithuania, and Poland were assigned to the low-performing cluster. The results of the AHP for the case studies of Latvia, Lithuania, and Poland indicate the overall need for prioritization of support for digital transformation using national and EU funding to achieve better results. Nonetheless, AHP findings also suggested that the opinions of the national government, consulting, and research experts were more aligned throughout all three countries, but the entrepreneurs’ opinions differed from these groups. These findings provide quantitative information regarding digitalisation in the bioeconomy of the EU. They also offer additional qualitative information about scenarios and criteria for increasing the level of digitalisation in the bioeconomy sector in Latvia, Lithuania, and Poland, which could be useful for policy-makers. This research could also have practical implications for shaping the future trajectory of the bioeconomy policy.

1. Introduction

Bioeconomy is a well-defined concept for the academic domain, industries, governmental agencies, international organizations, farmers, and other groups of society. In the last decade, more than sixty countries worldwide, including developed and developing countries, have designed their bioeconomy strategies [1]. The idea of “bioeconomy” covers a wide-ranging interdisciplinary domain. It involves numerous applications in biotechnology and economics aimed at achieving a more sustainable approach to producing goods and aligning production processes more harmoniously with nature [2]. As indicated by Aguilar and Twardowski [3], the bioeconomy has been the catalyser in triggering the transition from the economic paradigm of a linear production system towards a circular bioeconomy leading to sustainable development.
The concept of bioeconomy is inseparable from a sustainable workforce, natural resource management, promotion of renewable resources, mitigation of climate change, and ensuring food security [4,5,6,7]. In recent years, digitalisation has become another important feature of the bioeconomy. In the context of bioeconomy, digitalisation shows a range of different operations commonly related to the collection, electronic processing, data exchange [8,9,10], and data monetization. Therefore, both the bioeconomy and the digital economy are described as two megatrends for the future that lead present economies toward transitions [11]. From the perspective of circular bioeconomy, the use of emerging technologies gives measurable benefits. For example, emerging technologies assist workers in making efforts towards circularity-based operational decisions and improve products’ economic and environmental sustainability through efficient resource utilization [12,13].
New digital tools are especially applicable in the primary sector of the bioeconomy, i.e., the agriculture sector. According to Rennings et al. [11] and Loy et al. [14], implementing digital technologies in the bioeconomy processes makes the economy more efficient. Agriculture is anticipated to have a significant role in propelling advancements in the digital economy, centred around progress made in smart or precision agriculture [15]. Digitalisation plays a central role in smart farming, encompassing the application of information and communication technologies to the identification, monitoring, analysis, and representation of the spatial characteristics of agricultural production in digital formats [16,17]. In the broader sense, digitalisation is associated with progress, efficiency, and processing speed and is applicable in all sub-sectors of the bioeconomy. Many of the benefits of digitalisation are related to increased efficiency through precise mechanisation, automation, and improved decision-making [18].
Unfortunately, digital transformation does not come with benefits only since the process involves overcoming technological, monetary, and personal barriers. These barriers correspond to the PEST criteria and are shown in Table 1 based on [18,19,20,21] research.
Eastwood et al. [19] conducted a comprehensive analysis of the barriers agriculture enterprises face in adopting digital applications. The most significant challenges related to digitalisation revolve around technological issues: data quality, reliability, security, and the integration of data with various systems. Moreover, digital transformation is associated with high investment costs into new technologies, making it feasible primarily for large and profitable agribusinesses. State institutions often lag in digitalising their systems, resulting in poor digital infrastructure and interconnectivity issues among systems, thereby hampering the flow of digitalized business data.
Additionally, a scarcity of skilled personnel in rural areas exacerbates the implementation of digitalisation. To address these issues, Eastwood et al. [21] advocate for a strong connection between national authorities, consultants, researchers, and entrepreneurs to foster better technological innovation and digitalisation processes. There is a shortage of qualified personnel in rural areas; therefore, the issue of digital skills is essential. In this context, as Eastwood et al. [21] supported, a strong connection between national authorities, consultants, researchers, and entrepreneurs should be achieved for better technological innovation and digitalisation processes.
Rübberdt [8] indicates the importance of data integration in the analysis of the bioeconomy sector because the bioeconomy future implies maximisation of sustainability and value creation from the available number of raw materials that would be inconceivable without integrated data systems. He also points out that although digitalisation activities have been implemented for some time in different domains of bioeconomy, they usually cover a particular sub-area in R&D or resource planning and activities of agriculture and forestry [8]. Here, Rübberdt [8] highlights the challenge of data linking and interpretation, particularly in agriculture and forestry. In this context, the data relating to the environment—such as soil constituents or moisture levels, as well as weather data—usually play a key role. However, data gaps are expected.
Literature suggests that an emphasis on digitalisation efforts is made in livestock farming involving different integrated operations to automate work processes [20,21,22,23]. Vik et al. [24] analysed the digitalisation processes in the Norwegian dairy sector. They discovered that the adoption of automated milking systems and other digital techniques is mostly related to the political and structural changes in the sector. On the one hand, these processes increased the social welfare of farmers by providing them with more leisure time. On the other hand, some farmers highlighted the lack of competencies in working with automated milking systems. A study by Goller et al. [20] analysing the digitalisation in agriculture in German dairy farms demonstrated the same challenges of digitalisation requiring deep knowledge and understanding of farming processes and effort to learn new skills and obtain new knowledge. The study revealed the positive effects of digitalisation both on farmers’ work and private life. A study by Langer, Kühl [22] highlighted the importance of societal attitude, namely, acceptance, which can influence the digital transformation in agriculture.
For the above reasons, it can be concluded that various barriers to implementing the digitalisation processes in bioeconomy activities persist, and ways to overcome or minimise them should be explored. In this context, this study aims to assess the barriers to the bioeconomy sector and ways to support digital transformation within the bioeconomy in the EU, focusing on agriculture as the main contributor to the bioeconomy in the EU, Latvia, Lithuania, and Poland. The paper is structured as follows: Section 2 explains the methodology applied in the research, Section 3 discusses the results of the empirical application, and Section 4 presents the discussion part and future research areas. The novelty of this study lies in its provision of quantitative data regarding digitalisation in the EU bioeconomy and qualitative insights into the potential for increased digitalisation within the bioeconomy sectors of Latvia, Lithuania, and Poland. These combined findings present a unique contribution that could inform policymakers and influence future bioeconomy policies. The flowchart of this study is reflected in Figure 1, depicting a breakdown of the study process into four consecutive stages, each composed of multiple steps.

2. Materials and Methods

The article comprises the results of the cluster analysis aimed at the exploration of the clusters of digital performance and R&D in the EU member states. Cluster analysis is applied based on the results of the factor analysis [25]. It is a statistical technique used in data analysis to identify groups or clusters within a dataset. The goal of cluster analysis is to group similar data points while keeping dissimilar points in separate clusters. This technique is particularly useful when there is no predefined labelling of the data and aims to uncover patterns and relationships that might not be immediately apparent. The cluster analysis was carried out by grouping the data from Eurostat that characterises the drivers for digitalisation. The data are grouped into five categories: Macro (main GDP aggregates per capita); Digital infrastructure (level of internet access in households); Individuals (internet use by individuals; level of digital skills; individuals using the internet for doing an online course); Enterprises and e-commerce (enterprises having received orders online; enterprises using software solutions to analyse information about clients for marketing purposes; internet purchases by individuals; share of enterprises’ turnover on e-commerce) and R&D (Research & Development) (R&D expenditure; share of government budget appropriations or outlays on R&D; R&D personnel, the numerator in full-time equivalent (FTE)) (The table with an extended list of indicators and data sources can be found in the study by Zeverte-Rivza et al. [25] where it was used for factor analysis).
The article also reflects the results of the use of the AHP method of evaluation of the scenarios and criteria for increasing the level of digitalisation in the bioeconomy sector. AHP analysis is among the most widely employed multicriteria methods among other decision-making methods such as TOPSIS, DEMATEL, ELECTRE, PROMETHEE, ANP, etc. [26,27]. The AHP is a decision-making framework developed by Thomas L. Saaty in the 1970s. It is a structured technique used to prioritize and make decisions when multiple criteria and alternatives are involved. The AHP method helps individuals or groups systematically analyse complex problems by breaking them down into a hierarchical structure. This method combines the evaluation of alternatives and the aggregation of results to determine the most suitable options. It is utilised for ranking alternatives or selecting the best option. The ranking or selection process revolves around an overarching objective, which is further divided into a set of criteria [28,29,30].
AHP stands out from similar decision-making approaches due to its focus on capturing both qualitative and quantitative aspects of decision-making through pairwise comparisons. Multi-Criteria Decision Analysis (MCDA): MCDA methods, like AHP, deal with decision problems involving multiple criteria. However, AHP emphasises pairwise comparisons and hierarchical structuring, which helps decision-makers better understand the interdependencies among criteria and alternatives. Sometimes, decisions are made by simply assigning weights to criteria and adding up the scores of alternatives. AHP, on the other hand, offers a more structured way to determine those weights through pairwise comparisons, making it less susceptible to subjective biases. Comparing AHP to ELECTRE and PROMETHEE methods, also used for multi-criteria decision analysis, the main difference is that these methods often rely on ranking or outranking alternatives based on predefined rules. AHP, in contrast, allows decision-makers to explicitly define the preferences and relative importance of criteria [26,27,28,29,30].
In essence, AHP’s strength lies in its ability to organize complex decisions systematically, involve stakeholder preferences through pairwise comparisons, and provide a coherent and logical framework for making informed choices.
The structure of the AHP for this study consists of 3 levels (Figure 2): The overall objective, or level 1, is intended to assess the scenarios and criteria for supporting digitalisation in the bioeconomy sector. Level 2, or the criteria level, comprises five criteria: market pressure for customers and other stakeholders; pressure from new regulatory measures; availability of technologies; advancement of digital skills and support (monetary, technical, or other). Level 3 involves the choice from 3 alternatives or scenarios: self-initiative from the enterprises of the sector or the (bottom-up scenario) that would foresee the initiative to introduce digital solutions in the bioeconomy sector coming from the sector itself, considering the needs of the enterprises and the market. This scenario would empower the enterprises to choose the digital pillars they would need to strengthen or introduce in their businesses and/or supply chains independently or in a self-coordinated alignment with other enterprises or supply chains they are a part of.
The second scenario—national and EU support/political prioritisation of digitalisation, or the top-down scenario—is a scenario in which specific digitalization aspects are given priority and assistance is extended to implement these priorities within enterprises’ digital profiles. Governmental or intergovernmental entities (such as the EU) are assuming the role of formulating digitalization policies and devising methods of assistance for implementing these policies across both governmental and enterprise domains.
The third scenario foresees a continuation of the existing path with a combination of market-driven and government initiatives.
The AHP was applied in Latvia, Lithuania, and Poland. To gather the results of the AHP, similar stakeholder groups were represented in all countries (see Table 2). The national government agency related to bioeconomy, regional development, and digitalisation was the Ministry of Agriculture in Lithuania and Poland and the Ministry of Environmental Protection and Regional Development in Latvia. The experts from agriculture consulting agencies of all three countries comprised the second group. The third group consisted of the researcher working in the thematic field of digitalisation and bioeconomy, and the fourth group—of the entrepreneurs.
The evaluation of the AHP criteria and scenarios is carried out by each expert according to the scale of relative importance. This type of nine-point scale has been elaborated by the founder of the AHP method—T.L. Saaty [31]. It evaluates the intensity of importance on a scale from 1 to 9, with 1 being equal importance of the compared activities and 9—absolute importance of the compared activities. The results of the evaluation of criteria and scenarios are then processed to calculate the summary results and their min-max distribution among countries and within stakeholder groups. The soundness of the application of the AHP is checked by the consistency ratio (CR), which needs to be below 0.2 [31]. It was tested during the application of the AHP model, and the CR criteria were fulfilled.

3. Results

3.1. Bioeconomy in the European Union

The bioeconomy is a concept that appeared in the strategic documents of the European Union (EU) at the beginning of the new century (see Table 3). It has been adopted by individual member states and their regions in response to the scientific and research domain, the economic sector, and public authorities to the challenges of modernity [32]. The main challenges related to this are the growing world population, the accelerating depletion of certain resources, especially non-renewable ones, including fossil energy sources, the growing pressure of the industrial sector on the environment, and adverse climate change [33].
The current interest in bioeconomy issues stems from several challenges faced by the global economy, which include sustainable management of natural resources, sustainable production, improving public health, mitigating the adverse effects of climate change, integrating social and economic development, and global sustainability [34]. For this reason, the bioeconomy has become an essential area of interest for the European Union and a critical element in the implementation of various policies. In 2012, the concept of bioeconomy development was reflected in the European Union’s Bioeconomy strategy—Innovating for Sustainable Growth. A Bioeconomy for Europe [33]. In the bioeconomy development program, the European Commission identified several priority goals, the implementation of which would lay the groundwork for the development of a more innovative, resource-efficient, and competitive society, in which ensuring food security would be realized under conditions that protected the natural environment, while at the same time enabling the use of renewable resources in other industrial sectors [33]. The goals formulated in this way indicated the need to support the development, in EU countries, of the production of renewable biological resources and the conversion of these resources and waste streams into higher value-added products, such as food, feed, bio-based products, and bioenergy.
Table 3. Selected definition of bioeconomy.
Reference Defining Methods of Bioeconomy
Enriquez, Martinez [35]All economic actions obtained from scientific and/or research activity focused on understanding mechanisms and processes at the genetic/molecular levels and their application to industrial processes.
EC DG Research [36]All production systems involving biophysical and biochemical processes, and thus encompassing all the life sciences and related general technologies necessary to produce useful products; biotechnology applications in agriculture and industry, such as biorefineries, bioenergy and biochemicals, are an essential part of the biobased economy; it also includes new forms of land and sea utilisation (such as those that improve ecosystem services and other public goods), as well as the use of materials currently considered waste.
OECD [37] Converting life science knowledge into new, sustainable, eco-efficient, and competitive products.
BECOTEPS [38] Refers to the sustainable production and conversion of biomass into a range of food, health, fibre, and industrial products and energy.
EC DG Research [39] An economy utilising biological resources from the land and sea and waste, including food wastes, as inputs to industry and energy production cover bio-based processes for green industries.
EC DG Research [33] Bioeconomy includes the production of renewable biological resources and the transformation of these resources and waste streams into value-added products such as food, feed, bio-based products and bioenergy. The bioeconomy is based on life sciences, agronomy, ecology, food and social sciences, biotechnology, nanotechnology, information and communication technologies (ICT), and engineering. It encompasses the sectors of agriculture, forestry, fisheries, food, pulp and paper production, and parts of chemical, biotechnological and energy industries.
McCormick, Kautto [40] An economy where the basic building blocks for materials, chemicals and energy are derived from renewable biological resources, such as plant and animal sources.
GBS [41] Production, utilisation, and regeneration of resources, including connected knowledge, outcome of research, and innovation, to provide information, products, processes, and services within and across all economic sectors to reach sustainable economic development.
Birner [42] The knowledge-based production and utilisation of biological resources, innovative biological processes and principles to sustainably provide goods and services across all economic sectors
CBE JU [43] The bioeconomy is an emerging—and rapidly growing—sector that will play a key role in the sustainable production of renewable biological resources from both land and aquatic environments.
Source: own study […] Maciejczak M. et al. [44], Adamowicz [45].
The main aim was to maximize its contribution to the 2030 Agenda, the Sustainable Development Goals (SDGs), and the Paris Agreement. This update is also related to the new European policy priorities, all of which emphasise the significance of a sustainable, circular bioeconomy to meet their goals. More specifically, they are included in the revised Industrial Policy Strategy, the Circular Economy Action Plan, and the Communication on Accelerating Innovation in Clean Energy. The reviewed Strategy for Sustainable Bioeconomy in Europe endorses the five goals, but in the context of the revised policy, proposes three key priorities, namely: Strengthening and scaling up the bio-based sectors, unlocking investments and markets; Rapidly deploying local bioeconomies across Europe, and Understanding the ecological boundaries of the bioeconomy [46].
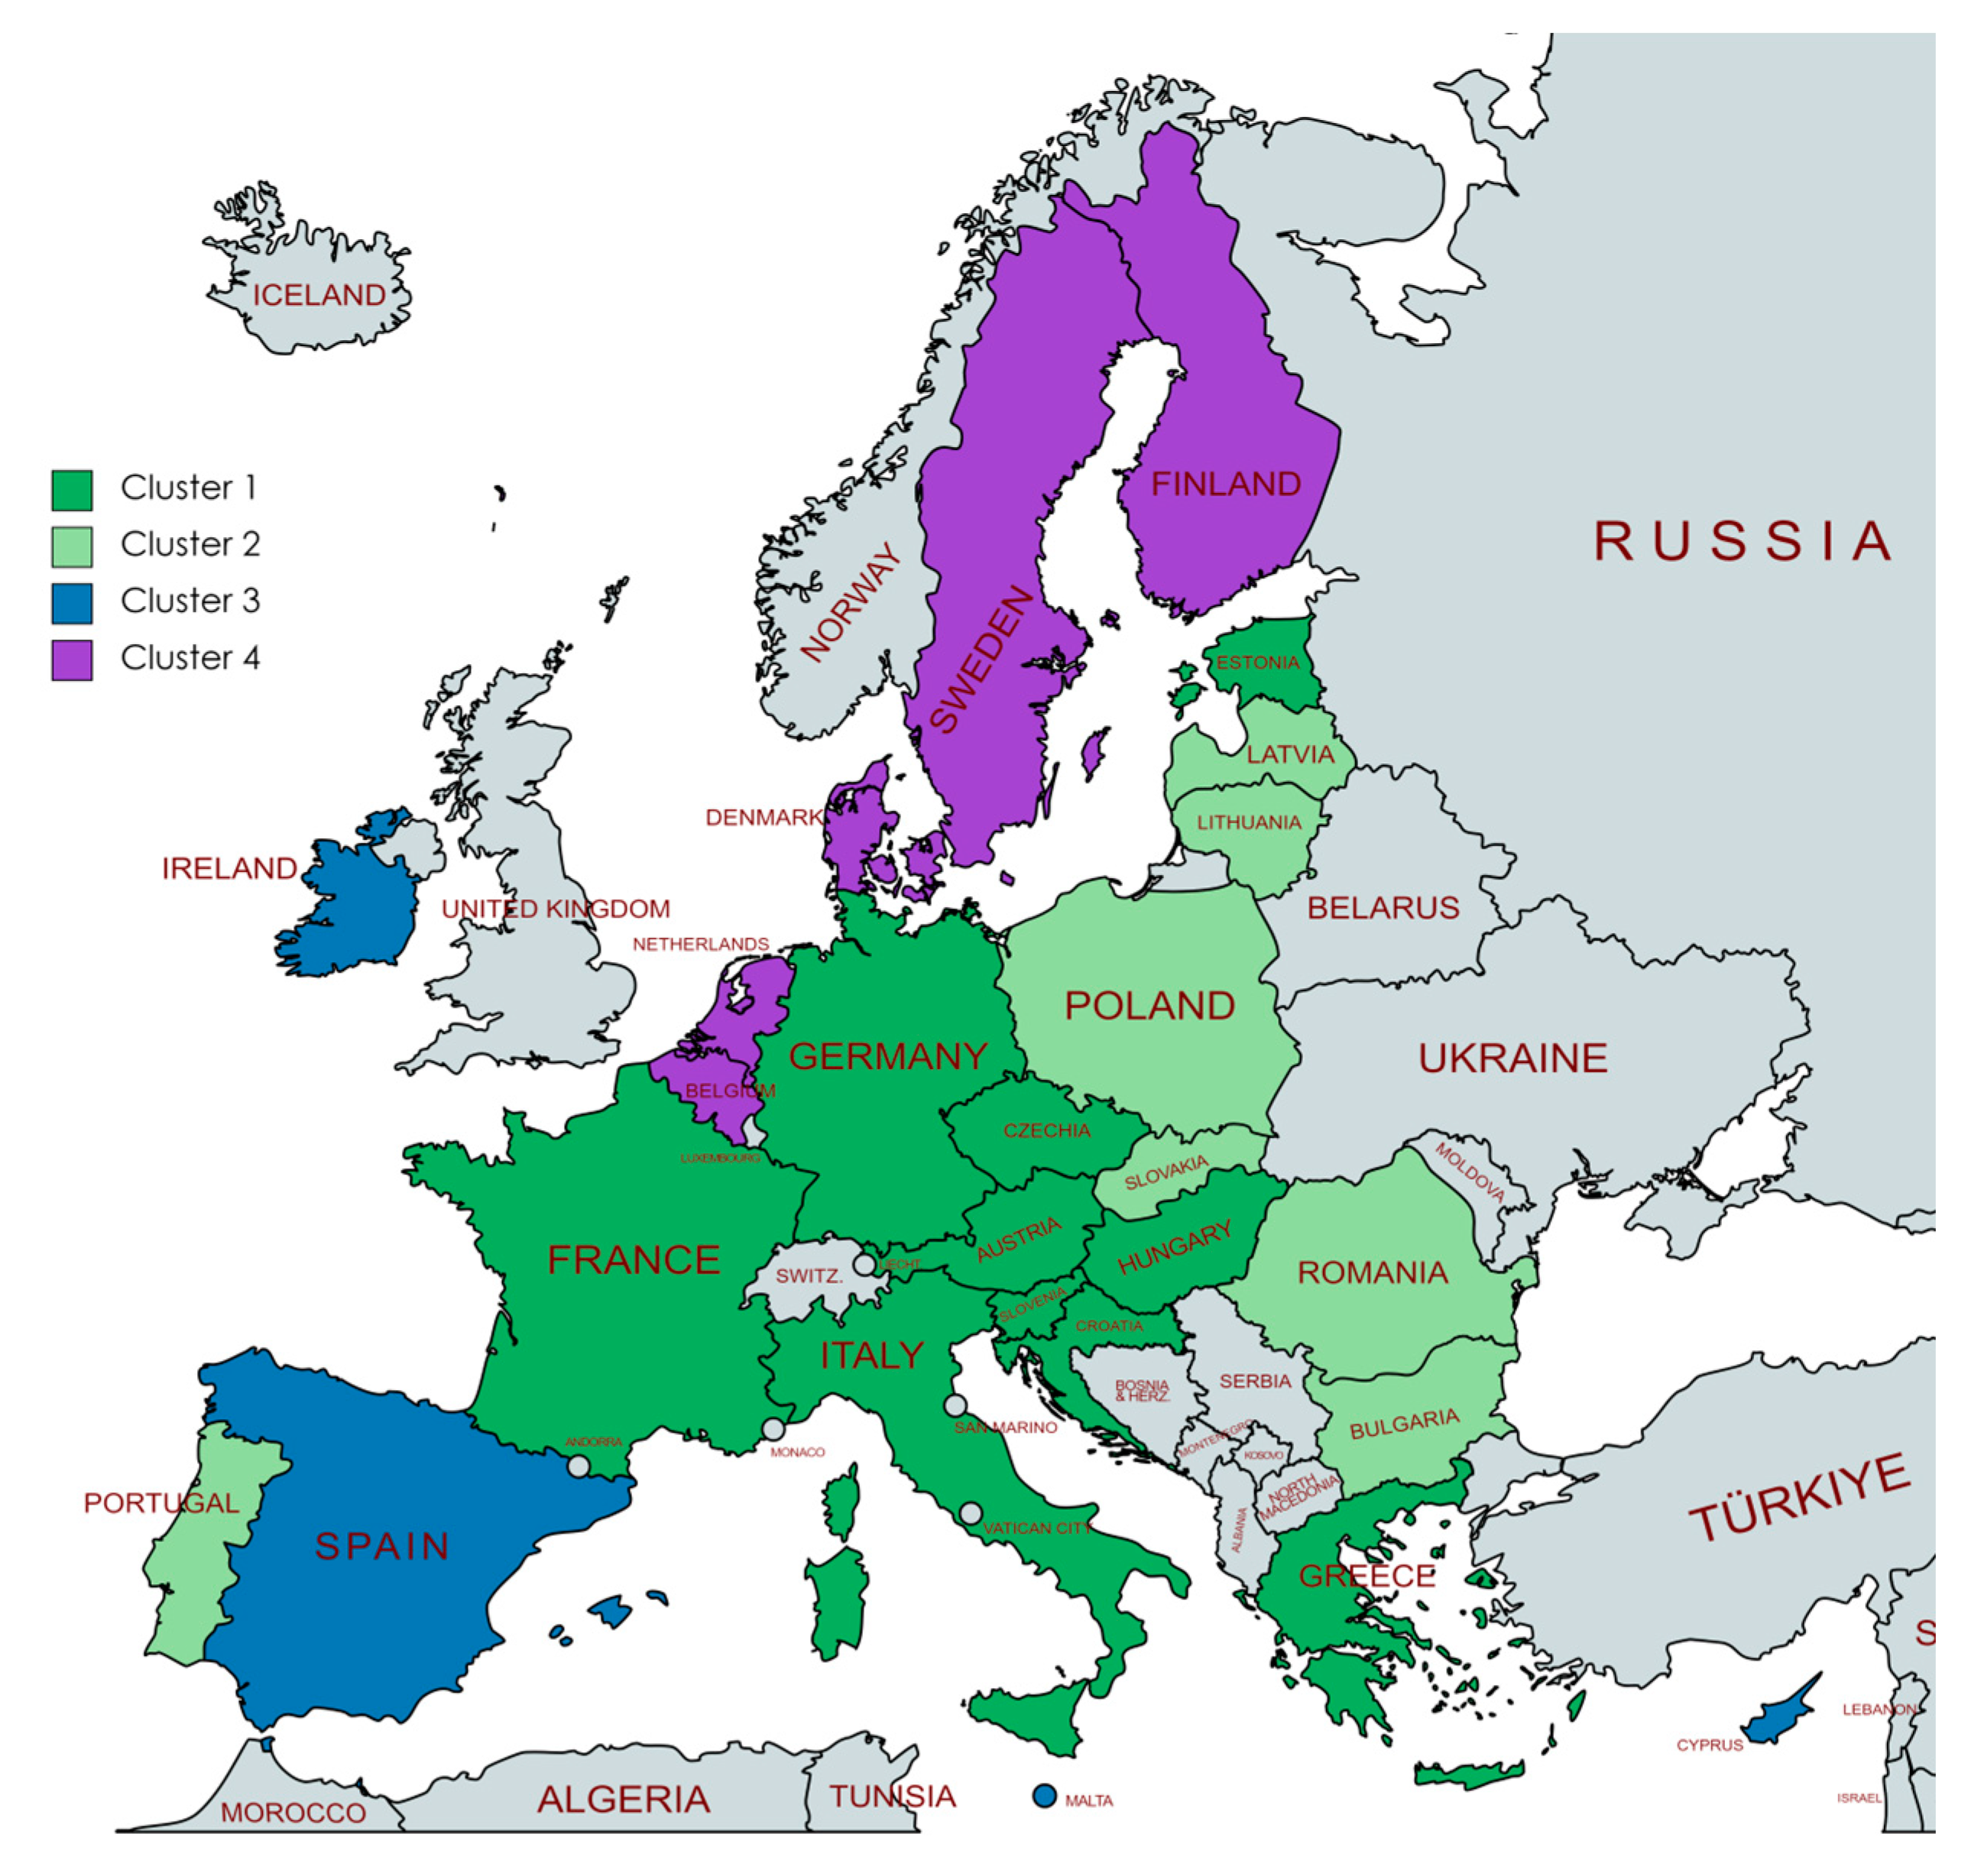
According to the JRC report Trends in the Bioeconomy, as of 10 December 2022 of the EU27 countries had national bioeconomy strategies (i.e., Austria, France, Finland, Germany, Ireland, Italy, Latvia, The Netherlands, Portugal, Spain) and seven countries were in the process of development of their national strategies (i.e., Czechia, Croatia, Hungary, Lithuania, Poland, Sweden, and Slovakia) [47]. It should also be pointed out that currently, there are three macro-regional bioeconomy initiatives engaging governmental authorities in Europe. These include BIOEAST—Central-Eastern European Initiative for Knowledge-based Agriculture Aquaculture and Forestry in the Bioeconomy (https://www.norden.org/en/bioeconomy (accessed on 23 May 2023)), Nordic bioeconomy (https://www.matis.is/media/utgafa/actions_for_sustainable_bioeconomy_in_the_west_nordic_region.pdf (accessed on 23 May 2023)), and Bioeconomy in the Baltic Sea Region (http://bsrbioeconomy.net/ (accessed on 25 May 2023)).
In 2019, the bioeconomy created more than 17.42 million jobs (plus one million new green jobs anticipated by 2030) and more than EUR 2.346 trillion in annual turnovers in the EU.
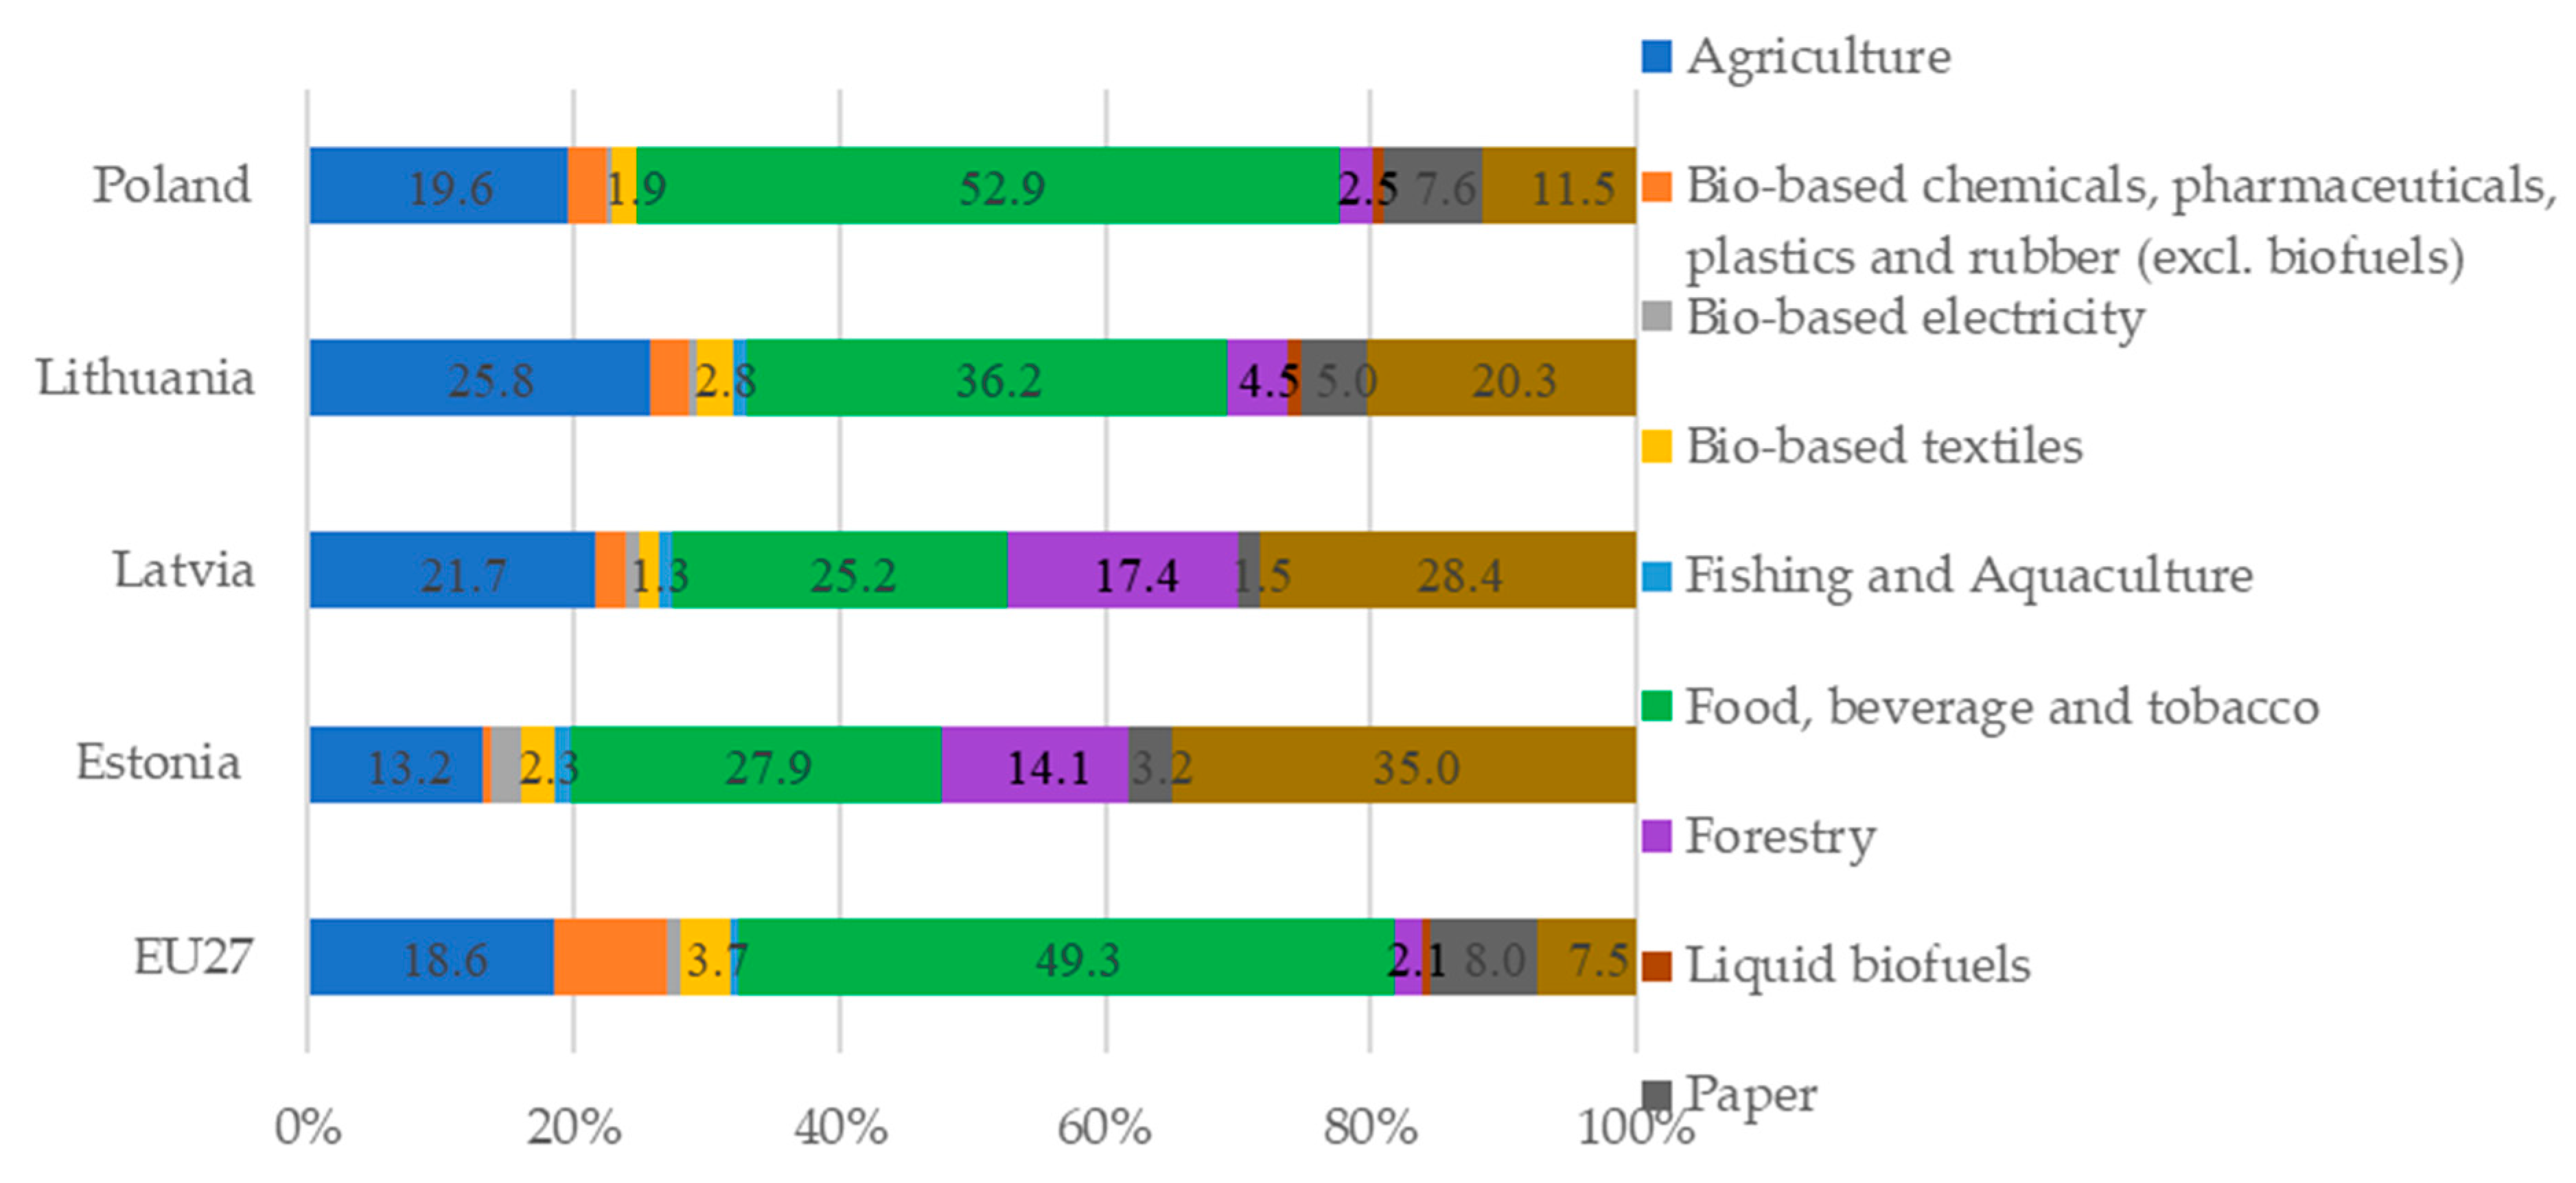
According to the 2019 data, the largest share (68%) of the EU bioeconomy turnover was recorded by agriculture and food production (Table 4 and Figure 3). In 2019, 49.3% of the turnover of the EU bioeconomy came from the food, beverage, and tobacco industries, i.e., €967 billion in food production, €153,67 billion in beverage production and €36.16 billion in tobacco production, which was €1.157 trillion in total. The second largest share in the EU bioeconomy turnover was generated by Agriculture—€437 billion (18.63%). The next sectors are as follows: bio-based chemical sector (8.39%), paper production industry (8.04%), and production of wood products and furniture (7.53%).
A comparable situation can be observed when analysing value added in the bioeconomy: in 2019, the total value added was €57 billion, the majority of which was generated by food, beverage and tobacco production (€237.46 billion) and agriculture (€192.8 billion). Each sector generated about a third of the total value added in the bioeconomy. Within this group, the highest value added was generated by the bio-based chemicals sector (€64.52 billion), production of wood products and furniture (€49.6 billion), and paper industry (€48.21 billion).
The evaluation of turnover of the bioeconomy sectors in Estonia, Latvia, Lithuania, and Poland indicates variability (Figure 3), from €7.58 billion in Estonia (0.32% of the turnover of the bioeconomy sector in EU27) to €146.88 billion in Poland (6.26% of the turnover of the bioeconomy sector in EU27).
Analysing the structure of turnover of the bioeconomy in Lithuania and Poland in 2019, it can be seen that the largest part of turnover is accounted for by food, beverage, and tobacco production (respectively 36.2%, i.e., €3.2 billion; 52.9%, i.e., €28.9 billion) followed by agriculture, wood production and furniture. Simultaneously, in Estonia and Latvia, the largest part of turnover came from the production of wood products and furniture (35%, i.e., €2.7 billion; 28.4%, i.e., €2.3 billion, respectively (notably from wood products), followed by food, beverage and tobacco production and agriculture. A relatively significant share of the turnover structure was also accounted for by forestry. The analysis of the value added in the bioeconomy of the studied countries has shown a similar structure.
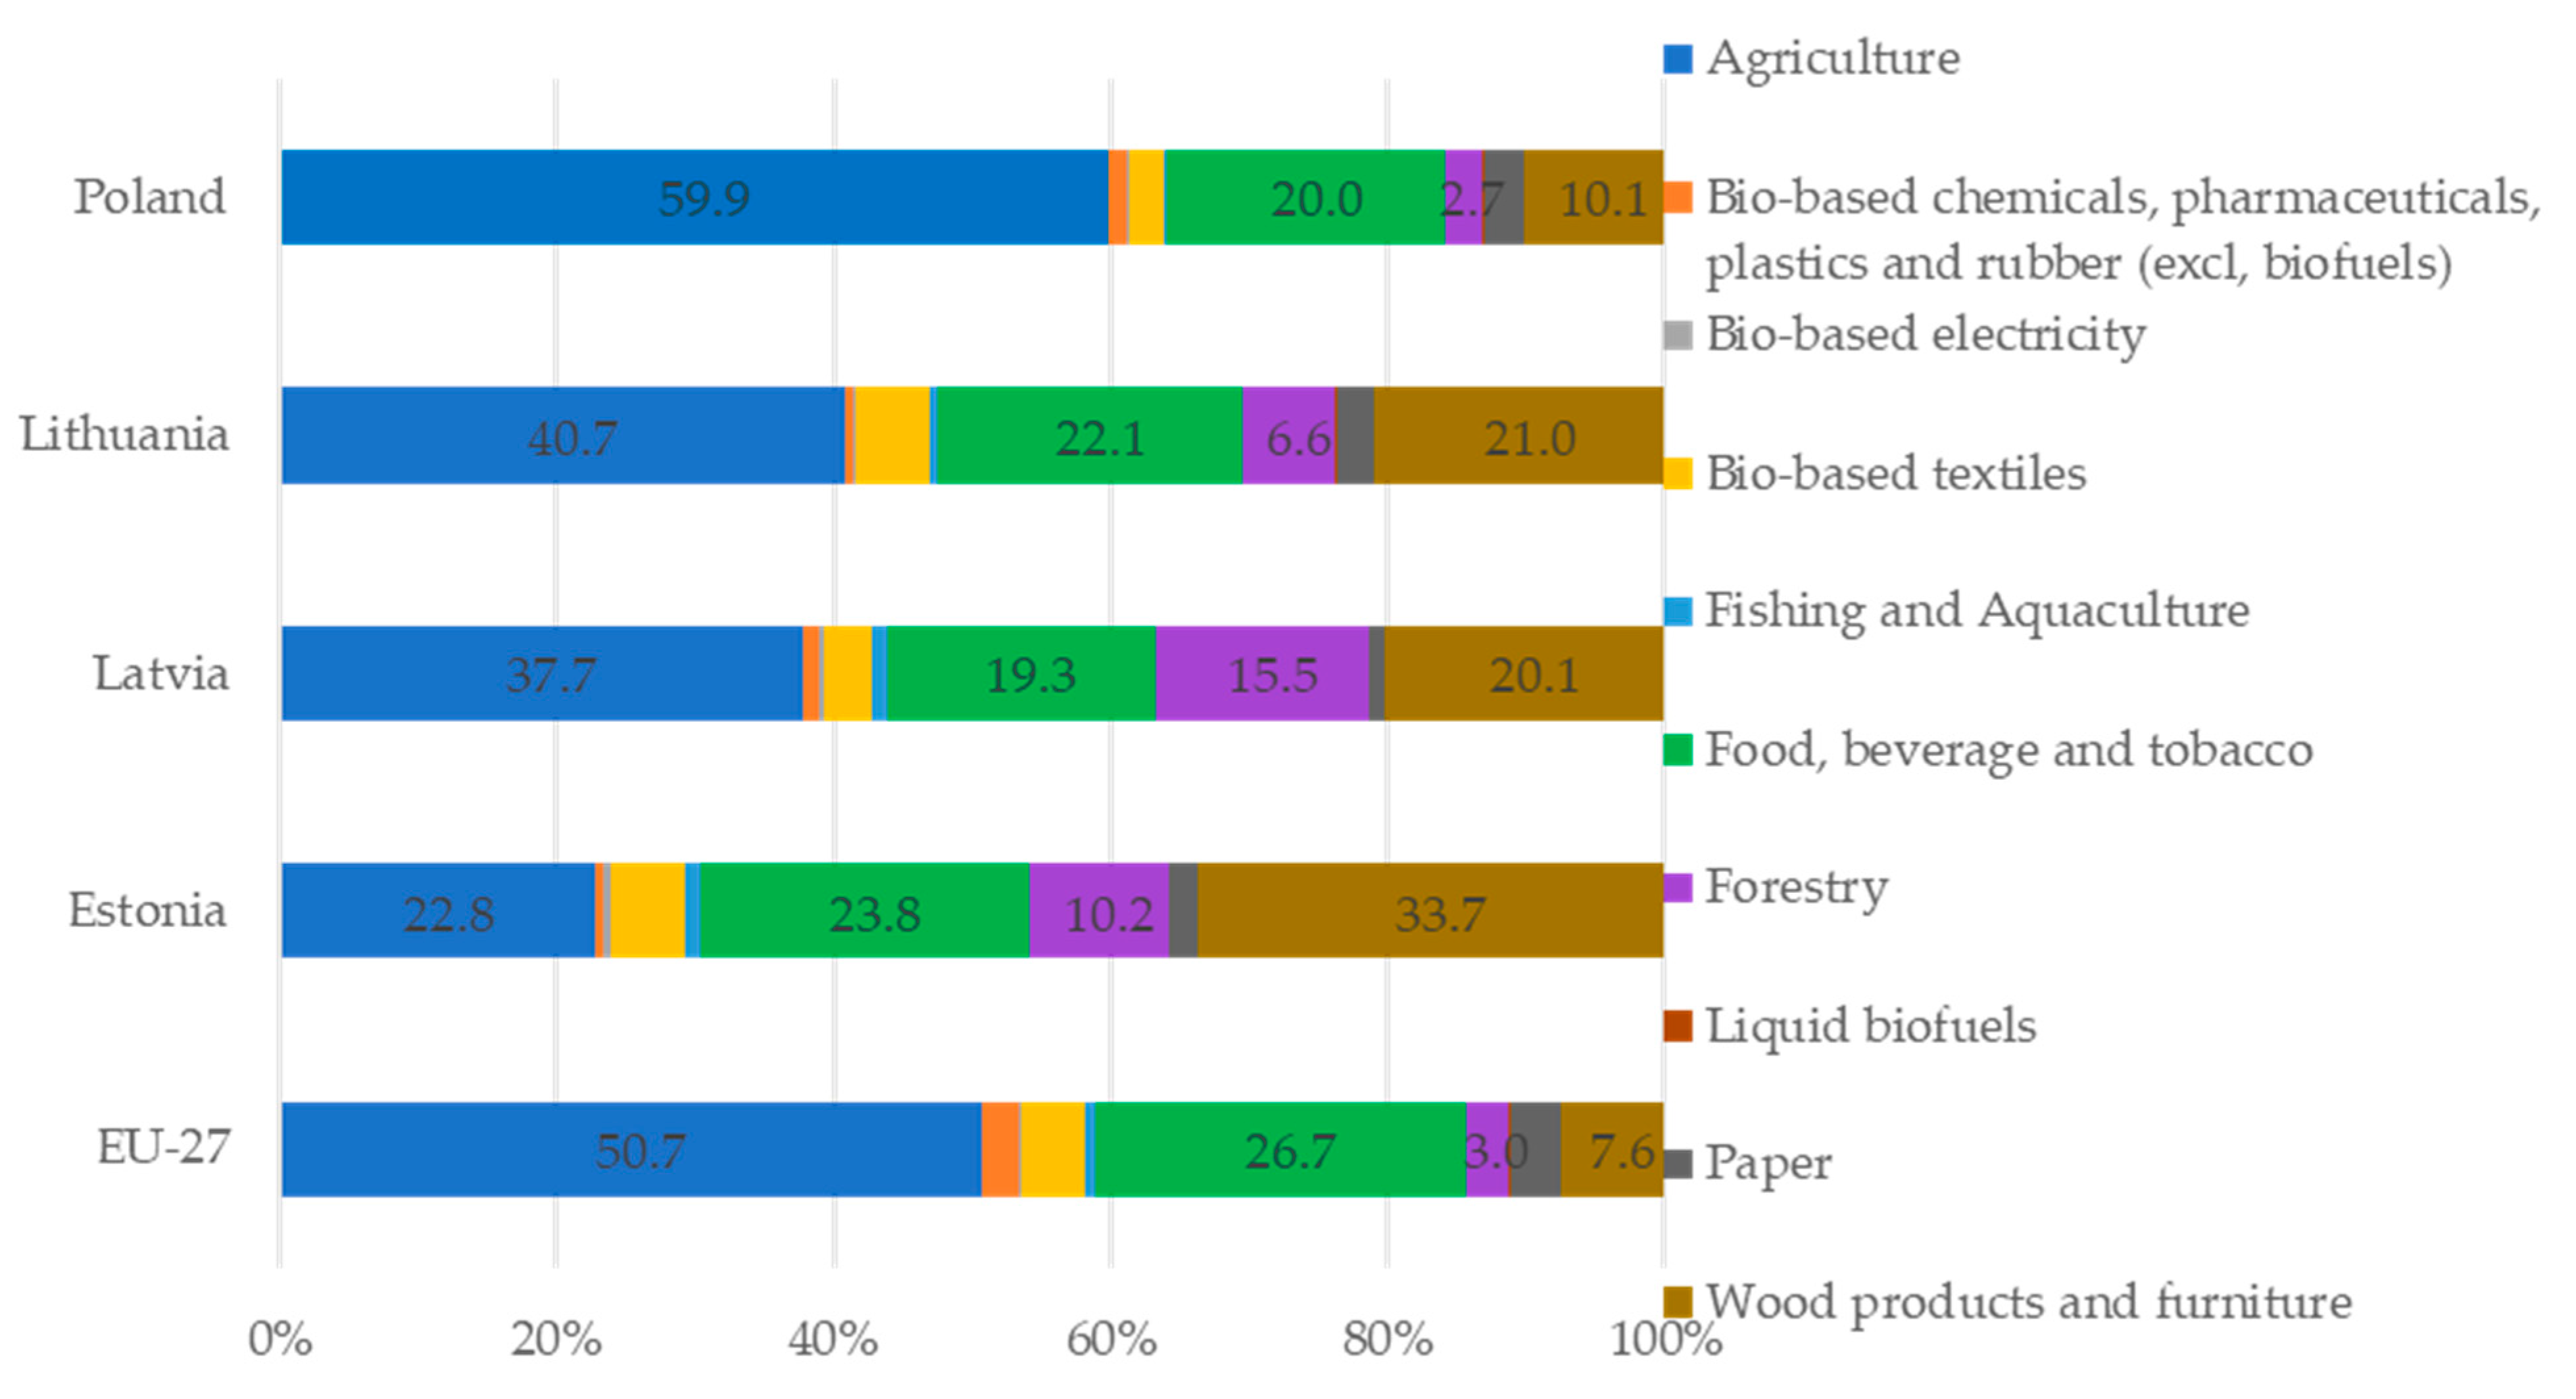
The analysis of the employment in the bioeconomy sectors (Table 5, Figure 4) has suggested the prevalence of agriculture and food production, which together accounted for 78% of total employment in the bioeconomy. In 2019, 17.42 million people were employed in the bioeconomy of the EU27; specifically, 8.83 million were employed in agriculture and 4.66—in food production.
Employment analysis in the bioeconomy sectors in Estonia, Latvia, Lithuania, and Poland has indicated variability (Figure 4), from 61.7 thousand people employed in Estonia (0.3% of people employed in the bioeconomy sector in EU27) to 2.3 million people employed in Poland (14% of people employed in bioeconomy sector in EU27). Latvia, Lithuania, and Poland recorded the highest share of employment in the agricultural sector, while in Estonia, the largest number of people employed was in wood products and furniture. In Latvia and Lithuania, it could also be noticed that a large share of people working in the bioeconomy sector was employed in the production of wood products and furniture (20.1%; 21%). The second sector registering high employment was food production (respectively, Estonia—23.8%, Latvia—19.3%, Lithuania—22.1%, and Poland 20%).

3.2. Digitalisation in the Baltic States and Poland

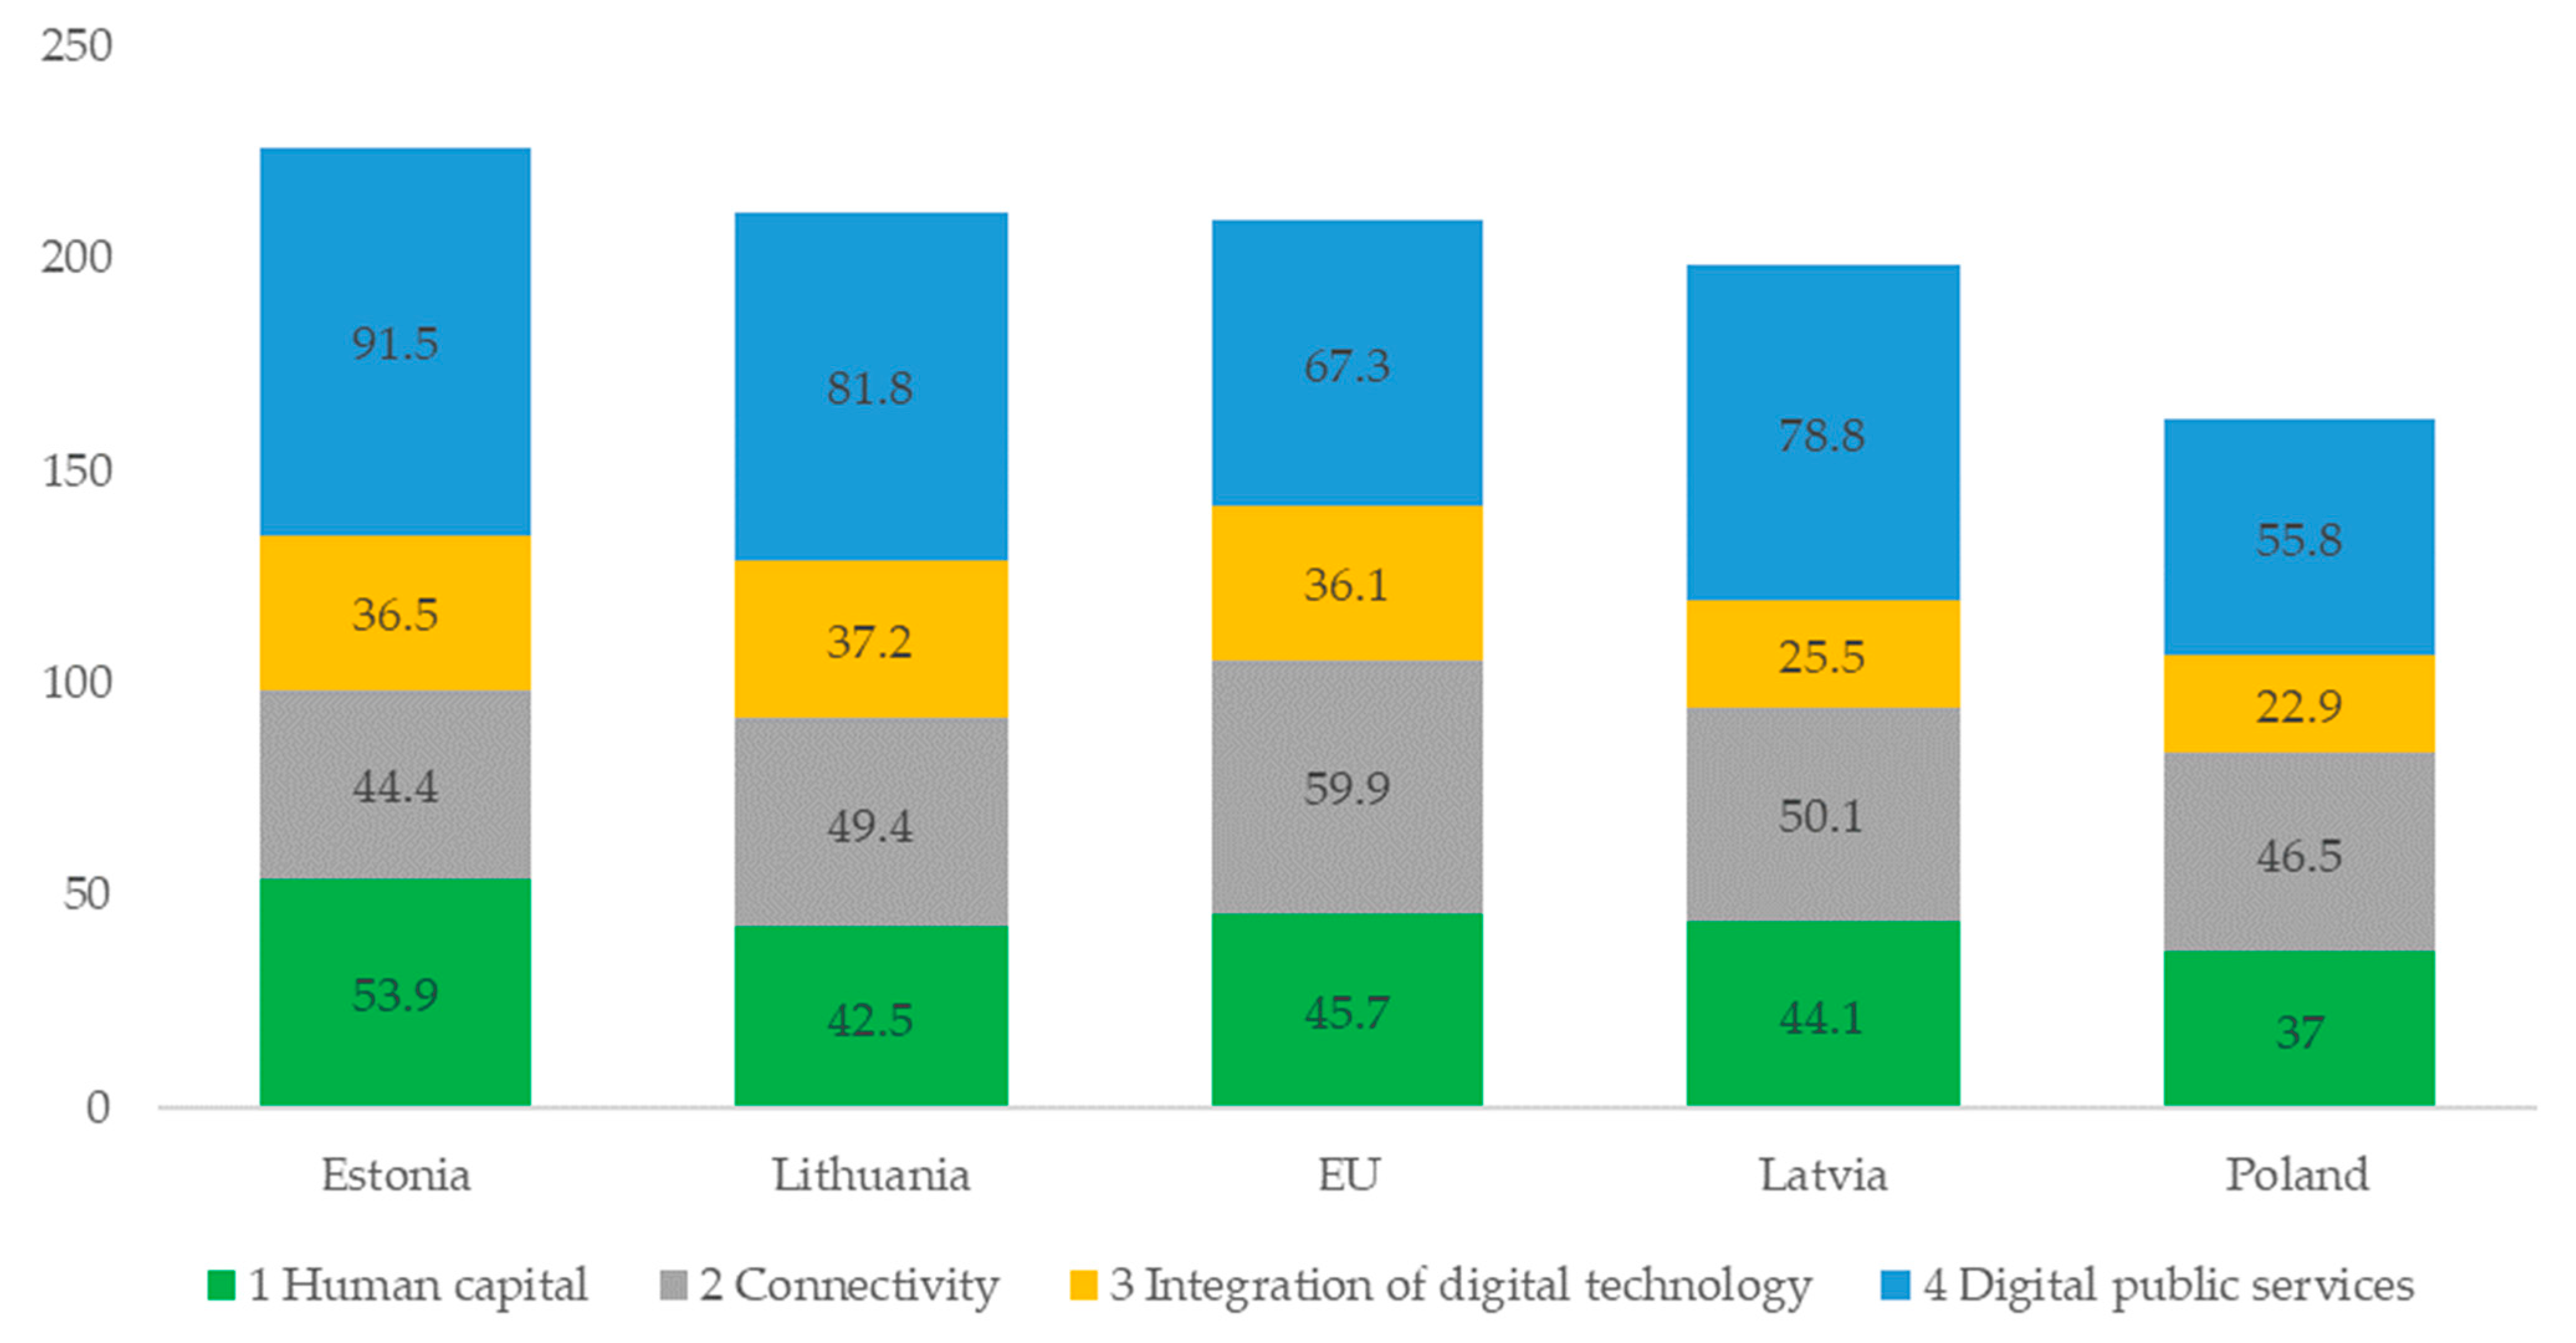
Digitization in the EU is reflected in the Digital Economy and Society Index (DESI), calculated annually and showing the progress of digital transformation achieved in EU member countries. The newest DESI report of 2022 relied on the data of 2020, i.e., after the introduction of the pandemic-related restrictions (Figure 5) [48].
During the COVID-19 pandemic, the member states were advancing their digitalisation efforts. Nonetheless, they continue to struggle to close the gaps in digital skills, the digital transformation of SMEs, and the rollout of advanced 5G networks.
The EU has made significant resources available to support digital transformation by allocating EUR 127 billion to digital reforms and investments under the National Recovery and Resilience Plans. This presented an opportunity to accelerate digitalisation, make the Union more resilient, and reduce external dependencies through reforms and investments. On average, the member states allocated 26% of their funds subject to allocation under the Recovery and Resilience Facility (RRF) to digital transformation, exceeding the mandatory 20% threshold. Austria, Germany, Luxembourg, Ireland, and Lithuania are the countries that have chosen to invest more than 30% of their RRF allocation into digital technology.
Estonia ranked 9th, and Lithuania ranked 14th of 27 EU member states in the 2022 edition of the DEXI. Both countries performed well and ranked above the EU average by the majority of indicators, except for connectivity in the case of Estonia and connectivity and human capital in the case of Lithuania. Estonia’s performance growth was slower than in other countries with similar DESI results. Between 2017 and 2022, Estonia raised its score by about 6.5% each year, compared to the EU average of 7.5%. Lithuania was close to the average in many indicators, but the country’s progress has slowed over the past five years, and catching up with the most digitalised EU countries has not been as fast as it could have been. Lithuania still has prospects to improve the digital skills of its population and to invest in retraining and upskilling its workforce, as it presently ranks 20th in the DESI human capital dimension.
Meanwhile, Latvia and Poland ranked lower than the average of the 27 EU member countries in DESI 2022 (17th and 24th, respectively). Latvia’s DESI index has grown at a slower rate than in the majority of other EU countries over the past few years, while Poland’s DESI index has grown slightly more than the EU average. Still, neither country has yet managed to catch up with other member states.

3.3. Cluster Analysis by the Digitalisation and R&D Indicators of EU Member States

Cluster analysis was performed based on the factor analysis using the group of indicators described in Section 2. The factor analysis determined a group of indicators associated with Factor 1—Digitalisation level and Factor 2—R&D level. ANOVA results indicate that both factors are significant for cluster analysis (Table 6) with Sig. < 0.05.
The EU member states were grouped into 4 clusters (see Table 7 and Table 8). The 1st cluster consists of most of the EU member states—10—and is characterised by a rather high score of R&D level for the cluster member states but a comparatively lower score for the digitalisation level.
The country closest to the cluster centre is France, and Germany is the furthest from the cluster centre. Germany is characterised by higher R&D scores than the rest of the group but lower scores for the digitalisation level. Moreover, one of the Baltic states—Estonia—also belongs to the 1st cluster. This could be viewed as an accomplishment for Estonia and a result of its strategic focus towards digitalisation and investments in R&D [49,50]. The 2nd cluster features lower-performing member states by both criteria and consists of 7 EU member states, including Latvia, Lithuania, and Poland. The countries that are the furthest away from the cluster centre are Romania and Bulgaria, whose results of the analysed indicators are lower than the rest of the group. The 3rd cluster consists of the EU member states with high scores in the digitalisation level but low scores in R&D. The last 4th cluster unites the highest performing EU member states both in the digitalisation and R&D levels—Belgium, Denmark, Luxembourg, Netherlands, Finland, and Sweden.
The mapping (Figure 6) of the cluster membership allows us to distinguish three characteristic regions: Central European states with a fairly good level of both factors, lower-performing Eastern and Western parts of Europe, and the highest-performing Central and Northern Europe. This allows us to assume the importance of historical and geopolitical factors in the development of the country’s path towards digitalisation. It also highlights Estonia’s previously mentioned successful direction of strategic priority for digitalisation and funding for R&D that enables it to be listed among the states of Cluster 1 instead of Cluster 2, which includes Latvia, Lithuania, Poland, and other countries of this region.

3.4. Evaluation of Scenarios and Criteria for Increasing the Level of Digitalisation in the Bioeconomy Sector
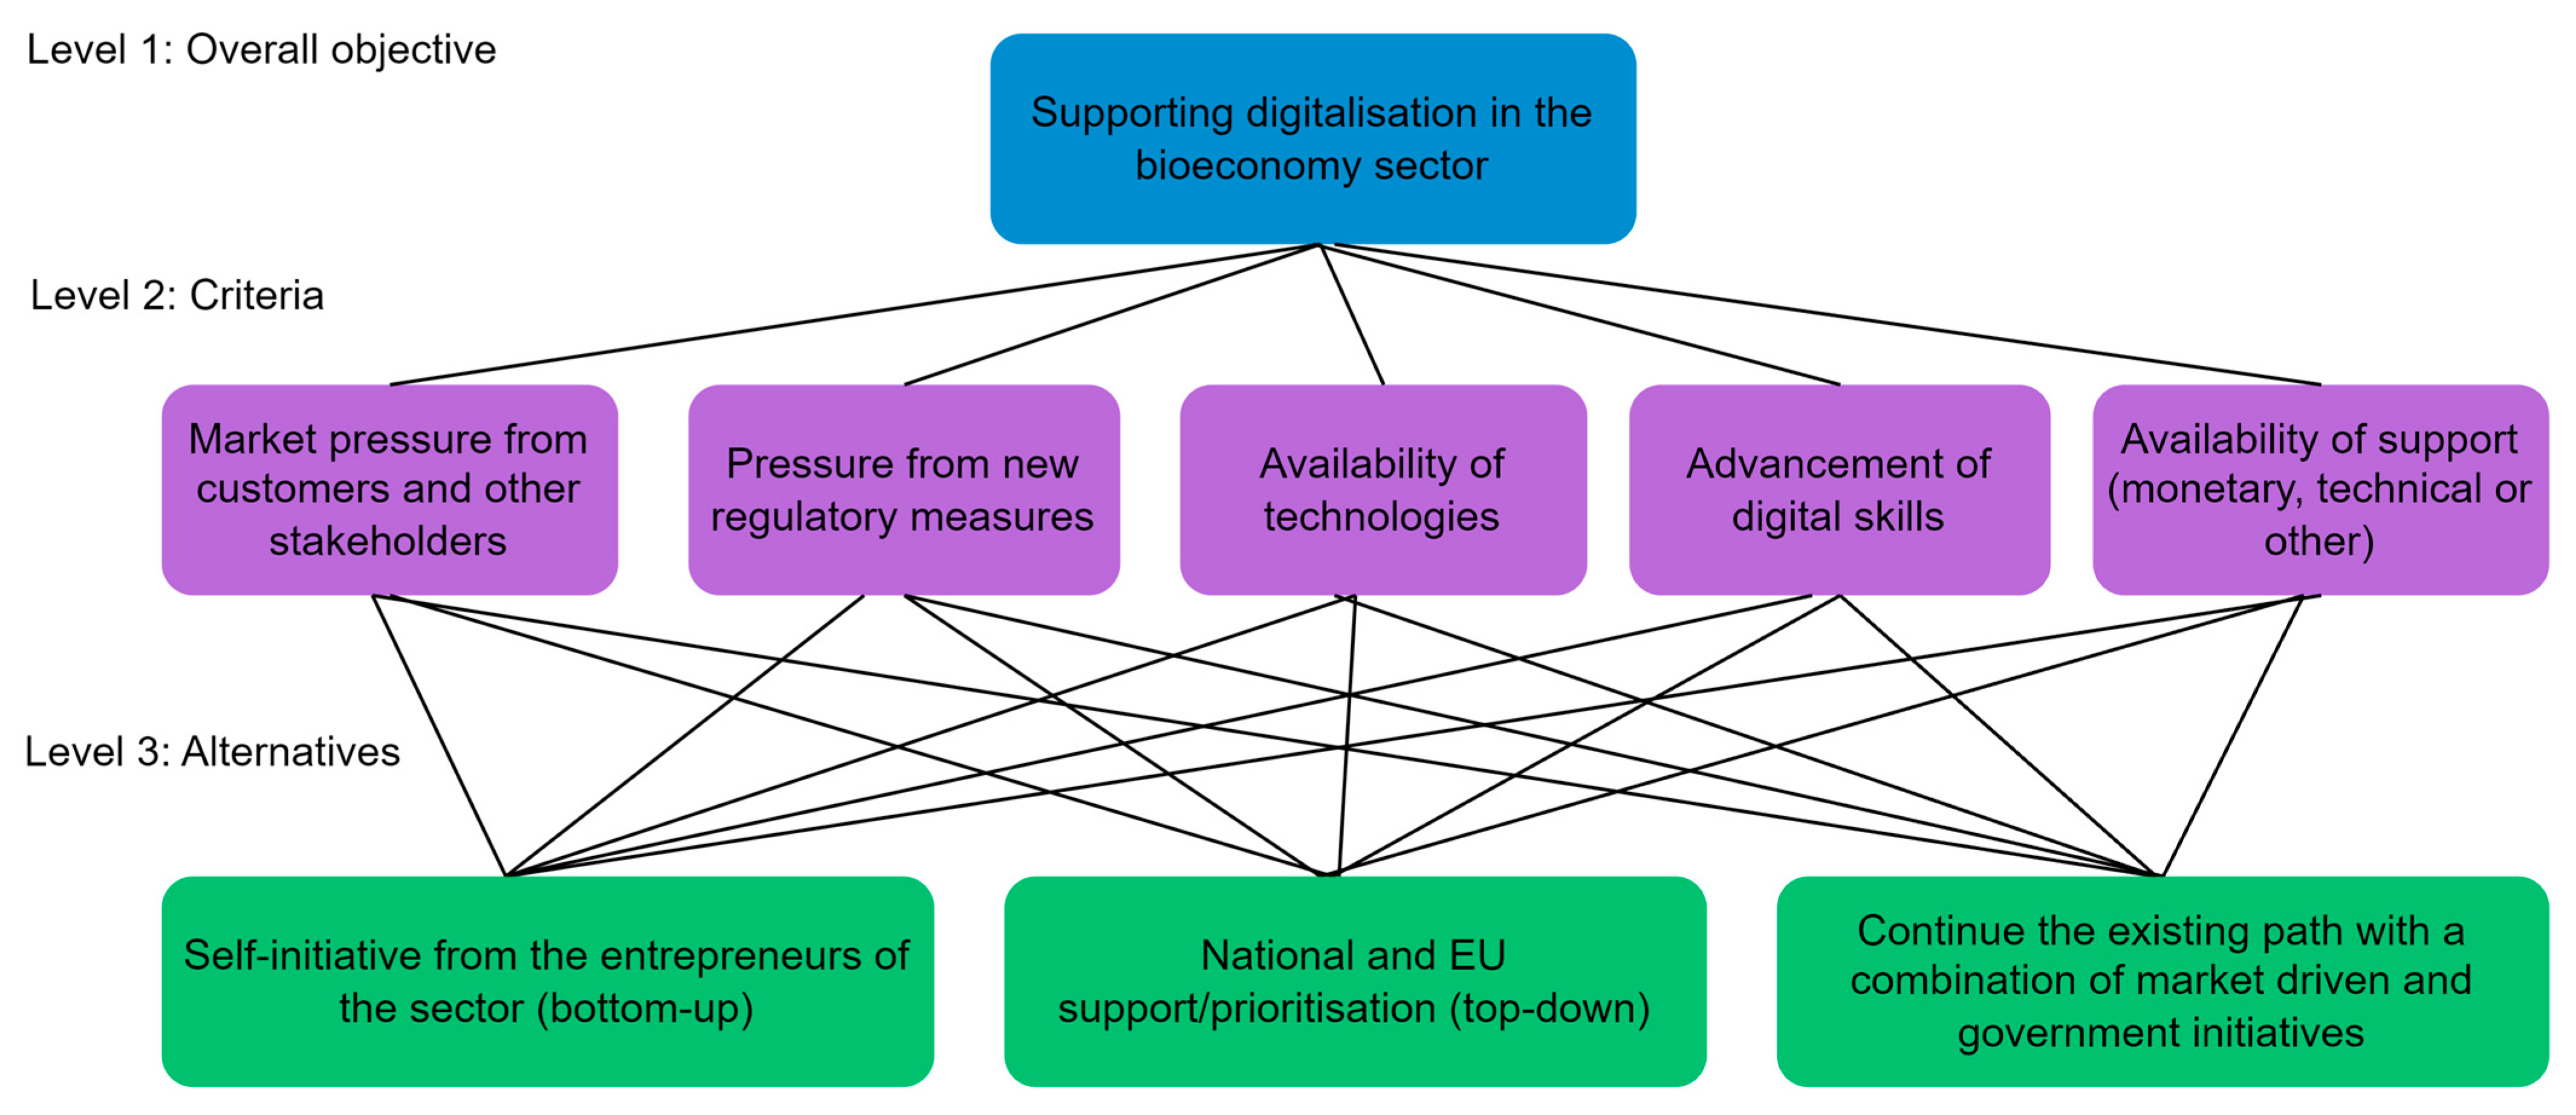
As mentioned in Section 2, covering the research methods, the structure of the AHP for this study consists of 3 levels. Level 1 is the overall objective to assess the scenarios and criteria for supporting digitalisation in the bioeconomy sector. Level 2, or the criteria level, consists of 5 criteria:
1. Market pressure for customers and other stakeholders;
2. Pressure from new regulatory measures;
3. Availability of technologies;
4. Advancement of digital skills;
5. Availability of support (monetary, technical, or other).
Level 3 involves three alternatives or scenarios:
1. Self-initiative from the enterprises of the sector (bottom-up scenario);
2. National and EU support/political prioritisation of digitalisation (top-down scenario);
3. A scenario that implies a continuation of the existing path with a combination of market-driven and government initiatives.
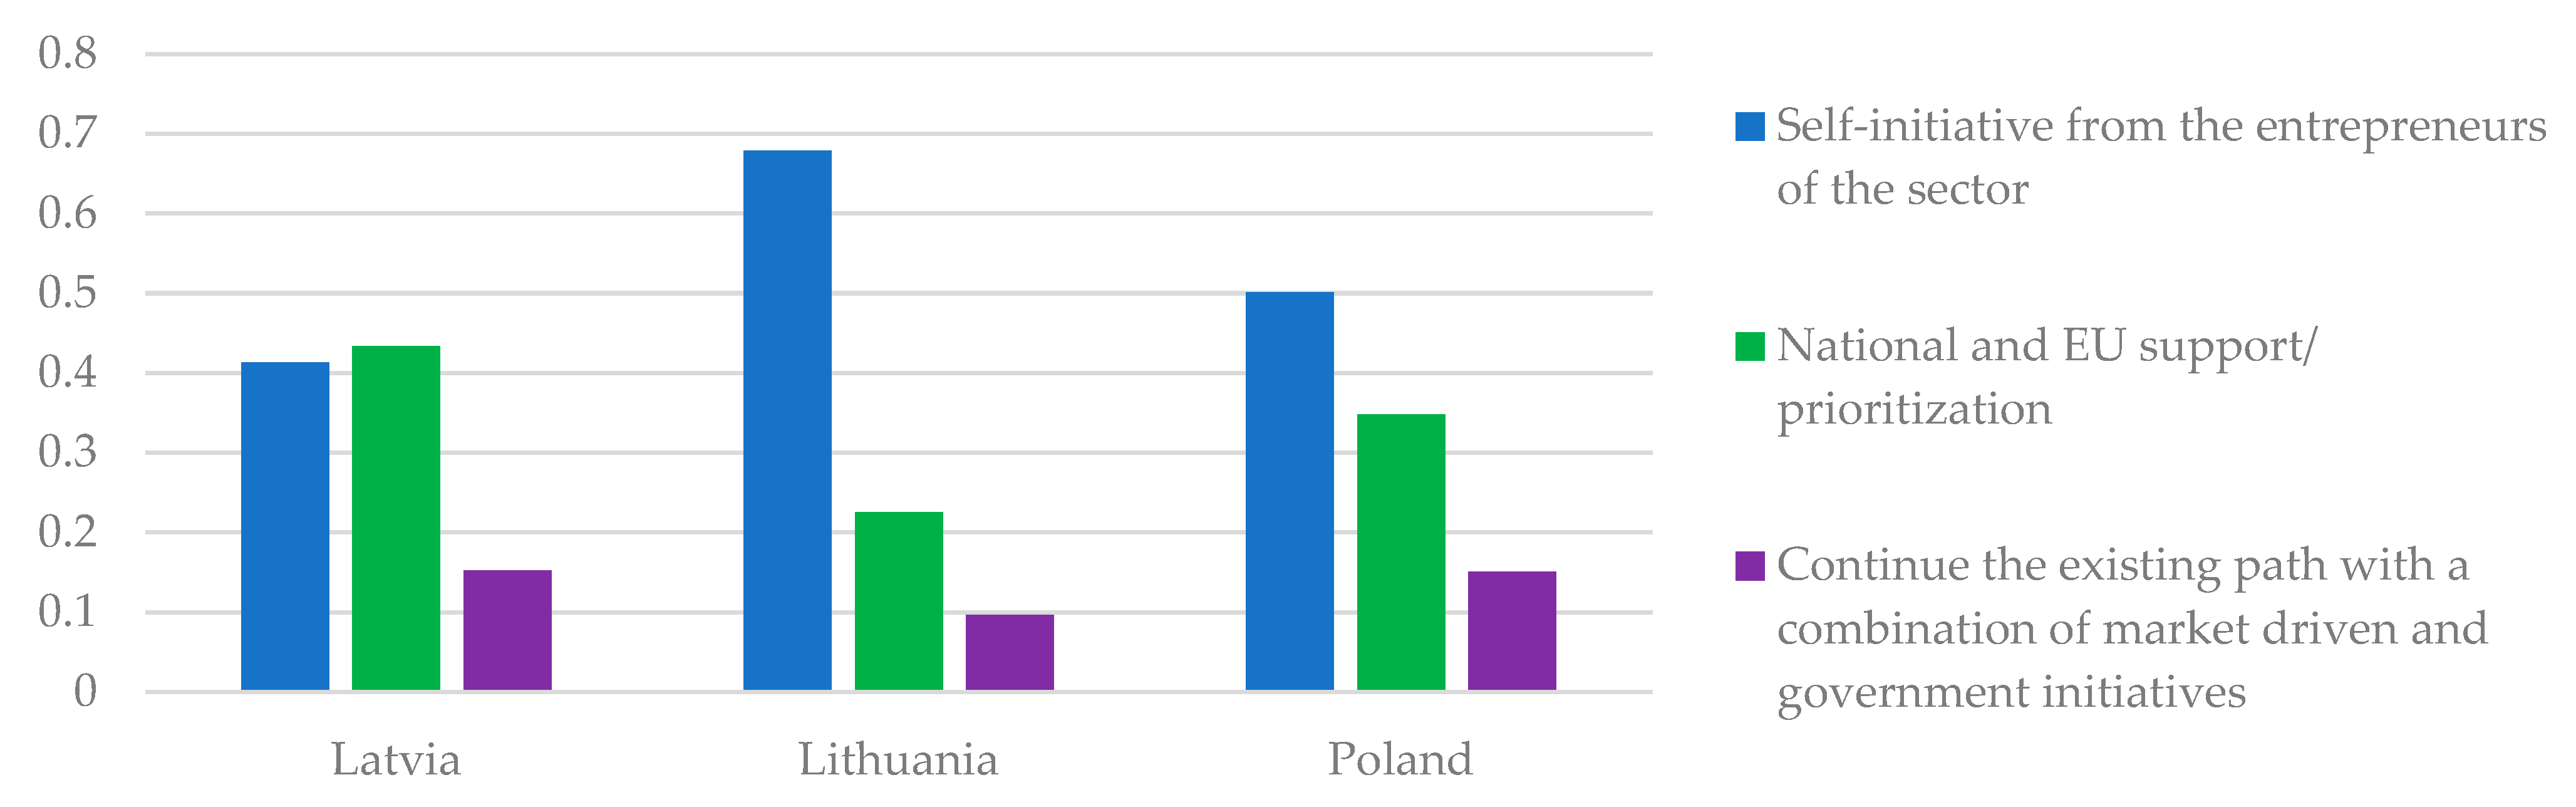
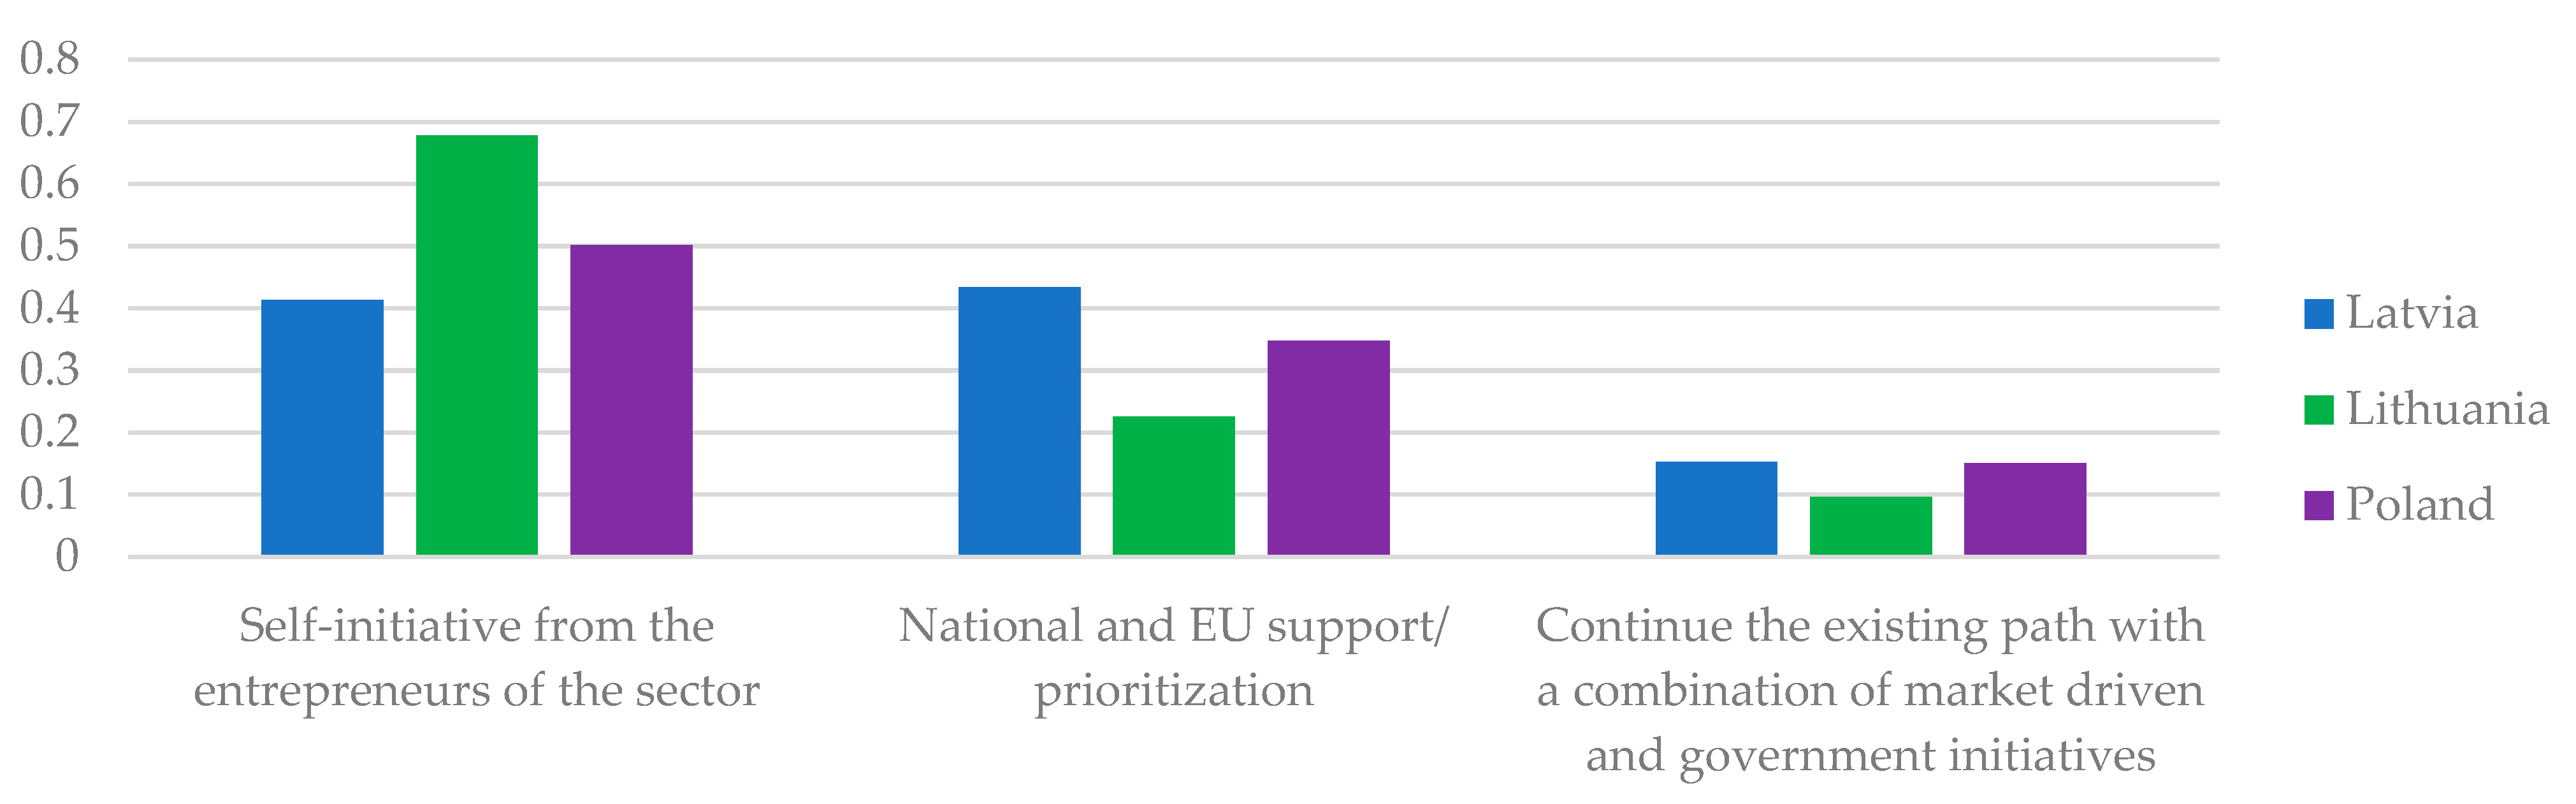
According to the obtained results (Figure 7 and Figure 8), the Lithuanian and Polish experts prioritised the criteria promoting scenario No. 1, which implies self-initiative from the enterprises of the sector (bottom-up). Meanwhile, experts from Latvia considered scenario No. 2 –national and EU support for digitalisation and prioritization of digitalisation—to be the best scenario. Based on Estonia’s example, digitalisation can be an efficient driver for the economy, while strategic prioritisation followed by sufficient support instruments can have a positive effect on digital transformation and overall economic growth.
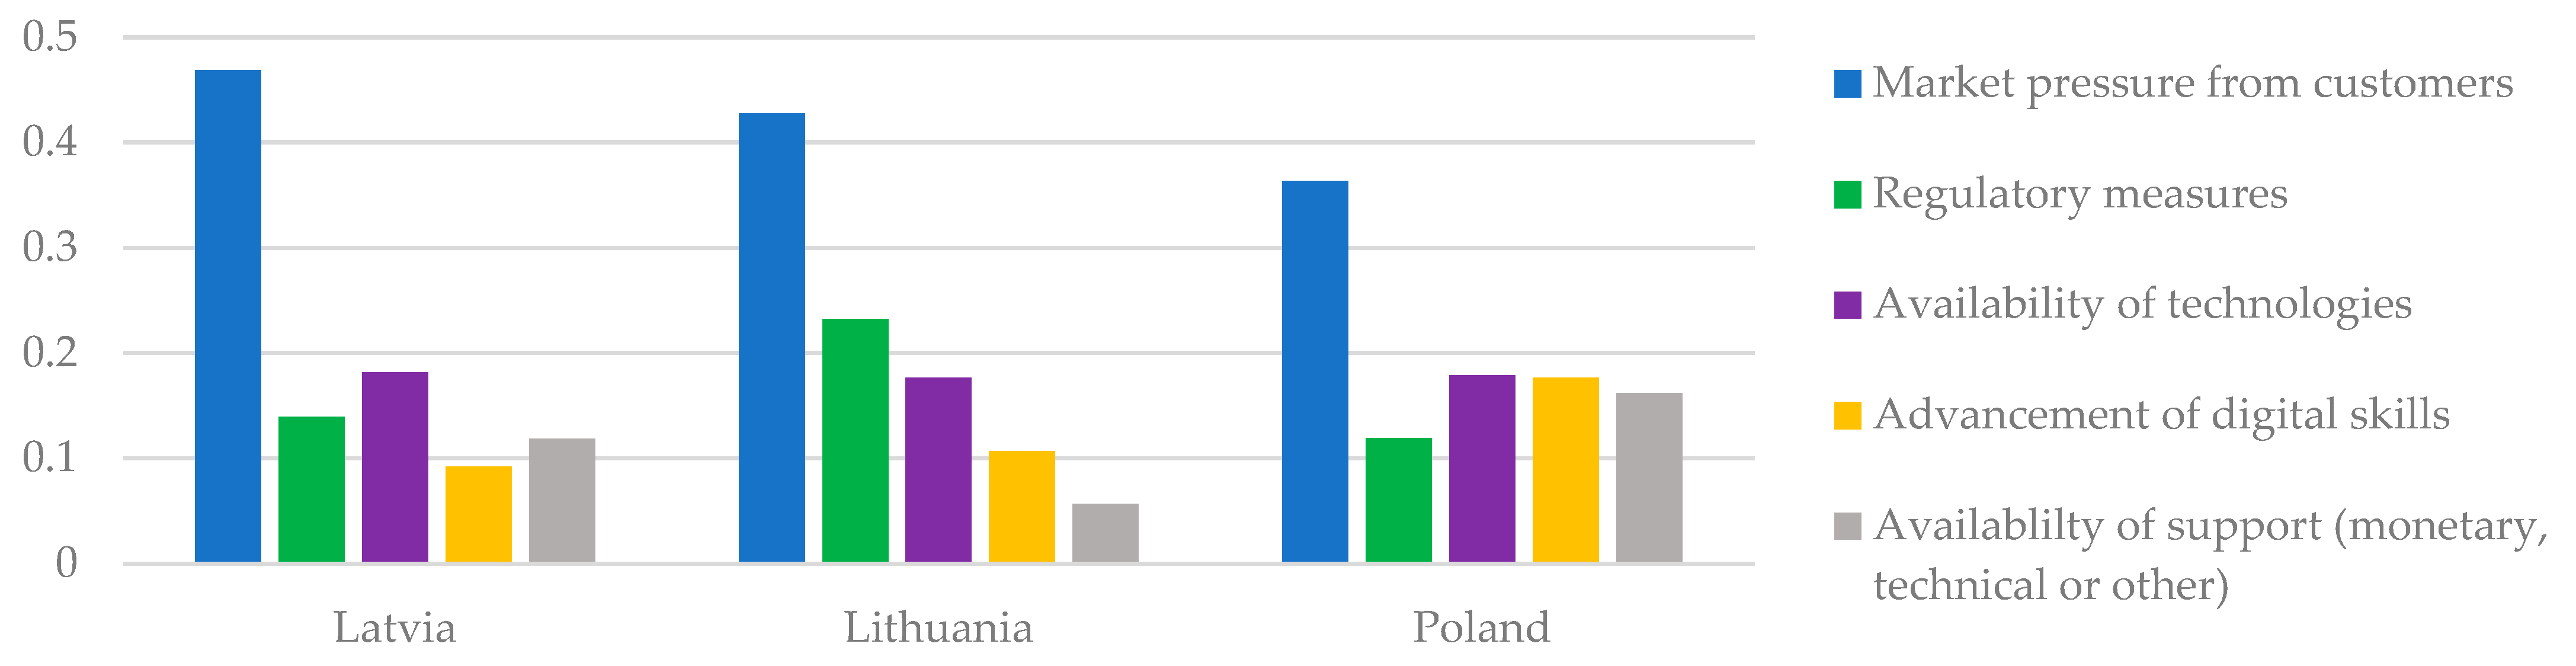
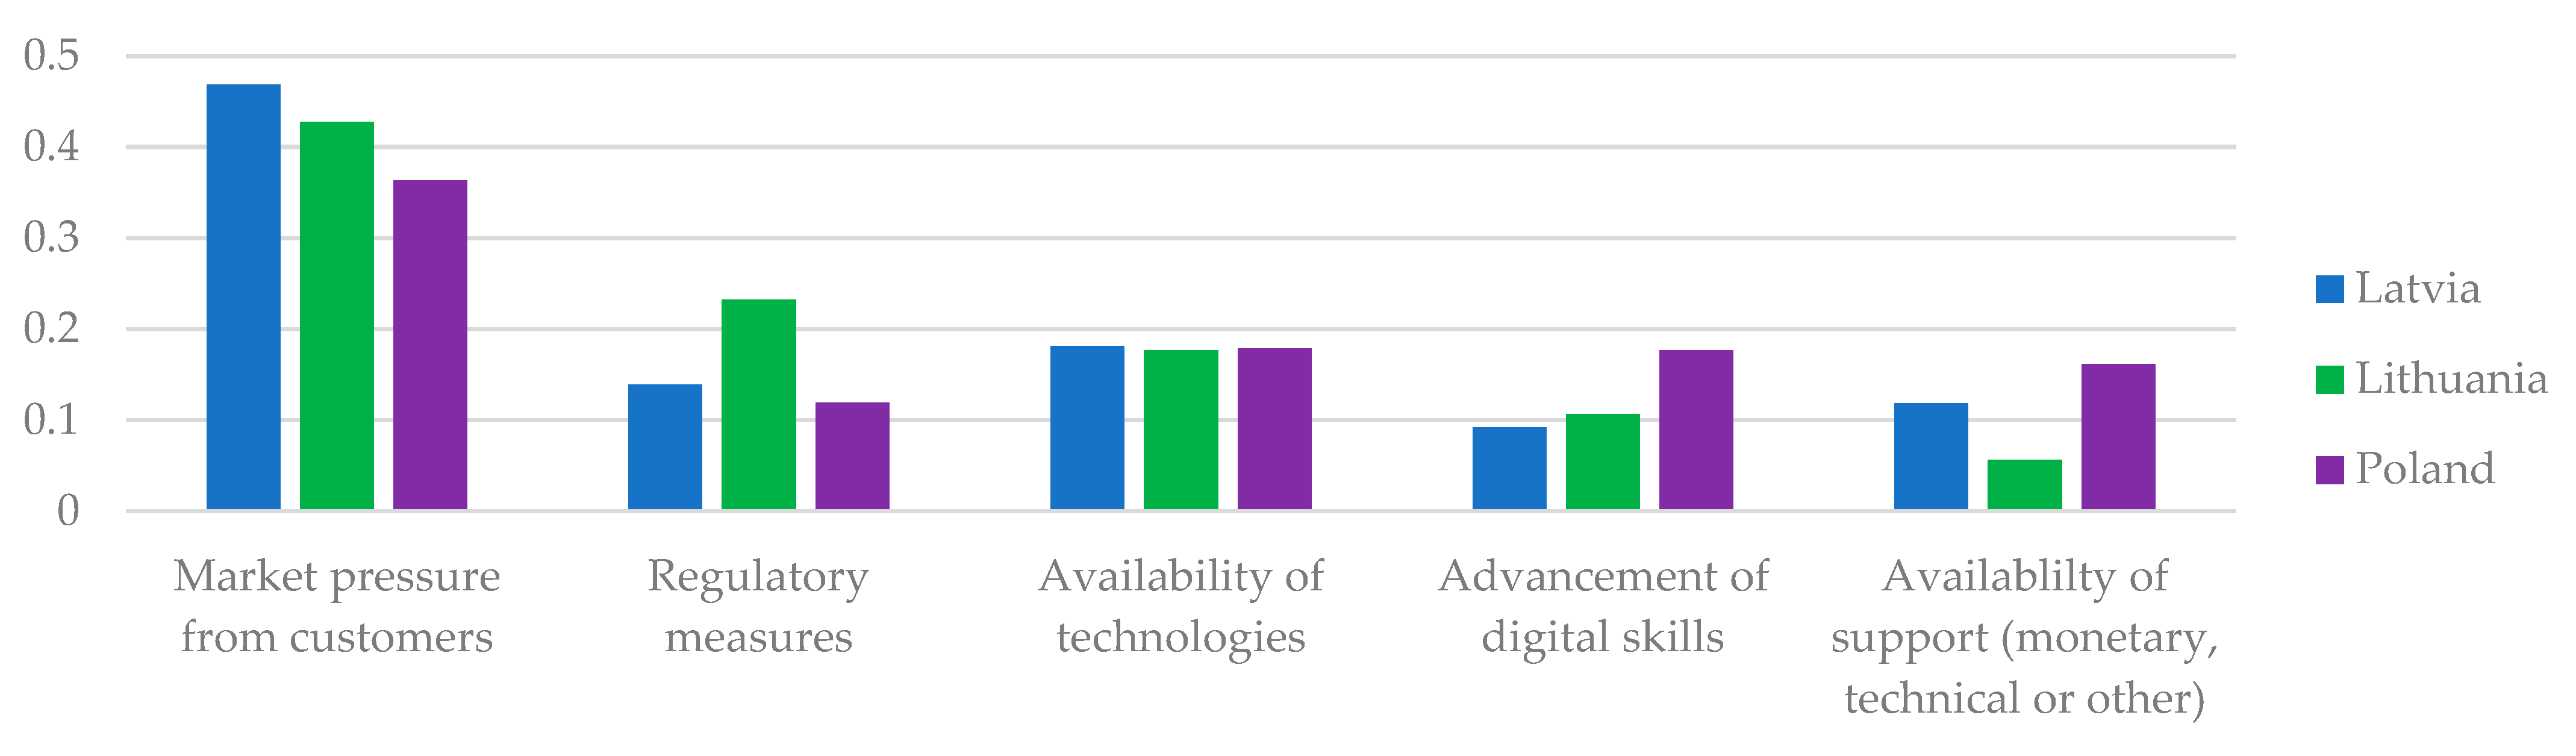
The evaluation of criteria (Figure 9 and Figure 10) by comparing them between the countries indicates that all countries have considered market pressure from customers to be the leading driver for change in digitalisation in the bioeconomy sector, followed by the availability of technologies in Latvia (and advancement of digital skills in Poland) and regulatory measures in Lithuania. Overall, the availability of technologies is considered important among all three countries and assessed equally, regulatory measures are considered more important in Latvia and Lithuania. Meanwhile, the Polish experts gave it less emphasis while rating all other criteria higher.

3.5. Results for Stakeholder Groups

The results for the stakeholder groups have shown that all stakeholder groups from Latvia, Lithuania, and Poland have evaluated market pressure as the most important criterion, with the national government experts giving it the greatest emphasis and entrepreneurs giving the lowest score (Table 9). This group is followed by the availability of technologies as the next most important criterion in all stakeholder groups except for the group of entrepreneurs, which rated pressure from new regulatory measures as the second most important. The two least important criteria, in the opinion of the national government and research experts, are the advancement of digital skills and the availability of support. These criteria were evaluated as more important by the experts from extension services and entrepreneurs.
In the evaluation of scenarios (Table 10), scenario No. 1—Self-initiative of the entrepreneurs of the sector—was ranked the highest by all stakeholder groups except for the national government experts. They prioritised scenario No. 2—National and EU support/political prioritisation of digitalisation. This is logical as this group emphasises the role of policymaking in shifting business practices towards digital transformation. Scenario No. 3—Existing path with a combination of market-driven and government initiatives—received the lowest score, indicating that all experts were not satisfied with the status quo and the current path of digitalisation in the bioeconomy and would expect to see a different approach towards supporting it.

4. Discussion

The analysis in this study was based on the primary data from AHP surveys; however, it should be noted that sectoral data on digitalisation in the bioeconomy is lacking or very general in the countries examined. That is why the opinions of the experts involved in the analysis or implementation of the changes in the digitalisation of the bioeconomy are of great importance in this research. The results indicate that the market pressure to introduce digital solutions is preferred by most of the experts in all three countries except for the national government experts.
A detailed inquiry into the situation of digitalisation in the EU shows that, according to both the DESI index and the results of the cluster analysis, all three countries analysed are in a group of countries that are not highly advanced in digitalisation. It should also be noted that the third Baltic state—Estonia—has significantly higher digital performance indicators than the other two Baltic countries and Poland. Still, a clear path towards digitalisation can be observed. It could also be anticipated that Latvia, Lithuania, and Poland will follow this path due to market pressure. Nonetheless, based on the AHP analysis, it could be concluded that targeted national and EU support measures could help to attain the average EU level of digitalisation faster. Support and aid for investments in digital technologies are particularly important in such investment-intensive bioeconomy sectors as agriculture and forestry, where many digital tools are available, but the investment costs are too high for entrepreneurs to cover, especially in the case of small-scale actors [51]. This is also stated in the AHP evaluation by the entrepreneurs’ stakeholder group, substantiating the findings of previous research [20,24].
As mentioned above, one of the barriers to research in the bioeconomy is data availability. It could be improved by changes in the recommendations/requirements for reporting in the bioeconomy. In addition, it could be achieved by detailed studies commissioned by government entities or the use of targeted grants for this purpose.
The findings of the current research on digitalisation in the bioeconomy sector are in line with the previous studies. There are research works showing a strong link between digitalisation and R&D [52,53,54], which is in line with our findings.
The cluster analysis of the present research has also highlighted the links between digitalisation and R&D. The 4th cluster encompasses the highest performing EU member states in the digitalisation and R&D levels, e.g., Belgium, Denmark, Luxembourg, Netherlands, Finland, and Sweden. Therefore, it can be concluded that there is a definite link between R&D investments and performance and the level of technological advancements (in this case, digital) in a country. This link between the R&D investments and performance has been described comprehensively in [21,55,56]. Considering this, the level of digitalisation in the bioeconomy sector of EU countries is also increased through the implementation of the CBE JU-funded investment projects, particularly flagships. These projects are dedicated to creating and delivering technically mature facilities for bioeconomy sector activities and are usually related to the high level of digitalisation. The performance in these clusters is the highest in Central and Northern Europe, while Eastern and Western parts of Europe have demonstrated lower performance [57]. This fact has also been supported by the present research, revealing that Latvia, Lithuania, and Poland belong to the lower-performing EU member states in digitalisation and R&D. This fact has also been substantiated by the AHP analysis. The results have revealed that the stakeholders have not rated digitalisation through the national and EU prioritisation and funding (scenario No. 2) as the best scenario in most stakeholder groups and all countries participating in the evaluation. This might be linked with the consideration that governmental entities are not fully aware of the dynamic changes of digitalisation and transformation to Industry 5.0 [58,59]. Thus, the priorities set in a top-down manner might be too robust and not correspond to the changing needs of the enterprises and demands from the market. According to the findings by Schwab et al. [60], digitalisation involving diverse stakeholders’ participation in the bioeconomy value chain, all under the oversight of governmental agencies, serves as a driving force for sustainability. Analyzing the links/connection between digitalisation in the bioeconomy and reaching sustainable development goals could be a further path for the research.

5. Conclusions

The primary data for this study were obtained from AHP surveys. Nonetheless, it should be acknowledged that specific sectoral data on digitalisation within the bioeconomy are either lacking or very general in the countries examined, which was one of the study’s limitations. For this reason, the insights of experts involved in the analysis and implementation of digital changes in the bioeconomy were crucial for the research. According to the results obtained, most experts in all three countries, with the exception of the national government experts, preferred the scenario of market pressure driving the adoption of digital solutions.
A comprehensive inquiry into digitalisation in the EU, both through the DESI index and cluster analysis, revealed that all three countries analysed fell into a category of countries with relatively low levels of digital advancement. Notably, Estonia, among the Baltic states, stood out with significantly higher digital performance indicators than the other two Baltic states and Poland. Nevertheless, a clear trajectory towards digitalisation could be observed, and it’s likely that Latvia, Lithuania, and Poland would follow this path driven by market pressure. However, as indicated by the AHP analysis, targeted national and EU support measures would expedite the attainment of the average EU level of digitalisation. Based on the outcomes of cluster analysis, a clear correlation exists between the level of R&D investments and performance and the extent of technological advancements within the country, particularly in the digital domain.
Thus, it could be concluded that both the outcomes of the cluster analysis and AHP applied to the case studies of Latvia, Lithuania, and Poland underscore the overarching necessity to prioritise support for R&D and digital transformation through national and EU funding. This emphasis is crucial for attaining improved outcomes of digitalisation in the bioeconomy affecting the highly significant primary production sectors of agriculture and forestry in the studied countries, but potentially throughout the broader EU context that could be analysed in further research. As previously mentioned, one of the obstacles in bioeconomy research was the limited availability of data, which also posed a limitation in this study. This limitation could be addressed through changes in recommendations or requirements disaggregating the data about digitalisation to a level that would enable an analysis of the sectors corresponding to bioeconomy in national statistics and EUROSTAT data. Additionally, conducting further in-depth studies could contribute to improved data availability and better insights into the progress of digitalisation in the bioeconomy. The AHP results may also indicate that the opinions of the national government, consulting and research experts were more aligned, but the opinions of entrepreneurs differed from these groups. Hence, when planning new support measures for the bioeconomy sector, it would be advisable to involve entrepreneurs in the planning process to ensure their needs are met.

Author Contributions

Conceptualization, S.Z.-R., A.P. and L.G.; methodology S.Z.-R. and P.R.; software, S.Z.-R. and P.R.; validation, S.Z.-R.; formal analysis, S.Z.-R. and P.R.; investigation, S.Z.-R.; resources, S.Z.-R.; data curation, S.Z.-R., A.P., L.G. and I.G.; writing—original draft preparation, S.Z.-R., A.P., L.G. and A.N.; writing—review and editing, S.Z.-R., A.P., L.G. and A.N.; visualization, S.Z.-R., A.P. and L.G.; supervision, S.Z.-R.; project administration, I.G.; funding acquisition, I.G. All authors have read and agreed to the published version of the manuscript.

Funding

This research and APC for this article was funded by the Post-doctoral Research Aid Program of the State Education Development Agency of Latvia, project “Digitalisation of Enterprises of the Bioeconomy Sector for Increasing their Competitiveness and Exportability” grant number 1.1.1.2/VIAA/3/19/553.

Informed Consent Statement

Informed consent was obtained from all subjects involved in the study.

Data Availability Statement

The authors used secondary data from publicly available Eurostat databases and the DataM Data-Modelling platform of resource economics (European Commission) and primary data from surveys conducted using the AHP method.

Conflicts of Interest

The authors declare no conflict of interest. The funders of this research had no role in the study’s design, in the collection, analysis, or interpretation of data, in the writing of the manuscript, or in the decision to publish the results.

References

  1. Gardossi, L.; Philp, J.; Fava, F.; Winickoff, D.; D’Aprile, L.; Dell’Anno, B.; Jørgen, M.O.; Lenzi, A. Bioeconomy national strategies in the G20 and OECD countries: Sharing experiences and comparing existing policies. EFB Bioeconomy J. 2023, 3, 100053. [Google Scholar] [CrossRef]
  2. Lanzerath, D.; Schurr, U. Introduction: Bioeconomy and Sustainability. In Bioeconomy and Sustainability; Lanzerath, D., Schurr, U., Pinsdorf, C., Stake, M., Eds.; Springer: Cham, Germany, 2022; pp. 3–9. [Google Scholar] [CrossRef]
  3. Aguilar, A.; Twardowski, T. Bioeconomy in a changing word. EFB Bioeconomy J. 2022, 2, 100041. [Google Scholar] [CrossRef]
  4. Venkatramanan, V.; Shah, S.; Prasad, R. Sustainable Bioeconomy: Pathways to Sustainable Development Goals; Springer Nature: Berlin/Heidelberg, Germany, 2021. [Google Scholar] [CrossRef]
  5. Asada, R.; Cardellini, G.; Mair-Bauernfeind, C.; Wenger, J.; Haas, V.; Holzer, D.; Stern, T. Effective bioeconomy? A MRIO-based socioeconomic and environmental impact assessment of generic sectoral innovations. Technol. Forecast. Soc. Change 2020, 153, 119946. [Google Scholar] [CrossRef]
  6. Böcher, M.; Töller, A.E.; Perbandt, D.; Beer, K.; Vogelpohl, T. Research trends: Bioeconomy politics and governance. For. Policy Econ. 2020, 118, 102219. [Google Scholar] [CrossRef]
  7. Liobikienė, G.; Miceikienė, A.; Brizga, J. Decomposition analysis of bioresources: Implementing a competitive and sustainable bioeconomy strategy in the Baltic Sea Region. Land Use Policy 2021, 108, 105565. [Google Scholar] [CrossRef]
  8. Rübberdt, K. Digital Bioeconomy. In The Bioeconomy System; Thrän, D., Moesenfechtel, U., Eds.; Springer: Berlin/Heidelberg, Germany, 2022; pp. 145–158. [Google Scholar] [CrossRef]
  9. Tunberg, M. The Digitalisation of the Bioeconomy will Provide Opportunities for Operators and ICT Providers. Available online: https://www.analysysmason.com/globalassets/x_migrated-media/media/analysys_mason_bioeconomy_digital_transformation_quarterly_oct2019.pdf (accessed on 1 August 2023).
  10. D’Amico, G.; Szopik-Depczynska, K.; Beltramo, R.; D’Adamo, I.; Ioppolo, G. Smart and Sustainable Bioeconomy Platform: A New Approach towards Sustainability. Sustainability 2022, 14, 466. [Google Scholar] [CrossRef]
  11. Rennings, M.; Burgsmüller, A.P.F.; Bröring, S. Convergence towards a digitalized bioeconomy—Exploring cross-industry merger and acquisition activities between the bioeconomy and the digital economy. Bus. Strategy Dev. 2023, 6, 53–74. [Google Scholar] [CrossRef]
  12. Mboli, J.S.; Dhavalkumar, T.; Mishra, J.L. An Internet of Things-enabled decision support system for circular economy business model. Softw. Pract. Exp. 2022, 52, 772–787. [Google Scholar] [CrossRef]
  13. Garcia-Muiña, F.E.; González-Sánchez, R.; Ferrari, A.M.; Volpi, L.; Pini, M.; Siligardi, C.; Settembre-Blundo, D. Identifying the equilibrium point between sustainability goals and circular economy practices in an Industry 4.0 manufacturing context using eco-design. Soc. Sci. 2019, 8, 241. [Google Scholar] [CrossRef]
  14. Loy, A.C.M.; Kong, K.G.H.; Lim, J.Y. Frontier of digitalization in Biomass-to-X supply chain: Opportunity or threats? J. Bioresour. Bioprod. 2023, 8, 101–107. [Google Scholar] [CrossRef]
  15. Bukht, R.; Heeks, R. Defining, conceptualizing and measuring the digital economy. Dev. Inform. Work. Pap. 2017, 68, 1–24. Available online: https://papers.ssrn.com/sol3/papers.cfm?abstract_id=3431732 (accessed on 1 August 2023).
  16. Ayre, M.; Mc Collumb, V.; Waters, W.; Samsond, P.; Curro, A.; Nettlee, R.; Paschene, J.A.; King, B.; Reichelt, N. Supporting and practising digital innovation with advisers in smart farming. NJAS—Wagening J. Life Sci. 2019, 90–91, 100302. [Google Scholar] [CrossRef]
  17. Ingram, J.; Maye, D. What are the implications of digitalisation for agricultural knowledge? Front. Sustain. Food Syst. 2020, 4, 66. [Google Scholar] [CrossRef]
  18. Fielke, S.; Taylor, B.; Jakku, E. Digitalisation of agricultural knowledge and advice networks: A state-of-the-art review. Agric. Syst. 2020, 180, 102763. [Google Scholar] [CrossRef]
  19. Eastwood, C.R.; Turner, J.A.; Romera, A.J.; Selbie, D.; Henwood, R.; Espig, M.; Wever, M. A Review of Multi-scale Barriers to Transitioning from Digital Agriculture to a Digital Bioeconomy. CABI Rev. 2023, 1–11. [Google Scholar] [CrossRef]
  20. Goller, M.; Caruso, C.; Harteis, C. Digitalisation in agriculture: Knowledge and learning requirements of German dairy farmers. Int. J. Res. Vocat. Educ. Train. 2021, 8, 208–223. [Google Scholar] [CrossRef]
  21. Eastwood, C.; Klerkx, L.; Nettle, R. Dynamics and distribution of public and private research and extension roles for technological innovation and diffusion: Case studies of the implementation and adaptation of precision farming technologies. J. Rural Stud. 2017, 49, 1–12. [Google Scholar] [CrossRef]
  22. Langer, G.; Kühl, S. Perception and acceptance of robots in dairy farming—A cluster analysis of German citizens. Agric. Hum. Values 2023. [Google Scholar] [CrossRef]
  23. Steeneveld, W.; Tauer, L.W.; Hogeveen, H.; Oude Lansink, A.G.J.M. Comparing technical efficiency of farms with an automatic milking system and a conventional milking system. J. Dairy Sci. 2012, 95, 7391–7398. [Google Scholar] [CrossRef]
  24. Vik, J.; Stræte, E.P.; Hansen, B.G.; Nærland, T. The political robot–The structural consequences of automated milking systems (AMS) in Norway. NJAS—Wagening J. Life Sci. 2019, 90–91, 100305. [Google Scholar] [CrossRef]
  25. Zeverte-Rivza, S.; Rivza, P.; Gudele, I. Impact of Digitalisation and R&D on the Economies of EU Member States. In Proceedings of the Engineering for Rural Development, Jelgava, Latvia, 24–26 May 2023. [Google Scholar]
  26. Stofkova, J.; Krejnus, M.; Stofkova, K.R.; Malega, P.; Binasova, V. Use of the Analytic Hierarchy Process and Selected Methods in the Managerial Decision-Making Process in the Context of Sustainable Development. Sustainability 2022, 14, 11546. [Google Scholar] [CrossRef]
  27. Schulze-González, E.; Pastor-Ferrando, J.-P.; Aragonés-Beltrán, P. Testing a Recent DEMATEL-Based Proposal to Simplify the Use of ANP. Mathematics 2021, 9, 1605. [Google Scholar] [CrossRef]
  28. Ramanatan, R. Multicriteria Analysis of Energy. In Encyclopedia of Energy; Cleveland, C.J., Ed.; Science Direct: Amsterdam, The Netherlands, 2004; pp. 77–88. [Google Scholar]
  29. Canco, I.; Kruja, D.; Iancu, T. AHP, a Reliable Method for Quality Decision Making: A Case Study in Business. Sustainability 2021, 13, 13932. [Google Scholar] [CrossRef]
  30. Ameen, R.; Mourshed, M. Urban sustainability assessment framework development: The ranking and weighting of sustainability indicators using analytic hierarchy process. Sustain. Cities Soc. 2019, 44, 356–366. [Google Scholar] [CrossRef]
  31. Saaty, T.L. How to make a decision: The analytic hierarchy process. Interfaces 1994, 24, 19–43. [Google Scholar] [CrossRef]
  32. European Commission. Europe 2020—A Strategy for Smart, Sustainable and Inclusive Growth; European Commission: Brussels, Belgium, 2010. [Google Scholar]
  33. European Commission. Innovating for Sustainable Growth: A Bioeconomy for Europe, EC, 2012. Available online: https://www.eea.europa.eu/policy-documents/innovating-for-sustainable-growth-a (accessed on 5 May 2023).
  34. Twardowski, T.; Wozniak, E. Bioekonomia wokół nas. Nauka 2016, 3, 147–160. (In Polish) [Google Scholar]
  35. Enriquez, J.; Martinez, J. Genomies and the World’s Economy. Sci. Mag. 1998, 281, 925–926. [Google Scholar]
  36. European Commission. DG Research 2006. FP7 Theme 2. Food, Agriculture, Fisheries and Biotechnology, 2007 Work Programme. Available online: https://ec.europa.eu/research/participants/data/ref/fp7/88207/b_wp_200702_en.pdf (accessed on 15 April 2023).
  37. OECD. Bioeconomy to 2030: Designing a Policy Agenda. 2009. Available online: https://www.oecd.org/futures/long-termtechnologicalsocietalchallenges/thebioeconomyto2030designingapolicyagenda.htm (accessed on 15 April 2023).
  38. BECOTEPS—The European Bioeconomy in 2030. Delivering Sustainable Growth by Addressing the Grand Societal Challenges, The White Paper. 2011. Available online: https://www.greenpolicyplatform.org/sites/default/files/downloads/resource//BECOTEPS_European%20Bioeconomy%20in%202030.pdf (accessed on 12 July 2023).
  39. European Commission, DG Research. Bio-Based Economy in Europe: State of Play and Future Potential—Part 2. Summary of the Position Papers Received in Response to the European Commission’ s Public On-Line Consultation; European Commission, DG Research: Brussels, Belgium, 2011. [Google Scholar]
  40. McCormick, K.; Kautto, N. The Bioeconomy in Europe: An Overview. Sustainability 2013, 5, 2589–2608. [Google Scholar] [CrossRef]
  41. GBS-Global Bioeconomy Summit. 2018. Available online: https://gbs2020.net/wp-content/uploads/2021/10/GBS_2018_Report_web.pdf (accessed on 20 June 2023).
  42. Birner, R. Bioeconomy Concepts. In Bioeconomy Shaping the Transition to a Sustainable, Biobased Economy; Lewandowski, I., Ed.; Springer International Publishing AG: Cham, Switzerland, 2018; pp. 17–39. [Google Scholar]
  43. CBE JU. Bio-based Industries Joint Undertaking Driving Europe’s Green Transition. 2022. Available online: https://www.cbe.europa.eu/system/files/2022-12/BBI%20JU%20Driving%20Europe%E2%80%99s%20green%20transition.pdf (accessed on 20 June 2023).
  44. Maciejczak, M.; Hofreiter, K. How to define bioeconomy? Rocz. Nauk. Stowarzyszenia Ekon. Rol. Agrobiznesu 2013, 15, 243–248. [Google Scholar]
  45. Adamowicz, M. Bioeconomy as a Concept for the Development of Agriculture and Agribusiness. Probl. Agric. Econ. 2020, 365, 135–155. [Google Scholar] [CrossRef]
  46. Sustainable Bioeconomy for Europe: Strengthening the Connection Between Economy, Society, and the Environment, Updated Bioeconomy Strategy. Directorate-General for Research and Innovation (European Commission). 2018. Available online: https://op.europa.eu/en/publication-detail/-/publication/edace3e3-e189-11e8-b690-01aa75ed71a1 (accessed on 20 June 2023).
  47. Mubareka, S.; Giuntoli, J.; Sanchez Lopez, J.; Lasarte Lopez, J.; M’barek, R.; Ronzon, T.; Renner, A.; Avraamides, M. Trends in the EU Bioeconomy, EUR 31434 EN; Publications Office of the European Union: Luxembourg, 2023; ISBN 978-92-68-00295-7. [Google Scholar] [CrossRef]
  48. The Digital Economy and Society Index (DESI), European Commission. 2022. Available online: https://digital-strategy.ec.europa.eu/en/policies/desi (accessed on 20 June 2023).
  49. Kattel, R.; Mergel, I. Estonia’s Digital Transformation. In Great Policy Successes; Compton, M.E., Hart, P., Eds.; Oxford University Press: Oxford, UK, 2019; pp. 143–160. [Google Scholar]
  50. RDIE Strategy: Estonian Research and Development, Innovation and Entrepreneurship Strategy 2021–2035. Ministry of Economic Affairs and Communications. Republic of Estonia. 2021. Available online: www.taie_arengukava_kinnitatud_15.07.2021_211109a_en_final.pdf (accessed on 20 June 2023).
  51. Ehlers, M.H.; Huber, R.; Finger, R. Agricultural policy in the era of digitalization. Food Policy 2021, 100, 102019. [Google Scholar] [CrossRef]
  52. Klerkx, L.; Jakku, E.; Labarthe, P. A review of social science on digital agriculture, smart farming and agriculture 4.0: New contributions and a future research agenda. NJAS—Wagening J. Life Sci. 2019, 90–91, 100315. [Google Scholar] [CrossRef]
  53. Phillips, P.W.B.; Relf-Eckstein, J.-A.; Jobe, G.; Wixted, B. Configuring the new digital landscape in western Canadian agriculture. Njas—Wagening J. Life Sci. 2019, 90–91, 100295. [Google Scholar] [CrossRef]
  54. Castro, G.D.R.; Fernández, M.C.G.; Colsa, A.U. Unleashing the convergence amid digitalization and sustainability towards pursuing the Sustainable Development Goals (SDGs): A holistic review. J. Clean. Prod. 2021, 280, 122204. [Google Scholar] [CrossRef]
  55. Boikova, T.; Zeverte-Rivza, S.; Rivza, P.; Rivza, B. The Determinants and Effects of Competitiveness: The Role of Digitalization in the European Economies. Sustainability 2021, 13, 11689. [Google Scholar] [CrossRef]
  56. Bacco, M.; Barsocchi, P.; Ferro, E.; Gotta, A.; Ruggeri, M. The Digitisation of Agriculture: A Survey of Research Activities on Smart Farming. Array 2019, 3–4, 100009. [Google Scholar] [CrossRef]
  57. CBE JU. A Competitive Bioeconomy for a Sustainable Future. 2023. Available online: https://www.cbe.europa.eu/system/files/2023-03/A%20competitive%20bioeconomy%20for%20a%20sustainable%20future.pdf (accessed on 29 June 2023).
  58. Pereira, R.; dos Santos, N. Neoindustrialization—Reflections on a New Paradigmatic Approach for the Industry: A Scoping Review on Industry 5.0. Logistics 2023, 7, 43. [Google Scholar] [CrossRef]
  59. Alojaiman, B. Technological Modernizations in the Industry 5.0 Era: A Descriptive Analysis and Future Research Directions. Processes 2023, 11, 1318. [Google Scholar] [CrossRef]
  60. Schwab, A.K.; Halberstadt, J.; Besieda, A.; Kraft, M.; Ortland, A. Organizational aspects of digitalization in the context of agriculture: Exemplary results from analyzing data flows in German dairy farming. Procedia Comput. Sci. 2023, 219, 1006–1011. [Google Scholar] [CrossRef]
Figure 1. Flowchart of the study. Source: own study.
Sustainability 15 13237 g001
Figure 2. The AHP structure. Source: own study.
Sustainability 15 13237 g002
Figure 3. Turnover in the bioeconomy by sectors in EU27, 2019. Source: DataM JRC [47].
Sustainability 15 13237 g003
Figure 4. Structure of employment in the bioeconomy by sectors in EU27, 2019. Source: DataM JRC [47].
Sustainability 15 13237 g004
Figure 5. DESI for EU27 and Estonia, Latvia, Lithuania, and Poland in 2022. Source: European Commission [48].
Sustainability 15 13237 g005
Figure 6. Cluster membership in EU. Source: own study.
Sustainability 15 13237 g006
Figure 7. Results summary for Latvia, Lithuania, and Poland for the evaluation of scenario, and comparison among countries. Source: own study.
Sustainability 15 13237 g007
Figure 8. Results summary for Latvia, Lithuania, and Poland: the evaluation and comparison of scenarios. Source: own study.
Sustainability 15 13237 g008
Figure 9. Results summary for Latvia, Lithuania, and Poland for the evaluation and comparison of criteria among countries. Source: own study.
Sustainability 15 13237 g009
Figure 10. Results summary for Latvia, Lithuania, and Poland for the evaluation and comparison of criteria. Source: own study.
Sustainability 15 13237 g010
Table 1. Barriers to digital transformation in bioeconomy according to the PEST criteria.
PEST CriteriaBarriers
PoliticalUncertainty regarding data regulation methods, data protection concerns
Lack of strategic prioritisation of digitalisation
Fragmented support for digitalisation
Insufficient development of state-owned efficient and interoperable systems, e.g., systems gathering farming data, weather service
Lack of transparency regarding the use of requested data
EconomicHigh investment costs
Limited monetization of produced data
Cost-effectiveness of introducing new technologies
SocialDigital skills of the entrepreneur and employees
Readiness of the rest of the supply chain and market, limited integration of data, insufficient digital skills of clients
Desire to learn and change practices
Fear of using new technologies, uncertainty about cyber security threats and data sharing
Possible negative consumer and societies’ perceptions of the use of digital tools vs traditional/natural
TechnologicalLow data quality, data gaps
Issues with the integration of systems, technologies and data
Data and cyber security threats
Issues with stability, speed and reliability of the internet connection
Limited availability of technologies
Limited availability of service, parts and tech support
Source: own study based on the research of [18,19,20].
Table 2. Stakeholder groups are involved in the evaluation.
Stakeholder GroupsLatviaLithuaniaPoland
National governmentMinistry of Environmental Protection and Regional DevelopmentMinistry of Agriculture of the Republic of LithuaniaMinistry of Agriculture and Rural Development—no result
ConsultingLatvian Rural Advisory and Training Centre—no resultPI Lithuanian Agriculture Advisory ServiceAgricultural Advisory Centre in Brwinów (CDR)
ResearchLatvia University of Life Sciences and TechnologiesVytautas Magnus UniversityInstitute of Agricultural and Food Economics—National Research Institute
EntrepreneurshipFarmer (berry growing and processing)Entrepreneur from the forestry sectorFarmer (horticultural farm—mainly apple and currant production)
Source: own study.
Table 4. Turnover in the bioeconomy by sectors in EU27, 2019 (billion euro).
SectorsEU27EstoniaLatviaLithuaniaPoland
Agriculture437.01.01.73.228.9
Bio-based chemicals, pharmaceuticals, plastics and rubber (excl. biofuels)196.90.00.20.44.1
Bio-based electricity26.40.20.10.10.6
Bio-based textiles86.10.20.10.42.7
Fishing and Aquaculture12.50.10.10.10.2
Food, beverage and tobacco1157.12.12.04.577.6
Forestry49.51.11.40.63.6
Liquid biofuels14.90.0-0.11.0
Paper188.70.20.10.611.2
Wood products and furniture176.62.72.32.516.9
Bioeconomy2345.77.68.012.5146.9
Source: DataM JRC [47].
Table 5. Employment in the bioeconomy by sectors in EU27, Estonia, Latvia, Lithuania, and Poland in 2019.
SectorsEU27EstoniaLatviaLithuaniaPoland
Agriculture8,830,300 14,100 45,430 75,780 1,418,700
Bio-based chemicals, pharmaceuticals, plastics and rubber (excl, biofuels)462,379 313 1567 1243 31,090
Bio-based electricity25,047 379 336 411 2086
Bio-based textiles791,242 3273 4064 9962 61,004
Fishing and Aquaculture161,040 660 1490 840 5100
Food, beverage and tobacco4,658,299 14,688 23,213 41,152 474,372
Forestry517,410 6270 18,680 12,270 63,000
Liquid biofuels25,747 0 -231 3380
Paper632,755 1280 1419 5148 70,067
Wood products and furniture1,320,066 20,794 24,257 38,987 240,260
Bioeconomy17,424,285 61,756 120,455 186,023 2,369,059
Source: DataM JRC [47].
Table 6. ANOVA.
Table 6. ANOVA.
ClusterErrorFSig.
Mean SquaredfMean Squaredf
REGR factor score 1 (Digitalisation level)6.34530.3032320.9500.000
REGR factor score 2 (R&D level)6.21430.3202319.4220.000
Source: own study.
Table 7. Cluster membership.
Cluster 1Cluster 2Cluster 3Cluster 4
CountriesDistanceCountriesDistanceCountriesDistanceCountriesDistance
Czechia0.465Bulgaria1.151Ireland0.954Belgium0.541
Germany1.502Latvia0.658Spain0.426Denmark0.643
Estonia0.687Lithuania0.658Cyprus1.003Luxembourg0.629
Greece0.642Poland0.475Malta0.862Netherlands0.860
France0.138Portugal0.634 Finland0.544
Croatia0.660Romania0.963 Sweden0.414
Italy0.588Slovakia0.628
Hungary0.356
Austria0.793
Slovenia0.347
Source: own study.
Table 8. Final Cluster Centres.
Cluster
1234
REGR factor score 1 (Digitalisation level)−0.60804−0.678271.325220.92123
REGR factor score 2 (R&D level)0.51837−0.83708−1.217150.92407
Source: own study.
Table 9. Criteria evaluation by stakeholder groups.
Stakeholder GroupsCriteria
Market Pressure for Customers and Other StakeholdersPressure from New Regulatory MeasuresAvailability of TechnologiesAdvancement of Digital SkillsAvailability of Support (Monetary, Technical or Other)
National government0.480.160.200.070.09
Consulting0.390.090.220.180.11
Research 0.400.170.210.100.12
Entrepreneurship0.320.220.170.140.15
Source: own study.
Table 10. Scenario evaluation by stakeholder groups.
Stakeholder GroupsScenarios
Self-Initiative from the Enterprises of the SectorNational and EU Support/Political Prioritisation of DigitalisationExisting Path with a Combination of Market-Driven and Government Initiatives
National government0.380.500.12
Consulting0.560.360.08
Research 0.530.300.16
Entrepreneurship0.570.290.14
Source: own study.
Disclaimer/Publisher’s Note: The statements, opinions and data contained in all publications are solely those of the individual author(s) and contributor(s) and not of MDPI and/or the editor(s). MDPI and/or the editor(s) disclaim responsibility for any injury to people or property resulting from any ideas, methods, instructions or products referred to in the content.

