Article

Study on the Influence of Subway Tunnel Induced by Under-Crossing Tunnel Based on Monitor Data in Shenzhen, China

1
College of Earth Sciences and Engineering, North China University of Water Resources and Electric Power, Zhengzhou 450046, China
2
Shenzhen Energy Corporation All Rights Reserved, Shenzhen 518000, China
*
Authors to whom correspondence should be addressed.
Sustainability 2023, 15(17), 13232; https://doi.org/10.3390/su151713232
Submission received: 31 July 2023 / Revised: 29 August 2023 / Accepted: 30 August 2023 / Published: 4 September 2023

Abstract

:
A dense network of underground tunnels usually makes subsequent tunnels cross existing tunnels in the process of urbanization. In this study, we mainly study the deformation of the subway line 11 caused by the under-crossing of the Qianhai–Nanshan Integrated Drainage Deep Tunnel in Shenzhen. We analyzed the process of displacement during the subsequent tunnel under-crossing the subway line 11 according to the displacement monitoring data. Our results demonstrate that deformation detection is an effective measure for controlling the impact of the subsequent tunnel under-crossing subway tunnels. The aim of this paper may provide guidelines for some existing tunnels that are under-crossed by subsequent tunnels with similar conditions.

1. Introduction

In recent years, the rapid development of urban subways and the expansion of underground space have resulted in subsequent tunnels (new post-construction tunnels) having to cross existing tunnels. As a result, the distance between subsequent tunnels and existing ones has become closer and closer, which is likely to cause excessive disturbance to and the deformation of existing tunnels [1,2,3,4,5]. The accident that occurred in the Rastatt shield tunnel under the railroad in Germany led to the tracks twisting and the ground sinking in 2017 [6].
The disturbance from subsequent tunnel may produce more deformation to existing tunnels. In the literature, some studies focused on the influence model based on the relative position relationship between tunnels and geotechnical conditions [7,8,9,10,11,12]. Some scholars analyzed subsidence influence on existing tunnels through field measurement methods [13,14,15,16,17,18,19]. The measured data obtained from the impact of under-crossing of subsequent tunnels showed that the existing tunnel structure presented a wavy shape in the longitudinal direction with the peak moving in the forward direction, and that the profile of surface subsidence was different. To study the interaction between a subsequent tunnel and an existing one, numerical simulation methods were used [20,21,22,23,24], and these numerical results indicated that the displacement and bending of the lower lining of the existing tunnel would significantly increase under the influence of the subsequent tunnel under-crossing. The maximum vertical surface subsidence would occur within about twice the diameter of the existing tunnel. Additionally, the Laplace integral transformation, a continuous Euler–Bernoulli beam with certain equivalent bending stiffness based on the elastic laminated half-space foundation model and the Winker model have been used to study the displacement of tunnels [25,26,27,28]. Numerical simulation is hard to fully simulate actual engineering due to many actual strata parameters that are difficult to obtain. The deformation mechanism of an existing subway tunnel caused by a subsequent tunnel under-crossing is ambiguous under the influence of many factors. Therefore, the field measurement method is still an effective approach to study the behavior of the displacement.
In this paper, we present a case study of the existing subway tunnel under-crossed by a subsequent adjacent shield tunnel in Shenzhen. The subsequent tunnel under-crossed the subway line 11 in an orthogonal manner. There were fully weathered and strongly weathered mixed granite with poor self-stability where the subsequent tunnel crossed. Deformation monitoring especially around intersection area when the subsequent tunnel under-crossing helps to control the deformation of the existing tunnel. Combination monitoring data, the tunnel process, and parameters need to be adjusted in time to ensure the existing subway line safety. Our study focuses on the deformation of the subway tunnel influenced by the subsequent shield tunnel by using a high-precision automatic real-time measurement system. We hope that it may provide a better understanding of the processes of deformation patterns and better control of the existing subway tunnel subjected to the process of subsequent new tunnel under-crossings.

2. Project Overview and Monitoring

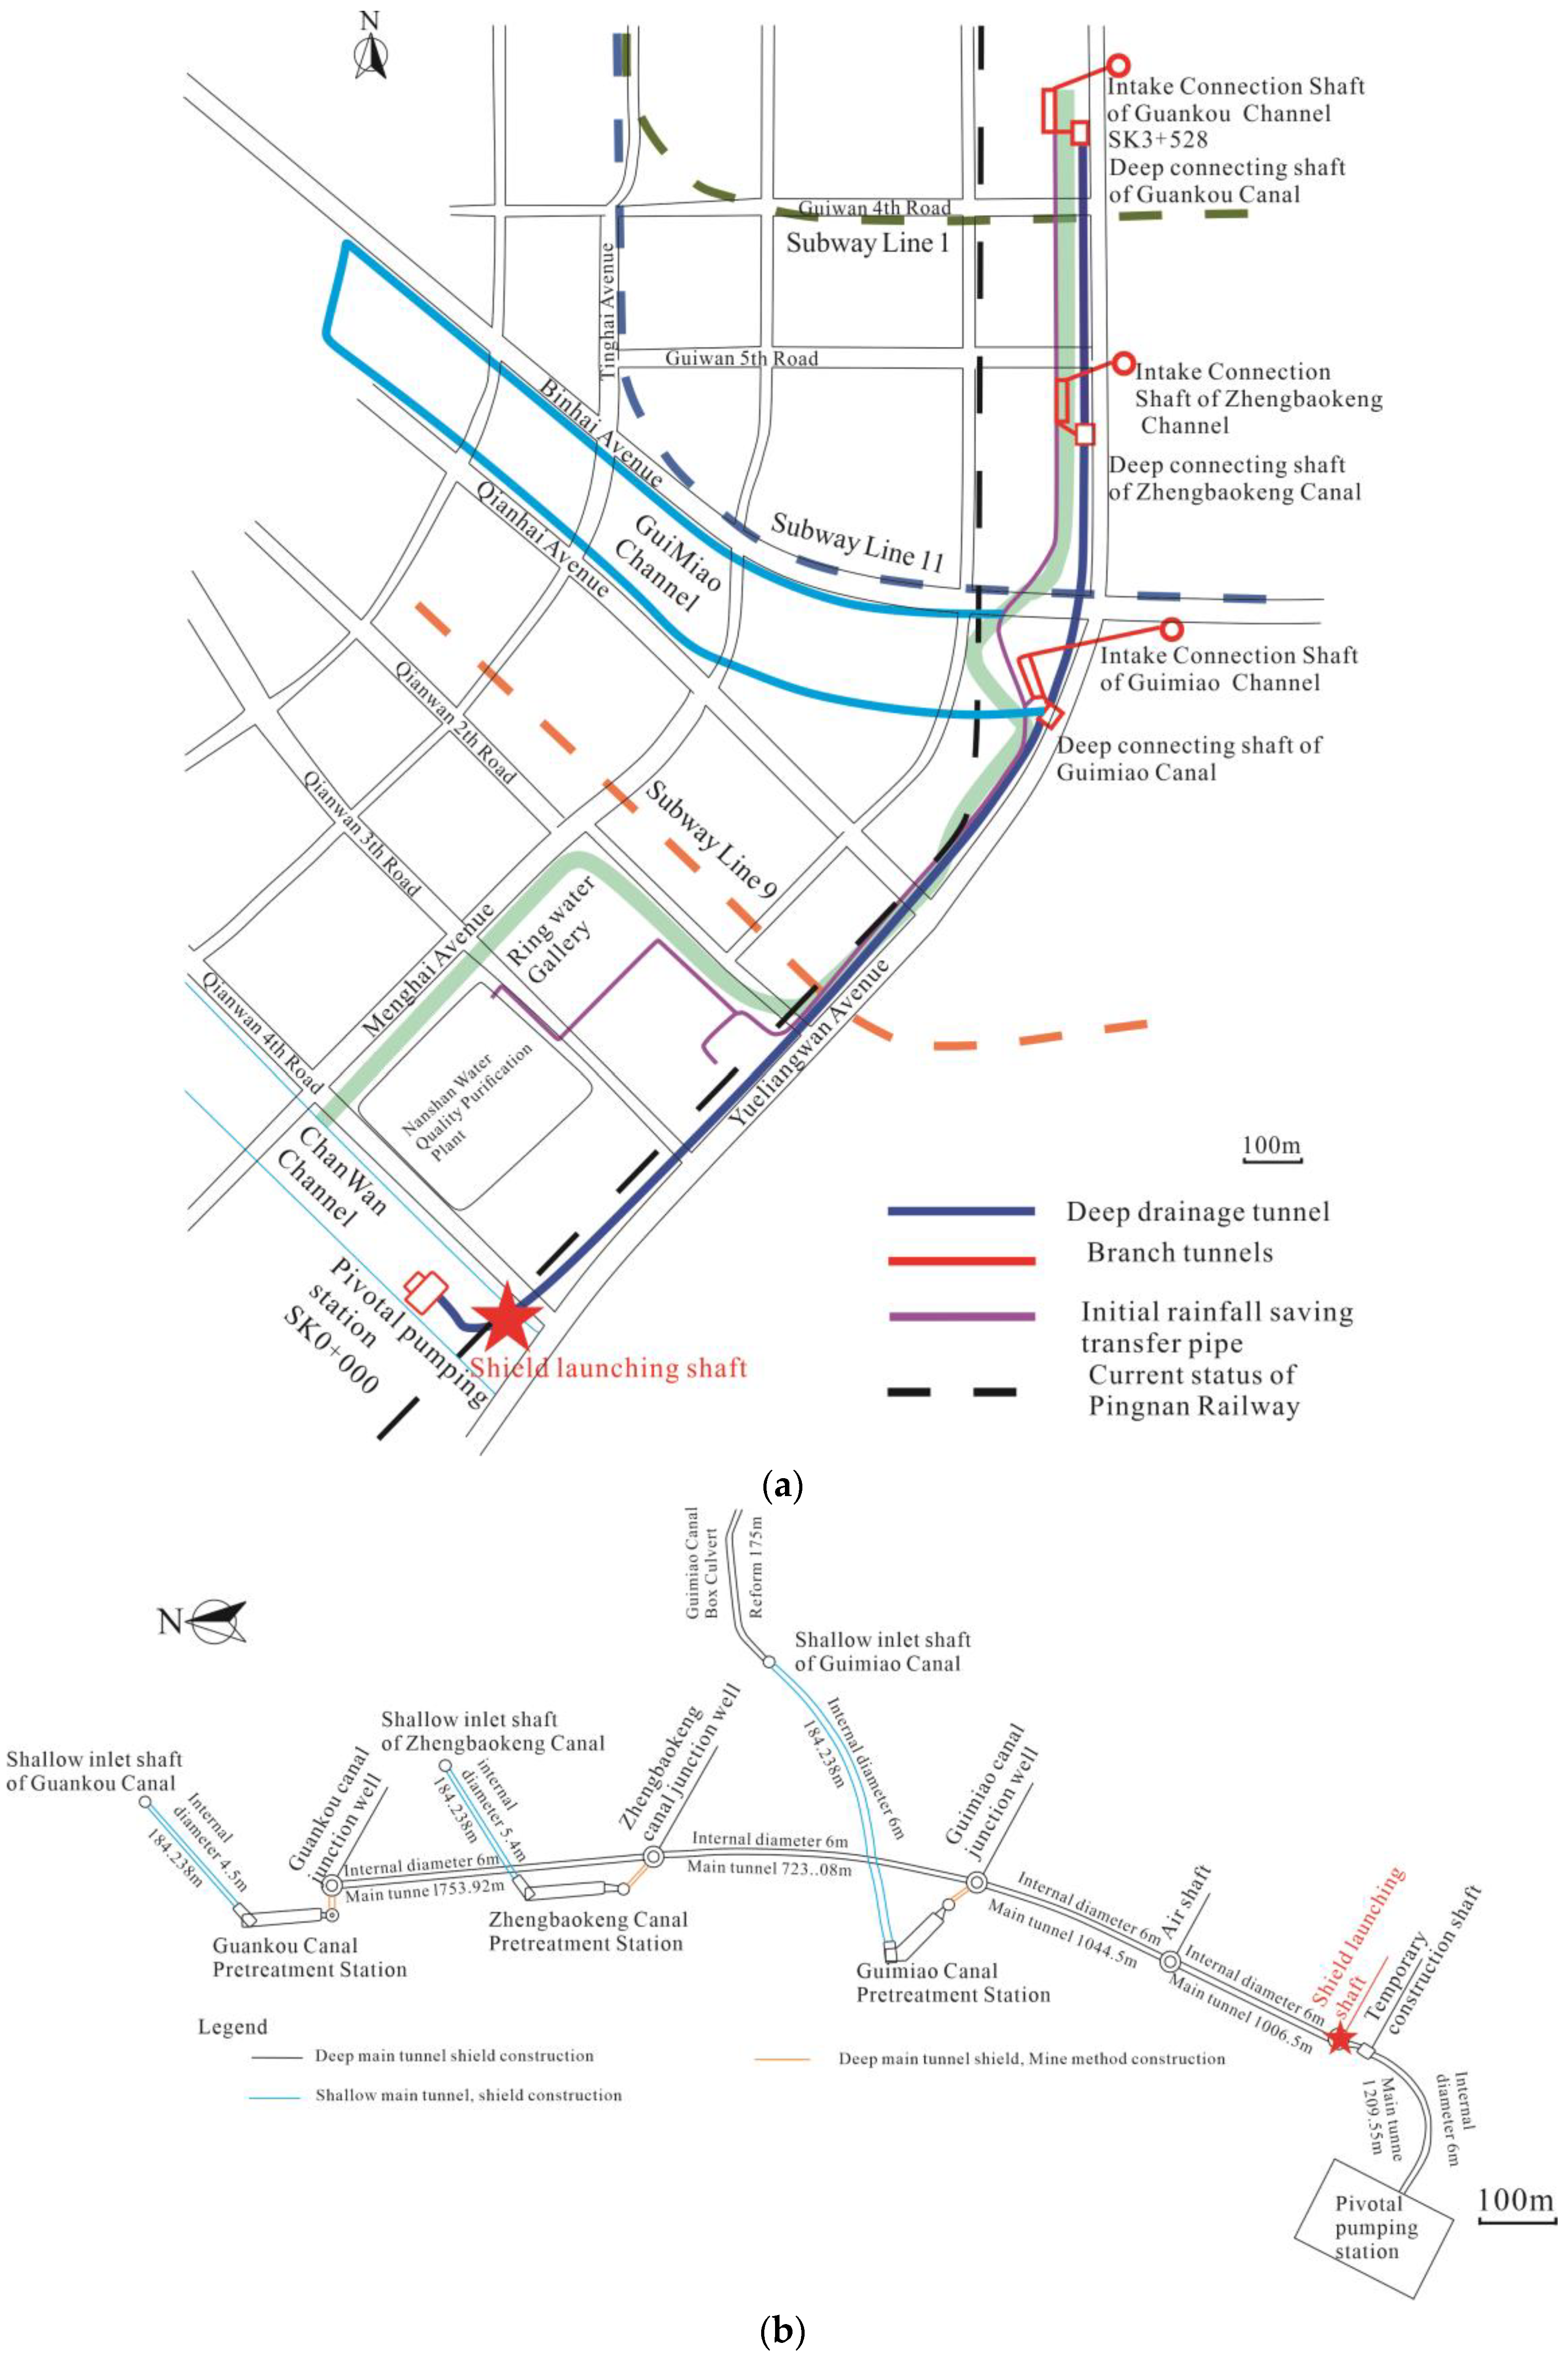
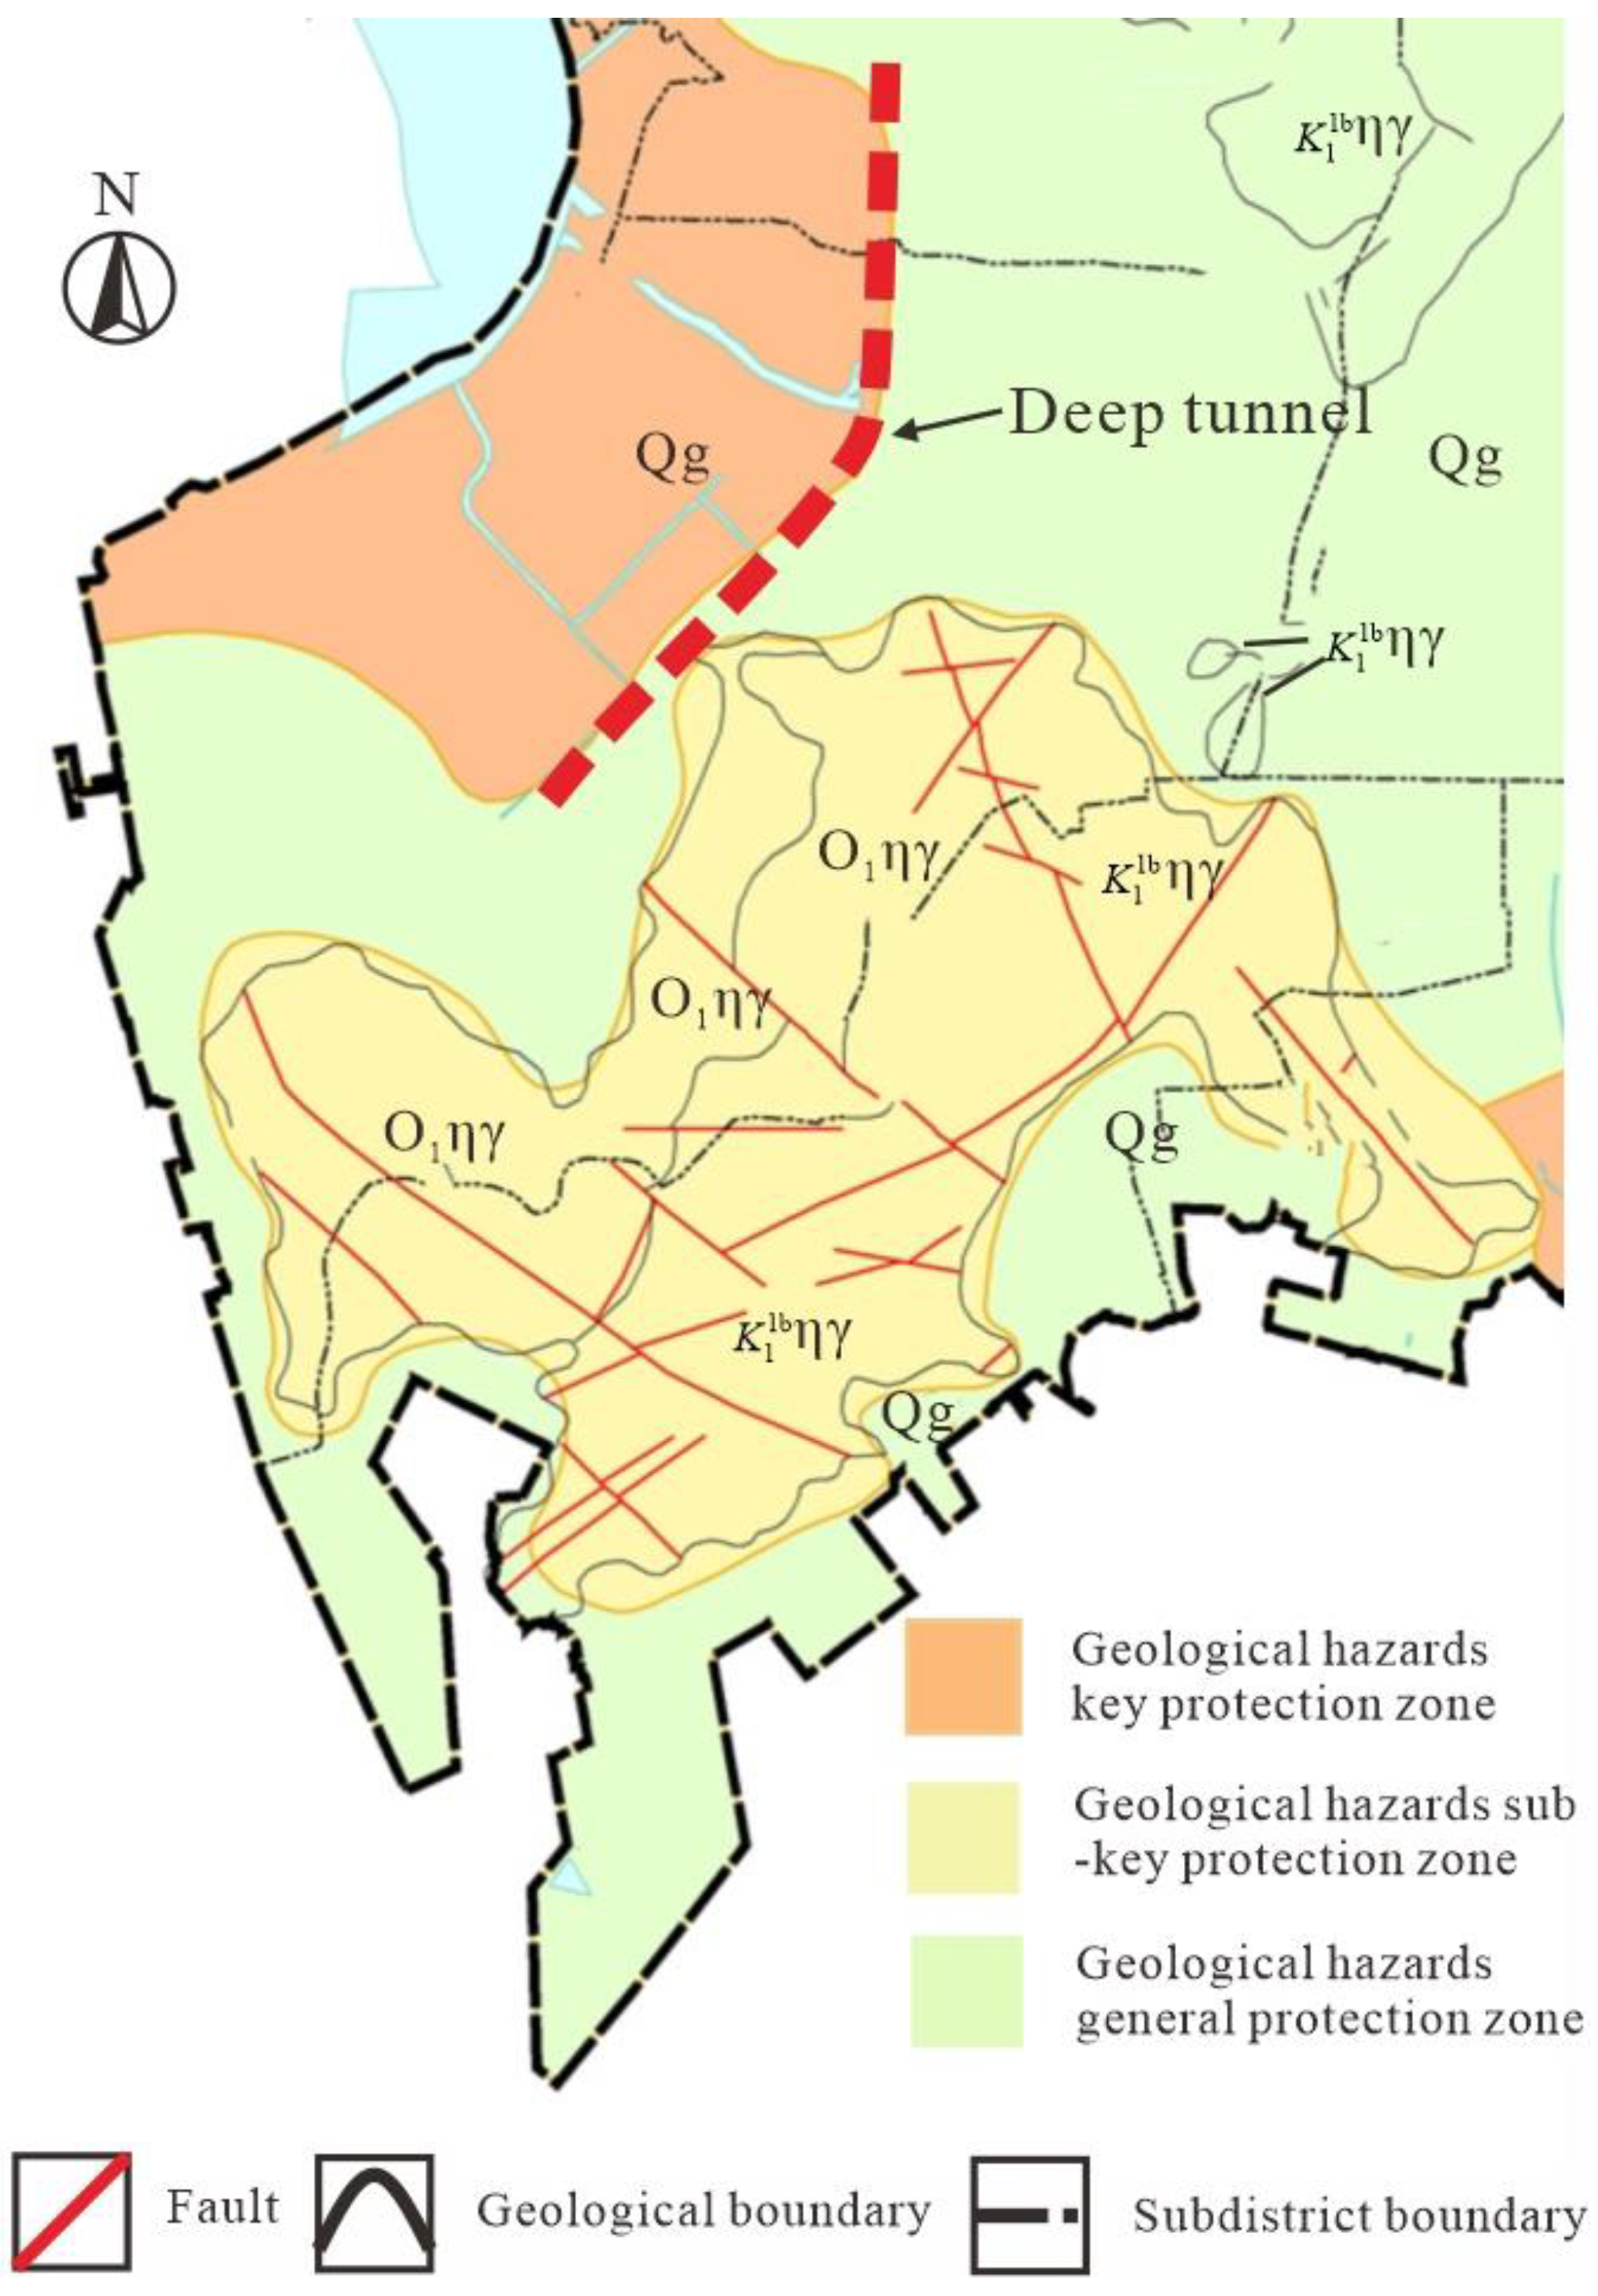
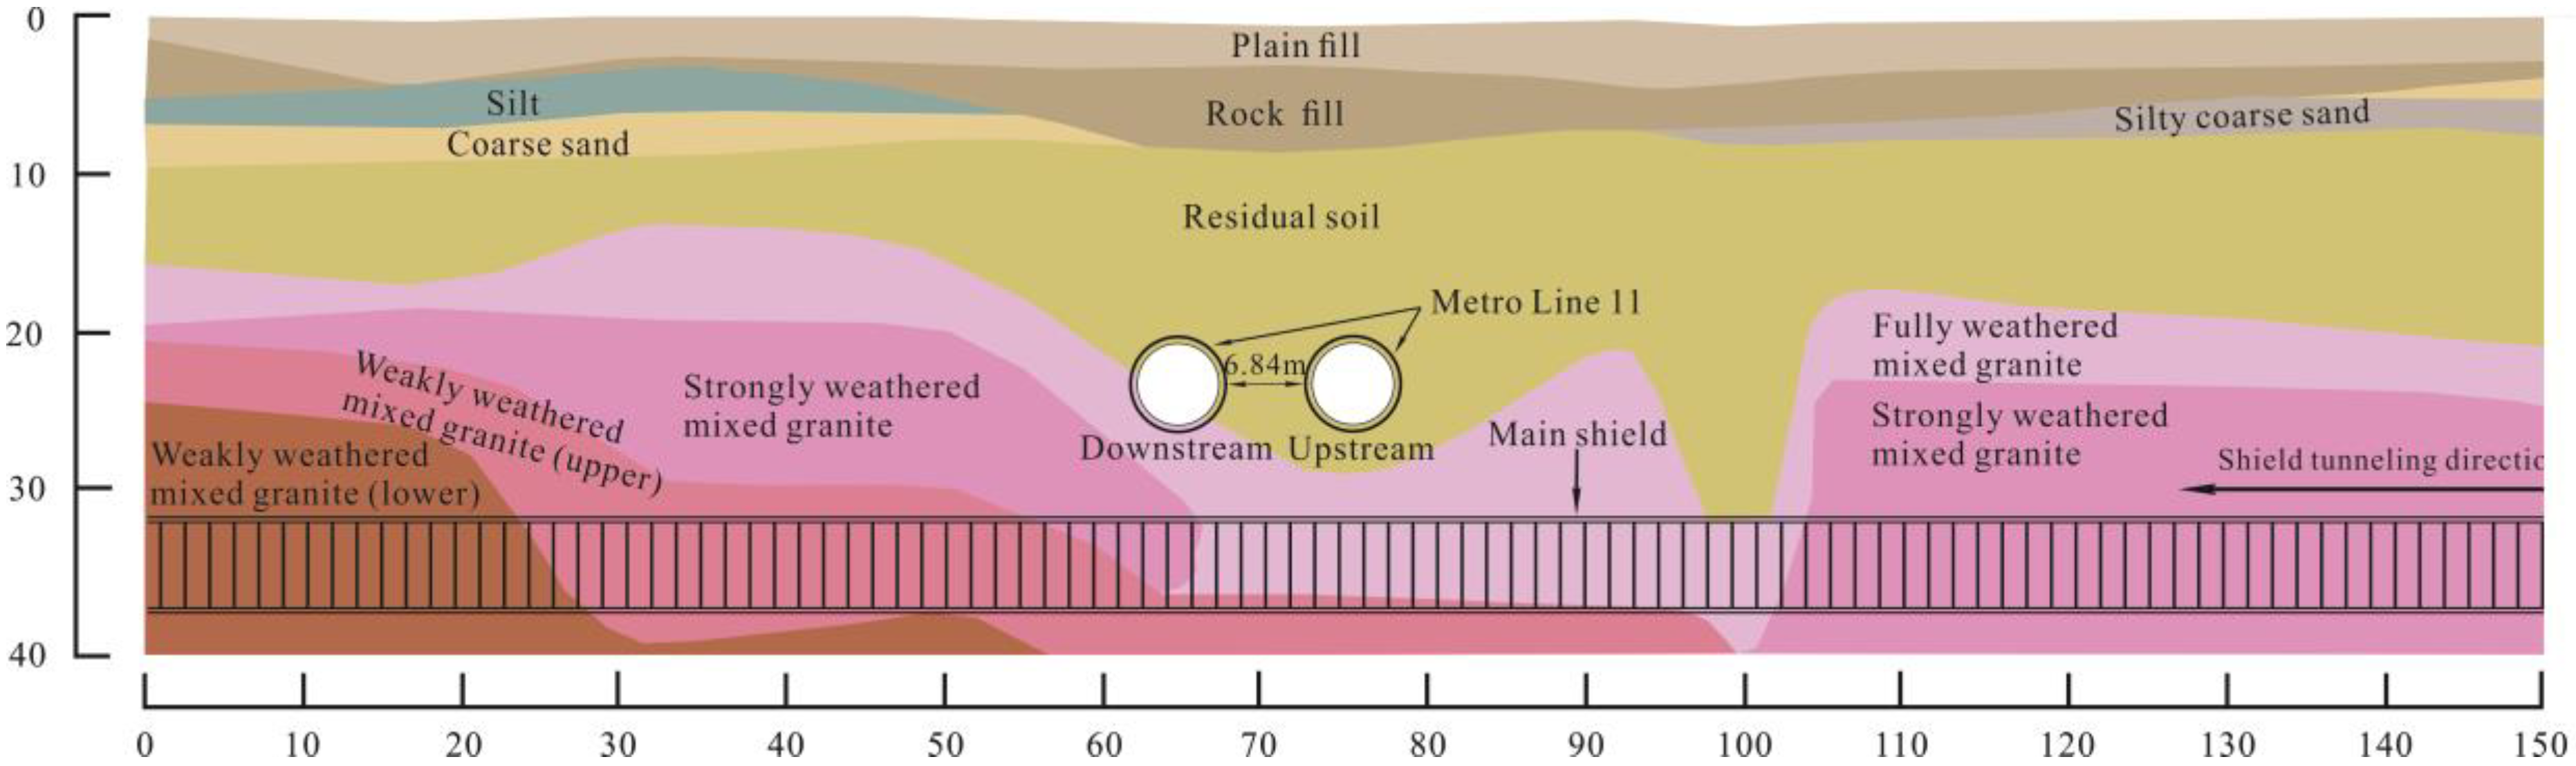
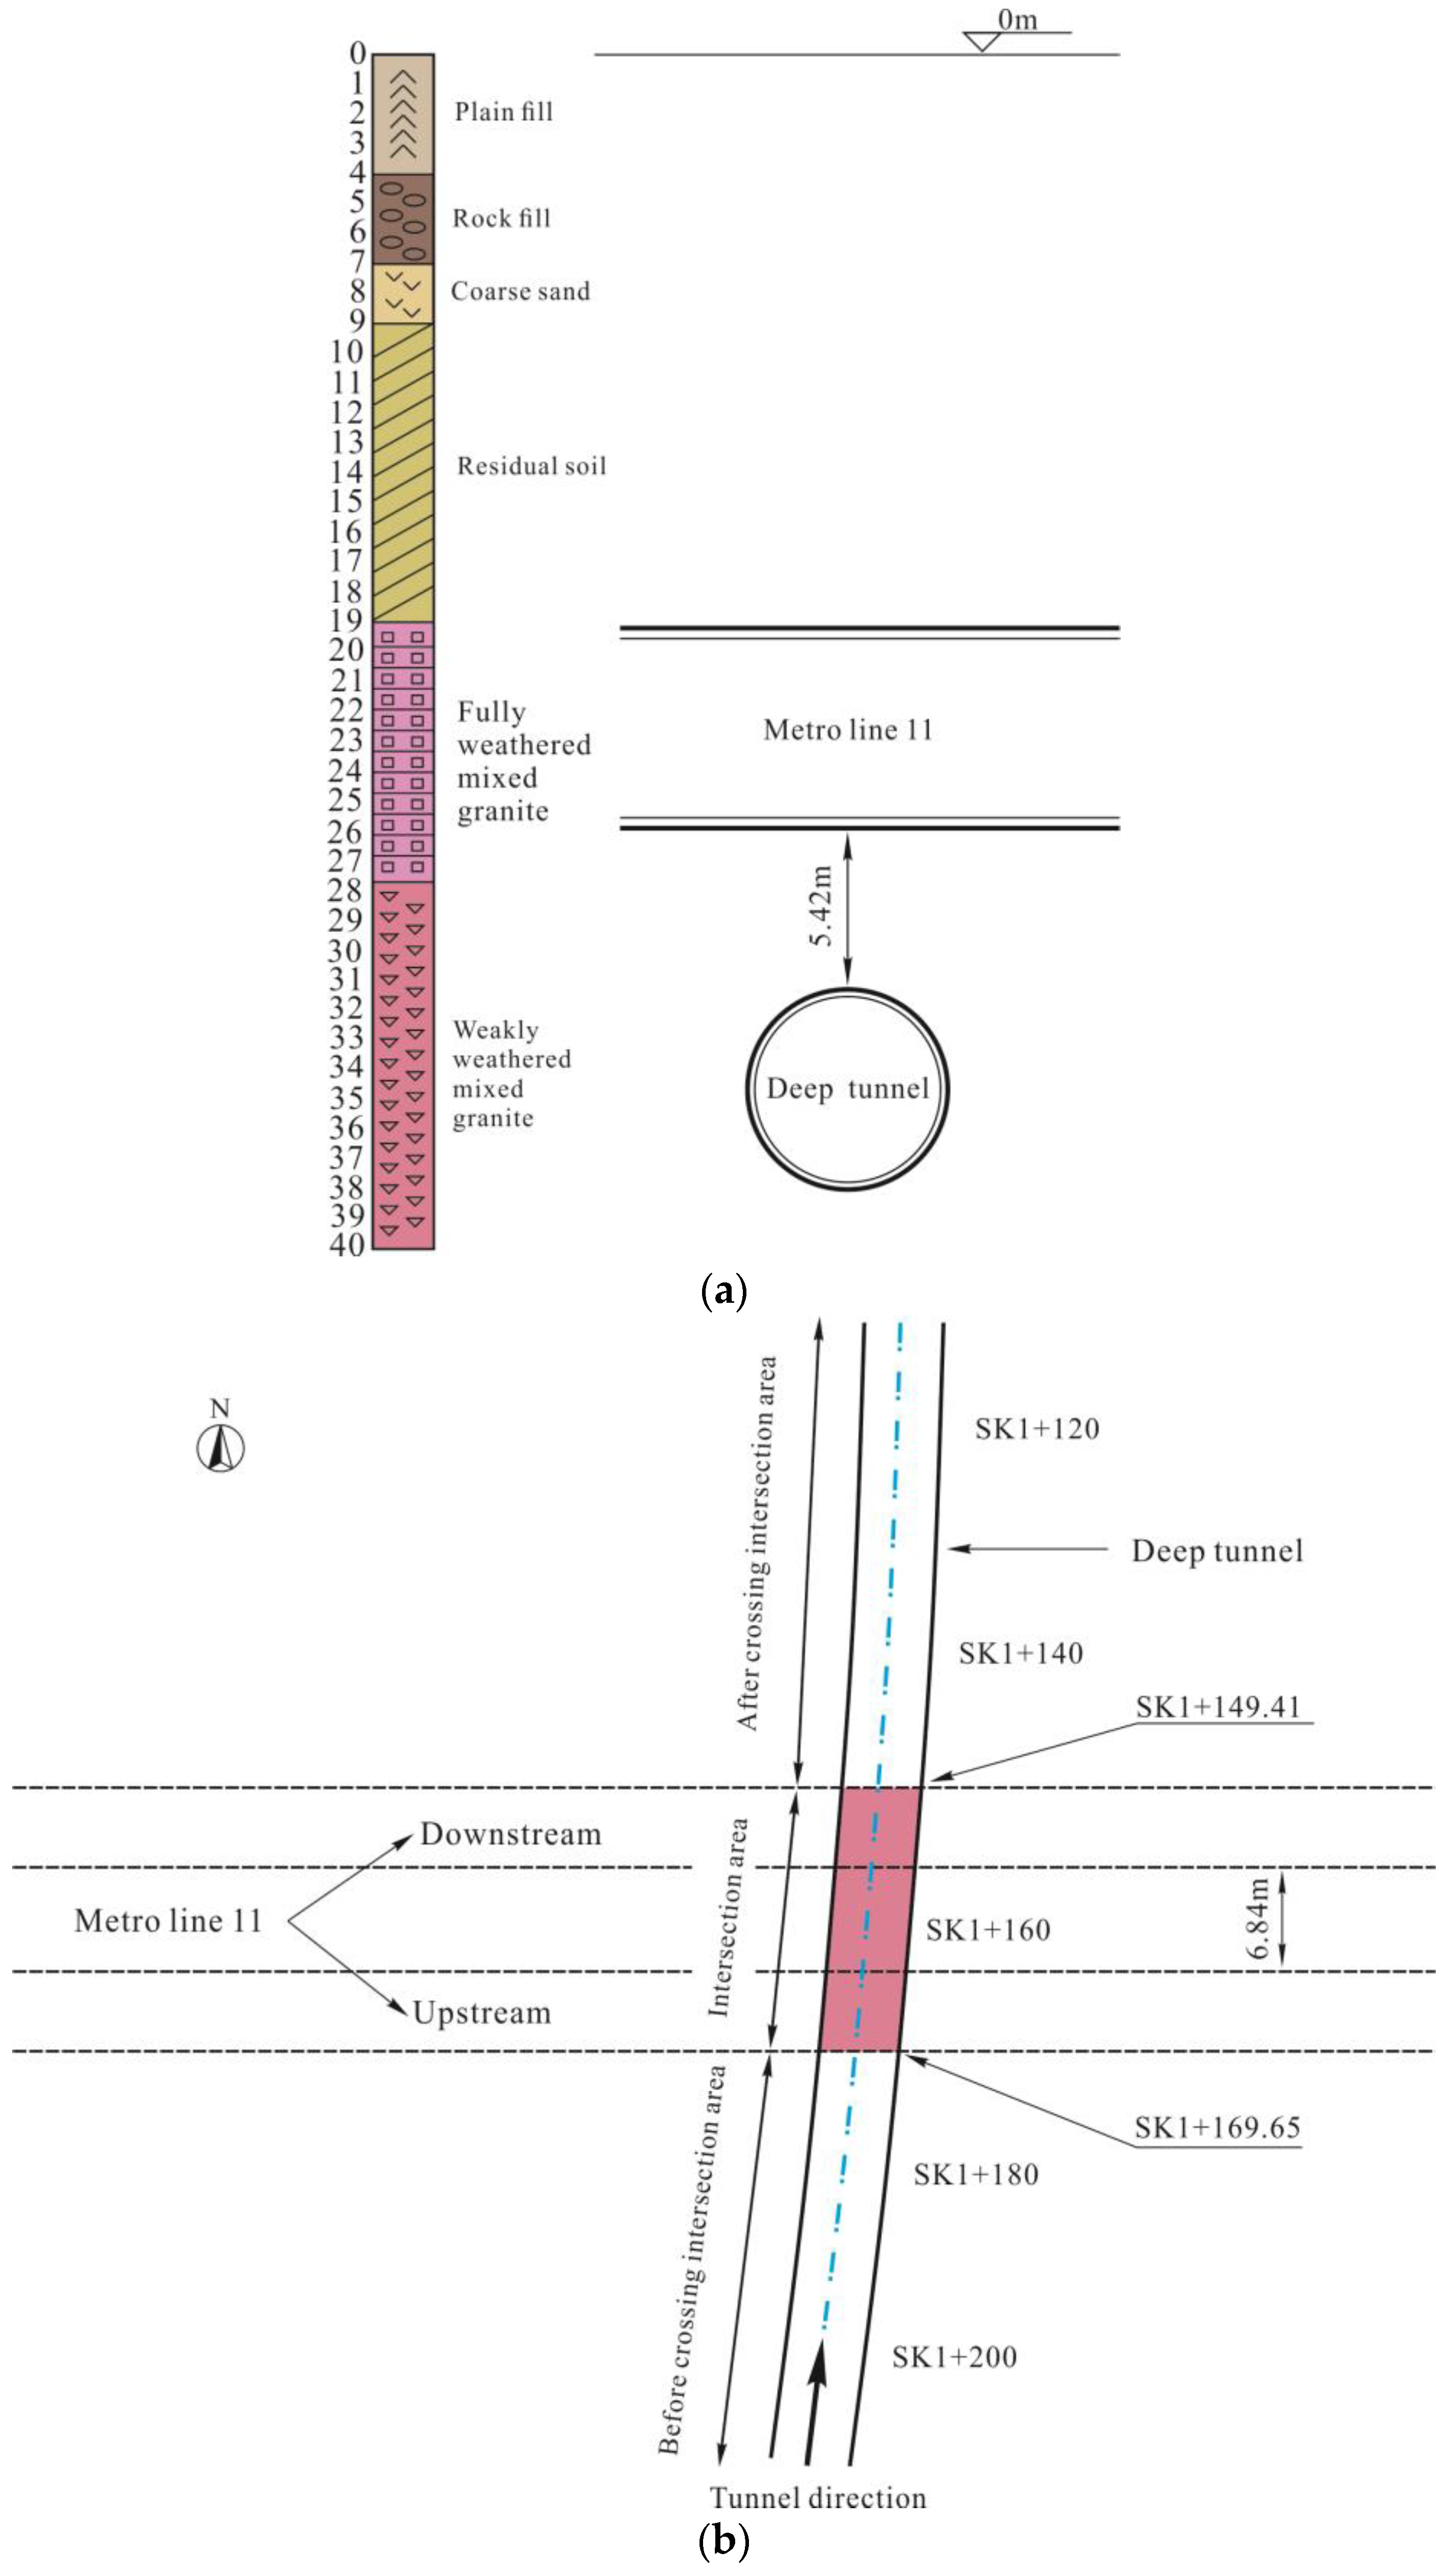
2.1. Project Background

The Qianhai–Nanshan drainage deep tunnel, with a total length of 3737.558 m, is located in Nanshan district along the west side of Yueliangwan avenue in Shenzhen. The project starts at the current Guankou canal and ends at the water corridor of the Chanwan canal. The tunnel would under-cross more than ten municipal roads from north to south, including Taoyuan Road, Xuefu Road, Guimiao Road, Chuangye Road, Qianwan 1st Road, S3 Guang-zhou-Shenzhen Coastal Expressway, and Chanwan Road.
The inner and outer diameters of the tunnel are 6.0 m and 6.7 m, respectively. The tunnel would under-cross the subway lines 1, 9, and 11. The tunnel starts at the combination shaft located at the location SK3 + 528 with a bottom elevation of −35.05 m, which runs along northeast direction and turns left at the location SK1 + 949.103 with a turning radius of 900 m, then towards along north direction, it finally arrives at the location SK0 + 000 with a bottom elevation of 39.99 m, as shown in Figure 1.
The engineering geological condition includes the metamorphic rocks of the Jixian system and Qingbaikou system Silver Lake Group ( O 1 η γ ), intrusive rocks of the Yanshan IV ( K 1 1 b η γ ), and sedimentary layers of the Quaternary Strata (Qg). The Jixian system and Qingbaikou system Silver Lake Group metamorphic rocks are mainly located in the southern part of the project area with various rock types, including granite, quartzite, schist, and gneiss. The Yanshan IV formation is distributed in the northern and eastern parts of the project area with black mica granite and diorite. The Quaternary strata is well-developed in the area, including residual slope layers, artificial accumulation layers, marine phases, and sea–land intersection sediment layers, comprising various sediment types such as silt, silty sand, clay, and sand. The main regional geologic map is shown in Figure 2.
Figure 3 shows that there is a variety of strata, including plain fill, rock fill, silt, coarse, silty coarse, residual soil, fully weathered mixed granite, strongly weathered mixed granite, and weakly weathered mixed granite layers [29]. The physical and mechanical parameters of these strata are listed in Table 1. In this site, plain fill is widely distributed, with diverse components and uneven soil quality, making it a relatively unstable soil mass. The Quaternary Holocene series of marine land deposits contain organic sand, and the Quaternary Holocene series of alluvial proluvial gravel sand are liquefiable sand, with slight to moderate liquefaction potential. The plain fill and the sand layers are located in the shallow strata and far above the tunnel, which have less influence on the tunnel. Residual soil as well as fully and strong weathered rock are vulnerable to softening when they are disturbed from tunnels crossing through due to their poor physical properties, which may cause excessive deformation and even threaten the safety of the tunnel. Strata alternating between soft and hard easily cause cutter head wear or mud cake blunt shield, which also lead to a shield posture that is difficult to control, thereby slowing the excavation speed down.
The weathered granite strata would cause more deformation due to being prone to softening and disintegration after tunnelling, which would increase tunnelling risk, especially when a subsequent tunnel under-crosses at a close distance. In addition, when there is more groundwater with higher pressure or the groundwater is not treated properly, the risk of subsidence induced by tunnelling is increased. The tunnel is located within a relatively impermeable layer, while there are some fissures in weathered rocks where tunnel crosses, and groundwater may form concentrated seepage. The weathered granite strata would cause more deformation due to being prone to softening and disintegration after tunnelling, The seepage of groundwater will further expand the plastic zone of the rock surrounding the tunnel, and then affect the stress distribution and deformation of rock surrounding the tunnel. The stress release caused by tunnel excavation in the saturated rock mass is a nonlinear development process, with complex temporal and spatial effects accompanied by seepage. The coupling effect of the seepage field and stress field in groundwater seepage during excavation will aggravate deformation formation and may lead to catastrophic accidents, such as water gushing and collapse. Therefore, stratum reinforcement measures must be taken before tunnelling through such a geological section, especially when under-crossing the existing subway tunnel. In order to enhance the strength and modulus of surrounding rock, reduce the permeability of surrounding rock and improve the stability of surrounding rock, grouting is the most commonly used measure of formation reinforcement in tunnel engineering, and pre-grouting technology is an important means to ensure the safety and quality of construction.
The width of the double lines of subway tunnel 11 is 20.24 m, and the subsequent tunnel would under-cross from SK1 + 169.65 to SK1 + 149.41. The depth of the subsequent tunnel is 35 m from the ground. The minimum vertical distance between the subsequent tunnel and subway tunnel is 5.42 m, and the horizontal angle with the centerline of the subway line is 83°. For the convenience of expression, we define the upstream and downstream directions of subway lines corresponding to from west to east and east to west, respectively. The relationship of the deep tunnel under-crossing subway line 11 is shown in Figure 4a. The crossing intersection area is divided into three parts, namely, before crossing intersection area, under intersection area, and after crossing intersection area, as shown in Figure 4b.

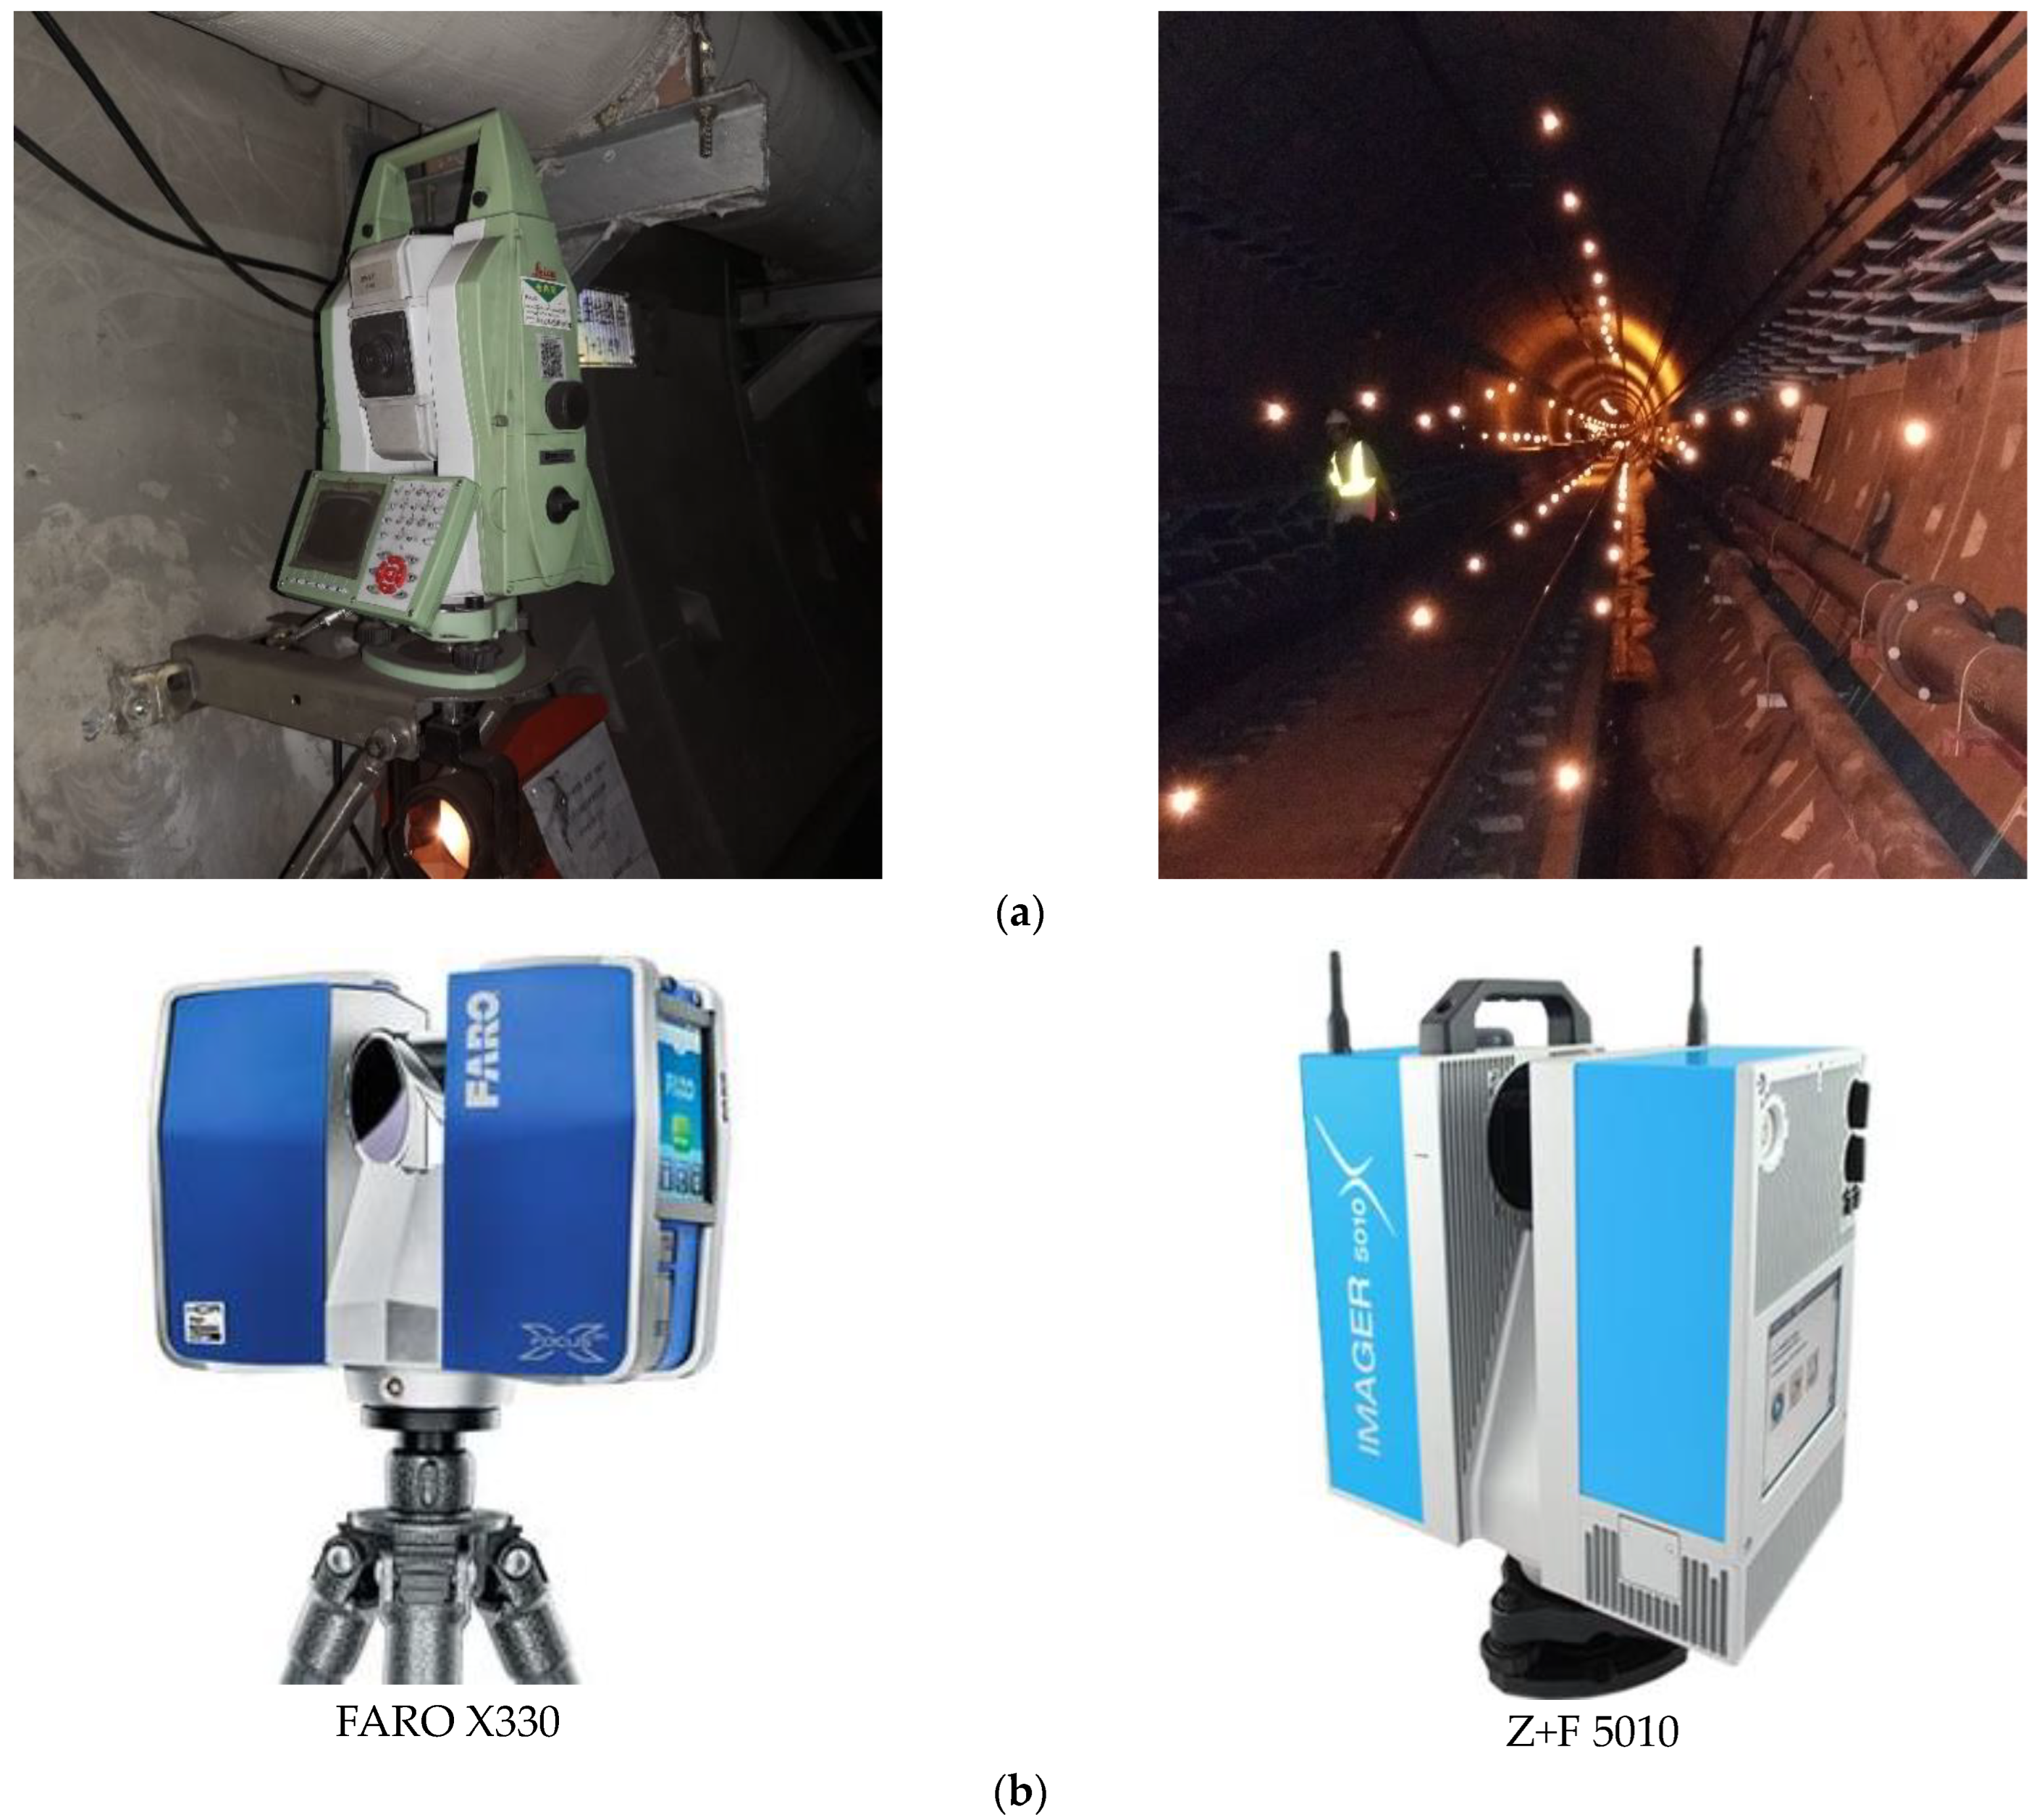
2.2. On-Site Monitoring Program

The construction of a subsequent tunnel under an existing subway tunnel can cause more deformation or even failure of the existing structure. To ensure the deformation remains within a safe range threshold, it is necessary to monitor the entire excavation process and to provide timely feedback for adjusting construction parameters and measures. This would prevent the existing tunnel of subway line 11 from suffering significant deformation. Before the tunnelling of the subsequent tunnel under the subway line 11, the section of the subway line 11 needs to be determined by three-dimensional laser scanning. At the same time, the structural characteristics of the subway line 11 also need to be investigated and recorded in detail. Monitoring points are positioned upstream and downstream the subway line 11. Three monitoring points are set in each monitored section, including one monitor point on the vault and two monitor points on the track bed, as shown in Figure 5. The actual scene of the site layout and monitoring equipment are shown in Figure 6. In actual engineering, these monitor data can be used to evaluate the risk grade based on a comprehensive evaluation model of tunnel risk based on the cloud model and combination weight. According to the characteristics of the risk influencing factors of the tunnel, four levels (lower risk, medium risk, higher risk, and highest risk) are given according to the trial version of the risk standard based on a former analysis. The risk grade can be obtained by the evaluation model from time to time, when the risk grade reaches higher risk grade, tunnelling should be shut down, and some treatment measures such as grouting and pumping should be strengthened.

3. Results

3.1. Field Monitoring

The subsequent tunnel under-crossed from 20 April 2022 to 22 June 2022. We selected the monitoring data beginning on 20 April 2022. The study area was divided into three parts according to the relative position of the shield, namely before crossing the intersection area, under the intersection area, and after crossing intersection area, as shown in Figure 4. In order to control the impact of the subsequent tunnelling on the existing subway tunnel, we monitored the displacements of sections 01, 05, 07, 09, 11, and 15. Each monitor point is marked with a corresponding number, for instance “U05-1” refers to the monitor point on Section 5 upstream of the line, while “D05-1” refers to the monitor point on Section 5 downstream of the line.

3.2. Vertical Displacement of Vault

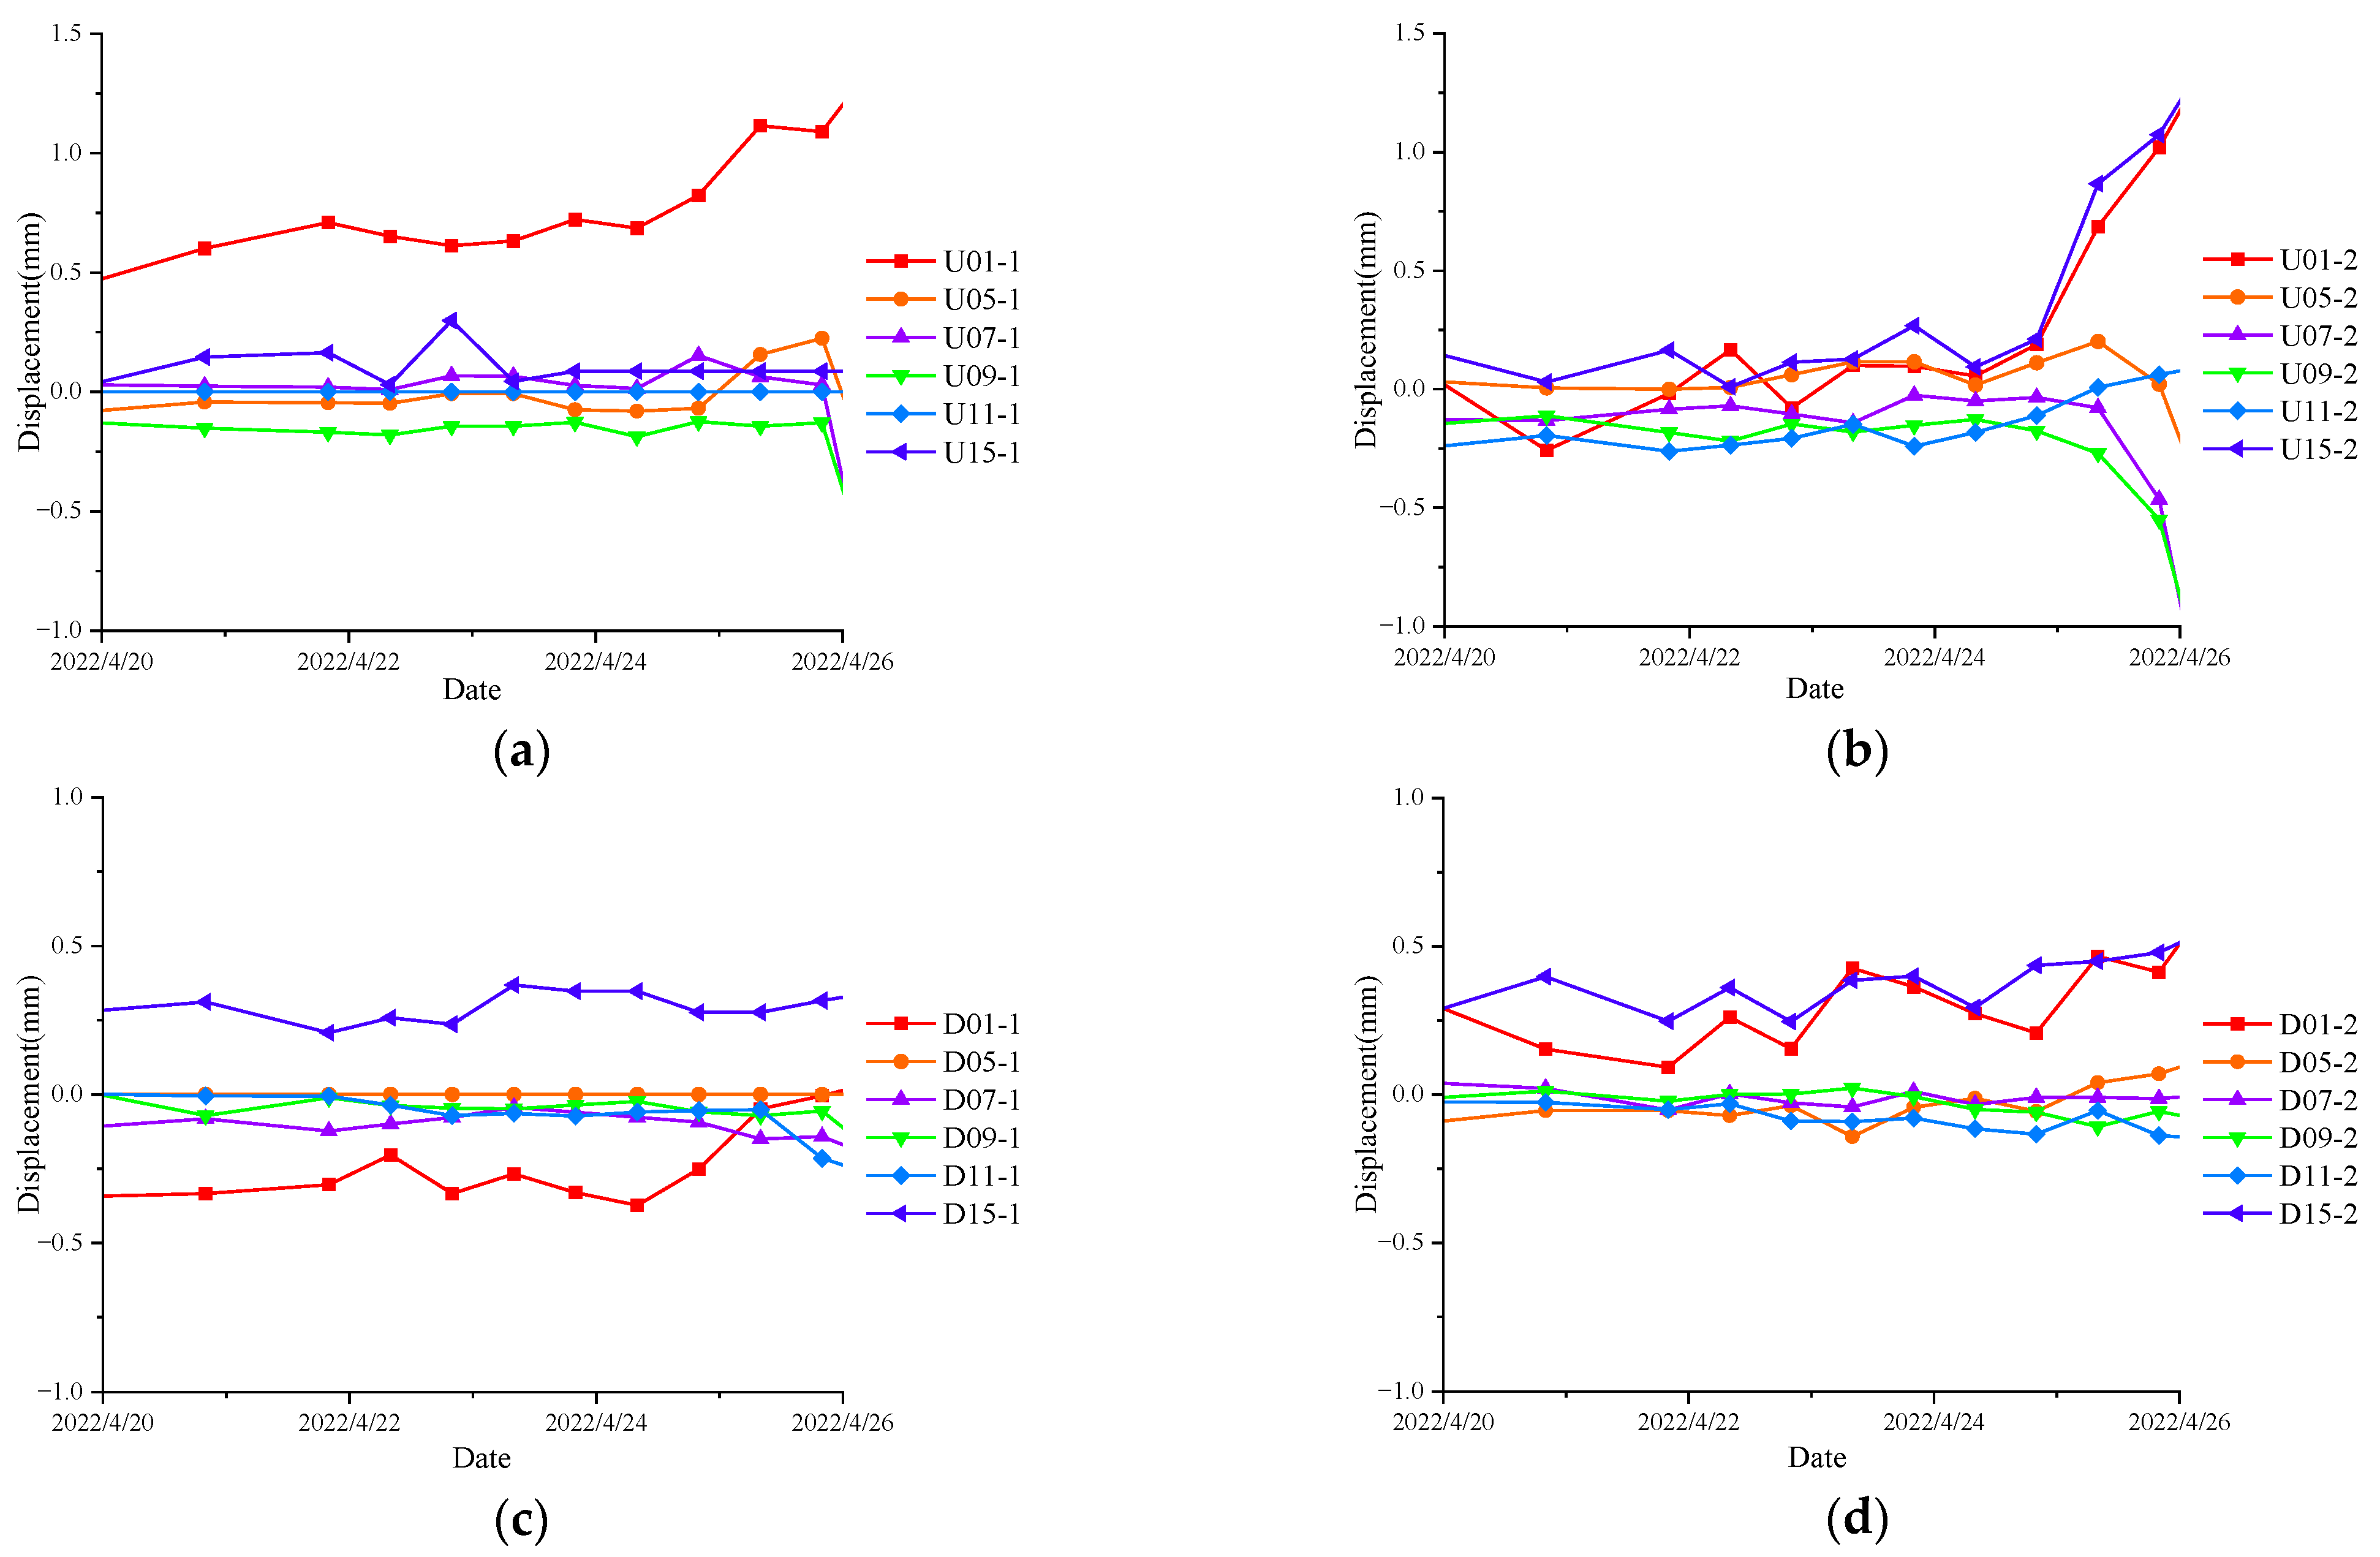
3.2.1. Before Crossing the Intersection Area

Figure 7 shows the vertical displacement of the vault of the existing subway tunnel of the upstream and downstream lines before the subsequent tunnel under-crosses the subway line 11 from 20 April to 26 April.
Figure 7 shows that the vertical displacement of the vault in the upstream line fluctuates within a small range before 24 April and increases sharply after 24 April. Figure 7a shows that the displacement of point U15-3 rapidly increases with a maximum displacement of 0.96 mm and that the displacements of points U15-3 and U01-3 are more significant than other points. Figure 7b shows that the vertical displacement of the vault downstream of the line changes slightly before subsequent tunnel arrives. Figure 7 shows that the displacements on both sides are slightly larger than the those in the middle. Figure 7 obviously shows that the displacement of the tunnel of subway line 11 started to rise on 25 April when the subsequent tunnel arrived at the location SK1 + 194.424 with the distance about 25 m away upstream of the subway tunnel and 39 m away downstream of the subway tunnel, respectively. The squeezing effect of the shield machine of the subsequent tunnel on the earth first affected the tunnel upstream.

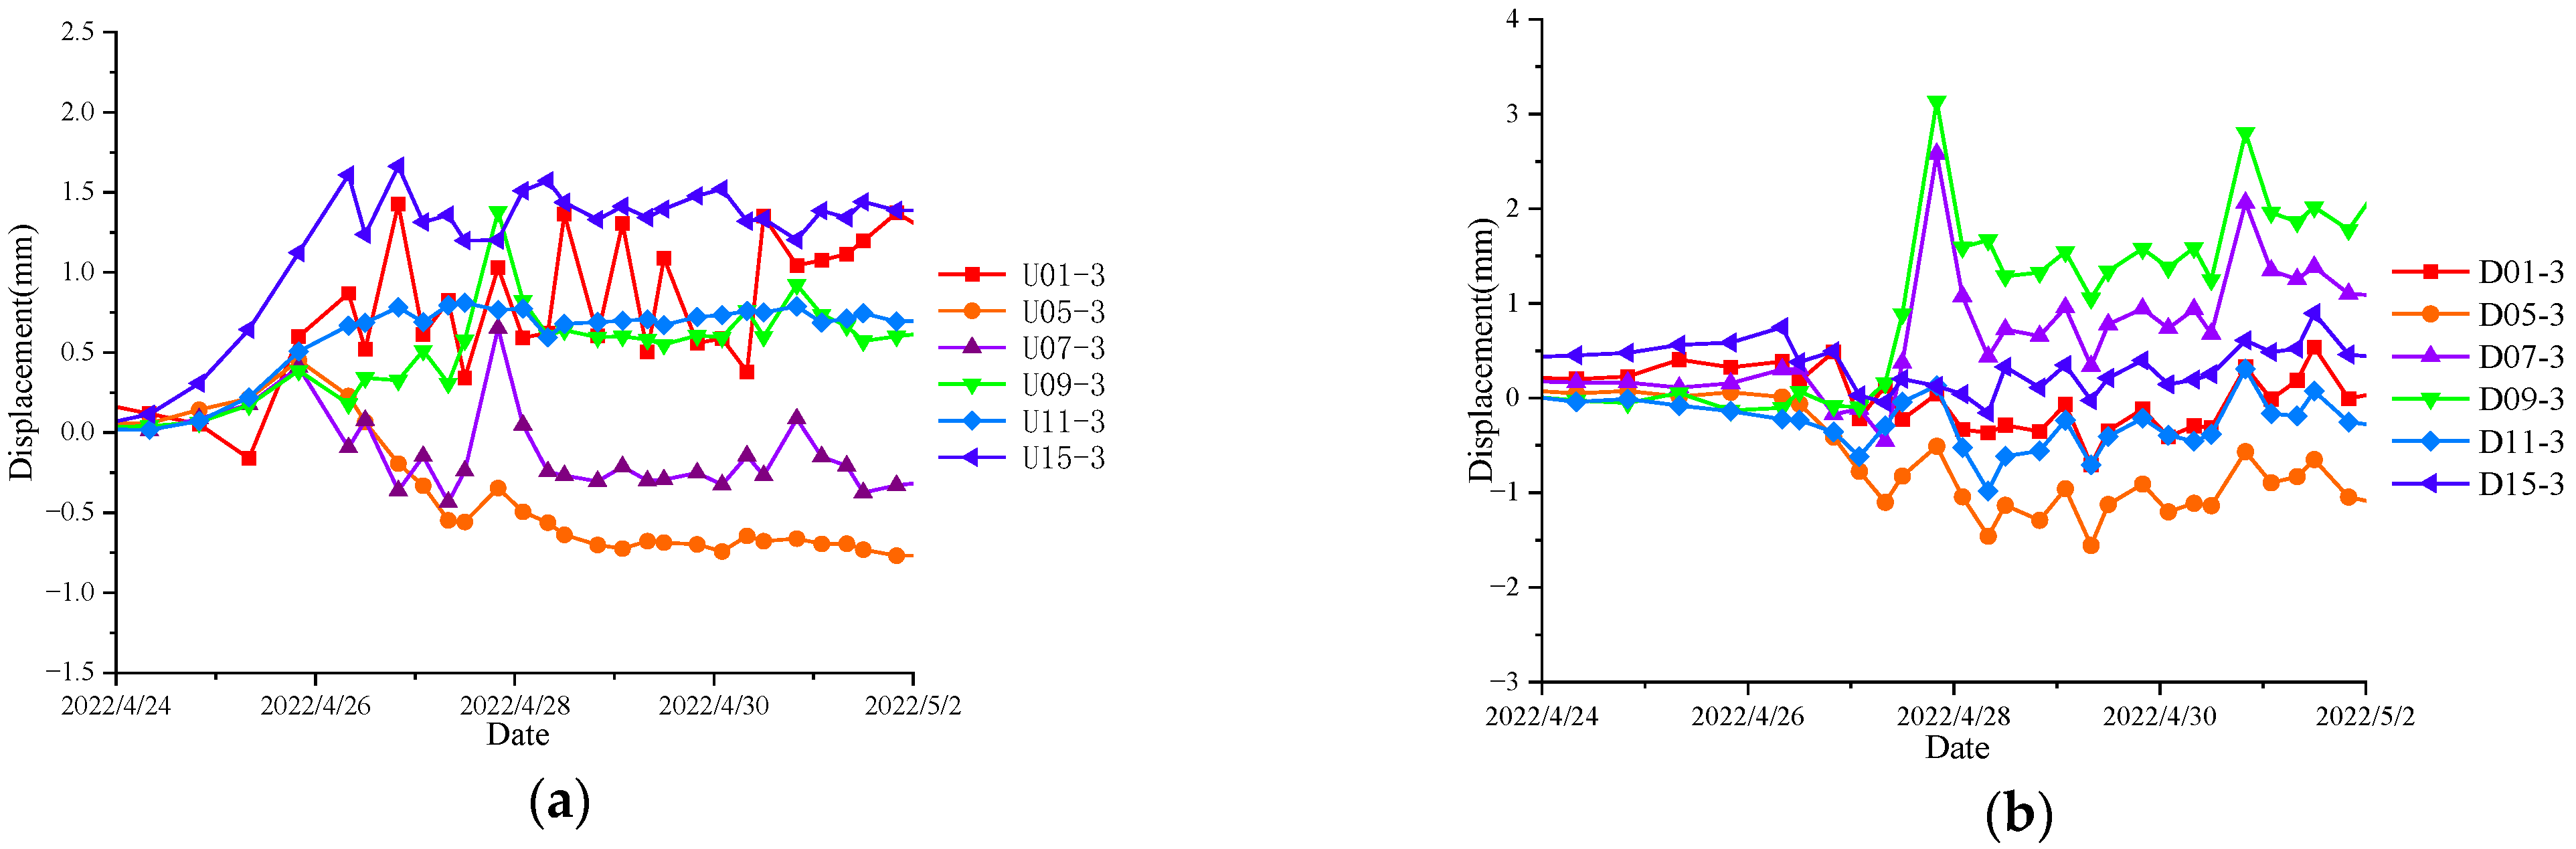
3.2.2. Under the Intersection Area

Figure 8 shows the vertical displacement of the vault of the subway tunnel when the subsequent tunnel under-crosses the intersection area from 24 April to 2 May.
When the subsequent tunnel under-crosses the subway line 11, the displacement of each monitor point has not changed since before crossing the intersection area. The vertical displacement of the vaults of points U15-3 and U01-3 continued to fluctuate and decrease after reaching a peak at 12:00 on 26 April, with a maximum displacement of 1.66 mm and 1.42 mm, respectively. The vertical displacement of the vaults of points U07-3 and U09-3 both reached their maximum value at 6:00 am on 28 April, while the vertical displacement of the vaults of point U11-3 slowly increased and then remained around 0.7 mm. The vertical displacement of the vault of point U05-3 continued to flatten and remain the value of −0.8 mm.
The vertical displacement of the vault in the downstream line did not show an obvious change before 26 April. However, from 26 April to 2 May, when the shield machine of the subsequent tunnel was under-crossing the intersection area, the vertical displacement of the vault almost experienced five stages, namely “rising”, “sinking”, “fluctuating”, “rising”, and “sinking”, with the overall shape similar to that of a cat’s head. The vertical displacement of the vault of point U09-3 reached its peak at 6:00 am on 1 May, with a maximum displacement of 2.80 mm, followed by the displacement of point U07-3 with a maximum displacement of 2.06 mm. During the second ascent, the peak displacement of points U09-3 and U07-3 did not exceed the first ascent. The changes at the remaining points were much smaller than points U09-3 and U07-3, with a maximum displacement of 1.55 mm at 18:00 on 29 April.
Under the intersection area, the subway tunnel downstream of the line first sank slowly and then rose sharply, and the changes to the monitor points of the subway tunnels both upstream and downstream of the lines were quite different. The influence of earth excavated by the shield machine caused the subway tunnels to sink. Then, the squeezing effect of the shield machine was greater than the effect of ground loss, making the subway tunnels to rise owing to the advancement of the shield machine.

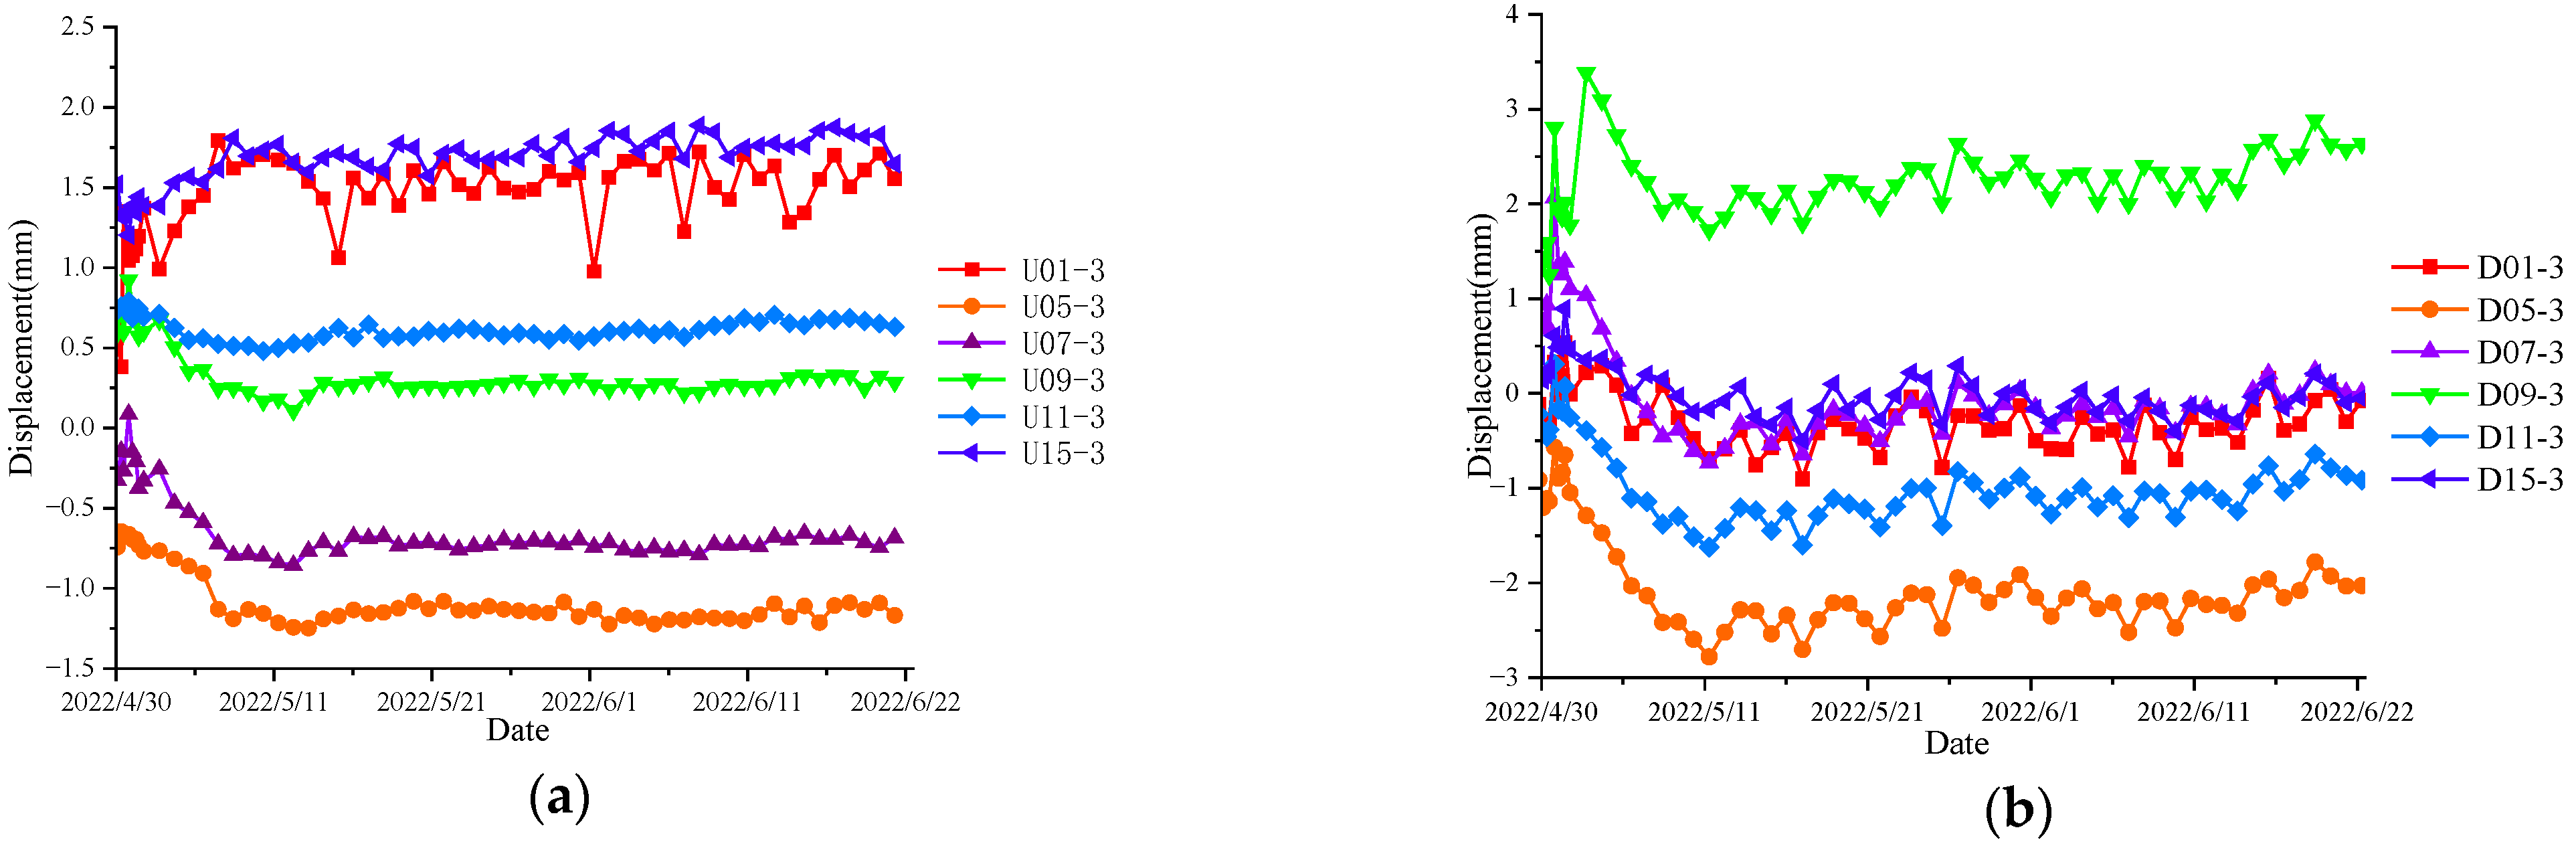
3.2.3. After Crossing the Intersection Area

Figure 9 shows the vertical displacement of the vault of the subway tunnels upstream and downstream of the lines after the subsequent tunnel under-crosses the intersection area from 30 April to 22 June.
After under-crossing the intersection area on 2 May, the displacement of each monitor point upstream of the line continued to maintain the previous trend and stabilized after 11 May. Except for the displacement of point U01-3, it experienced dramatic changes at individual times. The displacements of the points U15-3, U01-3, U09-3, and U11-3 ultimately presented a convex state, with points U15-3 and U01-3 significantly protruding to 1.7 mm and 1.6 mm, respectively. The displacement of points U07-3 and U05-3 finally showed a subsidence trending to −0.8 mm and −1.2 mm, respectively. Downstream of the line, only the displacement of point D09-3 finally presented an uplift state. After the tunnelling of the subsequent tunnel, the maximum value of displacement was 3.38 mm. The displacement of points D05-3 and D11-3 shows a sinking state, with maximum displacements of −2.56 mm and −1.3 mm, respectively. The final displacements of points D01-3, D07-3, and D15-3 are close to a stable state. After under-crossing the intersection area, the change in subway double tunnels became relatively stable as the subsequent tunnel moved away.
Combined with the project logs and displacement curves, it can be seen that the deformation float of the vault is mainly due to the squeezing action of the shield machine of the subsequent tunnel, and that the vault sink is mainly due to soil loss, which is closely related to the location of the shield machine.

3.3. Vertical Displacement of Track Bed

3.3.1. Before Crossing the Intersection Area

Figure 10 shows the vertical displacement of the track bed of the subway tunnel upstream and downstream of the lines before under-crossing the intersection area from 20 April to 26 April.
Before 25 April, there was no notable vertical displacement of the left track bed upstream of the line. The displacement of point U01-1 gradually increased during this period and began to change on 25 April, with a maximum displacement of 1.11 mm. The remaining monitor points began to sink at 18:00 on 25 April. There was a flat portion for points U11-1 and U15-1 due to the failure of the monitor equipment at that time. Before 25 April, there was also no notable vertical displacement of the right track bed in upstream of the line. The displacement of points U01-2, U11-2, and U15-2 began to increase and reached a maximum displacement of 1.07 mm on 25 April. The sinking trend of points U09-2 and U07-2 was earlier than that of U05-2. In contrast, the vertical displacement of the track bed downstream of the line fluctuated back and forth without no obvious trend.

3.3.2. Under the Intersection Area

Figure 11 shows the vertical displacement of the track bed of the subway tunnel both upstream and downstream of the lines when the subsequent tunnel under-crosses from 24 April to 2 May.
Upstream of the line, the vertical displacement curves of the left and right sides of the track beds are different. The displacement of points U05-1, U07-1, and U09-1 generally shows a sinking state, and the displacement of points U01-1, U11-1, and U15-1 show ascending state. The patterns in the change of points U07-1 and U09-1 are basically the same. The vertical displacement of the right track bed upstream of the line is consistent with that of the left track bed. The displacement of points U05-5, U07-5, and U09-5 also show a sinking state, with a maximum displacement of 1.66 mm. The displacement of points U01-5 and U15-5 reached their maximum values at 6:00 am on 27 April, with values of 1.62 mm and 1.49 mm, respectively. Afterwards, the displacement of point U01-5 changed sharply, but its displacement value did not exceed 1.62 mm. The displacement of other monitoring points changed smoothly after 28 April.
Downstream of the line, the displacements of monitor points on the left and right sides of the track beds are similar. From 26 April to 2 May, the vertical displacements of these monitor points could be divided into five parts totally, including “rising”, “sinking”, “fluctuating”, “rising”, and “sinking”. The shape of these curves generally resembled a cat’s head. During the fluctuation phase, the displacement of each monitoring point decreased slightly, and then rebounded at 18:00 on 29 April. The displacement of the Section 09 is the largest, with the displacement of the left and right track bed being 3.18 mm and 2.86 mm, respectively around 12:00 on 1 May. There was no obvious difference between the other monitor points.

3.3.3. After Crossing the Intersection Area

Figure 12 shows the vertical displacement of the track bed of the subway tunnel both upstream and downstream of the lines after the subsequent tunnel under-crosses the intersection area from 30 April to 22 June.
Upstream of the line, the displacement of points U01-1, U11-1, and U15-1 slowly increased after 2 May, then continued to fluctuate, with a maximum displacement of 2.21 mm. In the following process, the displacement of point U01-1 suddenly decreased from 17 May, reached its extreme value on 19 May, and then continuously fluctuated and increased. Figure 12 shows that the displacement of points U05-1, U07-1, and U09-1 slowly sank with slight changes, and the maximum displacement of point U05-1 was about −1.9 mm. The displacement of point U01-5 had two large fluctuations, but it quickly returned to its previous level. The displacement of points U09-5 and U05-5 gradually declined and fluctuated after rising on 17 May. The displacement of points of U11-5 and U15-5 fluctuated continuously throughout the process.
Downstream of the line, the vertical displacement of the left and right track beds kept consistent. On 3 May, the displacement on the left and right sides of Section 09 reached 5.14 mm and 6.14 mm, respectively, and then began to decline and stabilized at 4.4 mm and 4.8 mm, respectively. The displacement of other points kept falling at first, then fluctuated and stabilized at a certain level. The displacement of point D05-2 significantly sank and fluctuated continuously after 11 May, eventually remaining at −2.5 mm.
Although the distance between the left and right monitor points on the track bed is less than 3 m, there is an obvious gap between the displacements on both sides, as shown in Figure 11 and Figure 12. In the geological diagram, downstream of the tunnel traversed the strata of the residual soil layer and the fully weathered mixed granite layer, as shown in Figure 3. The physical and mechanical parameters of the surrounding rock in the lower-left part of downstream of the line were greater than those in the other parts, which led to the gap around the track bed, and this uneven displacement might cause the subway to shake and even derail. From this phenomenon, it can be observed that detailed stratum data are particularly important for the preliminary prediction of subway tunnels. It is foreseeable that the displacement change would be the same as the stratigraphic trend because the physical and mechanical strength parameters of the different strata are also different when the subsequent tunnel crosses different strata.

4. Discussion

When a new tunnel under-crosses an existing subway tunnel, the deformation of the existing subway tunnel is paid more attention due to more deformation. Accurate monitoring instruments are applied to monitor the displacement of existing subway tunnel during the new tunnel under-crossing. Some monitoring cross-sections are set along the longitudinal direction of the existing subway tunnel (shown in Figure 5). The excavation parameters, such as tunnelling speed, jacking forces, and grouting pressure, directly affect the deformation of the existing subway tunnel. Therefore, the development of deformation caused by the process of subsequent tunnel under-crossings may reach the ultimate state and may take place in different patterns.

4.1. Critical Moments during Under-Crossing

By using a high-precision automatic real-time measurement system, the displacement of the subway tunnel caused by the under-crossing tunnel can be well recorded, which is critical to the dynamic adjustment of technical parameters, such as the speed of shield tunnelling, the pressure of the excavation chamber, and the rotation of the screw conveyor, and helps to determine the critical moment during the subsequent tunnel under-crossing.
Figure 8 shows that many monitoring points reached their peak at 8:00 am on 28 April as the shield machine arrived at the location SK1 + 144.857, i.e., when the shield machine wass under-crossing the intersection area. The subsequent tunnel was tunneled from 0:00 am on 28 April to 0:00 am on 1 May, it was observed that the subway tunnel reached a peak around 11 May, because the change in earth stress gradually developed before reaching a steady state. This moment is particularly important and should be given full attention to other similar projects. Hence, it may be useful to extend monitor time until the tunnel displacement is relatively stable.

4.2. Deformation of the Subway Tunnel of Line 11

Throughout the complete process of shield tunnelling, the deformation upstream and downstream of the tunnels is not synchronous, and the deformation downstream of the tunnel has a certain lag effect compared to that of upstream of the tunnel. The deformation of the subway tunnel is relatively minor before the tunnelling of the subsequent tunnel. When the shield machine enters under the intersection area, the deformation of the subway tunnel occurs obviously. The maximum bulges of the vault of upstream and downstream of the tunnel in the subsequent process are 1.73 mm and 2.82 mm, respectively, and the maximum sink values are −1.26 mm and −2.56 mm, respectively. The maximum bulges of track beds of upstream and downstream of the tunnels in the subsequent process are 2.21 mm and 6.14 mm, respectively, and the maximum subsidence values are −2.15 mm and −3.14 mm, respectively. The deformation of the vault and track beds of the subway tunnel in the same monitoring intersection are nearly the same.
The early warning deformation values of the subway line 11 are listed in Table 2 based on the relevant requirements of the design documents. An early warning and alarm will occur when the change rate of deformation reaches 60% and 85% of the control value, respectively. The above monitoring must satisfy the safety requirements based on the Management Measures for Rail Transit Operation Safety Protection Zone and Construction Planning Control Zone Engineering of Shenzhen City in 2021.
From the field monitor data, except that of the displacement of the monitor point on the right side of downstream of the tunnel on 3 May reaches 6 mm. The rest of the displacement does not exceed the warning value, which shows that the existing subway tunnel is safe during the process of the subsequent shield tunnelling under the subway line 11. Simultaneously, the application of on-site monitoring plays a vital role in ensuring the safe operation of existing tunnel lines.

5. Conclusions

This paper presents a case study of the Shenzhen–Qianhai deep tunnel under-crossing the subway tunnel of line 11. Some displacement monitor points were placed in the existing tunnels to detect the subsidence of the tunnel to ensure the safety of the subway tunnel. An automatic monitoring system was used to monitor the displacement of the subway tunnel, which provided a scientific basis for safety analysis and judgment of the subway tunnel during the subsequent tunnel under-crossing. Through these real-time monitoring data, we can know where the existing tunnels are at higher risk of deformation during the process of under-cross tunnelling, which helps to adjust the tunnelling parameters in a timely manner to ensure the existing tunnel is within a safe state.
The displacement of the subway tunnel presented obvious an change when the subsequent tunnel under-crossed the subway tunnel. The subsidence of the subway tunnel was obviously affected by the position of the shield machine in the subsequent tunnel. There was sharply deformation upstream of the tunnel about 25 m before the subsequent tunnel under-crossed the subway tunnel. The displacement was most obviously before the subsequent tunnel arrived at the intersection area, and then the displacement gradually reduced as the shield machine moved away from the intersection area. During the under-crossing process, the mode of displacement of the subway tunnel downstream of the line closely resembles the shape of a cat’s head. In contrast, the displacement of the subway tunnel upstream of the line had no obvious change. The maximum displacement of the subway tunnel was 6.14 mm on the right track bed downstream of the tunnel. The deformations of the vault and track bed of the subway tunnel in the same monitoring cross-section were nearly the same. This implies that the segmental lining had sufficient flexibility to deform in harmony with the surrounding soil.

Author Contributions

X.Z. and H.T. mainly analyzed the monitor data and performed subsidence analyses. Z.L., J.D. and S.L. gathered in situ data. X.Z. and H.T. wrote the main manuscript text. All authors reviewed and revised the manuscript. All authors have read and agreed to the published version of the manuscript.

Funding

The project was supported by Key R&D and promotion projects in Henan Province (technical research) (No. 202102310018), Key R&D and promotion projects in Henan Province (technical research) (No. 192102310267), and The National Natural Science Foundation of China (Grant No. 41825018).

Data Availability Statement

The datasets used and/or analyzed during the current study are available from the corresponding author upon reasonable request.

Acknowledgments

We appreciated the help from Shenzhen Shenshui Water Resources Consulting Co., Ltd. in this research project.

Conflicts of Interest

The authors declare no conflict of interest.

References

  1. He, C.; Su, Z.X.; Zeng, D.Y. Influence of metro shield tunneling on existing tunnel directly above. China Civ. Eng. J. 2008, 3, 91–98. (In Chinese) [Google Scholar] [CrossRef]
  2. Fang, Q.; Du, J.; Li, J.; Zhang, D.; Cao, L. Settlement characteristics of large-diameter shield excavation below existing metro in close vicinity. J. Cent. South Univ. 2021, 28, 882–897. [Google Scholar] [CrossRef]
  3. He, Z.K. Influence of Shield Tunnel of Hangzhou Metro Line 5 on Pile-Raft Foundation of Existing Hangzhou South Railway Station and Construction Control Technology. Tunn. Constr. 2022, 42, 222–231. (In Chinese) [Google Scholar]
  4. Li, C.; Zhong, Z.; He, G.; Liu, X. Response of the ground and adjacent end-bearing piles due to side-by-side twin tunnelling in compound rock strata. Tunn. Undergr. Space Technol. 2019, 89, 91–108. [Google Scholar] [CrossRef]
  5. Liu, W.; Liang, J.; Xu, T. Tunnelling-induced ground deformation subjected to the behavior of tail grouting materials. Tunn. Undergr. Space Technol. 2023, 140, 105253. [Google Scholar] [CrossRef]
  6. Büchel, B.; Partl, T.; Corman, F. The Disruption at Rastatt and its Effects on the Swiss Railway System. In Proceedings of the 8th International Conference on Railway Operations Modelling and Analysis (ICROMA), Norrköping, Sweden, 17–20 June 2019. [Google Scholar]
  7. Kim, S.H.; Burd, H.J.; Milligan, G.E. Interaction between closely spaced tunnels in clay. In Geotechnical Aspects of Underground Construction in Soft Ground; CRC Press: Boca Raton, FL, USA, 1996; pp. 543–548. [Google Scholar] [CrossRef]
  8. Byun, G.W.; Kim, D.G.; Lee, S.D. Behavior of the ground in rectangularly crossed area due to tunnel excavation under the existing tunnel. Tunn. Undergr. Space Technol. 2006, 21, 361. [Google Scholar] [CrossRef]
  9. Choi, J.-I.; Lee, S.-W. Influence of existing tunnel on mechanical behavior of new tunnel. KSCE J. Civ. Eng. 2010, 14, 773–783. [Google Scholar] [CrossRef]
  10. Marshall, A.M.; Farrell, R.; Klar, A.; Mair, R. Tunnels in sands: The effect of size, depth, and volume loss on greenfield displacements. Géotechnique 2012, 62, 385–399. [Google Scholar] [CrossRef]
  11. Lin, Q.; Lu, D.; Lei, C.; Tian, Y.; Gong, Q.; Du, X. Model test study on the stability of cobble strata during shield under-crossing. Tunn. Undergr. Space Technol. 2021, 110, 103807. [Google Scholar] [CrossRef]
  12. Xie, X.; Yang, Y.; Ji, M. Analysis of ground surface settlement induced by the construction of a large-diameter shield-driven tunnel in Shanghai, China. Tunn. Undergr. Space Technol. 2016, 51, 120–132. [Google Scholar] [CrossRef]
  13. Kimmance, J.P.; Lawrence, S.; Hassan, O.; Purchase, N.J.; Tollinger, G. Observations of deformations created in existing tunnels by adjacent and cross cutting excavations. In Proceedings of the International Symposium on Geotechnical Aspects of Underground Construction in Soft ground, London, UK, 15–17 April 1996; pp. 707–712. [Google Scholar]
  14. Shao, H.; Zhang, Z.X. Analysis of disturbing effect on running metro caused by adjacent shield-driven. Rock Soil Mech. 2004, 25, 545–549. [Google Scholar] [CrossRef]
  15. Zhang, C.P.; Zhang, D.L.; Luo, J.J.; Wang, M.S.; Wu, J.P. Remote monitoring system applied to the construction of metro station undercrossing existing metro tunnel. Rock Soil Mech. 2009, 6, 1861–1866. [Google Scholar] [CrossRef]
  16. Mohamad, H.; Bennett, P.J.; Soga, K.; Mair, R.J.; Bowers, K. Behavior of an old masonry tunnel due to tunnelling-induced ground settlement. Géotechnique 2010, 60, 927–938. [Google Scholar] [CrossRef]
  17. Fang, Q.; Zhang, D.; Li, Q.; Wong, L.N.Y. Effects of twin tunnels construction beneath existing shield-driven twin tunnels. Tunn. Undergr. Space Technol. 2015, 45, 128–137. [Google Scholar] [CrossRef]
  18. Jin, D.; Yuan, D.; Li, X.; Zheng, H. An in-tunnel grouting protection method for excavating twin tunnels beneath an existing tunnel. Tunn. Undergr. Space Technol. 2018, 71, 27–35. [Google Scholar] [CrossRef]
  19. Jin, D.; Yuan, D.; Liu, S.; Li, X.; Luo, W. Performance of Existing Metro Tunnels Undercrossed by Four Closely Spaced Shield Tunnels. J. Perform. Constr. Facil. 2019, 33, 04018099. [Google Scholar] [CrossRef]
  20. Addenbrooke, T.I.; Potts, D.M. Twin Tunnel Interaction: Surface and Subsurface Effects. Int. J. Geomech. 2001, 1, 249–271. [Google Scholar] [CrossRef]
  21. Ng, C.W.W.; Fong, K.Y.; Liu, H.L. The effects of existing horseshoe-shaped tunnel sizes on circular crossing tunnel interactions: Three-dimensional numerical analyses. Tunn. Undergr. Space Technol. 2018, 77, 68–79. [Google Scholar] [CrossRef]
  22. Xue, F.; Zhang, M. Excavation Face Stability of Shield Tunneling Closely Under Existing Tunnels: Particle Flow Simulation. Iran. J. Sci. Technol. Trans. Civ. Eng. 2020, 44, 497–506. [Google Scholar] [CrossRef]
  23. Do, N.A.; Dias, D.; Golpasand, M.-R.B.; Dang, V.K.; Nait-Rabah, O.; Pham, V.V.; Dang, T.T. Numerical analyses of twin stacked mechanized tunnels in soft grounds—Influence of their position and construction procedure. Tunn. Undergr. Space Technol. 2022, 130, 104734. [Google Scholar] [CrossRef]
  24. Zhang, Z.G.; Huang, M.S.; Wang, W.D. Analysis on response of existing tunnels due to adjacent tunneling in multi-layered soils. Chin. J. Geotech. Eng. 2009, 31, 600–608. [Google Scholar] [CrossRef]
  25. Lai, H.P.; Zheng, H.W.; Chen, R.; Kang, Z.; Liu, Y. Settlement behaviors of existing tunnel caused by obliquely under-crossing shield tunneling in close proximity with small intersection angle. Tunn. Undergr. Space Technol. 2020, 97, 103258. [Google Scholar] [CrossRef]
  26. Zhang, Z.G.; Huang, M.S.; Wang, W.D.; Zhang, M.X. Deformation analysis of existing pipe traversed vertically by tunneling in layered soil: Comparison between coupling method and two-stage method. Rock Soil Mech. 2010, 31, 229–235. [Google Scholar] [CrossRef]
  27. Liang, R.; Xia, T.; Hong, Y.; Yu, F. Effects of above-crossing tunnelling on the existing shield tunnels. Tunn. Undergr. Space Technol. 2016, 58, 159–176. [Google Scholar] [CrossRef]
  28. Wei, G.; Qi, Y.J.; Wu, H.J.; Hua, X.X.; Zhang, Y.Z. Changes in circumferential pressure and stresses in existing tunnels caused by tunnel crossing. J. Cent. South Univ. (Sci. Technol.) 2020, 3515–3527. [Google Scholar] [CrossRef]
  29. Liu, S.H. Analysis on the difference of geological survey between mining method and shield method in Qianhai deep tunnel project. Urban Geol. 2022, 362–369. (In Chinese) [Google Scholar] [CrossRef]
Figure 1. The schematic configuration of the project location. (a) The plan layout of the project location. (b) The composition of the project construction content.
Sustainability 15 13232 g001
Figure 2. Regional geologic map.
Sustainability 15 13232 g002
Figure 3. Geological diagram of around the crossing section of the subsequent tunnel and the subway Line 11 (units: m).
Sustainability 15 13232 g003
Figure 4. Schematic diagram of the relationship between the subsequent tunnel and subway line 11. (a) Cross-section of deep tunnel and subway line 11. (b) Planar position relationship between the subsequent tunnel and subway line 11.
Sustainability 15 13232 g004
Figure 5. Schematic diagram of monitoring points layout of subway line 11. (a) Overall layout profile of monitoring points for subway line 11. (b) Schematic diagram of monitoring points within a single cross-section.
Sustainability 15 13232 g005
Figure 6. The monitoring equipment and the installation photos of subway line 11. (a) The monitoring points and the installation photos of subway line 11. (b) Tunnel monitoring equipment of subway line 11.
Sustainability 15 13232 g006
Figure 7. Vertical displacements of the vault of subway line before the subsequent tunnel under-crosses the intersection area. (a) Displacements of the vault of the subway tunnel of line 11 upstream of the line. (b) Displacements of the vault of the subway tunnel of line 11 downstream of the line.
Sustainability 15 13232 g007
Figure 8. Vertical displacements of the vault of the subway tunnel of line 11 under the intersection area. (a) Displacements of the vault of subway tunnel upstream of the line. (b) Displacements of the vault of subway tunnel downstream of the line.
Sustainability 15 13232 g008
Figure 9. Vertical displacements of the vault of the subway tunnels after the subsequent tunnel under-crosses the intersection area. (a) Displacements of the vault of the subway tunnel upstream of the line. (b) Displacements of the vault of subway tunnel downstream of the line.
Sustainability 15 13232 g009
Figure 10. Vertical displacements of track bed of the subway tunnel before the subsequent tunnel under-crosses the intersection area. (a) Left track bed of the subway tunnel upstream of the line. (b) Right track bed of the subway tunnel upstream of the line. (c) Left track bed of the subway tunnel downstream of the line. (d) Right track bed of the subway tunnel downstream of the line.
Sustainability 15 13232 g010
Figure 11. Vertical displacements of track bed of the subway tunnel under the intersection area. (a) Left track bed of the subway tunnel upstream of the line. (b) Right track bed of the subway tunnel upstream of the line. (c) Left track bed of the subway tunnel downstream of the line. (d) Right track bed of the subway tunnel downstream of the line.
Sustainability 15 13232 g011
Figure 12. Vertical displacements of track bed of the subway tunnel after the subsequent tunnel under-crosses the intersection area. (a) Left track bed of the subway tunnel upstream of the line. (b) Right track bed of the subway tunnel upstream of the line. (c) Left track bed of the subway tunnel downstream of the line. (d) Right track bed of the subway tunnel downstream of the line.
Sustainability 15 13232 g012
Table 1. The physical and mechanical parameters of each stratum.
StrataDensity (g/cm3)Coefficient of Compressibility (MPa−1)Compression Modulus (MPa)Cohesion (kPa)Friction (°)
Plain fill1.860.451512
Rock fill2.00-4025
Residual soil1.870.45352017
Fully weathered mixed granite1.940.3872525
Strongly weathered mixed granite2.000.11253526.6
Weakly weathered mixed granite2.54-10003526.5
Table 2. The deformation control standard of the subway line 11.
Safety Control IndicatorsEarly Warning (mm)Alarm (mm)Control (mm)
Horizontal displacement of tunnel68.510
Vertical displacement of tunnel68.510
Radial convergence of tunnel68.510
Disclaimer/Publisher’s Note: The statements, opinions and data contained in all publications are solely those of the individual author(s) and contributor(s) and not of MDPI and/or the editor(s). MDPI and/or the editor(s) disclaim responsibility for any injury to people or property resulting from any ideas, methods, instructions or products referred to in the content.

