
Dynamic Simulation Model and Experimental Validation of One Passive Fuel Cell–Battery Hybrid Powertrain for an Electric Light Scooter

 , , and
Abstract
:1. Introduction
2. Methods
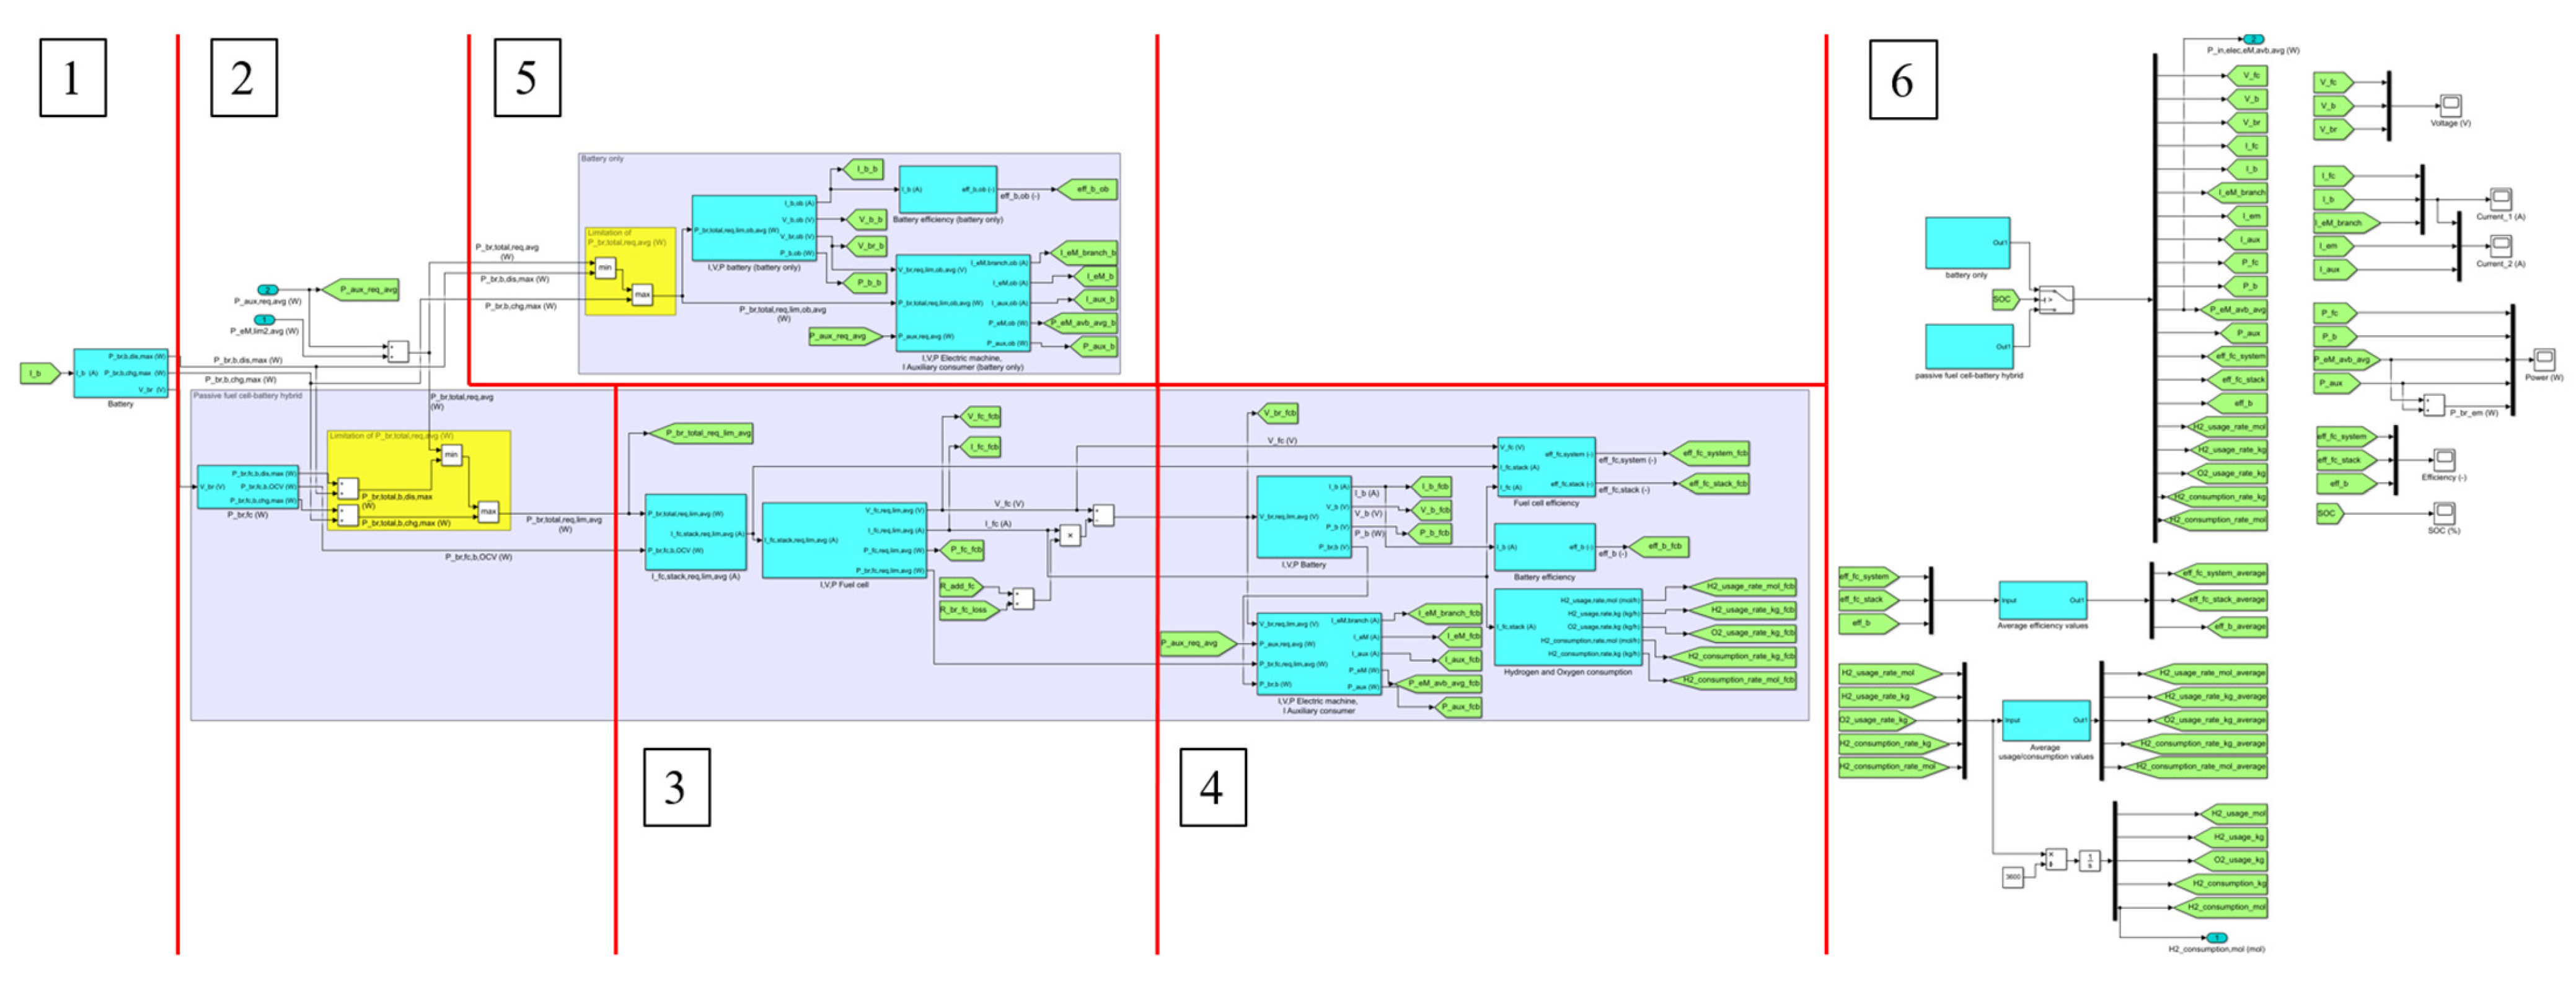
3. Modeling
4. Experimental Validation
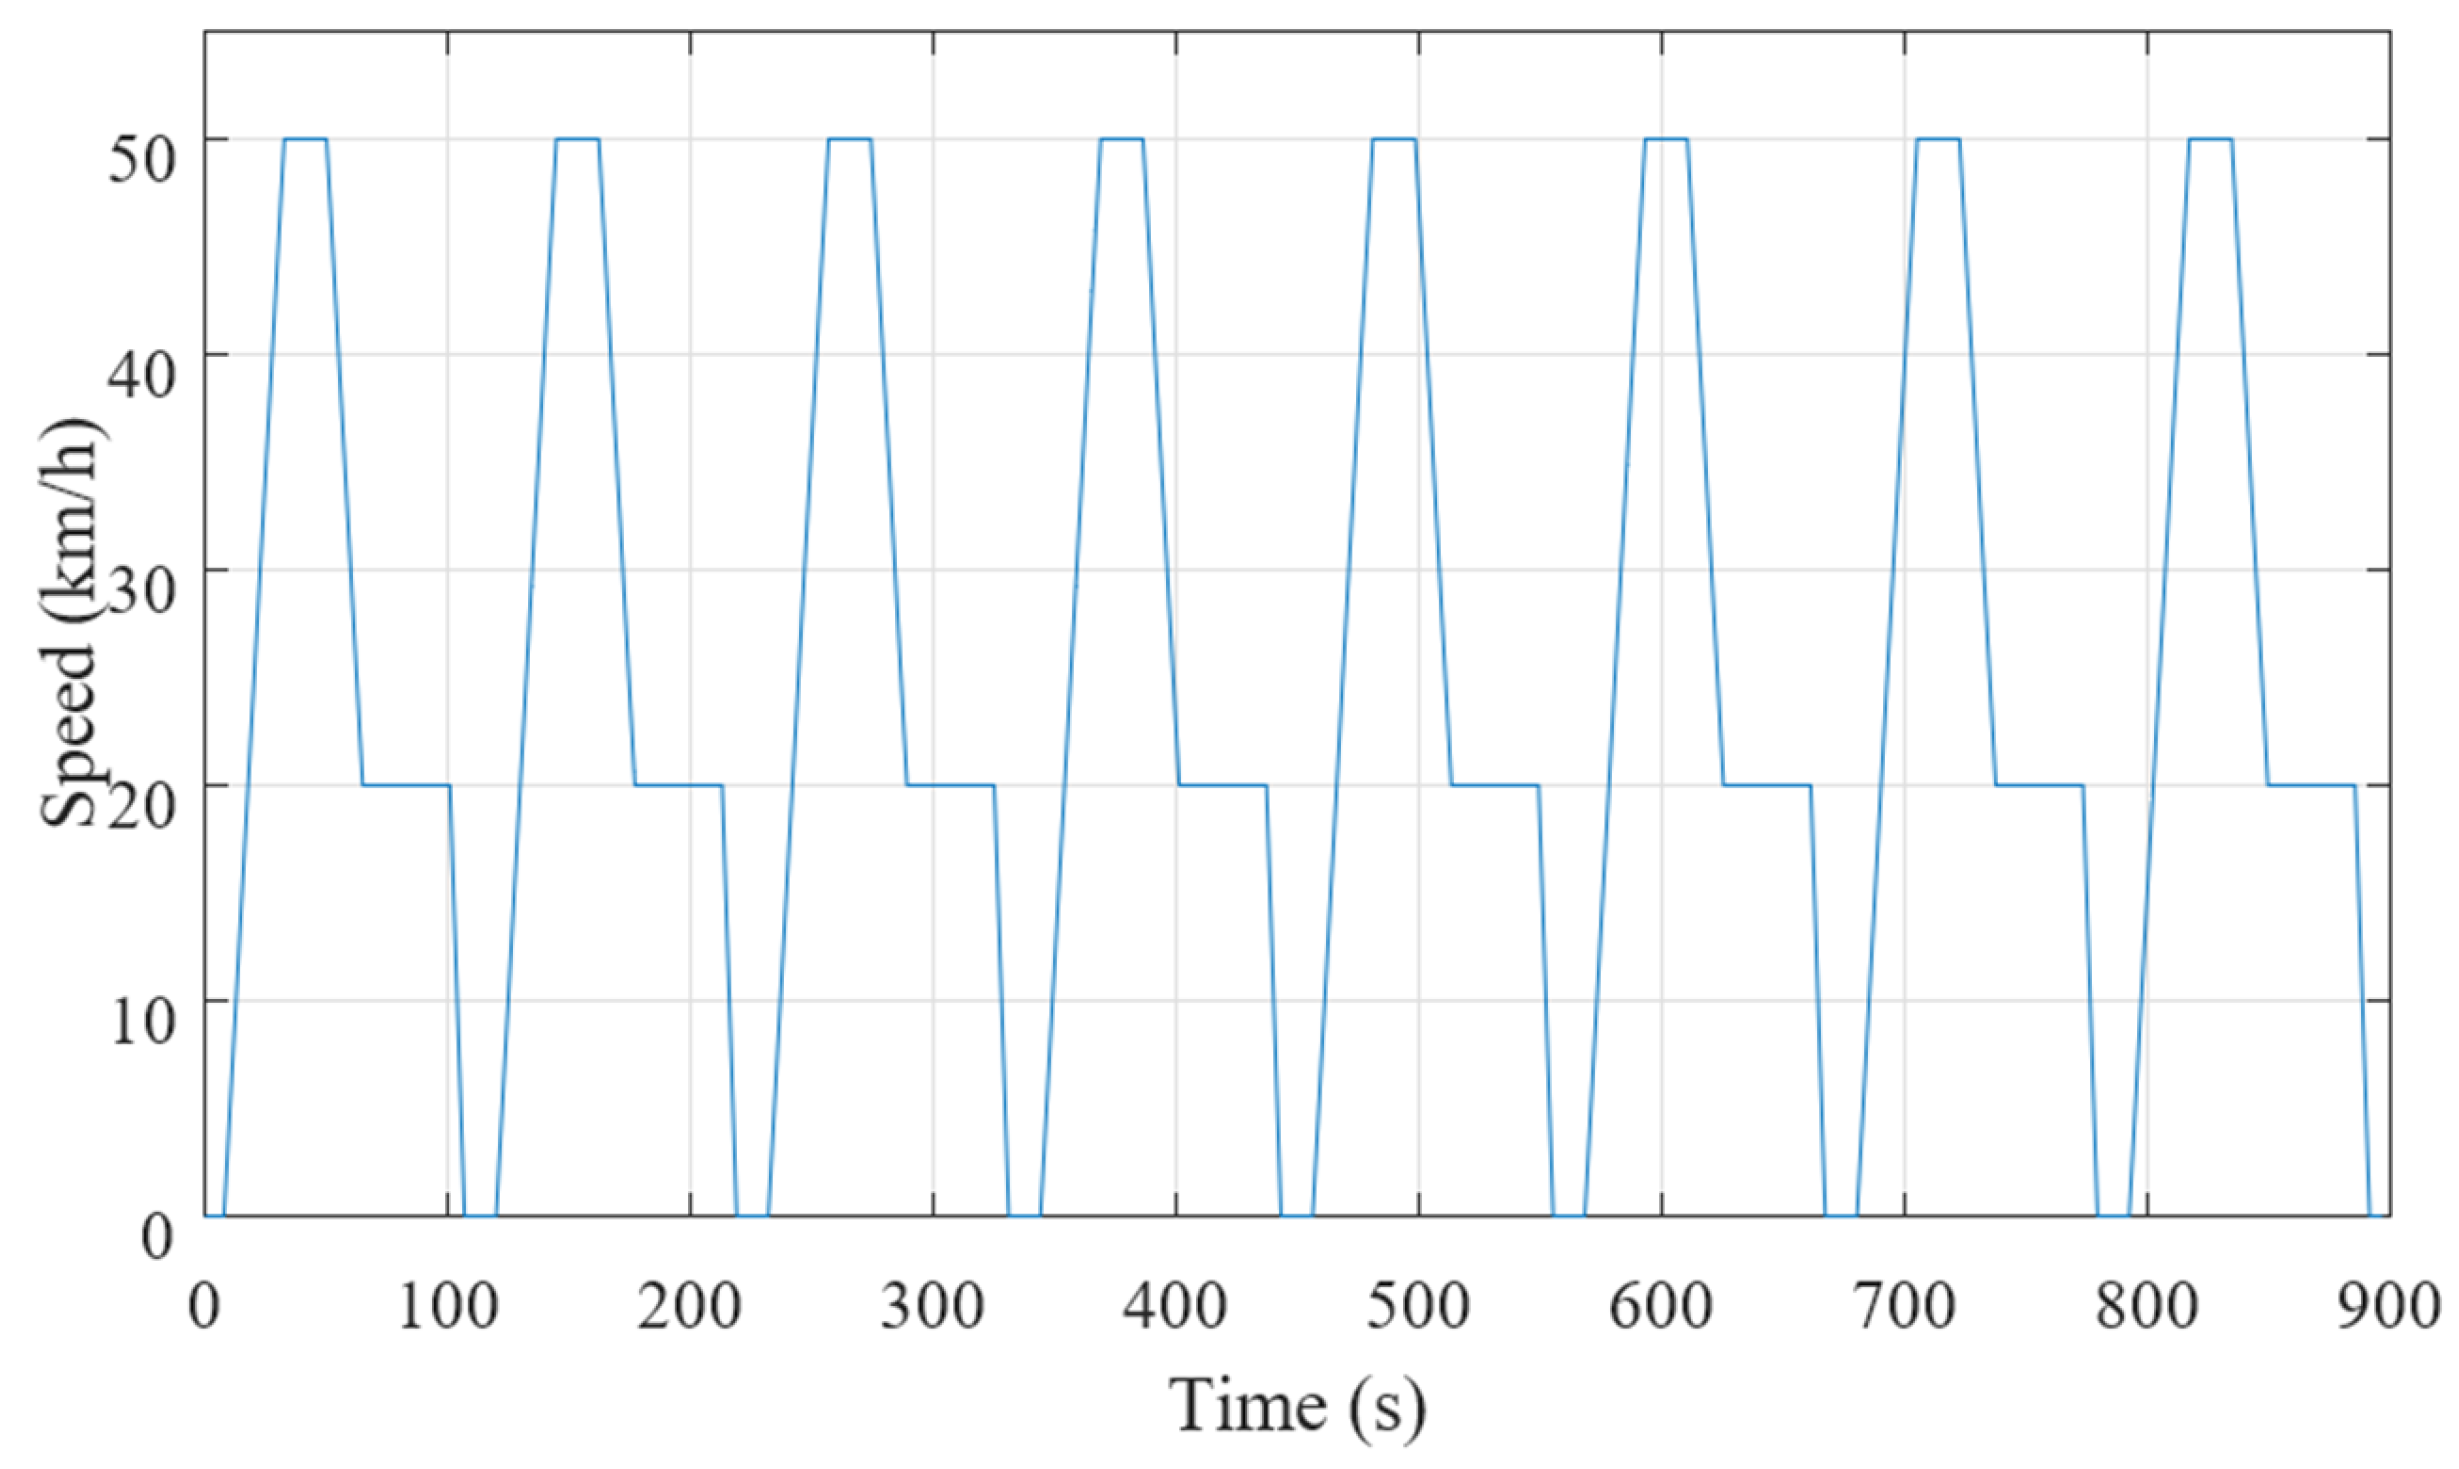
4.1. ECE-R47-Based Driving Cycle
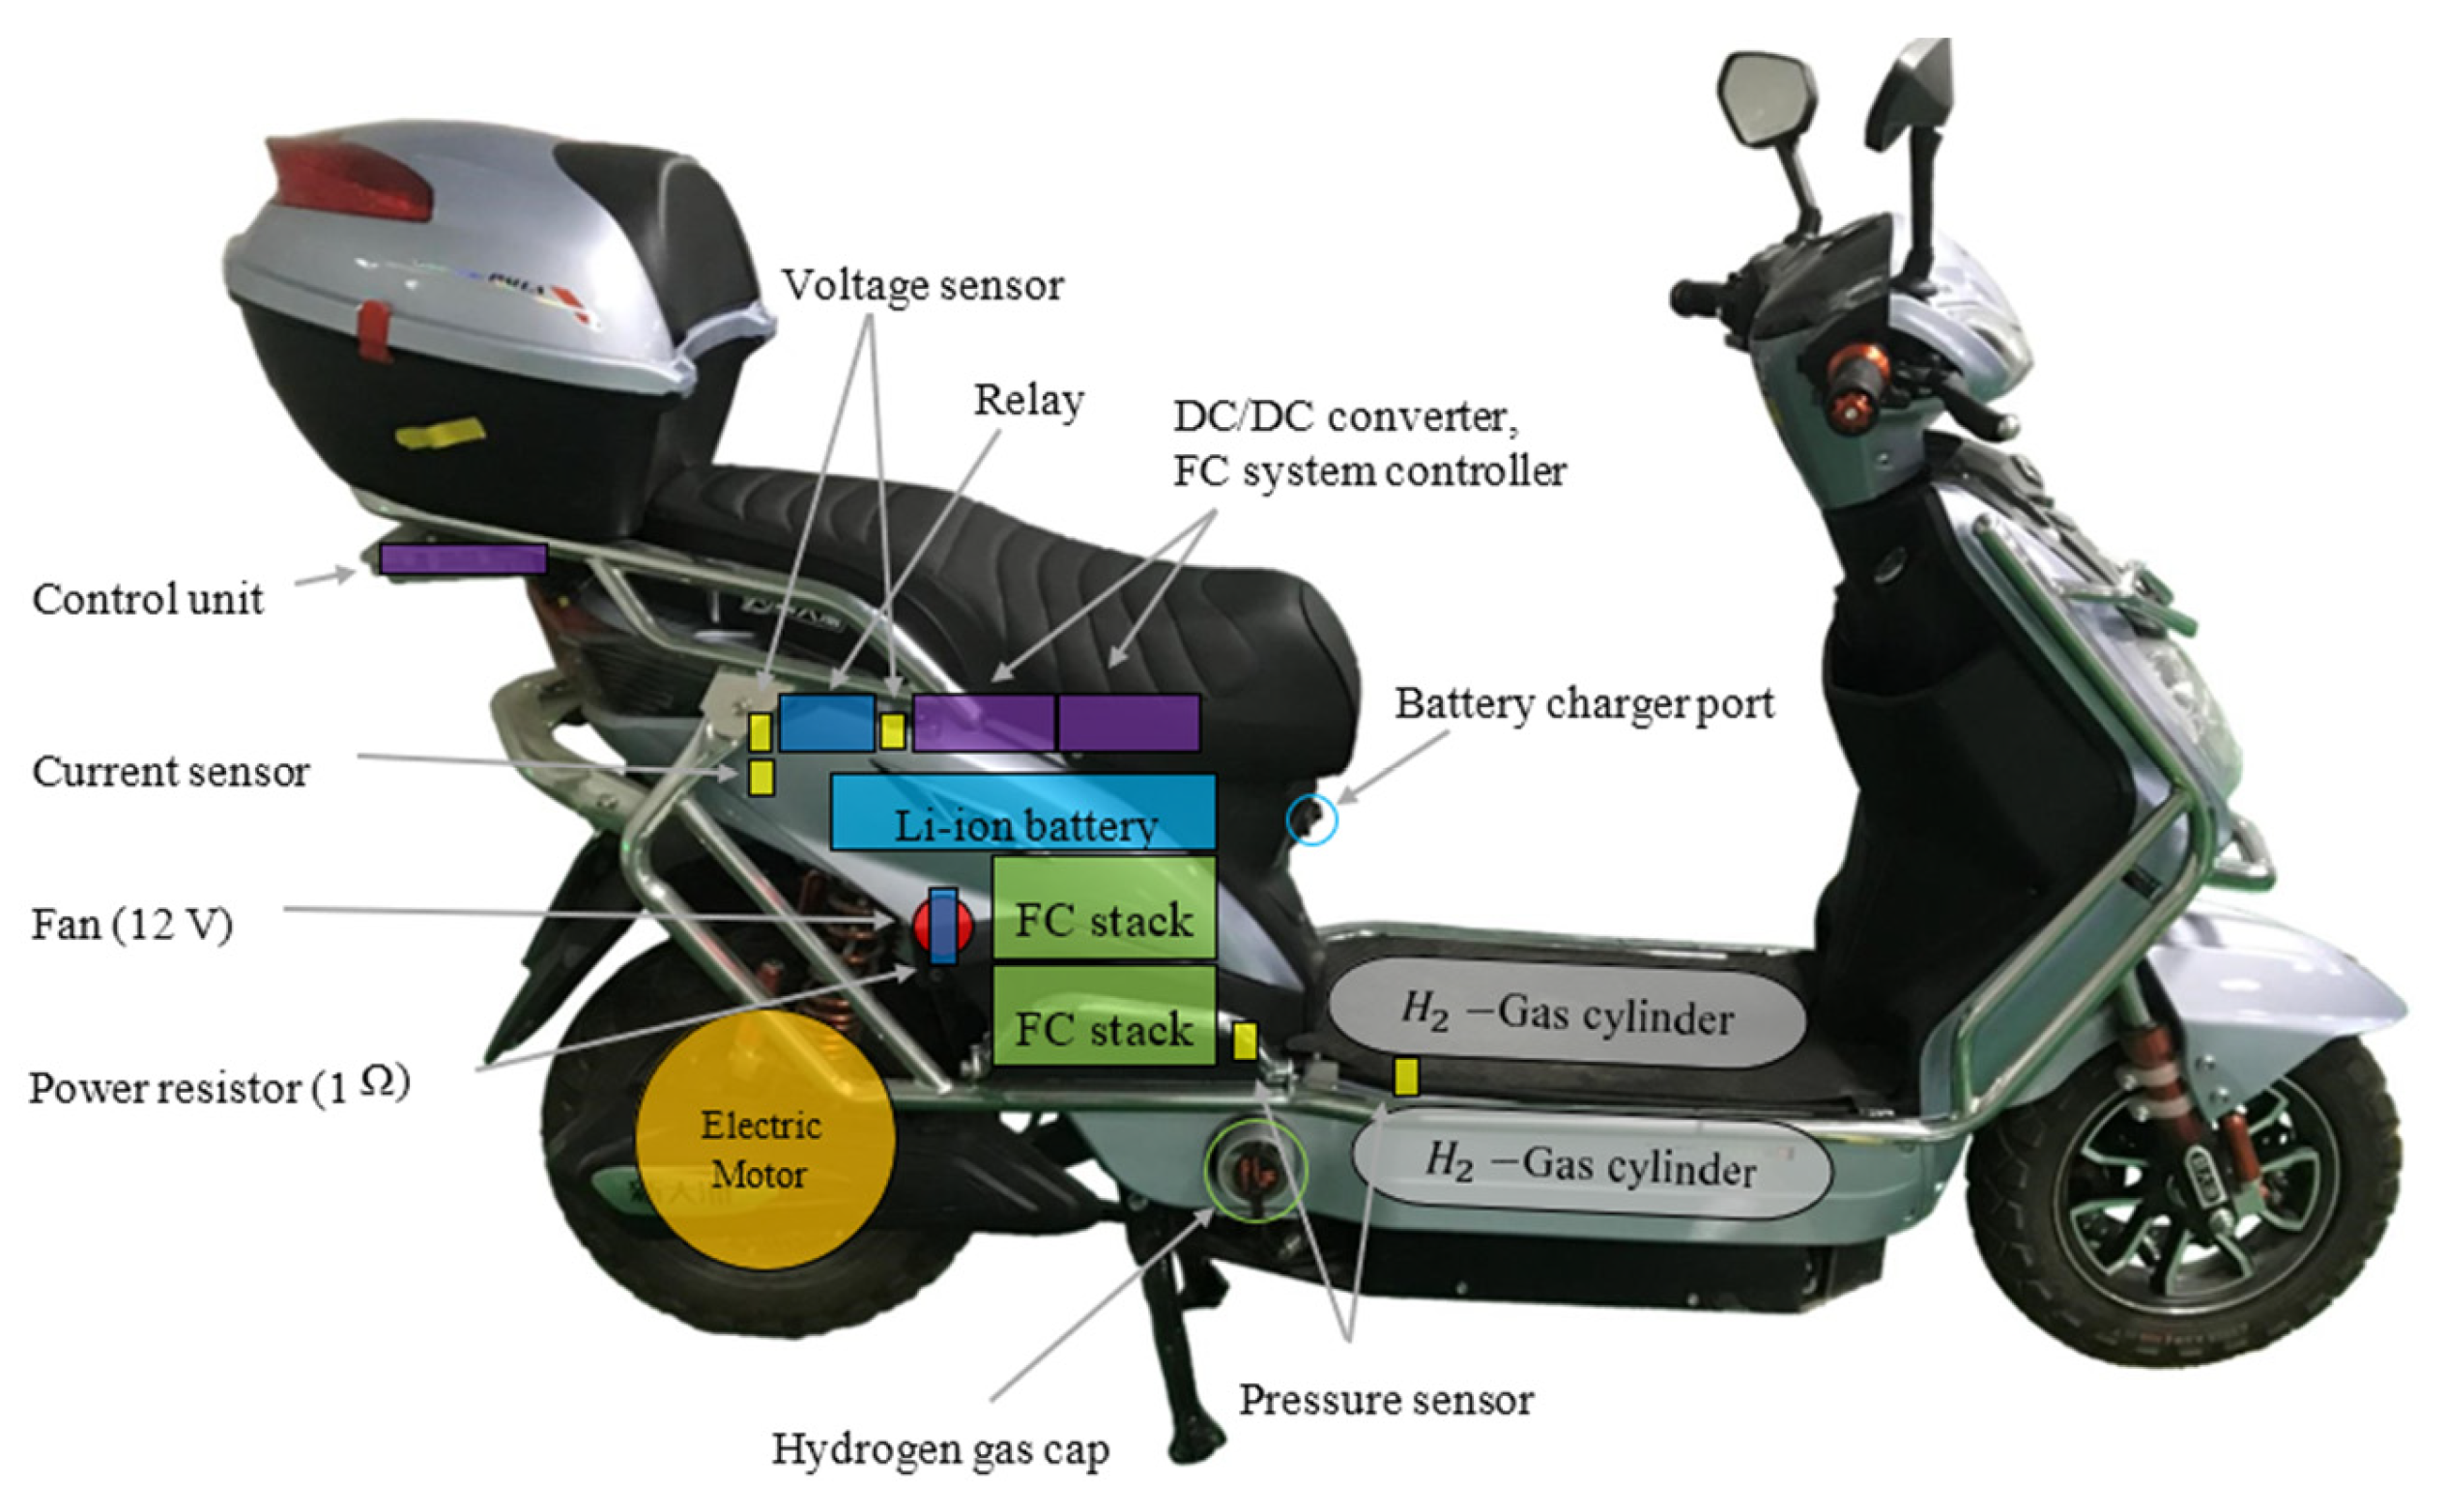
4.2. Test Facilities and Setup
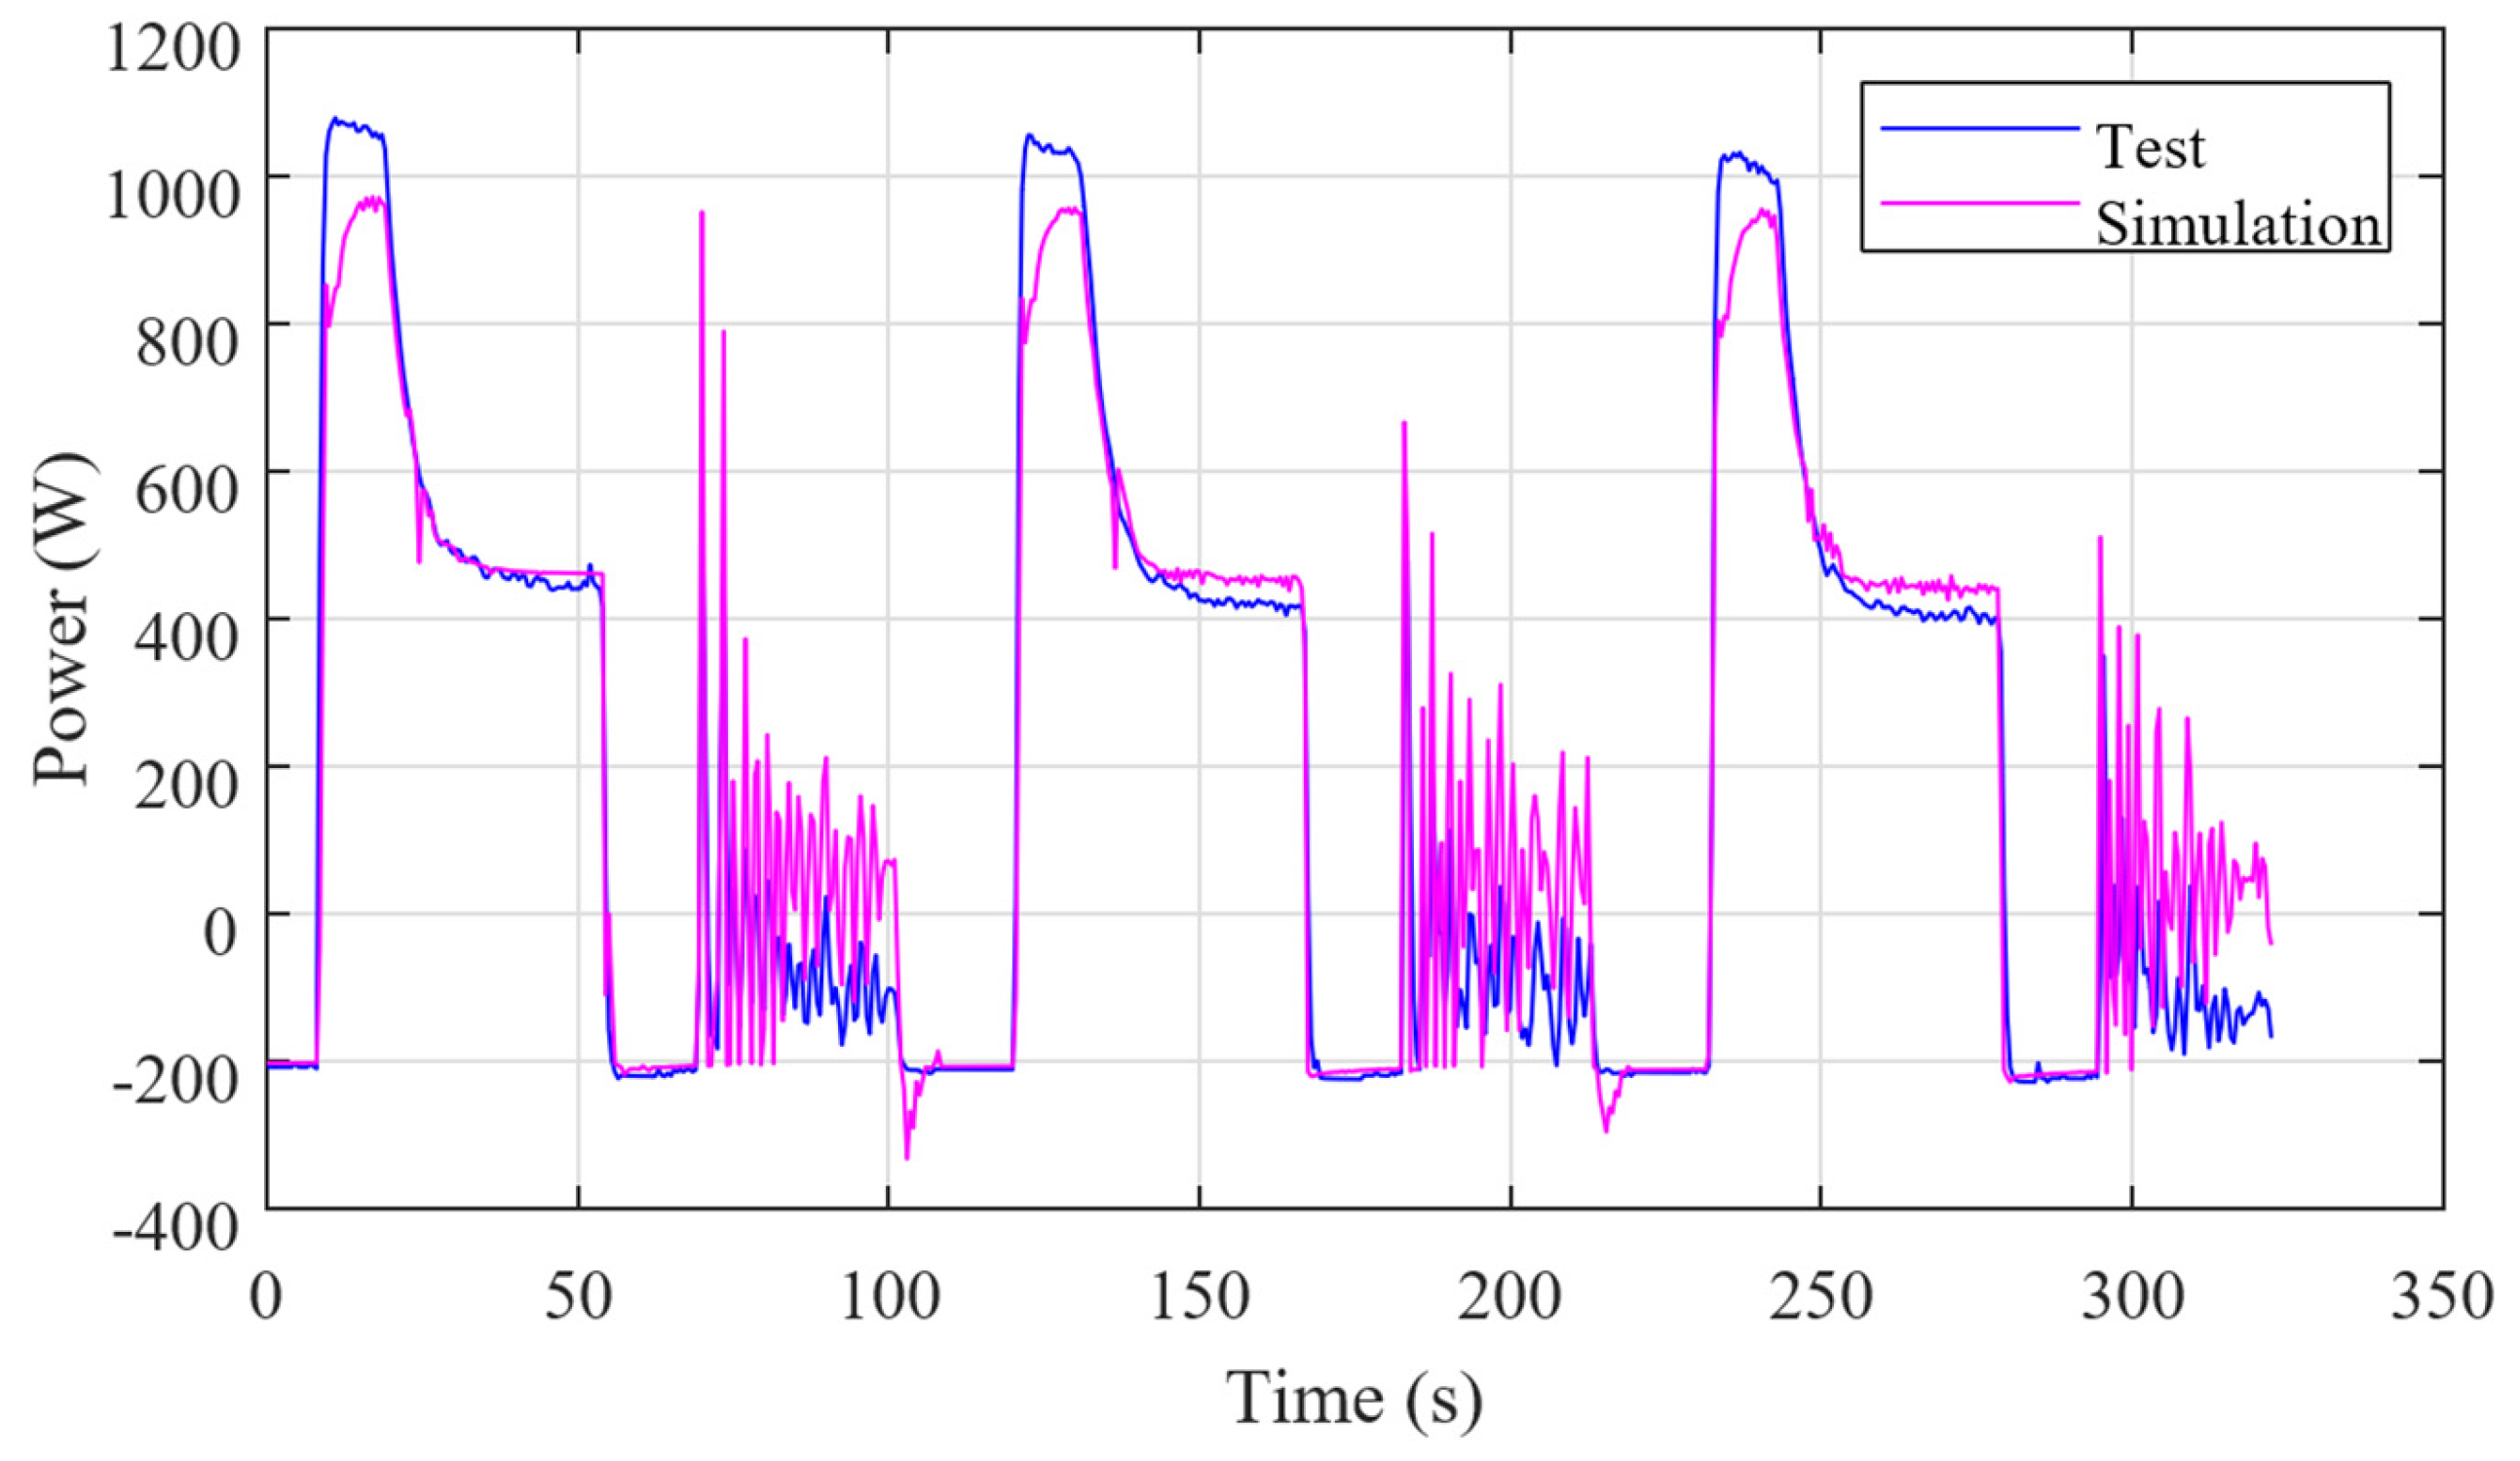
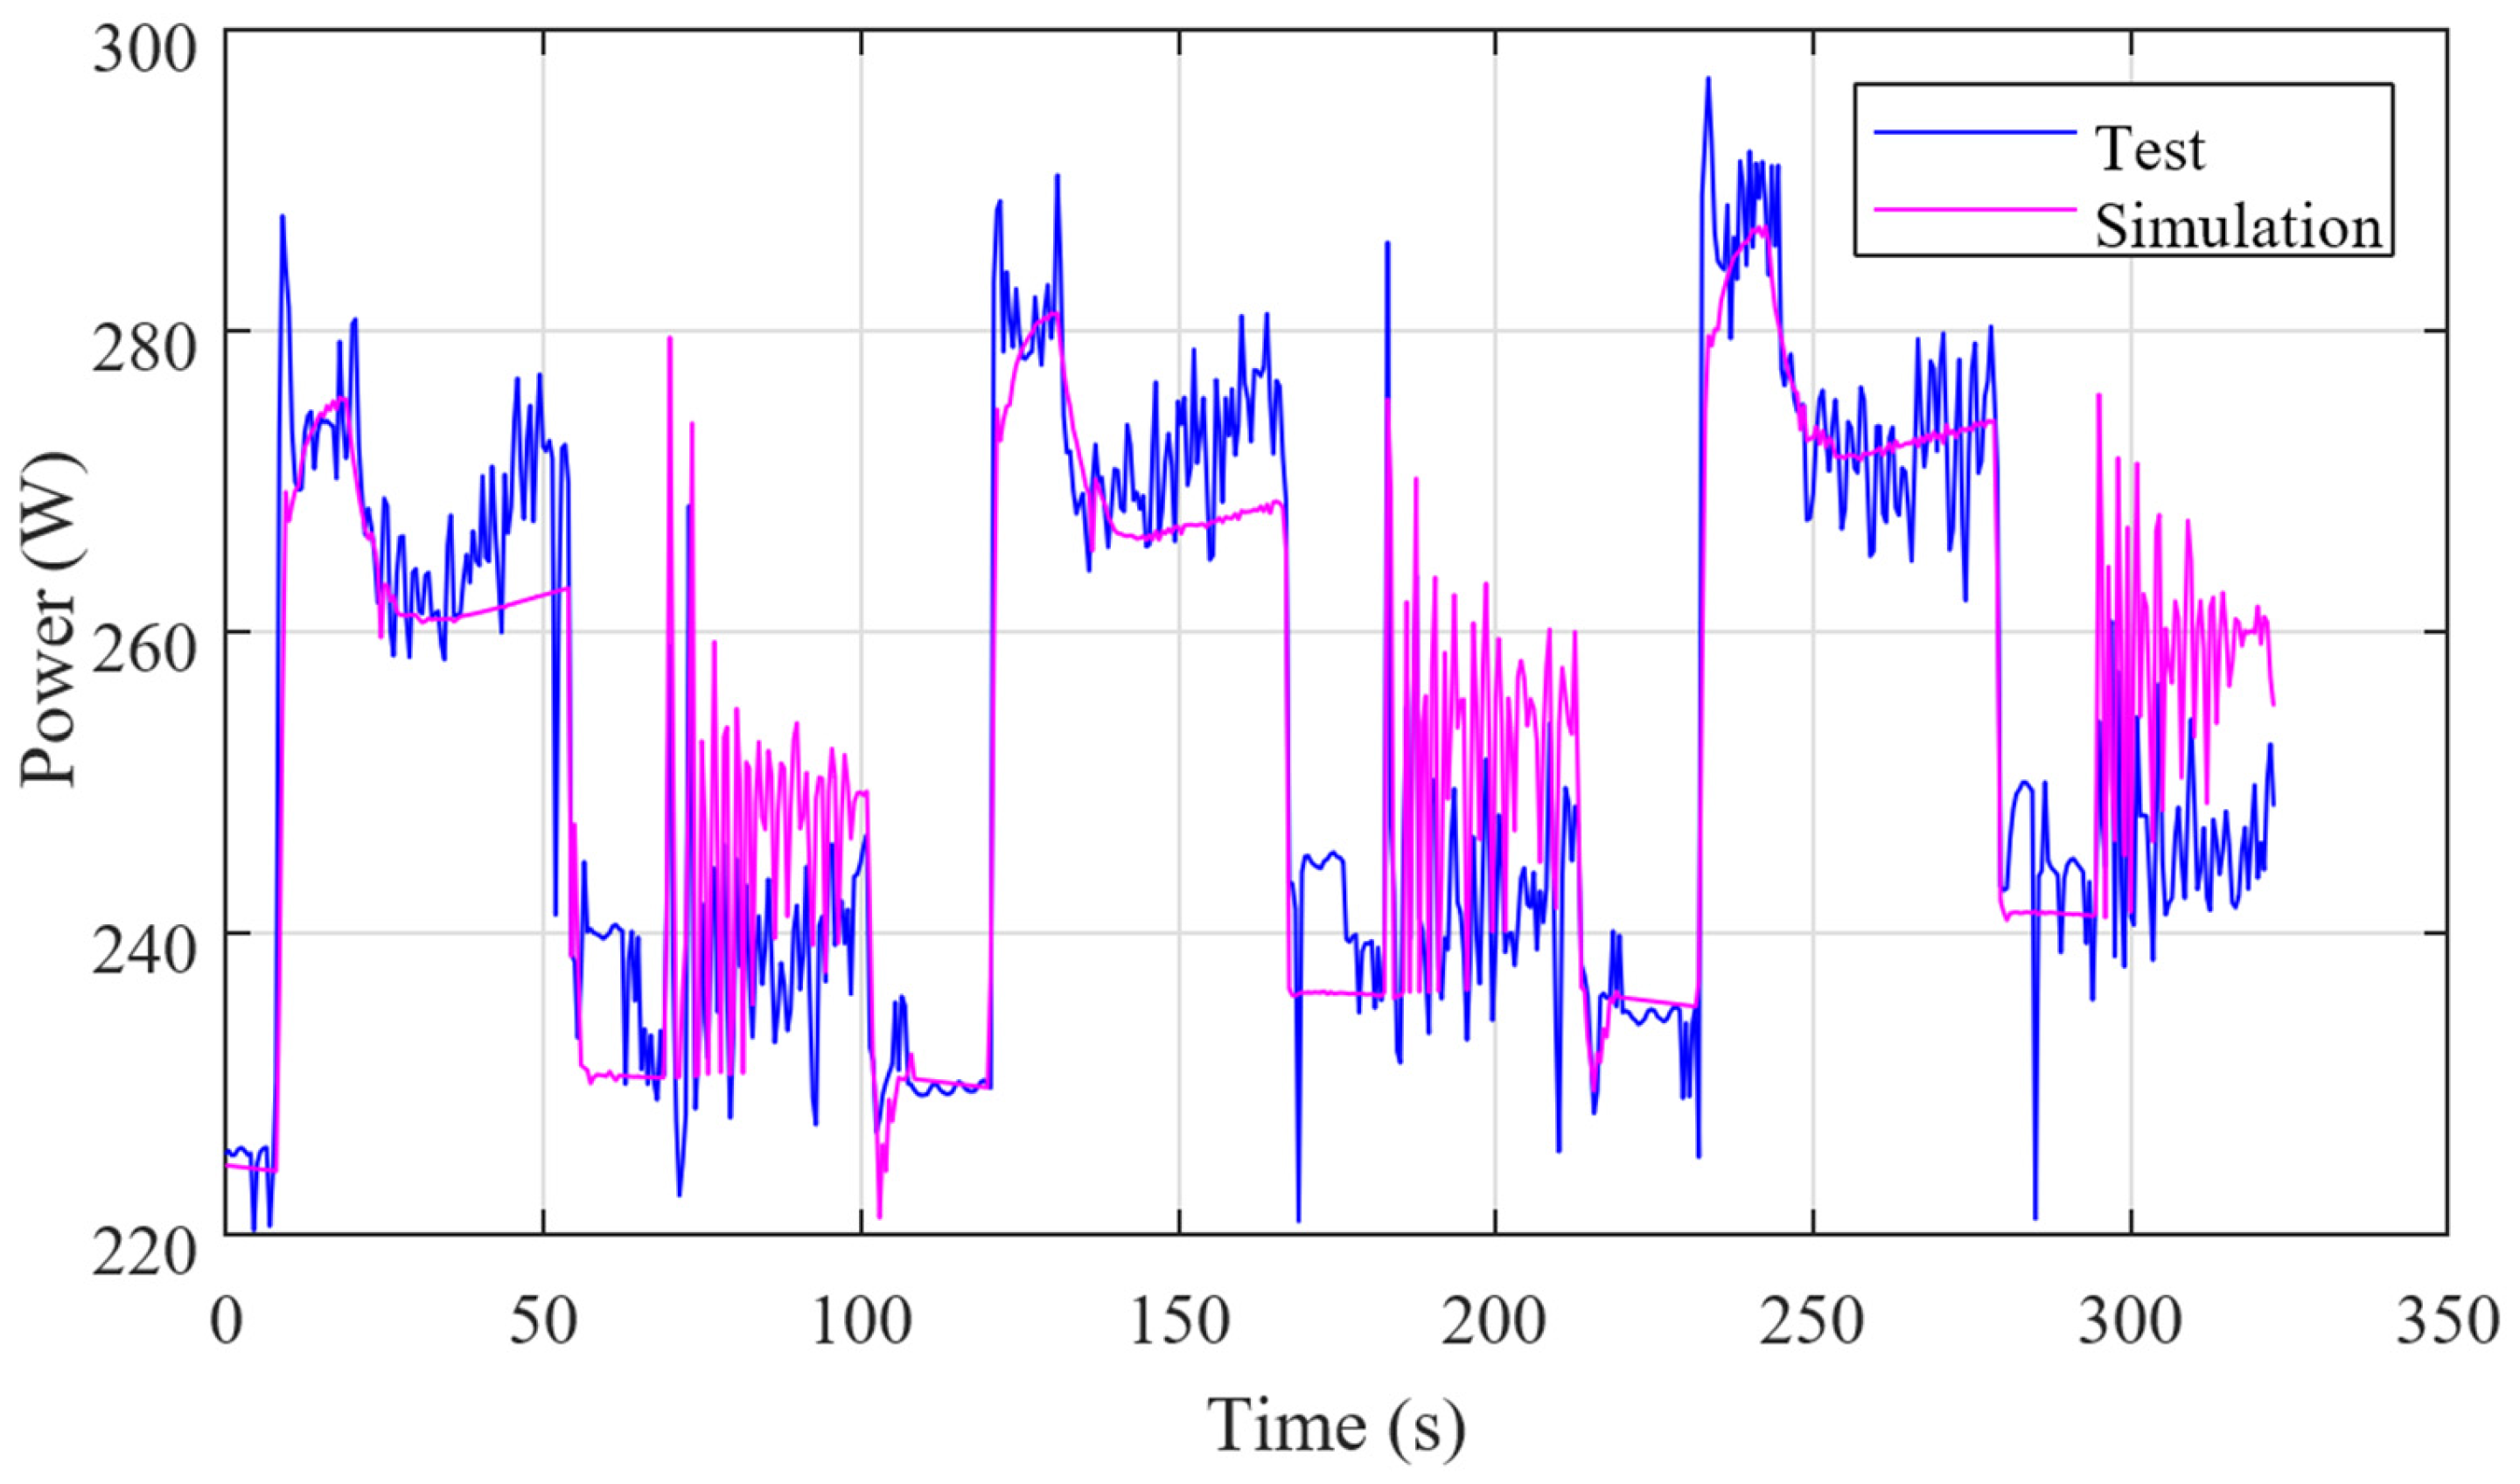
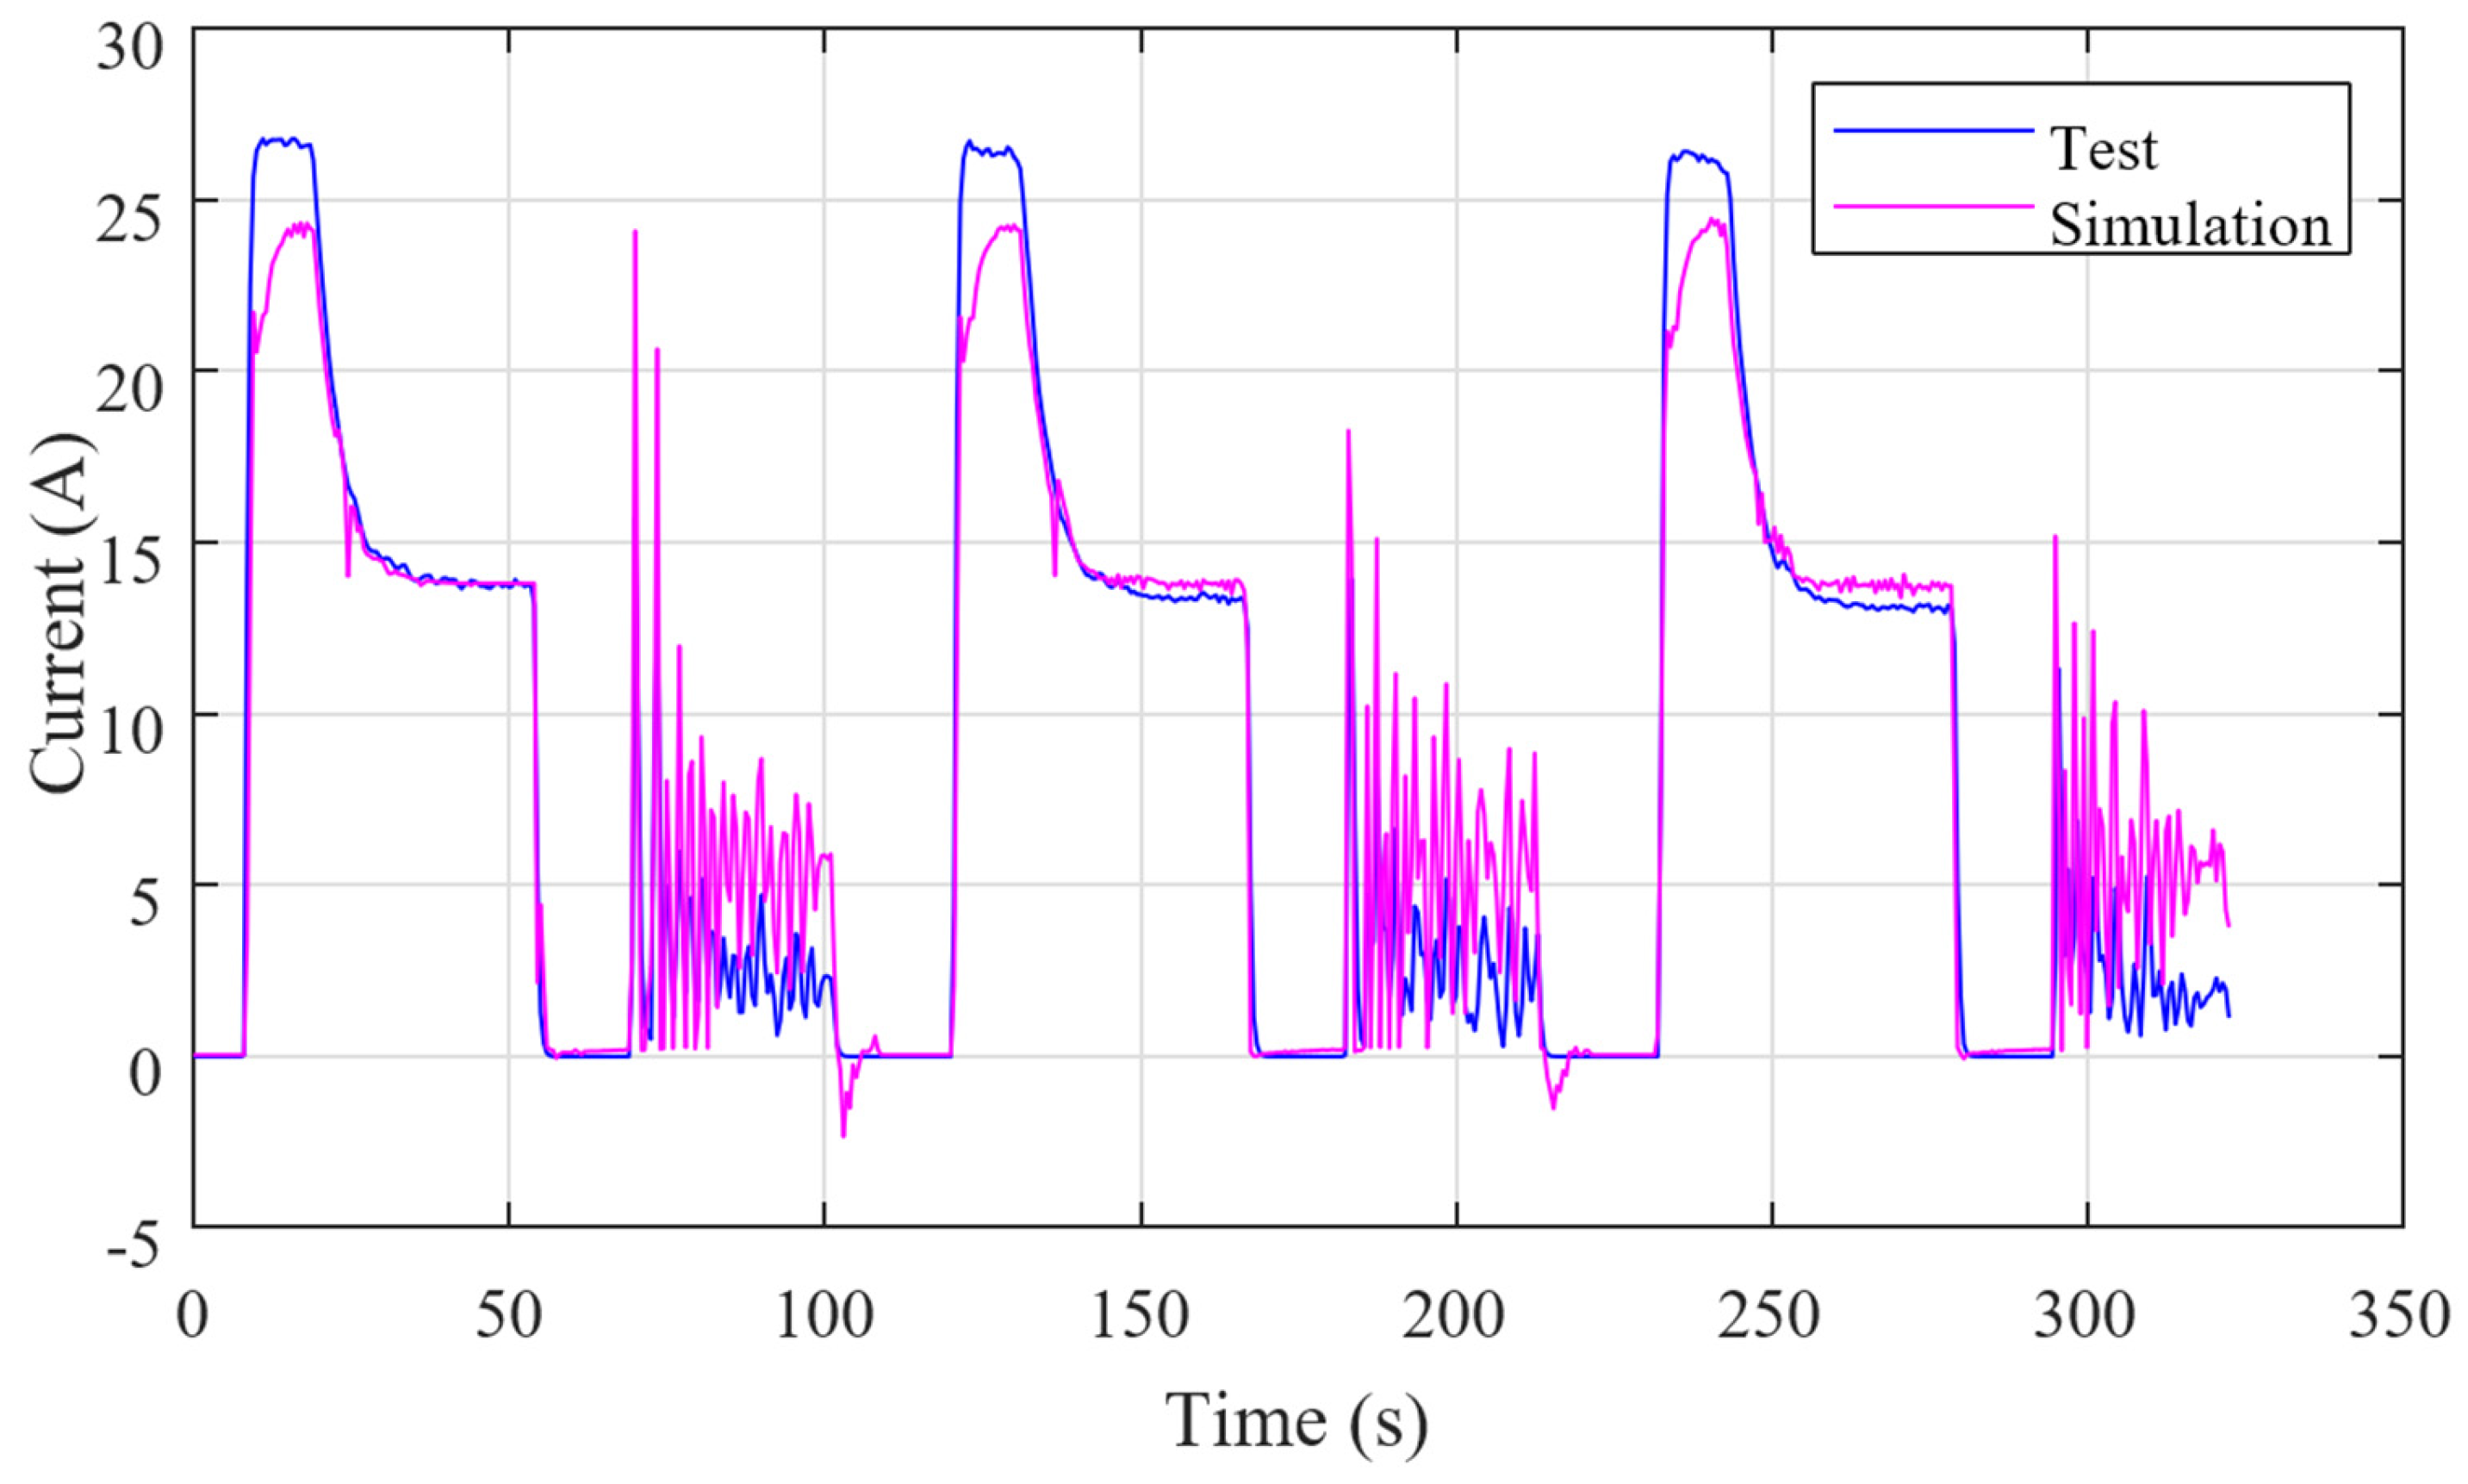
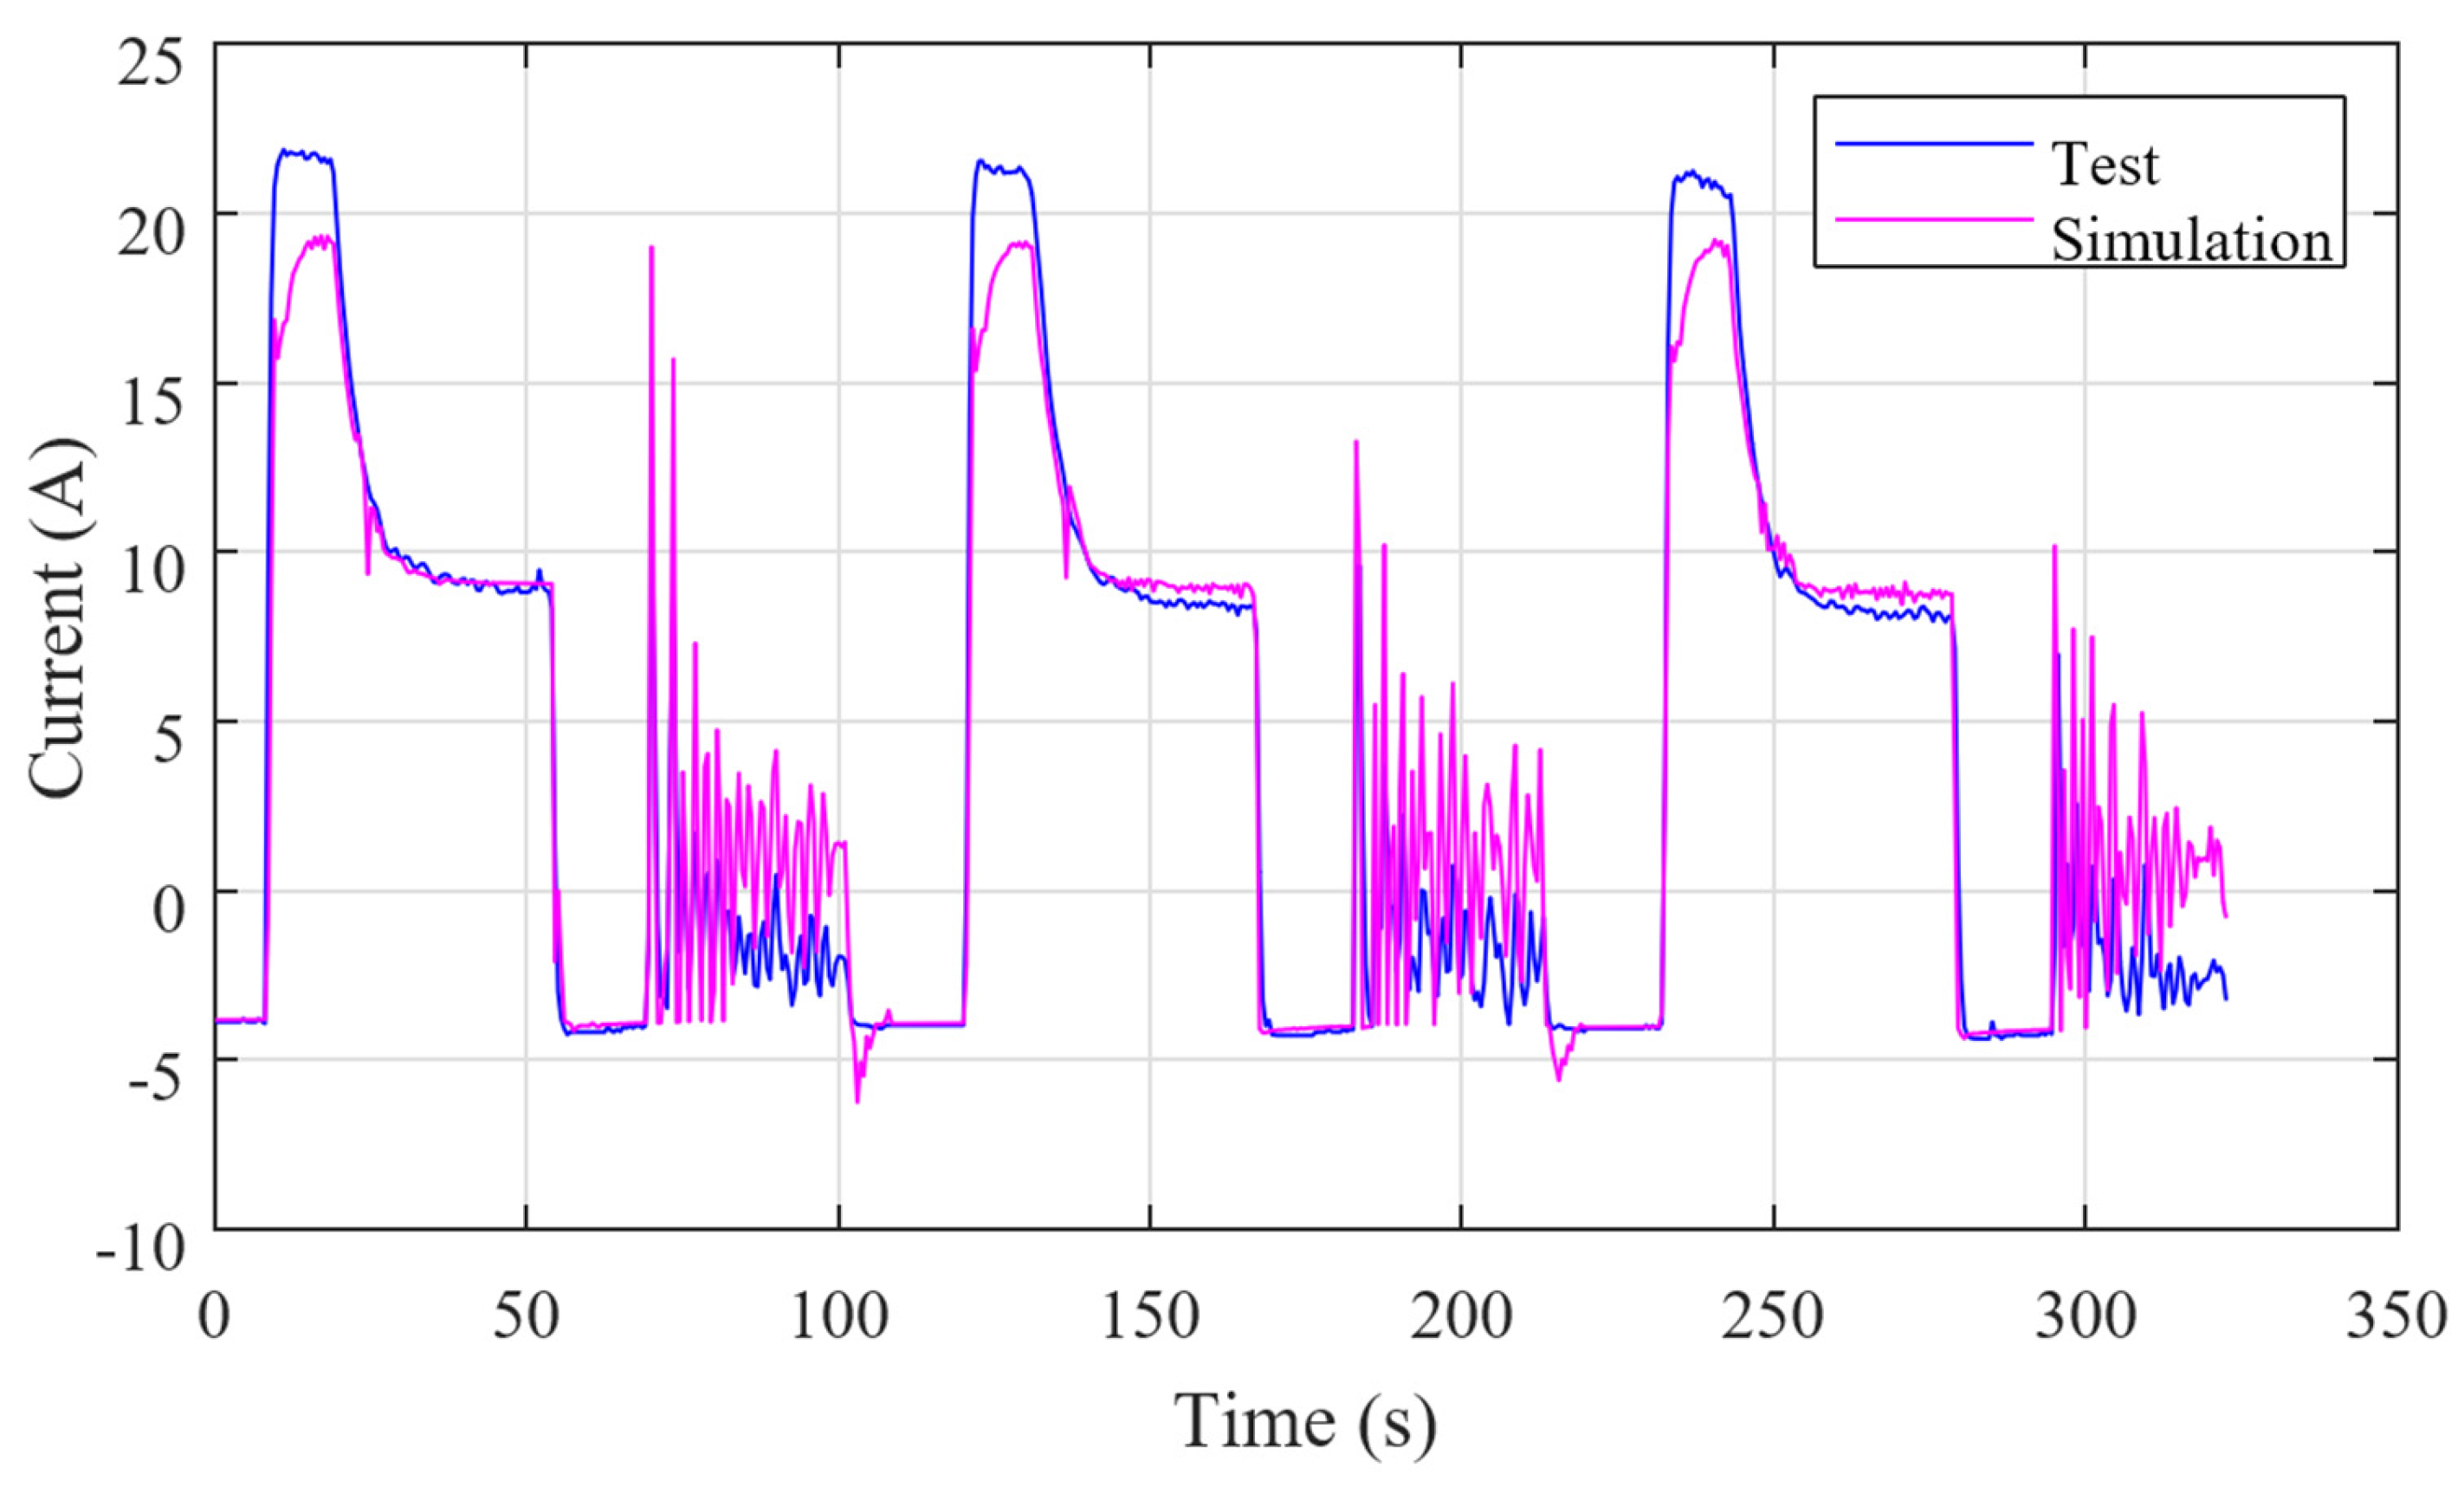
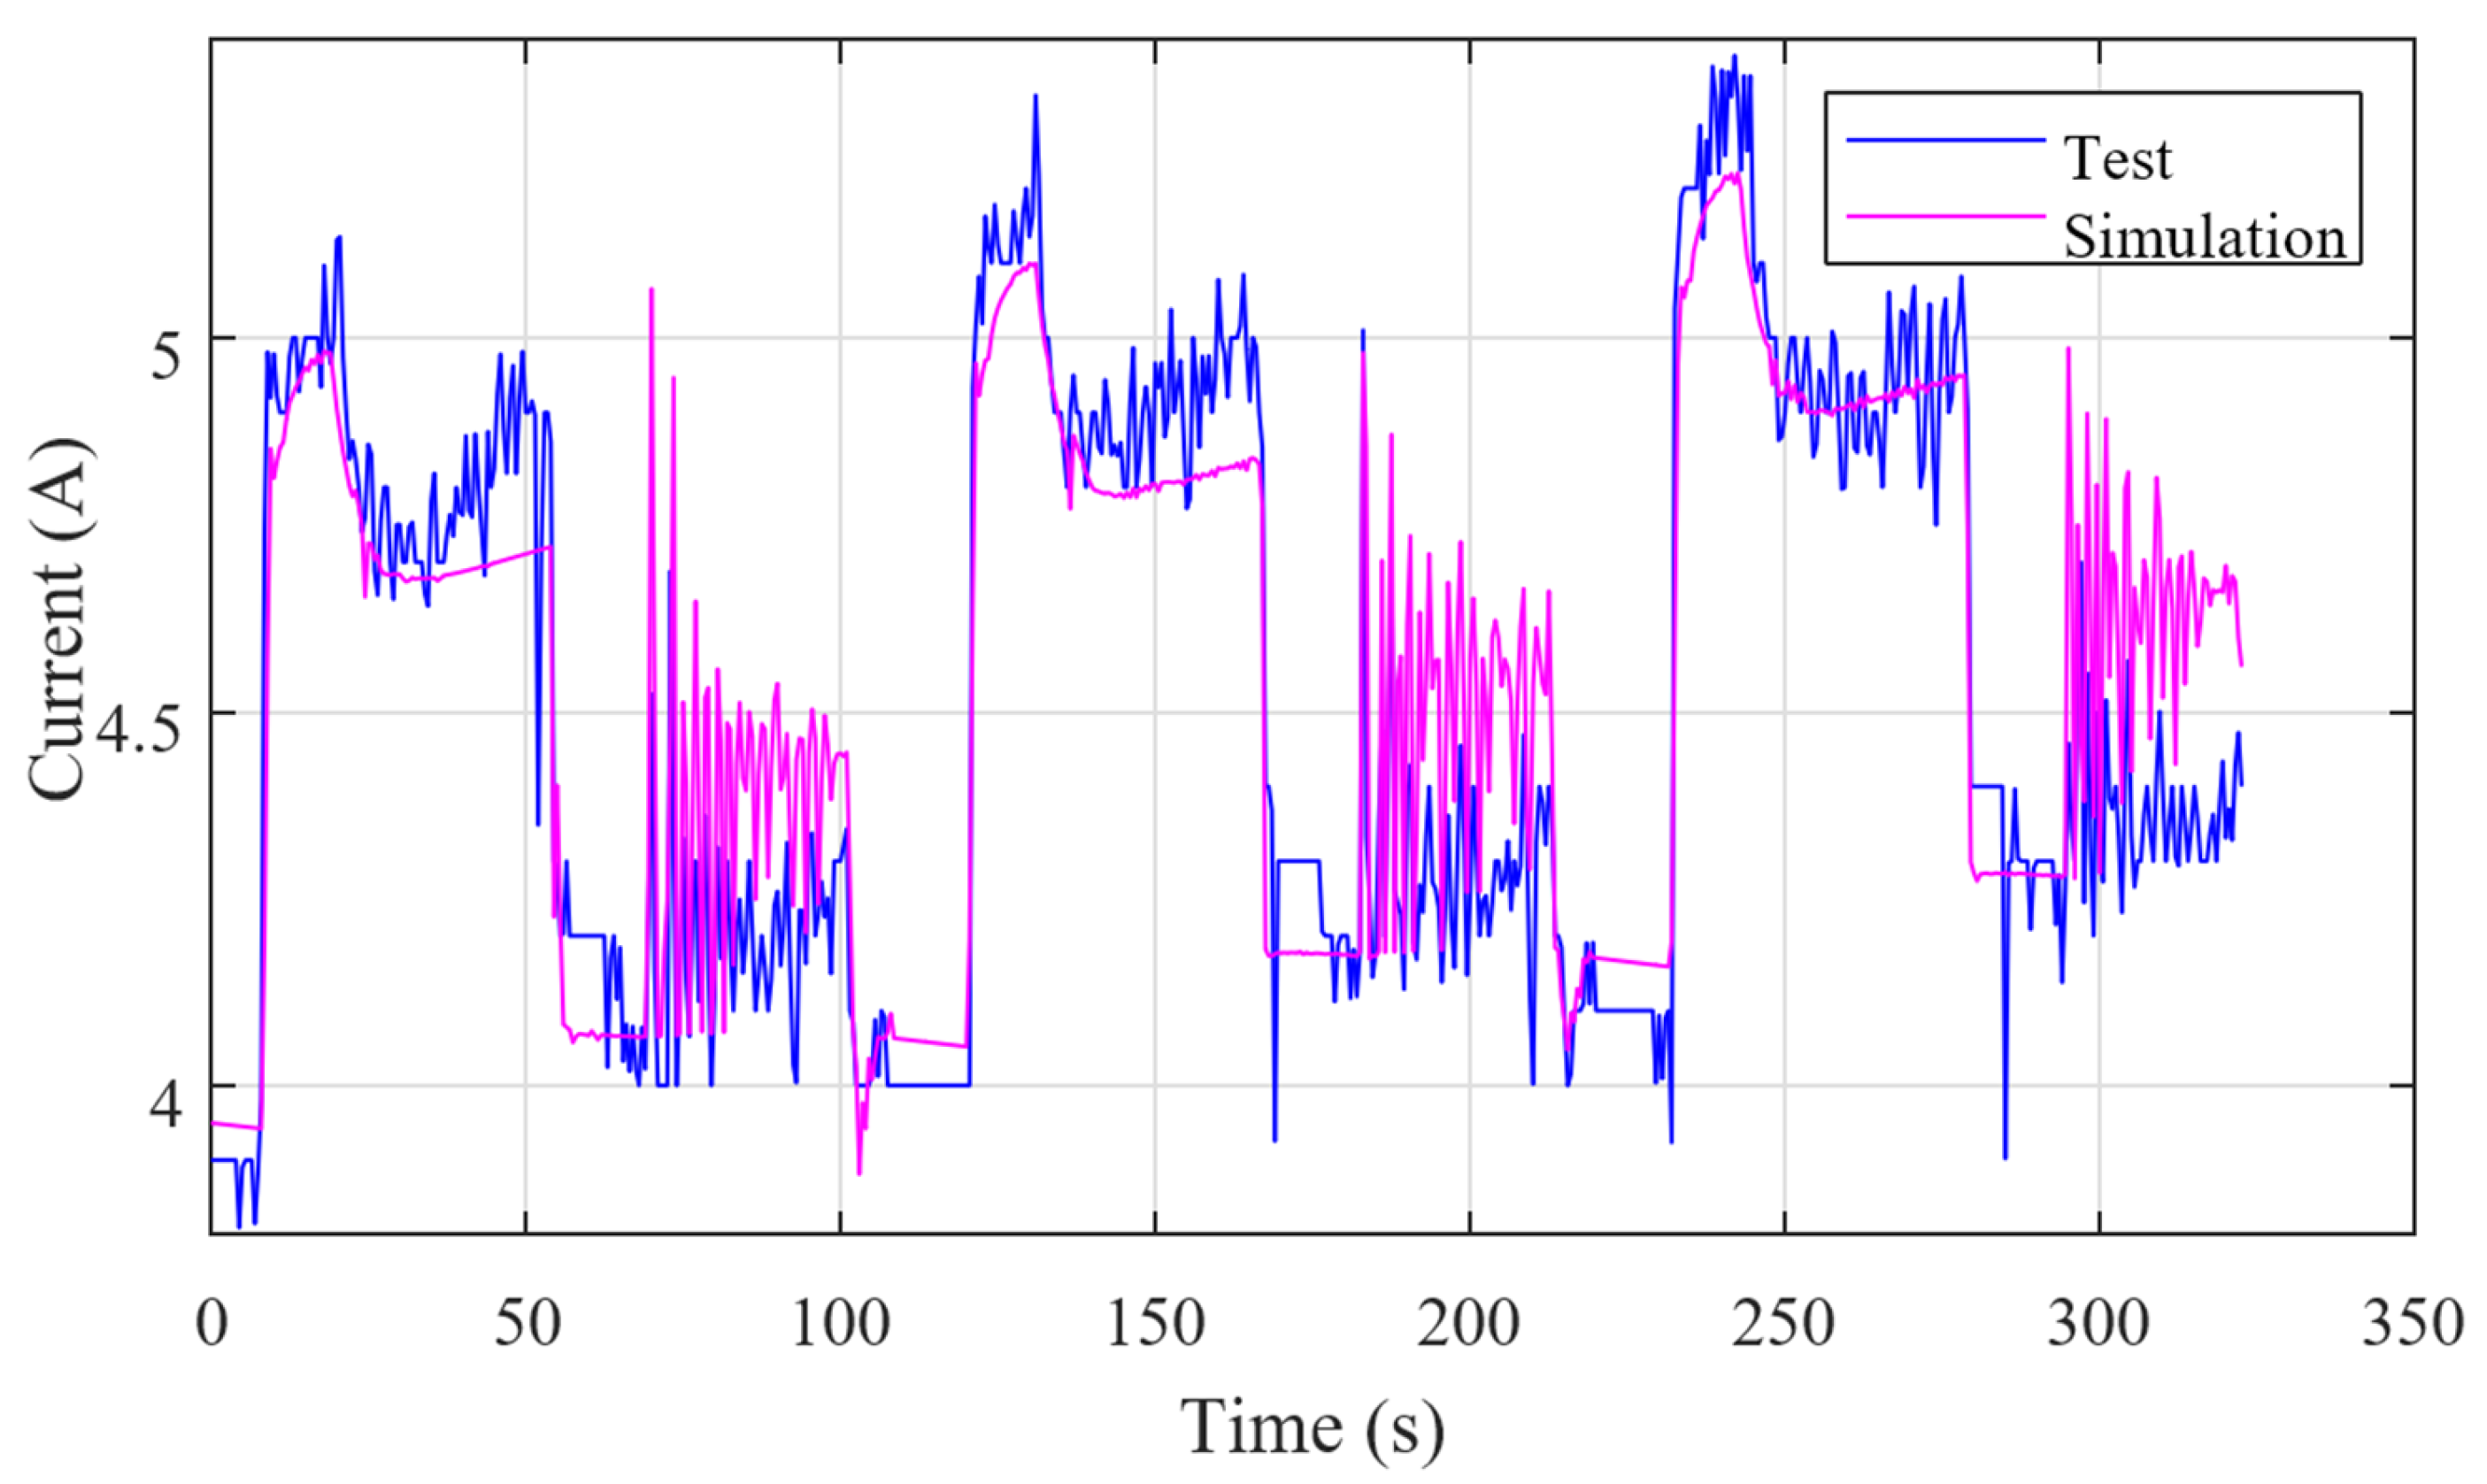
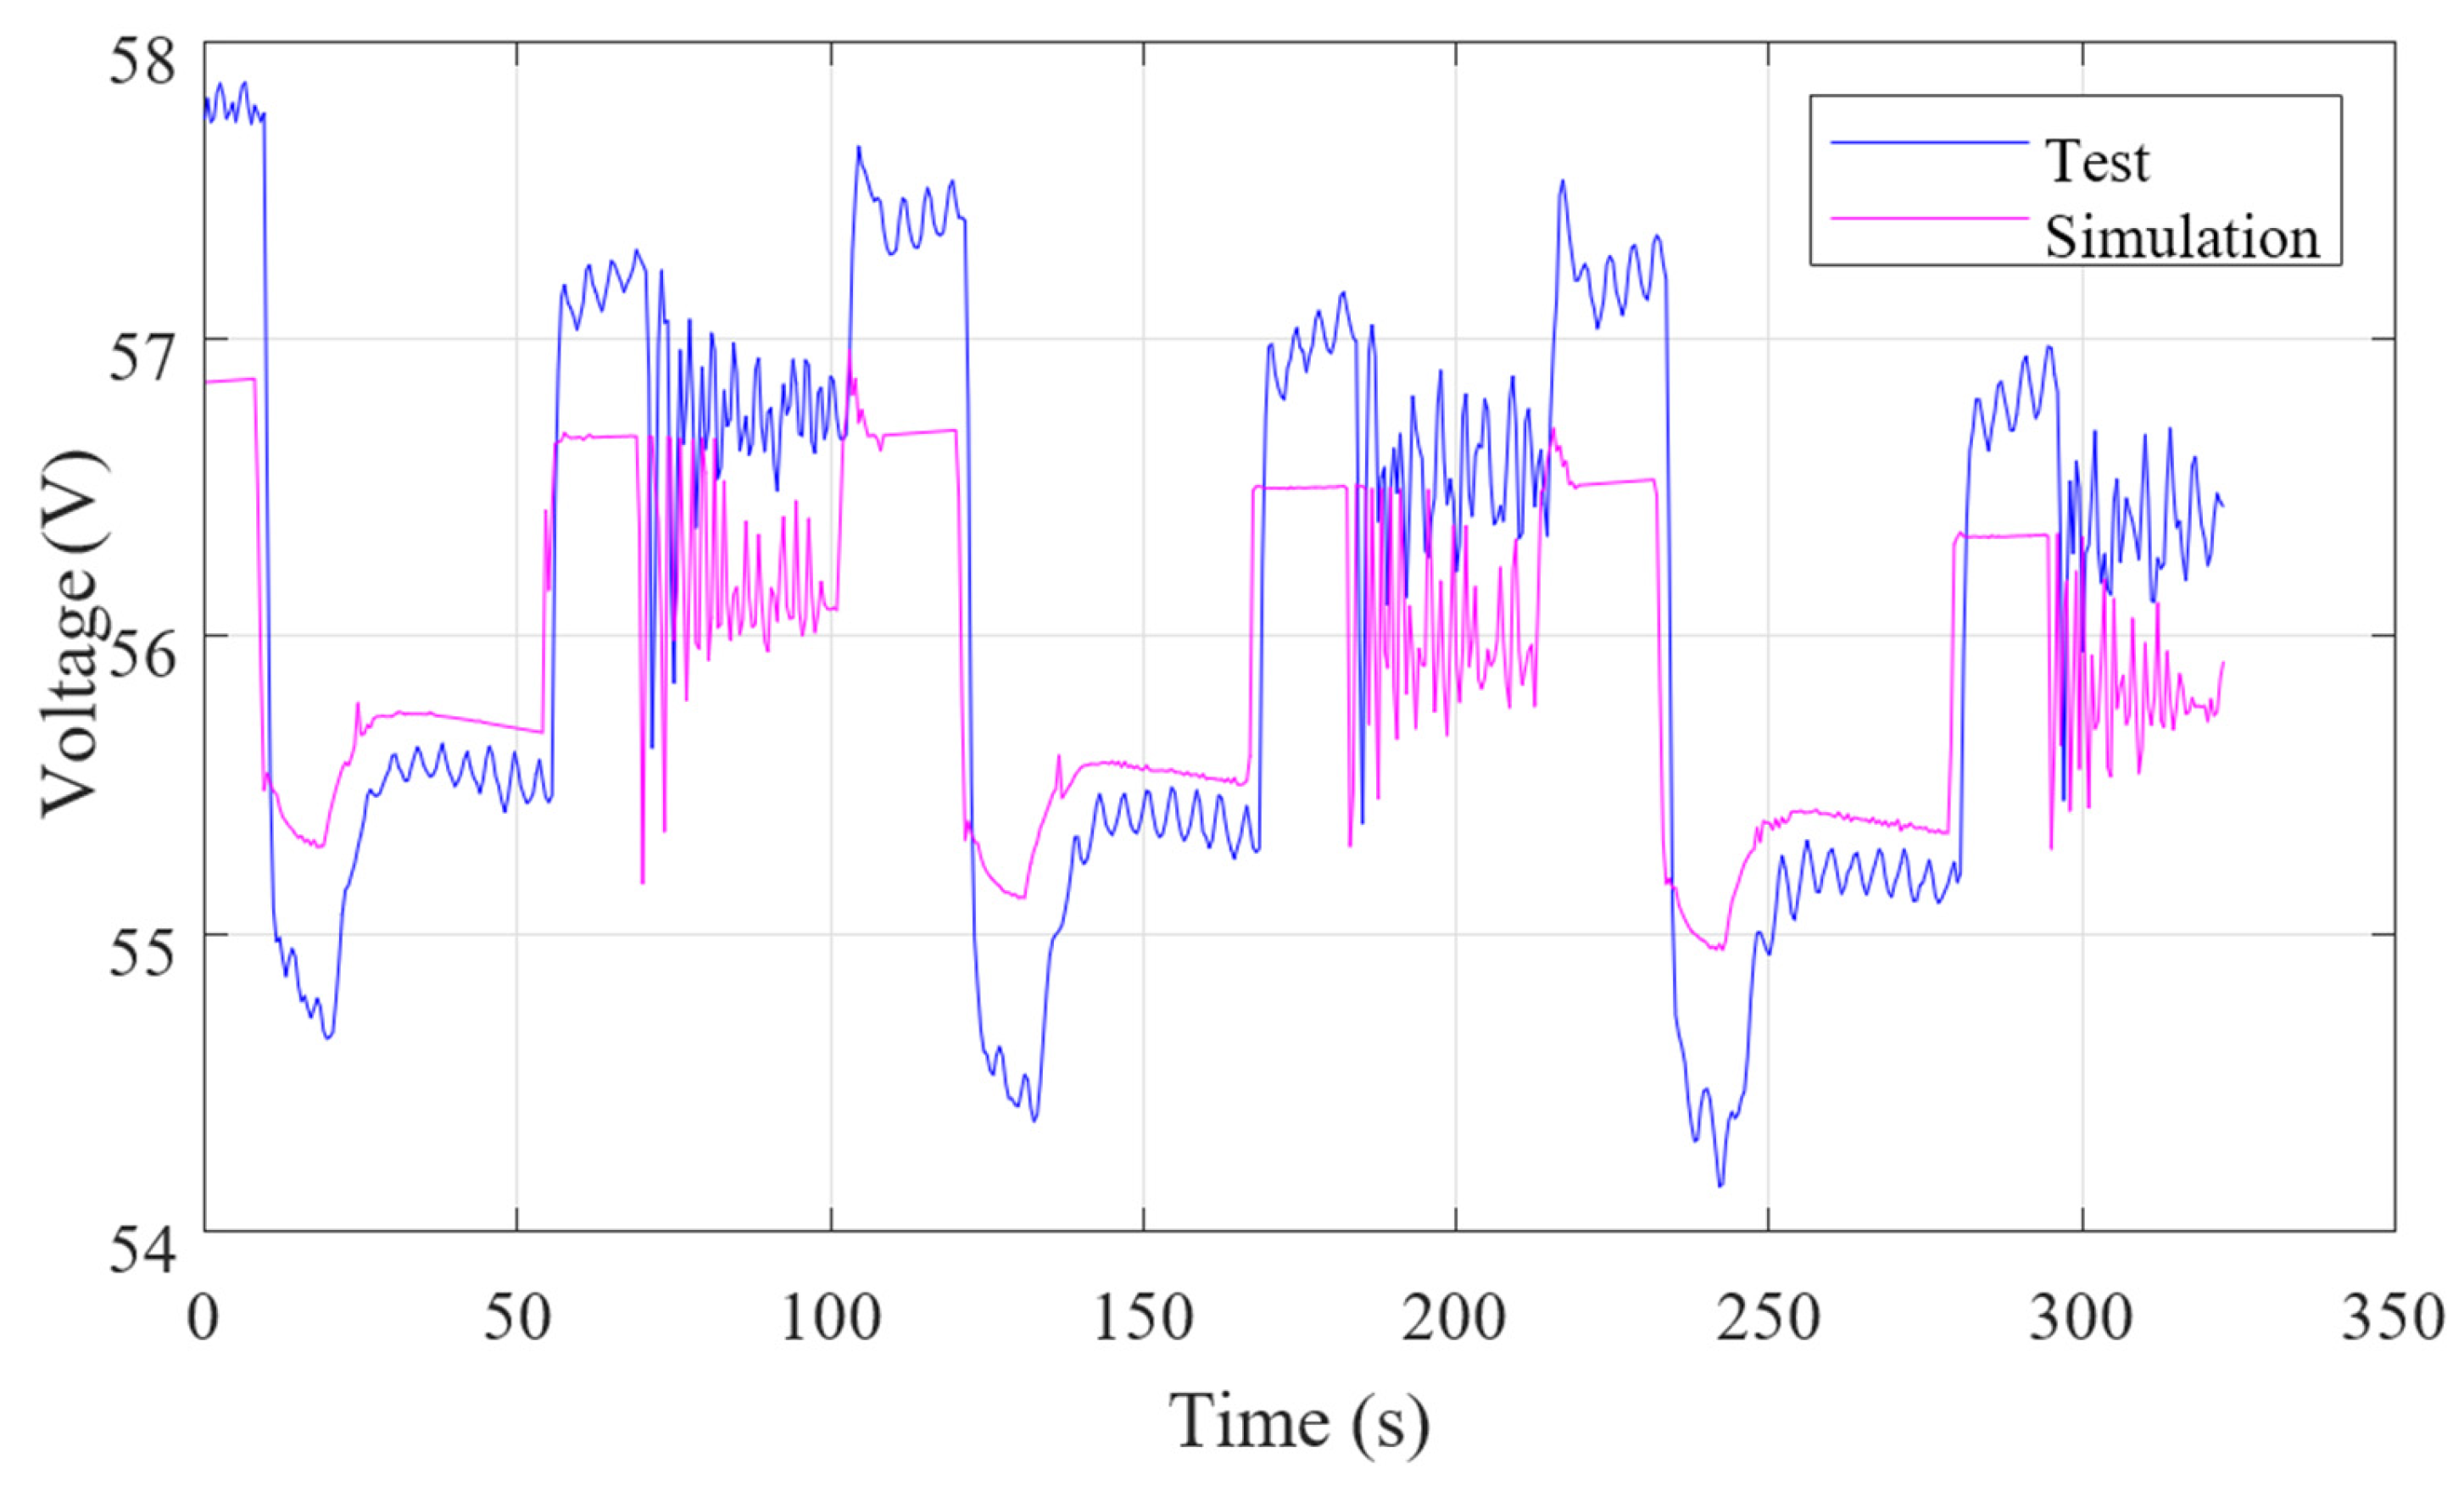
4.3. Comparison between Test and Simulation
5. Discussion
Author Contributions
Funding
Institutional Review Board Statement
Informed Consent Statement
Data Availability Statement
Conflicts of Interest
References
- Ravi, N.; Ekram, S.; Mahajan, D. Design and development of a in-wheel brushless D.C. motor drive for an electric scooter. In Proceedings of the 2006 International Conference on Power Electronic, Drives and Energy Systems, New Delhi, India, 12–15 December 2006; pp. 1–4. [Google Scholar] [CrossRef]
- Xu, X.; Zhao, J.; Zhao, J.; Shi, K.; Dong, P.; Wang, S.; Liu, Y.; Guo, W.; Liu, X. Comparative study on fuel saving potential of series-parallel hybrid transmission and series hybrid transmission. Energy Convers. Manag. 2022, 252, 114970. [Google Scholar] [CrossRef]
- Hu, D.; Cheng, S.; Zhou, J.; Hu, L. Energy Management Optimization Method of Plug-In Hybrid-Electric Bus Based on Incremental Learning. IEEE J. Emerg. Sel. Top. Power Electron. 2023, 11, 7–18. [Google Scholar] [CrossRef]
- Jia, C.; Zhou, J.; He, H.; Li, J.; Wei, Z.; Li, K.; Shi, M. A novel energy management strategy for hybrid electric bus with fuel cell health and battery thermal-and health-constrained awareness. Energy 2023, 271, 127105. [Google Scholar] [CrossRef]
- Lu, D.; Hu, D.; Yi, F.; Li, J.; Yang, Q. Optimal selection range of FCV power battery capacity considering the synergistic decay of dual power source lifespan. Int. J. Hydrogen Energy 2023, 48, 13578–13590. [Google Scholar] [CrossRef]
- Jiang, Z.; Gao, L.; Blackwelder, M.J.; Dougal, R.A. Design and experimental tests of control strategies for active hybrid fuel cell/battery power sources. J. Power Sources 2004, 130, 163–171. [Google Scholar] [CrossRef]
- Dong, P.; Zhao, J.; Liu, X.; Wu, J.; Xu, X.; Liu, Y.; Wang, S.; Guo, W. Practical application of energy management strategy for hybrid electric vehicles based on intelligent and connected technologies: Development stages, challenges, and future trends. Renew. Sustain. Energy Rev. 2022, 170, 112947. [Google Scholar] [CrossRef]
- Blackwelder, M.J.; Dougal, R.A. Power coordination in a fuel cell–battery hybrid power source using commercial power controller circuits. J. Power Sources 2004, 134, 139–147. [Google Scholar] [CrossRef]
- Zhang, Y.; Zhang, C.; Huang, Z.; Xu, L.; Liu, Z.; Liu, M. Real-time energy management strategy for fuel cell range extender vehicles based on nonlinear control. IEEE Trans. Transp. Electrif. 2019, 5, 1294–1305. [Google Scholar] [CrossRef]
- Gao, L.; Jiang, Z.; Dougal, R.A. An actively controlled fuel cell/battery hybrid to meet pulsed power demands. J. Power Sources 2004, 130, 202–207. [Google Scholar] [CrossRef]
- Zeng, T.; Zhang, C.; Zhang, Y.; Deng, C.; Hao, D.; Zhu, Z.; Ran, H.; Cao, D. Optimization-oriented adaptive equivalent consumption minimization strategy based on short-term demand power prediction for fuel cell hybrid vehicle. Energy 2021, 227, 120305. [Google Scholar] [CrossRef]
- González, E.L.; Cuesta, J.S.; Fernandez, F.J.V.; Llerena, F.I.; Carlini, M.A.R.; Bordons, C.; Hernandez, E.; Elfes, A. Experimental evaluation of a passive fuel cell/battery hybrid power system for an unmanned ground vehicle. Int. J. Hydrogen Energy 2019, 44, 12772–12782. [Google Scholar] [CrossRef]
- Jia, C.; Li, K.; He, H.; Zhou, J.; Li, J.; Wei, Z. Health-aware energy management strategy for fuel cell hybrid bus considering air-conditioning control based on TD3 algorithm. Energy 2023, 283, 128462. [Google Scholar] [CrossRef]
- Al-Ali, A.; Waheed, W.; Abu-Nada, E.; Alazzam, A. A review of active and passive hybrid systems based on Dielectrophoresis for the manipulation of microparticles. J. Chromatogr. A 2022, 1676, 463268. [Google Scholar] [CrossRef] [PubMed]
- Zhang, Y.; Tennakoon, T.; Chan, Y.H.; Chan, K.C.; Fu, S.C.; Tso, C.Y.; Yu, K.M.; Huang, B.L.; Yao, S.H.; Qiu, H.H.; et al. Energy consumption modelling of a passive hybrid system for office buildings in different climates. Energy 2022, 239, 121914. [Google Scholar] [CrossRef]
- Offer, G.J. Fuel Cell Hybrid Electric Vehicle Powertrain Modelling and Testing. Ph.D. Thesis, Imperial College London, London, UK, 2014. [Google Scholar]
- Andreasen, S.J.; Ashworth, L.; Menjón Remón, I.N.; Kær, S.K. Directly connected series coupled HTPEM fuel cell stacks to a Li-ion battery DC bus for a fuel cell electrical vehicle. Int. J. Hydrogen Energy 2008, 33, 7137–7145. [Google Scholar] [CrossRef]
- Renken, F.; Piwczyk, D.; Shen, W.; Pop-Calimanu, I.M.; Steinberger-Wilckens, R. A Novel Concept to Control the Powertrain in Battery Fuel Cell Hybrid Vehicles. In Proceedings of the 2018 20th European Conference on Power Electronics and Applications (EPE’18 ECCE Europe), Riga, Latvia, 17–21 September 2018; pp. 1–9. Available online: https://ieeexplore.ieee.org/xpl/conhome/8493084/proceeding (accessed on 20 September 2020).
- Nishizawa, A.; Kallo, J.; Garrot, O.; Weiss-Ungethüm, J. Fuel cell and Li-ion battery direct hybridization system for aircraft applications. J. Power Sources 2013, 222, 294–300. [Google Scholar] [CrossRef]
- Bernard, J.; Hofer, M.; Hannesen, U.; Toth, A.; Tsukada, A.; Büchi, F.N.; Dietrich, P. Fuel cell/battery passive hybrid power source for electric powertrains. J. Power Sources 2011, 196, 5867–5872. [Google Scholar] [CrossRef]
- Wu, B.; Parkes, M.A.; Yufit, V.; De Benedetti, L.; Veismann, S.; Wirsching, C.; Vesper, F.; Martinez-Botas, R.F.; Marquis, A.J.; Offer, G.J.; et al. Design and testing of a 9.5 kWe proton exchange membrane fuel cell–supercapacitor passive hybrid system. Int. J. Hydrogen Energy 2014, 39, 7885–7896. [Google Scholar] [CrossRef]
- Pisu, P.; Cantemir, C.-G.; Dembski, N.; Rizzoni, G.; Serrao, L.; Josephson, J.R.; Russell, J. Evaluation of powertrain solutions for future tactical truck vehicle systems. In Modeling and Simulation for Military Applications; SPIE: Bellingham, WA, USA, 2006; Volume 6228, pp. 105–116. [Google Scholar] [CrossRef]
- Sun, L.; You, F. Machine learning and data-driven techniques for the control of smart power generation systems: An uncertainty handling perspective. Engineering 2021, 7, 1239–1247. [Google Scholar] [CrossRef]
- Zou, Y.; Li, J.; Hu, X.; Chamaillard, Y. Modeling and Control of Hybrid Propulsion System for Ground Vehicles; Springer: Berlin/Heidelberg, Germany, 2018. [Google Scholar] [CrossRef]
- Onori, S.; Serrao, L.; Rizzoni, G. Hybrid Electric Vehicles: Energy Management Strategies; Springer London Ltd.: London, UK, 2016. [Google Scholar] [CrossRef]
- Dixon, G.; Stobart, R.; Steffen, T. Unified Backwards Facing and Forwards Facing Simulation of a Hybrid Electric Vehicle Using MATLAB Simscape; SAE Technical Paper 2015-01-1215; SAE International: Warrendale, PA, USA, 2015. [Google Scholar] [CrossRef]
- Gao, D.W.; Mi, C.; Emadi, A. Modeling and simulation of electric and hybrid vehicles. Proc. IEEE 2007, 95, 729–745. [Google Scholar] [CrossRef]
- Hellberg, T.; Meywerk, M. Usage-based optimisation of characteristic maps for conceptual powertrain design. Automot. Engine Technol. 2017, 2, 49–61. [Google Scholar] [CrossRef]
- Zhou, J.; Feng, C.; Su, Q.; Jiang, S.; Fan, Z.; Ruan, J.; Sun, S.; Hu, L. The Multi-Objective Optimization of Powertrain Design and Energy Management Strategy for Fuel Cell–Battery Electric Vehicle. Sustainability 2022, 14, 6320. [Google Scholar] [CrossRef]
- European Union. OJ L 53—Commission Delegated Regulation (EU) No 134/2014 of 16 December 2013 Supplementing Regulation (EU) No 168/2013 of the European Parliament and of the Council with Regard to Environmental and Propulsion Unit Performance Requirements and Amending Annex V Thereof, 21 February 2014. Available online: http://data.europa.eu/eli/reg_del/2014/134/2018-03-20 (accessed on 2 May 2020).
- European Union. Regulation (EU) No 168/2013 of the European Parliament and of the Council of 15 January 2013 on the Approval and Market Surveillance of Two- or Three-Wheel Vehicles and Quadricycles: 02013R0168-20190220, 20 February 2019. Available online: http://data.europa.eu/eli/reg/2013/168/2019-02-20 (accessed on 2 May 2020).
- United Nations Economic Commission for Europe. UN Regulation No. 47—Emission of Gaseous Pollutants of Mopeds. 1981. Available online: https://www.unece.org/fileadmin/DAM/trans/main/wp29/wp29regs/r047e.pdf (accessed on 2 May 2020).
- Giechaskiel, B.; Zardini, A.; Martini, G. Particle emission measurements from L-category vehicles. SAE Int. J. Engines 2015, 8, 2322–2337. [Google Scholar] [CrossRef]
- GB/T 24157-2017; Test Methods of Range and Indication for the State of Charge of Electric Motorcycle and Electric Mopeds. The Standardization Administration of the People’s Republic of China: Beijing, China. 2017. Available online: http://c.gb688.cn/bzgk/gb/showGb?type=online&hcno=719EBA32808F06FCCDE397C721C57A65 (accessed on 2 May 2020).
- Delphi Technologies PLC. Worldwide Emissions Standards—Passenger Cars and Light Duty Vehicles 2019–2020. Available online: https://www.delphi.com/innovations (accessed on 2 May 2020).


| No. of Operation | Operation | Acceleration (m/s2) | Roller Speed (km/h) | Duration of Operation (s) | Total Duration of One Cycle (s) |
|---|---|---|---|---|---|
| 1 | Idling | - | - | 8 | |
| 2 | Acceleration | full throttle | 0-max | 8 | |
| 3 | Constant speed | full throttle | max | 57 | |
| 4 | Deceleration | −0.56 | max-20 | 65 | |
| 5 | Constant speed | - | 20 | 36 | 101 |
| 6 | Deceleration | −0.93 | 20-0 | 6 | 107 |
| 7 | Idling | - | - | 5 | 112 |
Disclaimer/Publisher’s Note: The statements, opinions and data contained in all publications are solely those of the individual author(s) and contributor(s) and not of MDPI and/or the editor(s). MDPI and/or the editor(s) disclaim responsibility for any injury to people or property resulting from any ideas, methods, instructions or products referred to in the content. |
© 2023 by the authors. Licensee MDPI, Basel, Switzerland. This article is an open access article distributed under the terms and conditions of the Creative Commons Attribution (CC BY) license (https://creativecommons.org/licenses/by/4.0/).
Share and Cite
Zhang, Z.; Rex, A.; Zhou, J.; Zhang, X.; Huang, G.; Zhang, J.; Zhang, T. Dynamic Simulation Model and Experimental Validation of One Passive Fuel Cell–Battery Hybrid Powertrain for an Electric Light Scooter. Sustainability 2023, 15, 13180. https://doi.org/10.3390/su151713180
Zhang Z, Rex A, Zhou J, Zhang X, Huang G, Zhang J, Zhang T. Dynamic Simulation Model and Experimental Validation of One Passive Fuel Cell–Battery Hybrid Powertrain for an Electric Light Scooter. Sustainability. 2023; 15(17):13180. https://doi.org/10.3390/su151713180
Chicago/Turabian StyleZhang, Zhiming, Alexander Rex, Jiaming Zhou, Xinfeng Zhang, Gangqiang Huang, Jinming Zhang, and Tong Zhang. 2023. "Dynamic Simulation Model and Experimental Validation of One Passive Fuel Cell–Battery Hybrid Powertrain for an Electric Light Scooter" Sustainability 15, no. 17: 13180. https://doi.org/10.3390/su151713180
APA StyleZhang, Z., Rex, A., Zhou, J., Zhang, X., Huang, G., Zhang, J., & Zhang, T. (2023). Dynamic Simulation Model and Experimental Validation of One Passive Fuel Cell–Battery Hybrid Powertrain for an Electric Light Scooter. Sustainability, 15(17), 13180. https://doi.org/10.3390/su151713180