Article

An Electrochemical Performance Model Considering of Non-Uniform Gas Distribution Based on Porous Media Method in PEMFC Stack

1
School of Automotive Studies, Tongji University, Shanghai 201804, China
2
Yangtze Delta Region Institute of Tsinghua University Zhejiang, Jiaxing 314006, China
3
School of Intelligent Manufacturing, Weifang University of Science and Technology, Weifang 262700, China
*
Authors to whom correspondence should be addressed.
Sustainability 2024, 16(2), 587; https://doi.org/10.3390/su16020587
Submission received: 23 November 2023 / Revised: 21 December 2023 / Accepted: 8 January 2024 / Published: 9 January 2024

Abstract

:
Proton exchange membrane fuel cell (PEMFC) is significant and favorable to the long-range and short refueling time in the vehicle industry. However, the non-uniform distribution of gas flow supply, particularly in the fuel cell stack is neglected in the electrochemical model for PEMFC performance optimization. The purpose of this study is to break through this limitation to establish an optimized electrochemical fuel cell performance model, with porous media methods considering the non-uniform gas flow distribution in fuel cell stack with different compression of the gas distribution layer (GDL). The numerical models are validated by experimentation of a practical fuel cell stack. For the established fuel cell model, there is a 5% difference between the maximum and minimum speeds of various flow channels in the anode flow field under 10% GDL compression. Furthermore, the single-channel electrochemical performance model is optimized by considering the non-uniform gas flow distribution of the fuel cell stack. The results of the optimized electrochemical fuel cell performance model demonstrate that the correlation coefficient between the experiment results and the simulation results is nearly 99.50%, which is higher than that of the original model under 20% GDL compression. This established model is effective in enhancing the prediction accuracy of the PEMFC performance.

1. Introduction

1.1. The Importance of the Fuel Cell Electrochemical Performance Model

Fuel cells have the advantages of high efficiency and no pollution to develop electric vehicles and to effectively solve the problems of carbon emission and energy crisis in the transportation domain [1]. PEMFCs (Proton Exchange Membrane Fuel Cells) are the most applied at present, which has the advantages of long driving range, low emission, low noise, and quick refueling time in normal temperature environments, etc., and are expected to become one of the most promising alternatives for vehicle power source [2,3]. However, PEMFC still has problems with high performance and long durability, which are difficult to commercialize [4,5]. Therefore, recent studies have contributed to PEMFC electrochemical performance and optimization.
The research on PEMFC performance is mainly using experiments and numerical simulation methods [6]. Compared to numerical simulation, experimental research requires a long time and expensive equipment, and it is difficult to observe and analyze the specific behavior inside PEMFCs. Numerical simulation is becoming an indispensable part of PEMFC research [7,8]. The numerical simulation model of the PEMFC performance is important to predict the internal multi-physical phenomenon such as the gas flow, fuel concentration, water content of PEM (proton exchange membrane), operating temperature and current density, etc., which has gradually developed from a one-dimensional mathematical model to a more complex three-dimensional mathematical model, and its scale has also developed from half cells to full-size of single cells and stacks [9].
Atyabi et al. [10] conducted a simulation using a 3D multiphase model of a PEMFC to examine the impact of clamping force on the contact resistance between the GDL (gas diffusion layer) and BPP (bipolar plate). Their findings also indicated that a higher clamping force resulted in a more uniform distribution of electric potential and oxygen concentration. Tas et al. [11] developed three-dimensional and anisotropic numerical models to study the effects of cell temperature and relative humidity on charge transport parameters. Chen et al. [12] established a three-dimensional multi-phase PEMFC electrochemical model coupled with a cooling channel to comprehensively analyze the heat transfer characteristics. They also examined the distribution of water saturation on the central section of cathode CL (catalyst layer) and the distribution of temperature on the central section of PEM for better PEMFC performance. These studies made significant contributions to understanding the electrochemical performance development of PEMFCs.
Some recent studies have been conducted to combine FEA (finite element analysis) and CFD (computational fluid dynamics) to predict the electrochemical performance of PEMFC considering the structural effect and flow fluid effect on the compression of the GDL. Zhang et al. [13] established a force-temperature-humidity multi-field coupled model using FEA and CFD to analyze the electrochemical performance of PEMFC. This model takes into account the compression behavior of porosity and contact pressure in GDLs. This method can significantly improve the accuracy and reliability of the numerical simulation model. Under clamping force, the porosity and permeability of the GDL will decrease [14]. The large clamping force will reduce the transverse reactant gas flow between adjacent channels, and this effect is more obvious with high current densities which need large providing fuel [15]. Therefore, clamping force will affect PEMFC performance and the appropriate clamping force of the PEMFC stack can effectively improve the output power of PEMFC [16].
However, due to limitations of calculation resources and accuracy, the current PEMFC electrochemical simulation model mainly focuses on the single-channel electrochemical model, to economize the computational resources and obtain high precision [17]. The gas flow in a PEMFC stack is influenced by the internal structure of its flow channels, resulting in variations in flow between different single cells and even within the flow channels of a single cell. Consequently, the single-channel electrochemical model is inadequate in accurately representing the performance of real PEMFC.

1.2. The Influence of the Gas Flow Distribution in PEMFC Stack

For fuel cell vehicles, a PEMFC stack usually needs hundreds of single cells to work together in series to meet the output power needs in different driving conditions. In the redistribution of the reaction gas from the inlet of the PEMFC stack to each single cell through the manifold, it will be affected by factors such as flow separation and confluence, so it is difficult to ensure the uniform distribution of gas flow and the consistency of the single cell electrochemical performance [18]. In addition, the gas flow inside a single cell also is affected by mass and heat transfer, electrochemical reaction, etc., which causes the uneven distribution of reaction gas and current density in the reactive area of PEM and results in local hot spots, high mechanical stress, flooding, and other fault phenomena [19]. The consistency of gas distribution inside PEMFC is very important to the design of the flow field and improves the output electrochemical PEMFC performance [20]. The internal flow field of PEMFC is mainly composed of the plate flow channel and manifold of the PEMFC stack. The plate flow channel affects the gas distribution in a single cell, and the manifold affects the gas distribution among single cells in the PEMFC stack [21].
The primary objective of flow field design is to facilitate the uniform distribution of reaction gas within the active region of a PEMFC. This ensures smooth transportation of the gas to the catalyst, resulting in a more consistent distribution of current density and heat. Additionally, it promotes the timely production of reaction water, which effectively enhances the efficiency and durability of PEMFC [22,23]. At present, common flow field forms mainly include parallel flow fields, serpentine flow fields, grid flow fields, etc. [24]. The study of flow field structure mainly focuses on geometry structure parameters, which include channel height, channel width, and rib width [25]. Different heights and widths will affect the PEMFC performance. A narrower channel should be used at high current densities for high gas pressure, while a wider channel should be used at low current densities for large quantities of flow [26]. Meanwhile, the shape of the flow channel also has a significant influence on the PEMFC performance [27]. Am et al. [28] studied the influence of flow channel shapes on the PEMFC performance. The results show that the performance of the top trapezoid and bottom inverted trapezoid flow channels is relatively excellent, and the flow channel shape has an important influence on the current density of PEMFC at middle and high current densities.
Except for the consistent distribution of gas flow in a single cell, the other objective of flow field design is the flow consistency among single cells, since the inlet flow rate of a single cell directly affects the uniform electrochemical reaction of PEMFC performance i.e., the consistency of the voltage in the PEMFC stack, which plays an important role in the overall output performance for the dynamic driving condition of fuel cell vehicle. Yin et al. [29] conducted a numerical investigation to study the distribution of gas flow rates in the anode of two U-type fuel cell stacks (a 15-cell stack and a 140-cell stack), both composed of the same type of unit fuel cells. The results revealed that the asymmetric feed header of the manifold structure hurt the consistency of gas flow rate distribution. However, when the 140-cell stack was equipped with a rotational symmetric feed header, the original maximum non-uniformity was reduced by approximately 50%. Jiang et al. [30] developed a 3D model of a 7-channel serpentine flow field PEMFC with the same dimensions as the experimental setup to analyze the non-uniformity within a single cell and CFD was employed to simulate and investigate the distribution of physical fields within the membrane. Yang et al. [31] constructed a comprehensive stack model by integrating a 1 + 1-dimensional multiphase stack sub-model and a flow distribution sub-model to investigate the distribution of flow and performance heterogeneity.
The existing single-channel electrochemical models cannot fully reveal the PEMFC performance and its key important influencing factors. This limitation arises from the non-uniform distribution of gas flow among channels within the fuel cell stack. When using a complete fuel cell stack model based on the finite element method, the fuel cell bipolar plate flow field’s intricate structure poses challenges in grid partitioning and solving, resulting in the requirement for substantial computational resources and lengthy computation time. This paper presents a novel approach to simplify the flow field domain of fuel cell bipolar plates by utilizing porous media theory. It considers the flow field domain as a porous media region and develops a corresponding porous media model for this domain. The gas distribution model based on the porous media model can simulate the gas distribution among channels within the PEMFC stack under different clamping forces. By combining the single-channel electrochemical model, the electrochemical performance of PEMFC can be accurately assessed. The simplified model presented in this paper enhances the accuracy of performance prediction for the PEMFC stack under different clamping forces, thereby facilitating the optimization of PEMFC performance during the design process.

2. The Combined Model of Electrochemical Performance and Gas Distribution

Due to the flow field structure of PEMFCs, the gas distribution varies among different single cells and different flow channels in a single cell. In this part, the single-channel electrochemical performance model combined with the PEMFC gas distribution model is described and established. The combined model is more realistic and has higher accuracy. Ultimately, this combined model can lead to better predictions and optimization of PEMFC performance.

2.1. The Single-Channel Electrochemical Performance Model

The compression of GDL results in a small porosity of the supply fuel and oxygen which has an important influence on the electrochemical performance of the fuel cells [32]. Thus, the characteristics of GDL after deformation under actual clamping force are comprehensively considered in this electrochemical performance model of PEMFC.
Firstly, the deformation of GDL is simulated based on the FEM structural analysis in ANSYS® 19.2, and then the deformation results of GDL under the clamping force are obtained. Meanwhile, the porosity and permeability of the GDL after deformation are calculated based on these results. These calculated values are then uploaded into the electrochemical performance model via UDF (User Defined Function). Finally, the PEMFC electrochemical performance simulation was carried out in FLUENT® 19.2. This co-simulation based on FEA, CFD, and electrochemistry can effectively improve the reliability of the PEMFC performance prediction results.
The PEMFC single-channel electrochemical performance model established in this paper is based on the actual PEMFC stack for the fuel cell vehicle with a hundred kilowatts, and the anode and cathode flow fields are parallel straight channel flow fields with symmetry. The structural dimensions of the single-channel model are shown in Figure 1, which consists of BPPs, GDLs, CLs, flow channels, and a PEM. The structural dimensional parameters of this model are shown in Table 1 and the material properties are shown in Table 2.

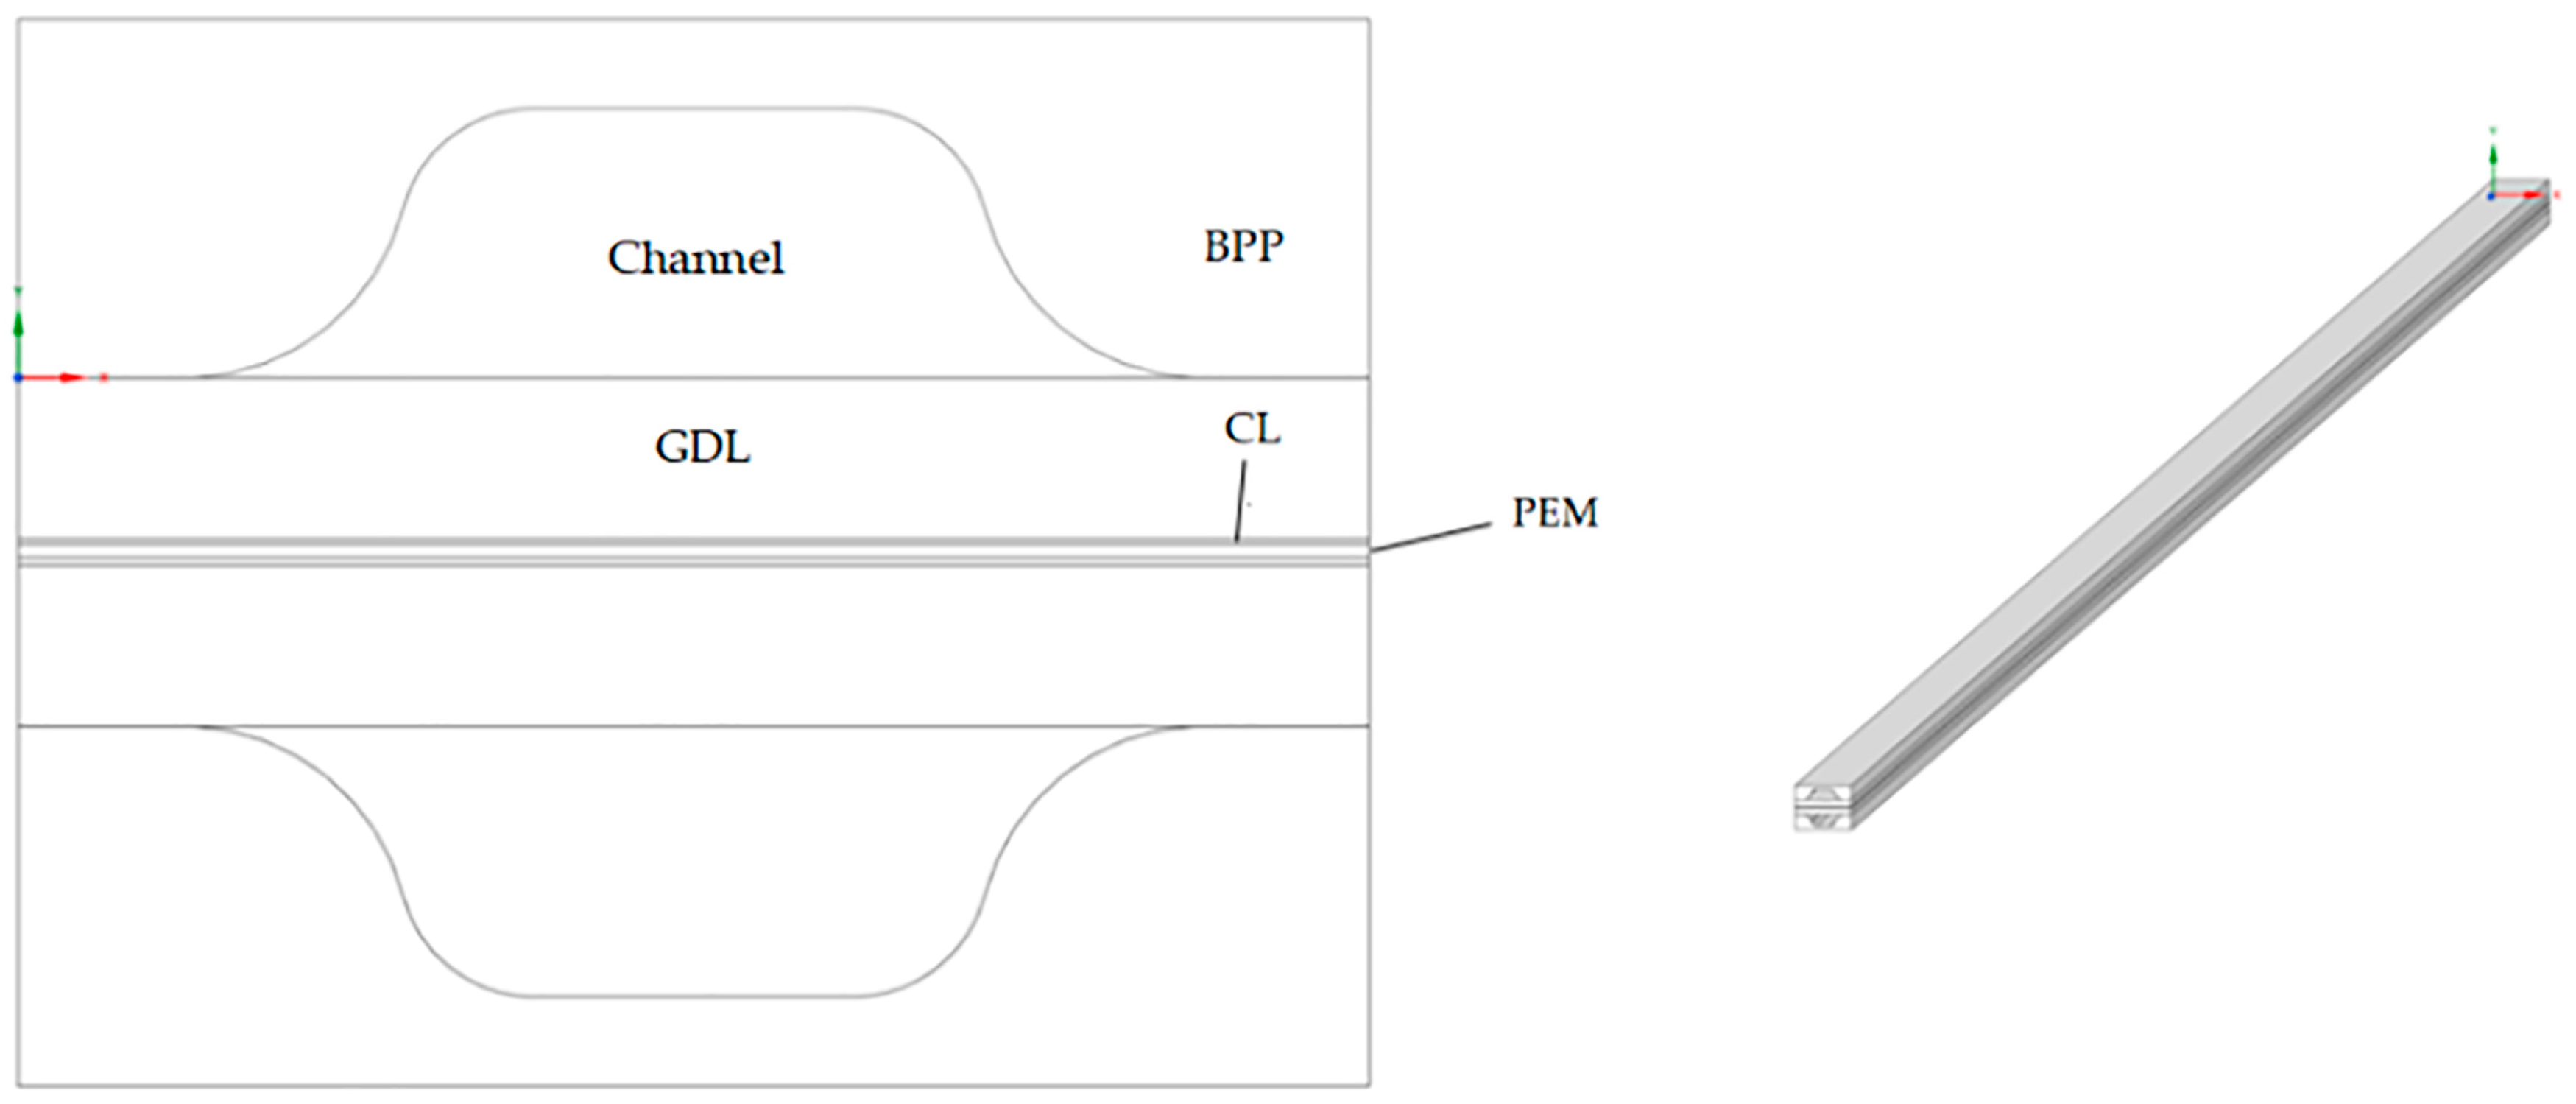
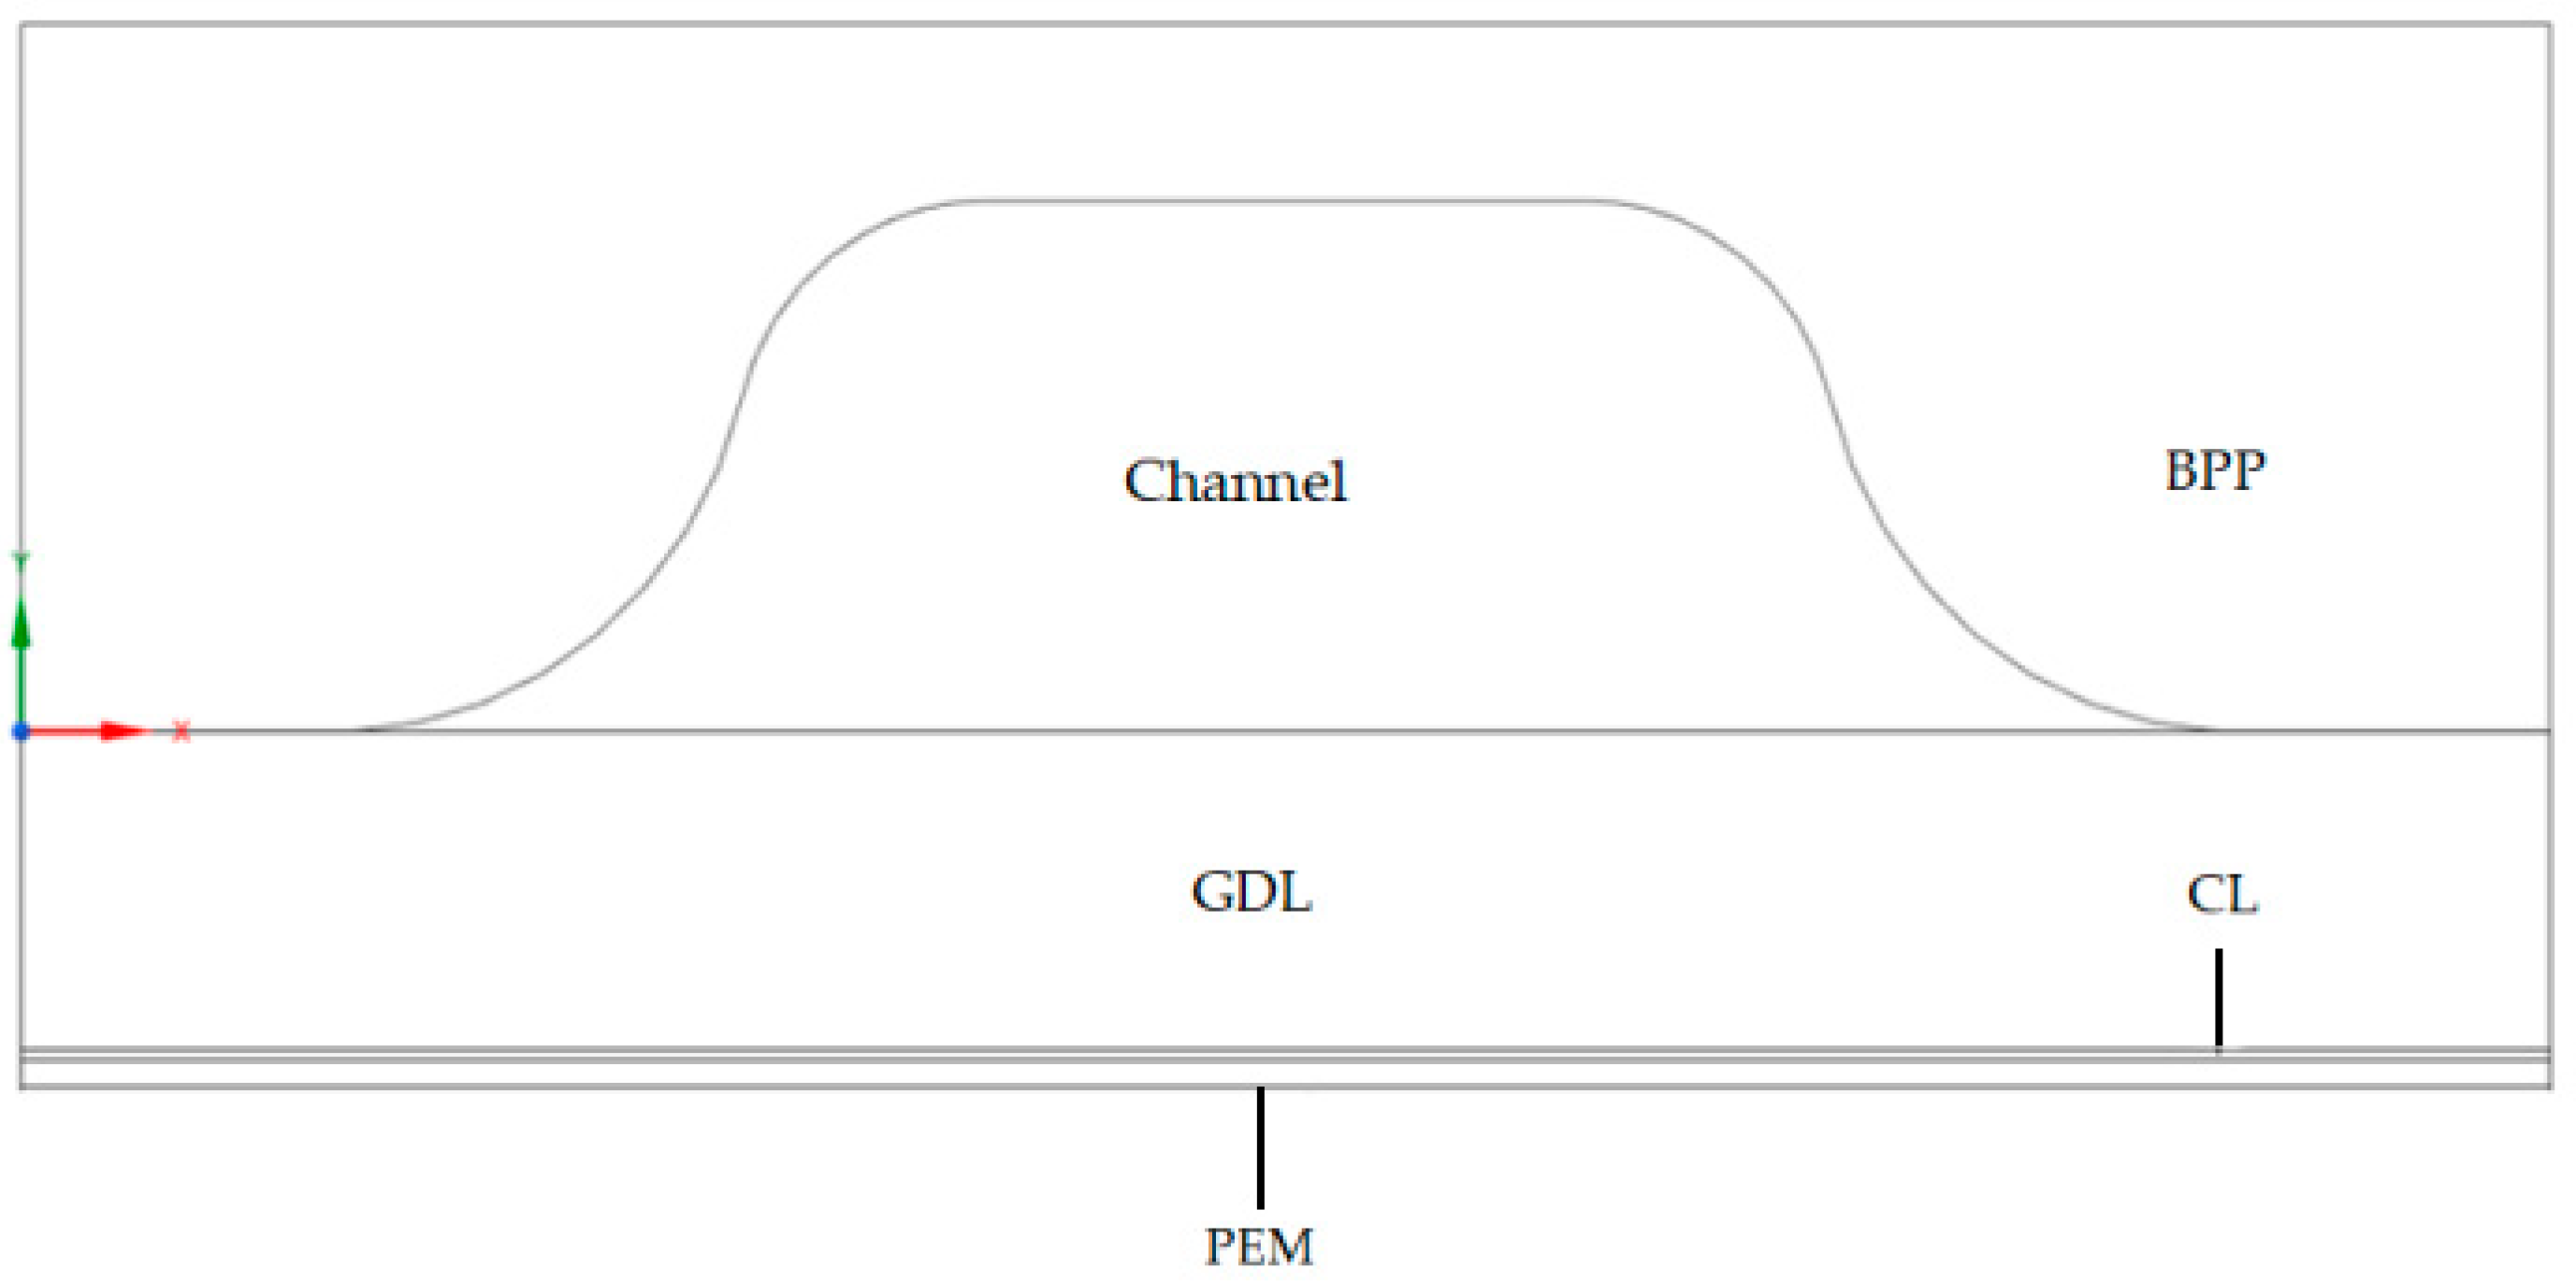
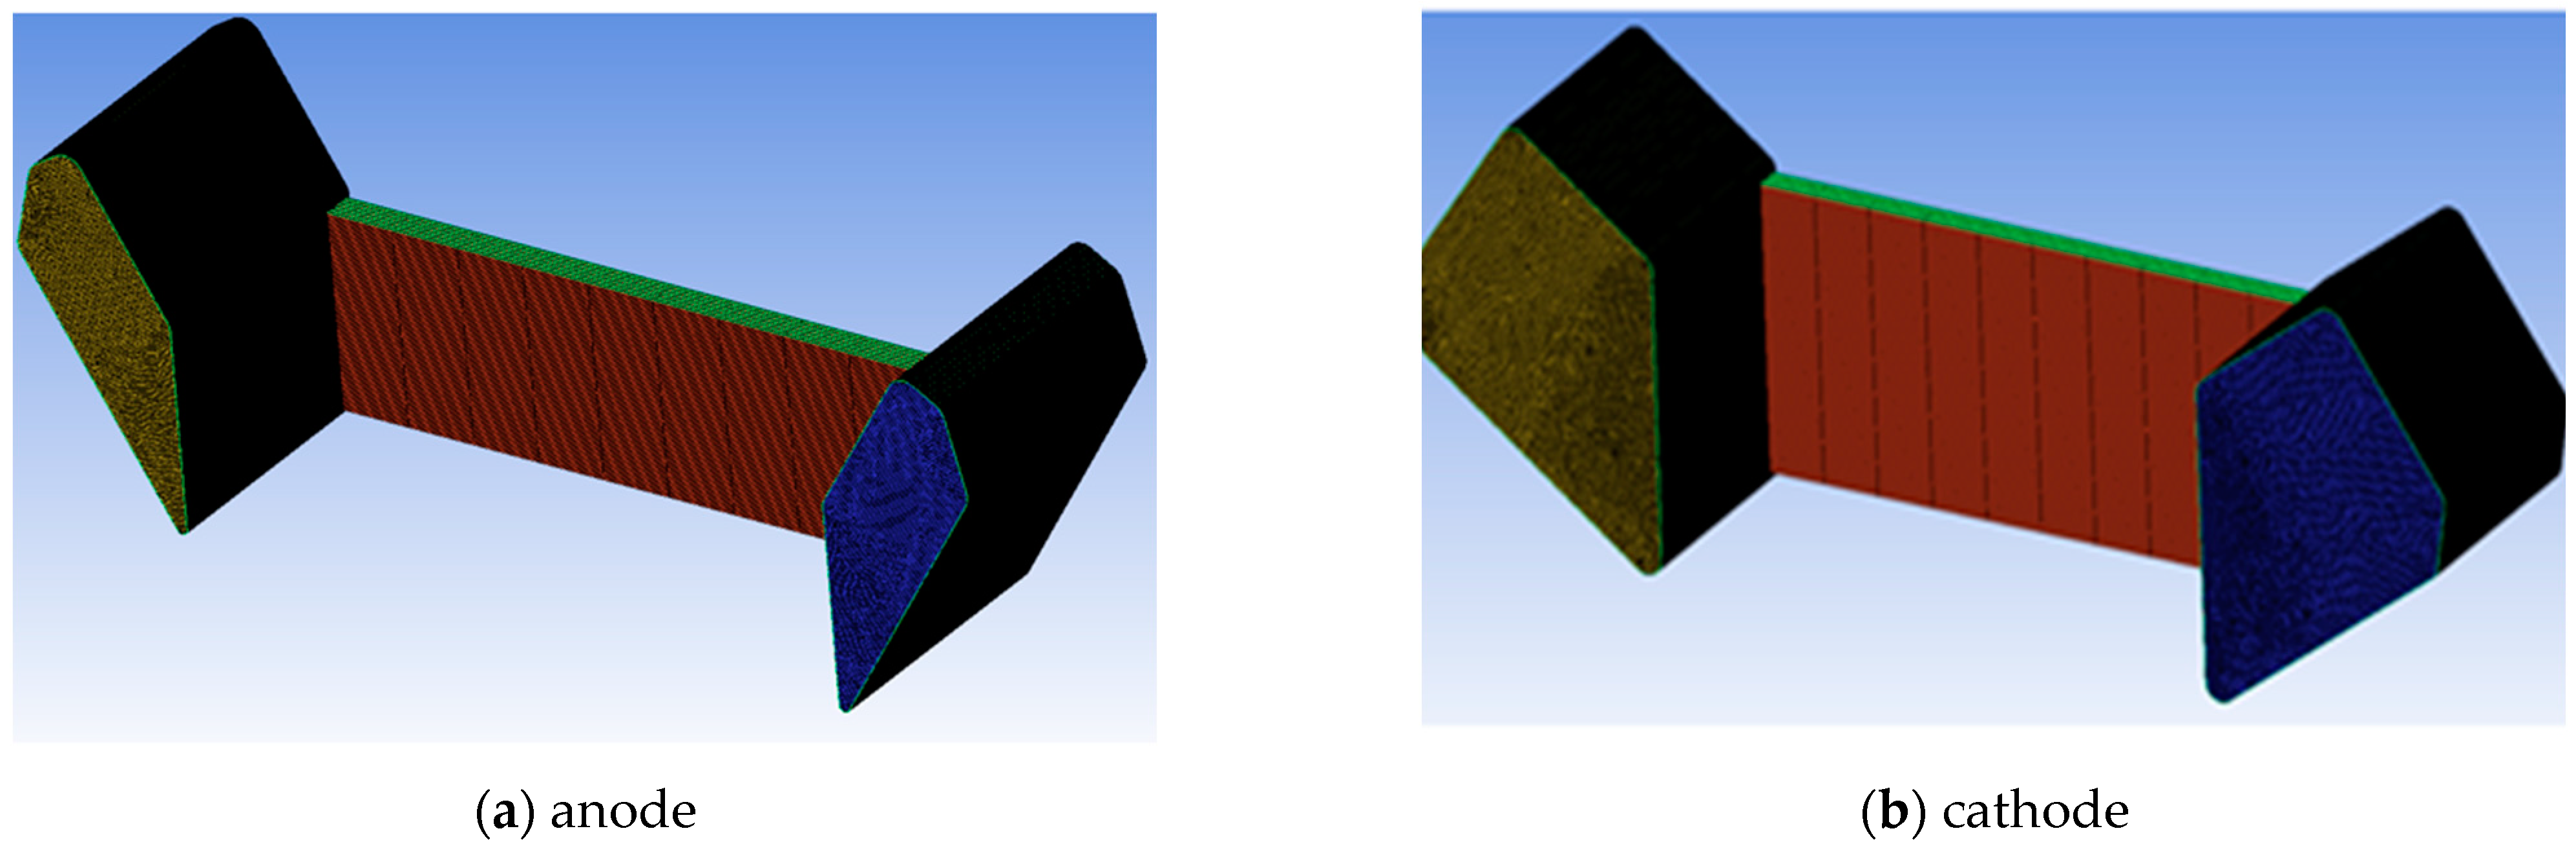
2.1.1. The FEA Model Considering of GDL Compression

Under the impact of the clamping force of the PEMFC stack, the MEA will be deformed, which will affect the porosity and permeability of GDL and the transportation of supplied fuels. To well consider the effect of the GDL deformation, a two-dimensional mechanical structural model is established. Because PEM and CL are smaller in thickness than GDL, the deformation of BPP and GDL is mainly considered. Considering the symmetry of the anode and cathode structure of PEMFC, the mechanical structure of the single-channel model is established as shown in Figure 2.
The BPP, GDL, CL, and PEM are translational repetitive structures, so symmetric constraints are applied to the boundary conditions on both sides of this model and fixed constraints are applied to the lower surface of PEM. Meanwhile, the displacement load is applied to the upper surface of BPP to simulate the clamping force. Considering the effect of temperature on material properties, the operating temperature of PEMFC is set at 80 °C.
The deformation of GDL can be obtained by the displacements of nodes on the upper and lower boundaries of GDL. The porosity of GDL will change with the thickness of GDL, so Equation (1) is described to obtain the spatial distribution of the GDL porosity according to the spatial distribution of the GDL deformation [33]:
ε = 1 1 ε 0 δ 0 δ
Wherein ε 0 is the initial GDL porosity; δ 0 is the initial GDL thickness; ε is the GDL porosity after compression; δ is the GDL thickness after compression. The permeability distribution is relied on and the porosity distribution in GDLs, so the spatial distribution of the permeability can be obtained according to the spatial distribution of the porosity, as is described in Equation (2) [34]:
κ = ε ( ε 0.037 ) 2.661 d f 2 7.8 ( ln ε ) 2 ( 1.661 ε 0.0037 ) 2
where, κ is the permeability; d f is the GDL fiber diameter.
After that, the porosity and permeability distributions of GDL can be uploaded into FLUENT® via UDF, which can provide an accurate simulation of the electrochemical performance of PEMFC considering the GDL compression.

2.1.2. The Electrochemical Performance Model of PEMFC

Based on the obtained porosity and permeability of GDL, a three-dimensional electrochemical performance model can be established. The number of nodes in the PEMFC single-channel model established is about 355,000 as shown in Figure 3.
To assess the grid independence, five different node quantities are used: 132,670, 203,804, 269,020, 355,000, and 425,512. At an operating voltage of 0.75 V, the current density of the electrochemical performance model of PEMFC is calculated for each node quantity. Figure 4 shows the current densities for the five different node quantities, which are 0.3552, 0.3689, 0.3771, 0.3830, and 0.3838 A/cm2, respectively. The difference in current density between the node quantities of 355,000 and 425,512 is only 0.21%, indicating a negligible variation. Considering both computational accuracy and performance, the electrochemical performance model of PEMFC with a node quantity of 355,000 is chosen for numerical simulation in this paper.
The electrochemical performance model of PEMFC is mainly composed of two reaction parts: one is the potential model in the electrode solid phase part, and the other one is the ion current model in the electrolyte phase part. The potential model is to describe the electron transport process in solid conductive materials, and the solution domains are CLs, GDLs, and BPPs. The ion current model is to describe the transport process of protons or ions and the solution domains are CLs and PEM.
In the electrochemical performance model, the inlet condition is set as mass-flow-inlet, while the outlet condition is specified as pressure-outlet, simulating the purge in the PEMFC engine system. In this system, the anode is composed of a mixture of hydrogen and water vapor, while the cathode consists of a mixture of oxygen, water vapor, and nitrogen to supply humidified fuels.
The total mass flow rate at the anode inlet is [9]:
m ˙ a n , i n = S H 2 i M H 2 2 F A a r e a + S H 2 i M H 2 O 2 F R H a P s a t , T a P a R H a P s a t , T a A a r e a
where, S H 2 is the hydrogen stoichiometric ratio; i is the current density; M H 2 is the molar mass of hydrogen; F is Faraday’s constant; A a r e a is the effective reaction area of the electrochemical reaction; M H 2 O is the molar mass of water vapor; R H a is the anode relative humidity; P s a t , T a is the saturated vapor pressure of water; P a is the inlet pressure of the anode.
The total mass flow rate at the cathode inlet is [9]:
m ˙ c a , i n = S O 2 i M O 2 4 F A a r e a + 0.79 0.21 S O 2 i M O 2 4 F A a r e a + S O 2 i M H 2 O 4 F R H c P s a t , T c 0.21 ( P c R H c P s a t , T c ) A a r e a
where, S O 2 is the stoichiometric ratio of oxygen and M O 2 is the molar mass of oxygen; R H c is the cathode relative humidity; P s a t , T c is the saturated vapor pressure of water at temperature; P c is the inlet pressure of the cathode.

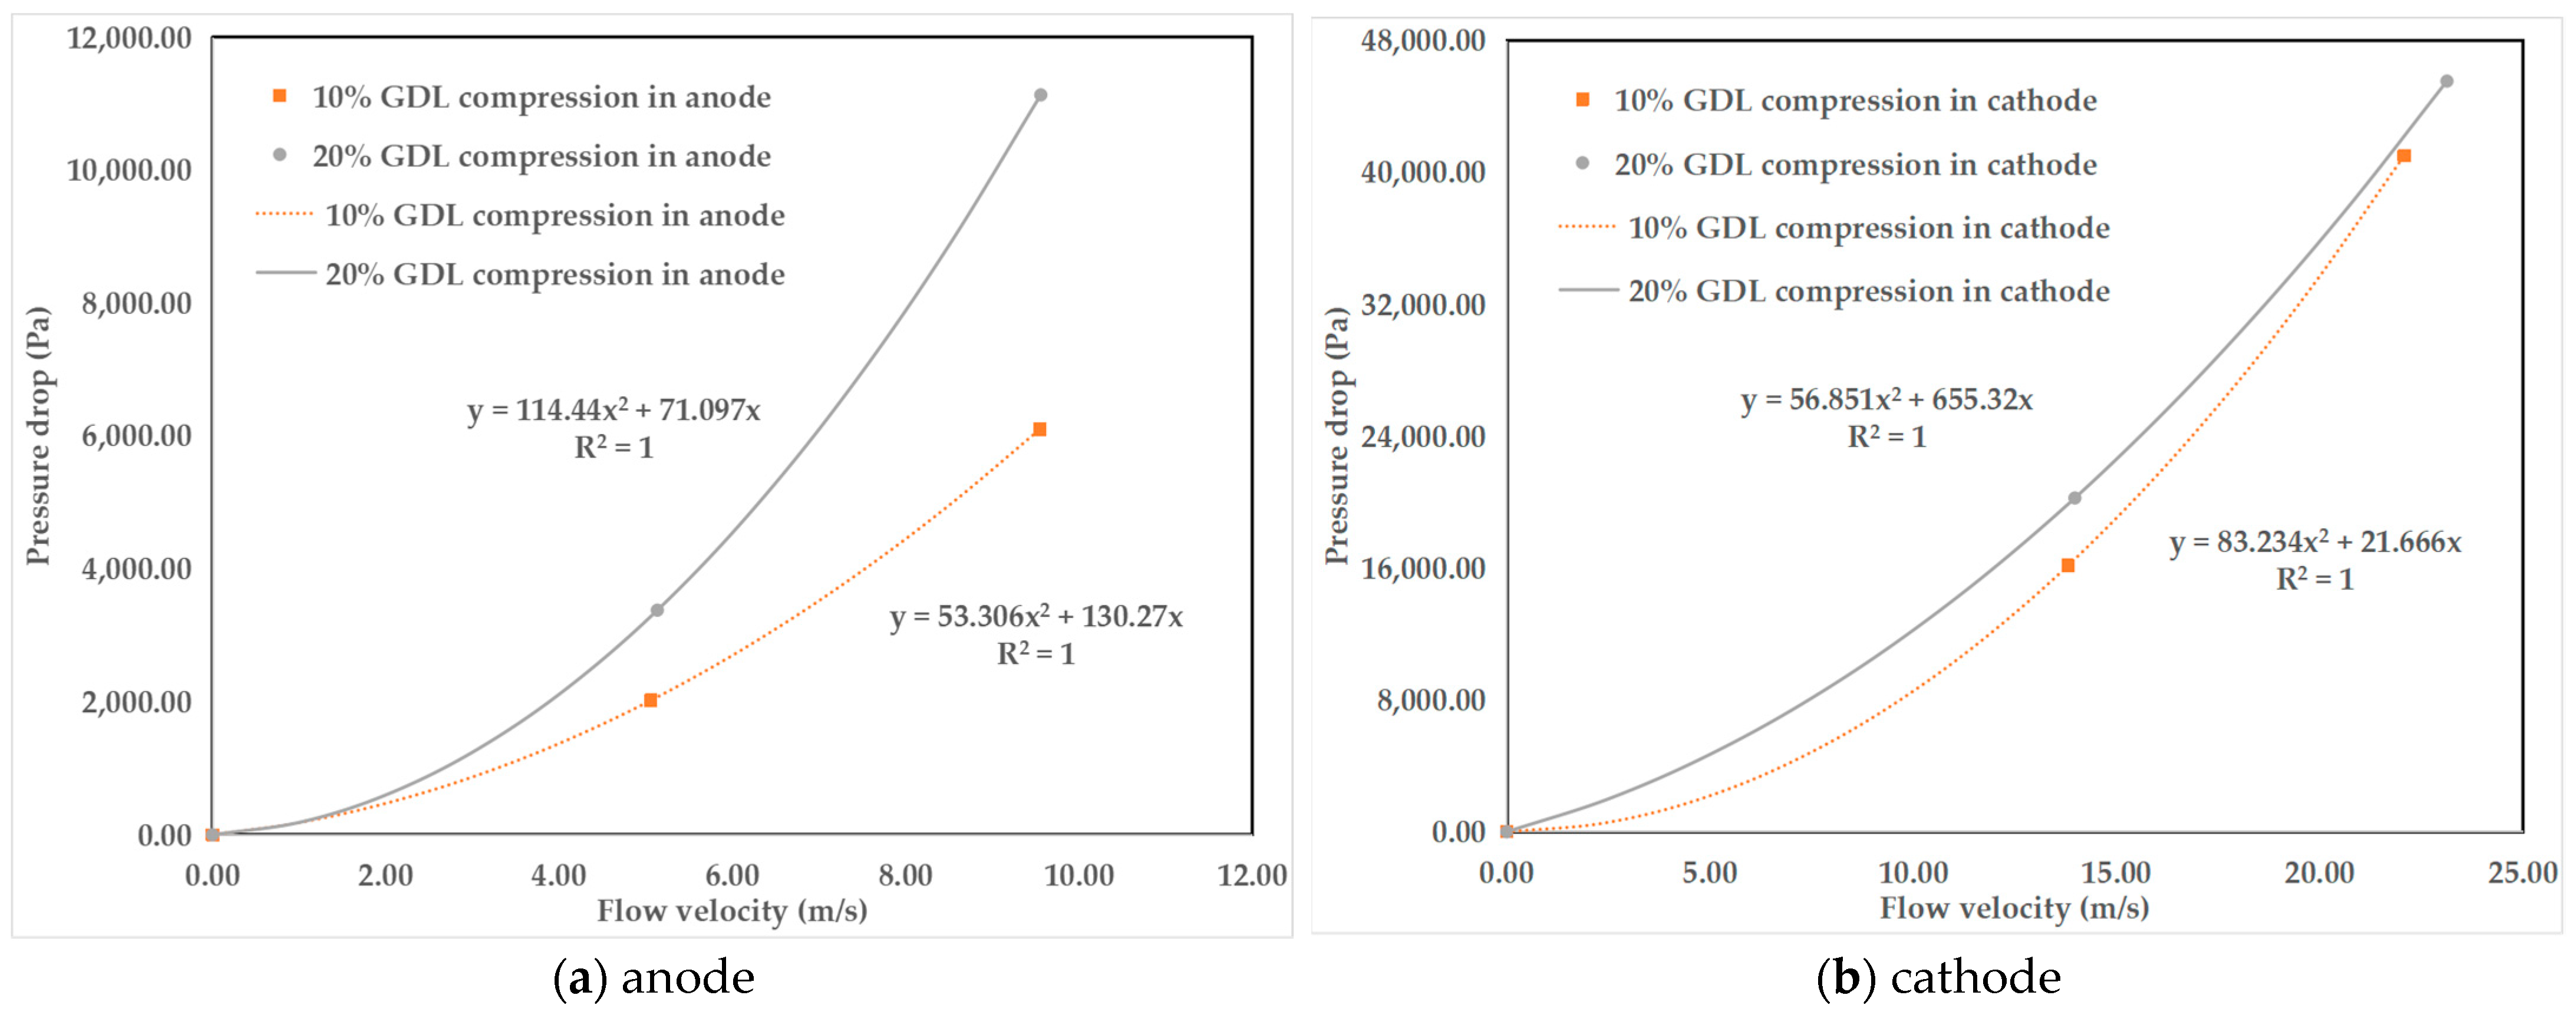
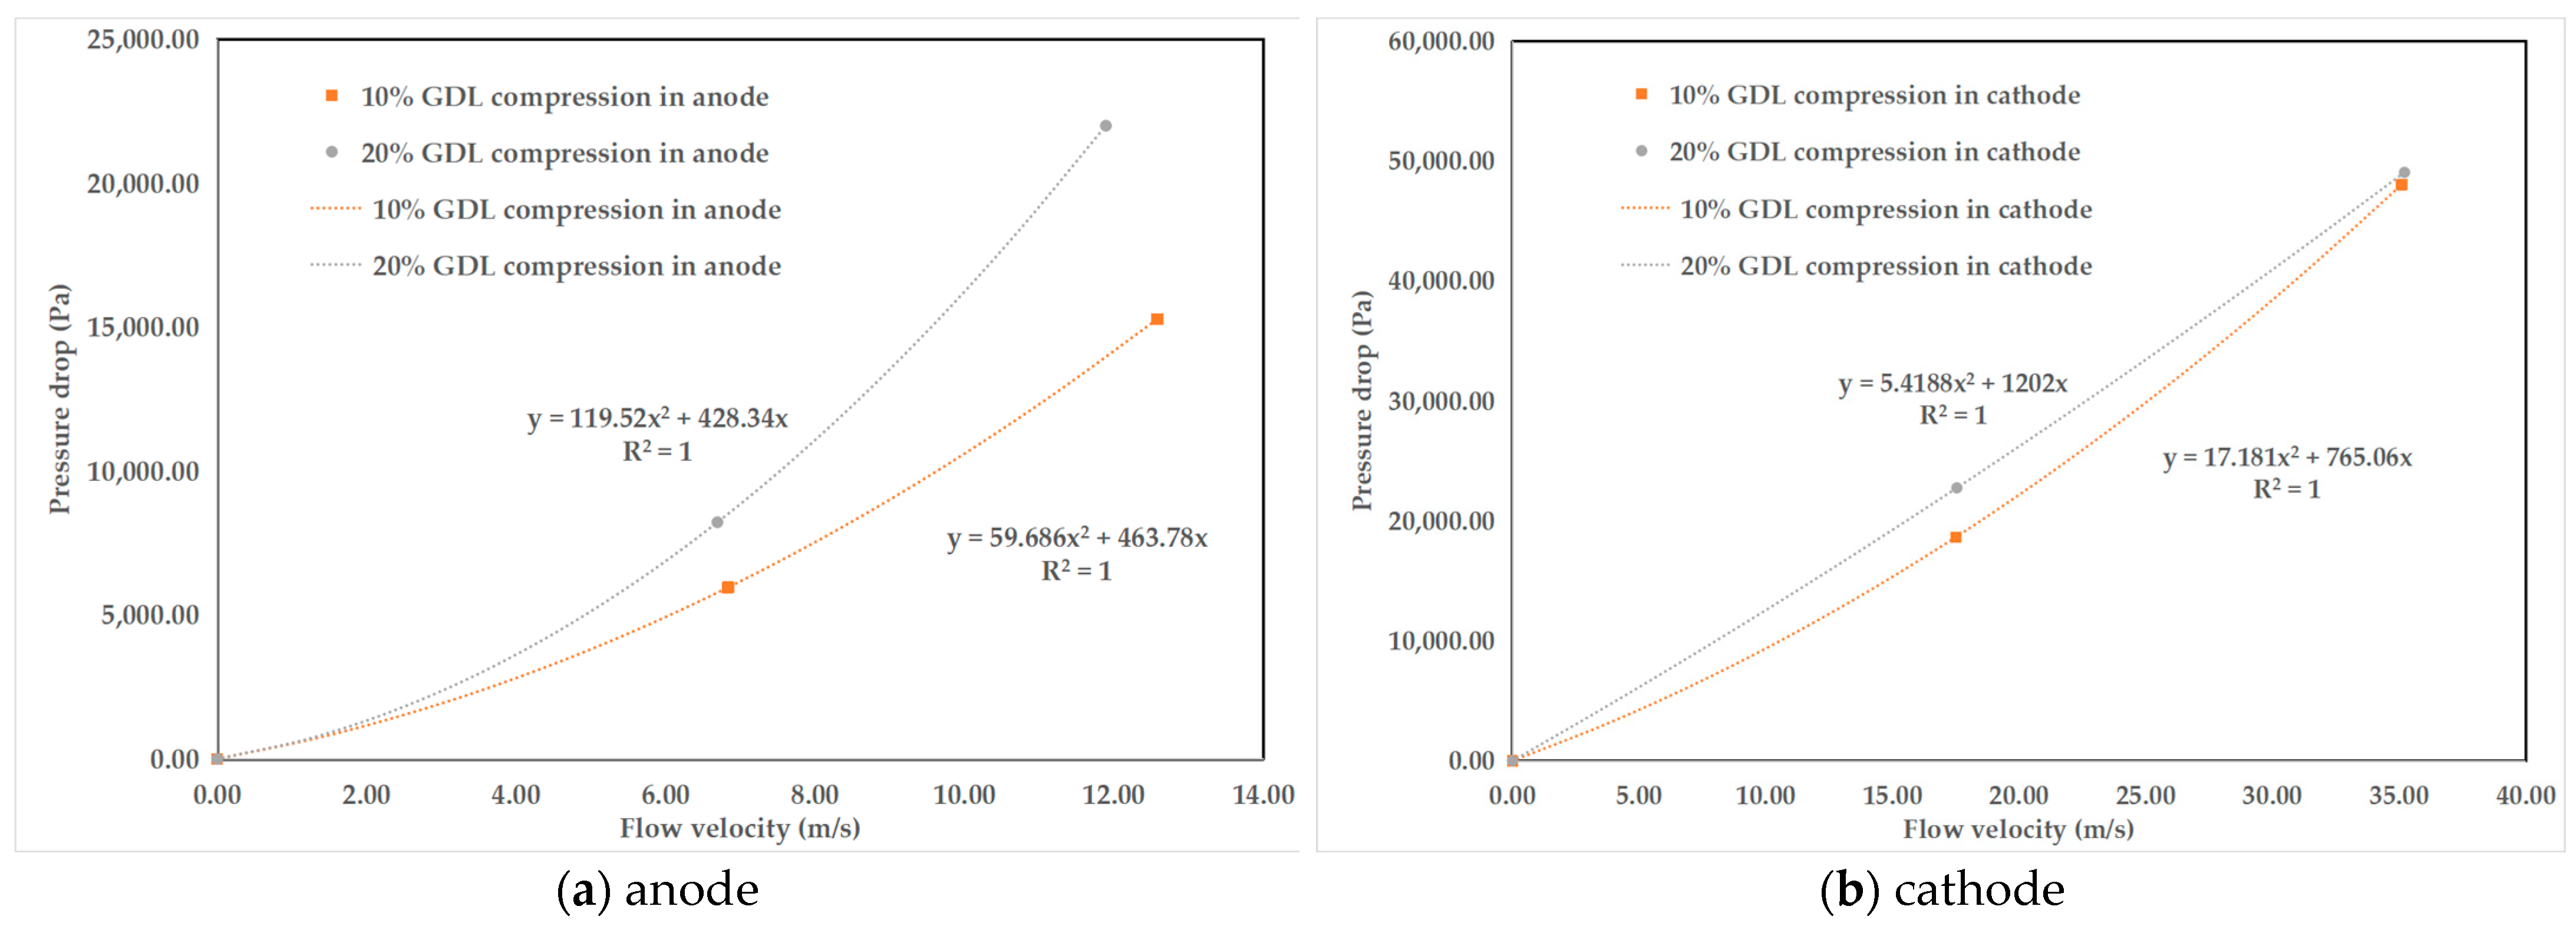
2.2. The Gas Distribution Model Based on Porous Media Theory

Considering of the full-power fuel cell vehicle with a large fuel cell stack of hundred kilowatts, due to the large dimensional size of the PEMFC stack, the pressure loss along the way of supply fuels and the local pressure loss at the manifolds of endplates are significant to be considered in the electrochemical performance prediction and optimization. And particular, this difference will result in a large uneven distribution in the internal flow channels of the PEMFC reaction area. Since the large scale of the FEA model can reach hundreds of millions of nodes and elements, the common calculation requires relatively more numerical resources and time. The porous media theory can simplify the complex flow field into a fluid region with a flow resistance source. The essence of the resistance source is a velocity-dependent momentum source term, and the flow field is assumed to be a uniform porous medium, so the formula can be written as [35]:
S i = μ α v i + C 2 1 2 ρ v v i
where, S i is the source term of momentum equation in a certain direction; μ is the gas viscosity coefficient; α is the permeability; C 2 is the inertial drag coefficient; ρ is the gas density; v is the total velocity value; v i is the velocity value in the same direction with S i . The first term on the right side of the equation is the viscosity loss term, and the second term is the inertial loss term.
On a macro scale, the effect of S i on the fluid flow direction produces a negative pressure gradient, which is shown below [35]:
p = S i Δ n
where, p is the differential pressure between the inlet and outlet of the porous media domain, Δ n is the length of the porous media domain.
To validate the porous media model and simulate the flow field distribution of the whole fuel cell, it is necessary to fit the inertial resistance coefficient and the viscous resistance coefficient. Based on Equations (5) and (6), the relationship between pressure and flow rate across the inlet and outlet needs to be expressed as a quadratic function. Subsequently, the viscous resistance coefficient and the inertial resistance coefficient can be computed using the following formula:
1 α = a 1 μ Δ n
C 2 = 2 a 2 ρ Δ n
where, a 1 and a 2 are the quadratic curve fitting coefficients.
The fitting parameters for the gas distribution model of a single cell are determined based on the results obtained from the simulation model of the PEMFC single channel. Conversely, the fitting parameters for the gas distribution model of the PEMFC stack are derived from fluid simulations of the gas distribution in a single cell. It is worth mentioning that the fitting parameters and simulations are performed independently for the anode and cathode flow fields.
The established gas distribution model of a single cell refers to the actual structure of BPPs in the PEMFC stack, as shown in Figure 5. The marked dotted area of a circle is the simulation area of the single-cell gas distribution model, which mainly includes the gas distribution area in the inlet, the middle parallel flow channel area, and the gas distribution area in the outlet. The marked area of a rectangle is the shape of the anode manifold corresponding to the inlet and outlet of the anode gas. The marked part of the square is the shape of the cathode manifold corresponding to the outlet and inlet of the cathode gas.
The boundary conditions in the model are as follows: the inlet is mass-flow-inlet, where the anode receives a mixture of hydrogen and water vapor, and the cathode receives humidified air; the outlet is pressure-outlet; non-slip fixed constraints are applied for other boundaries. The working conditions of the gas distribution model of the whole PEMFC stack are as follows in Table 3, which are consistent with the test conditions.
Through the gas distribution model of the whole PEMFC stack, different clamping forces on the GDL compression will affect the consistency of gas distribution under the current density of 2 A/cm2.

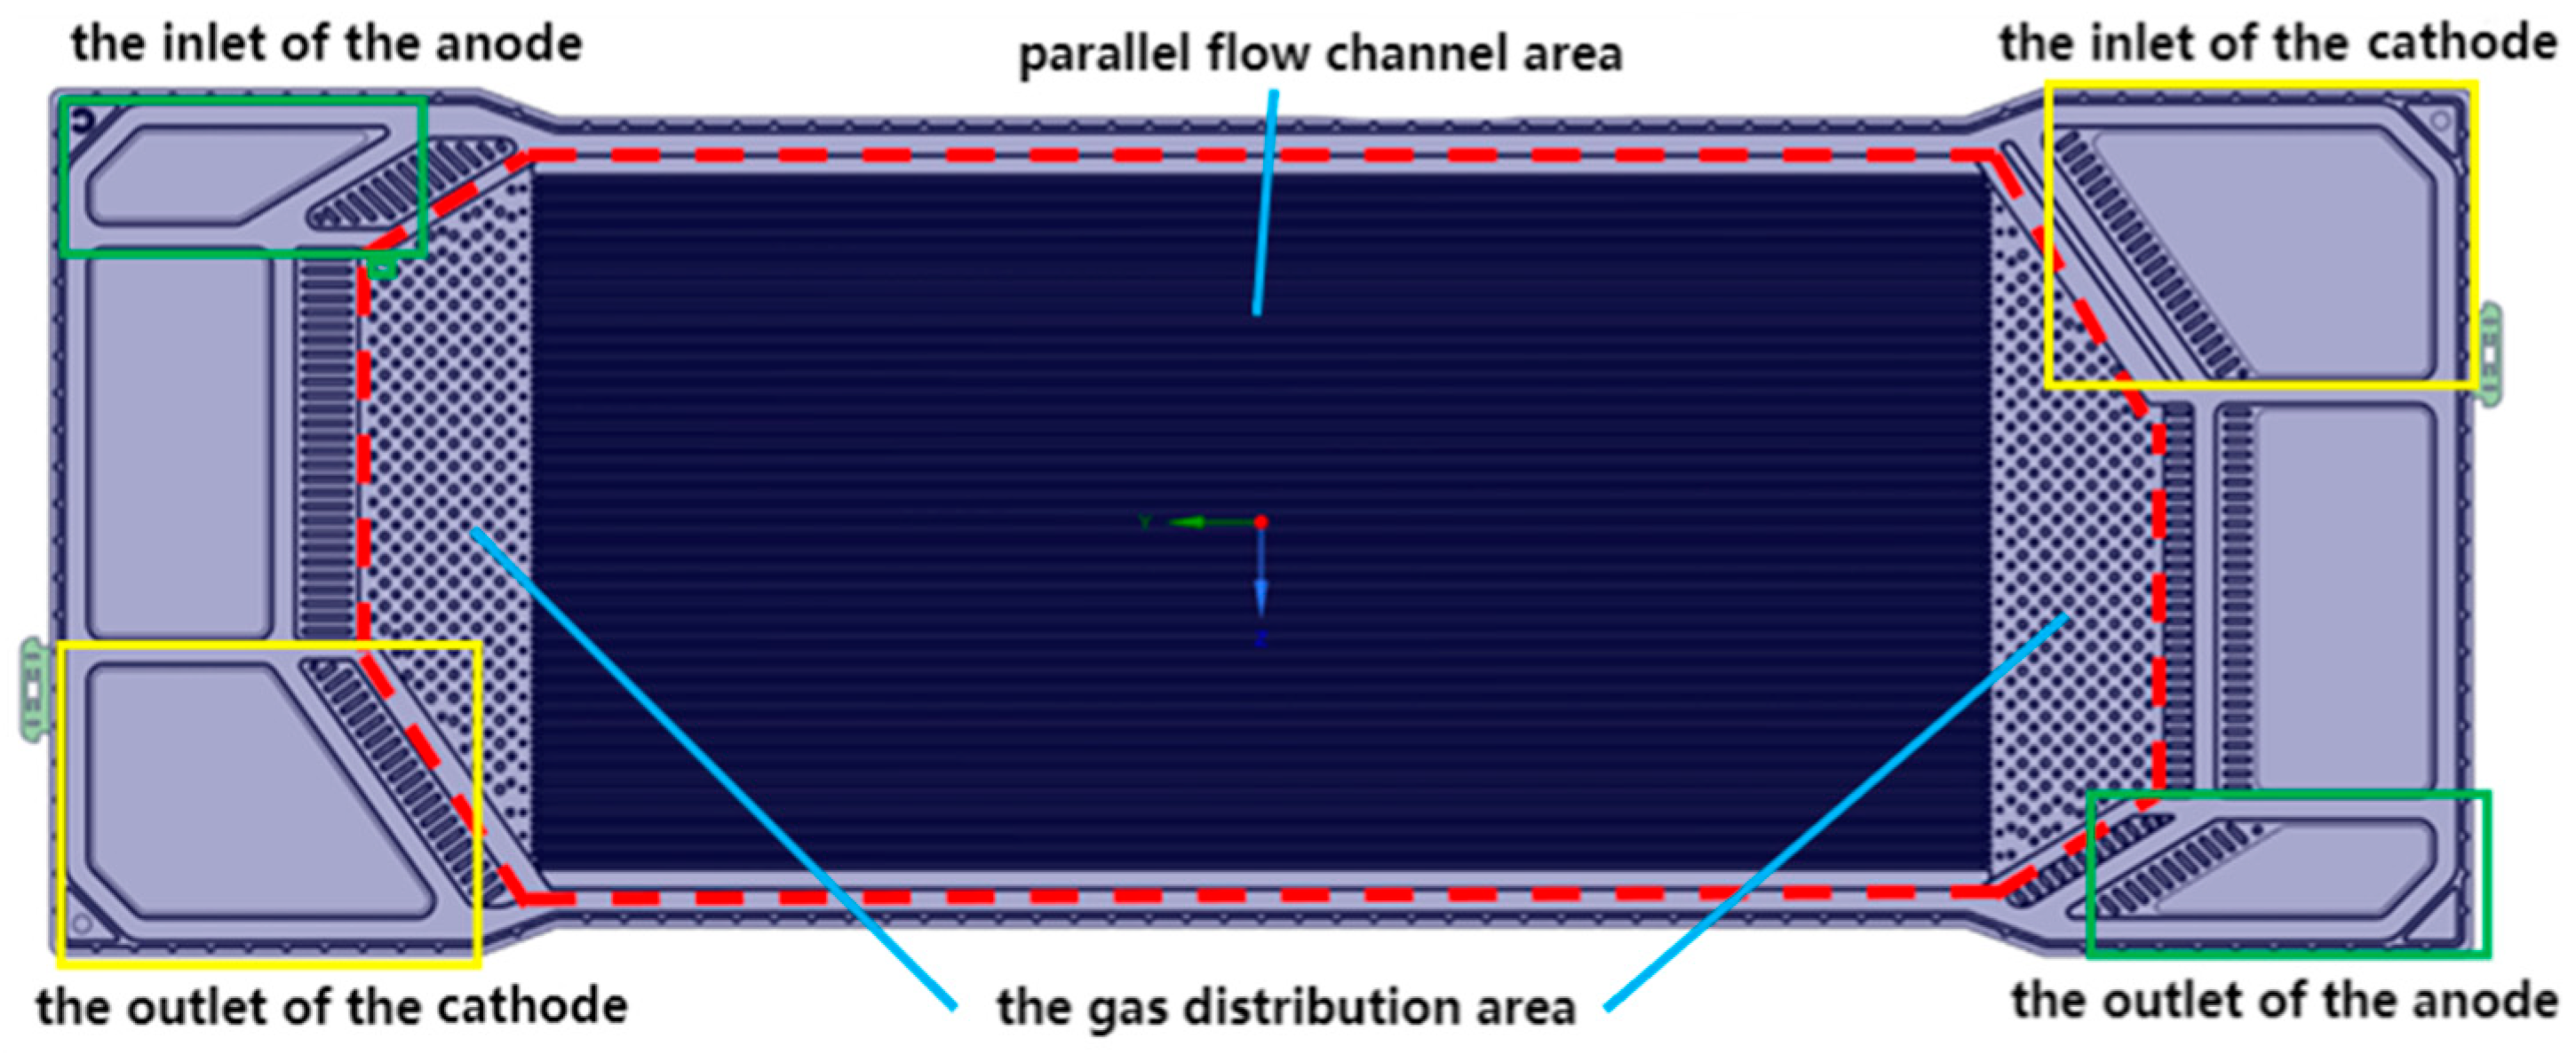
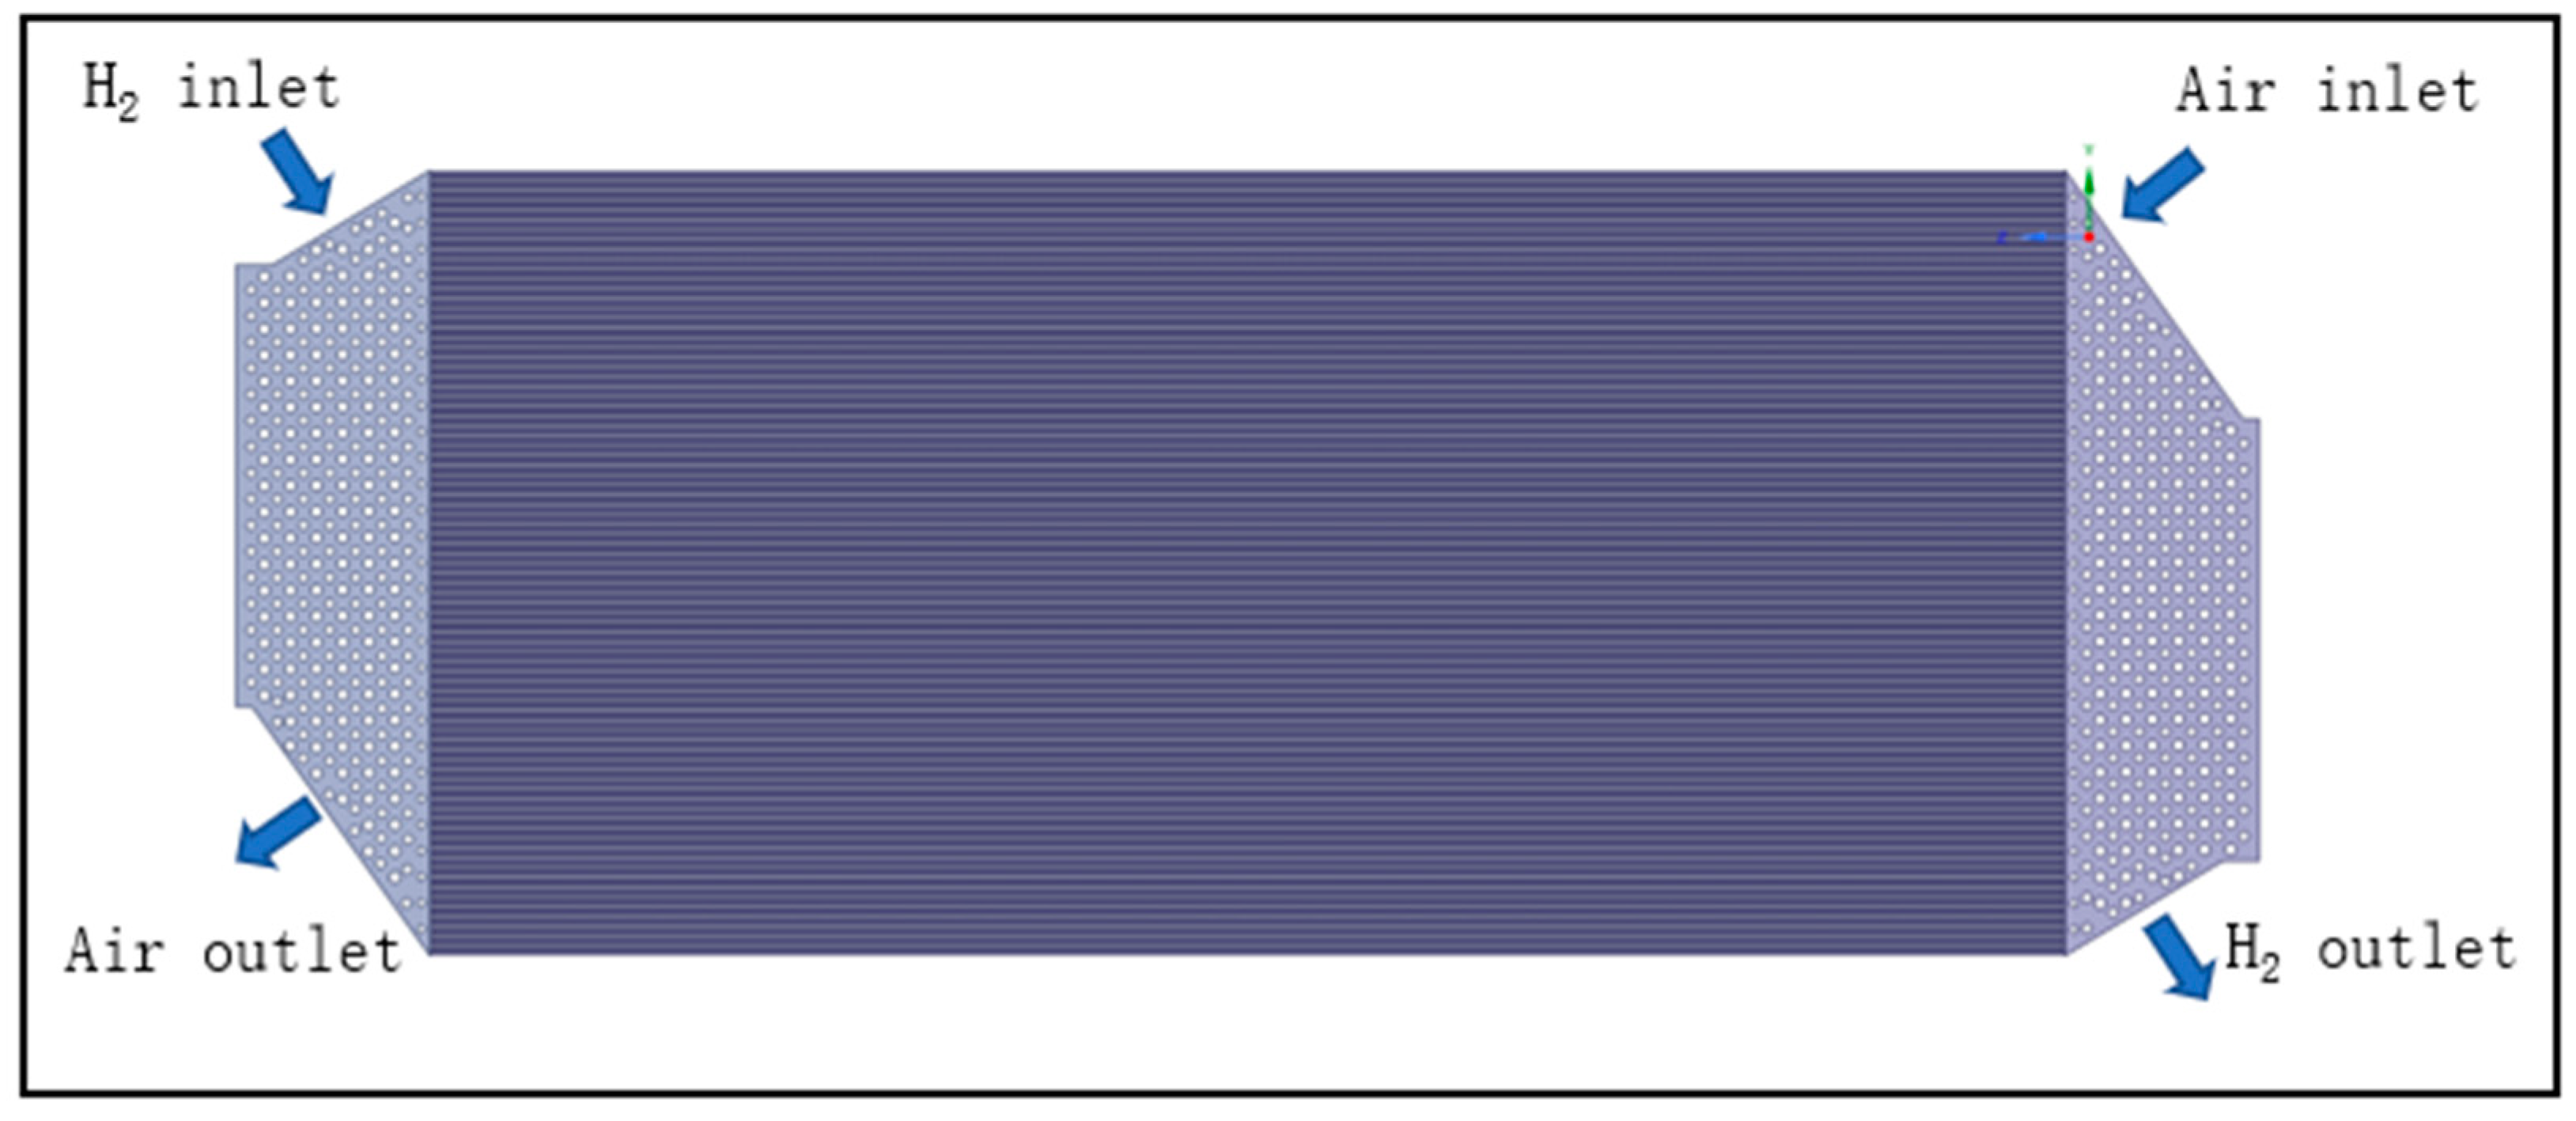
2.2.1. The Gas Distribution Model of Single Fuel Cell

According to Figure 5, a three-dimensional gas distribution model of a single cell is established as shown in Figure 6. The middle parallel flow field is composed of 80 straight channels and the area is 250 mm × 120 mm. At the same time, to present the gas distribution consistency under the action of clamping force, the compressed cross-section shape of GDL is implanted in each straight channel of the single cell.
The application area of the porous media model is each straight channel in the single-cell simulation model. To accurately represent the flow field characteristics of PEMFC considering mass and heat transfer, chemical reactions, and other factors during actual operation, it is essential to validate parameter fitting based on the results of the single channel model under various clamping forces. When the compression of GDL is 10% and 20% respectively, different pressure and flow rates for the anode and cathode are fitted as the results shown in Figure 7. The calculation results of the inertial resistance coefficient and the viscous resistance coefficient are shown in Table 4.
The single-cell gas distribution model can provide the gas flow velocity distribution in the anode and cathode flow fields under different operating conditions and clamping forces.

2.2.2. The Gas Distribution Model of Fuel Cell Stack

The continuous power output of a fuel cell vehicle requires a large number of single cells in the fuel cell stack. This necessitates a high level of consistency in the distribution of reaction gas among these single cells. In this regard, the manifold plays a crucial role in facilitating gas distribution among the inlets of single cells in the stack. Consequently, a study is conducted to examine the impact of the manifold on the consistency of gas distribution throughout the fuel cell stack, building upon the findings from single-cell gas distribution analysis. The results of this study provide valuable insights into the optimal design of the manifold, offering important directions for its design optimization.
In the context of a full-dimensional PEMFC stack, separate gas distribution models were developed for the anode and cathode gas, as depicted in Figure 8. This distinction arises from the differences in the manifolds employed for the anode and cathode. The gas distribution model for the PEMFC stack incorporates porous media within each single cell. Similarly, by utilizing the simulation results of gas distribution in a single cell, the data on different pressures and flow rates for the anode and cathode were extracted for validation purposes at GDL compressions of 10% and 20%. The corresponding fitted curves can be observed in Figure 9, while the resistance coefficients are presented in Table 5.

3. Optimization and Validation of the Electrochemical Performance Model

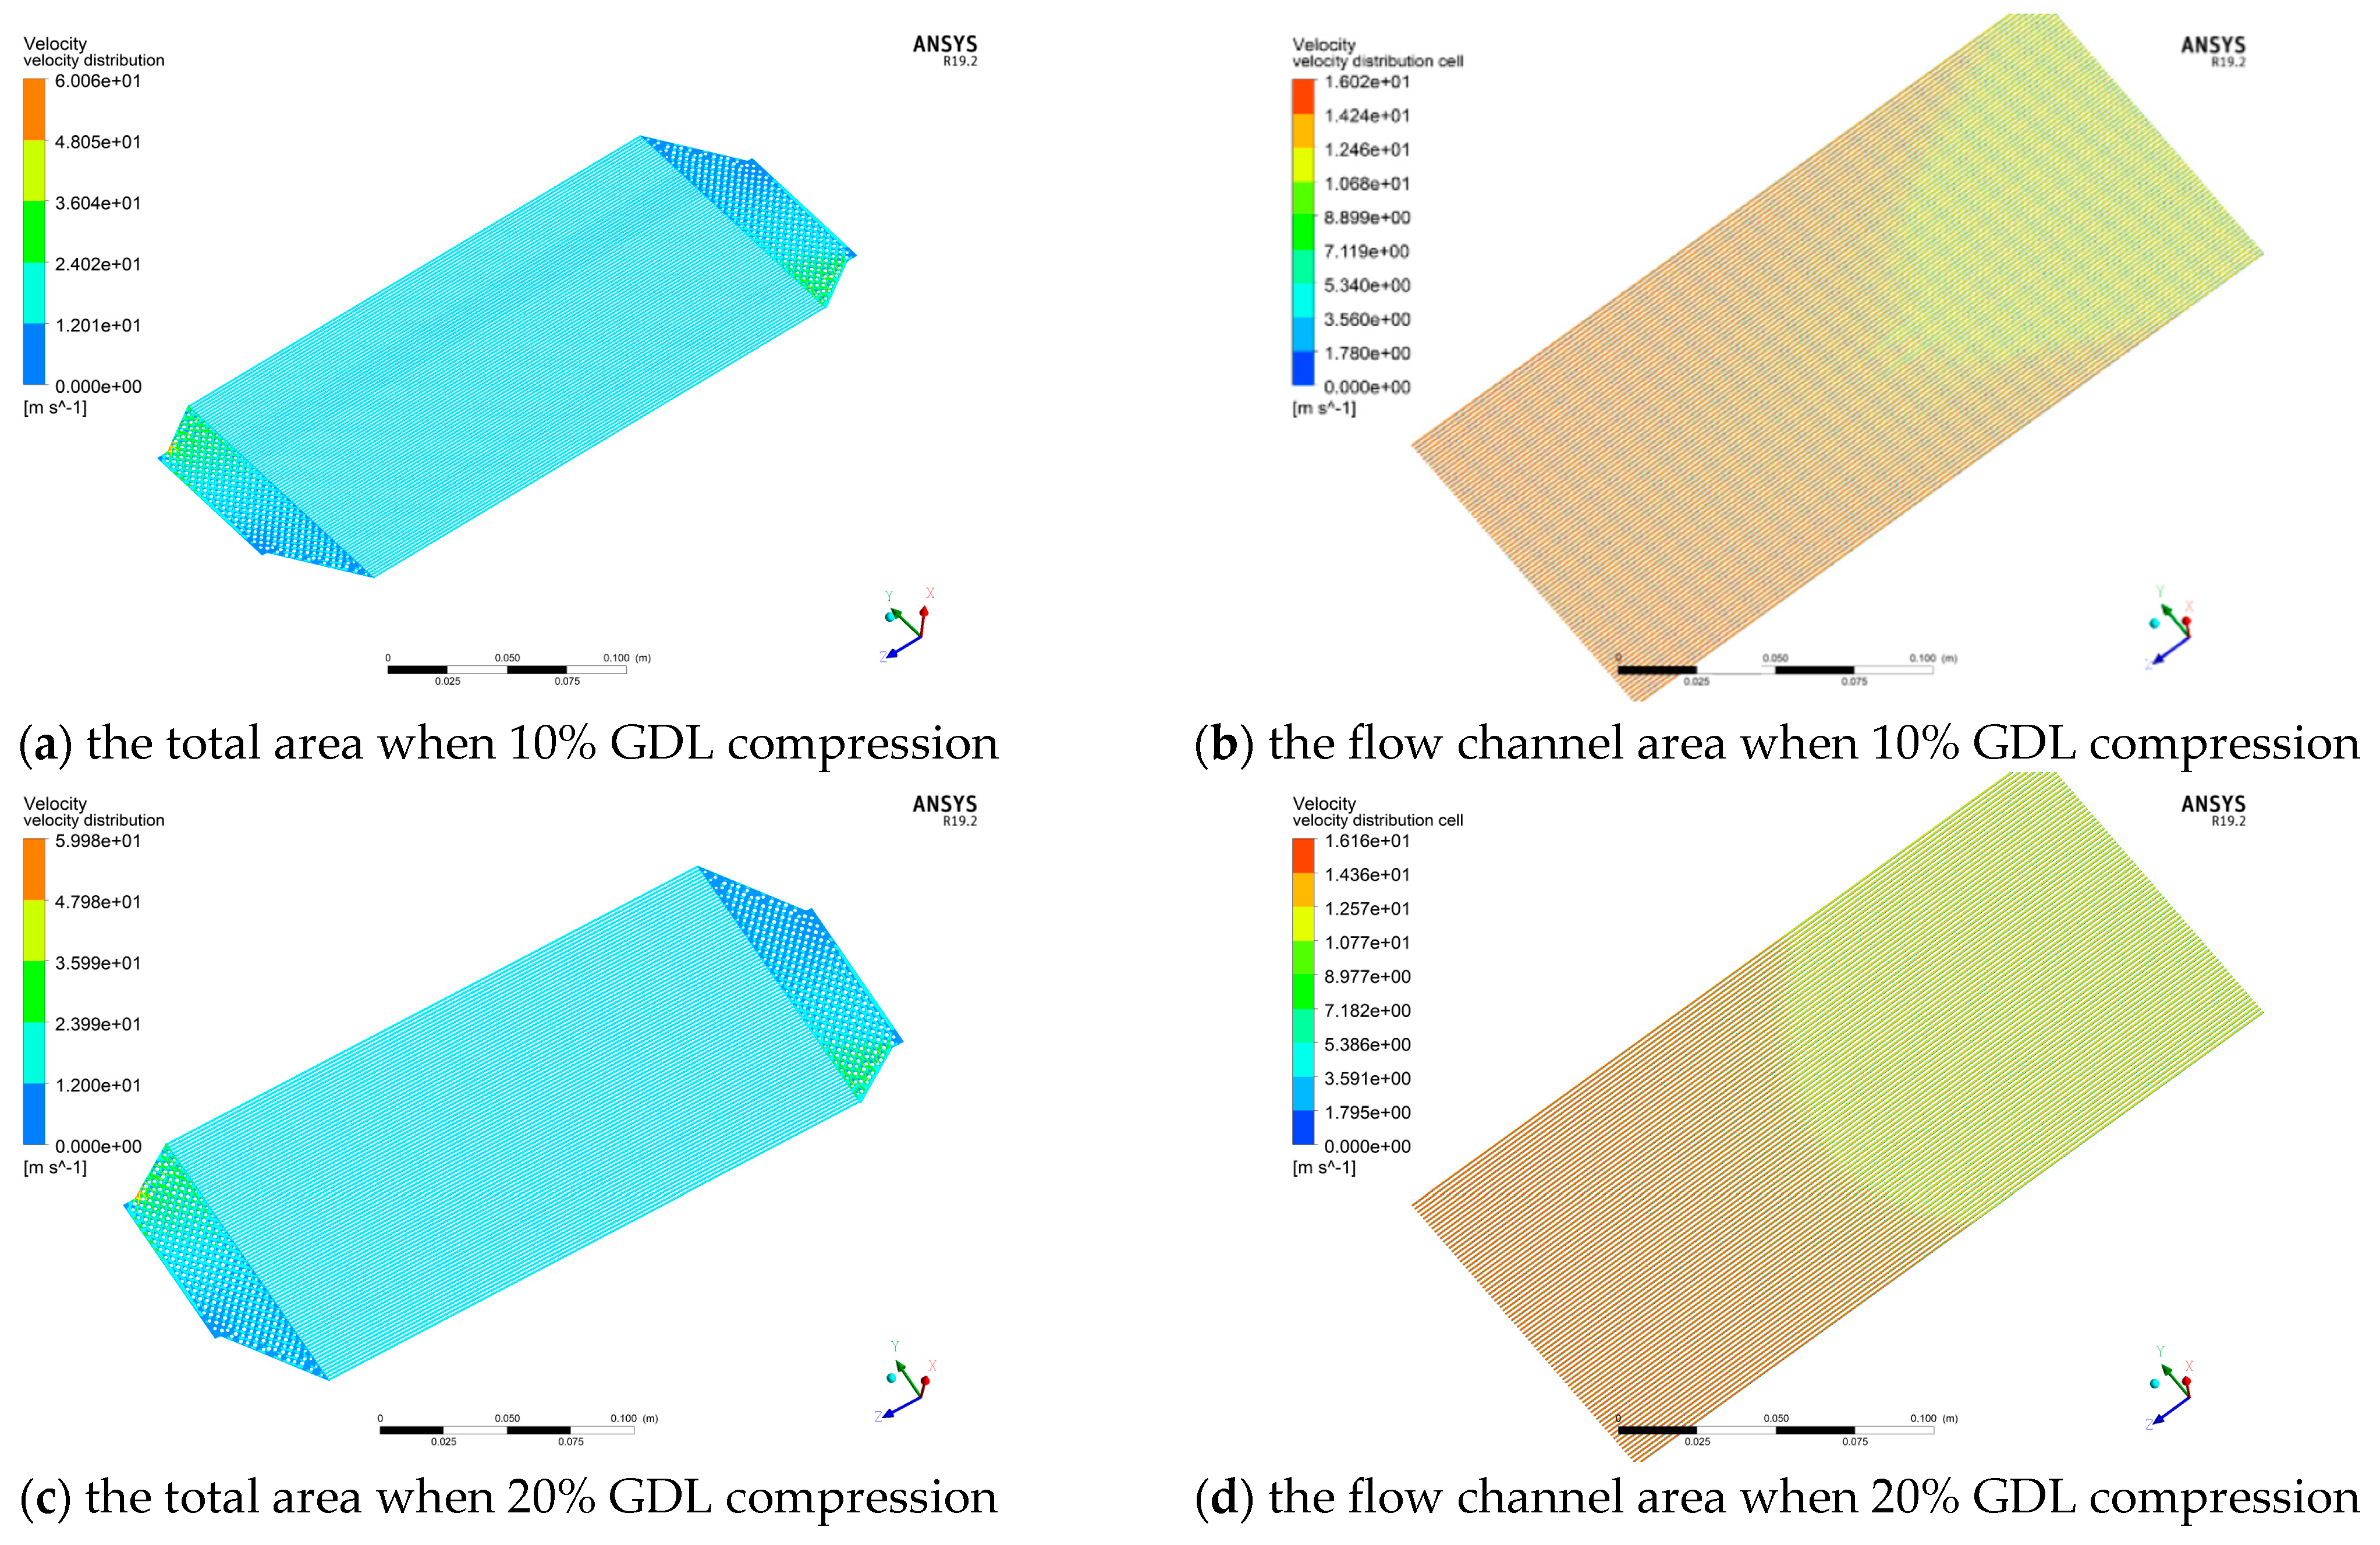
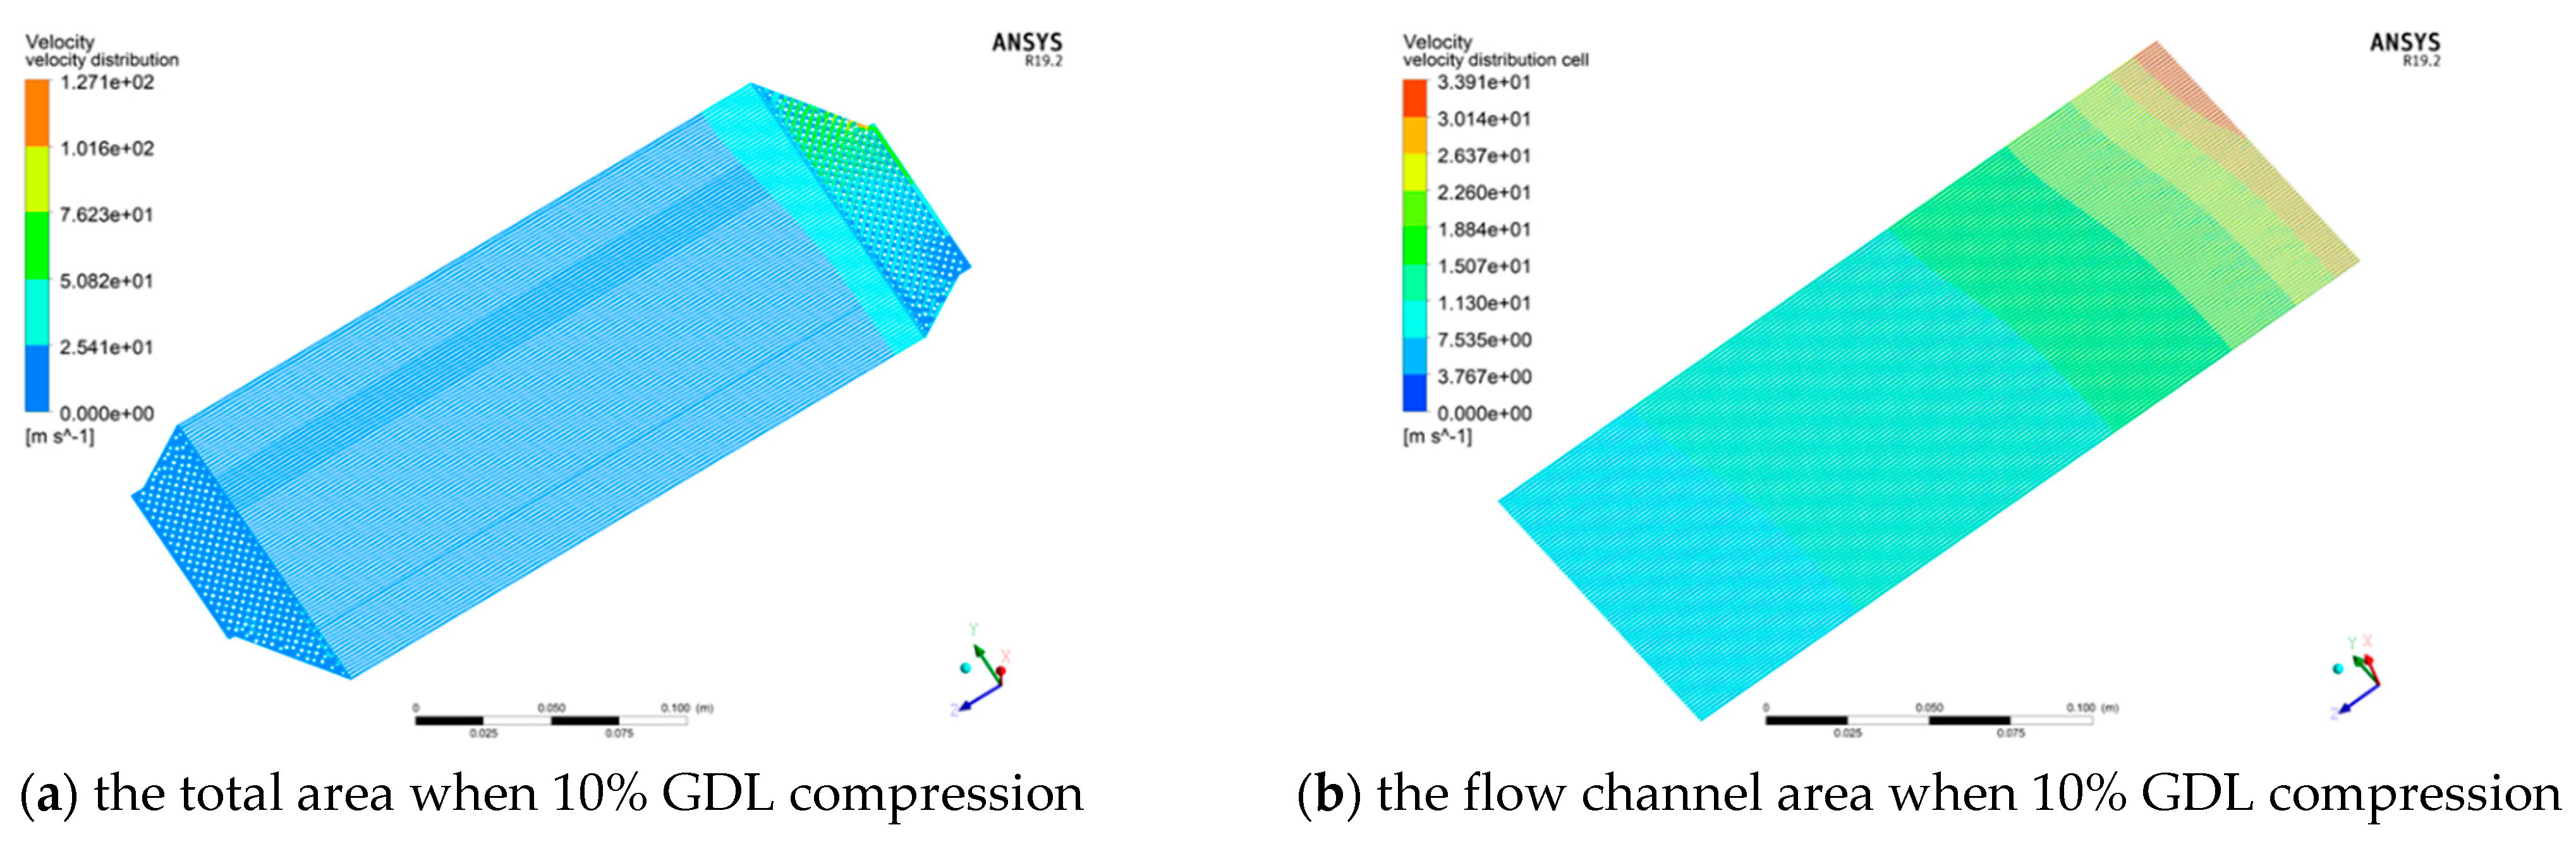
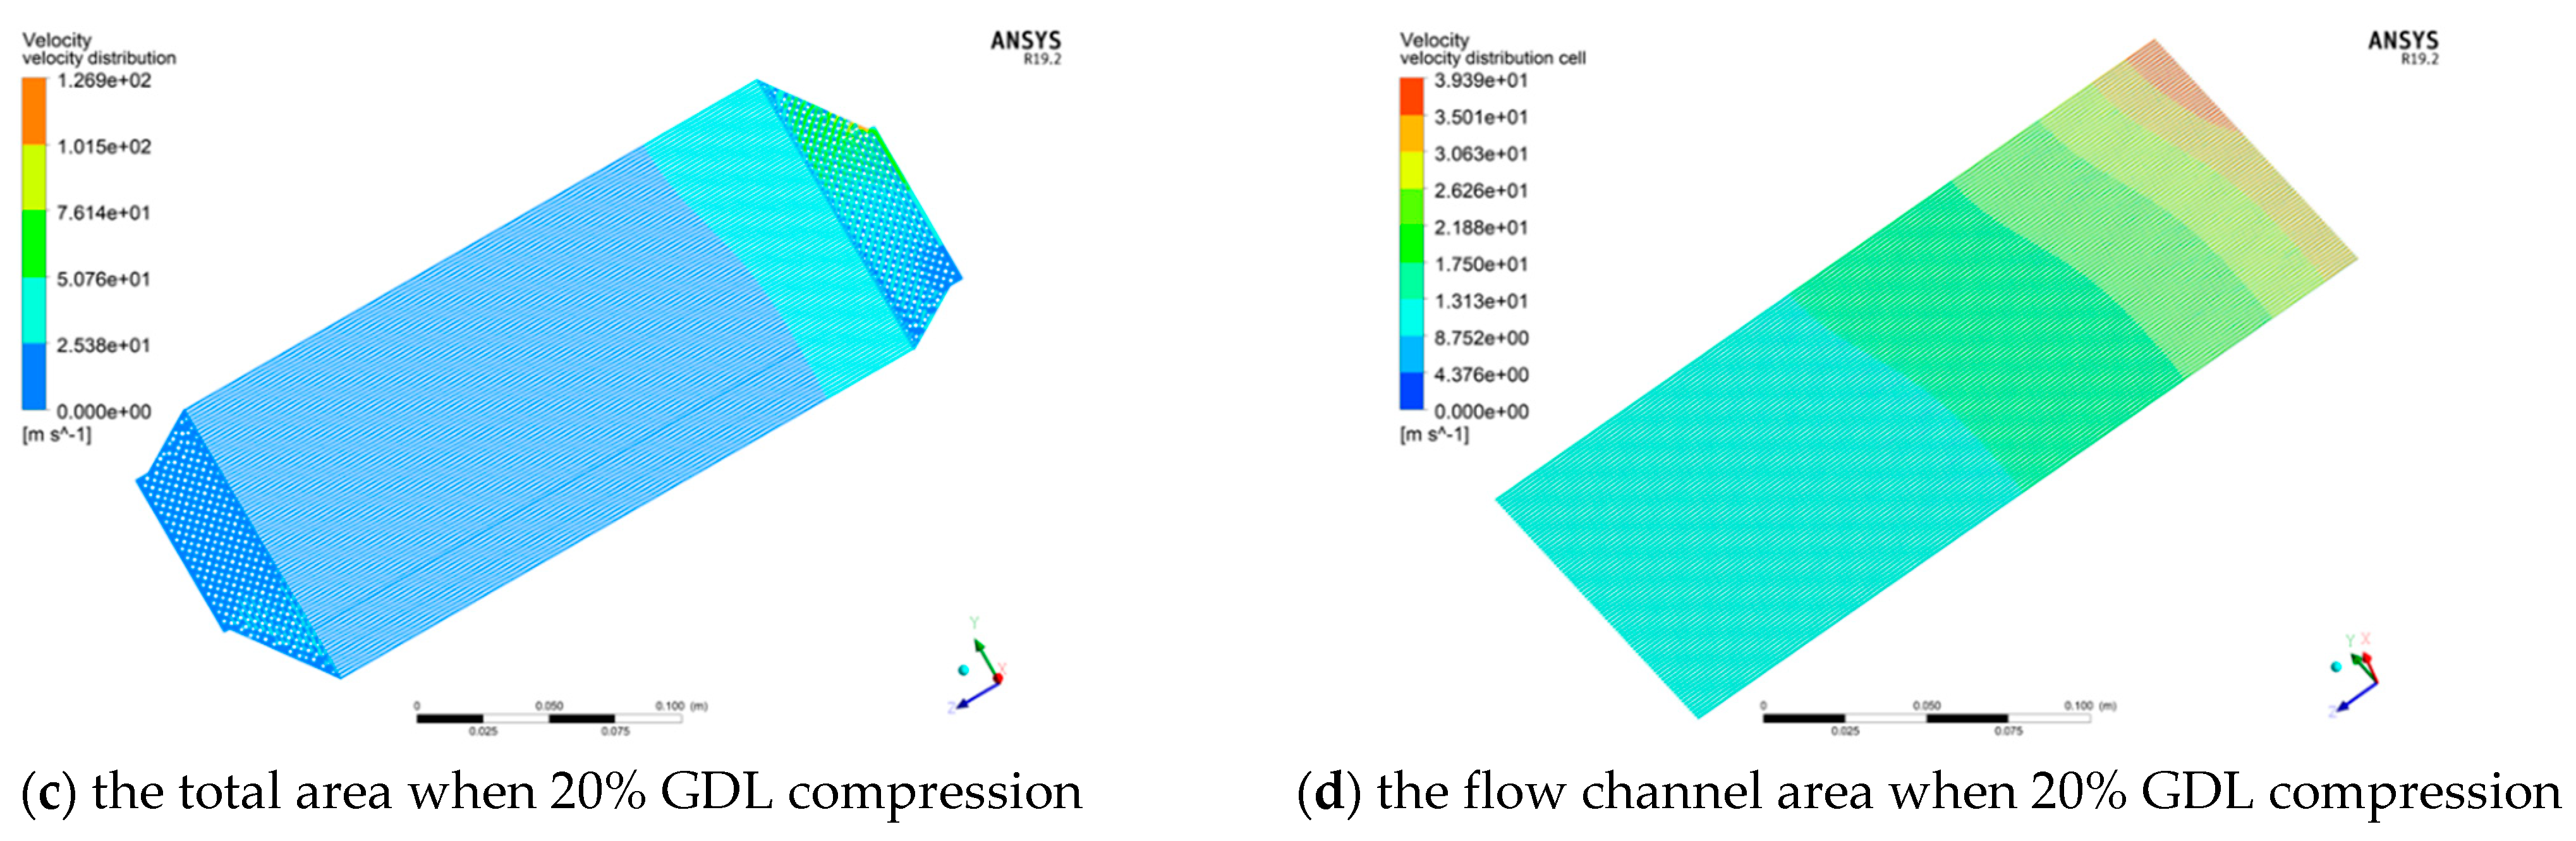
3.1. The Analysis of Gas Distribution in a Single Fuel Cell

Through the gas distribution model of the single cell, the flow velocity of gas distribution in anode flow field under 10% and 20% of GDL compression at 2 A/cm2 can be obtained, as shown in Figure 10. It can be seen that in the gas distribution area on both sides, the local peak value appears in the area near the inlet and outlet, indicating that the circular hole structure installed in the gas distribution area has effectively provided buffering capabilities. In terms of gas distribution in the middle parallel flow channel area, it is observed that high flow velocity exists on both sides, while low flow velocity is present in the middle of the flow channel. This pattern corresponds to high gas flow velocity at the inlet and outlet, indicating that gas flowing diagonally in the flow channel area can enhance the uniformity of gas distribution. In addition, with an increase in clamping force, the disparity in gas flow rate between side channels and middle channels decrease slightly. This indicates that increasing the clamping force appropriately can minimize the flow disparity among different channels in a single cell, consequently enhancing the consistency of gas distribution.
Similarly, the flow velocity of gas distribution in the cathode flow field under 10% and 20% of GDL compression at 2 A/cm2 can be obtained, as shown in Figure 11. Different from the anode flow field, it is evident that the flow velocity is faster in the channel near the cathode inlet in the cathode flow field.
Since the center of each flow channel is an important position to evaluate the gas distribution quality, the flow velocity distribution at the center of all the flow channels is shown in Figure 12, which conforms to the trend shown in Figure 10 and Figure 11. The flow velocity of all the flow channels is almost constant which indicates that the gas distribution is enough uniform. However, the flow velocity in the center of the flow channel near both sides is higher, while the flow velocity in the middle is relatively lower. There is a 5% difference between the maximum and minimum speeds of various flow channels in the anode flow field under 10% GDL compression.
In addition, for different GDL compression, it can be seen from the proportional curves in Figure 12 that the difference among flow channels with 20% GDL compression is significantly smaller than that with 10% GDL compression, which further indicates that high GDL compression is better to gas distribution consistency for all the flow channels. For the anode flow field velocity, the maximum variance of 20% GDL compression is 8.13 × 10⁻⁵ and that of 10% GDL compression is 1.48 × 10⁻⁴.

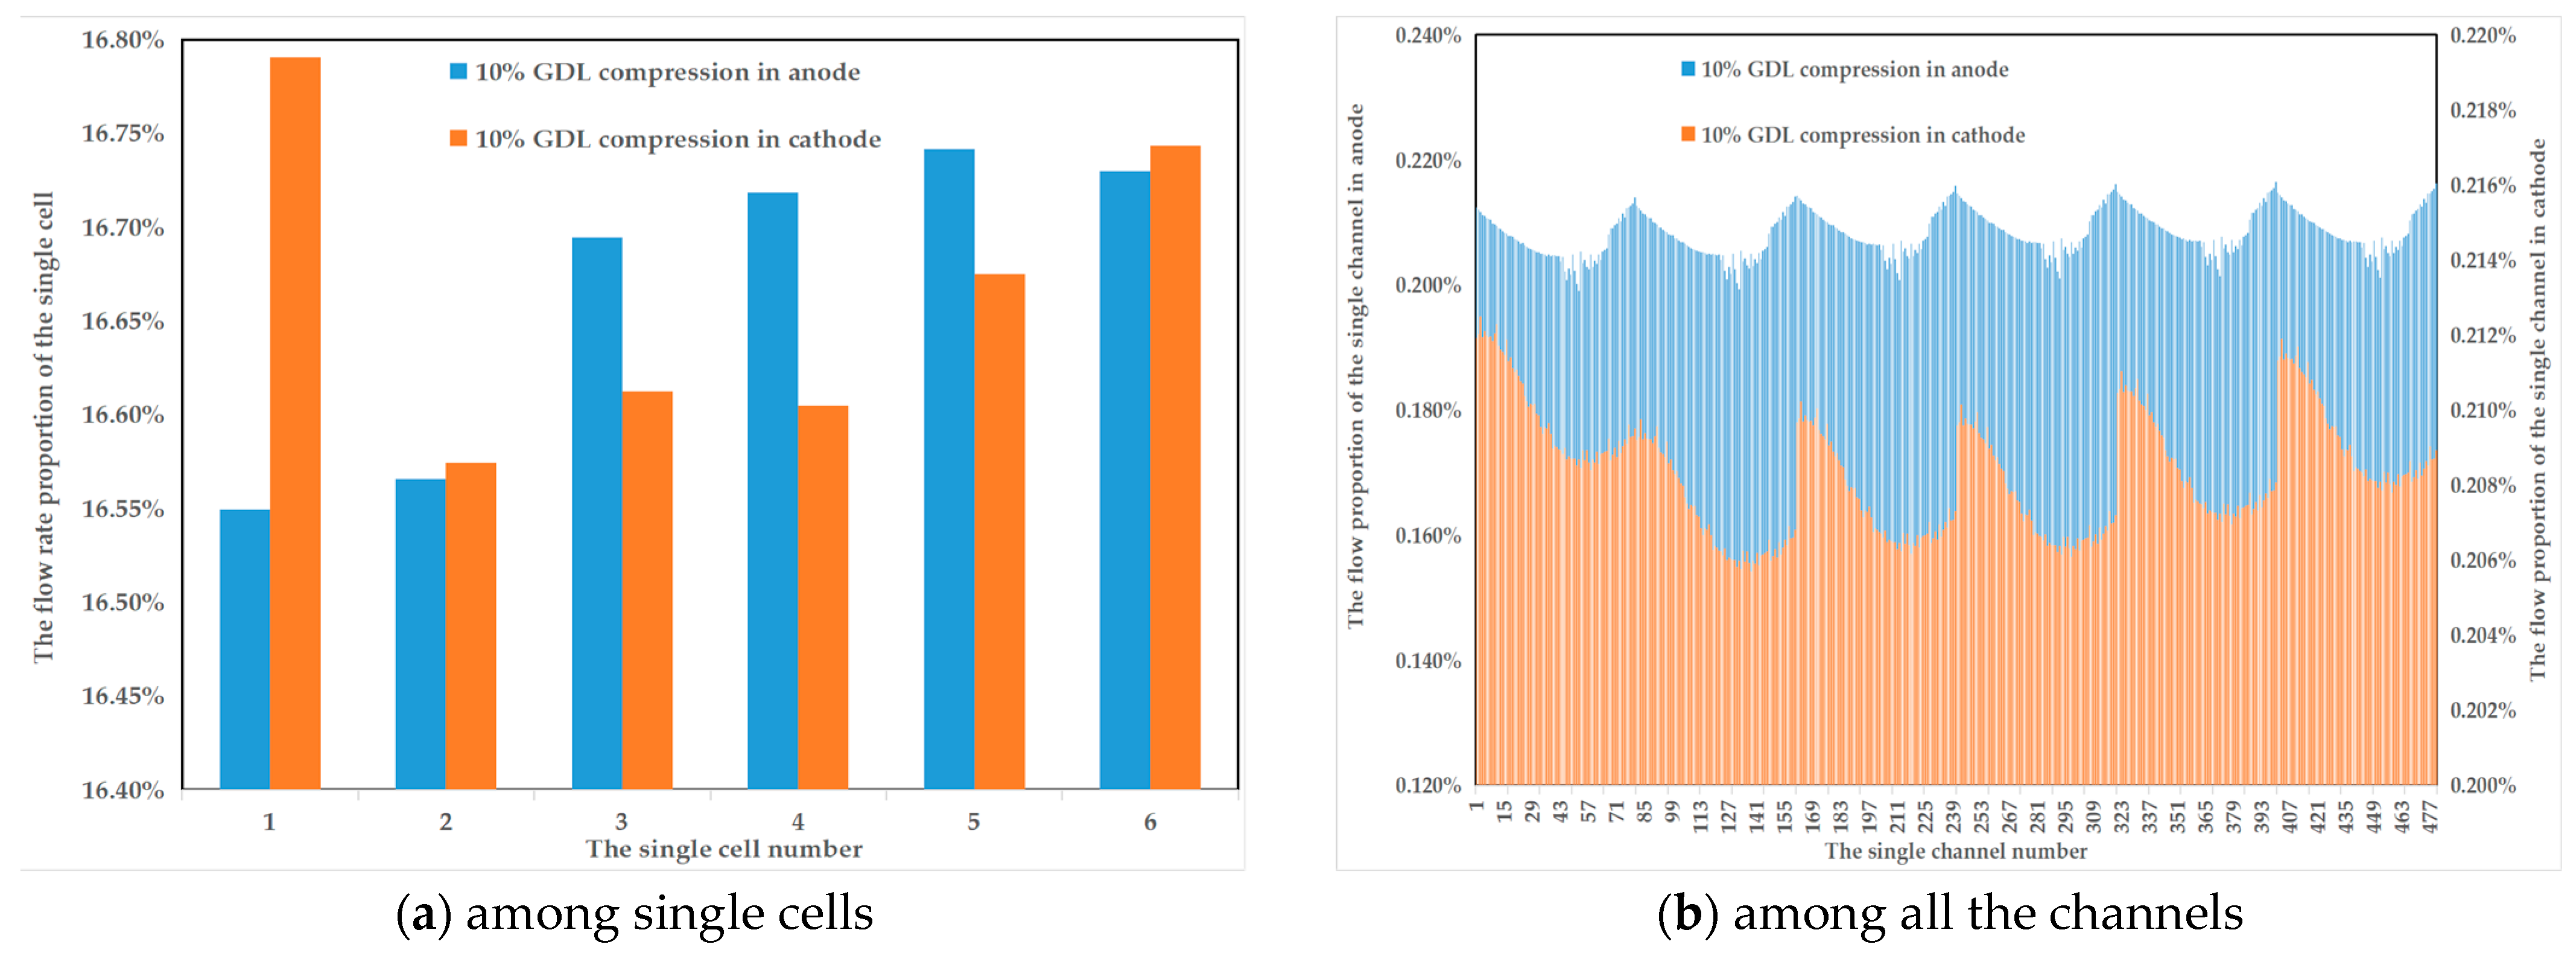
3.2. The Gas Distribution of Fuel Cell Stack

Since the gas flow distribution of all flow channels in a single cell is different, the gas flow distribution status is necessary to be considered in the electrochemical performance model for an accurate prediction. Based on the gas flow distribution results of the single cell model and the PEMFC stack model, the flow distribution ratio of all flow channels in the PEMFC stack can be extracted. According to the total flow rate of the inlet in the stack and the flow distribution ratio of all flow channels, the inlet mass flow rate of each channel in the PEMFC stack can be obtained.
Considering 10% GDL compression and 0.1 A/cm2 as a practical case, the gas flow distribution of a PEMFC stack with 6 cells can be obtained by the gas distribution model, as shown in Figure 13.
Based on the results depicted in Figure 13a, which illustrates the gas flow distribution among single cells in a PEMFC stack with 6 cells, this information can be utilized as the inlet condition for the single-cell gas flow distribution model. By applying these data, the flow distribution among all channels can be obtained, as demonstrated in Figure 13b. As is shown in Figure 13, it is evident that the flow rate in different channels of the PEMFC stack is not consistent. Similarly, by following the aforementioned steps, it can be determined that the flow rate distribution of all channels in the stack is under different clamping forces and various current densities.

3.3. The Optimized Electrochemical Performance Model and Validation

Combined with the electrochemical performance model, an optimized PEMFC electrochemical performance model considering gas distribution among all flow channels in the stack can be established. To evaluate the performance of the single-channel model considering gas distribution, this study utilized the following method. Firstly, the average flow rate of all channels was computed, and the flow rate data points above and below this average were divided into two distinct groups. Subsequently, the average value of each group was determined, and these two average values were employed as the inlet flow rates in the simulation using the single channel performance model, yielding two sets of results. Finally, the average of these two sets of results was considered the final output performance of the optimized single-channel model.
To validate the results of the optimized electrochemical performance model, the performance of the PEMFC stack test is conducted. The performance of the stack is then compared with the simulation results obtained from the electrochemical performance model, which includes both the single-channel model and the optimized model. The performance results of the test and simulation are shown in Table 6.
The polarization curve of the PEMFC stack can be obtained by experiments. In this case, the clamping force is calculated based on the compression of GDL, the voltage is the average voltage of all single cells, and the current density is the ratio of the current to the action area. Under 10% and 20% GDL compressions, the polarization curve of the single channel model, the optimized model, and the experimental results are individually shown in Figure 14. It is evident that with an increase in clamping force, all three polarization curves exhibit a slight improvement, suggesting that a moderate increase in clamping force can enhance the output performance of PEMFC.
To evaluate the correlation between the results obtained from the model simulation and the experimental results, a correlation analysis was performed. This analysis aimed to determine the degree of association or relationship between the two sets of data. By comparing and analyzing the simulated results with the experimental data, the correlation coefficients can be gained to assess the accuracy and reliability of the model. A higher correlation coefficient indicates a stronger agreement between the two data sets, indicating a higher level of precision and reliability for the model.
The correlation coefficients between the test results and the simulation results of the single channel model and optimized model are calculated respectively, and the results are shown in Table 7. It can be seen that the PEMFC performance model considering gas distribution is slightly more consistent with the test results under different clamping forces compared to the model without considering gas distribution. Under 20% GDL compression, the correlation coefficient of the optimized model is nearly 99.50%, which is higher than that of the original model. As the number of cells in the PEMFC stack grows, the impact of flow distribution consistency will become more significant. It is expected that the theoretical accuracy of the optimized model will proportionately improve. Hence, it can be inferred that the single-channel performance model, which considers gas distribution in the PEMFC stack, provides a more accurate prediction of the output performance of the stack.

4. Conclusions

This study demonstrates an efficient method to investigate non-uniform gas distribution in the stack. Simulation models are developed to analyze the gas distribution in both PEMFC single cell and whole stack, utilizing porous media theory and a three-dimensional co-simulation performance model of the PEMFC single channel. Subsequently, the simulation results of gas distribution among all the channels in the stack are combined to optimize the single-channel simulation performance model. The objective is to improve its accuracy as a predictive model of stack performance under different clamping forces, and the model is validated through PEMFC stack performance tests. The main conclusions are outlined below:
(1)
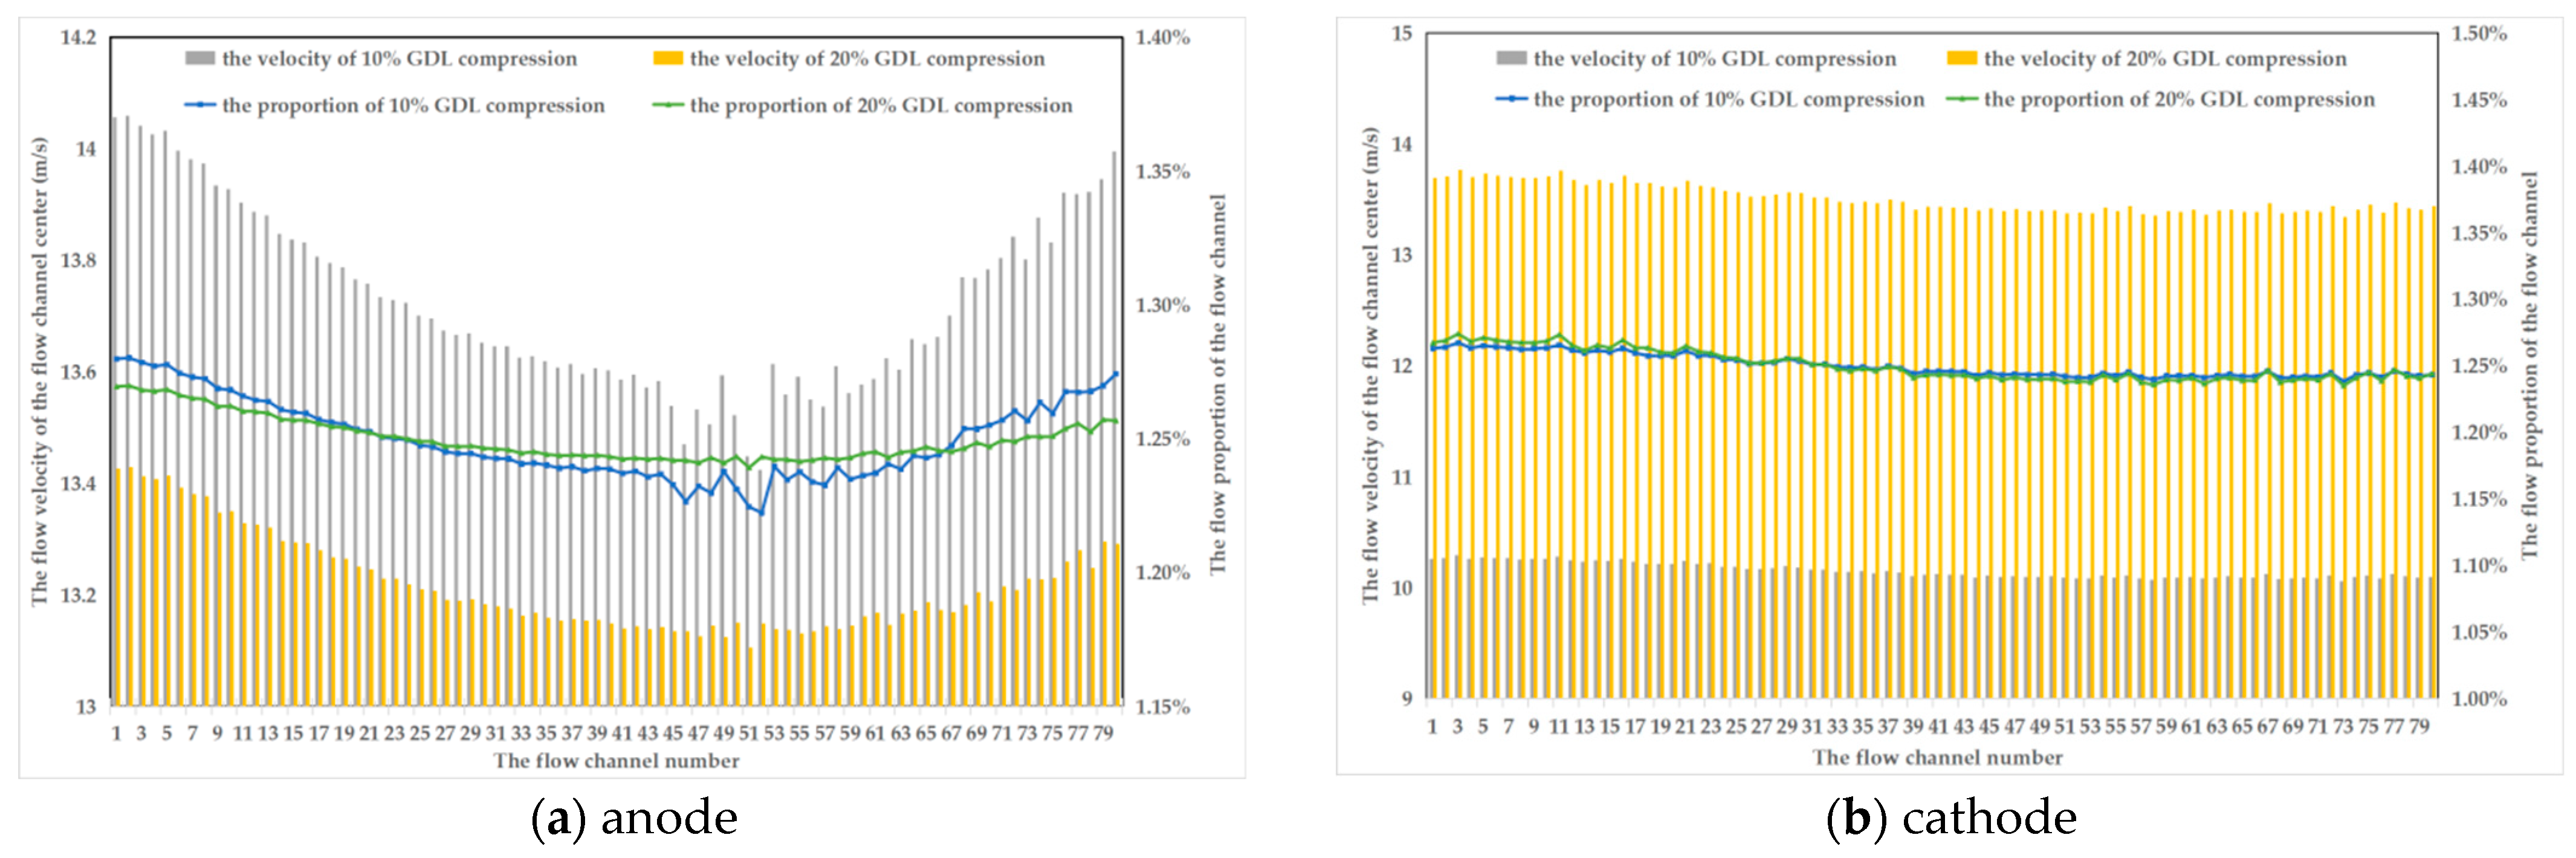
The gas flow distribution in the single-cell anode flow field exhibits an overall trend where the flow rate is higher near both sides and lower in the middle. On the other hand, in the cathode flow field, the flow rate is higher near the inlet side;
(2)
When the clamping force increases, the gas distribution consistency of the anode flow field is slightly improved;
(3)
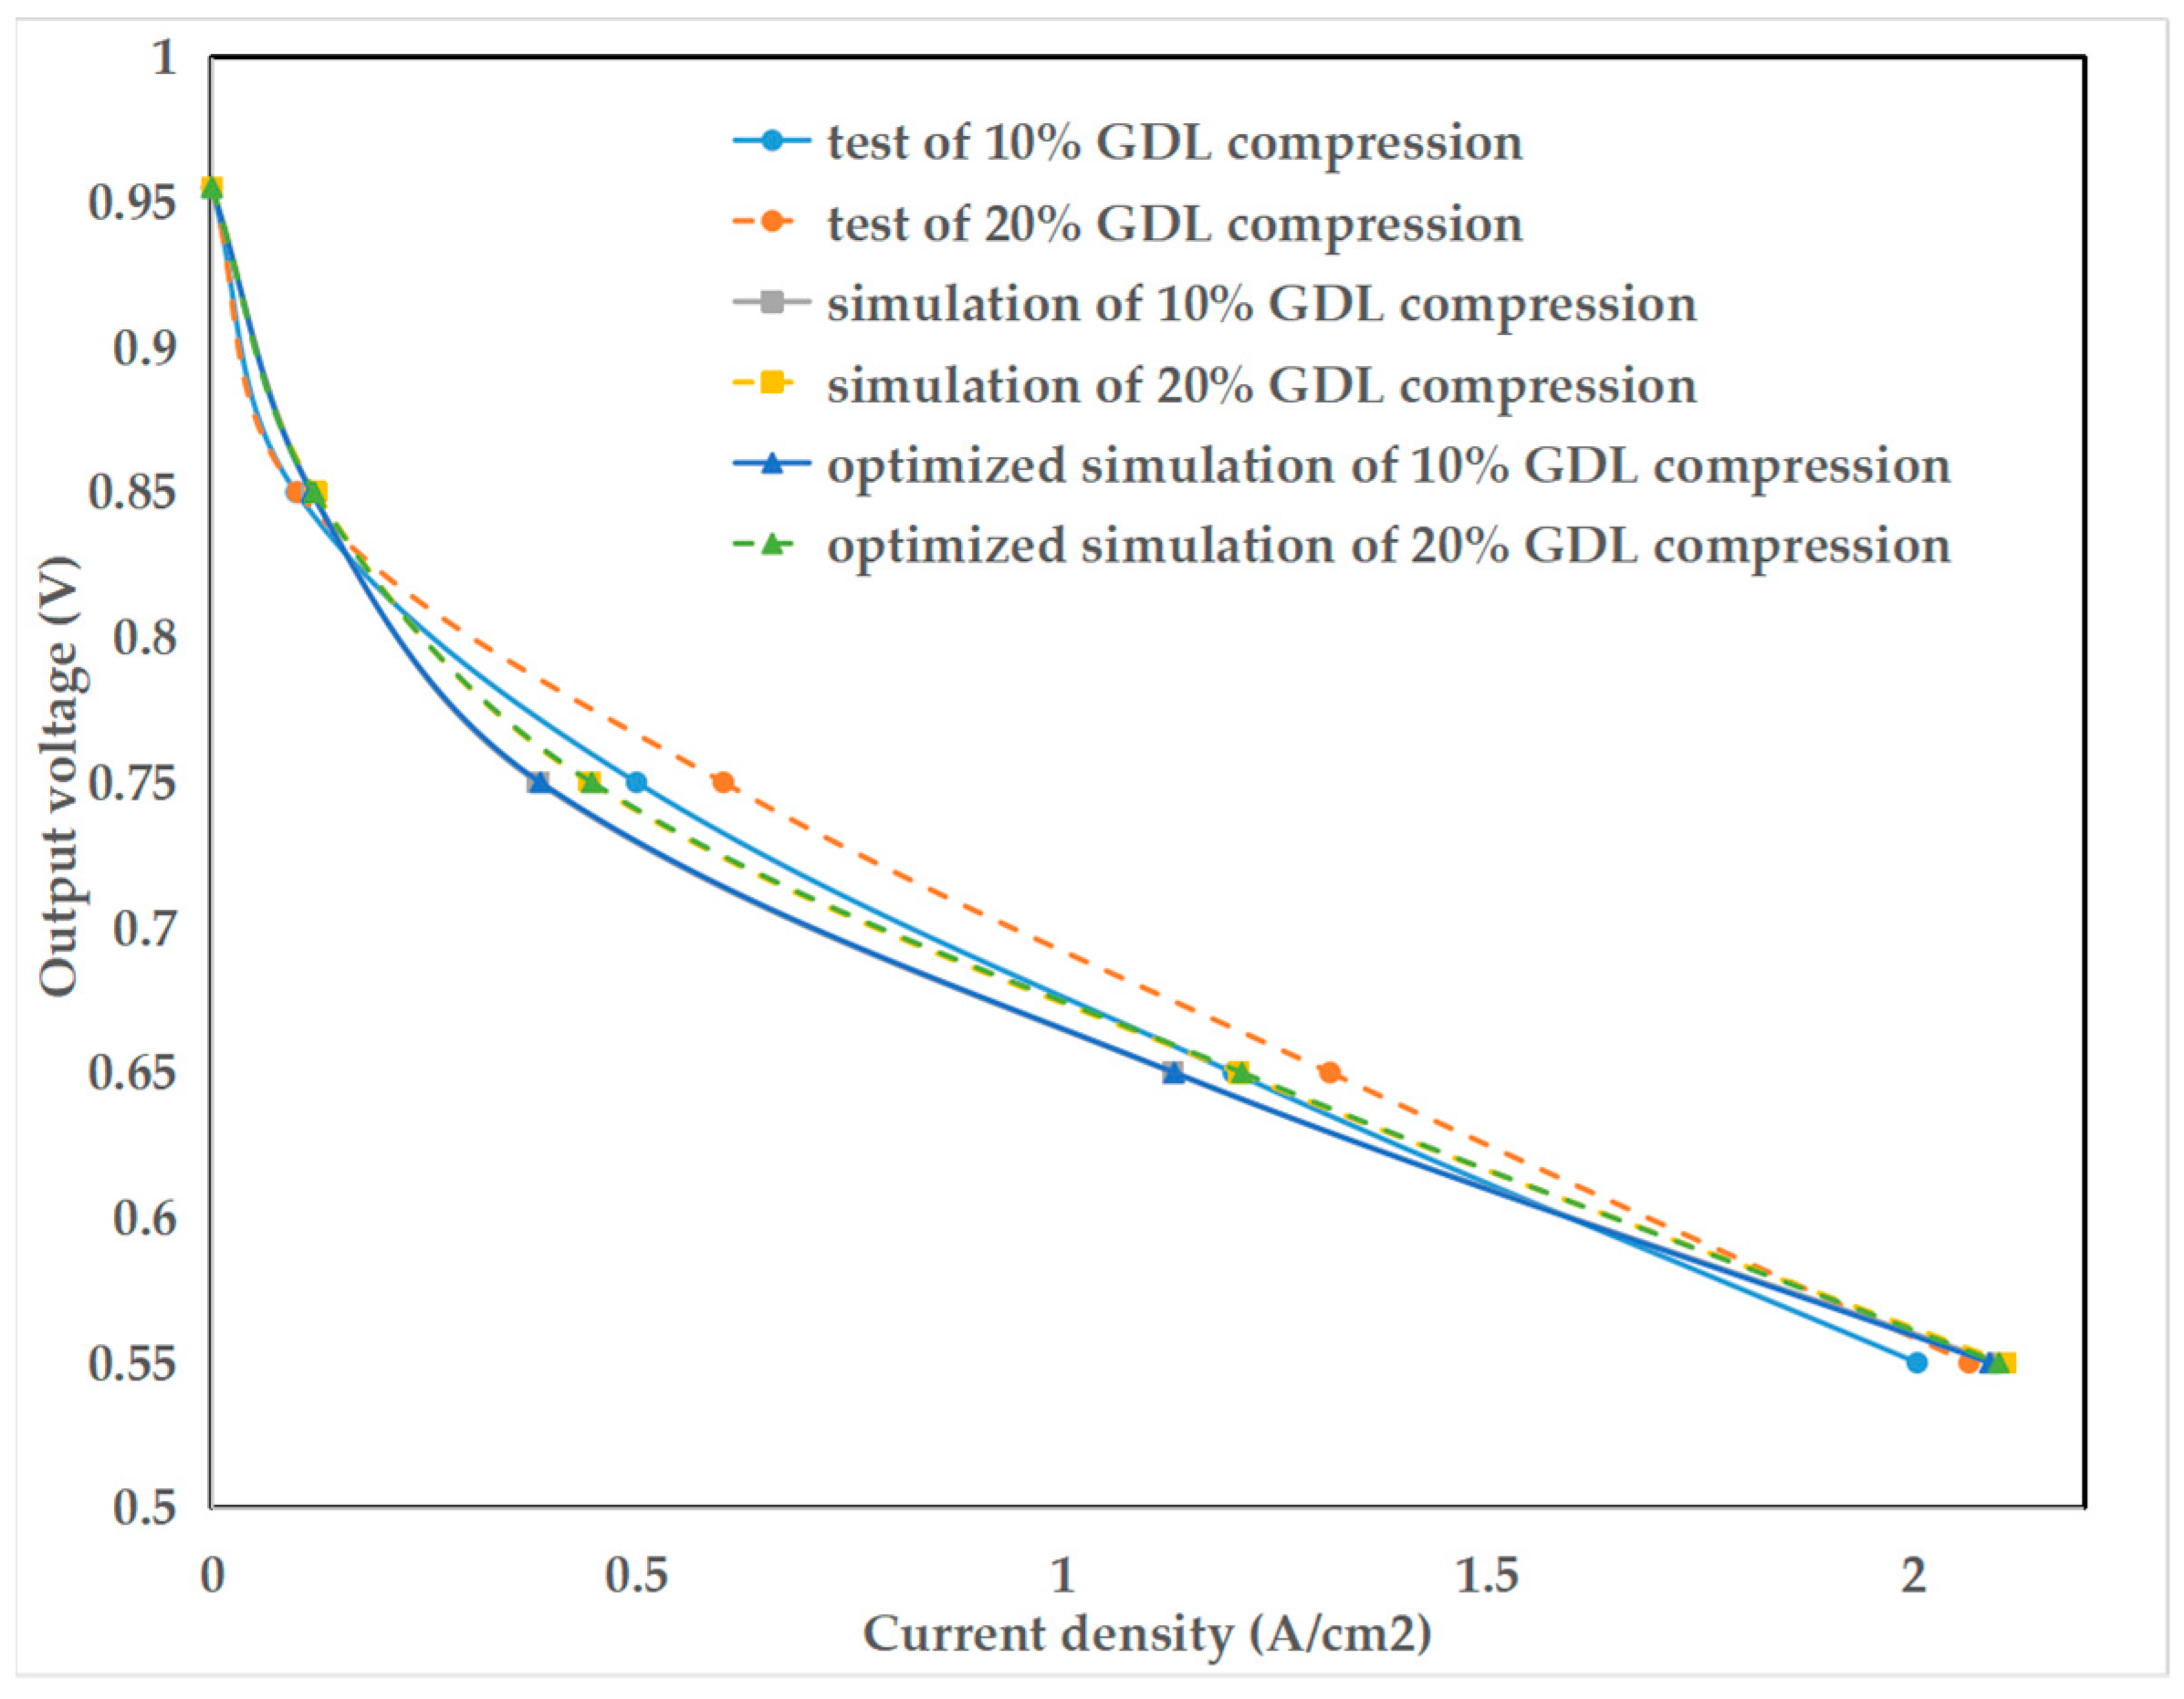
The results of the stack performance experiment and simulation show that the output performance of PEMFC can be improved by increasing the clamping force appropriately;
(4)
Compared to the performance model without considering gas distribution, the simulation results obtained from the performance model considering gas distribution exhibit greater consistency with the test results, resulting in higher accuracy.
In this study, a gas distribution model based on porous media theory was developed to analyze the gas distribution among different flow channels in the PEMFC stack. By combining the gas distribution model with the single-channel electrochemical model, an optimized model was obtained. To validate the effectiveness of the optimized model, performance experiments of a PEMFC stack with 6 cells were conducted. The results demonstrated that the optimized model achieved higher accuracy in predicting performance. Particularly, for PEMFC stacks characterized by complex flow field structures or a large number of single cells, the accuracy of this optimized model is expected to be even higher. The optimized model developed through the method in this article proves to be valuable for investigating the electrochemical performance of the PEMFC stack.
Fuel cell vehicles require larger PEMFC stacks to meet the increasing demand for high-output power. The study can provide an efficient PEMFC performance perdition for a large fuel cell stack. In the next step, it is recommended to establish a gas distribution model based on hundreds of fuel cell stacks. This would involve stack performance consistency testing, current density partitioning testing, etc. to further evaluate the accuracy of the optimized electrochemical model.

Author Contributions

Conceptualization, Z.Z. and T.Z.; methodology, Z.Z. and C.Q.; software, C.Q. and S.W.; validation, Z.Z. and J.Z.; resources, Z.Z. and T.Z.; writing—original draft preparation, Z.Z. and C.Q.; writing—review and editing, Z.Z. and S.W.; funding acquisition, Z.Z. and T.Z. All authors have read and agreed to the published version of the manuscript.

Funding

This research was funded by the Natural Science Foundation of Shanghai, grant number 22ZR1466800.

Institutional Review Board Statement

Not applicable.

Informed Consent Statement

Not applicable.

Data Availability Statement

Data are contained within the article.

Conflicts of Interest

The authors declare no conflicts of interest.

Abbreviations

PEMFCProton Exchange Membrane Fuel Cell
GDLGas Distribution Layer
FEAFinite Element Analysis
CFDComputational Fluid Dynamics
PEMProton Exchange Membrane
UDFUser Defined Function
BPPBipolar Plate
CLCatalyst Layer

References

  1. Pramuanjaroenkij, A.; Kaka, S. The fuel cell electric vehicles: The highlight review. Int. J. Hydrog. Energy 2023, 48, 9401–9425. [Google Scholar] [CrossRef]
  2. Mancino, A.; Menale, C.; Vellucci, F. PEM Fuel Cell Applications in Road Transport. Energies 2023, 16, 6129. [Google Scholar] [CrossRef]
  3. Jia, C.; He, H.; Zhou, J.; Li, J.; Wei, Z.; Li, K. Learning-based model predictive energy management for fuel cell hybrid electric bus with health-aware control. Appl. Energy 2024, 355, 122228. [Google Scholar] [CrossRef]
  4. Dirkes, S.; Leidig, J.; Fisch, P.; Pischinger, S. Prescriptive Lifetime Management for PEM fuel cell systems in transportation applications, Part I: State of the art and conceptual design. Energy Convers. Manag. 2023, 277, 116598. [Google Scholar] [CrossRef]
  5. Jia, C.; He, H.; Zhou, J.; Li, J.; Wei, Z.; Li, K. A novel health-aware deep reinforcement learning energy management for fuel cell bus incorporating offline high-quality experience. Energy 2023, 282, 128928. [Google Scholar] [CrossRef]
  6. Tang, A.; Yang, Y.; Yu, Q.; Zhang, Z.; Yang, L. A Review of Life Prediction Methods for PEMFCs in Electric Vehicles. Sustainability 2022, 14, 9842. [Google Scholar] [CrossRef]
  7. Carcadea, E.; Ismail, M.S.; Ingham, D.B.; Patularu, L.; Varlam, M. Effects of geometrical dimensions of flow channels of a large-active-area PEM fuel cell: A CFD study. Int. J. Hydrog. Energy 2020, 46, 13572–13582. [Google Scholar] [CrossRef]
  8. Jia, C.; Li, K.; He, H.; Zhou, J.; Li, J.; Wei, Z. Health-aware energy management strategy for fuel cell hybrid bus considering air-conditioning control based on TD3 algorithm. Energy 2023, 283, 128462. [Google Scholar] [CrossRef]
  9. Zhang, G.; Qu, Z.; Wang, Y. Full-scale three-dimensional simulation of air-cooled proton exchange membrane fuel cell stack: Temperature spatial variation and comprehensive validation. Energy Convers. Manag. 2022, 270, 116211. [Google Scholar] [CrossRef]
  10. Atyabi, S.A.; Afshari, E.; Wongwises, S.; Yan, W.-M.; Hadjadj, A.; Shadloo, M.S. Effects of assembly pressure on PEM fuel cell performance by taking into accounts electrical and thermal contact resistances. Energy 2019, 179, 490–501. [Google Scholar] [CrossRef]
  11. Taş, M.; Elden, G. Three-dimensional and anisotropic numerical analysis of a PEM fuel cell. Int. J. Hydrog. Energy 2022, 47, 19758–19771. [Google Scholar] [CrossRef]
  12. Chen, B.; Deng, Q.; Yang, G.; Zhou, Y.; Chen, W.; Cai, Y.; Tu, Z. Numerical study on heat transfer characteristics and performance evaluation of PEMFC based on multiphase electrochemical model coupled with cooling channel. Energy 2023, 285, 128933. [Google Scholar] [CrossRef]
  13. Zhang, Z.; Chen, Z.; Li, K.; Zhang, X.; Zhang, C.; Zhang, T. A Multi-Field Coupled PEMFC Model with Force-Temperature-Humidity and Experimental Validation for High Electrochemical Performance Design. Sustainability 2023, 15, 12436. [Google Scholar] [CrossRef]
  14. Shi, L.; Xu, S.; Liu, J. Influences of assembly pressure and flow channel size on performances of proton exchange membrane fuel cells based on a multi-model. Int. J. Hydrog. Energy 2022, 47, 7902–7914. [Google Scholar] [CrossRef]
  15. Shi, Z.; Wang, X. A numerical study of flow crossover between adjacent flow channels in a proton exchange membrane fuel cell with serpentine flow field. J. Power Sources 2008, 185, 985–992. [Google Scholar] [CrossRef]
  16. Yan, X.; Lin, C.; Zheng, Z.; Chen, J.; Wei, G.; Zhang, J. Effect of clamping pressure on liquid-cooled PEMFC stack performance considering inhomogeneous gas diffusion layer compression. Appl. Energy 2020, 258, 114073. [Google Scholar] [CrossRef]
  17. Yong, Z.; Shirong, H.; Xiaohui, J.; Yuntao, Y.; Mu, X.; Xi, Y. Performance study on a large-scale proton exchange membrane fuel cell with cooling. Int. J. Hydrog. Energy 2022, 47, 10381–10394. [Google Scholar] [CrossRef]
  18. Yang, Z.; Wang, X.; Zhang, Y.; Jiao, K.; Du, Q.; Hao, D. Effects of U-type and Z-type configurations on proton exchange membrane fuel cell stack performances considering non-uniform flow distribution phenomena. Int. J. Green Energy 2022, 19, 1160–1169. [Google Scholar] [CrossRef]
  19. Yong, Z.; Shirong, H.; Xiaohui, J.; Yuntao, Y.; Mu, X.; Xi, Y. Characteristics of proton exchange membrane fuel cell considering ‘dot matrix’ gas distribution zones and waveform staggered flow field with cooling channels. Energy Convers. Manag. 2022, 267, 115881. [Google Scholar] [CrossRef]
  20. Zhang, Y.; He, S.; Jiang, X.H. Three-dimensional multi-phase simulation of different flow fields with cooling channel in proton exchange membrane fuel cell. Int. J. Hydrog. Energy 2022, 47, 37929–37944. [Google Scholar] [CrossRef]
  21. Yu, Y.; Zhan, Z.; He, L. Effects of Distribution Zone Design on Flow Uniformity and Pressure Drop in PEMFC. J. Electrochem. Soc. 2021, 9, 168. [Google Scholar] [CrossRef]
  22. Jeon, D.H.; Greenway, S.; Shimpalee, S.; Zee, J.W.V. The effect of serpentine flow-field designs on PEM fuel cell performance. Int. J. Hydrog. Energy 2008, 33, 1052–1066. [Google Scholar] [CrossRef]
  23. Jia, C.; Zhou, J.; He, H.; Li, J.; Wei, Z.; Li, K.; Shi, M. A novel energy management strategy for hybrid electric bus with fuel cell health and battery thermal-and health-constrained awareness. Energy 2023, 271, 127105. [Google Scholar] [CrossRef]
  24. Son, J.; Um, S.; Kim, Y.-B. Numerical analysis of the effect of anisotropic gas diffusion layer permeability on polymer electrolyte membrane fuel cell performance with various channel types. Fuel 2021, 289, 119888. [Google Scholar] [CrossRef]
  25. Zhang, L.; Shi, Z. Optimization of serpentine flow field in proton-exchange membrane fuel cell under the effects of external factors—ScienceDirect. Alex. Eng. J. 2020, 60, 421–433. [Google Scholar] [CrossRef]
  26. Scholta, J.; Escher, G.; Zhang, W. Investigation on the influence of channel geometries on PEMFC performance. J. Power Sources 2006, 155, 66–71. [Google Scholar] [CrossRef]
  27. Hu, H.; Xu, X.; Mei, N.; Li, C. Multi-angle study of the effects of different wave flow field plates on fuel cell performance. Int. J. Mod. Phys. B Condens. Matter Phys. B Stat. Phys. Appl. Phys. 2021, 35, 2150062. [Google Scholar] [CrossRef]
  28. Mohammedi, A.; Sahli, Y.; Ben Moussa, H. 3D investigation of the channel cross-section configuration effect on the power delivered by PEMFCs with straight channels. Fuel 2020, 263, 116713. [Google Scholar] [CrossRef]
  29. Yin, R.-J.; Zeng, W.-C.; Bai, F.; Chen, L.; Tao, W.-Q. Study on the effects of manifold structure on the gas flow distribution uniformity of anode of PEMFC stack with 140-cell. Renew. Energy 2024, 221, 119693. [Google Scholar] [CrossRef]
  30. Jiang, Y.; Liu, X.; Zhang, X. In Non-uniformity Analysis of Parameter Distribution in a 7-channel Serpentine Flow Field Proton Exchange Membrane Fuel Cell. In Proceedings of the 2021 IEEE 4th International Electrical and Energy Conference (CIEEC), Wuhan, China, 28–30 May 2021; pp. 1–5. [Google Scholar]
  31. Yang, Z.; Jiao, K.; Liu, Z.; Yin, Y.; Du, Q. Investigation of performance heterogeneity of PEMFC stack based on 1+1D and flow distribution models. Energy Convers. Manag. 2020, 207, 112502. [Google Scholar] [CrossRef]
  32. Molaeimanesh, G.R.; Googarchin, H.S.; Moqaddam, A.Q. Lattice Boltzmann simulation of proton exchange membrane fuel cells—A review on opportunities and challenges. Int. J. Hydrog. Energy 2016, 41, 22221–22245. [Google Scholar] [CrossRef]
  33. Jiao, K.; Park, J.; Li, X. Experimental investigations on liquid water removal from the gas diffusion layer by reactant flow in a PEM fuel cell. Appl. Energy 2010, 87, 2770–2777. [Google Scholar] [CrossRef]
  34. Tomadakis, M.M.; Robertson, T.J. Viscous Permeability of Random Fiber Structures: Comparison of Electrical and Diffusional Estimates with Experimental and Analytical Results. J. Compos. Mater. 2005, 39, 163–188. [Google Scholar] [CrossRef]
  35. Yang, S.; Xiao, Z.; Liu, Z.; Du, W.; Sun, Y.; Deng, C. Parameter analysis of flow distribution characteristics of proton exchange membrane fuel cell stack. Zhongnan Daxue Xuebao (Ziran Kexue Ban) J. Cent. South Univ. (Sci. Technol.) 2022, 53, 4627–4636. [Google Scholar]
Figure 1. The structure of the single channel model at the engineering dimensional level.
Sustainability 16 00587 g001
Figure 2. The two-dimensional mechanical model for the GDL compression.
Sustainability 16 00587 g002
Figure 3. The mesh of the single-channel electrochemical performance model.
Sustainability 16 00587 g003
Figure 4. Grid independence test for the current density.
Sustainability 16 00587 g004
Figure 5. The actual BPP structure of PEMFC.
Sustainability 16 00587 g005
Figure 6. The structure of the single-cell gas distribution model.
Sustainability 16 00587 g006
Figure 7. The fitted curves of different pressure and flow rates in single-channel.
Sustainability 16 00587 g007
Figure 8. The gas distribution models for the anode and cathode of the PEMFC stack.
Sustainability 16 00587 g008
Figure 9. The fitted curve of different pressure and flow rates in single cell model.
Sustainability 16 00587 g009
Figure 10. The anode flow velocity distribution under 2 A/cm2.
Sustainability 16 00587 g010
Figure 11. The cathode flow field velocity distribution under 2 A/cm2.
Sustainability 16 00587 g011aSustainability 16 00587 g011b
Figure 12. The flow velocity at the center of the flow channel.
Sustainability 16 00587 g012
Figure 13. The gas distribution of PEMFC stack.
Sustainability 16 00587 g013
Figure 14. The polarization curves of the test and the established model.
Sustainability 16 00587 g014
Table 1. The structural parameters of the model.
DimensionsUnitsValues
BPP heightmm0.4
BPP widthmm1.508
GDL heightmm0.18
Anode CL heightmm0.006
Cathode CL heightmm0.008
PEM heightmm0.016
Channel heightmm0.3
Channel lengthmm250
Channel width (top)mm0.359
Channel width (bottom)mm1.149
Channelmm0.15
Table 2. The properties of PEMFC materials.
Material PropertiesBPPGDLCLPEM
Elastic modulus (103 MPa)2008.92164.60.446
Poisson’s ratio0.30.310.3960.25
Thermal expansion coefficient
(10−6 K−1)
17.388.9320
Thermal conductivity (W m−1 K−1)15.11.869730.033
Table 3. The operating conditions of the PEMFC stack.
ParametersValue
Anode inlet pressure (kPa)150
Cathode inlet pressure (kPa)170
Anode stoichiometric coefficient1.5
Cathode stoichiometric coefficient2
Anode inlet humidity (%)50
Cathode inlet humidity (%)50
Working temperature (°C)80
Table 4. The resistance coefficient of the gas distribution model of a single cell.
Flow FieldGDL Compression RateInertial Resistance CoefficientViscous Resistance Coefficient
Anode10%2.37 × 1031.21 × 107
20%3.97 × 1039.48 × 106
Cathode10%2.89 × 1032.89 × 106
20%1.97 × 1038.74 × 107
Table 5. The resistance coefficient of the gas distribution model of the fuel cell stack.
Flow FieldCompressionInertial Resistance CoefficientViscous Resistance Coefficient
Anode10%1.04 × 1043.09 × 108
20%2.07 × 1042.86 × 108
Cathode10%2.98 × 1035.10 × 108
20%9.40 × 1028.01 × 108
Table 6. The performance results of the test and simulation.
The Compression of GDLVoltage (V)Current Density (A/cm2)
Test10%0.9550
0.850.099
0.750.499
0.651.200
0.552.004
20%0.9550
0.850.101
0.750.601
0.651.314
0.552.065
Simulation10%0.9550
0.850.118
0.750.383
0.651.129
0.552.098
20%0.9550
0.850.122
0.750.444
0.651.206
0.552.108
Optimized simulation10%0.9550
0.850.117
0.750.386
0.651.131
0.552.090
20%0.9550
0.850.121
0.750.447
0.651.211
0.552.100
Table 7. The correlation coefficient of the test, single fuel cell model, and the optimized model.
CompressionSingle Fuel Cell ModelOptimized Model
10%0.99630.9966
20%0.99460.9950
Disclaimer/Publisher’s Note: The statements, opinions and data contained in all publications are solely those of the individual author(s) and contributor(s) and not of MDPI and/or the editor(s). MDPI and/or the editor(s) disclaim responsibility for any injury to people or property resulting from any ideas, methods, instructions or products referred to in the content.

