Article

Multivariate Statistical Methods and GIS-Based Evaluation of Potable Water in Urban Children’s Parks Due to Potentially Toxic Elements Contamination: A Children’s Health Risk Assessment Study in a Developing Country

1
Department of Biological, Geological and Environmental Sciences, Alma Mater Studiorum University of Bologna, 40126 Bologna, Italy
2
Department of Environmental Sciences, Kohat University of Science and Technology, Kohat 26000, Pakistan
3
School of Environmental Sciences, China University of Geosciences, Wuhan 430074, China
4
Department of Zoology, Abdul Wali Khan University Mardan, Mardan 23200, Pakistan
5
Faculty of Environmental Sciences, Czech University of Life Sciences Prague, 16500 Prague, Czech Republic
6
Department of Environmental Sciences, University of Peshawar, Peshawar 25120, Pakistan
7
Department of Botany, Abdul Wali Khan University, Mardan 23200, Pakistan
8
Natural and Medical Sciences Research Center, University of Nizwa, Nizwa 616, Oman
9
Zoology Department, College of Science, King Saud University, P.O. Box 2455, Riyadh 11451, Saudi Arabia
*
Author to whom correspondence should be addressed.
Sustainability 2023, 15(17), 13177; https://doi.org/10.3390/su151713177
Submission received: 3 August 2023 / Revised: 27 August 2023 / Accepted: 28 August 2023 / Published: 1 September 2023
(This article belongs to the Special Issue Environmental and Health Risk Assessment of Heavy Metal Pollution)

Abstract

:
Contamination of potentially toxic elements (PTEs) has received widespread attention in urban children’s parks (UCPs) worldwide in the past few decades. However, the risk assessment of PTEs in drinking water sources of UCPs is still unknown particularly in developing countries. Hence, the present study investigated the spatial distribution, sources for PTEs (Cd, Cr, Pb, Ni, and Cu), and health risk assessment in drinking water sources of UCPs in Khyber Pakhtunkhwa, Pakistan. Among PTEs, Cd, Cr, and Pb had low to high concentrations and exceeded the safe limits of WHO and PAK-EPA in most UCPs. PCA results showed high anthropogenic and low natural sources, contributing to the release of PTEs in all UCPs. Heavy-metal pollution index (PTE-PI) results showed low to high pollution levels for all UCPs, with the highest values of 113 and 116 for Sardaryab Park Charsadda (SPC) and Zoo Park Peshawar (ZPP), respectively. Heavy-metal evaluation index (PTE-EI) results also showed low to high pollution levels for all UCPs. UCPs samples (50%) showed low pollution levels in PTE-PI results. To the contrary, UCPs samples (50%) exhibited high pollution levels in PTE-EI results. The non-carcinogenic risk of HQ and HI values of all PTEs were below the permissible limit (<1) for adults and children via ingestion and dermal contact. CR and TCR results showed that PTEs (Cr, Cd, Pb, and Ni) had the highest carcinogenic risk (>1.00 × 10⁻⁴) for both adults and children in all UCPs, except Cd and Ni for adults via the ingestion route, while Cr values (>1.00 × 10⁻⁴) were exceeded for children in some of the UCPs via the dermal route. Consequently, long-term exposure to toxic PTEs could pose a carcinogenic risk to the local population. Thus, the present study suggests that the government should implement enforcement with firm protocols and monitoring guidelines of environmental regulations to mitigate PTEs originating from anthropogenic sources in order to reduce health risks and improve public health safety in urban areas.

Graphical Abstract

1. Introduction

According to the world urbanization prospects of the United Nations (UN), 55% of the world’s population resides in urban areas [1]. Urban parks play a critical role in maintaining the urban ecosystem with the rapid development of urbanization [2,3]. As a result, high amounts of pollutants are accumulated in the urban environment due to rapid urbanization, high energy consumption, and migrations of people into big cities [4,5]. Pollutants like potentially toxic elements (PTEs) are released into the urban park soils and the surrounding environment as a consequence of high urbanization and industrialization [6,7,8]. The primary sources of PTEs are heavy traffic and intensive human activities (such as the dumping of municipal and industrial wastes, home heating, industrial emissions, and energy generation), leading to contamination of parks and roadside lawns in urban environments [9,10,11]. PTE contamination in urban children’s parks (UCPs) is associated with traffic emissions, fuel combustion, tire and brake wear, particles of weathered street dust, waste discharge from industrial activities, weathering particles from buildings and pavement surfaces, urban infrastructure development, wastewater disposal systems, and dumping of municipal solid waste [12,13,14,15,16,17]. Moreover, urban soils are exposed to PTE input from natural sources, wastewater irrigation, and atmospheric deposition [18,19,20,21], resulting in being discharged into water bodies by natural weathering, the erosion process, and anthropogenic activities [22]. Typically, urban runoff contains a range of pollutants that could contaminate water quality [23,24], and such pollutants like PTEs degrade the drinking water sources and leach into groundwater system.
Residents can be exposed to PTEs by ingestion, inhalation, and skin contact, especially children and adults who often visit urban parks [3]. PTEs can pose substantial risks to the public’s health once they have bioaccumulated, especially to the most susceptible groups, such as children and senior citizens [13]. Furthermore, visitors and locals commonly engage in recreational activities in public parks, and exposure to elevated PTEs can hinder a child’s development, cause abnormal behavior, or lead to other chronic disorders, while others have the potential to cause cancer when exposed to high concentrations [25]. In general, prolonged exposure to PTEs may cause a variety of harmful health effects, including cancer, immune system disruption, neurological problems, cardiovascular and liver diseases, kidney and bone malfunction, and immune system disruption [26]. Due to the fact that children and other park visitors are more susceptible to PTE toxicity, it is crucial to identify the risks of exposure to drinking water sources in urban parks [27]. So far, multivariate statistical analyses like principle component analysis multiple linear regression (PCA-MLR) have been widely used for source identification of PTEs [28,29]. Therefore, it is crucial to identify the potential sources of PTEs and high risk areas in urban parks in order to prevent and control PTE pollution [30].
Several studies have shown contamination by PTEs such as Cr, Ni, Cd, As, Cu, Pb, and Zn in urban soils in parks, sports playgrounds, and schools [31,32,33,34], with most of the recent studies focused on PTE concentration, potential sources, and health risk assessment in UCP soils. PTE pollution was also reported in various research in some of the urban lakes [35,36]. The PTEs in urban environments have been a major concern for researchers and environmentalists worldwide. Research on PTE contamination in drinking water sources of urban parks and the urban environment is very limited. However, to the best of our knowledge, this will be the first study to assess PTE contamination, its potential source, and health risk evaluation in UCP drinking water sources of the Khyber Pakhtunkhwa (KPK) province in Pakistan. Parks in this province serve as popular recreation areas and tourism destinations for the local citizens. PTEs in the UCP drinking water could pose a serious threat to human health. As the proportion of people living in urban areas is predicted to expand from 50% today to 66% by 2050 worldwide [29], identifying and remediating PTEs-contaminated soils and drinking water may become more critical. Evidently, research into the health risks posed by PTEs in drinking water sources of UCPs is still unknown in developing countries like Pakistan. To fill this research gap, a scientific approach is needed to evaluate the PTEs pollution in UCPs and its origins to minimize the health risks via drinking water ingestion and dermal contact of exposure pathways for children and adults. This study could be important to provide scientific support for controlling and prevention of PTEs contamination in order to improve healthy urban environments worldwide, as proposed by the World Health Organization (WHO).
Therefore, we have selected a total of 20 UCPs in famous regions of the KPK province. The primary objectives of the present study were as follows: (1) to investigate the spatial distribution of PTEs (Cd, Cr, Pb, Ni, and Cu) in selected UCPs; (2) to assess the PTEs contamination and potential sources by PCA-MLR; and (3) to assess their possible risks (carcinogenic and non-carcinogenic) to human health, via ingestion and dermal contact, for the local population (adults and children). This research can be used as a reference basis in future studies for proper management of PTE contamination in urban parks. The findings of this study can help decision makers and can alert inhabitants around the world to manage and remediate PTEs contamination in soil and drinking water sources with the guidelines and remediation strategies in urban environments.

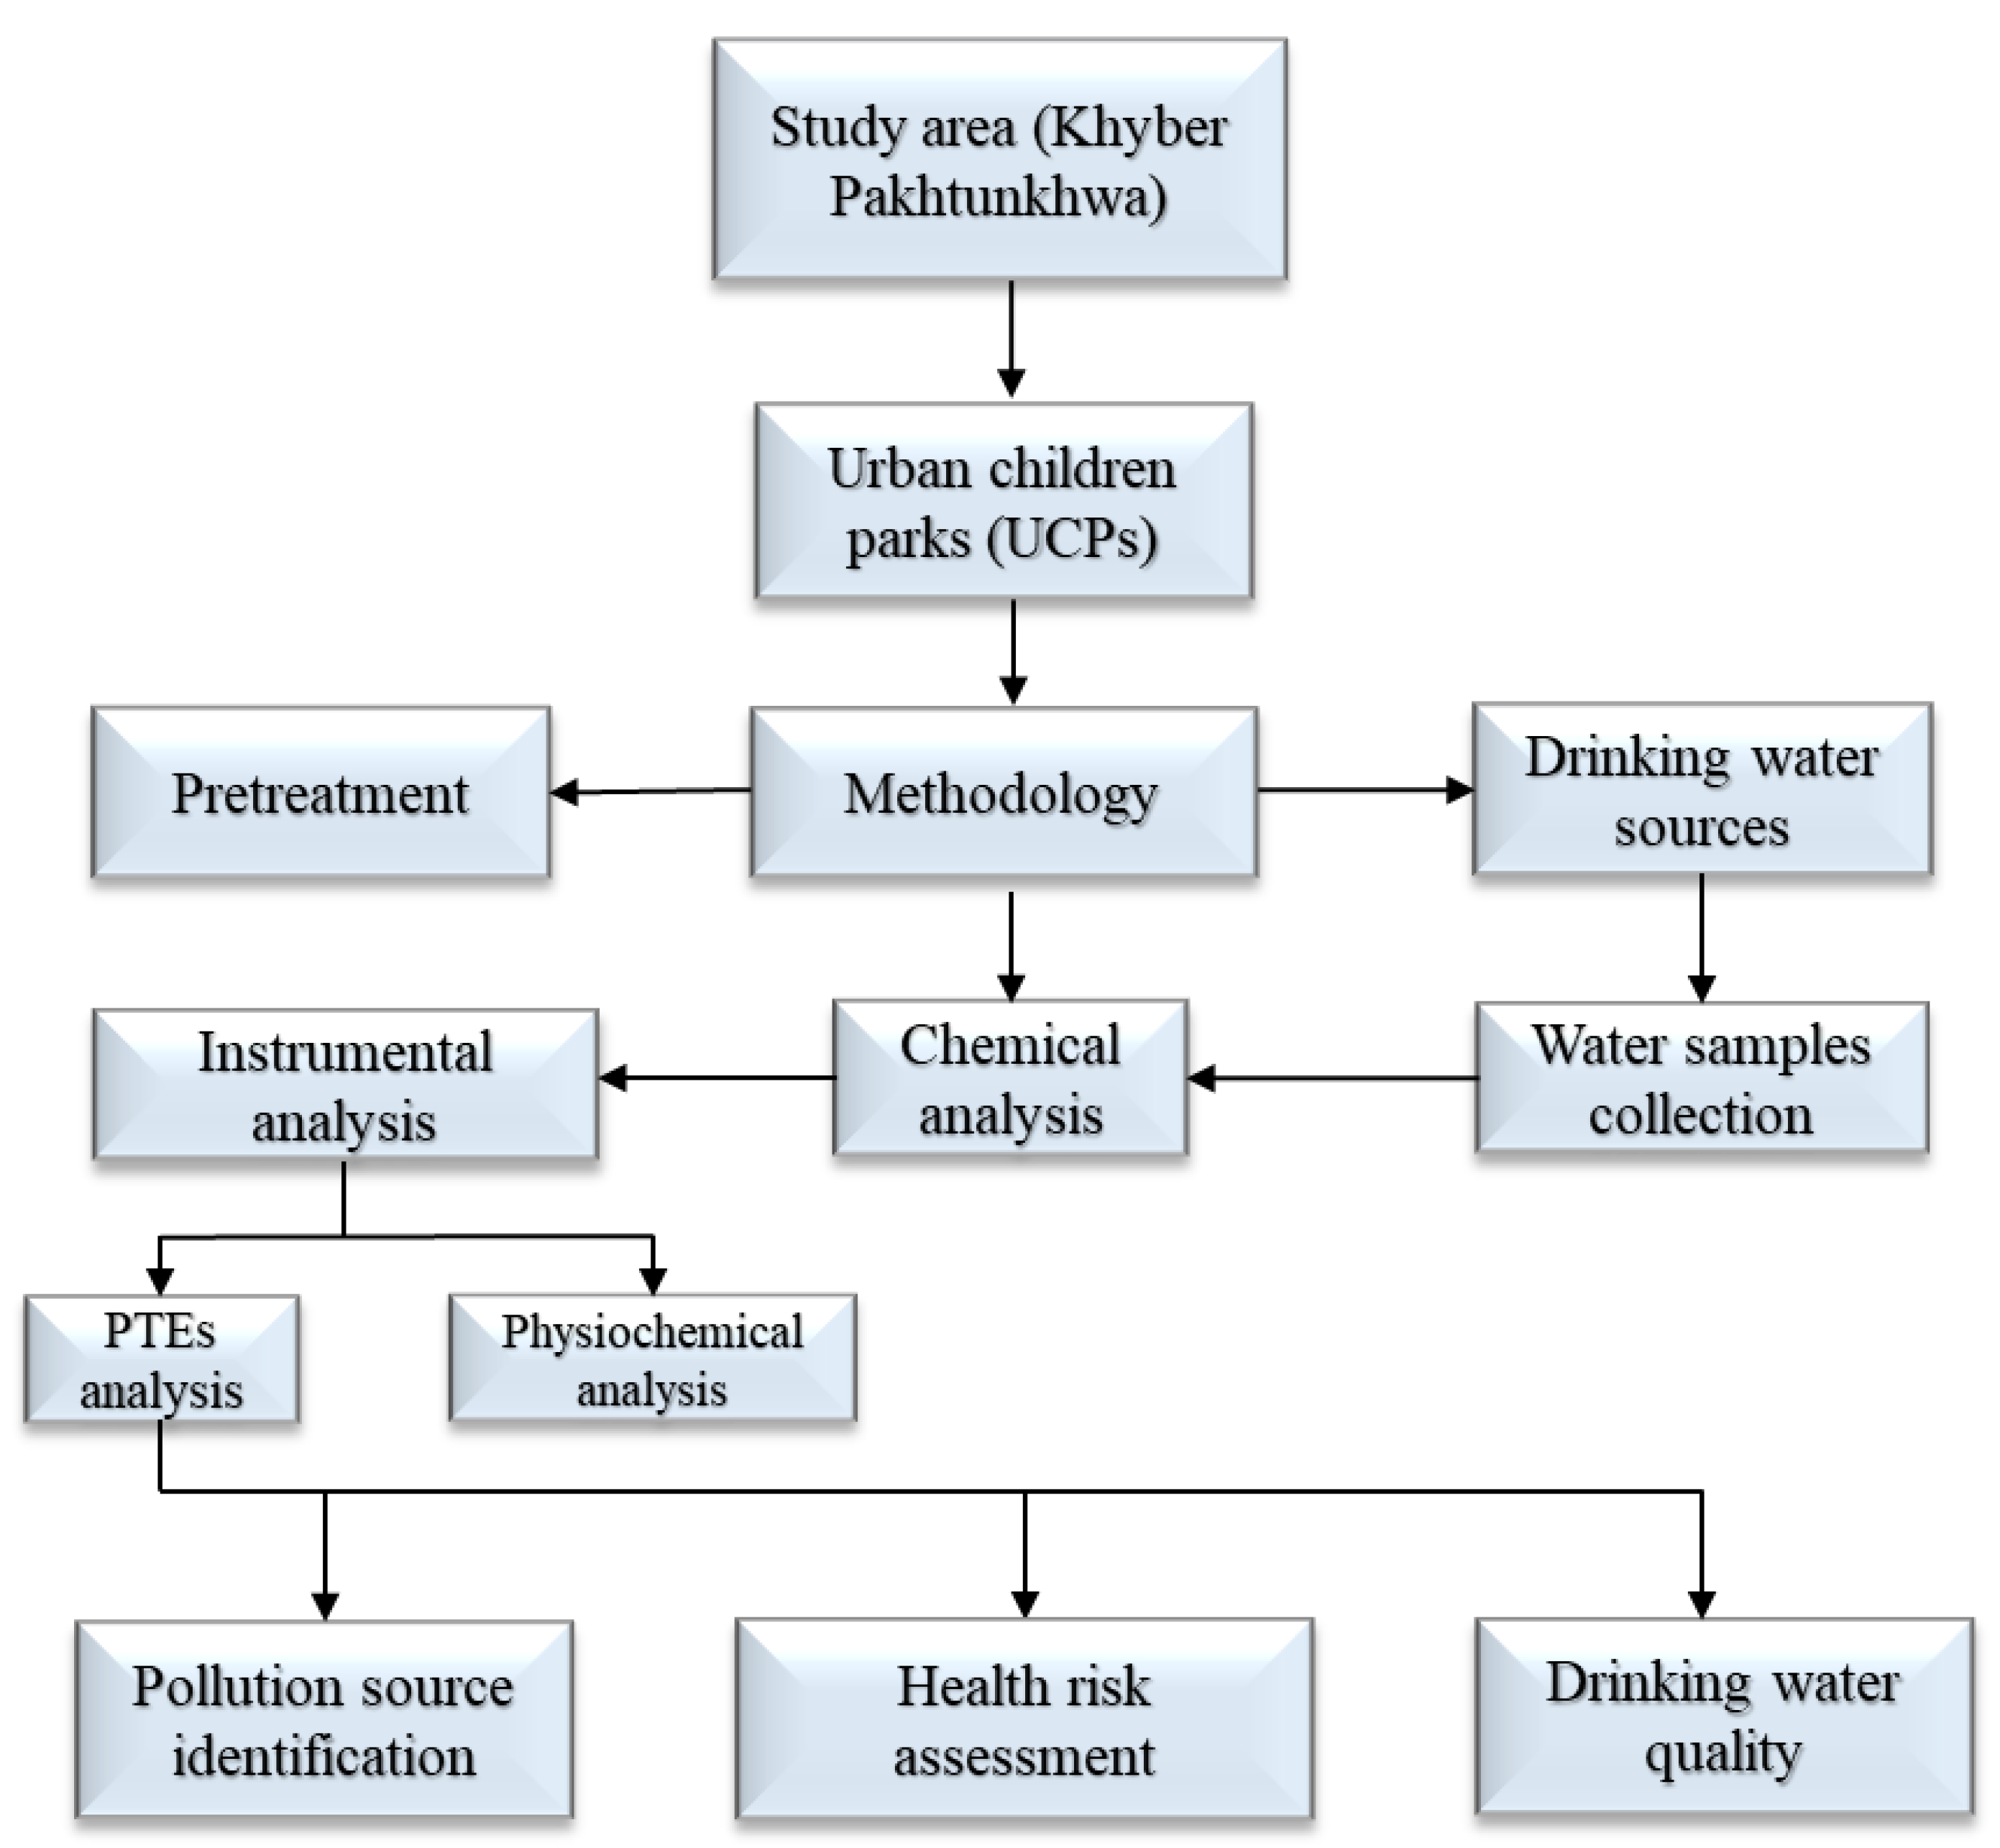
2. Materials and Methods

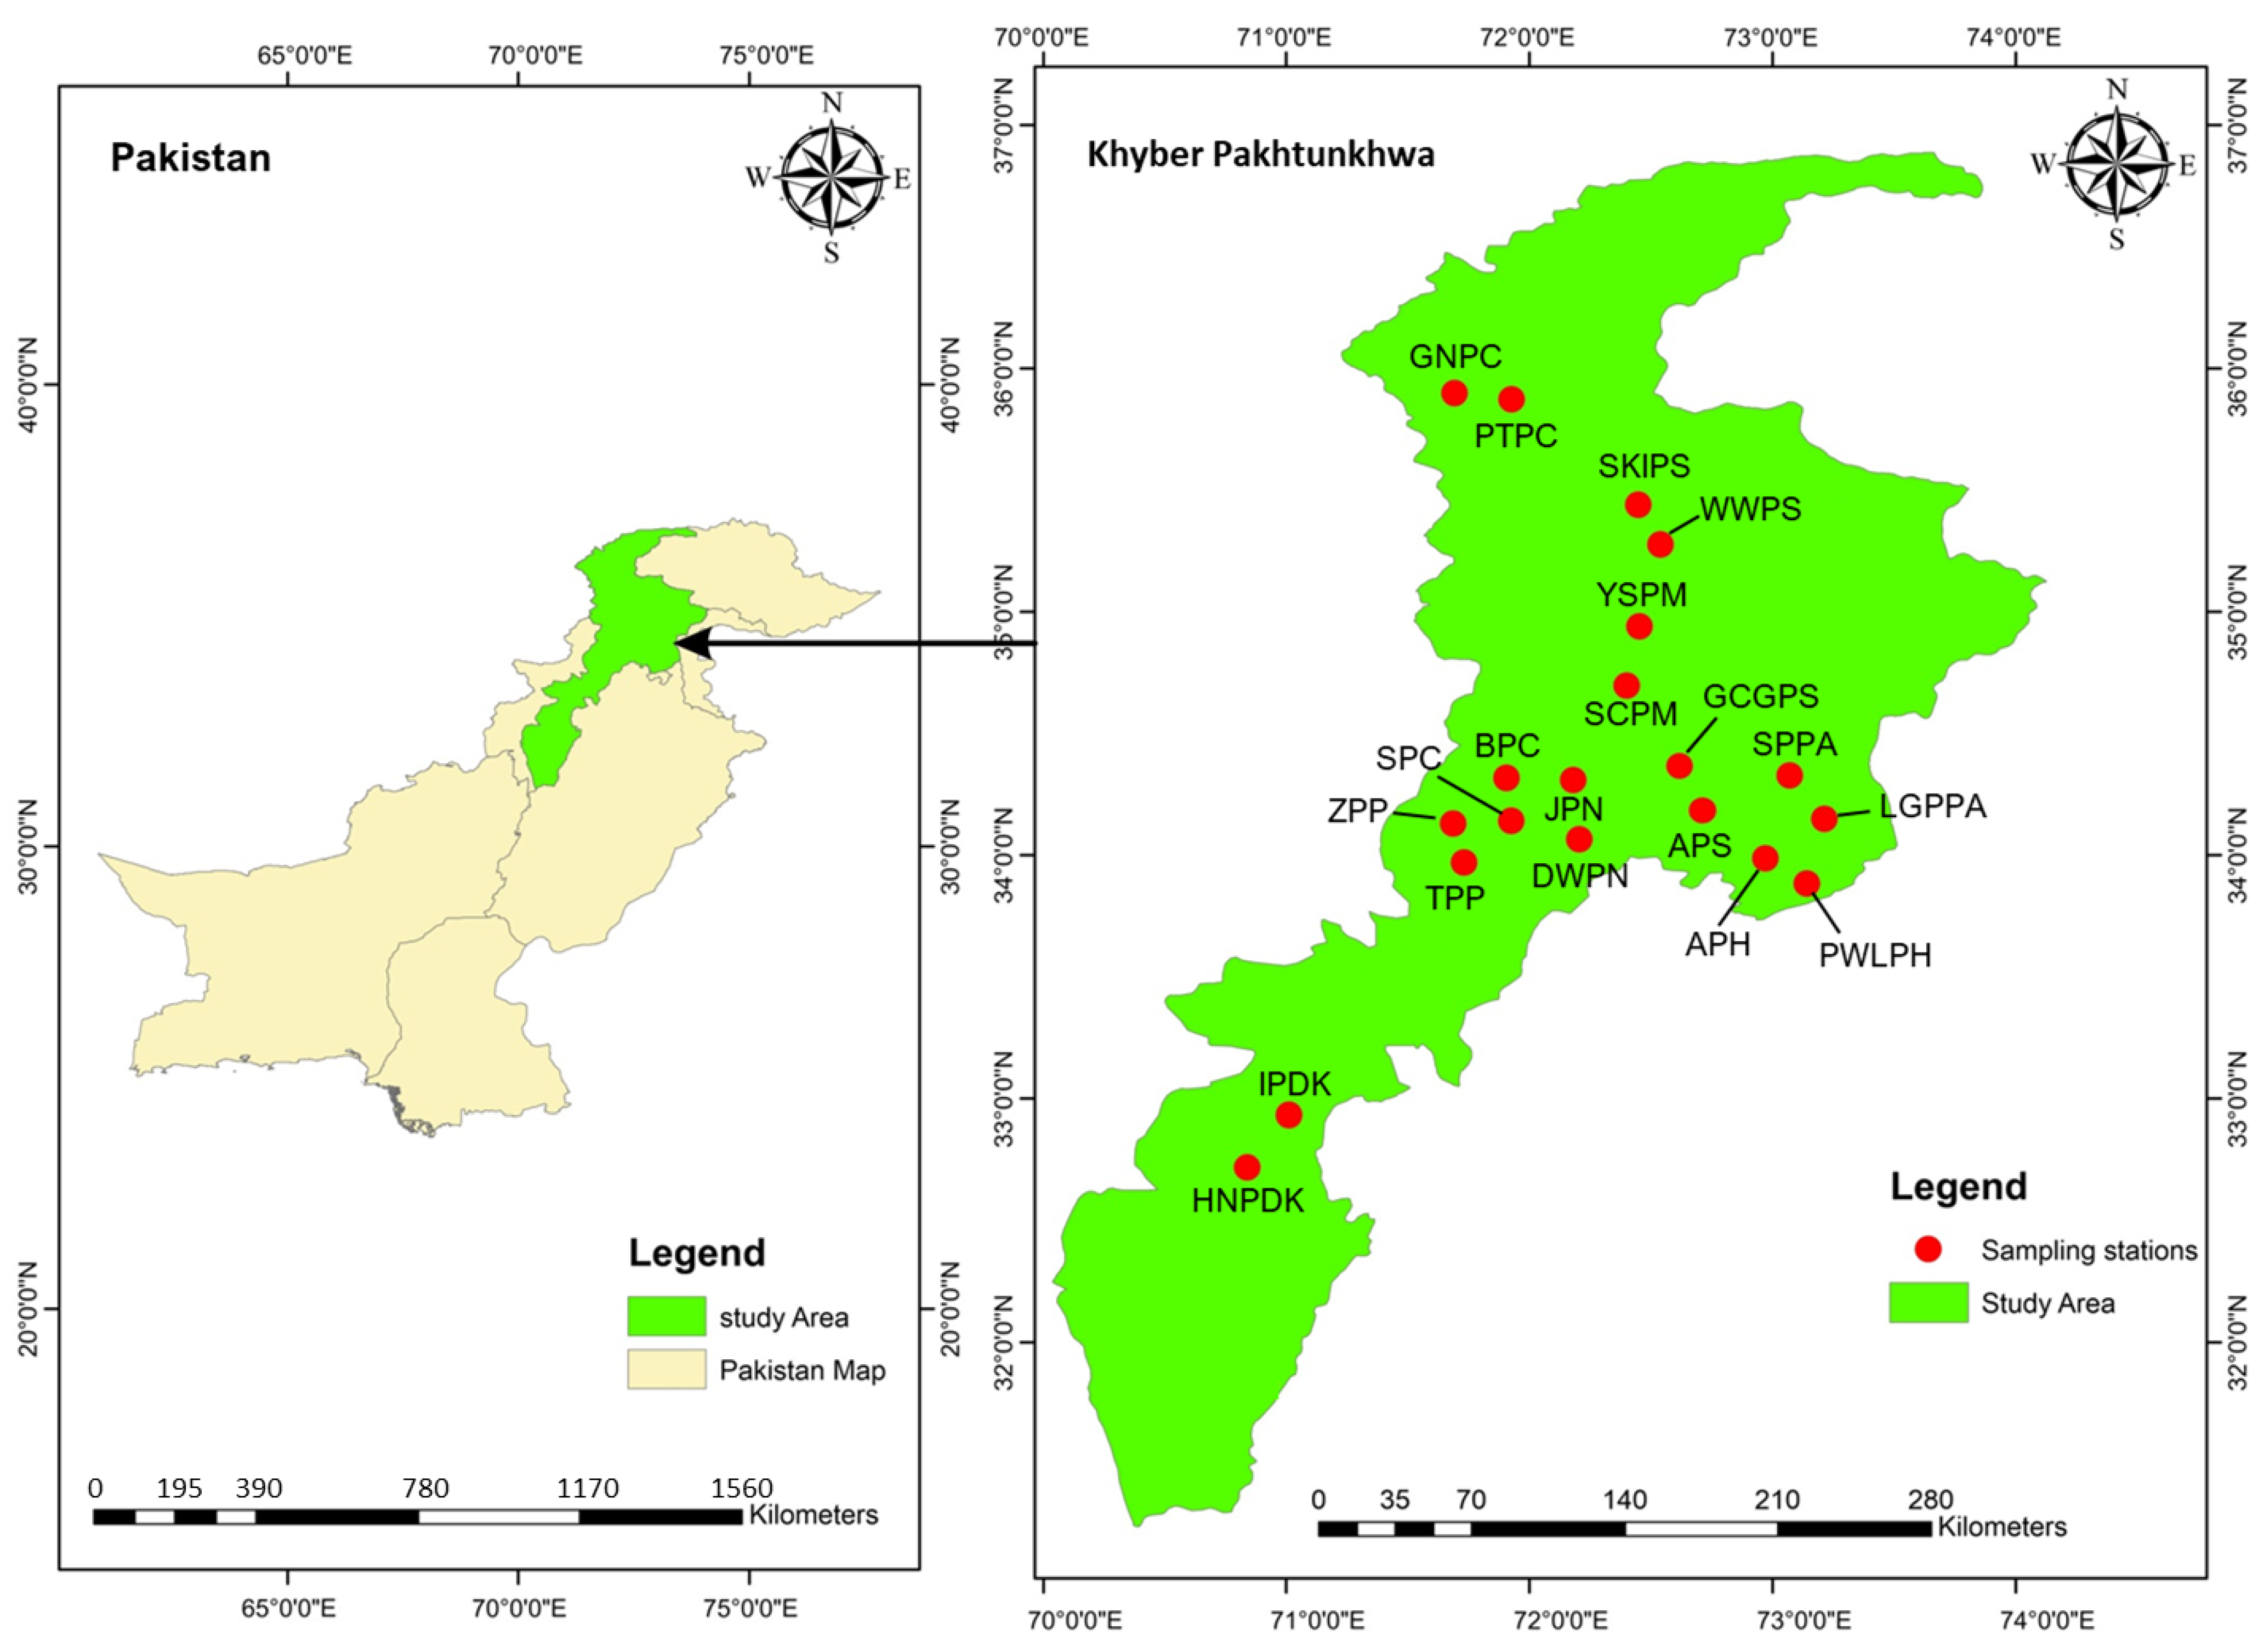
2.1. Study Area, Water Sampling, and Analysis

The water samples were collected from a total of 20 UCPs of 10 cities in the Khyber Pakhtunkhwa province of Pakistan in 2019, as shown in Figure 1. All the UCPs were selected based on high population and industrialized areas, and the parks were also used for different recreational activities by the local children and adults. The UCPs are categorized with specific acronyms, including Baghicha Park Charsadda (BPC), Sardaryab Park Charsadda (SPC), Zoo Park Peshawar (ZPP), Tatara Park Peshawar (TPP), Jannah Park Nowshera (JPN), Disney Water Park Nowshera (DWPN), Pak Wonder Land Park Haripur (PWLPH), Ayub Park Haripur (APH), Sher Khan International Park Swat (SKIPS), Wonder World Park Swat (WWPS), Albela Park Swabi (APS), Gohati Cricket Ground Park Swabi (GCGPS), Sports Complex Park Mardan (SCPM), Younus Stadium Park Mardan (YSPM), Gol National Park Chitral (GNPC), Pakistan Tour Park Chitral (PTPC), Haq Nawaz Park Dera Ismail Khan (HNPDK), Insaf Park Dera Ismail Khan (IPDK), Lady Garden Public Park Abbottabad (LGPPA), and Shimla Pahari Park Abbottabad (SPPA).
The research methodology (see Figure 2) was followed for drinking water sample collection with the proper guidelines, and all the samples were collected in the selected UCPs. The water samples were randomly collected from different drinking water sources including bore wells, hand pumps, and tap water in UCPs. The total geographical area of each park was varied, and water samples were collected from the abovementioned sources. Based on the total area of each UCP, 10 water samples were collected from drinking water sources. A total of (n = 200) drinking water samples were collected from all the 20 UCPs in all selected cities. The drinking water resources in these UCPs are regularly used for drinking and other domestic purposes. Before sample collection, water was allowed to run for a few minutes during the sampling time from the specific target in each park. The polyethylene bottles were first cleaned with distilled water, then water samples were taken. A few drops of acid (HNO3, 0.5% v/v) were added to bottles prior to PTE analysis. All the water samples were filtered by Whatman filter paper (0.45 μm). All the samples were sealed, labeled, and well preserved using the method used by [37].
The water samples were directly used for the physicochemical parameters analysis (Figure 2). pH and total dissolved solids (TDS) were determined using a digital pH meter (Model C93, Turnhout, Belgium) and a TDS meter (Model S518877), respectively, while electrical conductivity (EC) was measured by a conductivity meter (Model HI98303). The water samples were analyzed for PTEs including cadmium (Cd), chromium (Cr), lead (Pb), nickel (Ni) and copper (Cu) by graphite furnace atomic absorption spectrophotometry (PerkinElmer, Waltham, MA, USA, ASS-PEA-700) using standard procedures adopted by [15].

2.2. PTEs Pollution Indices

2.2.1. Potentially Toxic Elements Pollution Index (PTE-PI)

The PTE-PI is a measurement that reflects the combined impact of several dissolved PTEs and indicates the overall quality of water with regard to PTE concentration [38]. PTE-PI is an effective technique used to assign a specific rating/weighting (Wi) for each selected parameter. The rating is based on a value between 0 and 1, indicates the relative importance of each parameter, and can be interpreted as inversely related to the suggested standard (Si) for individual parameter [39,40].
Different PTE-PI ranges have been specified and used to classify water quality as “poor”, “good”, “very good”, and “excellent”. The critical level of the PTE-PI value is 100, and it has been reported that PTE-PI levels above 100 have a stronger negative impact on health [41]. PTE-PI can be calculated by using Equations (1) and (2):
PTE - PI = i = 1 n ( Q i × W i ) i = 1 n W i
Q i = M i S i × 100
where Qi and Wi represent the sub-index and unit weightage of the ith parameter, respectively, and n is the total number of the parameters. Mi is the concentration of the measured ith parameter, and Si is the concentration of standard maximum permissible values (μg/L) of WHO [42], respectively, as shown in Table S1, described by the European Directive on water quality [43]. The weightage unit (Wi) signifies an inverse proportional to the maximum concentration level.
W i = 1 S i

2.2.2. Potentially Toxic Elements Evaluation Index (PTE-EI)

The PTE-EI is also used to evaluate the combined impact of measured PTEs on the overall drinking water quality [39]. In the present study, five PTEs (Cd, Cr, Pb, Ni, and Cu) were selected and assessed for PTE-PI and PTE-EI calculation. HEI was computed by the given Equation (4):
PTE - EI = i = 1 n H c H m a c
where Hc is the observed value of the ith parameter (mg/L), while Hmac is the maximum permissible concentration of the ith parameter [44].

2.3. Human Health Risk Model

2.3.1. Non-Carcinogenic Risk Assessment

The health risk model is used to determine the extent of human exposure to toxic PTEs, developed by the United States Environmental Protection Agency (USEPA) [45], in the drinking water of UCPs. Risk assessment is described as the method of estimating the likelihood of any given likely amount of detrimental health impacts occurring over a specified time period [46]. Human health risk assessment was estimated in recent studies to demonstrate the potential health risks posed by PTEs in water, soil, and air [47,48]. The risk assessment is one of the most effective ways of providing crucial information, highlighting the most critical metals among heavy metals, which have a negative influence on human health and the environment due to their toxicity. The most useful aspect of health risk assessment is that it provides information and depicts an inhabitant’s health status. Children and adults are usually exposed to toxic PTEs in UCPs drinking water by two main exposure pathways, i.e., ingestion and dermal contact. Furthermore, adults are regarded as the general population, while children are considered the sensitive group. The daily metal intake (DMI) was used to quantify the exposure to PTEs in UCPs water through ingestion and dermal contact. The daily metal intake via ingestion (DMIing) and the daily metal intake via dermal contact (DMIder) of PTEs in UCP water were calculated according to Equations (5) and (6), respectively.
D M I i n g = C × I R × E F × E D B W × A T
D M I d e r = C × S A × K p × E T × E D × E F × C F × A B S B W × A T
The descriptions of the parameters for the health risk model are presented in Table S2. Non-carcinogenic toxic risk was estimated by calculating the hazard quotients (HQ) and hazard index (HI). The hazard quotient (HQ) was calculated as the proportion of the DMI and the reference dose (RfD) for a specific PTE. The total non-carcinogenic risks (HI) were identified by the sum of the HQ values of all selected PTEs in the UCPs water. The HQing, HQder, and HI of all PTEs in UCPs water was calculated according to Equations (7)–(9).
H Q i n g = D M I i n g R f D i n g
H Q d e r = D M I d e r R f D d e r
H I = H Q = D M I R f D
where DMI is the average daily exposure dose through ingestion and dermal contact. RfDs are the reference doses of selected PTEs for ingestion and dermal contact. All RfD values of non-carcinogenic risk for both exposure pathways are presented by the United States Department of Energy (USDOE) [49], as shown in Table S2. The values of HQ and HI greater than 1 indicate non-carcinogenic risk to human health in the exposed population, while HQ and HI values less than 1 are considered safe.

2.3.2. Carcinogenic Risk Assessment

The carcinogenic risk of toxic PTEs was calculated by using the carcinogenic risk (CR), and the total cancer risk (TCR) represents the sum of the potential carcinogenic risks. The estimated CR value shows the probability of developing cancer risk for an individual during a lifetime exposure to carcinogenic toxic chemicals. The CR was calculated for PTEs (Cr, Cd, Pb, and Ni) in the present study, based on their observed corresponding DMI and available cancer slope factor (CSF) values. The non-carcinogenic and total carcinogenic risks can be identified by combining the overall risks for three exposure routes in the UCPs drinking water. The CR for two exposure pathways and TCR were calculated by using Equations (10)–(12) [50]:
C R i n g = D M I i n g × C S F
C R d e r = D M I d e r × C S F
T C R = C R
where CSF is the cancer slope factors (per mg/kg-day) as shown in Table S2. In general, the carcinogenic risk is unacceptable if the CR values exceed (>10−4), while CR values (1 × 10⁻⁶ < CR < 1 × 10⁻⁴) are assumed to be acceptable with no carcinogenic risk [51], whereas the CR values (<10−6) imply that the carcinogenic risk can be negligible [45].

2.4. Quality Assurance and Quality Control

The standard procedure was used to certify the PTEs quality in order to confirm the accuracy of the results. Double distilled water and certified standard solution (1000 mg/L) of Fluka Kamica (Buchs, Switzerland) were used for quality control of the standard solution and analysis of PTEs. The analytical chemical spectroscopic purity of 99.9% (Merck Darmstadt, Germany) was also used for the sample formation and PTEs analysis. The reagent blanks, duplicate samples, and standards were used with different concentrations. Analytical estimated error was less than or equal to 10%, and the reproducibility of the analytical results was within 5%.

2.5. Statistical Analysis

Descriptive statistics were performed using Microsoft Excel (2016) and SPSS (version 21). PCA-MLR was used for PTEs contamination sources using XLSTAT (2022). Origin Lab (2018) and SigmaPlot (14.0) were used to make all the figures. Arc Geographic Information System (Arc-GIS 10) software was used for the study area map and distribution maps of PTEs.

3. Results

3.1. Physiochemical Characteristics of UCPs Water

The physiochemical properties of all UCPs water samples are presented in Table S3 and Figure 3. There is a substantial variation in the concentration of physiochemical parameters in drinking water of all UCPs. The overall pH varied from 6.10 to 8.46 for drinking water of all the UCPs, suggesting that it is neutral to alkaline in nature. The lowest mean value of pH (6.95) was recorded for BPC and PTPC, while a high pH value (8.03) was observed for LGPPA. The EC values were varied for drinking water of all UCPs, ranged from 192 to 1394 μS/cm. The lowest EC mean value was recorded for LGPPA (331 μS/cm), and the highest EC mean value was detected for APH (959 μS/cm). Furthermore, the concentration of total dissolved solids (TDS) of all UCPs samples was observed between 220–1245 μg/L. The highest TDS value was recorded for DWPN, with a mean value of 986 μg/L, while the lowest TDS was observed for BPC with a mean value of 313 μg/L. These physiochemical parameters possibly influence and control the occurrence and bioavailability of PTEs in groundwater, which is further discussed in Section 4 below.

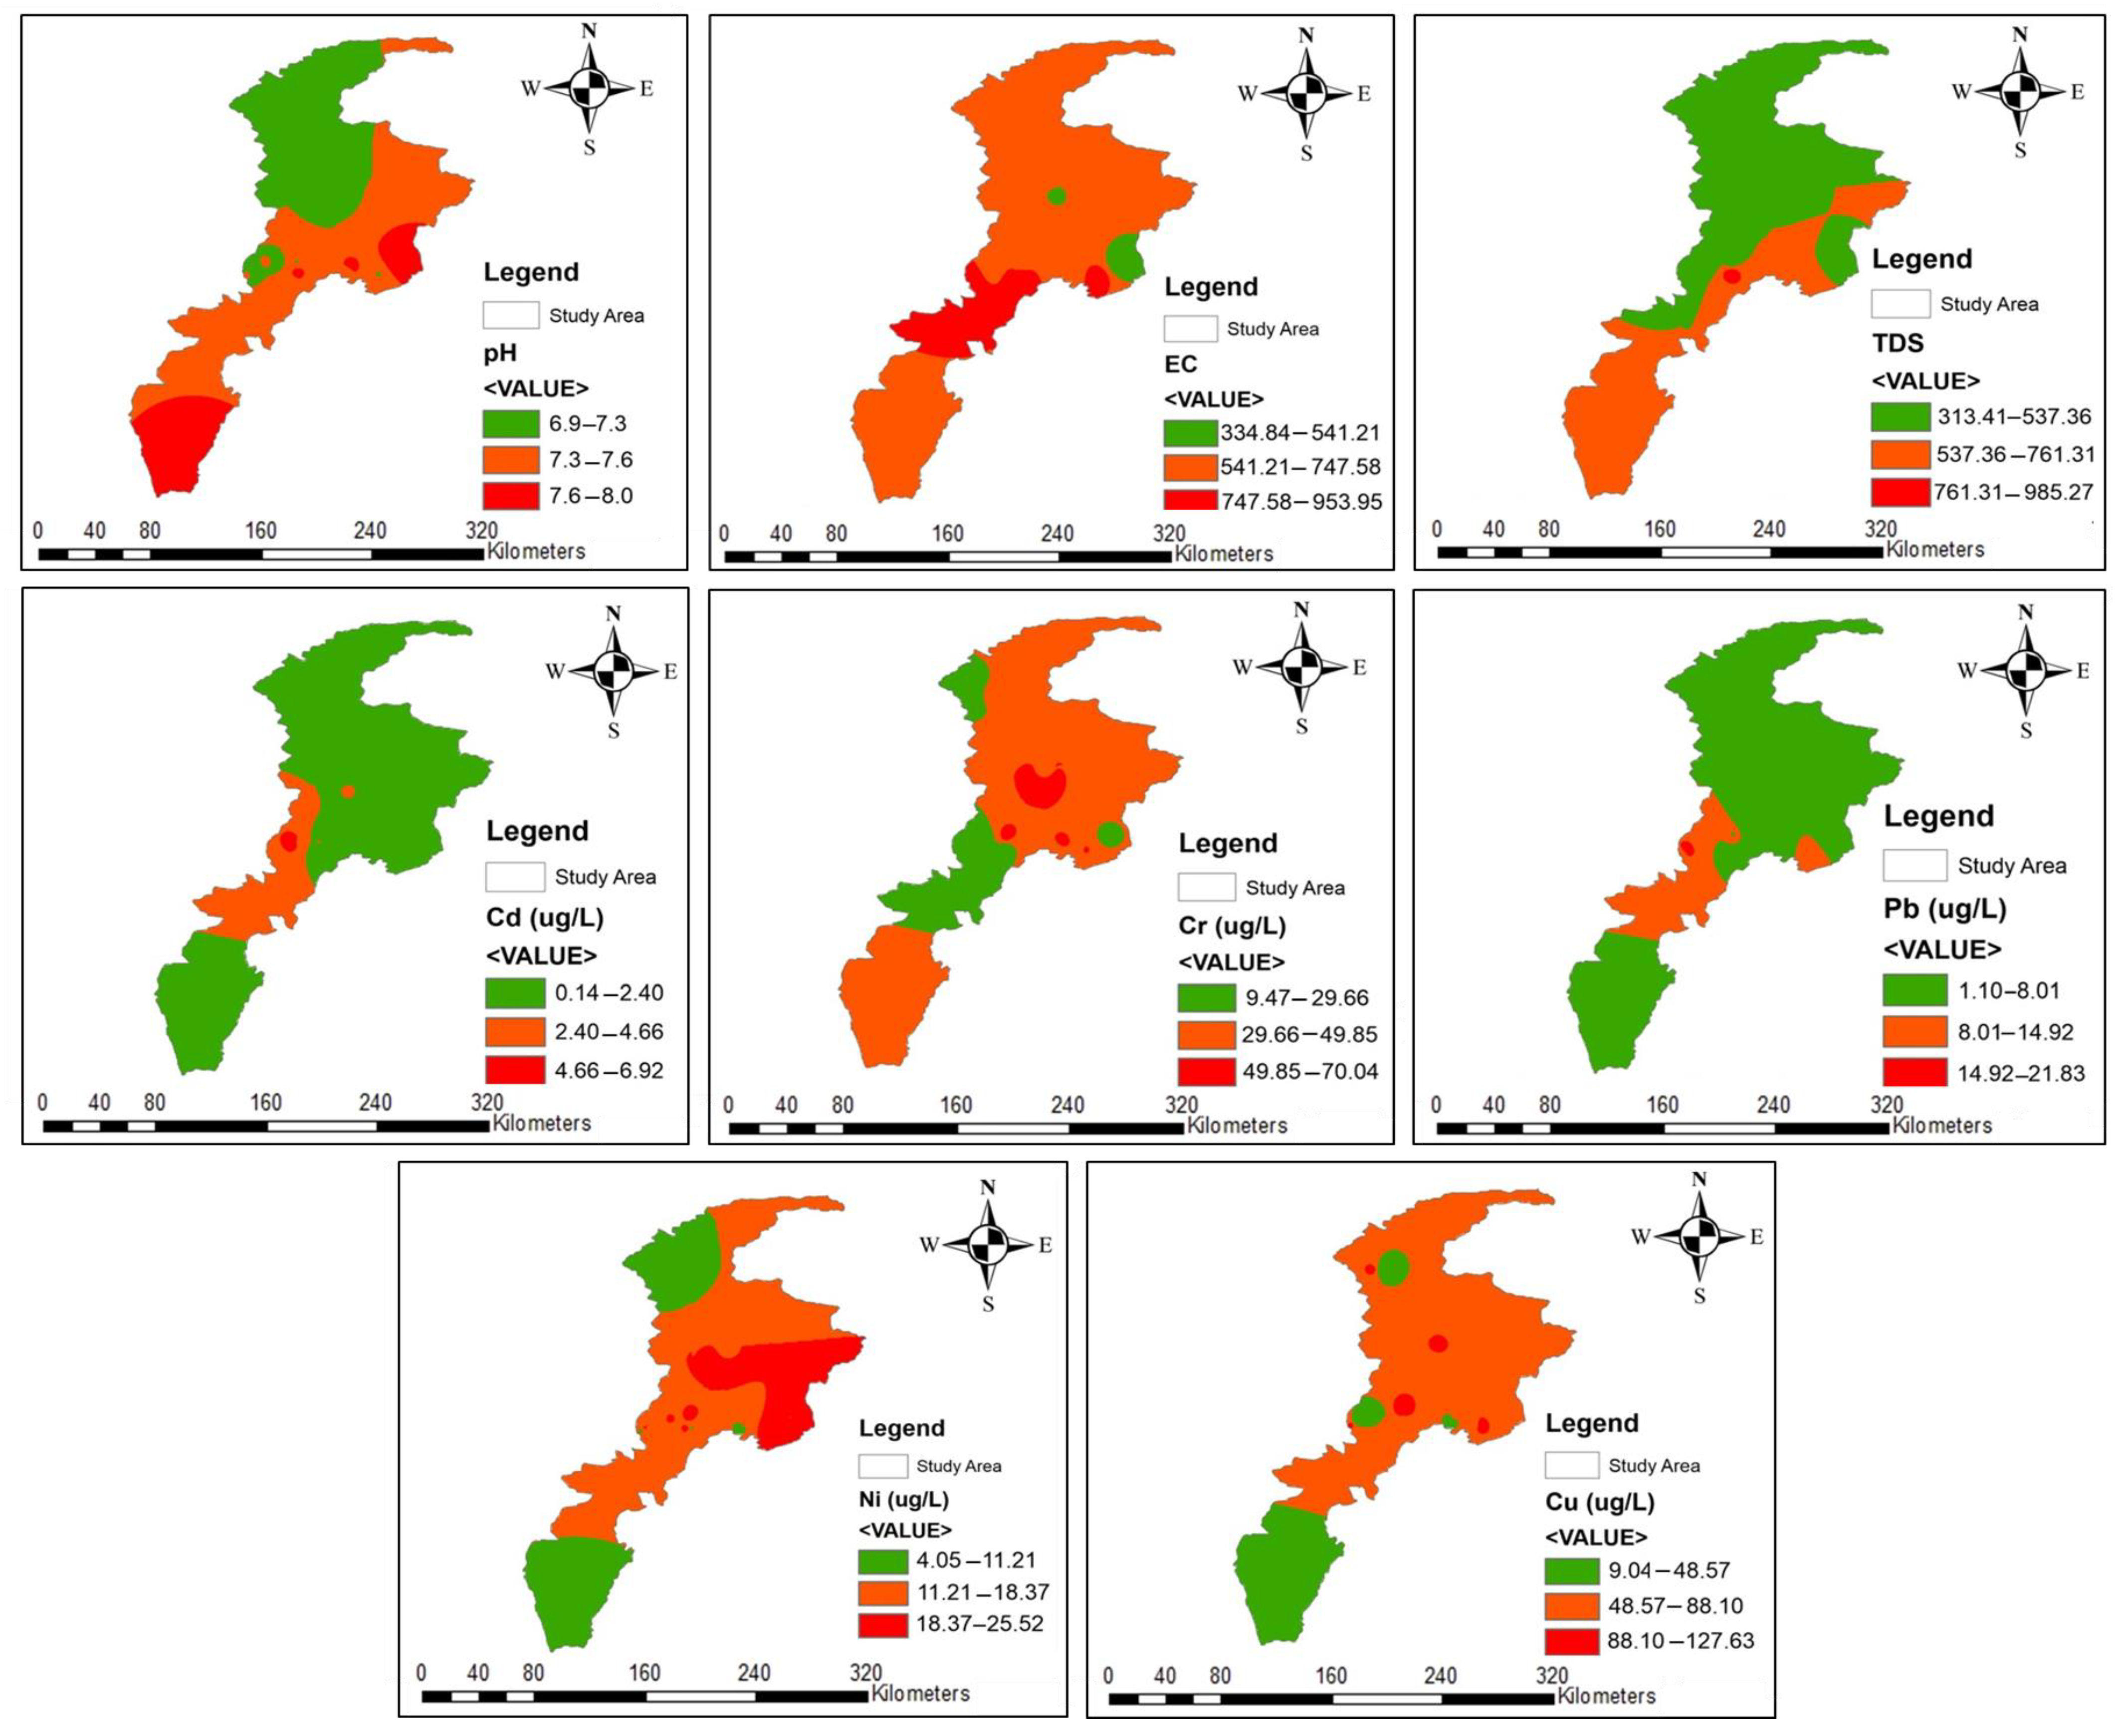
3.2. Spatial Distribution of PTEs in UCPs Water

The basic descriptive statistics and spatial distribution of PTEs concentrations in UCPs drinking water are presented in Table S3 and Figure 3. The distribution levels of PTEs in the drinking water of all UCPs are greatly varied. Among PTEs, Cu had the highest concentration for all UCPs, followed by Cr, Ni, Pb, and Cd. Cu was observed with elevated concentration, ranging from 38.8–222 µg/L with a mean value of 130 ug/L for PWLPH. The lowest concentration was recorded for Cd, ranged from 0.09–0.19 µg/L with a mean value of 0.14 ug/L in the UCP water of PTPC. Cr concentrations exceeded the permissible limit (50 µg/L) set by WHO [52] in UCPs water of SPC, PWLPH, WWPS, SCPM, and YSPM, while its concentrations were found to be within acceptable limits of WHO [52] and PAK-EPA [53].
For BPC and SPC, Cu exhibited high mean concentrations (31.1 and 19.0 µg/L), followed by Ni (19.5 and 14.6 µg/L) and Cr (11.6 and 12.5 µg/L), respectively. A low mean concentration was recorded for Pb (8.49 and 9.37 µg/L) and followed by Cd (4.35 and 6.95 µg/L), respectively. For ZPP, Pb showed a high mean concentration of 21.9 µg/L, followed by Ni (19.2 µg/L) and Cu (14.0 µg/L), respectively. The concentrations of all selected PTEs were found to be within allowable limits of WHO in all the UCPs water, indicating low contamination, except Cd. Noticeably, Cd concentration was above the permissible limit (3 µg/L) of WHO, with mean values of 4.35 and 4.05 µg/L in UCPs water of BPC and ZPP, respectively. Similarly, Cu showed high abundance with mean values of 106 and 75.5 µg/L, while Cd and Pb showed lowest concentrations with mean values (3.60 and 1.12 µg/L) and (9.54 and 2.45 µg/L) in TPP and JPN, respectively. Likewise, Cu exhibited high mean concentration (80.6 µg/L), while the lowest mean concentration (0.42 µg/L) was recorded for Cd in DWPN. Furthermore, the PTEs such as Cr and Ni concentrations were relatively comparable for PWLPH, APH, and SKIPS, with mean values (51.4, 49.2, and 46.1 µg/L) and (25.8, 18.2 and 16.5 µg/L), respectively. To the contrary, the concentrations of Cu were comparatively higher than the other PTEs, with mean values of 130, 54.2, and 98.8 µg/L, respectively, in the above-mentioned UCPs. Cr and Pb mean concentrations (51.4 and 15.2 µg/L) in PWLPH were found to be higher than the threshold values of WHO [52] and PAK-EPA [53], respectively. The mean concentrations of PTEs in drinking water showed high variation between different UCPs of KPK, indicating low to high contamination of Cd, Cr, and Pb, which exceeded the permissible limits of WHO [52] and PAK-EPA [53]. The PTEs concentrations were noticeably low to moderate level for WWPS and APS. Similarly, Cr was remarkably observed with high mean values of 68.3, 71.1, 61.5, and 61.3 µg/L for WWPS, GCGPS, SCPM, and YSPM, respectively and exceeded the threshold limits of WHO [52] and PAK-EPA [53]. Cd exhibited low concentration levels (0.67 and 0.99 µg/L), followed by Ni (2.60 and 19.2 µg/L), for APS and YSPM, respectively. Among UCPs, the PTEs concentrations were comparatively lower, especially for Cd, Pb, and Ni in UCPs drinking water of GNPC, PTPC, HNPDK, and IPDK. Cu showed high concentration for GNPC with mean value of 104 µg/L, while to the contrary, PTPC, HNPDK, and IPDK showed low Cu concentration with mean values of 8.5, 10.0, and 19.1 µg/L, respectively, and Cr had moderate mean concentration in the aforementioned UCPs.
Similarly, LGPPA and SPPA showed relatively similar mean values of PTEs such as Cd (0.55 and 0.58 µg/L) and Cu (60.1 and 51.1 µg/L), respectively. The spatial distribution of high abundance of PTEs (especially Cu, Cr, Pb, and Cd) in all UCPs water confirms high contamination levels that could be subjected to the input of potential sources in the study areas. Overall, in the present study, the mean concentrations of PTEs occurred in descending order of Cu > Cr > Ni > Pb > Cd for all UCPs.

3.3. Source Apportionment of PTEs

Principle component analysis (PCA) is an effective technique used for source apportionment of PTEs [54]. In this study, we used PCA multilinear regression (PCA-MLR) to extract three major component factors in terms of eigenvalues (eigenvalue > 1) and estimated total variance. The positive and negative loadings for different datasets of PTEs in UCPs are presented in Table 1. Overall, four significant factors (F1, F2, F3, and F4) were obtained, and the first two significant loading factors were observed for PTEs in UCPs, as presented in Figure 4. The positive loading factors imply that the presence of the water variables could influence the groundwater or surface water samples. Contrarily, the negative loading factors show that the groundwater and surface water quality are not affected by the water variables. The four factors of the UCPs water sources described 80.8% of the total variation with an eigenvalue of 6.56, as shown in Table 1.
Factor 1 (F1) described 29.9% of the total variance with an eigenvalue of 2.40. F1 is predominantly loaded with PTEs such as Cd, Pb, and Ni, showing moderate positive loadings (0.78), (0.75), and (0.50), respectively, except pH and TDS have moderate negative loadings (−0.69) and (−0.68), respectively. F1 contributed to the moderate loadings of PTEs for the UCPs drinking groundwater, suggesting anthropogenic and natural sources. The negative loadings of pH and TDS could be associated with the features and mobility of PTEs [55]. Factor 2 (F2) described 20.9% of the total variance with an eigenvalue of 1.67. F2 had strong positive loadings for Cr (0.75), Ni (0.63), and Cu (0.78), respectively. The contribution of the strong loadings of PTEs in F2 results showed anthropogenic origin in drinking water sources of UCPs.
Thus, F1 and F2 results showed moderate to high loadings of physicochemical and PTEs contribution, suggesting anthropogenic and natural sources in the drinking water sources of UCPs. Factor 3 (F3) accounted for 18.6% of the total variance with an eigenvalue of 1.49 and was strongly characterized with EC (0.90) and moderate loading with TDS (0.66). The high loading of EC and moderate TDS reflect anthropogenic sources in drinking water sources of UCPs. Factor 4 (F4) explained 11.3% of the total variance with an eigenvalue of 1.00. F4 showed a low contribution in the PCA results, and only pH had a positive moderate loading of 0.62 in F4. Moderate loadings of the physiochemical parameters might be attributed to their moderate to high concentration in the study area.

3.4. Pollution Assessment of PTEs

Pollution indices (PTE-PI and PTE-EI) of PTEs were carried out for the drinking water quality of UCPs. PTE-PI and PTE-EI represent different classes with low to high risk levels. The PTE-PI values were calculated based on all PTEs for each UCP (Table 2). The mean concentration value of selected PTEs (Cd, Cr, Pb, Ni, and Cu) were considered while calculating the PTE-PI and PTE-EI of the UCPs water.
Results showed that PTE-PI values of PTEs were observed from low to high values for all the drinking water samples of UCPs, ranging from 11.4 to 116 with the mean PTE-PI value (48.2), which is below the critical threshold pollution index value of 100. The lowest PTE-PI value was recorded for GNPC, while the highest PTE-PI value was observed for ZPP. Overall, the PTE-PI values for all the UCPs water samples were found to be below the critical limit of PTE-PI (100), except SPC (113) and ZPP (116), which exceeded the threshold critical value. These UCPs (SPC and ZPP) showed high PTE-PI values, indicating contamination in drinking water in comparison with other UCPs. In most of the cases (16 UCPs), the mean PTE-PI was much lower than the allowable index value of 100 suggested for drinking water [56]. The scales were slightly altered utilizing multiples of the median as a criterion in order to apply these PTE-PI indices. To distinguish between different levels of contamination, the data are divided into three classes: low (<40), medium (40–80), and high (>80). According to the PTE-PI results, 50% of 10 UCPs samples showed low pollution levels (low risk) with “Excellent” water quality, 40% of eight UCPs had medium pollution levels (medium risk) with “Good” and “Very Good” water quality, and 10% of two UCPs indicated high pollution levels (high risk) with “Poor” water quality.
Furthermore, PTE-EI was also used for the brief interpretation of the pollution index [57] of PTEs in UCPs water. The PTE-EI values of PTEs ranged from 0.810 to 3.48 for all UCPs water, with a mean value of 2.04 (Table 2). The respective mean values of the samples were used to construct different PTE-EI values, and the various levels of contamination are characterized by the mean values. Moreover, the PTE-EI values were classified on the basis of pollution levels as low (PTE-EI < 1), medium (PTE-EI = 1–2), and high (>2) as described previously by [50]. Therefore, the results were observed according to the proposed PTE-EI criteria as follows: 5% of samples (1 UCP) showed low pollution level (low risk), 45% of (9 UCPs) samples had medium pollution levels (medium risk), and 50% of (10 UCPs) samples exhibit high pollution levels (high risk), as shown in Table 2. Similar observations and results of PTE-PI and PTE-EI were found in agreement with the study reported by [58].

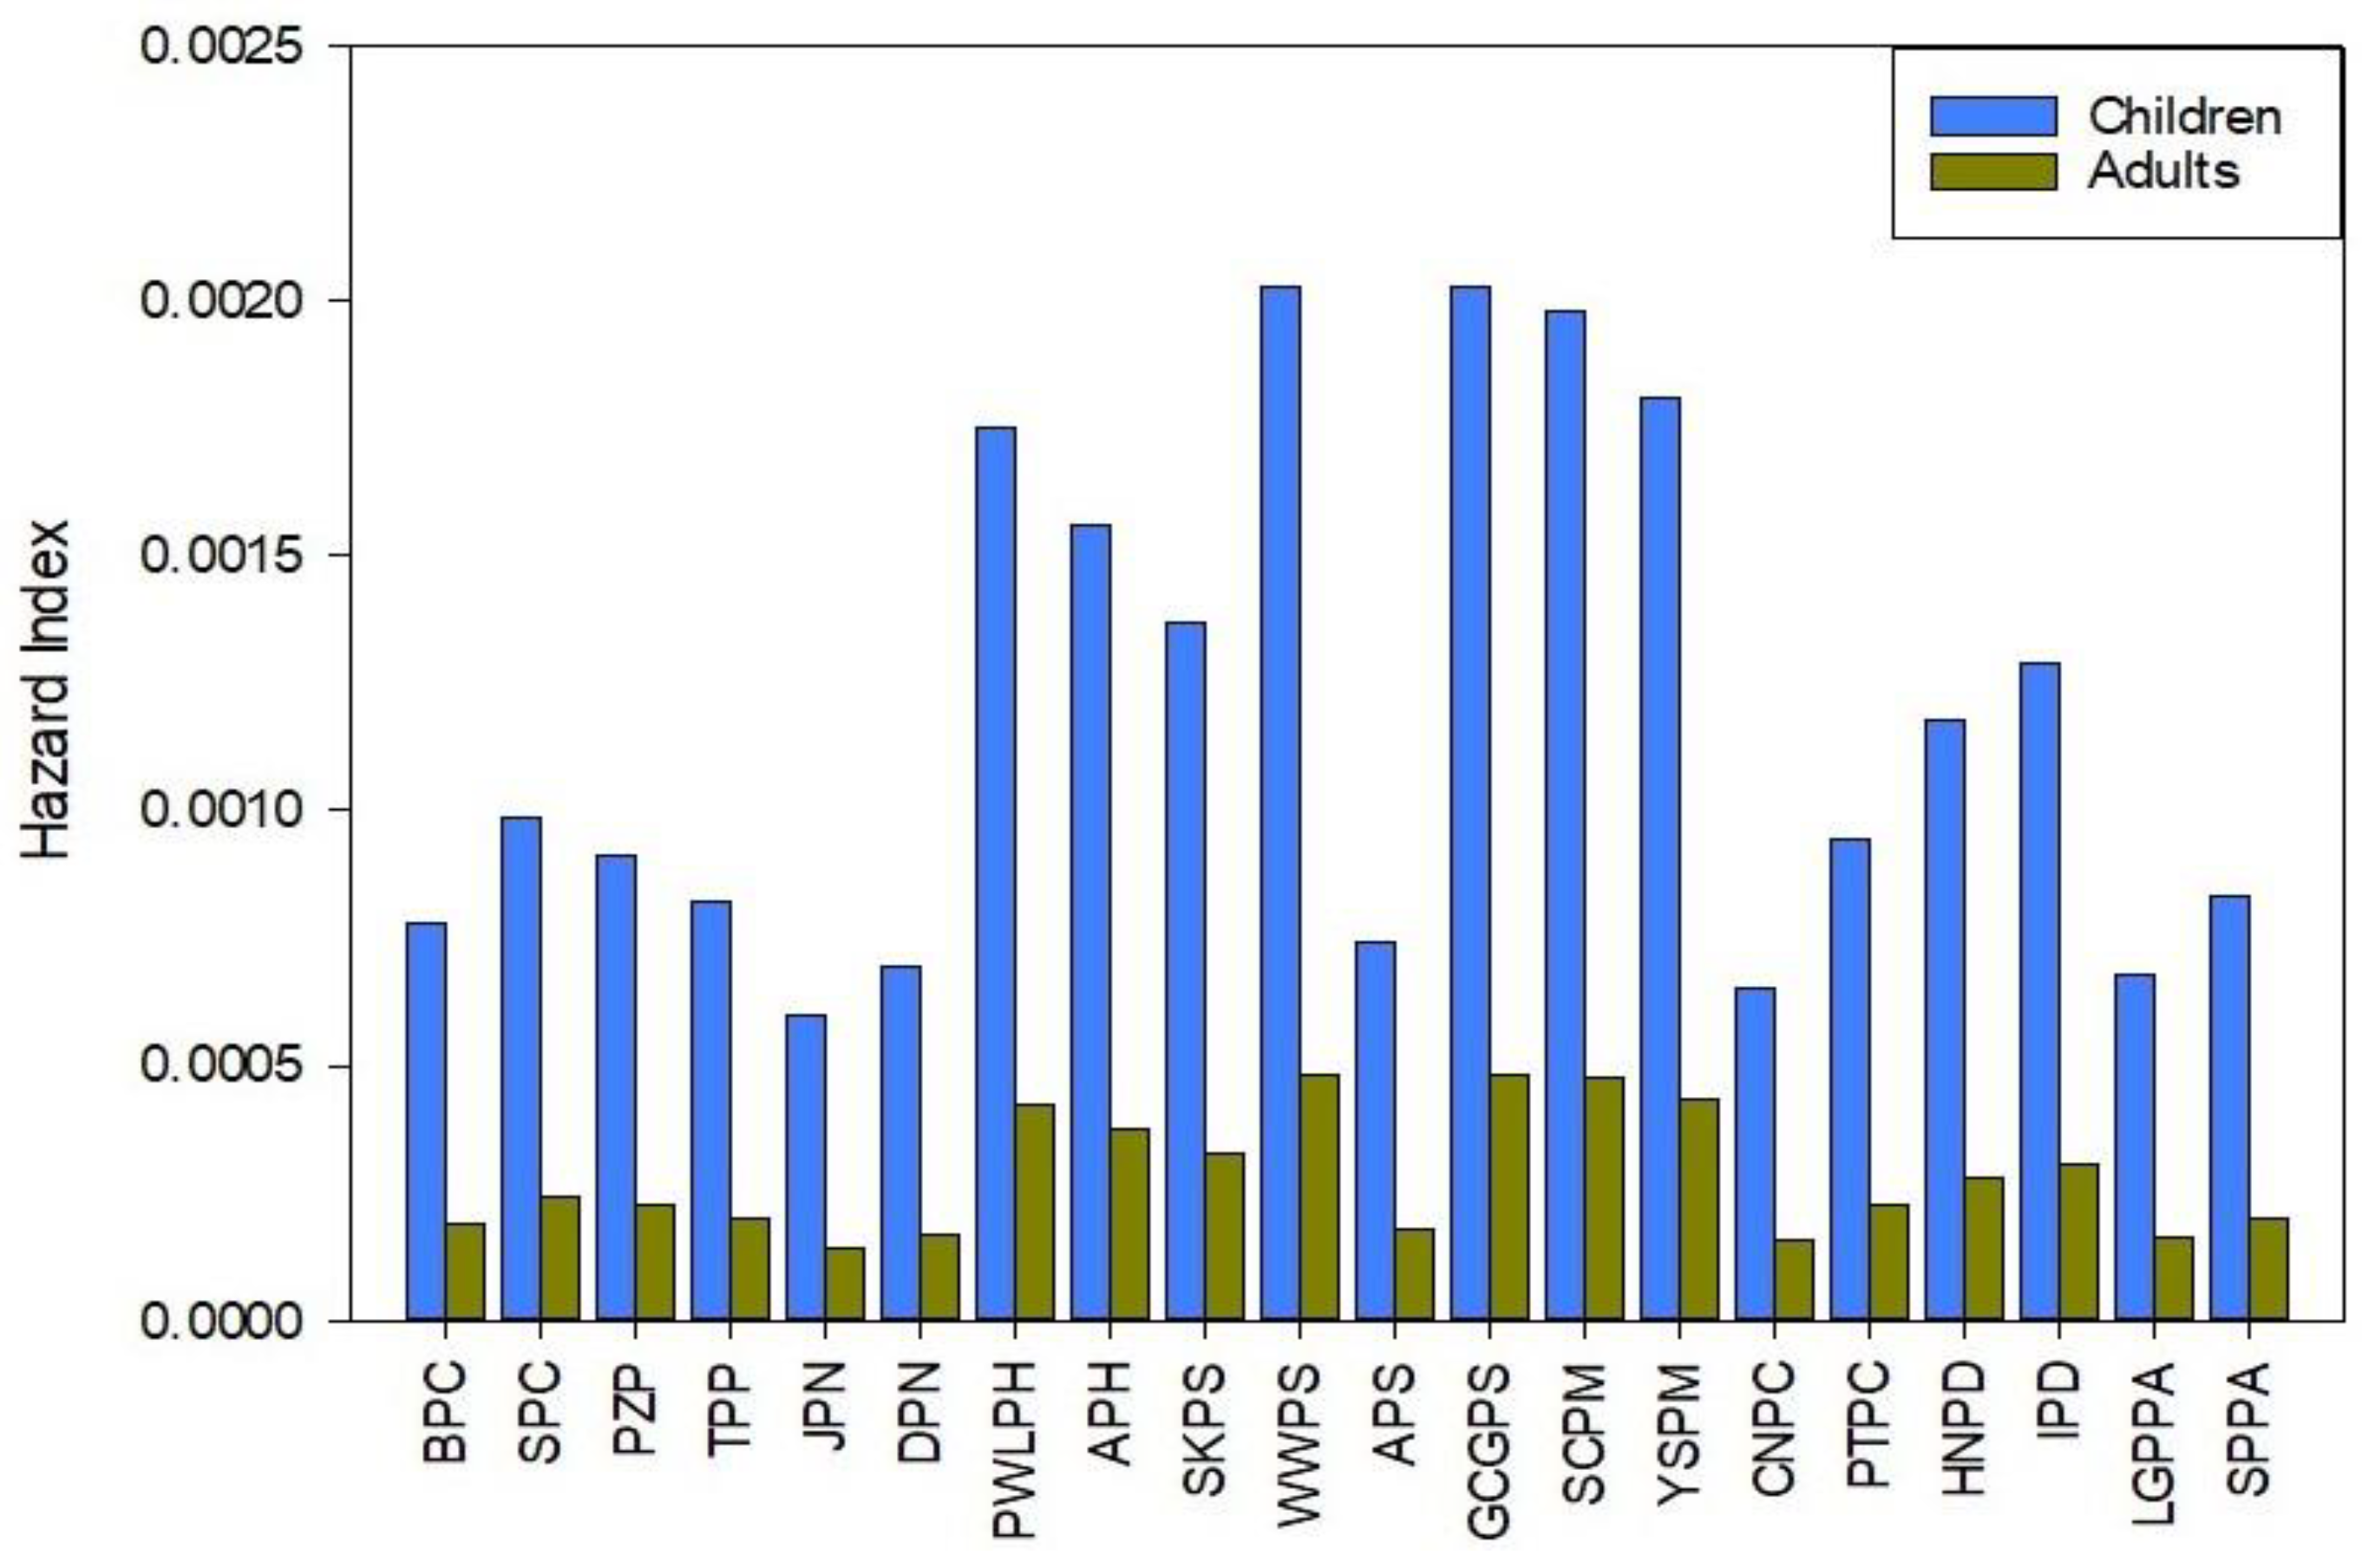
3.5. Health Risk Assessment

The health risks of selected PTEs in UCPs drinking water sources were evaluated for the adults and children via two exposure pathways, i.e., ingestion and dermal contact. The statistical results of DMI for both adults and children via the two exposure pathways are shown in Tables S4 and S5. The results showed that DMI values were higher for children than adults in both exposure routes. Cd had the lowest DMI values for both exposure routes as compared to other PTEs. The non-carcinogenic risks of PTEs also showed low HQ values for adults in comparison with children. Similarly, the ingestion route is the dominant exposure pathway for non-carcinogenic risks of PTEs, followed by the dermal route. The highest HQ mean value (2.67 × 10⁻³) was observed for Cr in GCGPS, while the lowest HQ mean value (3.77 × 10⁻⁶) was recorded for Ni in APS via the ingestion route. For the dermal route, Cr had the highest HQ mean value (6.18 × 10⁻³) for GCGPS, while Ni showed the lowest HQ mean value (9.13 × 10⁻⁸) for SKIPS. Based on non-carcinogenic risk results, the HQ values of all PTEs for both exposure routes were less than the standard permissible limit (HQ < 1), as shown in Tables S6 and S7, suggesting no non-carcinogenic risk to the local population. The decreasing trend of the HQ mean values of PTEs was Cr > Pb > Cd > Ni > Cu, via ingestion for both children and adults, while for the dermal route, it was as follows: Cr > Cd > Pb > Cu > Ni, for both children and adults.
The HI values of all PTEs in UCPs were less than 1 for both the adults and children, as shown in Figure 5. HI values of PTEs ranged from 2.03 × 10⁻³ to 5.98 × 10⁻⁴ for children, and for adults they were 4.83 × 10⁻⁴ to 1.44 × 10⁻⁴, via both exposure pathways, respectively. This indicates that exposure of PTEs in the UCPs could not pose non-carcinogenic risks to adults and children through the two exposure routes. Among UCPs, HQ and HI values were relatively lower in JPN, DWPN, APS, GNPC, and PTPC than the others. Generally, the HQ and HI values of children were relatively higher than those of adults in all UCPs, signifying that the non-carcinogenic risk of children is higher than that of adults via both exposure pathways (Tables S6 and S7 and Figure 5).
Furthermore, CR results showed that PTEs (Cr, Cd, Pb, and Ni) had the highest potential carcinogenic risk for both adults and children and surpassed the threshold value (1.00 × 10⁻⁴) in all UCPs, except Cd and Ni for adults (<1.00 × 10⁻⁴) via the ingestion route (Table 3). The highest value was recorded for Cr (3.28 × 10⁻¹) in GCGPS via the ingestion route, while the lowest CR value was observed for Ni (6.34 × 10⁻⁵) in APS. Moreover, CR values of all PTEs were lower than the standard limit, except Cr had a high CR value (>1.00 × 10⁻⁴) for children via the dermal route. High CR values of Cr (>1.00 × 10⁻⁴) were recorded for all the UCPs, except BPC, SPC, ZPP, TPP, and JPN via the dermal route. The carcinogenic risk levels of PTEs in UCPs are found to be acceptable, except Cd and Ni for adults (<1.00 × 10⁻⁴) via the ingestion route and Cr (>1.00 × 10⁻⁴) for children via the dermal route are prone to cause potential carcinogenic risk. The TCR mean values were identified for selected PTEs (Cr, Cd, Pb, and Cu) and were found to be varied in the present study. The TCR values for Cr, Cd, Pb, and Cu exceeded the acceptable limit (1.00 × 10⁻⁴) except Cd and Ni for adults (Table 3). High TCR values of Cr, Cd, Pb, and Cu indicate high total carcinogenic risk for children and adults exposed to drinking water in all UCPs, and were found to be in agreement with the results of high cancer risk observed for adults and children [59].

4. Discussion

The physiochemical properties play a critical role in influencing the bioavailability of PTEs in groundwater. All the drinking water samples had relatively low to high pH levels in the present study of UCPs. By comparison, the mean pH values in UCPs water were slightly varied, reflecting the existence of alkalizing products such as calcium-magnesium carbonate or calcium carbonate in flagstones, gravel, concrete, cement, and mortar as well as the atmospheric particulate deposition [60,61], resulting in release into the groundwater system. As a result, the drinking water sources could be affected by low to high pH and influence the PTEs concentration. TDS mean values were high for most of the UCPs water, and the presence of high TDS could be attributed to the leaching of ions into the groundwater system [62].
The comparison of PTEs concentrations in all samples with the permissible limits of WHO revealed varying degrees of contamination in drinking water sources of UCPs. Our results indicated that PTEs (Cu, Cr, and Cd) concentrations were generally higher in the UCPs drinking water than in the previous studies. For instance, the PTEs (Cu, Cd, Ni) concentrations (Figure 3) in the present study were relatively higher in most of the UCPs than in a previous study of lakes along urban gradient lakes in Wuhan, China [63]. Similarly, high Cu, Cr, Pb, Ni, and Cd were found to be higher than the previous study of the urban Houguan Lake in Wuhan, China [64], and also higher than the reported values of PTEs (Cu, Pb, and Cd) in urban groundwater of Nnewi, Southeast Nigeria [65]. In contrast, the mean values of PTEs concentrations were relatively lower than the results of the urban Mariout Lake, Egypt, reported by [66], and were lower than the mean values of Cu, Pb, Ni, and Cr (except Cd) in the groundwater of an industrial park situated at the southeast of Zhejiang Province, China [67]. In another study, PTEs such as Cr, Cu, and Cd were relatively higher, while Pb concentrations were lower than in the previous study of drinking water sources in the industrial city of Sialkot, Punjab Pakistan [26], and were higher than in our recent studies of [68,69,70]. The variation in PTEs concentration level demonstrates numerous factors depending upon various potential sources of anthropogenic activities and natural geological backgrounds, resulting in UCPs water contamination. This variation in PTEs concentration also reflects the impact of physiochemical properties of the soil, which might affect the mobilization and bioavailability of PTEs in the groundwater system. For instance, the bioavailability and mobility of PTEs can potentially be influenced by soil pH, organic matter, and cation-exchange mechanism. In addition, due to the precipitation mechanism between PTEs and anions, PTEs can be more readily accessible and mobilized in comparison to high pH [71]. Another reason is that urbanization in UCPs areas could also affect the soil texture, soil pH, cation-exchange capacity, bulk density, and thus PTEs discharge and deposit in the soils [72] and release into the groundwater system. Moreover, long-term disposal of solid waste and wastewater irrigation in parks result in UCPs soil contamination with high level of PTEs. Additional factors that contribute to the contamination of the soil with PTEs include inadequate sludge and septic tank treatment plans, sanitary system leakage, and raw sewage water from installations [73].
Some other factors like pH may have an impact on bioavailability of PTEs in the drinking water of UCPs. Evidently, Li et al. also reported that the physiochemical properties of the soil ecosystem (soil pH, cation exchange mechanism, and organic matter) could influence bioavailability of PTEs. The dissolution of PTEs occur in soil due to redox potential under acidic to alkaline conditions (pH 5.0 to 8.0) and reach into the groundwater through leaching [74]. In the present study, some of the UCPs (BPC, SKIPS, and PTPC) had low pH level with moderate to high PTEs concentration as compared to the other UCPs. PTEs are bioavailable and easier to mobilize at low pH levels compared to high pH levels because of soil precipitations between various anions and metals [75]. Some of the anthropogenic sources such as domestic waste disposal contribute to release toxic pollutants [76] in the UCPs. According to a previous study of PTEs in Peshawar urban parks in Pakistan, Cd originates from industrial facilities (power stations, coal combustion, and the metallurgical sector), whereas Ni is derived from agricultural practices including wastewater irrigation and solid waste disposal [73], and Pb is primarily found in urban soil due to vehicle exhaust emissions [77]. Furthermore, ref. [5] reported that the soil’s characteristics, pollutant emissions, and the geochemical background had a significant impact on the spatial distribution of PTEs.
In the present study, moderate and high loadings of selected PTEs in PCA results demonstrate numerous factors as shown in Figure 4, showing their anthropogenic and natural sources. The loading factors of pH in F1 and F4 factors reflect the presence of alkaline salts such as calcium-magnesium carbonate CaMg(CO3)2 and calcium carbonate (CaCO3) in flagstones, concrete, gravel stones, and cement in soils [71], resulting in influencing the PTEs availability in UCPs. Despite the anthropogenic sources, previous research demonstrated that soil parent materials had an impact on the distribution of PTEs like Cd [3]. The PTEs such as Ni could originate from waste disposal and agricultural activity of wastewater irrigation [73], which could be released to the drinking water sources of UCPs. Other PTEs (Cu and Pb) in urban parks are mainly derived from vehicular exhaust emissions [77].
The results of health risk assessment showed that children are more exposed to average daily exposure doses due to smaller skin surface area and lower body weight. Children are also more susceptible to external environment during their developmental stages and growth. This could be a reason that children are more exposed to drinking water sources in UCPs via ingestion and dermal contact than adults. Previous studies also reported that children are more vulnerable to average daily exposure dose and high non-carcinogenic risks than adults [78]. We concluded that long-term exposure to these toxic PTEs (Cd, Ni, and Cr) through drinking water consumption of UCPs presents a carcinogenic risk to the local population. Our results of HQ, HI, and CR are consistent with the recent study conducted by [79] and [34]. TCR results also showed high values of Cr, Cd, Pb, and Cu, indicating high total carcinogenic risk for children and adults exposed to drinking water in all UCPs. In the present study, children present high non-carcinogenic risk and carcinogenic risk for both exposure routes. In general, children are typically more susceptible than adults to exposure to toxic contaminants due to their continuous outdoor activity [80] and their propensity to play on the ground, put objects in their mouth, and use their hands [81,82], confirming the risk of drinking water contaminated with PTEs in UCPs.
Additionally, heavy traffic and industrialized regions can influence and prominently increase these contaminants in the soil [83], resulting in contaminating the drinking water sources as well in local UCPs. The public urban parks are more likely accessed and visited by children and adults, and contaminated soil can be introduced in UCPs by their footsteps. The soil in these locations also has a significant impact on the population’s health, posing a concern if pollutant concentrations are high [84]. As a result, PTEs can possibly reach the groundwater system though leaching due to contaminated soil and continuous wastewater irrigation. A high content of PTEs is released as a result of long-term wastewater discharge and solid waste disposal in parks. Additionally, improper treatment and leakage in sludge and septic tank schemes, sanitary system seepage from installations, and discharge of raw sewage water [73] also contribute to contaminating the drinking water sources with PTEs in UCPs. Therefore, with the primary attention on prevention, and gaining control of potential health concerns needs to be undertaken related to exposure to PTEs, particularly for children in UCPs of Khyber Pakhtunkhwa, Pakistan.

5. Conclusions

In the present study, the mean concentrations of PTEs (Cd, Cr, Pb, Ni, and Cu) showed high variation in drinking water sources of UCPs. PTEs such as Cd, Cr, and Pb had high contamination and exceeded the permissible limits of WHO and PAK-EPA. The PCA results of PTEs revealed high anthropogenic sources of traffic and industrial emissions, solid waste disposal, wastewater irrigation, and soil parent materials. The PTE-PI and PTE-EI results showed low to high pollution levels for all the UCPs, with high values for Sardaryab Park Charsadda (SPC) and Zoo Park Peshawar (ZPP), indicating unhealthy drinking water quality in comparison with other UCPs. The HQ and HI values of all PTEs were less than the permissible limit (<1), while CR values surpassed the threshold value (1.00 × 10⁻⁴) of PTEs for both adults and children in all UCPs, except Cd and Ni for adults via the ingestion route. For the dermal route, CR values of Cr were higher than the standard limit among PTEs in most of the UCPs. The TCR values of PTEs were higher for children and adults via drinking water consumption in all UCPs. Our results revealed high carcinogenic risk of PTEs (Cd, Ni, and Cr) exposed to the local population in all UCPs. Therefore, the present study proposed that the government should control and mitigate the PTEs pollution in drinking water sources by enforcing environmental regulations as well as implementing the proper management strategies to remediate its pollution in urban children’s parks and reduce potential health risk in urban areas. The assessment of PTEs contamination and the health risk evaluation used in this work should be used in future risk assessments, as it can aid in the implementation of more appropriate metal risk management in urban environments worldwide.

Supplementary Materials

The following supporting information can be downloaded at https://www.mdpi.com/article/10.3390/su151713177/s1: Table S1. The mean Wi and Qi calculation for groundwater samples of the study area. Table S2. Parameter values used for daily metal intake in health risk models. Table S3. Physiochemical and PTEs mean concentration (μg/L) in drinking water sources of UCPs in KPK, Pakistan. Table S4. The DMI values of selected PTEs via ingestion for drinking water in UCPs. Table S5. The DMI values of selected PTEs via dermal contact for drinking water in UCPs. Table S6. Non-carcinogenic risks posed by each PTE via ingestion of UCPs water in KPK. Table S7. Non-carcinogenic risks posed by each PTE via dermal exposure pathway of UCPs water in KPK.

Author Contributions

Conceptualization, J.G. and J.N.; Methodology, J.G.; writing—original draft preparation, J.G.; formal analysis, J.N. and Z.U.; validation, J.N.; investigation, Z.U. and S.Z.H.; reviewing and editing, N.R., S.K., and M.S.; funding acquisition, M.H.A. All authors have read and agreed to the published version of the manuscript.

Funding

This research was funded by King Saud University through a Research group project under grant number (RSP2023R191).

Institutional Review Board Statement

Not applicable.

Informed Consent Statement

Not applicable.

Data Availability Statement

Data will be made available on request.

Acknowledgments

The authors extend their appreciation to the Researchers Supporting Project number (RSP2023R191), King Saud University, Riyadh, Saudi Arabia.

Conflicts of Interest

The authors declare no conflict of interest.

References

  1. UN. World Urbanization Prospects; The Population Division of the Department of Economic and Social Affairs: New York, NY, USA, 2018. [Google Scholar]
  2. Coulon, F.; Jones, K.; Li, H.; Hu, Q.; Gao, J.; Li, F.; Chen, M.; Zhu, Y.-G.; Liu, R.; Liu, M. China’s soil and groundwater management challenges: Lessons from the UK’s experience and opportunities for China. Environ. Int. 2016, 91, 196–200. [Google Scholar] [CrossRef] [PubMed]
  3. Liu, L.; Liu, Q.; Ma, J.; Wu, H.; Qu, Y.; Gong, Y.; Yang, S.; An, Y.; Zhou, Y. Heavy metal (loid) s in the topsoil of urban parks in Beijing, China: Concentrations, potential sources, and risk assessment. Environ. Pollut. 2020, 260, 114083. [Google Scholar] [CrossRef]
  4. Gu, Y.-G.; Gao, Y.-P. Bioaccessibilities and health implications of heavy metals in exposed-lawn soils from 28 urban parks in the megacity Guangzhou inferred from an in vitro physiologically-based extraction test. Ecotoxicol. Environ. Saf. 2018, 148, 747–753. [Google Scholar] [CrossRef] [PubMed]
  5. Wu, S.; Zhou, S.; Bao, H.; Chen, D.; Wang, C.; Li, B.; Tong, G.; Yuan, Y.; Xu, B.J. Improving risk management by using the spatial interaction relationship of heavy metals and PAHs in urban soil. J. Hazard. Mater. 2019, 364, 108–116. [Google Scholar] [CrossRef] [PubMed]
  6. Liu, X.; Zhong, L.; Meng, J.; Wang, F.; Zhang, J.; Zhi, Y.; Zeng, L.; Tang, X.; Xu, J. A multi-medium chain modeling approach to estimate the cumulative effects of cadmium pollution on human health. Environ. Pollut. 2018, 239, 308–317. [Google Scholar] [CrossRef] [PubMed]
  7. Yadav, I.C.; Devi, N.L.; Singh, V.K.; Li, J.; Zhang, G. Spatial distribution, source analysis, and health risk assessment of heavy metals contamination in house dust and surface soil from four major cities of Nepal. Chemosphere 2019, 218, 1100–1113. [Google Scholar] [CrossRef] [PubMed]
  8. Adewumi, A. Heavy metals in soils and road dust in Akure City, Southwest Nigeria: Pollution, sources, and ecological and health risks. Expos. Health 2022, 14, 375–392. [Google Scholar] [CrossRef]
  9. Santorufo, L.; Van Gestel, C.A.; Maisto, G. Ecotoxicological assessment of metal-polluted urban soils using bioassays with three soil invertebrates. Chemosphere 2012, 88, 418–425. [Google Scholar] [CrossRef]
  10. Penteado, P.B.; Nogarotto, D.C.; Baltazar, J.P.; Pozza, S.A.; Canteras, F.B. Inorganic pollution in urban topsoils of Latin American cities: A systematic review and future research direction. Catena 2022, 210, 105946. [Google Scholar] [CrossRef]
  11. Singh, K.K.; Tewari, G.; Kumar, S.; Busa, R.; Chaturvedi, A.; Rathore, S.S.; Singh, R.K.; Gangwar, A. Understanding urban groundwater pollution in the Upper Gangetic Alluvial Plains of northern India with multiple industries and their impact on drinking water quality and associated health risks. Groundw. Sustain. Dev. 2023, 21, 100902. [Google Scholar] [CrossRef]
  12. Antoniadis, V.; Golia, E.E.; Liu, Y.-T.; Wang, S.-L.; Shaheen, S.M.; Rinklebe, J. Soil and maize contamination by trace elements and associated health risk assessment in the industrial area of Volos, Greece. Environ. Int. 2019, 124, 79–88. [Google Scholar] [CrossRef] [PubMed]
  13. Huang, J.; Wu, Y.; Li, Y.; Sun, J.; Xie, Y.; Fan, Z. Do trace metal (loid) s in road soils pose health risks to tourists? A case of a highly-visited national park in China. J. Environ. Sci. 2022, 111, 61–74. [Google Scholar] [CrossRef] [PubMed]
  14. Khan, K.; Lu, Y.; Saeed, M.A.; Bilal, H.; Sher, H.; Khan, H.; Ali, J.; Wang, P.; Uwizeyimana, H.; Baninla, Y. Prevalent fecal contamination in drinking water resources and potential health risks in Swat, Pakistan. J. Environ. Sci. 2018, 72, 1–12. [Google Scholar] [CrossRef] [PubMed]
  15. Nawab, J.; Khan, S.; Ali, S.; Sher, H.; Rahman, Z.; Khan, K.; Tang, J.; Ahmad, A. Health risk assessment of heavy metals and bacterial contamination in drinking water sources: A case study of Malakand Agency, Pakistan. Environ. Monit. Assess. 2016, 188, 286. [Google Scholar] [CrossRef]
  16. Wu, L.; Liang, Y.; Fu, S.; Huang, Y.; Chen, Z.; Chang, X. Biomonitoring trace metal contamination in Guangzhou urban parks using Asian tramp snails (Bradybaena similaris). Chemosphere 2023, 334, 138960. [Google Scholar] [CrossRef]
  17. Boum-Nkot, S.N.; Nlend, B.; Komba, D.; Ndondo, G.N.; Bello, M.; Fongoh, E.; Ntamak-Nida, M.-J.; Etame, J. Hydrochemistry and assessment of heavy metals groundwater contamination in an industrialized city of sub-Saharan Africa (Douala, Cameroon). Implication on human health. HydroResearch 2023, 6, 52–64. [Google Scholar] [CrossRef]
  18. Pinto, M.M.C.; Silva, M.M.; da Silva, E.A.F.; Dinis, P.A.; Rocha, F. Transfer processes of potentially toxic elements (PTE) from rocks to soils and the origin of PTE in soils: A case study on the island of Santiago (Cape Verde). Environ. Monit. Assess. 2017, 183, 140–151. [Google Scholar]
  19. Wong, C.S.; Li, X.; Thornton, I. Urban environmental geochemistry of trace metals. Environ. Pollut. 2006, 142, 1–16. [Google Scholar] [CrossRef]
  20. Derakhshan-Babaei, F.; Mirchooli, F.; Mohammadi, M.; Nosrati, K.; Egli, M. Tracking the origin of trace metals in a watershed by identifying fingerprints of soils, landscape and river sediments. Sci. Total Environ. 2022, 835, 155583. [Google Scholar] [CrossRef]
  21. Pan, Y.; Peng, H.; Hou, Q.; Peng, K.; Shi, H.; Wang, S.; Zhang, W.; Zeng, M.; Huang, C.; Xu, L. Priority control factors for heavy metal groundwater contamination in peninsula regions based on source-oriented health risk assessment. Sci. Total Environ. 2023, 894, 165062. [Google Scholar] [CrossRef]
  22. Guo, C.; Chen, Y.; Xia, W.; Qu, X.; Yuan, H.; Xie, S.; Lin, L.-S. Eutrophication and heavy metal pollution patterns in the water suppling lakes of China’s south-to-north water diversion project. Sci. Total Environ. 2020, 711, 134543. [Google Scholar] [CrossRef] [PubMed]
  23. Wang, L.; Lyons, J.; Kanehl, P.; Bannerman, R. Impacts of urbanization on stream habitat and fish across multiple spatial scales. Environ. Manag. 2001, 28, 255–266. [Google Scholar] [CrossRef] [PubMed]
  24. Valtanen, M.; Sillanpää, N.; Setälä, H. The effects of urbanization on runoff pollutant concentrations, loadings and their seasonal patterns under cold climate. Water Air Soil Pollut. 2014, 225, 1977. [Google Scholar] [CrossRef]
  25. Oginawati, K.; Susetyo, S.H.; Rosalyn, F.A.; Kurniawan, S.B.; Abdullah, S.R.S. Risk analysis of inhaled hexavalent chromium (Cr 6+) exposure on blacksmiths from industrial area. Environ. Sci. Pollut. Res. 2021, 28, 14000–14008. [Google Scholar] [CrossRef] [PubMed]
  26. Ahmad, W.; Alharthy, R.D.; Zubair, M.; Ahmed, M.; Hameed, A.; Rafique, S. Toxic and heavy metals contamination assessment in soil and water to evaluate human health risk. Sci. Rep. 2021, 11, 17006. [Google Scholar] [CrossRef]
  27. Peña-Fernández, A.; González-Muñoz, M.; Lobo-Bedmar, M. Establishing the importance of human health risk assessment for metals and metalloids in urban environments. Environ. Int. 2014, 72, 176–185. [Google Scholar] [CrossRef]
  28. Dash, S.; Borah, S.S.; Kalamdhad, A.S. Application of positive matrix factorization receptor model and elemental analysis for the assessment of sediment contamination and their source apportionment of Deepor Beel, Assam, India. Ecol. Indic. 2020, 114, 106291. [Google Scholar] [CrossRef]
  29. Gholizadeh, M.H.; Melesse, A.M.; Reddi, L. Water quality assessment and apportionment of pollution sources using APCS-MLR and PMF receptor modeling techniques in three major rivers of South Florida. Sci. Total Environ. 2016, 566, 1552–1567. [Google Scholar] [CrossRef]
  30. Bisone, S.; Chatain, V.; Blanc, D.; Gautier, M.; Bayard, R.; Sanchez, F.; Gourdon, R. Geochemical characterization and modeling of arsenic behavior in a highly contaminated mining soil. Environ. Earth Sci. 2016, 75, 306. [Google Scholar] [CrossRef]
  31. Han, Q.; Wang, M.; Cao, J.; Gui, C.; Liu, Y.; He, X.; He, Y.; Liu, Y. Health risk assessment and bioaccessibilities of heavy metals for children in soil and dust from urban parks and schools of Jiaozuo, China. Ecotoxicol. Environ. Saf. 2020, 191, 110157. [Google Scholar] [CrossRef]
  32. Rodríguez-Oroz, D.; Vidal, R.; Fernandoy, F.; Lambert, F.; Quiero, F. Metal concentrations and source identification in Chilean public children’s playgrounds. Environ. Monit. Assess. 2018, 190, 703. [Google Scholar] [CrossRef] [PubMed]
  33. Vega, A.S.; Arce, G.; Rivera, J.I.; Acevedo, S.E.; Reyes-Paecke, S.; Bonilla, C.A.; Pastén, P. A comparative study of soil metal concentrations in Chilean urban parks using four pollution indexes. Appl. Geochem. 2022, 141, 105230. [Google Scholar] [CrossRef]
  34. Ghani, J.; Nawab, J.; Faiq, M.E.; Ullah, S.; Alam, A.; Ahmad, I.; Ali, S.W.; Khan, S.; Ahmad, I.; Muhammad, A. Multi-geostatistical analyses of the spatial distribution and source apportionment of potentially toxic elements in urban children’s park soils in Pakistan: A risk assessment study. Environ. Pollut. 2022, 311, 119961. [Google Scholar] [CrossRef]
  35. Yang, Y.; Wei, L.; Cui, L.; Zhang, M.; Wang, J. Profiles and risk assessment of heavy metals in Great Rift Lakes, Kenya. CLEAN–Soil Air Water 2017, 45, 1600825. [Google Scholar]
  36. Li, H.-B.; Yu, S.; Li, G.-L.; Deng, H.; Xu, B.; Ding, J.; Gao, J.-B.; Hong, Y.-W.; Wong, M.-H. Spatial distribution and historical records of mercury sedimentation in urban lakes under urbanization impacts. Sci. Total Environ. 2013, 445, 117–125. [Google Scholar] [CrossRef] [PubMed]
  37. Muhammad, N.; Nafees, M.; Ge, L.; Khan, M.H.; Bilal, M.; Chan, W.P.; Lisak, G. Assessment of industrial wastewater for potentially toxic elements, human health (dermal) risks, and pollution sources: A case study of Gadoon Amazai industrial estate, Swabi, Pakistan. J. Hazard. Mater. 2021, 419, 126450. [Google Scholar] [CrossRef] [PubMed]
  38. Sirajudeen, J.; Arulmanikandan, S.; Manivel, V. Heavy metal pollution index of groundwater of Fathima Nagar area near Uyyakondan channel Tiruchirappalli district, Tamil Nadu, India. World J. Pharm. Pharm. Sci. 2015, 4, 967–975. [Google Scholar]
  39. Prasanna, M.; Praveena, S.; Chidambaram, S.; Nagarajan, R.; Elayaraja, A. Evaluation of water quality pollution indices for heavy metal contamination monitoring: A case study from Curtin Lake, Miri City, East Malaysia. Environ. Earth Sci. 2012, 67, 1987–2001. [Google Scholar] [CrossRef]
  40. Prasad, B.; Mondal, K.K. The impact of filling an abandoned open cast mine with fly ash on ground water quality: A case study. Mine Water Environ. 2008, 27, 40–45. [Google Scholar] [CrossRef]
  41. Tokatlı, C.; Varol, M.J.E.R. Impact of the COVID-19 lockdown period on surface water quality in the Meriç-Ergene River Basin, Northwest Turkey. Environ. Res. 2021, 197, 111051. [Google Scholar] [CrossRef]
  42. WHO. Guidelines for Drinking-Water Quality; World Health Organization: Geneva, Switzerland, 2002. [Google Scholar]
  43. Schiller, G.J.Z. Directive 2009/12/EC of the European Parliament and of the Council of 11 March 2009 on Airport Charges/Neue Gemeinschaftsrechtliche Vorgaben zur Festsetzung von Flughafenentgelten: Die Richtlinie 2009/12/EG uber Flughafenentgelte/La Directive 2009/12/CE du Parlement Europeen et du Conseil sur les Redevances Aeroportuaires. ZLW 2009, 58, 356. [Google Scholar]
  44. Varol, M.; Tokatlı, C. Impact of paddy fields on water quality of Gala Lake (Turkey): An important migratory bird stopover habitat. Environ. Pollut. 2021, 287, 117640. [Google Scholar] [CrossRef] [PubMed]
  45. USEPA. Regional Screening Levels for Chemical Contaminants at Superfund Sites; United States Environmental Protection Agency: Washington, DC, USA, 2010.
  46. Wongsasuluk, P.; Chotpantarat, S.; Siriwong, W.; Robson, M. Heavy metal contamination and human health risk assessment in drinking water from shallow groundwater wells in an agricultural area in Ubon Ratchathani province, Thailand. Environ. Geochem. Health 2014, 36, 169–182. [Google Scholar] [CrossRef] [PubMed]
  47. Behrooz, R.D.; Kaskaoutis, D.; Grivas, G.; Mihalopoulos, N. Human health risk assessment for toxic elements in the extreme ambient dust conditions observed in Sistan, Iran. Chemosphere 2021, 262, 127835. [Google Scholar] [CrossRef] [PubMed]
  48. Tepanosyan, G.; Sahakyan, L.; Maghakyan, N.; Saghatelyan, A. Identification of spatial patterns, geochemical associations and assessment of origin-specific health risk of potentially toxic elements in soils of Armavir region, Armenia. Chemosphere 2021, 262, 128365. [Google Scholar] [CrossRef]
  49. US Department of Energy (USDOE). The Risk Assessment Information System (RAIS); US Department of Energy’s Oak Ridge Operations Office (ORO): Argonne, IL, USA, 2011.
  50. Jiang, C.; Zhao, Q.; Zheng, L.; Chen, X.; Li, C.; Ren, M. Distribution, source and health risk assessment based on the Monte Carlo method of heavy metals in shallow groundwater in an area affected by mining activities, China. Ecotoxicol. Environ. Saf. 2021, 224, 112679. [Google Scholar] [CrossRef]
  51. Brtnický, M.; Pecina, V.; Hladký, J.; Radziemska, M.; Koudelková, Z.; Klimánek, M.; Richtera, L.; Adamcová, D.; Elbl, J.; Galiová, M.V. Assessment of phytotoxicity, environmental and health risks of historical urban park soils. Chemosphere 2019, 220, 678–686. [Google Scholar] [CrossRef]
  52. WHO. Guidelines for Drinking-Water Quality; World Health Organization: Geneva, Switzerland, 2011; Volume 38, pp. 104–108. [Google Scholar]
  53. Pak-EPA, Government of Pakistan. National Standards for Drinking Water Quality; Pakistan Environmental Protection Agency: Islamabad, Pakistan, 2008.
  54. Gu, Y.G.; Li, Q.S.; Fang, J.H.; He, B.Y.; Fu, H.B.; Tong, Z. Identification of heavy metal sources in the reclaimed farmland soils of the pearl river estuary in China using a multivariate geostatistical approach. Ecotoxicol. Environ. Saf. 2014, 105, 7–12. [Google Scholar] [CrossRef]
  55. Song, Z.; Dong, L.; Shan, B.; Tang, W. Assessment of potential bioavailability of heavy metals in the sediments of land-freshwater interfaces by diffusive gradients in thin films. Chemosphere 2018, 191, 218–225. [Google Scholar] [CrossRef]
  56. Mohan, S.V.; Nithila, P.; Reddy, S. Estimation of heavy metals in drinking water and development of heavy metal pollution index. J. Environ. Sci. Health A J. 1996, 31, 283–289. [Google Scholar] [CrossRef]
  57. Edet, A.; Offiong, O. Evaluation of water quality pollution indices for heavy metal contamination monitoring. A study case from Akpabuyo-Odukpani area, Lower Cross River Basin (southeastern Nigeria). GeoJournal 2002, 57, 295–304. [Google Scholar] [CrossRef]
  58. Rezaei, A.; Hassani, H.; Hassani, S.; Jabbari, N.; Mousavi, S.B.F.; Rezaei, S. Evaluation of groundwater quality and heavy metal pollution indices in Bazman basin, southeastern Iran. Groundw. Sustain. Dev. 2019, 9, 100245. [Google Scholar] [CrossRef]
  59. Rahman, M.S.; Khan, M.; Jolly, Y.; Kabir, J.; Akter, S.; Salam, A. Assessing risk to human health for heavy metal contamination through street dust in the Southeast Asian Megacity: Dhaka, Bangladesh. Sci. Total Environ. 2019, 660, 1610–1622. [Google Scholar] [CrossRef] [PubMed]
  60. Scharenbroch, B.C.; Lloyd, J.E.; Johnson-Maynard, J.L. Distinguishing urban soils with physical, chemical, and biological properties. Pedobiologia 2005, 49, 283–296. [Google Scholar] [CrossRef]
  61. Li, Z.-G.; Zhang, G.-S.; Liu, Y.; Wan, K.-Y.; Zhang, R.-H.; Chen, F. Soil nutrient assessment for urban ecosystems in Hubei, China. PLoS ONE 2013, 8, e75856. [Google Scholar] [CrossRef] [PubMed]
  62. Loh, Y.S.A.; Akurugu, B.A.; Manu, E.; Aliou, A.-S. Assessment of groundwater quality and the main controls on its hydrochemistry in some Voltaian and basement aquifers, northern Ghana. Groundw. Sustain. Dev. 2020, 10, 100296. [Google Scholar] [CrossRef]
  63. Xia, W.; Wang, R.; Zhu, B.; Rudstam, L.G.; Liu, Y.; Xu, Y.; Xin, W.; Chen, Y. Heavy metal gradients from rural to urban lakes in central China. Ecol. Process 2020, 9, 47. [Google Scholar] [CrossRef]
  64. Dou, Y.; Yu, X.; Liu, L.; Ning, Y.; Bi, X.; Liu, J. Effects of hydrological connectivity project on heavy metals in Wuhan urban lakes on the time scale. Sci. Total Environ. 2022, 853, 158654. [Google Scholar] [CrossRef] [PubMed]
  65. Ayejoto, D.A.; Egbueri, J.C. Human health risk assessment of nitrate and heavy metals in urban groundwater in Southeast Nigeria. Acta Ecol. Sin. 2023, in press. [Google Scholar] [CrossRef]
  66. El-Magd, S.A.A.; Taha, T.; Pienaar, H.H.; Breil, P.; Amer, R.; Namour, P. Assessing heavy metal pollution hazard in sediments of Lake Mariout, Egypt. J. Afr. Earth Sci. 2021, 176, 104116. [Google Scholar] [CrossRef]
  67. Xiang, Z.; Wu, S.; Zhu, L.; Yang, K.; Lin, D. Pollution characteristics and source apportionment of heavy metal (loid) s in soil and groundwater of a retired industrial park. J. Environ. Sci. 2023, in press. [CrossRef]
  68. Nawab, J.; Rahman, A.; Khan, S.; Ghani, J.; Ullah, Z.; Khan, H.; Waqas, M. Drinking water quality assessment of government, non-government and self-based schemes in the disaster affected areas of khyber pakhtunkhwa, Pakistan. Expos. Health 2022, 1–17. [Google Scholar] [CrossRef]
  69. Bhatti, Z.I.; Ishtiaq, M.; Khan, S.A.; Nawab, J.; Ghani, J.; Ullah, Z.; Khan, S.; Baig, S.A.; Muhammad, I.; Din, Z.U. Contamination level, source identification and health risk assessment of potentially toxic elements in drinking water sources of mining and non-mining areas of Khyber Pakhtunkhwa, Pakistan. J. Water Health 2022, 20, 1343–1363. [Google Scholar] [CrossRef] [PubMed]
  70. Nawab, J.; Khan, S.; Xiaoping, W. Ecological and health risk assessment of potentially toxic elements in the major rivers of Pakistan: General population vs. Fishermen. Chemosphere 2018, 202, 154–164. [Google Scholar] [CrossRef] [PubMed]
  71. Li, H.; Qian, X.; Hu, W.; Wang, Y.; Gao, H. Chemical speciation and human health risk of trace metals in urban street dusts from a metropolitan city, Nanjing, SE China. Sci. Total Environ. 2013, 456, 212–221. [Google Scholar] [CrossRef]
  72. Amjadian, K.; Sacchi, E.; Rastegari Mehr, M. Heavy metals (HMs) and polycyclic aromatic hydrocarbons (PAHs) in soils of different land uses in Erbil metropolis, Kurdistan Region, Iraq. Environ. Monit. Assess. 2016, 188, 605. [Google Scholar] [CrossRef] [PubMed]
  73. Khan, S.; Munir, S.; Sajjad, M.; Li, G. Urban park soil contamination by potentially harmful elements and human health risk in Peshawar City, Khyber Pakhtunkhwa, Pakistan. J. Geochem. Explor. 2016, 165, 102–110. [Google Scholar] [CrossRef]
  74. Chuan, M.; Shu, G.; Liu, J. Solubility of heavy metals in a contaminated soil: Effects of redox potential and pH. Water Air Soil Pollut. 1996, 90, 543–556. [Google Scholar] [CrossRef]
  75. Li, J.; Rate, A.; Gilkes, R. Fractionation of trace elements in some non-agricultural Australian soils. J. Soil Res. 2003, 41, 1389–1402. [Google Scholar] [CrossRef]
  76. Grigg, N.; Ahmad, S.; Podger, G.; Kirby, M.; Colloff, M. Water Quality in the Ravi and Sutlej Rivers, Pakistan: A System View; South Asia Sustainable Development Investment Portfolio CSIRO: Canberra, Australia, 2018. [Google Scholar]
  77. Chen, T.-B.; Zheng, Y.-M.; Lei, M.; Huang, Z.-C.; Wu, H.-T.; Chen, H.; Fan, K.-K.; Yu, K.; Wu, X.; Tian, Q.-Z. Assessment of heavy metal pollution in surface soils of urban parks in Beijing, China. Chemosphere 2005, 60, 542–551. [Google Scholar] [CrossRef]
  78. Varol, M.; Tokatlı, C. Seasonal variations of toxic metal (loid) s in groundwater collected from an intensive agricultural area in northwestern Turkey and associated health risk assessment. Environ. Res. 2022, 204, 111922. [Google Scholar] [CrossRef]
  79. Shi, H.; Zeng, M.; Peng, H.; Huang, C.; Sun, H.; Hou, Q.; Pi, P. Health Risk Assessment of Heavy Metals in Groundwater of Hainan Island Using the Monte Carlo Simulation Coupled with the APCS/MLR Model. Int. J. Environ. Res. Public Health 2022, 19, 7827. [Google Scholar] [CrossRef] [PubMed]
  80. Ahmad, I.; Khan, B.; Asad, N.; Mian, I.; Jamil, M. Traffic-related lead pollution in roadside soils and plants in Khyber Pakhtunkhwa, Pakistan: Implications for human health. Int. J. Environ. Sci. Technol. 2019, 16, 8015–8022. [Google Scholar] [CrossRef]
  81. Wang, J.; Li, S.; Cui, X.; Li, H.; Qian, X.; Wang, C.; Sun, Y. Bioaccessibility, sources and health risk assessment of trace metals in urban park dust in Nanjing, Southeast China. Ecotoxicol. Environ. Saf. 2016, 128, 161–170. [Google Scholar] [CrossRef] [PubMed]
  82. Kravchenko, J.; Lyerly, H.K. The impact of coal-powered electrical plants and coal ash impoundments on the health of residential communities. N. C. Med. J. 2018, 79, 289–300. [Google Scholar] [CrossRef] [PubMed]
  83. Mitchell, R.G.; Spliethoff, H.M.; Ribaudo, L.N.; Lopp, D.M.; Shayler, H.A.; Marquez-Bravo, L.G.; Lambert, V.T.; Ferenz, G.S.; Russell-Anelli, J.M.; Stone, E.B. Lead (Pb) and other metals in New York City community garden soils: Factors influencing contaminant distributions. Environ. Pollut. 2014, 187, 162–169. [Google Scholar] [CrossRef]
  84. Figueiredo, A.M.G.; Tocchini, M.; dos Santos, T.F. Metals in playground soils of Sao Paulo city, Brazil. Procedia Environ. Sci. 2011, 4, 303–309. [Google Scholar] [CrossRef]
Figure 1. Study area map showing the sampling points of 20 urban children’s parks in Khyber Pakhtunkhwa province, Pakistan. Baghicha Park Charsadda (BPC), Sardaryab Park Charsadda (SPC), Zoo Park Peshawar (ZPP), Tatara Park Peshawar (TPP), Jannah Park Nowshera (JPN), Disney Water Park Nowshera (DWPN), Pak Wonder Land Park Haripur (PWLPH), Ayub Park Haripur (APH), Sher Khan International Park Swat (SKIPS), Wonder World Park Swat (WWPS), Albela Park Swabi (APS), Gohati Cricket Ground Park Swabi (GCGPS), Sports Complex Park Mardan (SCPM), Younus Stadium Park Mardan (YSPM), Gol National Park Chitral (GNPC), Pakistan Tour Park Chitral (PTPC), Haq Nawaz Park Dera Ismail Khan (HNPDK), Insaf Park Dera Ismail Khan (IPDK), Lady Garden Public Park Abbottabad (LGPPA), and Shimla Pahari Park Abbottabad (SPPA).
Sustainability 15 13177 g001
Figure 2. Research flow chart of the PTEs study in drinking water sources of UCPs.
Sustainability 15 13177 g002
Figure 3. Spatial distribution of pH, EC, TDS, and PTEs (Cd, Cr, Pb, Ni, and Cu) in UCPs.
Sustainability 15 13177 g003
Figure 4. (a) Significant loading factors and (b) overall loading factors of results of UCPs.
Sustainability 15 13177 g004
Figure 5. Hazard index (HI) of non-carcinogenic effects of all PTEs in drinking water of UCPs.
Sustainability 15 13177 g005
Table 1. Principal components analysis of selected parameters of UCPs.
ParametersF1F2F3F4
pH−0.690.090.140.62
EC0.080.000.90−0.33
TDS−0.680.020.660.15
Cd mg/L0.78−0.310.150.26
Cr mg/L−0.090.75−0.22−0.05
Pb mg/L0.75−0.050.340.21
Ni mg/L0.500.630.100.45
Cu mg/L0.130.780.18−0.28
Eigenvalue2.401.671.491.00
Variability (%)29.920.918.611.3
Cumulative %29.950.969.580.8
Note: Bold values are the main contributors to PCA.
Table 2. Overall Potentially Toxic Elements Pollution Index (PTE-PI), Potentially Toxic Elements Evaluation Index (PTE-EI), and quality classification (as per PTE-PI scale) of all PTEs of UCPs water.
UCPsPTE-PIPTE-EIQuality as per PTE-PI Scale
BPC79.82.25Good
SPC1132.80Poor
ZPP1163.48Poor
TPP73.72.15Good
JPN23.91.16Excellent
DWPN22.91.19Excellent
PWLPH73.43.35Good
APH57.42.55Very good
SKIPS33.11.95Excellent
WWPS55.52.74Very good
APS24.11.11Excellent
GCGPS44.22.55Very good
SCPM74.33.24Good
YSPM43.22.55Very good
GNPC11.40.810Excellent
PTPC17.11.16Excellent
HNPDK28.71.59Excellent
IPDK20.91.43Excellent
LGPPA31.51.50Excellent
SPPA20.01.30Excellent
Average48.22.04
Table 3. Carcinogenic risk of selected PTEs (Cr, Cd, Pb, and Ni) via ingestion and dermal route in drinking water of UCPs.
Children Adults
UCPsCRingCRderCRingCRderCRingCRderCRingCRderCRingCRderCRingCRderCRingCRderCRingCRder
CrCdPbNiCrCdPbNi
BPC5.36 × 10−26.22 × 10−42.99 × 10−31.73 × 10−58.12 × 10−34.71 × 10−51.84 × 10−32.13 × 10−61.36 × 10−21.42 × 10−47.58 × 10−43.96 × 10−62.06 × 10−31.08 × 10−54.67 × 10−44.88 × 10⁻⁶
SPC5.76 × 10−26.68 × 10−44.77 × 10−32.77 × 10−58.96 × 10−35.20 × 10−51.38 × 10−31.60 × 10−61.46 × 10−21.53 × 10−41.21 × 10−36.32 × 10−62.28 × 10−31.19 × 10−53.50 × 10−43.66 × 10⁻⁶
ZPP4.34 × 10−25.03 × 10−42.78 × 10−31.61 × 10−52.10 × 10−21.22 × 10−41.81 × 10−32.10 × 10−61.12 × 10−21.15 × 10−47.06 × 10−43.68 × 10−65.34 × 10−32.79 × 10−54.61 × 10−44.81 × 10⁻⁶
TPP6.25 × 10−27.24 × 10−42.47 × 10−31.43 × 10−59.12 × 10−35.29 × 10−59.15 × 10−41.06 × 10−61.59 × 10−21.66 × 10−46.27 × 10−43.28 × 10−62.32 × 10−31.21 × 10−52.32 × 10−42.43 × 10⁻⁶
JPN7.60 × 10−28.82 × 10−47.69 × 10−44.46 × 10−62.34 × 10−31.36 × 10−52.03 × 10−32.35 × 10−61.93 × 10−22.02 × 10−41.95× 10−41.02 × 10−65.95× 10−43.11 × 10−65.15× 10−45.37 × 10⁻⁶
DWPN9.72 × 10−21.13 × 10−32.88× 10−41.67 × 10−64.75 × 10−32.76 × 10−58.61 × 10−49.99 × 10−72.47 × 10−22.58× 10−47.32 × 10−53.82 × 10−71.21 × 10−36.30 × 10−62.19× 10−42.28 × 10⁻⁶
PWLPH2.37 × 10−12.75 × 10−31.15 × 10−36.69 × 10−61.46 × 10−28.48 × 10−52.44 × 10−32.82 × 10−66.02 × 10−26.29 × 10−42.93 × 10−41.53 × 10−63.71 × 10−31.94 × 10−56.18 × 10−46.46 × 10⁻⁶
APH2.27 × 10−12.63 × 10−31.45 × 10−38.40 × 10−68.08 × 10−34.69 × 10−51.72 × 10−31.99 × 10−65.76 × 10−26.01 × 10−43.68 × 10−41.92 × 10−62.05 × 10−31.07 × 10−54.36 × 10−44.55 × 10⁻⁶
SKIPS2.12 × 10−12.46 × 10−35.56 × 10−43.22 × 10−65.44 × 10−33.16 × 10−51.56 × 10−31.81 × 10−65.40 × 10−25.63 × 10−41.41 × 10−47.37 × 10−71.38 × 10−37.21 × 10−63.96 × 10−44.14 × 10⁻⁶
WWPS3.15 × 10−13.65 × 10−31.89 × 10−31.09 × 10−54.16 × 10−32.41 × 10−52.33 × 10−32.70 × 10−68.00 × 10−28.35 × 10−44.79 × 10−42.50 × 10−61.06 × 10−35.51 × 10−65.92 × 10−46.18 × 10⁻⁶
APS1.12 × 10−11.30 × 10−34.60 × 10−42.67 × 10−64.20 × 10−32.43 × 10−52.49 × 10−42.89 × 10−72.85 × 10−22.98 × 10−41.17 × 10−46.10 × 10−71.07 × 10−35.57 × 10−66.34 × 10−56.61 × 10⁻⁷
GCGPS3.28 × 10−13.80 × 10−31.20 × 10−36.97 × 10−64.36 × 10−32.53 × 10−51.85 × 10−32.14 × 10−68.33 × 10−28.69 × 10−43.05 × 10−41.59 × 10−61.11 × 10−35.78 × 10−64.69 × 10−44.90 × 10⁻⁶
SCPM2.84 × 10−13.29 × 10−31.83 × 10−31.06 × 10−51.09 × 10−26.32 × 10−51.84 × 10−32.14 × 10−67.20 × 10−27.52 × 10−44.64 × 10−42.42 × 10−62.77 × 10−31.44 × 10−54.68 × 10−44.89 × 10⁻⁶
YSPM2.83 × 10−13.28 × 10−36.79 × 10−43.94 × 10−67.35 × 10−34.27 × 10−51.82 × 10−32.11 × 10−67.18 × 10−27.49 × 10−41.73 × 10−49.01 × 10−71.87 × 10−39.75 × 10−64.62 × 10−44.82 × 10⁻⁶
GNPC9.87 × 10−21.14 × 10−32.95 × 10−41.71 × 10−61.03 × 10−35.99 × 10−68.07 × 10−49.36 × 10−72.51 × 10−22.62 × 10−47.49 × 10−53.91 × 10−72.62 × 10−41.37 × 10−62.05 × 10−42.14 × 10⁻⁶
PTPC1.60 × 10−11.86 × 10−39.61 × 10−55.57 × 10−73.53 × 10−32.05 × 10−54.42 × 10−45.13 × 10−74.06 × 10−24.24 × 10−42.44 × 10−51.27 × 10−78.96 × 10−44.68 × 10−61.12 × 10−41.17 × 10⁻⁶
HNPDK1.92 × 10−12.23 × 10−33.98 × 10−42.31 × 10−65.27 × 10−33.06 × 10−55.26 × 10−46.11 × 10−74.88 × 10−25.09 × 10−41.01 × 10−45.28 × 10−71.34 × 10−36.99 × 10−61.34 × 10−41.40 × 10⁻⁶
IPDK2.20 × 10−12.55 × 10−34.60 × 10−42.67 × 10−62.15 × 10−31.25 × 10−57.13 × 10−48.28 × 10−75.59 × 10−25.83 × 10−41.17 × 10−46.10 × 10−75.46 × 10−42.85 × 10−61.81 × 10−41.89 × 10⁻⁶
LGPPA8.62 × 10−21.00 × 10−33.77 × 10−42.19 × 10−66.93 × 10−34.02 × 10−51.66 × 10−31.92 × 10−62.19 × 10−22.29 × 10−49.59 × 10−55.00 × 10−71.76 × 10−39.19 × 10−64.21 × 10−44.40 × 10⁻⁶
SPPA1.28 × 10−11.48 × 10−33.98 × 10−42.31 × 10−62.73 × 10−31.58 × 10−52.05 × 10−32.38 × 10−63.24 × 10−23.39 × 10−41.01 × 10−45.28 × 10−76.92 × 10−43.61 × 10−65.21 × 10−45.43 × 10⁻⁶
TCR1.66 × 10−11.27 × 10−36.79 × 10−31.44 × 10−34.20 × 10−23.23 × 10−41.72 × 10−33.67 × 10⁻⁴
CRing: Carcinogenic risk via ingestion, CRder: Carcinogenic risk via dermal contact.
Disclaimer/Publisher’s Note: The statements, opinions and data contained in all publications are solely those of the individual author(s) and contributor(s) and not of MDPI and/or the editor(s). MDPI and/or the editor(s) disclaim responsibility for any injury to people or property resulting from any ideas, methods, instructions or products referred to in the content.

