Article

A Choice Experiment Model for Sustainable Consumer Goods: A Systematic Literature Review and Workflow Design

Consorzio Italbiotec, 20126 Milan, Italy
*
Author to whom correspondence should be addressed.
Sustainability 2023, 15(17), 13183; https://doi.org/10.3390/su151713183
Submission received: 14 July 2023 / Revised: 18 August 2023 / Accepted: 29 August 2023 / Published: 1 September 2023
(This article belongs to the Section Economic and Business Aspects of Sustainability)

Abstract

:
Although various methodological biases have been shown, the choice experiment (CE) literature has confirmed the relevance of sustainability in consumers’ purchase choices. Analysing 186 case studies through the Preferred Reporting Items for Systematic Reviews and Meta-Analyses (PRISMA) methodology, this study defines the state-of-the-art and future perspectives of the CE approach, allowing us—for the first time—to evaluate in a single study all variables to be considered for setting up the CE questionnaire, with a focus on the selection of attributes and levels, maximising the reliability of the result, and minimising potential method biases. This paper defines a standardised workflow to expand and refine a sustainability perspective that can potentially drive cross-cutting CEs in every consumer good by investigating the accuracy of characteristics driving the willingness to pay (WTP) a premium price for greener consumer goods. Most of the studies analysed in this article concern food products (92%), and around half (51%) focus on sustainability-related aspects, frequently described in generic terms. The results show how defining an adequate number and type of attributes and levels characterising the target product is crucial for a bias-reduced study. These need to be concrete and familiar, and using labels is essential to enhance informed choice, with sustainability being a far-reaching concept with multifaceted definitions. Moreover, choosing a neutral target product, defining the correct sample size, selecting a balanced and representative group of respondents, and using the right analysis model can also minimise potential bias.

1. Introduction

Climate change represents a substantial global threat: the increasing overheating of the atmosphere and the impact of human activities on the heritage of forests, oceans, and biodiversity are complex phenomena to contain [1,2,3]. The Paris Agreement of December 2015, a legally binding international treaty on climate change negotiated at the UN Climate Change Conference (COP21), constitutes a joint commitment of countries, regions, and cities to roll out low-carbon solutions in all economic sectors by limiting global warming below 2 °C [4]. The EU’s initial Paris Agreement contribution with the Green New Deal and the European Climate Law boosts the target for reducing greenhouse gas emissions to at least 55% to make the European Union climate-neutral by 2050 [5,6,7].
In this scenario, green development means promoting long-term economic growth and innovation through targeted investment to ensure that natural resources continue to offer the resources and environmental services that are essential to our wellbeing. Sustainable development should be regarded as a subset of green growth, rather than replacing it. It is more focused and involves an operational policy agenda that can assist in making real, observable advancements where the economy and the environment converge. It places a significant emphasis on creating an environment for innovation, investment, and competition that can give rise to new sources of economic growth—consistent with resilient ecosystems [8]. According to the EU, the green transition and sustainable development are two closely related aspects, promoting one another. The green economy and governance are connected with the promotion of sustainable production, employment, and consumption, aiming not only at a low-carbon technological shift, but also at an environmentally compatible modernisation of production and consumption methods, to increase the added value of businesses and their environmental sustainability in terms of material savings, energy efficiency, work organisation, and even worker–business relations [9].
Today, climate change and the progressive depletion of natural resources are not just well-known issues for policymakers but have also become a critical concern for the population, resulting in a rapid expansion of demand for sustainability by both the customers/buyers and the consumers [10,11,12]. According to a 2022 Eurobarometer survey, nearly half (49%) of Europeans consider climate change to be the most prominent global challenge, and about 80% agree on the importance of making Europe the number one neutral continent in the world by 2050 [13]. Contributing to 60% of greenhouse gas emissions and up to 80% of natural resource consumption, the consumer goods’ responsibility to tackle climate change is crucial, with increasing awareness of the environmental impact throughout the entire life cycle [14,15,16]. Thus, organic products and sustainable brands are growing in popularity, and consumers are increasingly interested in recycling and pursuing environmentally friendly lifestyles [14,17,18,19].

2. Theoretical Background

A survey on consumer behaviour has shown significant global paradigm shifts in the willingness to pay (WTP) for sustainable products and services: about 85% of people worldwide have been choosing more sustainable products over the past five years, half rank sustainability among their top five value drivers at the time of purchase, and more than one-third (34%) are willing to recognise a higher price for sustainable products or services, with an average of 25% [20]. Numerous studies have also determined the attitudes towards consumers’ environmentally friendly behaviour in the market and the WTP a premium price for sustainability-related goods [12,21,22,23,24]. It is clear how consumers’ attention to more environmentally friendly goods and services can affect their decision to buy; thus, it is essential to comprehend their needs. Recent surveys have also highlighted how the relevance of sustainability differs by sector; for example, consumers consider green features to be more critical for consumer products than for energy and public services [20]. Specifically, they focus more on sustainability in the consumer goods food industry, followed by the apparel and automotive industries, than in other sectors [25]. Currently, this diversity among sectors has not been deeply studied and would require further investigation to understand what market strategies to use.
The ecological trend is pushing companies to recognise the importance of satisfying consumers’ “environmental needs” through green solutions and implementing appropriate segmentation and market positioning strategies [26,27]. Investments in products with enhanced characteristics are increasingly based on analyses of consumers’ buying behaviours, attitudes, preferences, and intentions [28]. Despite these efforts, consumers experience a lack of harmonisation and clarity, mainly due to the absence of a unique and clear definition or regulation for terms such as “sustainable”, “organic”, “green”, and many others [29]. Sustainability is an all-encompassing concept that includes environmental, social/ethical, and economic dimensions, such as animal welfare, fair trade, and fair working conditions and wages. The environmental dimension may include organic food, carbon reduction, energy saving, circularity paradigms (zero waste), and processes with lower toxicity or better eco-friendly profiles. In this scenario, where sustainability can have multiple meanings and connotations, it is essential to emphasise how consumers can recognise specific, selective, and individual characteristics of the final product [30,31], and its production process refers to raw materials, packaging, labelling, and promotion [32]. Intending to guarantee transparency to the consumer and prevent speculative phenomena such as greenwashing [33], the EU has launched the “EU Taxonomy” initiative, a classification system for environmentally sustainable activities according to technical screening criteria [30,34]. This is part of the package of actions for the ecological transition that recognises sustainable development as a system meeting present and future needs [35] within the limits of our planet [36] and promotes a trade and sustainable development (TSD) policy [37].
Although this recent awareness drives business models’ transformation towards zero-emission solutions to protect their long-term profitability [38,39], there is still a significant gap in understanding consumer opinion through specific sustainability features. Most studies [21,22,23,24,40,41] to date have demonstrated and investigated the growing attitudes towards consumers’ environmentally friendly behaviour; however, they have often analysed consumer responses to products broadly defined as “sustainable”, “organic”, “green”, or “eco-friendly” without specifying their features. As said previously, “sustainability” is a wide, comprehensive concept with many different and complex facets. The use of nonspecific terms results in a lack of clarity, causing consumer confusion and misunderstandings, and frequently yielding unreliable outcomes.
This is evidenced by the fact that many studies show how consumers’ positive attitudes towards eco-friendly items do not always convert into actual behaviour [42,43,44,45,46,47], causing the attitude–intention–behaviour gap [43,48,49]. This issue has significant consequences for companies producing and/or marketing green products that do not accurately reflect real purchasing intentions, leading to expensive market features.
Finally, an in-depth analysis is needed to investigate consumers’ WTP for specific and well-described sustainability features of consumer products, such as packaging reduction, biodegradability, energy and/or water consumption, carbon footprint, and the use of chemicals [32]. The heterogeneity of variables in the WTP demonstrates the relevance of studies aimed at goods’ classification to influence and drive their purchase, obtaining exploitable business and marketing results.
It is important to understand why studies on this subject have often been inaccurate and produced hypothetical conclusions about purchase preferences that are not usually reflected in practice.
The choice experiment (CE) is the stated preference method for identifying characteristics driving the purchasing preferences of producers and customers. It is frequently applied in marketing and other areas of behavioural research to establish individual preferences between items because it allows for the evaluation of complex goods and services in their entirety, rather than a single aspect [50]. Based on an experimental design survey made up of different scenarios (choice sets) combined with multiple alternatives and product features (attributes) expressed with different degrees (levels), it requires a subject’s sample to choose from among several alternatives (labelled or unlabelled) in a series of scenarios where levels are intentionally combined [51]. The methodology behind the CE model is the random utility theory, which assumes that the consumer maximises utility when choosing. It also posits that a product or a service can be described by its components, and that a respondent’s overall utility (or preference) for a product/service is decided by the utility that they obtain from each component [52]. The results are thus intended as utility coefficients that, in turn, support the quantification of other metrics such as the probability of choice, market share, elasticity, and the WTP, i.e., the possible price (premium price) for a specific good or service, estimating its value according to its characteristics and potential demand [53,54].
The survey can also be combined with additional data collection, such as socioeconomic and demographic profile, lifestyle and purchasing habits, beliefs, health status, and topic knowledge, enabling a more comprehensive understanding of respondents’ choices and a WTP segmentation [53,55].
This method has inherent limitations, with the most common including hypothetical bias, defined as the difference in the WTP for a product attribute between hypothetical and non-hypothetical conditions [51], i.e., its underestimation or overestimation, resulting in a reduction in the study’s reliability [56]. This can be induced by several factors, such as non-binding answers leading respondents not to consider real effects of their decisions, the survey’s administration being far from the context of the behaviour (i.e., online vs. supermarket), or the tendency to distort the answer to impress others and/or change the image of oneself (reporting) [56,57]. Sample bias—the second most common bias—occurs when the selected sample is not representative of the entire population, such as by being too small, non-homogeneous (i.e., an imbalance between male and female, young and elderly, etc.), or using different sampling characteristics between the final investigation and the pilot one [53,55]. To obtain findings that are more useful for the market and marketing and more related to reality, these limitations should be overcome.
When addressing a study approach such as the choice experiment, it is important to clarify the definitions of consumer and buyer. The EU consumer protection law (Directive 2011/83/EU [58] and the amended 2019/2161/EU [59]) defines consumers as “any natural person who, in contracts covered by the directive, is acting for purposes which are outside his trade, business, craft or profession”. Despite this being the most widely used, it is important to note that the definitions of consumer, as provided for in various EU legal instruments, do not entirely overlap, although this is very relevant for the application of the extensive body of legislation dedicated to protecting consumers’ rights and health in the EU market.
Furthermore, the legal notion of a consumer differs from the definition given at the marketing and sociology levels, which also clearly distinguish between the concept of buyer/customer and consumer [60]. The former are defined as those who buy the goods or services from a seller or provider but are not necessarily the end users [61], while consumers are defined as those who use the goods or services, but not necessarily those who buy them [62]. This means that the two do not always coincide.
In the context of the choice experiment, the term “consumer” refers to the common EU definition from a legal point of view, while, from a marketing–sociological point of view, it mainly addresses consumers/customers, meaning individuals who buy the products and use them for themselves, as it tries to simulate a real-life buying choice.

3. Materials and Methods

With the aim of a systematic review of the state-of-the-art CE models, the analysis was carried out according to the Preferred Reporting Items for Systematic Reviews and Meta-Analysis (PRISMA) method [63]. A four-step diagram following a funnel approach allowed for the identification, selection, and analysis of articles relevant to the research topic [64,65]. The selection process adopted in the present study is shown in Figure 1 [53,55].

3.1. Identification

The relevant articles’ research was based on Scopus, the most extensive citation and abstract database in various disciplines, including science, technology, medicine, humanities, arts, and social sciences. The identification was conducted using a keyword query combining “Choice Experiment” with consumer goods; for the study’s purpose, they were defined as “products that are bought by individuals or households for personal use” [66], such as the following:
  • Detergent: “A chemical substance in the form of a powder or liquid to remove dirt from objectives” [67]. The present study focuses on detergents used for washing clothes and other things made of cloth.
  • Clothes and textiles: “Material made by weaving cotton, wool, or other fibers, or a piece of such material made by hand or machine” [68,69]. The present study focuses on both natural and manmade textiles and clothes.
  • Cosmetics: “Substances you put on your face or body intended to improve your appearance” [70].
  • Plastics and packaging: “An artificial substance that can be shaped when soft into many different forms and has many different uses” [71] and “the materials in which objects are wrapped before being sold” [72]. The present study focuses on packaging, wrapping, and containers used commercially, composed of various materials, such as plastics and polymers of different origins.
  • Domestic appliances: “A large piece of electrical equipment used in the home, especially in the kitchen” [73].
  • Food and beverages: “Something that people and animals eat, or plants absorb, to keep them alive” [74] and “a drink of any types” [75]. The present study focuses only on human food.
The results of the keyword queries are reported in Table 1.
Keywords were searched in the titles, abstracts, and keywords among all of the Scopus publications, applying the following filters:
  • Year: 2012–2022;
  • Language: English;
  • Publication stage: Final (thus not including articles in press);
  • Document type: Article (thus not including reviews, conference papers, book chapters, or letters).
By applying the above criteria, 1130 publications were identified.

3.2. Screening

The 1130 publications identified in step 1 were further screened to remove duplicates and those papers outside the scope of this study, following a funnel approach as reported in Figure 1. The removal of duplicates, i.e., identical articles resulting from different search terms, led to a total of 1018 papers, which were further screened as follows:
  • Screening based on the title: 753 articles removed; 265 publications selected and subjected to the following screening step;
  • Screening based on the abstract: 45 articles removed; 220 publications selected.
Removed publications included generic articles not addressing consumer preferences for specific consumer product characteristics, articles analysing the WTP without using the CE method, and articles referring to other topics (e.g., the keywords “Care” and “cosmetic” led to the identification of articles on the preference of treatments for specific health conditions, such as intellectual disabilities and post-surgical conditions, but also on the preference of treatments by inmates in prison; the term “cotton” identified several articles about worms or insects that attack the cotton plant or are capable of damaging tissue).

3.3. Eligibility

Publications were further screened by fully reading the contents of the articles. At this stage, 24 articles were removed because they did not employ the standard structure of CE questionnaires. Indeed, the removed articles referred to studies asking the consumers to do the following:
  • Choose the preferred feature of a product instead of choosing between the same product with different attributes;
  • Choose their favourite among different types of products;
  • Answer to a binary choice such as “I would buy it/I would not buy it” on a product with specific characteristics.

3.4. Inclusion, Quantity, and Qualitative Analysis

The funnel screening process thus resulted in the selection of 186 publications included in the qualitative and quantitative analyses. Quantitatively, publications were analysed according to the following:
  • Year of publication.
  • Geographical distribution, according to the country of affiliation of the first author.
  • Publishing journal also considers their impact factor.
The qualitative analysis focused on the following:
  • Focus of the study: Articles were classified according to the leading consumer goods object of the study, using the same categories as identified in Section 3.1. This classification aims to understand the sector on which the socioeconomic research has focused so far, thus identifying potential knowledge limits.
  • Sustainability: The products focused on by the study were classified according to their level of sustainability as “bio-based” (defined as “wholly or partly derived from materials of biological origin, excluding materials embedded in geological formations and/or fossilised” [76]), “green” (all sustainable products designed to minimise their impact on the environment, although without a bio-based origin), or neither. This classification highlights whether and which element of sustainability is relevant for consumers when making such choices, and to what extent socioeconomic research has focused on this aspect.
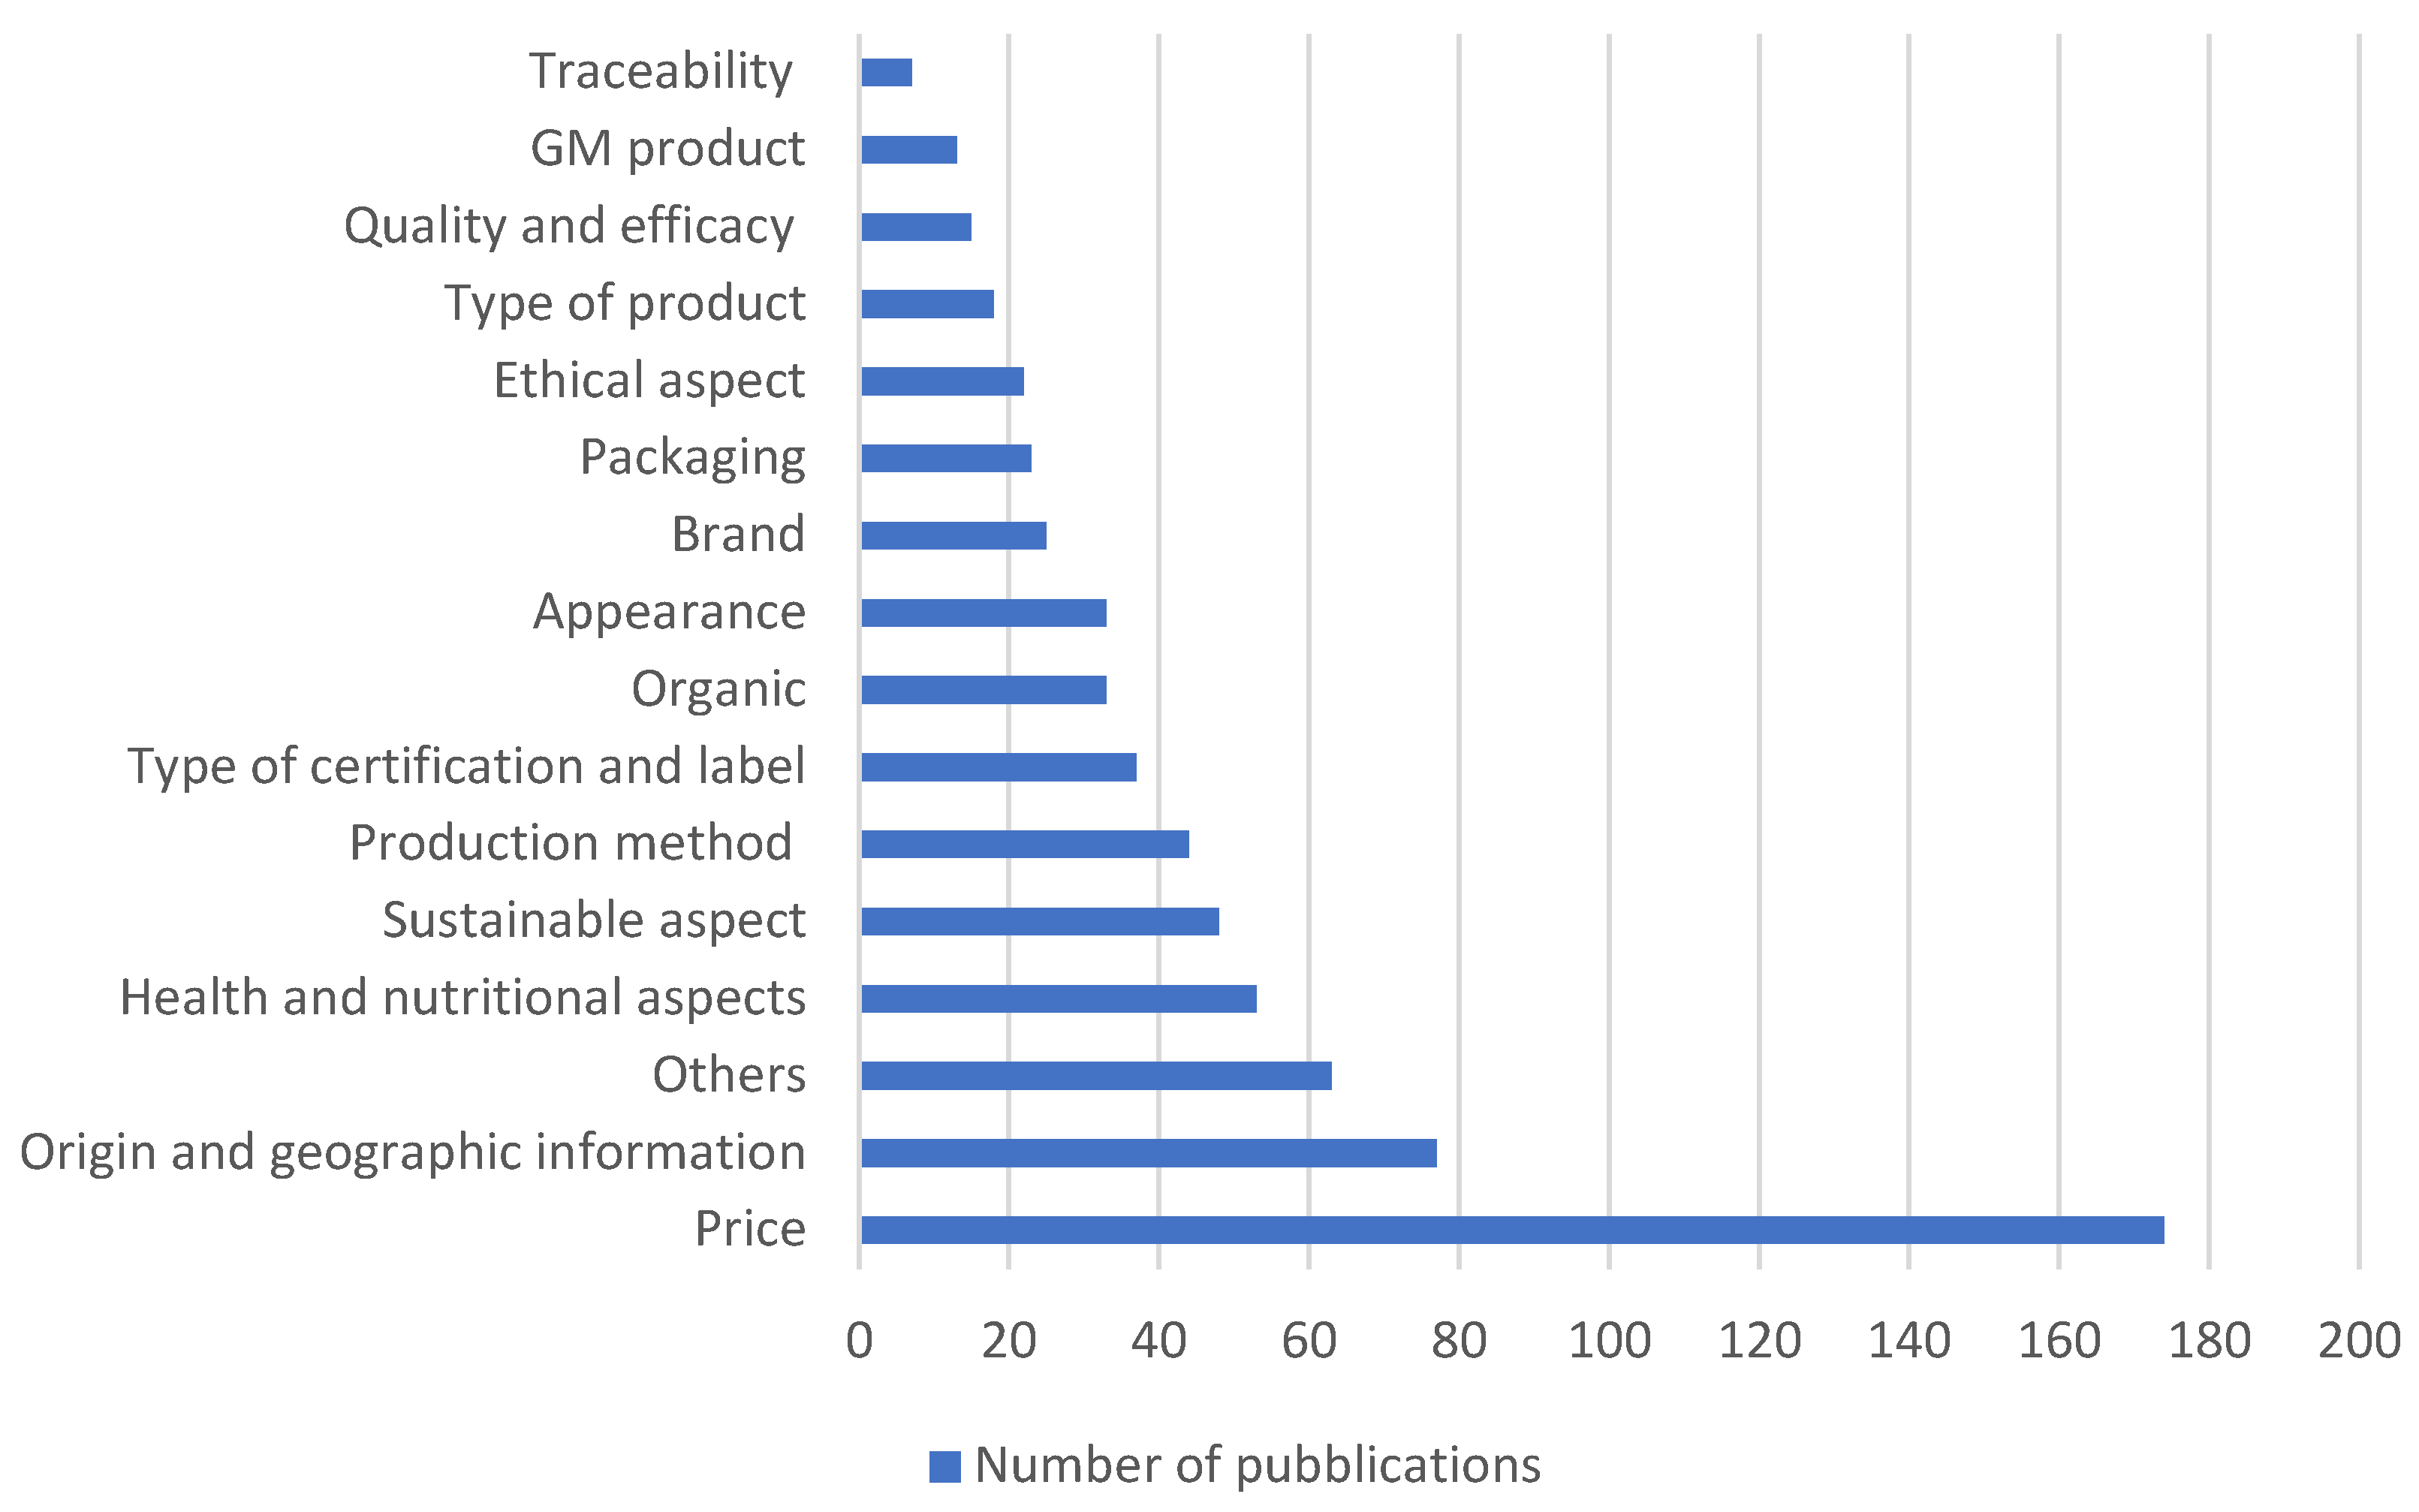
  • Specific elements of the CE model: For each publication, attributes were analysed and divided into 16 macro-categories, as defined in Table 2, to analyse which product features are more relevant for consumers. The total number of levels, resulting from the sum of the levels of each attribute (e.g., attribute 1 = 2 levels, attribute 2 = 3 levels, attribute 4 = 2 levels, resulting in a total of 7 levels), and the total number of choice sets were also taken into account, thus evaluating the complexity of the study. On the other hand, the study’s reliability was assessed by considering the total number of respondents for each study.
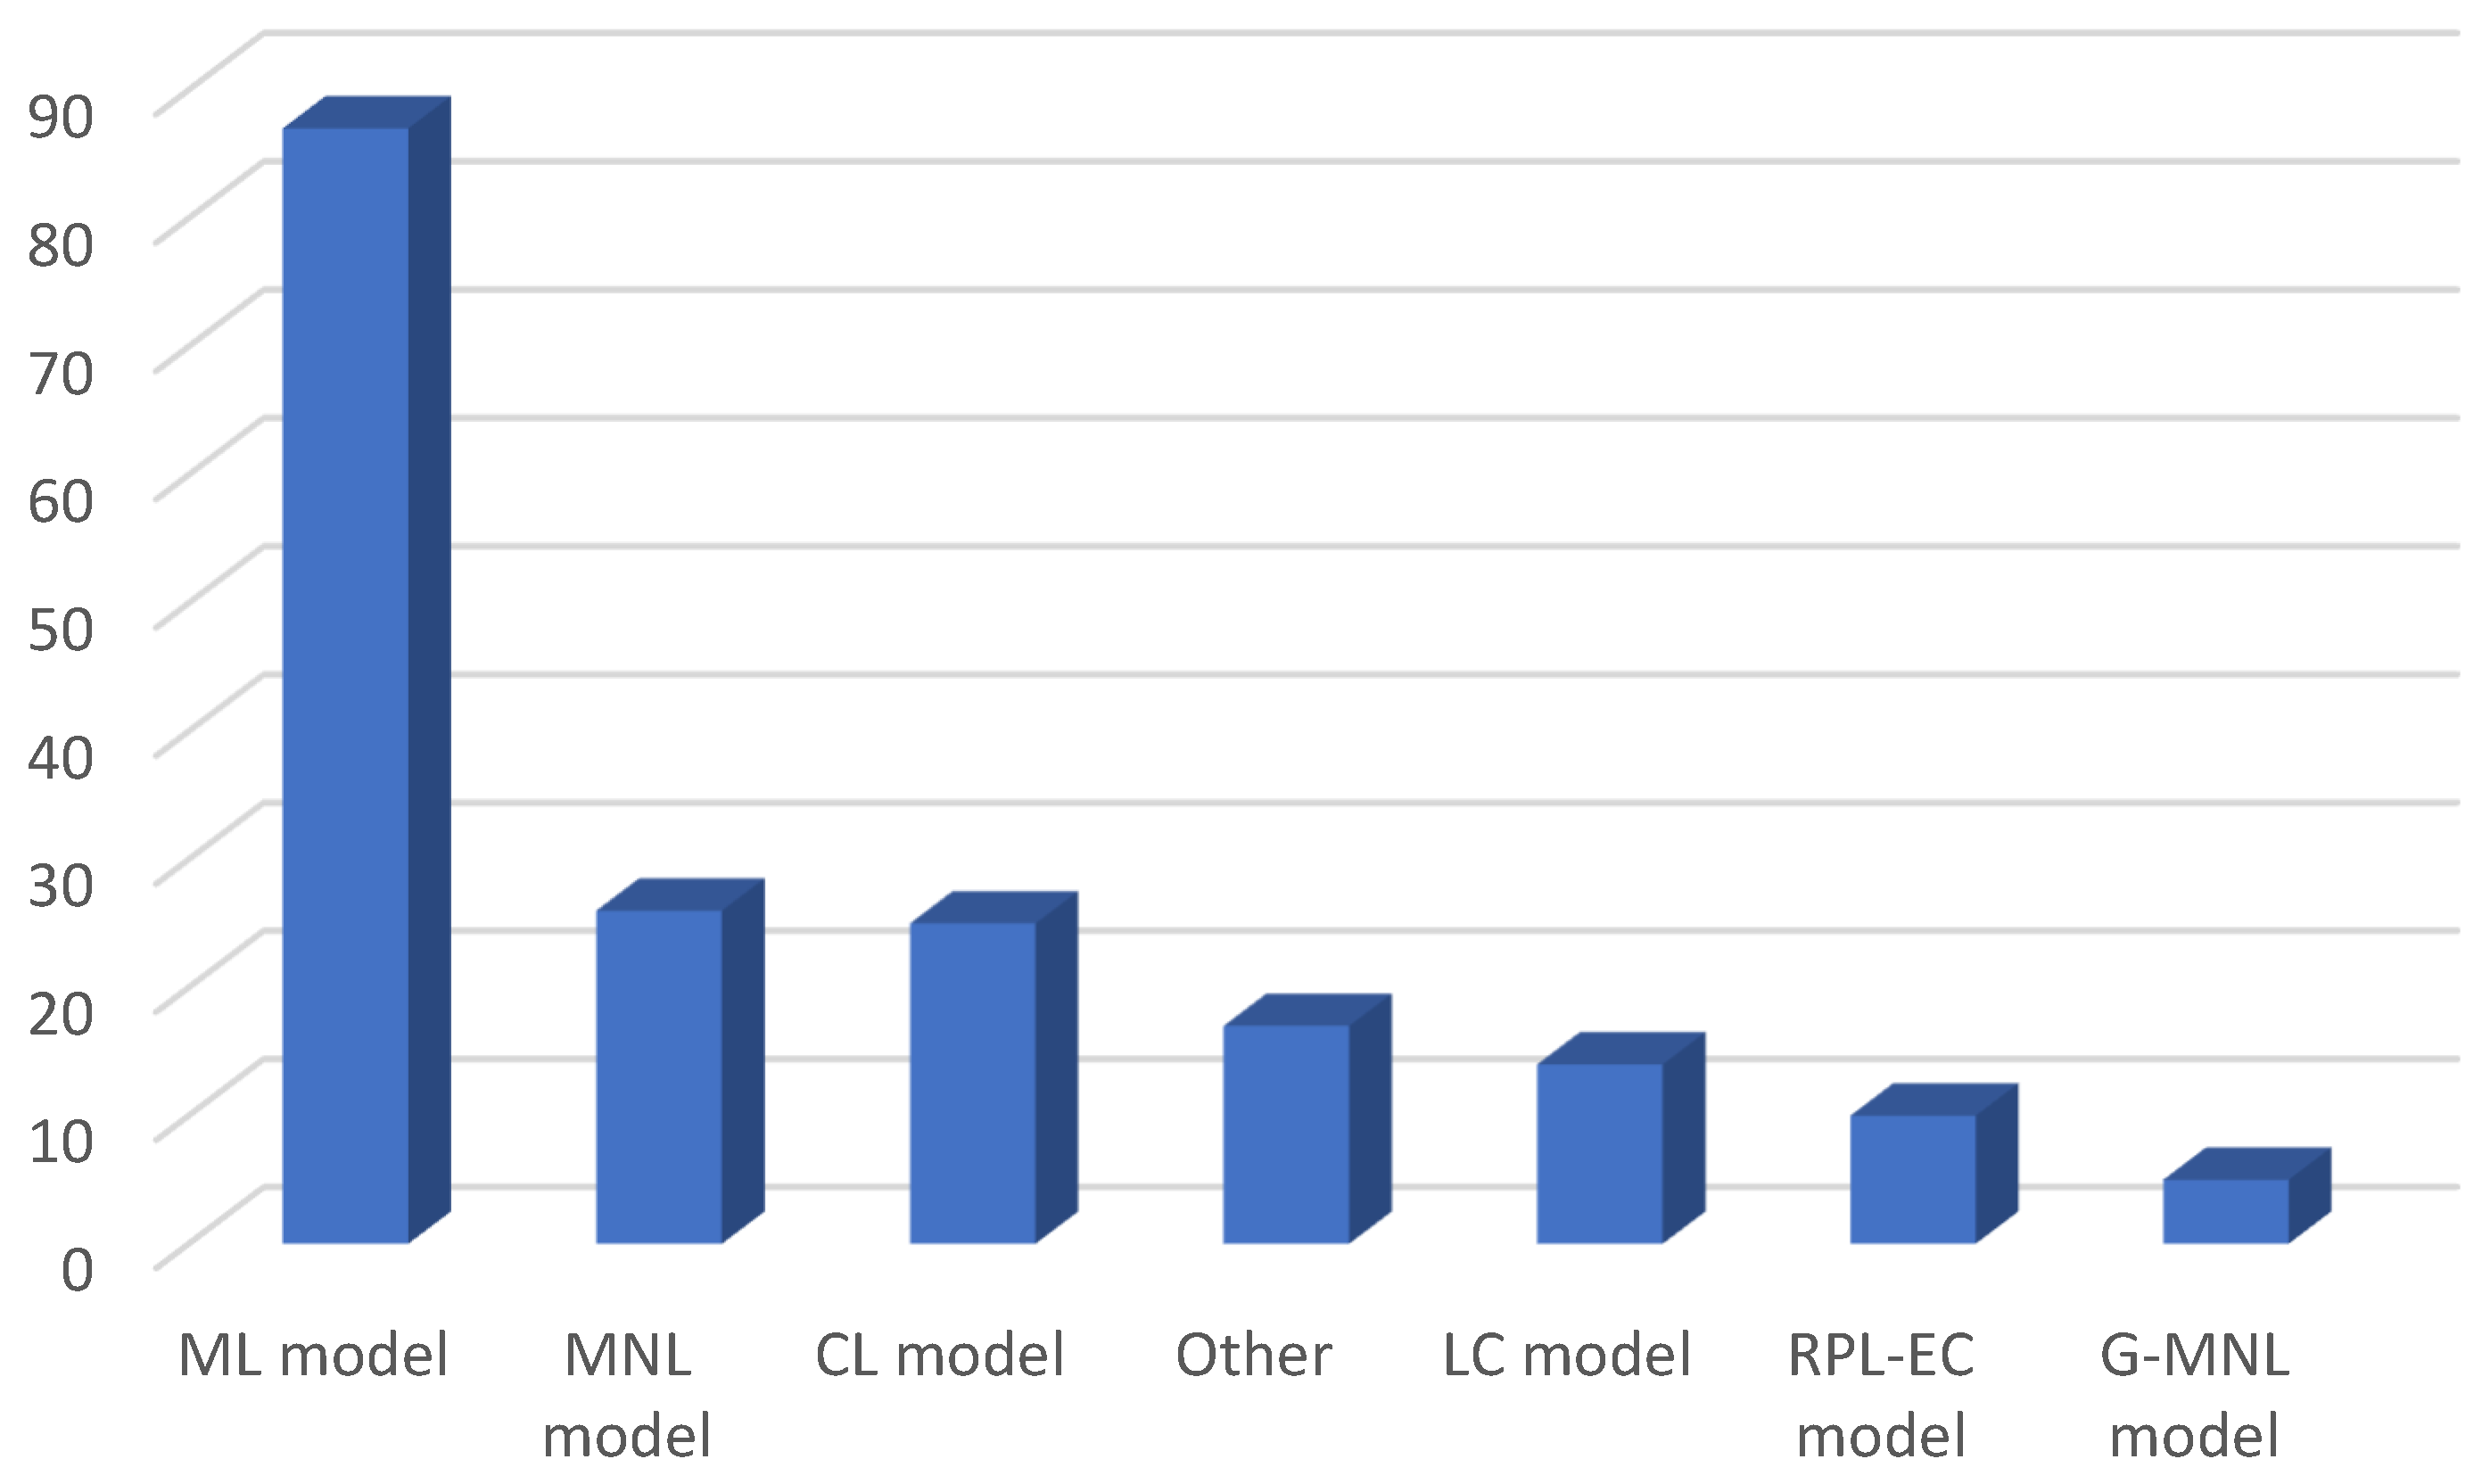
  • Calculation algorithms used in the CE methodology, to understand the best algorithm for future studies.
  • Preliminary studies, e.g., focus groups, literature research, and pilot studies to understand whether and which studies are needed to make the CE results more reliable and unbiased.
  • Additional studies, e.g., socioeconomic and demographic characteristics, shopping habits, food habits, consumers’ knowledge and awareness, health aspects, beliefs, and other habits, to better understand the sample characterisation in order to explain the final results and set up future analyses.
  • Methodological limits: For each identified publication, the study’s main limitations were deeply analysed to implement a step of good practices aimed at overcoming such limits.

3.5. Limitations of the Study

The present study adopted a systematic procedure. Nevertheless, the identification of keywords and screening of sources required by the PRISMA method brings an intrinsic limitation due to the subjectivity of the authors performing the selection and screening. However, the number of identified studies reduced this error, which can be considered negligible.

4. Results

The PRISMA method for the systematic literature analysis enabled a quantitative and qualitative classification of the most relevant advances in socioeconomic and scientific research on consumer products. This section presents the results of the systematic analysis, focusing on 186 publications that employed the CE methodology to analyse the WTP for consumer products.

4.1. Quantity Analysis

In the last ten years, between 2012 and 2022, as shown in Figure 2, the number of scientific publications related to this research has clearly increased, with about half of the selected articles (44) published in 2021 and 75% (142) in the last five years (2018–2022). The year 2022 only includes articles published before the date of this research (July 2022), thus including only a partial number of publications for the current year.
The geographic distribution of scientific publications, according to the country of affiliation of the first author, is shown in Figure 3. Italy ranks first, with 36 articles, followed by Germany (24), the United States (24), China (16), and Denmark (12), which together account for 60% of the total publications. The remaining 29 countries account for 40% of the selected articles, with less than 10 publications for each country.
The selected articles were published in 70 different scientific journals. Table 3 shows the top 11 most productive scientific journals with regard to the number of publications related to the research topic, representing about 50% of the total number of articles (94), with an average impact factor of 4.561, proving the quality of scientific publications. Half (6 out of 11) of these journals concern the field of food since, as analysed later, most of the selected articles fall within the “food” category.

4.2. Qualitative Analysis

Articles were classified according to the leading consumer goods object of the study and their level of sustainability, so as to determine the sectors on which the socioeconomic research has focused so far. Most of the publications (92%) analysed the WTP for consumer products belonging to the “food” category, followed by the “packaging” (7), “textile” (3), “cosmetic” (2), and “domestic appliance” (2) categories, and finally “detergent”, with no articles identified.
Concerning the sustainability assessment, as highlighted in Figure 4, half of the publications (47%) did not analyse sustainable characteristics in any form. In 60 articles, product sustainability represented the study’s primary objective: 31% of the publications analysed a green product and 1% analysed a bio-based product. Finally, 30% of the articles analysed a product with sustainable characteristics, without being the focus of the study (“Green attribute”; “Biobased attribute”).
The qualitative analysis also focused on specific features of the CE methodology as the main focus of this study. In more than 80% of the selected articles, the product was described by 3–5 attributes; in 50% of the studies, there were a total of 10–15 attributes.
Figure 5 summarises the most frequently employed attributes for the analysed publications, describing the products focused on by the studies.
The most analysed attribute was “price” (94% of the publications), due to the intrinsic structure of the CE method as a crucial element in estimating the WTP. The price could be a single value (e.g., USD 3, USD 7, USD 11) or a range (e.g., USD 5–10, USD 10–20, USD 20–30).
The most frequent attribute after “price” was “Origin and geographical information” (41%), which mainly includes information about the product’s origin or the raw materials’ origin, followed by “Health and nutritional aspect” (28%), which is a central element in food studies.
Articles were also classified according to the structure of the questionnaire, as shown in Figure 6. In 30% of the studies, each respondent was asked to complete 6–8 choice sets, with a few cases having equal to or less than 3 or more than 15 choice sets (8%). The majority (67%) of questionnaires presented three choice alternatives for each question, along with the option “none of these”. In a small proportion of articles (21%), each question had 4–5 alternatives, without the “no choice option”. The number of respondents in most articles (53%) was 100–600.
Figure 7 shows the most common algorithms used for analysing the CE results. The mixed logit model (ML model), based on the hypothesis that people show different preferences towards the studied attributes., was the most frequently employed in the publications (87 articles), followed by the multinomial logit model (MNL model) (26), which is the traditional method and assumes that individuals, except for socioeconomic and demographic characteristics (e.g., age, gender, income, etc.), are homogeneous in their preferences for specific attributes; the conditional logit model (CL model) (25), which does not consider these differences to be relevant when assuming a homogeneous set of consumer preferences; and the latent class model (LC model), based on a priori assumptions about the distributions of parameters across individuals (14). The random parameter logit error component model (PLL-EC model) and the generalised multinomial logit model (G-MNL model) were the least frequently used algorithms, with 10 and 5 articles, respectively [54,77].
As mentioned in Section 3.4, the CE questionnaire can be combined with additional studies to better understand the sample characterisation and analyse the WTP for different sociodemographic and/or economic groups.
Figure 8 shows that more than half of the additional studies (60%) analysed socioeconomic and demographic characteristics of the sample, such as age, gender, income, household size, number of children, education, marital status, and residence. In rare cases, the sample characteristics concerned biometric variables, such as weight, height, and body mass index. A smaller number of publications (13%) analysed the shopping habits of respondents, such as shopping preferences, attitudes, and frequency, or the family component responsible for the shopping. Furthermore, 9% of the studies focused on food habits, especially for articles concerning food as a consumer product, or investigated the consumers’ knowledge and awareness (6%). Indeed, the respondents may not have an adequate awareness of some product attributes, making an uninformed choice and decreasing the reliability of the study. Finally, only 4% of the articles analysed the health aspects of the respondents (e.g., state of health and presence of any diseases, healthy/unhealthy habits, or lifestyles, such as constant consumption of alcohol, cigarettes, etc., or frequency of sporting activity) and personal beliefs, due to cultural, religious, or political factors, etc.
This study also analysed the preliminary studies (Figure 9) carried out to obtain helpful information to set up future studies and understand the state of the art for defining aspects requiring further investigation. Half (50%) of the analysed articles reviewed the literature to define the most suitable attributes for the choice sets. In 25% of the articles, pilot studies were conducted to define the sample size and refine the CE model. Finally, consumers were also involved in focus groups (19%) to support researchers in defining the most important and relevant aspects for the study.
Finally, Figure 10 shows the main methodological limits encountered in the analysed studies, aiming to understand how future studies can overcome these problems. The most common problems were hypothetical bias (47 articles) and sample bias (46 articles). Finally, other limitations included the lack of sufficient analysis (74 articles), including lack of additional questions (42) or attributes/levels (32); excessively specific studies (43 articles), including country-specific studies (22) or product-specific studies (21); questionnaire and method bias (16 articles); and consumers’ awareness (9 articles). The term “other” refers to issues found in a few articles which did not fall within the above categories: for example, falsification of the study due to reputation problems of the brand, company, or product under analysis; problems of credibility or social prejudice; excessive cognitive load, etc.

5. Discussion

By analysing 186 consumers’ WTP for greener consumer goods, an exponential increase in the number of CE studies in the last decade was proven, nearly doubling between 2019 and 2021. The selected publications primarily focused on food, while the study of non-food products was still too limited, and around half of the items selected (46%) did not focus on sustainability-related aspects. Although the literature and market analysis increasingly highlight consumers’ green-conscious behaviour [14,15,16,17], the WTP for greener features in specific consumer products must be investigated. Intending to bridge the gap in knowledge on non-food consumer goods and consumer perceptions of sustainable attributes, this study analysed the recent literature to design a workflow to minimise bias.
A CE aims to create a questionnaire that describes a situation as close as possible to reality, allowing the consumer to identify themselves in a natural condition of purchase. In this context, the present study considers the strengths and limitations of existing CE studies to define some good practices in CE questionnaire construction that should be integrated into the standard practice of CE modelling, primarily when referring to the analysis of green and sustainable consumer products. Indeed, being highly innovative, they may not have been commercialised yet, and this represents one of the most crucial bottlenecks in designing an effective CE questionnaire that imitates reality as much as possible and, therefore, avoids bias.
The workflow resulting from the PRISMA review is described in Figure 11.

5.1. Target Product Selection

Choosing the target product is essential for reliable results [29,78,79], responding to neutrality criteria as much as possible, i.e., usable equally by all individuals, regardless of socioeconomic and demographic conditions, such as shower gel (basic hygiene of individuals of any gender and age), unisex clothing, or towels. In the case of inhomogeneous goods, such as lipstick (mainly used by a female population), this should be considered when selecting the sample and analysing the results to avoid falsification and biases.

5.2. Selection of Attributes and Levels

Defining an adequate number and type of attributes and levels characterising the target product is crucial for a bias-reduced study: a small number would not take into consideration the most relevant product characteristics; on the contrary, a vast number would create an overly complex set of choices, risking cognitive bias [53,80]. Some studies show that respondents can effectively process up to six attributes at a time [81,82]; consequently, the results of this study indicate the choice of 3–5 attributes and 10–15 variables (levels) to be optimal. Studies matching these ranges rarely found “lack of attributes and/or levels” among the study’s main limitations; where they did, it was usually referred to as levels.
The attributes most relevant to the consumer are origin and geographic information, nutritional and health aspects, and the production method; however, being characteristics that are mainly related to food products, these cannot be used for other goods categories. Using preliminary studies (i.e., literature reviews), focus groups, and expert consultations can help understand the state of the art and identify the best properties to study for the target product. If the study aims to estimate the WTP, the monetary cost must also be included as an attribute. Focusing on the green characteristics, the state-of-the-art analyses usually include general terms such as “organic”, “sustainable aspects”, and “biobased”, whose definition in most cases is left to the respondents. The “packaging” attribute, often defined by “biodegradable” or “recyclable” levels, is not associated with the type of material used, leading to possible interpretation biases. Defining the attributes and levels is critical in creating any CE, as it strongly influences its outcome and is crucial when studying good sustainability [53,80], affected by the variability in individual interpretation. The studies show that consumers associate the terms “organic” and “sustainable” with a positive attitude towards the environment but are unaware of their meaning.
Similarly, although they acknowledge that the type of packaging material positively affects the purchase decision and the perception of product sustainability, they find it challenging to evaluate which types of packaging are sustainable or the meaning of “biobased” and its associated benefits [29,80,83]. From a marketing perspective, promoting green/bio-based consumer goods should be supported through labels by better quantifying the associated benefits [29,84,85,86,87]. Several studies have shown that labels encourage consumers’ interest in sustainable aspects, although they do not lead to sustainable behaviour due to the lack of specific information, such as energy consumption in kWT and carbon emission in CO2 eq [81,88,89,90]. If included, benchmarks and ranges in a specific operational environment would facilitate the added value recognition [81]. Finally, studies have also shown how—although all of the certified environmental sustainability features positively influence purchasing choices—the presence of an EU-certified label encourages consumers to pay a higher price thanks to greater trust in the reliability of the information [29,31].
Despite the importance of using labels for marketing purposes, it is nevertheless crucial to consider the strict requirements and complex EU regulations on claims and labelling. The legislation is particularly stringent in relation to nutrition claims, so as to guarantee that consumers have sufficient information about the quality of the food product. Only nutrition claims that are listed in the Annex of Regulation (EC) No 1924/2006 [91], lastly amended by Regulation (EU) No 1047/2012 [92], are permitted. This also applies to environment-related claims [93].
Consumer products’ labelling is regulated differently based on the type of product, with the aim of ensuring consumers’ safety and the correctness of information. However, regarding sustainable and green claims, more than 230 sustainability labels have been mapped in the EU, with the majority being vague and misleading and over 40% having no supporting evidence [94]. In this context, to address greenwashing and protect consumers and the environment, in March 2023, the European Commission drafted a proposal for a directive on the substantiation and communication of explicit environmental claims, which will enable consumers to make informed purchasing decisions while contributing to a stronger green and circular economy [95].

5.3. Questionnaire Design

Selecting choice sets is the third crucial element in the CE design, potentially resulting in “measurement error resulting from respondents’ inattention to the choice questions or other unobserved, contextual influences” [96], if not previously experienced in focus groups and pilot studies. In the case of high-choice sets, a subdivision of respondents into groups and multiple scenarios is recommended to reduce potential biases related to decreased interest and commitment. Considering the study evidence, 8–9 choice sets [80,97,98] are to be considered for a low risk of bias.
Designing the questionnaire mainly provides (67%) three options for each question, including “none of these options”, simulating an actual purchase situation [99].

5.4. Sample Selection

The sample selection may affect the results, positioning itself as the second most common limitation in the CE models (sample bias). Therefore, it should have sufficient heterogeneity (e.g., age, gender, education, income, etc.), reducing possible inconsistency in the results. According to the analysed studies, the ideal number of respondents is between 100 and 600. An appropriate sample segmentation should include considerations of socioeconomic and demographic dimensions, such as the level of education—generally accompanied by better knowledge of the topics under investigation—wages—leading to ethical and sustainable considerations—and family size—which can improve health, safety, and quality values. Age affects WTP; as it grows, the recognition of sustainability and ethics decreases [29].

5.5. Results Analysis

The mixed logit model (ML model), the multinomial logit model (MNL model), and the conditional logit model (CL model) are among the most widespread CE computational models. The ML model overcomes the limitations of previous models, as it assumes the homogeneity of preferences; however, considering exclusively those belonging to the observed variables, it could become a limitation if a random variable is expected [100]. The ML model can yield more reliable results based on the intrinsic characteristics of these models and considering the above socioeconomic and demographic dimensions.

5.6. The Hypothetical Bias

Finally, from analysing the limits identified in the CEs, the hypothetical bias—as an important issue in applying the CE method—can be minimised but not eliminated. The most effective approaches to limiting it may include informing and educating respondents on the study’s importance and their responses. Furthermore, questions based on similar or equal prior purchase episodes can help the interviewees identify with real-life situations and increase the reliability of their responses, as well as comparing the data obtained with the market data to support the calibration and interpretation of the obtained results.

6. Conclusions

Despite a growing perception of consumers’ ecological awareness, further studies are required to investigate consumers’ WTP for sustainable products with specific characteristics to efficiently drive the scientific community’s and industries’ efforts to change current production processes. By qualitatively and quantitatively analysing 186 CE studies investigating consumer products, the present article identifies this model’s crucial steps for analysing greener features for consumer goods by providing a workflow that can be integrated into the standard practice of CE modelling and setup. The workflow developed in this study answers to the requirement for a scheme that considers all of the relevant factors, paying particular attention to the selection of attributes and levels—a crucial component in sustainability studies, as this is a term that is yet to be completely defined. This new approach allows for the maximisation of the reliability of the results and minimises all of the potential biases.
According to the results, the most crucial steps in constructing a CE model for green and sustainable consumer products can be summarised as follows:
  • Choosing the target product, which should be as neutral as possible.
  • Choosing an adequate number of attributes (3–5) and levels (10–15) that are concrete and familiar. The use of hypothetical labels can make the consumers more aware of their choices; labels must include detailed information on environmental aspects and additional details for consumers to enhance their knowledge in making informed choices.
  • Setting the right number of choice sets and testing the questionnaire to evaluate the response efficiency.
  • Defining the correct size of the sample and analysing the features of the respondents.
  • Choosing the model of analysis based on the context.
  • Informing and educating respondents on the meaning of the attributes/levels.
This workflow will help reduce intrinsic biases as much as possible when analysing green consumer products, which, being mainly innovative, cannot always be included in a real choice environment.
To address the research gap in the understanding of consumers’ opinions on specific sustainability features, new studies should focus on understanding consumer preferences for different sustainable consumer products, with the WTP differing according to the sector, as stated in the Introduction. To understand which green factors (such as recycling, energy reduction, carbon emission reduction, water consumption reduction, chemical reduction, packaging reduction, bio-based aspects, etc.) are deemed to be the most significant for different sectors, it is essential to consider the various definitions of the terms “sustainable”/“green”/“organic”. Understanding consumers’ preferences toward well-specified sustainability features enables a better understanding of purchasing dynamics. The use of the workflow developed in this study, combined with these new considerations, will produce more accurate data that industries and markets can use to guide their marketing and production decisions, minimising the attitude–intention–behaviour gap.
Additional research based on the conceptual framework of choice experiments could further implement the workflow and add to the results of the present study. Recognising the role of sustainable labelling and claims in marketing and in making the CE model easier to understand by consumers, a crucial aspect to be further investigated is how the use of different labels may affect the willingness to pay. To address this gap in the present study, further literature studies (e.g., using PRISMA) analysing the use of claims/labels in more detail and dedicated choice experiment studies are needed. The choice of the best model to be used during the analysis of the results—an aspect that was not dealt with in depth in this study—could be explored in more detail, evaluating the right choice according to the different case studies.

Author Contributions

Conceptualisation, M.E.S., S.D. and I.R.; methodology, M.E.S. and S.D.; formal analysis, M.E.S.; investigation, M.E.S. and S.D.; resources, M.E.S. and S.D.; data curation, M.E.S.; writing—original draft preparation, M.E.S., S.D. and I.R.; writing—review and editing, M.E.S., S.D. and I.R.; visualisation, M.E.S., S.D. and I.R.; supervision, S.D., D.B. and I.R.; project administration, M.E.S., S.D., D.B. and I.R.; funding acquisition, S.D. and I.R. All authors have read and agreed to the published version of the manuscript.

Funding

This research and the APC were funded by the European Union’s Horizon 2020 Research and Innovation Programme in the context of the FuturEnzyme project, grant number 101000327.

Institutional Review Board Statement

Not applicable.

Informed Consent Statement

Not applicable.

Data Availability Statement

Data employed and generated by this study are all available in the Materials and Methods section (Section 3).

Conflicts of Interest

The authors declare no conflict of interest.

References

  1. Patel, S.; Dey, A.; Singh, S.K.; Singh, R.; Singh, H.P. Socio-Economic Impacts of Climate Change. In Climate Impacts on Sustainable Natural Resource Management; John Wiley & Sons Ltd.: Hoboken, NJ, USA, 2021; pp. 237–267. ISBN 9781119793373. [Google Scholar] [CrossRef]
  2. Kates, R.W. Population and Consumption. Environ. Sci. Policy Sustain. Dev. 2000, 42, 10. [Google Scholar] [CrossRef]
  3. Tanner, C.; Kast, S.W. Promoting Sustainable Consumption: Determinants of Green Purchases by Swiss Consumers. Psychol. Mark. 2003, 20, 883–902. [Google Scholar] [CrossRef]
  4. Paris Agreement. Available online: https://ec.europa.eu/clima/eu-action/international-action-climate-change/climate-negotiations/paris-agreement_it (accessed on 17 May 2022).
  5. Communication from the Commission: The European Green Deal. Available online: https://eur-lex.europa.eu/legal-content/EN/TXT/?uri=COM%3A2019%3A640%3AFIN (accessed on 17 July 2022).
  6. Delivering the European Green Deal. Available online: https://ec.europa.eu/info/strategy/priorities-2019-2024/european-green-deal/delivering-european-green-deal_en (accessed on 27 May 2022).
  7. EU Climate Law: Climate Neutrality Agreement Approved by 2050. Available online: https://www.europarl.europa.eu/news/it/press-room/20210621IPR06627/legge-ue-sul-clima-approvato-l-accordo-sulla-neutralita-climatica-entro-il-2050 (accessed on 17 May 2022).
  8. OECD (Organisation for Economic Cooperation and Development). Towards Green Growth; OECD Publishing: Paris, France, 2011. [Google Scholar] [CrossRef]
  9. European Commission. The Green Economy—Promoting Sustainable Development in Europe. Available online: https://www.eesc.europa.eu/en/our-work/opinions-information-reports/opinions/green-economy-promoting-sustainable-development-europe (accessed on 1 August 2023).
  10. Do Paço, A.; Shiel, C.; Alves, H. A New Model for Testing Green Consumer Behaviour. J. Clean. Prod. 2019, 207, 998–1006. [Google Scholar] [CrossRef]
  11. Barr, S.; Gilg, A. Sustainable Lifestyles: Framing Environmental Action in and around the Home. Geoforum 2006, 37, 906–920. [Google Scholar] [CrossRef]
  12. Bassi, F. European Consumers’ Attitudes towards the Environment and Sustainable Behavior in the Market. Sustainability 2023, 15, 1666. [Google Scholar] [CrossRef]
  13. Future of Europe: Europeans See Climate Change as Top Challenge for the EU. Available online: https://ec.europa.eu/commission/presscorner/detail/en/ip_22_447 (accessed on 10 July 2023).
  14. Vehmas, K.; Raudaskoski, A.; Heikkilä, P.; Harlin, A.; Mensonen, A. Consumer Attitudes and Communication in Circular Fashion. J. Fash. Mark. Manag. 2018, 22, 286–300. [Google Scholar] [CrossRef]
  15. Gilg, A.; Barr, S.; Ford, N. Green Consumption or Sustainable Lifestyles? Identifying the Sustainable Consumer. Futures 2005, 37, 481–504. [Google Scholar] [CrossRef]
  16. Harrison, R.; Newholmand, T.; Sage, D.S. The Ethical Consumer; SAGE: Newcastle upon Tyne, UK, 2005; ISBN 141290353X. [Google Scholar]
  17. Bonini, S.; Oppenheim, J. Cultivating the Green Consumer. Stanford Soc. Innov. Rev. 2008, 6, 56–61. [Google Scholar]
  18. Ogiemwonyi, O.; Alam, M.N.; Alshareef, R.; Alsolamy, M.; Azizan, N.A.; Mat, N. Environmental Factors Affecting Green Purchase Behaviours of the Consumers: Mediating Role of Environmental Attitude. Clean. Environ. Syst. 2023, 10, 100130. [Google Scholar] [CrossRef]
  19. Ogiemwonyi, O.; Jan, M.T. The Correlative Influence of Consumer Ethical Beliefs, Environmental Ethics, and Moral Obligation on Green Consumption Behavior. Resour. Conserv. Recycl. Adv. 2023, 19, 200171. [Google Scholar] [CrossRef]
  20. Recent Study Reveals More Than a Third of Global Consumers Are Willing to Pay More for Sustainability as Demand Grows for Environmentally-Friendly Alternatives. Available online: https://www.businesswire.com/news/home/20211014005090/en/Recent- (accessed on 17 May 2022).
  21. Li, S.; Kallas, Z. Meta-Analysis of Consumers’ Willingness to Pay for Sustainable Food Products. Appetite 2021, 163, 105239. [Google Scholar] [CrossRef] [PubMed]
  22. Gomes, S.; Lopes, J.M.; Nogueira, S. Willingness to Pay More for Green Products: A Critical Challenge for Gen Z. J. Clean. Prod. 2023, 390, 136092. [Google Scholar] [CrossRef]
  23. De Canio, F. Consumer Willingness to Pay More for Pro-Environmental Packages: The Moderating Role of Familiarity. J. Environ. Manag. 2023, 339, 117828. [Google Scholar] [CrossRef] [PubMed]
  24. Biswas, A. A Study of Consumers’ Willingness to Pay for Green Products. J. Adv. Manag. Sci. 2016, 4, 211–215. [Google Scholar] [CrossRef]
  25. SAP (Systeme, Anwendungen, Produkte in Der Datenverarbeitung) Survey. Available online: https://news.sap.com/italy/2021/06/nuova-ricerca-sap-gli-italiani-mostrano-sempre-piu-interesse-a-conoscere-le-pratiche-di-sostenibilita-dei-brand/ (accessed on 27 July 2022).
  26. Finisterra Do Paço, A.M.; Barata Raposo, M.L.; Filho, W.L. Identifying the Green Consumer: A Segmentation Study. J. Target. Meas. Anal. Mark. 2009, 17, 17–25. [Google Scholar] [CrossRef]
  27. Jaiswal, D.; Kaushal, V.; Singh, P.K.; Biswas, A. Green Market Segmentation and Consumer Profiling: A Cluster Approach to an Emerging Consumer Market. Benchmarking Int. J. 2021, 28, 792–812. [Google Scholar] [CrossRef]
  28. Huang, W.S.; Kuo, H.Y.; Tung, S.Y.; Chen, H.S. Assessing Consumer Preferences for Suboptimal Food: Application of a Choice Experiment in Citrus Fruit Retail. Foods 2021, 10, 15. [Google Scholar] [CrossRef]
  29. Marangon, F.; Tempesta, T.; Troiano, S.; Vecchiato, D. Sustainable Agriculture and No-Food Production: An Empirical Investigation on Organic Cosmetics. Riv. Stud. Sulla Sostenibilita 2015, 1, 63–77. [Google Scholar] [CrossRef]
  30. European Parliament and the Council Regulation (EU) 2020/852 of the European Parliament and of the Council of 18 June 2020. Off. J. Eur. Union 2020, 198, 13–43.
  31. Aprile, M.C.; Punzo, G. How Environmental Sustainability Labels Affect Food Choices: Assessing Consumer Preferences in Southern Italy. J. Clean. Prod. 2022, 332, 130046. [Google Scholar] [CrossRef]
  32. Sharma, M.; Trivedi, P. Various Green Marketing Variables and Their Effects on Consumers’ Buying Behaviour for Green Products. Int. J. Latest Technol. Eng. Manag. Appl. Sci. 2018, 5, 1–8. [Google Scholar]
  33. Becker-Olsen, K.; Potucek, S. Encyclopedia of Corporate Social Responsibility; Springer: New York, NY, USA, 2013; ISBN 978-3-642-28036-8. [Google Scholar]
  34. European Commission EU Taxonomy for Sustainable Activities. Available online: https://finance.ec.europa.eu/sustainable-finance/tools-and-standards/eu-taxonomy-sustainable-activities_en (accessed on 20 May 2023).
  35. Sustainable Development. Available online: https://policy.trade.ec.europa.eu/development-and-sustainability/sustainable-development_en#:~:text=Sustainable development means meeting the,together and support each other (accessed on 10 July 2023).
  36. European Environmental Agency Sustainability Definition. Available online: https://www.eea.europa.eu/en/topics/at-a-glance/sustainability (accessed on 29 May 2023).
  37. European Commission Sustainable Development in EU Trade Agreements. Available online: https://policy.trade.ec.europa.eu/development-and-sustainability/sustainable-development/sustainable-development-eu-trade-agreements_en#tsd-review-2021 (accessed on 29 May 2023).
  38. Bocken, N.M.P.; Geradts, T.H.J. Barriers and Drivers to Sustainable Business Model Innovation: Organization Design and Dynamic Capabilities. Long Range Plann. 2020, 53, 101950. [Google Scholar] [CrossRef]
  39. Balia, S.; Gunasekaranb, A.; Aggarwalc, S.; Tyagic, B.; Balid, V. A Strategic Decision-Making Framework for Sustainable Reverse Operations. J. Clean. Prod. 2022, 381, 135058. [Google Scholar] [CrossRef]
  40. Berger, J. Signaling Can Increase Consumers’ Willingness to Pay for Green Products. Theoretical Model and Experimental Evidence. J. Consum. Behav. 2019, 18, 233–246. [Google Scholar] [CrossRef]
  41. Zaidi, N.; Dixit, S.; Maurya, M.; Dharwal, M. Willingness to Pay for Green Products and Factors Affecting Buyer’s Behaviour: An Empirical Study. Mater. Today Proc. 2020, 49, 3595–3599. [Google Scholar] [CrossRef]
  42. Ramesh, M.; Samudhra Rajakumar, C. Determinants of Online Purchase Decision of Green Products. Int. J. Eng. Adv. Technol. 2019, 9, 1477–1481. [Google Scholar] [CrossRef]
  43. Wijekoon, R.; Sabri, M.F. Determinants That Influence Green Product Purchase Intention and Behavior: A Literature Review and Guiding Framework. Sustainability 2021, 13, 6219. [Google Scholar] [CrossRef]
  44. Ariffin, S.; Yusof, J.M.; Putit, L.; Shah, M.I.A. Factors Influencing Perceived Quality and Repurchase Intention Towards Green Products. Procedia Econ. Financ. 2016, 37, 391–396. [Google Scholar] [CrossRef]
  45. Choshaly, S.H. Consumer Perception of Green Issues and Intention to Purchase Green Products. Int. J. Manag. Account. Econ. 2017, 4, 66–79. [Google Scholar]
  46. Ghose, A.; Chandra, B. Models for Predicting Sustainable Durable Products Consumption Behaviour: A Review Article. Vision 2020, 24, 81–89. [Google Scholar] [CrossRef]
  47. Bukhari, S.S. Green Marketing and Its Impact on Consumer Behavior. Eur. J. Bus. Manag. 2011, 3, 375–384. [Google Scholar]
  48. Chaihanchanchai, P. Encouraging Green Product Purchase: Green Value and Environmental Knowledge as Moderators of Attitude and Behavior Relationship Literature. Bus Strat Environ. 2023, 32, 289–303. [Google Scholar] [CrossRef]
  49. Sharma, A.P. Consumers’ Purchase Behaviour and Green Marketing: A Synthesis, Review and Agenda. Int. J. Consum. Stud. 2021, 45, 1217–1238. [Google Scholar] [CrossRef]
  50. Aalbers, M.B.; Abbott, A.; Abélès, M.; Abell, P.; Abou-Abdallah, M.; Abramiuk, M.A. International Encyclopedia of the Social & Behavioral Sciences; Wright, J.D., Ed.; University of Central Florida: Orlando, FL, USA, 2015; ISBN 978-0-08-097087-5. [Google Scholar]
  51. Aoki, K.; Akai, K. Testing Hypothetical Bias in a Choice Experiment: An Application to the Value of the Carbon Footprint of Mandarin Oranges. PLoS ONE 2022, 17, e0261369. [Google Scholar] [CrossRef] [PubMed]
  52. McFadden, D. Conditional Logit Analysis of Qualitative Choice Behavior. In Frontiers in Econometrics; Academic Press: New York, NY, USA, 1974; pp. 105–142. [Google Scholar]
  53. Snowball, J.D. The Choice Experiment Method and Use. In Measuring the Value of Culture; Springer: Berlin/Heidelberg, Germany, 2008; Volume 7, pp. 177–215. [Google Scholar] [CrossRef]
  54. Mariel, P.; Hoyos, D.; Meyerhoff, J.; Czajkowski, M.; Dekker, T.; Glenk, K.; Bredahl Jacobsen, J.; Liebe, U.; Bøye Olsen, S.; Sagebiel, J.; et al. Environmental Valuation with Discrete Choice Experiments Guidance on Design, Implementation and Data Analysis; Springer Nature: Berlin/Heidelberg, Germany, 2021; ISBN 9783030626686. [Google Scholar]
  55. Willis, K.G. The Use of Stated Preference Methods to Value Cultural Heritage. In Handbook of the Economics of Art and Culture; Elsevier: Amsterdam, The Netherlands, 2014; Volume 2, ISBN 9780444537768. [Google Scholar]
  56. Buckell, J.; Buchanan, J.; Wordsworth, S.; Becker, F.; Morrell, L.; Roope, L.; Kaur, A.; Abel, L. Hypotetical Bias. Available online: https://catalogofbias.org/biases/hypothetical-bias/ (accessed on 7 November 2022).
  57. Menapace, L.; Raffaelli, R. Unraveling Hypothetical Bias in Discrete Choice Experiments. J. Econ. Behav. Organ. 2020, 176, 416–430. [Google Scholar] [CrossRef]
  58. Directive 2011/83/EU. Available online: https://eur-lex.europa.eu/legal-content/EN/TXT/?qid=1585324548367&uri=CELEX%3A02011L0083-20220528 (accessed on 17 July 2023).
  59. Amended 2019/2161/EU. Available online: https://eur-lex.europa.eu/legal-content/EN/TXT/PDF/?uri=CELEX:32019L2161 (accessed on 17 July 2023).
  60. Margus Kingisepp, A.V. The Notion of Consumer in EU Consumer Acquis and the Consumer Rights Directive—A Significant Change of Paradigm? Juridica Int. 2011, 2011, 44–53. [Google Scholar]
  61. Cambridge Dictionary Customer Definition. Available online: https://dictionary.cambridge.org/dictionary/english/customer (accessed on 17 July 2023).
  62. Cambridge Dictionary Consumer Definition. Available online: https://dictionary.cambridge.org/dictionary/english/consumer?q=consumers (accessed on 17 July 2023).
  63. Preferred Reporting Items for Systematic Reviews and Meta-Analyses (PRISMA) Website. Available online: http://prisma-statement.org/ (accessed on 6 June 2023).
  64. Liberati, A.; Altman, D.G.; Tetzlaff, J.; Mulrow, C.; Gøtzsche, P.C.; Ioannidis, J.P.A.; Clarke, M.; Devereaux, P.J.; Kleijnen, J.; Moher, D. The PRISMA Statement for Reporting Systematic Reviews and Meta-Analyses of Studies That Evaluate Health Care Interventions: Explanation and Elaboration. PLoS Med. 2009, 6, e1000100. [Google Scholar] [CrossRef]
  65. PRISMA Flow Diagram. Available online: http://prisma-statement.org/PRISMAStatement/FlowDiagram.aspx (accessed on 6 June 2023).
  66. Corporate Finance Institute Consumer Products Definition. Available online: https://corporatefinanceinstitute.com/resources/economics/consumer-products/ (accessed on 6 June 2023).
  67. Cambridge Dictionary Detergent Definition. Available online: https://dictionary.cambridge.org/dictionary/english/detergent (accessed on 6 June 2023).
  68. Cambridge Dictionary Cloth Definition. Available online: https://dictionary.cambridge.org/dictionary/english/cloth (accessed on 6 June 2023).
  69. Cambridge Dictionary Textile Definition. Available online: https://dictionary.cambridge.org/dictionary/english/textile (accessed on 6 June 2023).
  70. Cambridge Dictionary Cosmetic Definition. Available online: https://dictionary.cambridge.org/dictionary/english/cosmetic (accessed on 6 June 2023).
  71. Cambridge Dictionary Plastic Definition. Available online: https://dictionary.cambridge.org/dictionary/english/plastic (accessed on 6 June 2023).
  72. Cambridge Dictionary Packaging Definition. Available online: https://dictionary.cambridge.org/dictionary/english/packaging (accessed on 6 June 2023).
  73. Cambridge Dictionary Domestic Appliance Definition. Available online: https://dictionary.cambridge.org/dictionary/english/domestic-appliance (accessed on 6 June 2023).
  74. Cambridge Dictionary Food Definition. Available online: https://dictionary.cambridge.org/dictionary/english/food (accessed on 6 June 2023).
  75. Cambridge Dictionary Beverage Definition. Available online: https://dictionary.cambridge.org/dictionary/english/beverage (accessed on 6 June 2023).
  76. European Commission Bio-Based Products. Available online: https://single-market-economy.ec.europa.eu/sectors/biotechnology/bio-based-products_en#:~:text=Bio-based products are wholly,geological formations and%2For fossilised (accessed on 6 June 2023).
  77. Greene, W.H.; Hensher, D.A. A Latent Class Model for Discrete Choice Analysis: Contrasts with Mixed Logit. Transp. Res. Part B Methodol. 2003, 37, 681–698. [Google Scholar] [CrossRef]
  78. Hustvedt, G.; Kathryn Carroll, A.; Bernard, J.C. Consumer Ethnocentricity and Preferences for Wool Products by Country of Origin and Manufacture. Int. J. Consum. Stud. 2013, 37, 498–506. [Google Scholar] [CrossRef]
  79. Nakano, M. Evaluation of Corporate Social Responsibility by Consumers: Use of Organic Material and Long Working Hours of Employees. Sustainability 2019, 11, 5219. [Google Scholar] [CrossRef]
  80. Herrmann, C.; Rhein, S.; Sträter, K.F. Consumers’ Sustainability-Related Perception of and Willingness-to-Pay for Food Packaging Alternatives. Resour. Conserv. Recycl. 2022, 181, 106219. [Google Scholar] [CrossRef]
  81. Huh, S.Y.; Jo, M.; Shin, J.; Yoo, S.H. Impact of Rebate Program for Energy-Efficient Household Appliances on Consumer Purchasing Decisions: The Case of Electric Rice Cookers in South Korea. Energy Policy 2019, 129, 1394–1403. [Google Scholar] [CrossRef]
  82. Deshazo, J.R. Designing Choice Sets for Stated Preference Methods: The Effects of Complexity on Choice Consistency. J. Environ. Econ. Manag. 2001, 44, 123–143. [Google Scholar] [CrossRef]
  83. Cheng, H.; Lambert, D.M.; DeLong, K.L.; Jensen, K.L. Inattention, Availability Bias, and Attribute Premium Estimation for a Biobased Product. Agric. Econ. 2022, 53, 274–288. [Google Scholar] [CrossRef]
  84. Liao, Y.-K.; Wu, W.-Y.; Pham, T.-T. Examining the Moderating Effects of Green Marketing and Green Psychological Benefits on Customers’ Green Attitude, Value and Purchase Intention. Sustainability 2020, 12, 7461. [Google Scholar] [CrossRef]
  85. Kong, W.; Harun, A.; Sulong, R.S.; Lily, J. The Influence of Consumers Perception of Green Products on Green Purchase Intention. Int. J. Asian Soc. Sci. 2014, 4, 924–939. [Google Scholar]
  86. Cai, Z.; Xie, Y.; Aguilar, F.X. Eco-Label Credibility and Retailer Effects on Green Product Purchasing Intentions. For. Policy Econ. 2017, 80, 200–208. [Google Scholar] [CrossRef]
  87. Atkinson, L.; Rosenthal, S. Signaling the Green Sell: The Influence of Eco-Label Source, Argument Specificity, and Product Involvement on Consumer Trust. J. Advert. 2014, 43, 33–45. [Google Scholar] [CrossRef]
  88. Waechter, S.; Sütterlin, B.; Siegrist, M. Desired and Undesired Effects of Energy Labels—An Eye-Tracking Study. PLoS ONE 2015, 10, e0134132. [Google Scholar] [CrossRef]
  89. Zhou, H.; Bukenya, J.O. Information Inefficiency and Willingness-to-Pay for Energy-Efficient Technology: A Stated Preference Approach for China Energy Label. Energy Policy 2016, 91, 12–21. [Google Scholar] [CrossRef]
  90. Lin, W.; Nayga, R.M. Green Identity Labeling, Environmental Information, and pro-Environmental Food Choices. Food Policy 2022, 106, 102187. [Google Scholar] [CrossRef]
  91. Annex of Regulation (EC) No 1924/2006. Available online: https://eur-lex.europa.eu/eli/reg/2006/1924/oj (accessed on 17 July 2023).
  92. Regulation (EU) No 1047/2012. Available online: https://eur-lex.europa.eu/eli/reg/2012/1047/oj (accessed on 17 July 2023).
  93. Lazíková, J.; Rumanovská, L. Nutrition and Health Claims on Foods in the EU Legislation. Juridical Trib. Trib. Juridica 2022, 12, 283–311. [Google Scholar] [CrossRef]
  94. European Commission Green Claims. Available online: https://environment.ec.europa.eu/topics/circular-economy/green-claims_en (accessed on 17 July 2023).
  95. Proposal for a Directive on Green Claims. Available online: https://environment.ec.europa.eu/publications/proposal-directive-green-claims_en (accessed on 17 July 2023).
  96. Johnson, F.R.; Lancsar, E.; Marshall, D.; Kilambi, V.; Mühlbacher, A.; Regier, D.A.; Bresnahan, B.W.; Kanninen, B.; Bridges, J.F.P. Constructing Experimental Designs for Discrete-Choice Experiments: Report of the ISPOR Conjoint Analysis Experimental Design Good Research Practices Task Force. Value Health 2013, 16, 3–13. [Google Scholar] [CrossRef]
  97. Clark, M.D.; Determann, D.; Petrou, S.; Moro, D.; Bekker-Grob, E.W. de Discrete Choice Experiments in Health Economics: A Review of the Literature. Pharmacoeconomics 2014, 32, 883–902. [Google Scholar] [CrossRef]
  98. Caussadea, S.; de Dios, J.; Rizzia, O.L.I.; Hensherb, D.A. Assessing the Influence of Design Dimensions on Stated Choice Experiment Estimates. Transp. Res. Part B Methodol. 2005, 39, 621–640. [Google Scholar] [CrossRef]
  99. Michaud, C.; Llerena, D.; Joly, I. Willingness to Pay for Environmental Attributes of Non-Food Agricultural Products: A Real Choice Experiment. Eur. Rev. Agric. Econ. 2013, 40, 313–329. [Google Scholar] [CrossRef]
  100. Docenti.unina.it Willingness to Pay and the Discrete Choice Experiment. Available online: https://www.docenti.unina.it/webdocenti-be/allegati/materiale-didattico/665259 (accessed on 17 July 2023).
Figure 1. PRISMA flow diagram: Selection process adopted in the present study. The 1130 records identified in step 1 were subjected to a duplicate removal (n = 1080) and a screening based on the reading of the title (n = 265), abstract (n = 220), and full text (n = 186), according to the thematic relevance. The 186 records selected were included in the quantitative and qualitative analyses.
Sustainability 15 13183 g001
Figure 2. Worldwide scientific production from 2012 to 2022. The Y-axis shows the number of publications; the X-axis shows the years in which they were published.
Sustainability 15 13183 g002
Figure 3. Geographical distribution of the publications in the world among 33 countries. Countries with the highest numbers of publications are shown in dark blue.
Sustainability 15 13183 g003
Figure 4. Level of sustainability in the consumer products focused on by the studies.
Sustainability 15 13183 g004
Figure 5. Type and number of attributes characterising the products studied by the CEs.
Sustainability 15 13183 g005
Figure 6. Distribution of (a) the number of choices set for each respondent, (b) the number of alternatives for each question in the choice set, (c) the presence/absence of the “none of these” option, and (d) the number of respondents.
Sustainability 15 13183 g006
Figure 7. Distribution of the most common analysis algorithms in scientific publications.
Sustainability 15 13183 g007
Figure 8. Additional studies carried out in combination with the CE in the selected publications.
Sustainability 15 13183 g008
Figure 9. Preliminary studies carried out before the CE in the selected publications.
Sustainability 15 13183 g009
Figure 10. Analysis of the limits and problems found in the selected articles.
Sustainability 15 13183 g010
Figure 11. Summary of the workflow.
Sustainability 15 13183 g011
Table 1. List of keywords searched systematically in the Scopus database.
Consumer ProductKeywords
Detergent“choice experiment” and washing powder
“choice experiment” and detergent
“choice experiment” and laundry tablet
Textile“choice experiment” and textile
“choice experiment” and clothes
“choice experiment” and apparel
“choice experiment” and leather
“choice experiment” and cotton
Cosmetic“choice experiment” and cosmetic
“choice experiment” and “personal care”
Packaging/plastic“choice experiment” and polymer
“choice experiment” and packaging
“choice experiment” and plastic
Domestic appliance“choice experiment” and domestic appliance
“choice experiment” and electric appliance
Food“choice experiment” and food
Table 2. Attribute macro-categories.
Type of AttributeDescription
PricePrice or price range of the product focused on by the study
Origin and geographic informationOrigin of the product or its raw materials, local or non-local origin
Health and nutritional aspectHygienic aspects, food safety, health claims, health benefits, food standard assurance, hormone-free, nutritional claims, general ingredients (salt, sugar…), food components (e.g., fats, proteins, carbohydrates), addition of additives or preservatives
Sustainable aspectEco-labels, eco-aspects, environmentally friendly production, sustainable products, water usage, carbon emissions, use of pesticides
Production methodType of production method used and all related information and characteristics
Type of certification and labelCertification or label regarding the characteristics and quality of the product, except for organic labels (in “organic”), eco or green labels (in “sustainable aspect”), and recycling labels (in “packaging”)
OrganicOrganic production, organic products, organic labels/certification
AppearanceFormat, size, colour, texture, taste, and smell of the product
BrandType of brand
PackagingType of packaging or recycling aspect
Ethical aspectExploitation of workers or long work, social responsibility, fair trade production, ethical production, animal welfare
Type of productDifferent type/variety of the same product (e.g., different types of green tea) or different products (e.g., different fruits: banana, apple, strawberry)
Quality and efficacyQuality/efficacy of the product and/or the yield of the production
GM productPresence or absence of GM technology
TraceabilityInformation about the traceability of the product
OtherAdditional information or other small categories that do not belong to the above
Table 3. Top 11 journals that have published articles on the applications of CEs for analysing WTP for consumer products.
Scientific JournalsNumber of Articles5-Year Impact Factor
(2017–2022)
Food Quality and Preference156.623
Sustainability (Switzerland)144.089
Food Policy105.115
British Food Journal102.593
Journal of Cleaner Production109.668
Journal of Agricultural Economics73.261
Foods74.338
Appetite63.928
Agribusiness51.938
Journal of Food Products Marketing52.269
Food Research International56.355
Disclaimer/Publisher’s Note: The statements, opinions and data contained in all publications are solely those of the individual author(s) and contributor(s) and not of MDPI and/or the editor(s). MDPI and/or the editor(s) disclaim responsibility for any injury to people or property resulting from any ideas, methods, instructions or products referred to in the content.

